prospects for global ship finance - petrofin by ted petropoulos head petrofin research 8th greek...
TRANSCRIPT

presented by
Ted Petropoulos HEAD
PETROFIN RESEARCH
8th Greek Shipping & Ship Finance Conference
20th May 2011
Prospects for global Ship Finance
Presentation of latest Petrofin Bank Research ©
PETROFIN RESEARCH
www.petrofin.gr
A. Analysis and trends of global ship finance
The total global portfolio today is estimated at approx. $500bn consisting of $450bn in drawn loans and $50bn in committed but undrawn loans.
PETROFIN RESEARCH
www.petrofin.gr A. Analysis and trends of global ship finance
In the following graphs we show the loan portfolios of the top 40 banks, according to the latest Petrofin Bank Research © just concluded:
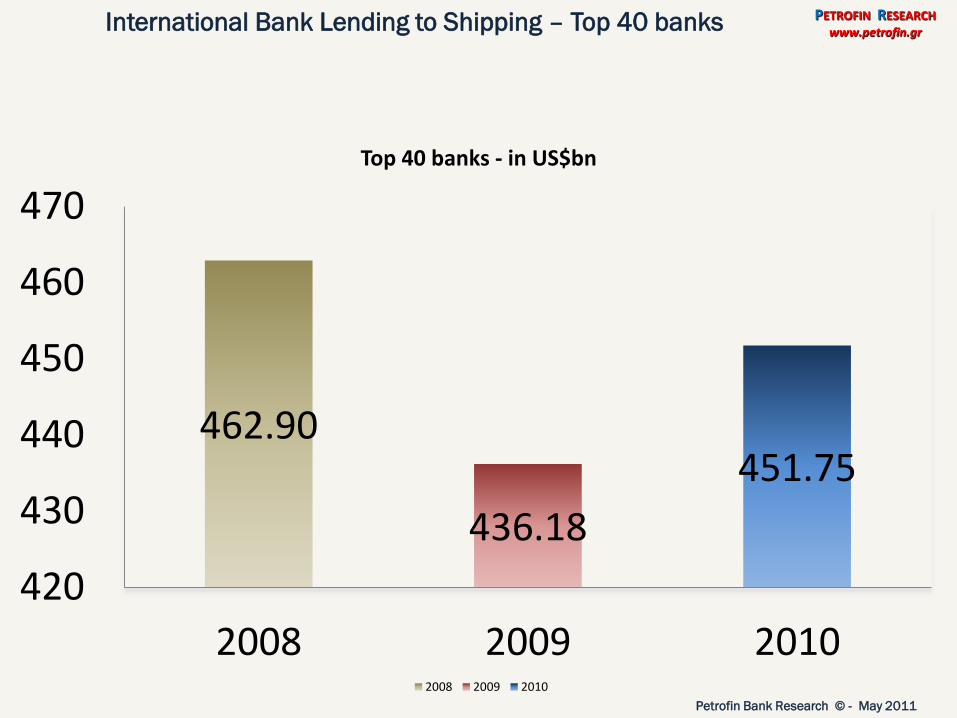
462.90
436.18
451.75
420
430
440
450
460
470
2008 2009 2010
Top 40 banks - in US$bn
2008 2009 2010
International Bank Lending to Shipping – Top 40 banks PETROFIN RESEARCH
www.petrofin.gr
Petrofin Bank Research © - May 2011
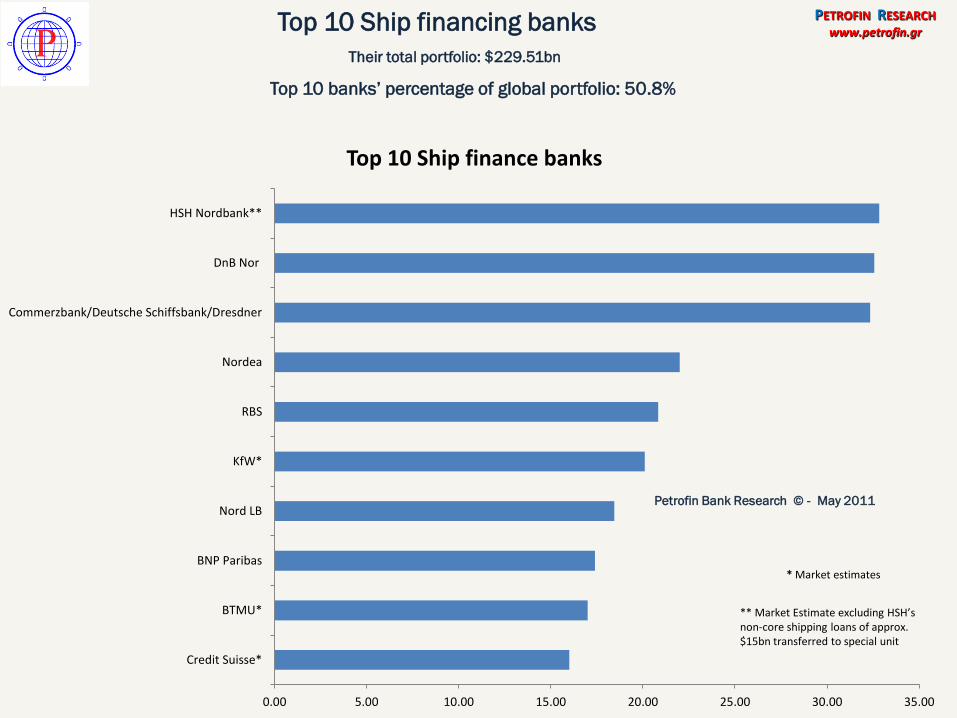
Their total portfolio: $229.51bn
Top 10 banks’ percentage of global portfolio: 50.8%
Top 10 Ship financing banks PETROFIN RESEARCH
www.petrofin.gr
Petrofin Bank Research © - May 2011
** Market Estimate excluding HSH’s non-core shipping loans of approx. $15bn transferred to special unit
* Market estimates
0.00 5.00 10.00 15.00 20.00 25.00 30.00 35.00
HSH Nordbank**
DnB Nor
Commerzbank/Deutsche Schiffsbank/Dresdner
Nordea
RBS
KfW*
Nord LB
BNP Paribas
BTMU*
Credit Suisse*
Top 10 Ship finance banks
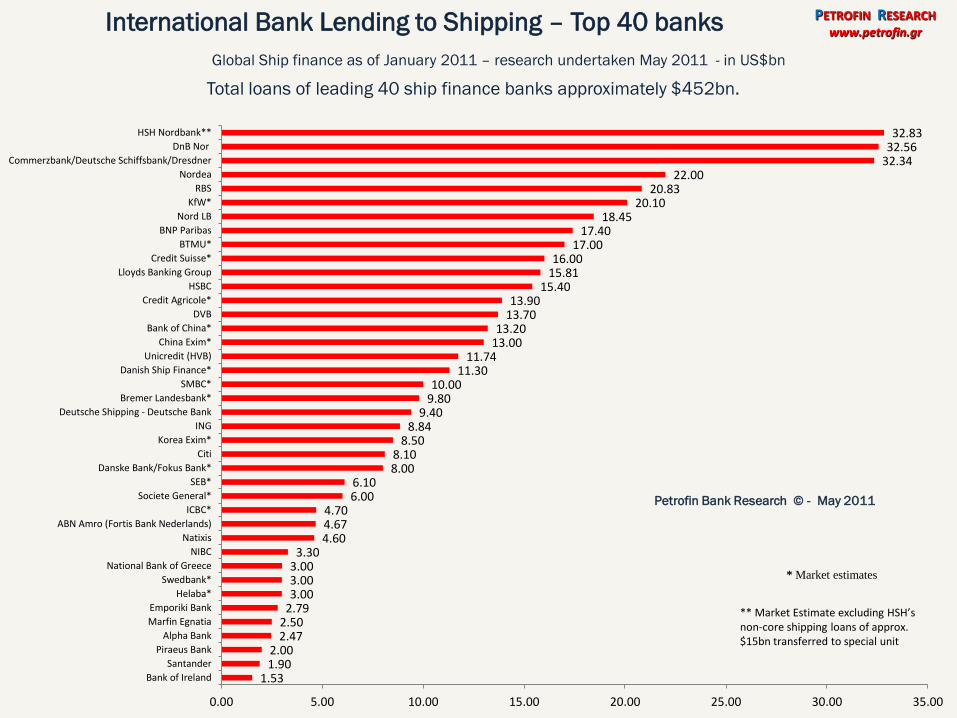
Global Ship finance as of January 2011 – research undertaken May 2011 - in US$bn
Total loans of leading 40 ship finance banks approximately $452bn.
International Bank Lending to Shipping – Top 40 banks PETROFIN RESEARCH
www.petrofin.gr
Petrofin Bank Research © - May 2011
32.83 32.56
32.34 22.00
20.83 20.10
18.45 17.40
17.00 16.00
15.81 15.40
13.90 13.70
13.20 13.00
11.74 11.30
10.00 9.80
9.40 8.84
8.50 8.10 8.00
6.10 6.00
4.70 4.67 4.60
3.30 3.00 3.00 3.00
2.79 2.50 2.47
2.00 1.90
1.53
0.00 5.00 10.00 15.00 20.00 25.00 30.00 35.00
HSH Nordbank**
DnB Nor
Commerzbank/Deutsche Schiffsbank/Dresdner
Nordea
RBS
KfW*
Nord LB
BNP Paribas
BTMU*
Credit Suisse*
Lloyds Banking Group
HSBC
Credit Agricole*
DVB
Bank of China*
China Exim*
Unicredit (HVB)
Danish Ship Finance*
SMBC*
Bremer Landesbank*
Deutsche Shipping - Deutsche Bank
ING
Korea Exim*
Citi
Danske Bank/Fokus Bank*
SEB*
Societe General*
ICBC*
ABN Amro (Fortis Bank Nederlands)
Natixis
NIBC
National Bank of Greece
Swedbank*
Helaba*
Emporiki Bank
Marfin Egnatia
Alpha Bank
Piraeus Bank
Santander
Bank of Ireland
** Market Estimate excluding HSH’s non-core shipping loans of approx. $15bn transferred to special unit
* Market estimates
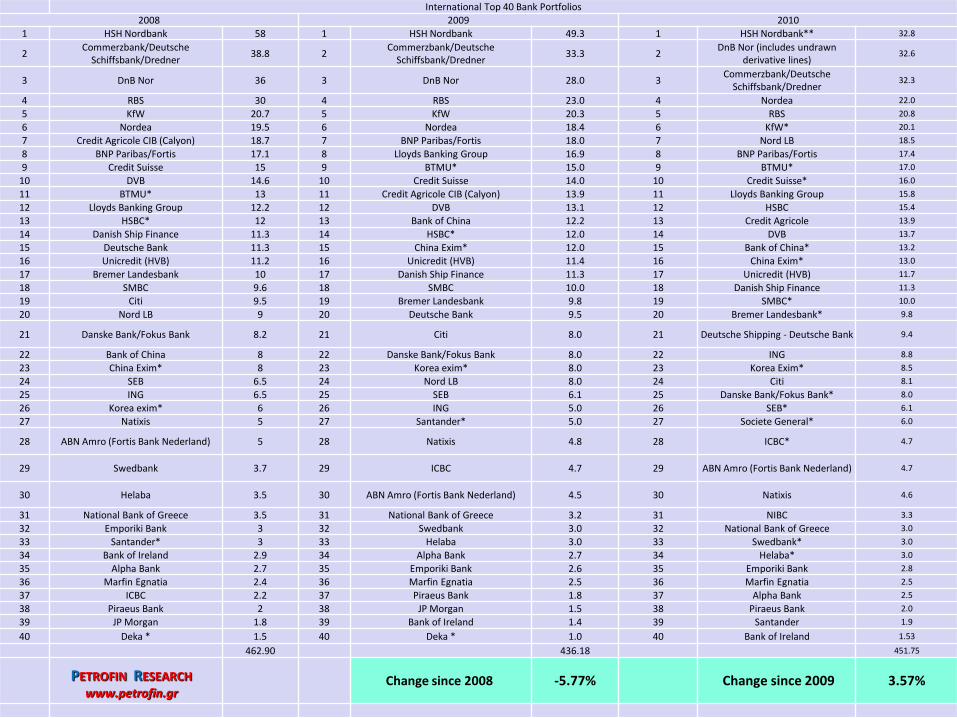
International Top 40 Bank Portfolios 2008 2009 2010
1 HSH Nordbank 58 1 HSH Nordbank 49.3 1 HSH Nordbank** 32.8
2 Commerzbank/Deutsche
Schiffsbank/Dredner 38.8 2
Commerzbank/Deutsche Schiffsbank/Dredner
33.3 2 DnB Nor (includes undrawn
derivative lines) 32.6
3 DnB Nor 36 3 DnB Nor 28.0 3 Commerzbank/Deutsche
Schiffsbank/Dredner 32.3
4 RBS 30 4 RBS 23.0 4 Nordea 22.0
5 KfW 20.7 5 KfW 20.3 5 RBS 20.8
6 Nordea 19.5 6 Nordea 18.4 6 KfW* 20.1
7 Credit Agricole CIB (Calyon) 18.7 7 BNP Paribas/Fortis 18.0 7 Nord LB 18.5
8 BNP Paribas/Fortis 17.1 8 Lloyds Banking Group 16.9 8 BNP Paribas/Fortis 17.4
9 Credit Suisse 15 9 BTMU* 15.0 9 BTMU* 17.0
10 DVB 14.6 10 Credit Suisse 14.0 10 Credit Suisse* 16.0
11 BTMU* 13 11 Credit Agricole CIB (Calyon) 13.9 11 Lloyds Banking Group 15.8
12 Lloyds Banking Group 12.2 12 DVB 13.1 12 HSBC 15.4
13 HSBC* 12 13 Bank of China 12.2 13 Credit Agricole 13.9
14 Danish Ship Finance 11.3 14 HSBC* 12.0 14 DVB 13.7
15 Deutsche Bank 11.3 15 China Exim* 12.0 15 Bank of China* 13.2
16 Unicredit (HVB) 11.2 16 Unicredit (HVB) 11.4 16 China Exim* 13.0
17 Bremer Landesbank 10 17 Danish Ship Finance 11.3 17 Unicredit (HVB) 11.7
18 SMBC 9.6 18 SMBC 10.0 18 Danish Ship Finance 11.3
19 Citi 9.5 19 Bremer Landesbank 9.8 19 SMBC* 10.0
20 Nord LB 9 20 Deutsche Bank 9.5 20 Bremer Landesbank* 9.8
21 Danske Bank/Fokus Bank 8.2 21 Citi 8.0 21 Deutsche Shipping - Deutsche Bank 9.4
22 Bank of China 8 22 Danske Bank/Fokus Bank 8.0 22 ING 8.8
23 China Exim* 8 23 Korea exim* 8.0 23 Korea Exim* 8.5
24 SEB 6.5 24 Nord LB 8.0 24 Citi 8.1
25 ING 6.5 25 SEB 6.1 25 Danske Bank/Fokus Bank* 8.0
26 Korea exim* 6 26 ING 5.0 26 SEB* 6.1
27 Natixis 5 27 Santander* 5.0 27 Societe General* 6.0
28 ABN Amro (Fortis Bank Nederland) 5 28 Natixis 4.8 28 ICBC* 4.7
29 Swedbank 3.7 29 ICBC 4.7 29 ABN Amro (Fortis Bank Nederland) 4.7
30 Helaba 3.5 30 ABN Amro (Fortis Bank Nederland) 4.5 30 Natixis 4.6
31 National Bank of Greece 3.5 31 National Bank of Greece 3.2 31 NIBC 3.3
32 Emporiki Bank 3 32 Swedbank 3.0 32 National Bank of Greece 3.0
33 Santander* 3 33 Helaba 3.0 33 Swedbank* 3.0
34 Bank of Ireland 2.9 34 Alpha Bank 2.7 34 Helaba* 3.0
35 Alpha Bank 2.7 35 Emporiki Bank 2.6 35 Emporiki Bank 2.8
36 Marfin Egnatia 2.4 36 Marfin Egnatia 2.5 36 Marfin Egnatia 2.5
37 ICBC 2.2 37 Piraeus Bank 1.8 37 Alpha Bank 2.5
38 Piraeus Bank 2 38 JP Morgan 1.5 38 Piraeus Bank 2.0
39 JP Morgan 1.8 39 Bank of Ireland 1.4 39 Santander 1.9
40 Deka * 1.5 40 Deka * 1.0 40 Bank of Ireland 1.53
462.90 436.18 451.75
Change since 2008 -5.77% Change since 2009 3.57%
PETROFIN RESEARCH
www.petrofin.gr
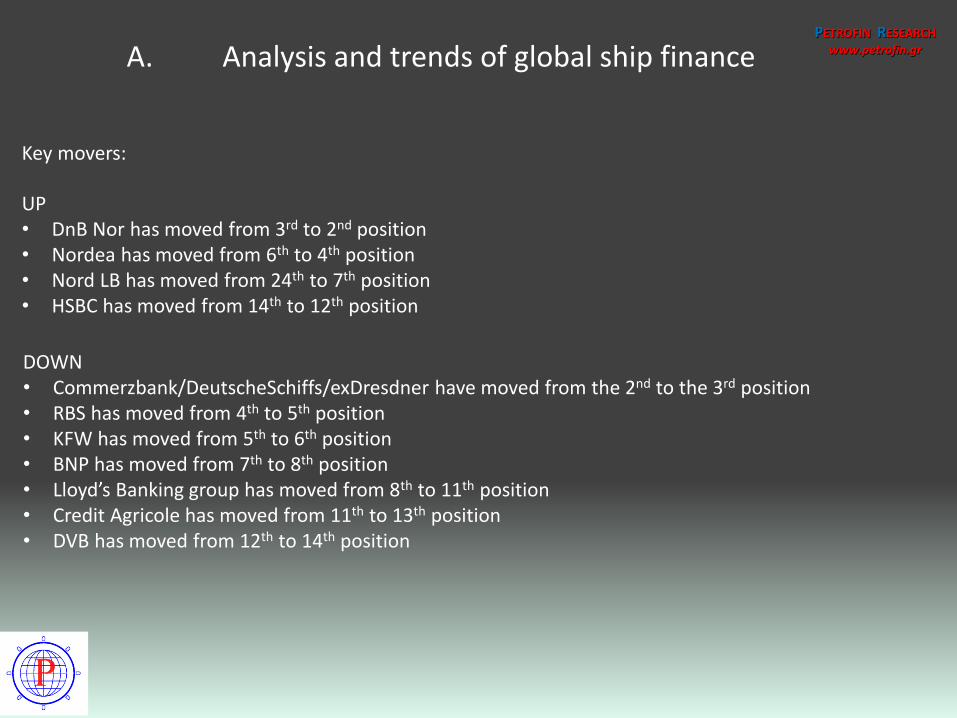
UP • DnB Nor has moved from 3rd to 2nd position • Nordea has moved from 6th to 4th position • Nord LB has moved from 24th to 7th position • HSBC has moved from 14th to 12th position
PETROFIN RESEARCH
www.petrofin.gr A. Analysis and trends of global ship finance
Key movers:
DOWN • Commerzbank/DeutscheSchiffs/exDresdner have moved from the 2nd to the 3rd position • RBS has moved from 4th to 5th position • KFW has moved from 5th to 6th position • BNP has moved from 7th to 8th position • Lloyd’s Banking group has moved from 8th to 11th position • Credit Agricole has moved from 11th to 13th position • DVB has moved from 12th to 14th position
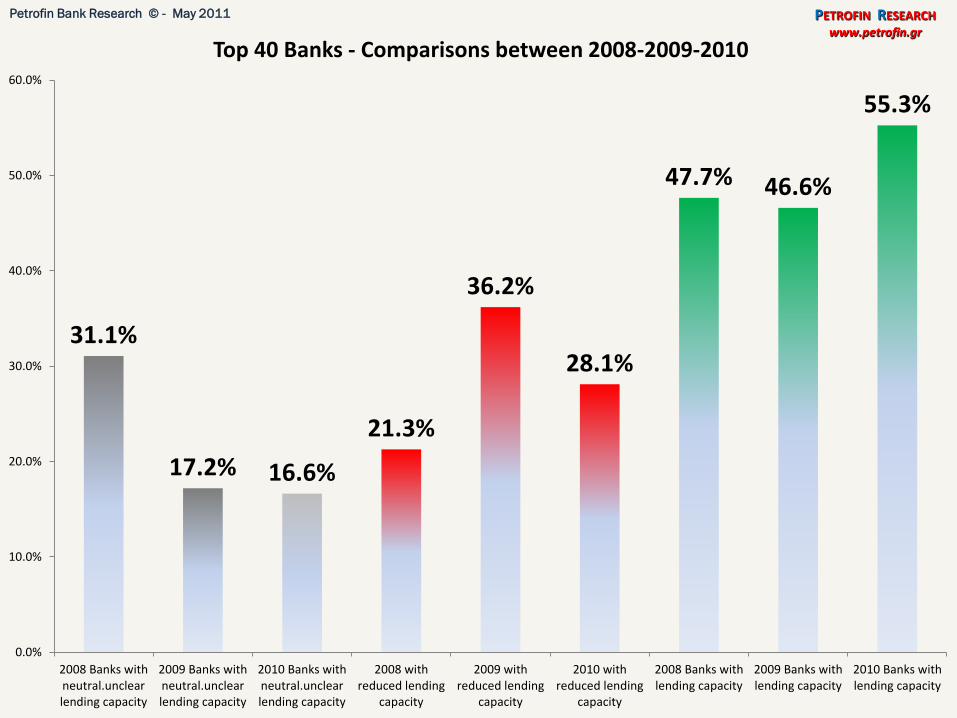
31.1%
17.2% 16.6%
21.3%
36.2%
28.1%
47.7% 46.6%
55.3%
0.0%
10.0%
20.0%
30.0%
40.0%
50.0%
60.0%
2008 Banks withneutral.unclearlending capacity
2009 Banks withneutral.unclearlending capacity
2010 Banks withneutral.unclearlending capacity
2008 withreduced lending
capacity
2009 withreduced lending
capacity
2010 withreduced lending
capacity
2008 Banks withlending capacity
2009 Banks withlending capacity
2010 Banks withlending capacity
Top 40 Banks - Comparisons between 2008-2009-2010
PETROFIN RESEARCH
www.petrofin.gr
Petrofin Bank Research © - May 2011

PETROFIN RESEARCH
www.petrofin.gr
Global ship finance exposure – asymmetrical distribution
A. Analysis and trends of global ship finance
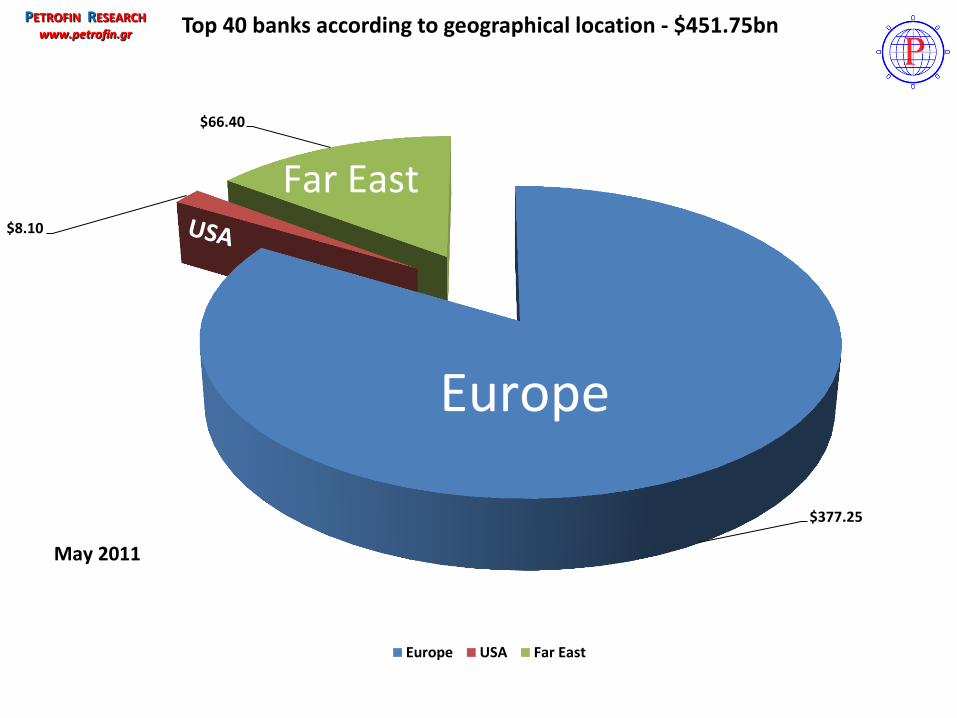
Total top banks’ portfolio: US$449.76bn
Europe
Far East
$377.25
$8.10
$66.40
Top 40 banks according to geographical location - $451.75bn
Europe USA Far East
Europe
Far East
PETROFIN RESEARCH
www.petrofin.gr
May 2011
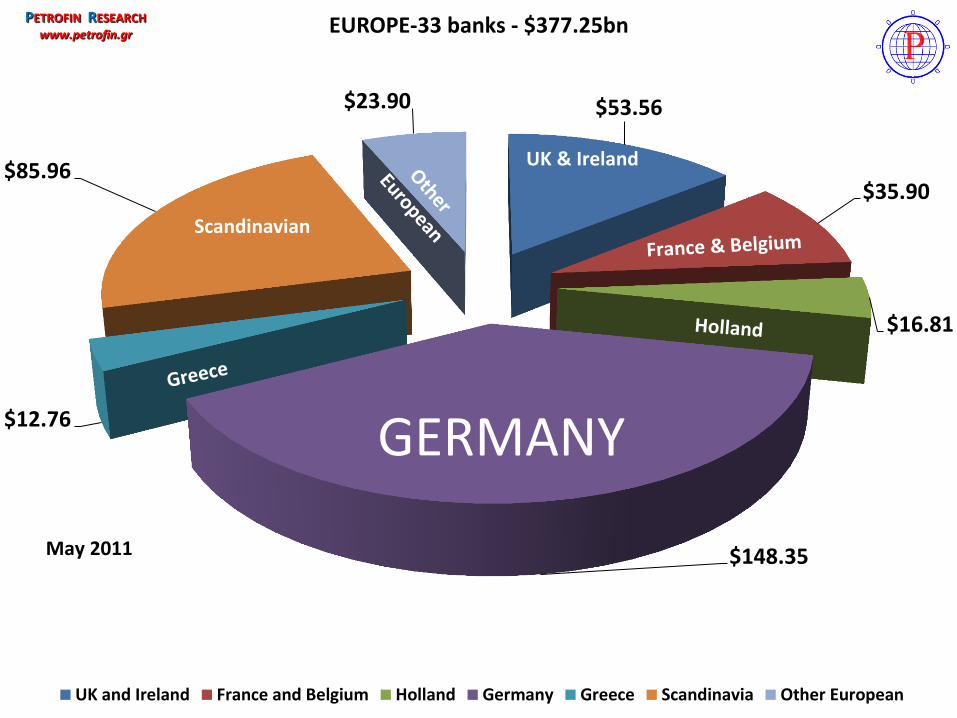
$53.56
$35.90
$16.81
$148.35
$12.76
$85.96
$23.90
EUROPE-33 banks - $377.25bn
UK and Ireland France and Belgium Holland Germany Greece Scandinavia Other European
GERMANY
UK & Ireland
PETROFIN RESEARCH
www.petrofin.gr
May 2011
Scandinavian
PETROFIN RESEARCH
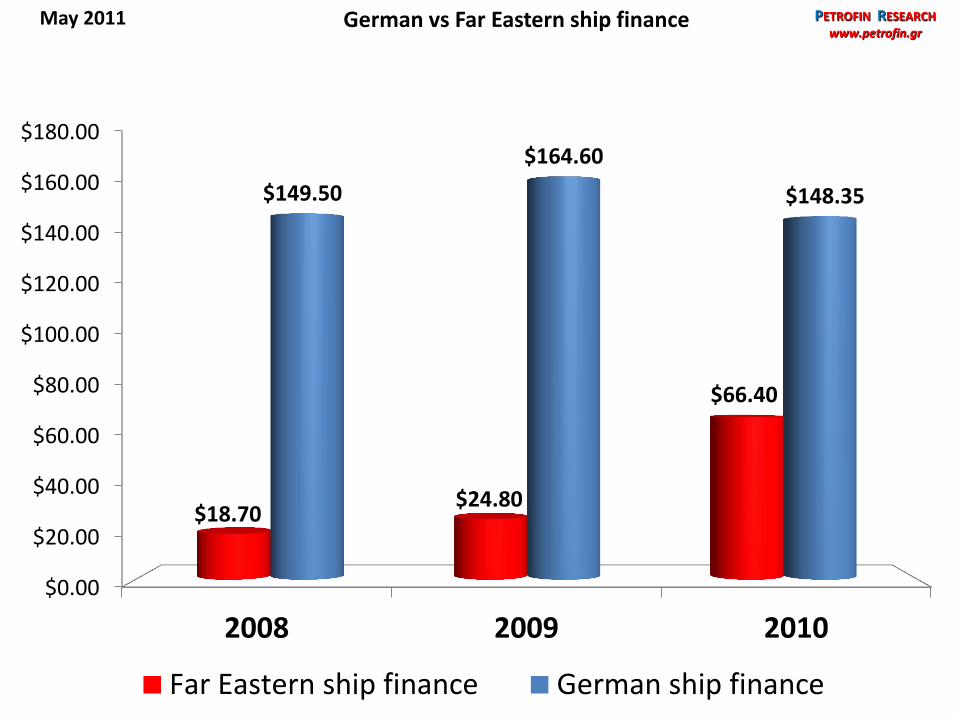
www.petrofin.gr May 2011 German vs Far Eastern ship finance
$0.00
$20.00
$40.00
$60.00
$80.00
$100.00
$120.00
$140.00
$160.00
$180.00
2008 2009 2010
$18.70 $24.80
$66.40
$149.50
$164.60
$148.35
Far Eastern ship finance German ship finance
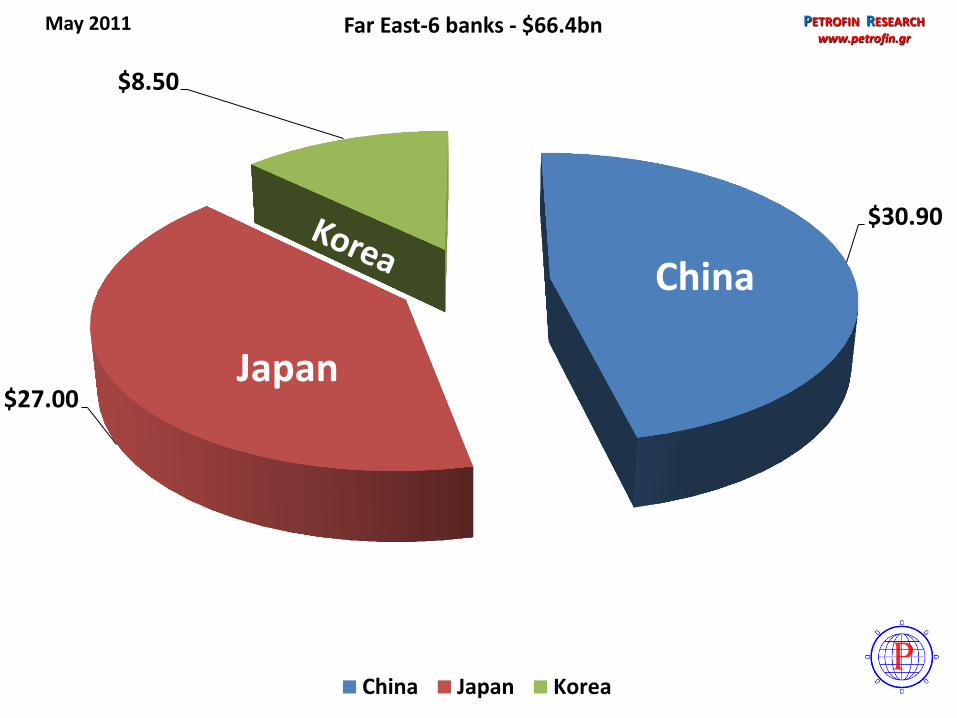
China
$30.90
$27.00
$8.50
Far East-6 banks - $66.4bn
China Japan Korea
China
PETROFIN RESEARCH
www.petrofin.gr May 2011
Japan
Trends and expectations over the next 3 years
PETROFIN RESEARCH
www.petrofin.gr
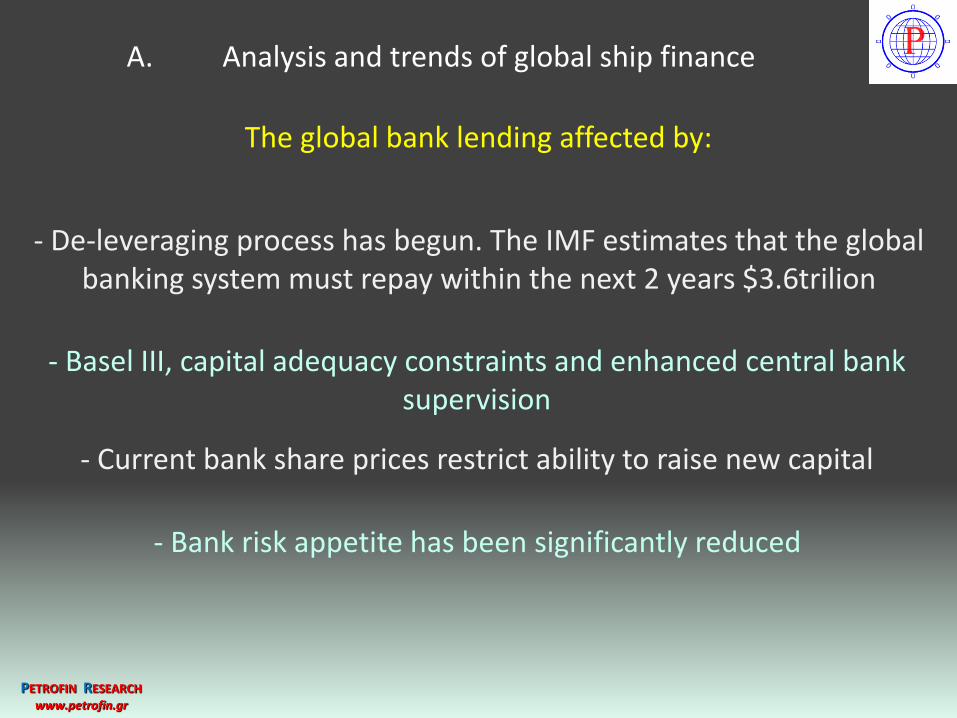
A. Analysis and trends of global ship finance
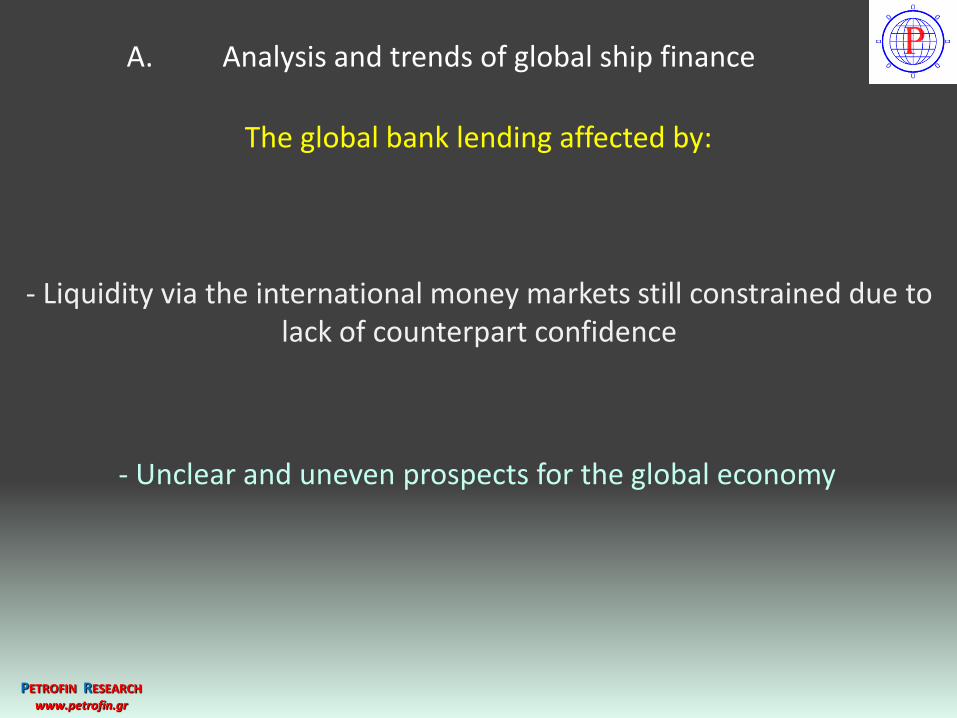
The global bank lending affected by:
PETROFIN RESEARCH
www.petrofin.gr
- De-leveraging process has begun. The IMF estimates that the global banking system must repay within the next 2 years $3.6trilion
A. Analysis and trends of global ship finance
- Basel III, capital adequacy constraints and enhanced central bank supervision
- Current bank share prices restrict ability to raise new capital
- Bank risk appetite has been significantly reduced
The global bank lending affected by:
PETROFIN RESEARCH
www.petrofin.gr
- Liquidity via the international money markets still constrained due to lack of counterpart confidence
A. Analysis and trends of global ship finance
- Unclear and uneven prospects for the global economy
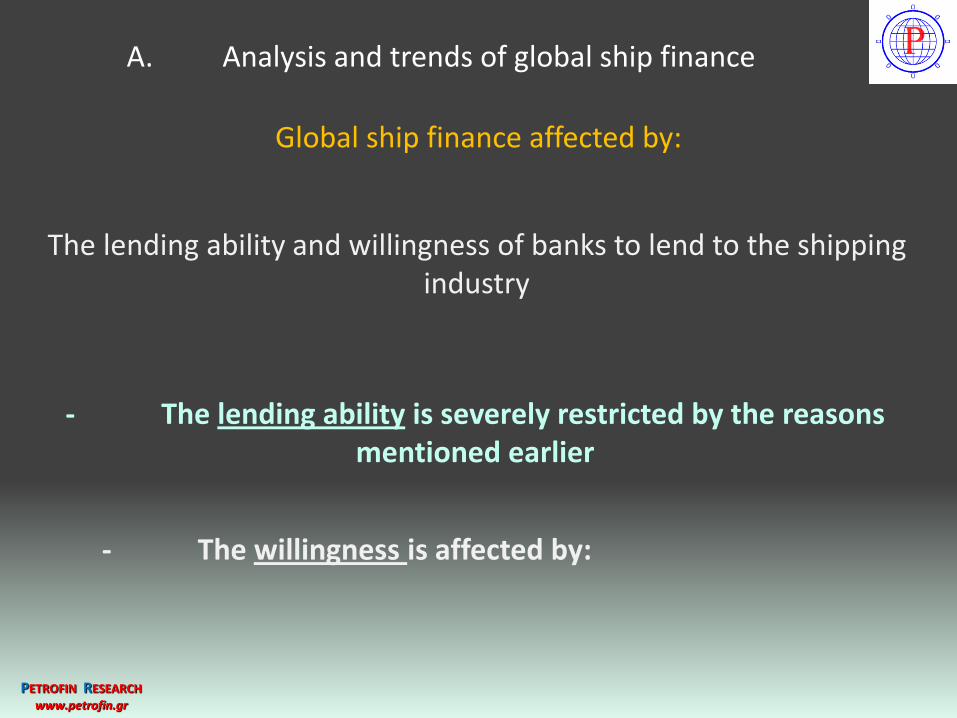
Global ship finance affected by:
PETROFIN RESEARCH
www.petrofin.gr
The lending ability and willingness of banks to lend to the shipping industry
A. Analysis and trends of global ship finance
- The lending ability is severely restricted by the reasons mentioned earlier
- The willingness is affected by:
Global ship finance affected by:
PETROFIN RESEARCH
www.petrofin.gr
A. Analysis and trends of global ship finance
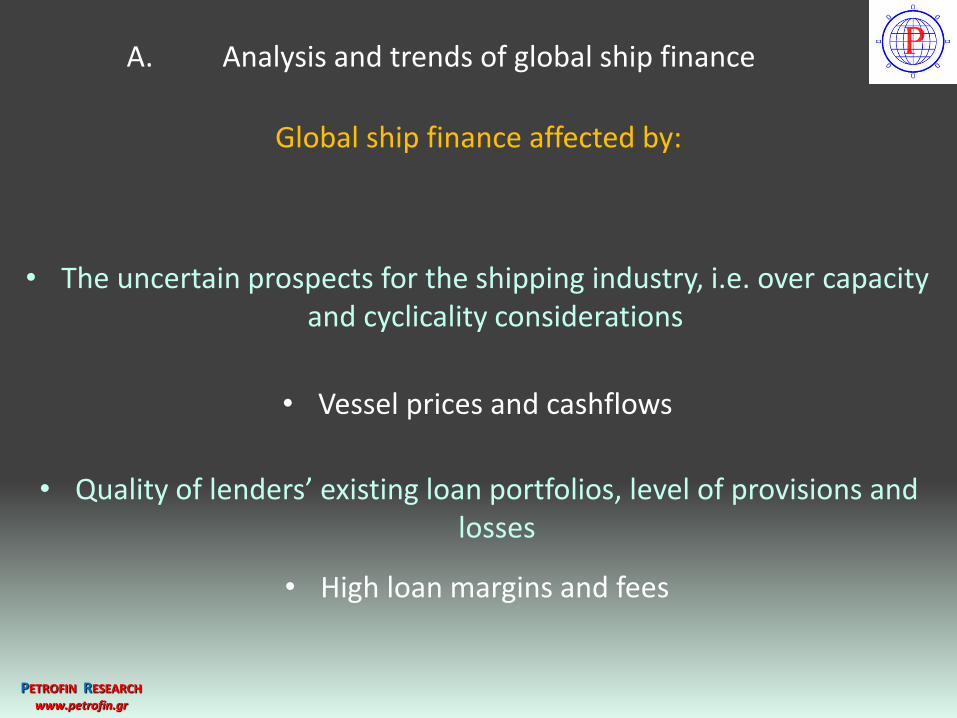
• The uncertain prospects for the shipping industry, i.e. over capacity and cyclicality considerations
• Vessel prices and cashflows
• Quality of lenders’ existing loan portfolios, level of provisions and losses
• High loan margins and fees
Global ship finance affected by:
PETROFIN RESEARCH
www.petrofin.gr
A. Analysis and trends of global ship finance
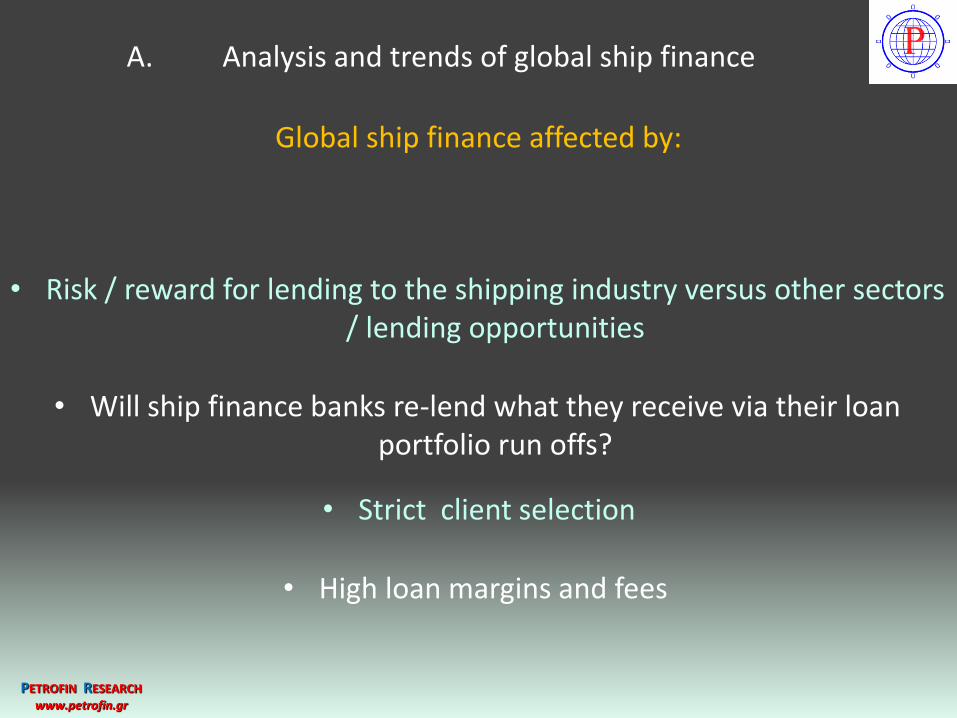
• Risk / reward for lending to the shipping industry versus other sectors / lending opportunities
• Will ship finance banks re-lend what they receive via their loan portfolio run offs?
• Strict client selection
• High loan margins and fees
Global ship finance affected by:
PETROFIN RESEARCH
www.petrofin.gr
A. Analysis and trends of global ship finance
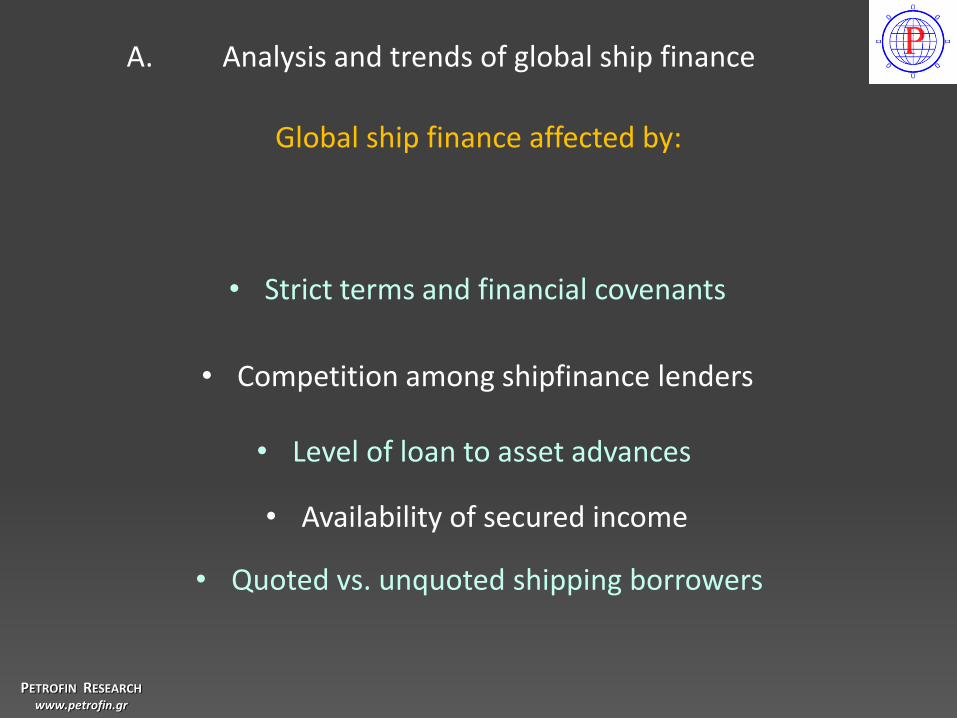
• Strict terms and financial covenants
• Competition among shipfinance lenders
• Level of loan to asset advances
• Availability of secured income
• Quoted vs. unquoted shipping borrowers

PETROFIN RESEARCH
www.petrofin.gr
B. Will there be finance for all?
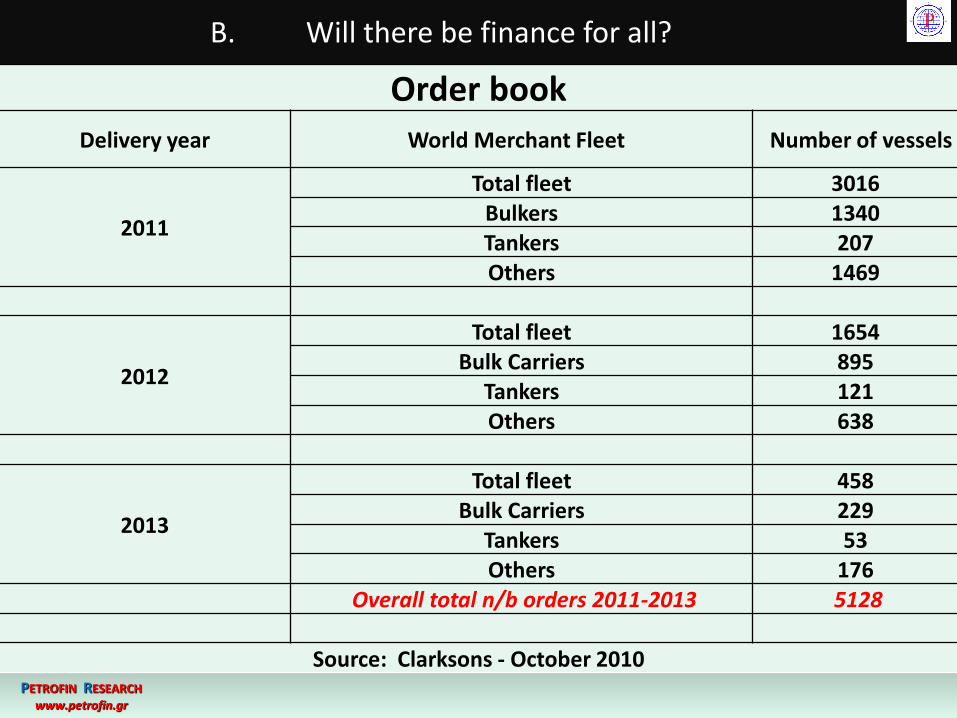
The total fleet order book
PETROFIN RESEARCH
www.petrofin.gr
Order book
Delivery year World Merchant Fleet Number of vessels
2011
Total fleet 3016 Bulkers 1340 Tankers 207 Others 1469
2012
Total fleet 1654 Bulk Carriers 895
Tankers 121 Others 638
2013
Total fleet 458 Bulk Carriers 229
Tankers 53 Others 176
Overall total n/b orders 2011-2013 5128
Source: Clarksons - October 2010
B. Will there be finance for all?

PETROFIN RESEARCH
www.petrofin.gr
B. Will there be finance for all?
Conversions / cancellations; some estimates
Additional newbuilding orders

Can the demand for newbuilding finance be accommodated?
PETROFIN RESEARCH
www.petrofin.gr
B. Will there be finance for all?
PETROFIN RESEARCH
www.petrofin.gr
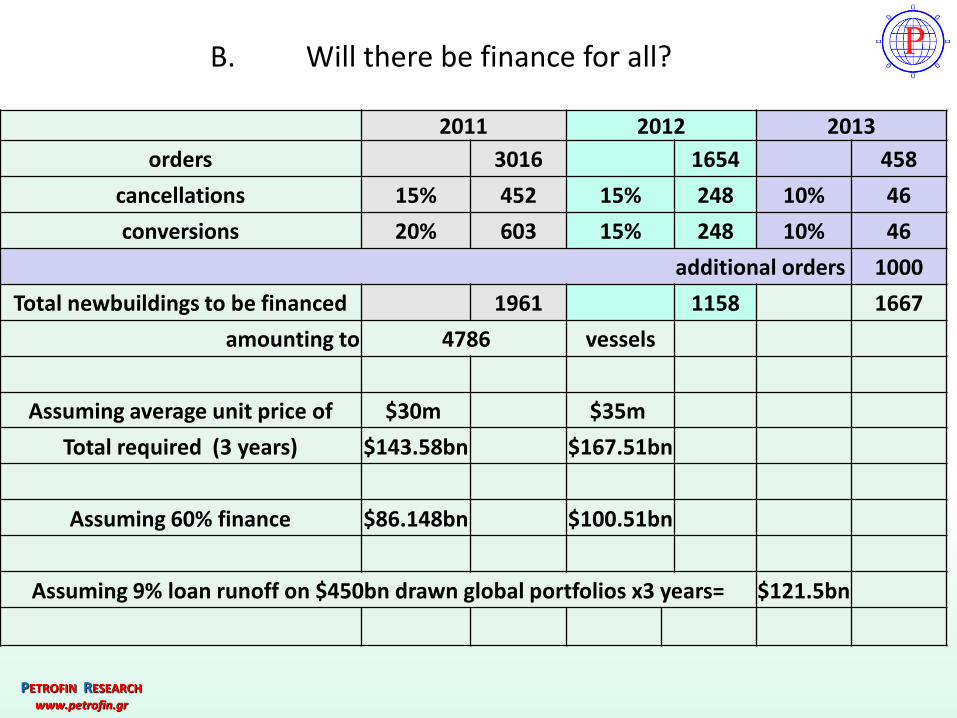
2011 2012 2013
orders 3016 1654 458
cancellations 15% 452 15% 248 10% 46
conversions 20% 603 15% 248 10% 46
additional orders 1000
Total newbuildings to be financed 1961 1158 1667
amounting to 4786 vessels
Assuming average unit price of $30m $35m
Total required (3 years) $143.58bn $167.51bn
Assuming 60% finance $86.148bn $100.51bn
Assuming 9% loan runoff on $450bn drawn global portfolios x3 years= $121.5bn
B. Will there be finance for all?
PETROFIN RESEARCH
www.petrofin.gr
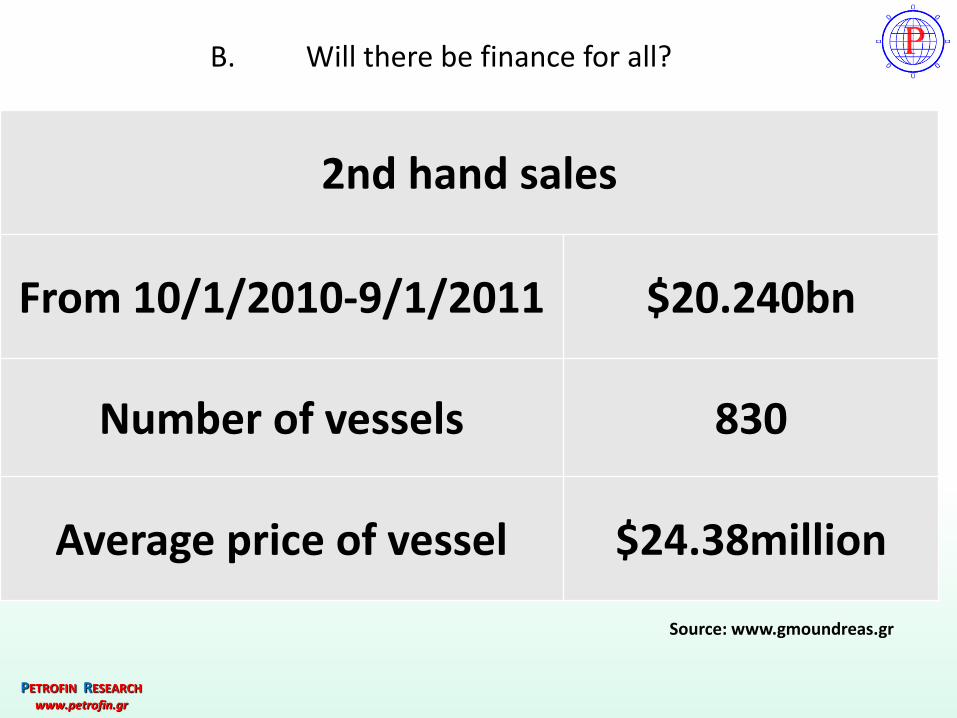
2nd hand sales
From 10/1/2010-9/1/2011 $20.240bn
Number of vessels 830
Average price of vessel $24.38million
Source: www.gmoundreas.gr
B. Will there be finance for all?
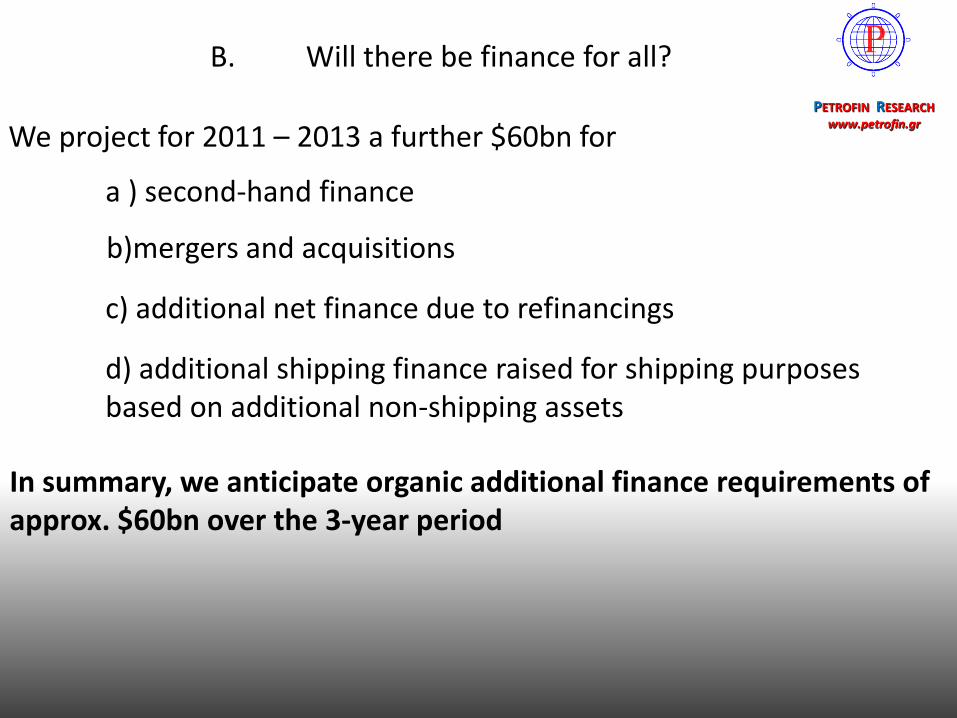
We project for 2011 – 2013 a further $60bn for
a ) second-hand finance
b)mergers and acquisitions
c) additional net finance due to refinancings
d) additional shipping finance raised for shipping purposes based on additional non-shipping assets
In summary, we anticipate organic additional finance requirements of approx. $60bn over the 3-year period
PETROFIN RESEARCH
www.petrofin.gr
B. Will there be finance for all?
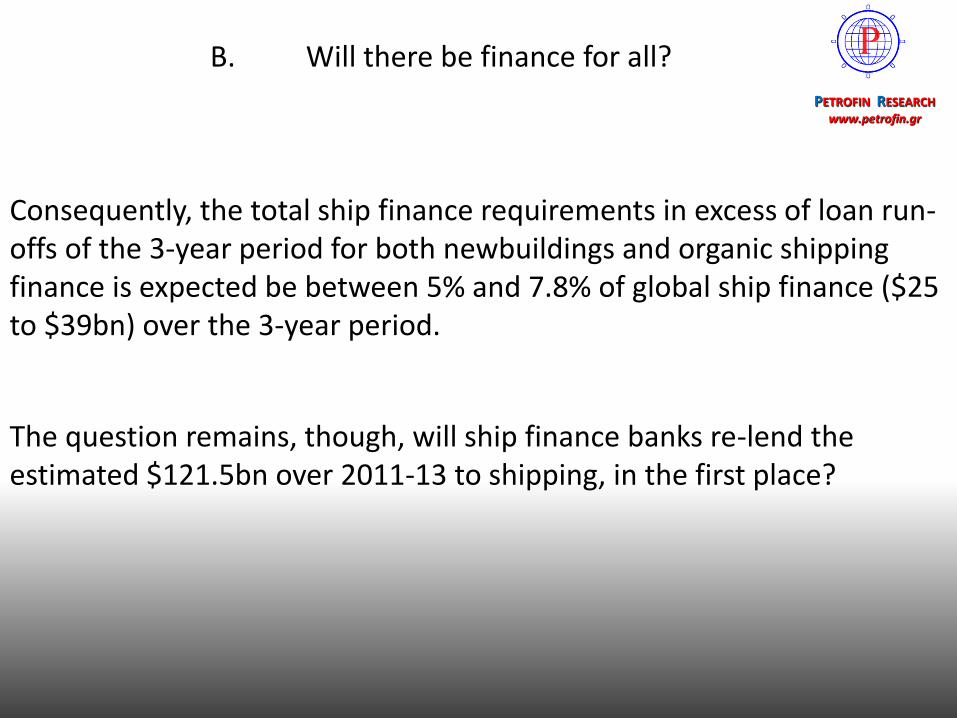
Consequently, the total ship finance requirements in excess of loan run-offs of the 3-year period for both newbuildings and organic shipping finance is expected be between 5% and 7.8% of global ship finance ($25 to $39bn) over the 3-year period.
The question remains, though, will ship finance banks re-lend the estimated $121.5bn over 2011-13 to shipping, in the first place?
PETROFIN RESEARCH www.petrofin.gr
B. Will there be finance for all?
Greek ship finance – presenting the latest Petrofin Bank Research as of end 2010, released April 2011
PETROFIN RESEARCH
www.petrofin.gr
C. Petrofin Bank Research for Greek ship finance
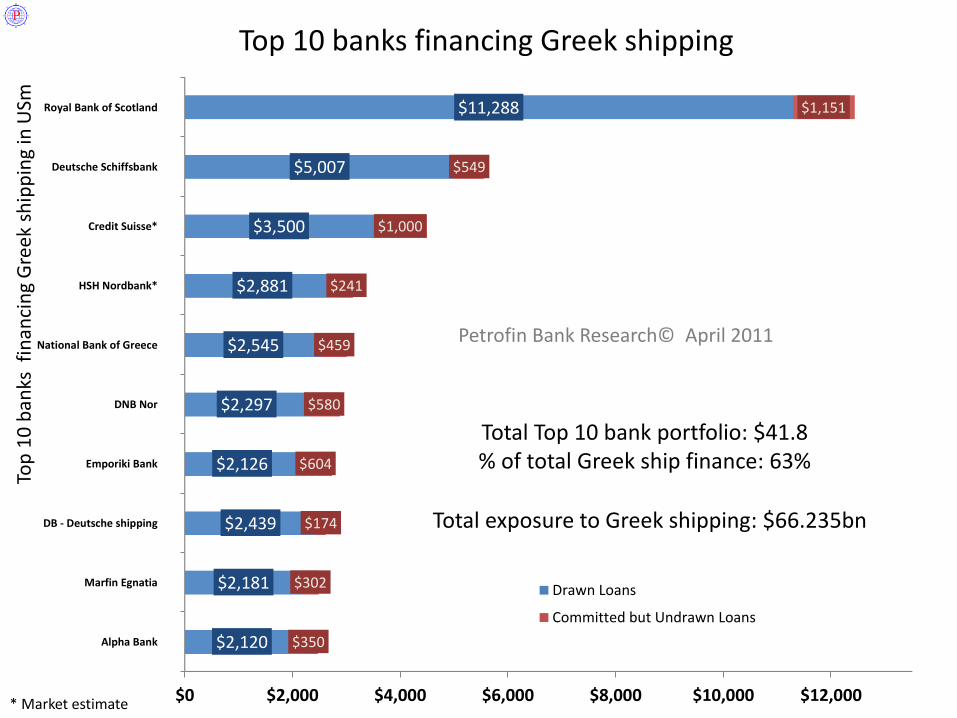
$0 $2,000 $4,000 $6,000 $8,000 $10,000 $12,000
Royal Bank of Scotland
Deutsche Schiffsbank
Credit Suisse*
HSH Nordbank*
National Bank of Greece
DNB Nor
Emporiki Bank
DB - Deutsche shipping
Marfin Egnatia
Alpha Bank
$11,288
$5,007
$3,500
$2,881
$2,545
$2,297
$2,126
$2,439
$2,181
$2,120
$1,151
$549
$1,000
$241
$459
$580
$604
$174
$302
$350
Drawn Loans
Committed but Undrawn Loans
Total exposure to Greek shipping: $66.235bn
Total Top 10 bank portfolio: $41.8 % of total Greek ship finance: 63%
Petrofin Bank Research© April 2011
* Market estimate
Top
10
ban
ks f
inan
cin
g G
reek
sh
ipp
ing
in U
Sm
Top 10 banks financing Greek shipping
* Market estimate
All
ban
ks f
inan
cin
g G
reek
sh
ipp
ing
in U
Sm
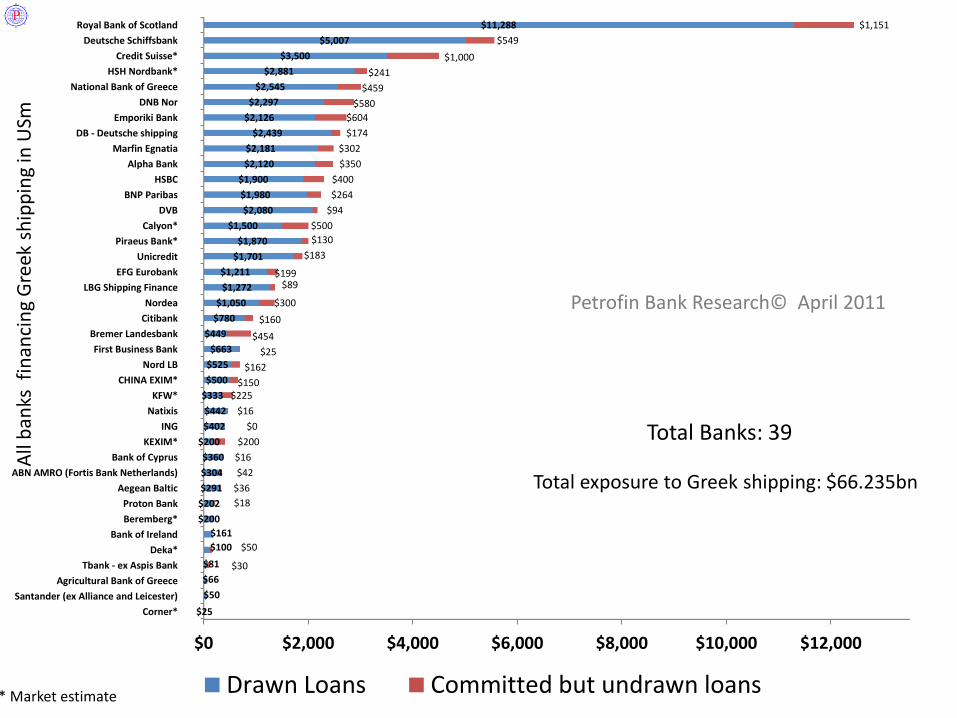
$0 $2,000 $4,000 $6,000 $8,000 $10,000 $12,000
Royal Bank of Scotland
Deutsche Schiffsbank
Credit Suisse*
HSH Nordbank*
National Bank of Greece
DNB Nor
Emporiki Bank
DB - Deutsche shipping
Marfin Egnatia
Alpha Bank
HSBC
BNP Paribas
DVB
Calyon*
Piraeus Bank*
Unicredit
EFG Eurobank
LBG Shipping Finance
Nordea
Citibank
Bremer Landesbank
First Business Bank
Nord LB
CHINA EXIM*
KFW*
Natixis
ING
KEXIM*
Bank of Cyprus
ABN AMRO (Fortis Bank Netherlands)
Aegean Baltic
Proton Bank
Beremberg*
Bank of Ireland
Deka*
Tbank - ex Aspis Bank
Agricultural Bank of Greece
Santander (ex Alliance and Leicester)
Corner*
$11,288
$5,007
$3,500
$2,881
$2,545
$2,297
$2,126
$2,439
$2,181
$2,120
$1,900
$1,980
$2,080
$1,500
$1,870
$1,701
$1,211
$1,272
$1,050
$780
$449
$663
$525
$500
$333
$442
$402
$200
$360
$304
$291
$202
$200
$161
$100
$81
$66
$50
$25
$1,151
$549
$1,000
$241
$459
$580
$604
$174
$302
$350
$400
$264
$94
$500
$130
$183
$199 $89
$300
$160
$454
$25
$162
$150 $225
$16
$0
$200
$16
$42
$36
$18
$50
$30
Drawn Loans Committed but undrawn loans
Total exposure to Greek shipping: $66.235bn
Total Banks: 39
Petrofin Bank Research© April 2011
PETROFIN RESEARCH
www.petrofin.gr
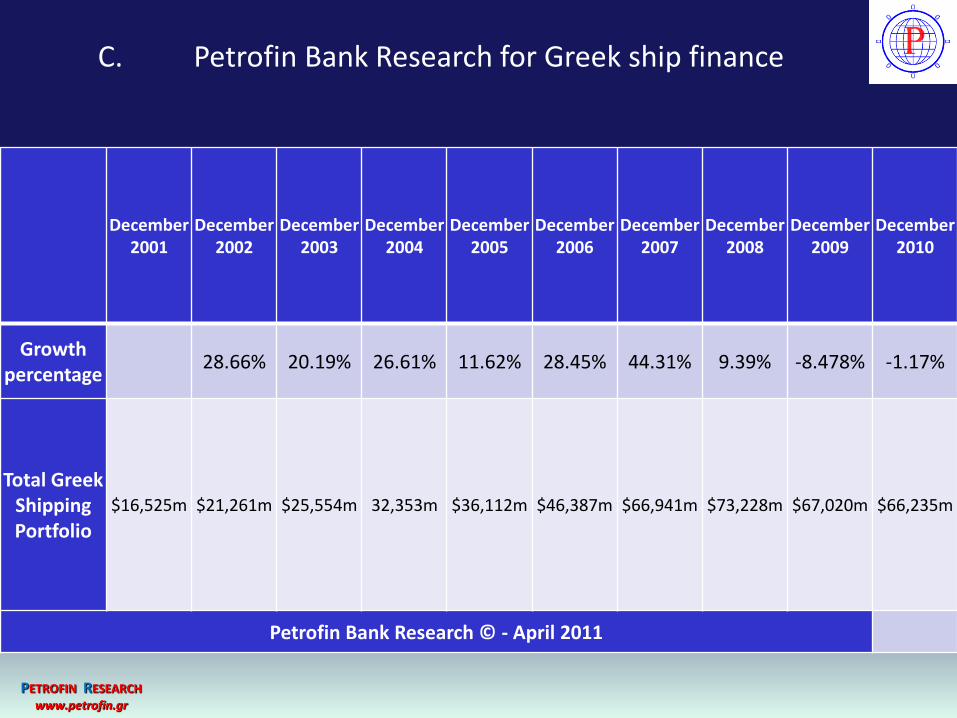
December
2001 December
2002 December
2003 December
2004 December
2005 December
2006 December
2007 December
2008 December
2009 December
2010
Growth percentage
28.66% 20.19% 26.61% 11.62% 28.45% 44.31% 9.39% -8.478% -1.17%
Total Greek Shipping Portfolio
$16,525m $21,261m $25,554m 32,353m $36,112m $46,387m $66,941m $73,228m $67,020m $66,235m
Petrofin Bank Research © - April 2011
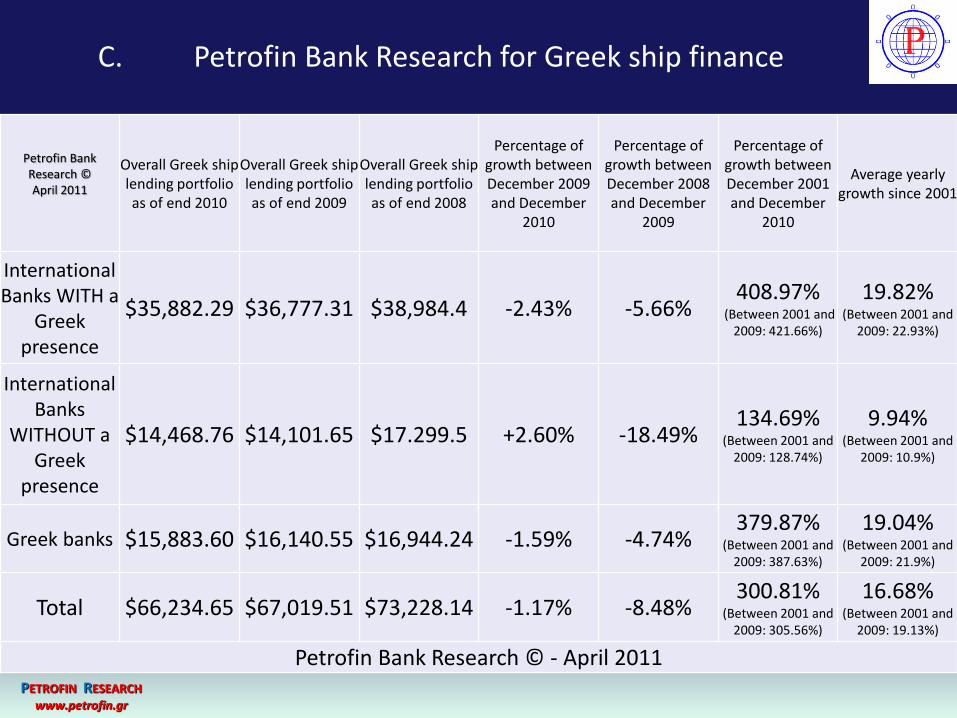
C. Petrofin Bank Research for Greek ship finance
PETROFIN RESEARCH
www.petrofin.gr
Petrofin Bank Research © April 2011
Overall Greek ship lending portfolio as of end 2010
Overall Greek ship lending portfolio as of end 2009
Overall Greek ship lending portfolio as of end 2008
Percentage of growth between December 2009 and December
2010
Percentage of growth between December 2008 and December
2009
Percentage of growth between December 2001 and December
2010
Average yearly growth since 2001
International Banks WITH a
Greek presence
$35,882.29 $36,777.31 $38,984.4 -2.43% -5.66% 408.97%
(Between 2001 and 2009: 421.66%)
19.82% (Between 2001 and
2009: 22.93%)
International Banks
WITHOUT a Greek
presence
$14,468.76 $14,101.65 $17.299.5 +2.60% -18.49% 134.69%
(Between 2001 and 2009: 128.74%)
9.94% (Between 2001 and
2009: 10.9%)
Greek banks $15,883.60 $16,140.55 $16,944.24 -1.59% -4.74% 379.87%
(Between 2001 and 2009: 387.63%)
19.04% (Between 2001 and
2009: 21.9%)
Total $66,234.65 $67,019.51 $73,228.14 -1.17% -8.48% 300.81%
(Between 2001 and 2009: 305.56%)
16.68% (Between 2001 and
2009: 19.13%)
Petrofin Bank Research © - April 2011
C. Petrofin Bank Research for Greek ship finance
Bank capacity in financing Greek shipping
November 2009: 35 banks February 2010: 40 banks Autumn 2010: 39 banks
Totals 2009: $73.2bn Totals 2010: $67.02bn Totals end 2010: $66.23bn
April 2011 PETROFIN RESEARCH
www.petrofin.gr
end 2010: 39 banks
0.00%
10.00%
20.00%
30.00%
40.00%
50.00%
60.00%
70.00%
33.25% 39.33%
28.45%
44.21% 51.49%
47.16%
62.73%
49.49%
15.26% 13.55% 8.81% 6.30%
14 banks Nov 2009
20 banks
Feb 2010 13
banks Autumn
2010
15 banks
end 2010
14 banks –
Nov 2009
13 banks Feb 2010
19 banks Autumn
2010
19 banks end 2010
Banks with neutral/unclear policy/capacity
7 banks Nov 2009
7 banks Feb
2010
7 banks Autumn
2010 5 banks
end 2010
Banks with reduced lending capacity
Banks with lending capacity
PETROFIN RESEARCH
www.petrofin.gr
C. Petrofin Bank Research for Greek ship finance
Trends and expectations for Greek ship finance over the next 3 years
PETROFIN RESEARCH
www.petrofin.gr
C. Petrofin Bank Research for Greek ship finance
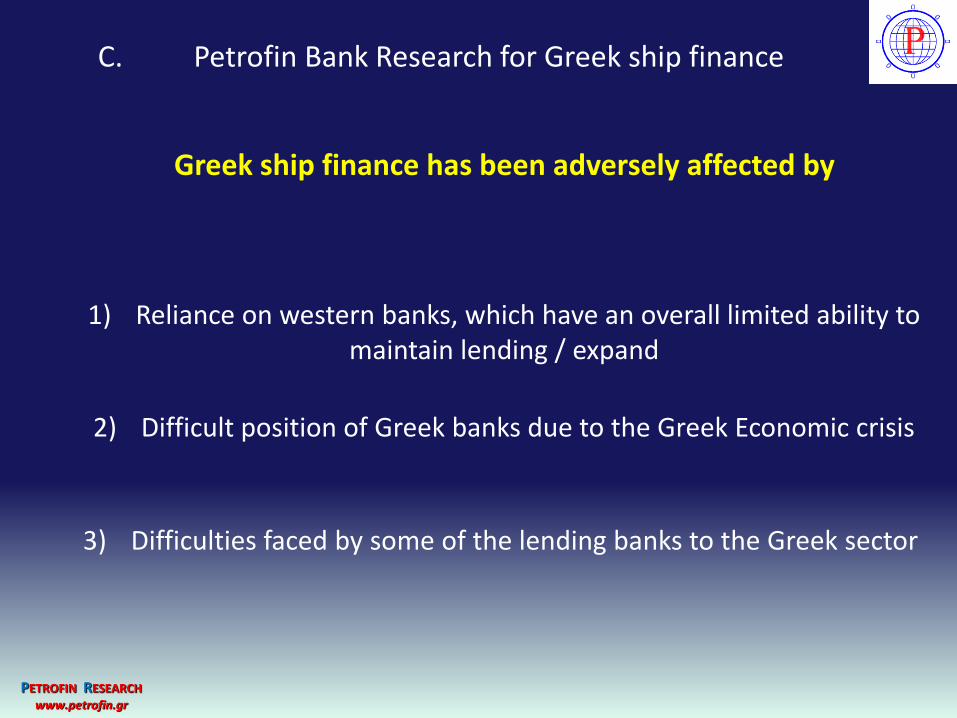
Greek ship finance has been adversely affected by
1) Reliance on western banks, which have an overall limited ability to maintain lending / expand
2) Difficult position of Greek banks due to the Greek Economic crisis
3) Difficulties faced by some of the lending banks to the Greek sector
PETROFIN RESEARCH
www.petrofin.gr
C. Petrofin Bank Research for Greek ship finance
Greek ship finance has been adversely affected by
4) Absence of new banks (other than Far Eastern banks)
5) Uncertain prospects for the shipping industry
6) Concern over future vessel values and future cashflows affecting banks’ loan portfolios
PETROFIN RESEARCH
www.petrofin.gr
C. Petrofin Bank Research for Greek ship finance
However,
1. Greek shipping has been remarkably free of shipping company failures
2. Greek owners are proving adept to coping with shipping crises
3. Greece’s confidence in shipping remains strong
4. Greek shipping still cashflow positive
5. Bank loan portfolios for Greek shipping still strong
6. Current tight Greek ship finance conditions enhance bank loan yields and ability to obtain stricter terms / financial covenants
PETROFIN RESEARCH
www.petrofin.gr
C. Petrofin Bank Research for Greek ship finance
However,
7. Loan to asset new advances remain attractively low
8. Banks able to select clients / loan transactions
9. Greek shipping’s cash reserves an attractive consideration for banks
10. Credit relationships between banks and Greek borrowers remain strong and mutually supportive
11. Greek shipping sector remains attractive in relation to other potential lending sectors
Other providers of debt and equity; alternative finance, private capital, the role of public companies
PETROFIN RESEARCH
www.petrofin.gr
D. Additional sources of ship finance
PETROFIN RESEARCH
www.petrofin.gr
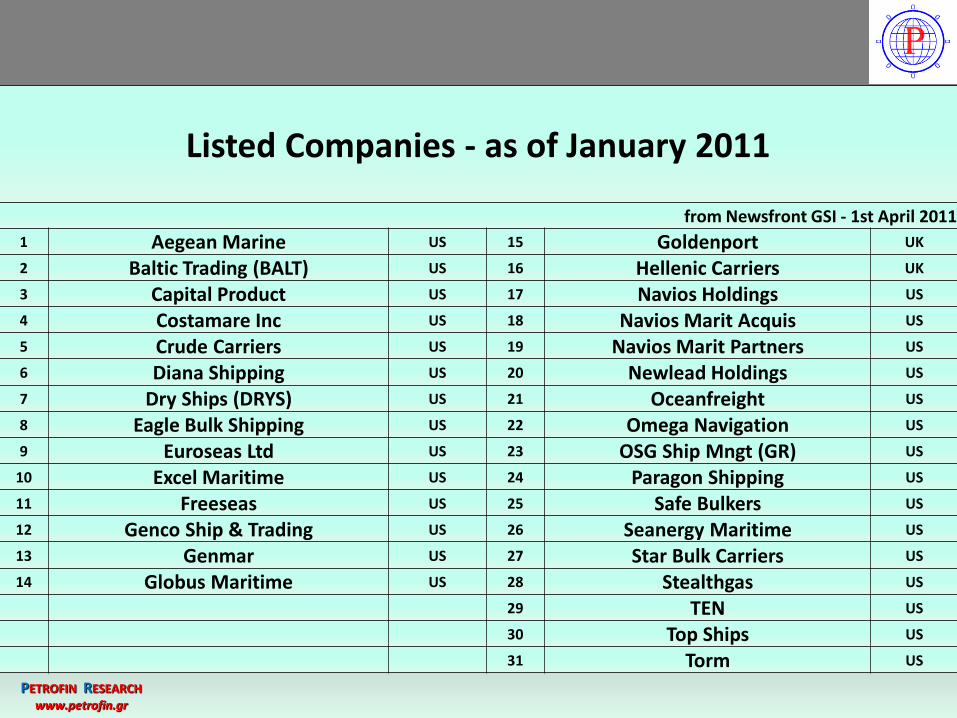
Listed Companies - as of January 2011
from Newsfront GSI - 1st April 2011
1 Aegean Marine US 15 Goldenport UK
2 Baltic Trading (BALT) US 16 Hellenic Carriers UK
3 Capital Product US 17 Navios Holdings US
4 Costamare Inc US 18 Navios Marit Acquis US
5 Crude Carriers US 19 Navios Marit Partners US
6 Diana Shipping US 20 Newlead Holdings US
7 Dry Ships (DRYS) US 21 Oceanfreight US
8 Eagle Bulk Shipping US 22 Omega Navigation US
9 Euroseas Ltd US 23 OSG Ship Mngt (GR) US
10 Excel Maritime US 24 Paragon Shipping US
11 Freeseas US 25 Safe Bulkers US
12 Genco Ship & Trading US 26 Seanergy Maritime US
13 Genmar US 27 Star Bulk Carriers US
14 Globus Maritime US 28 Stealthgas US
29 TEN US
30 Top Ships US
31 Torm US
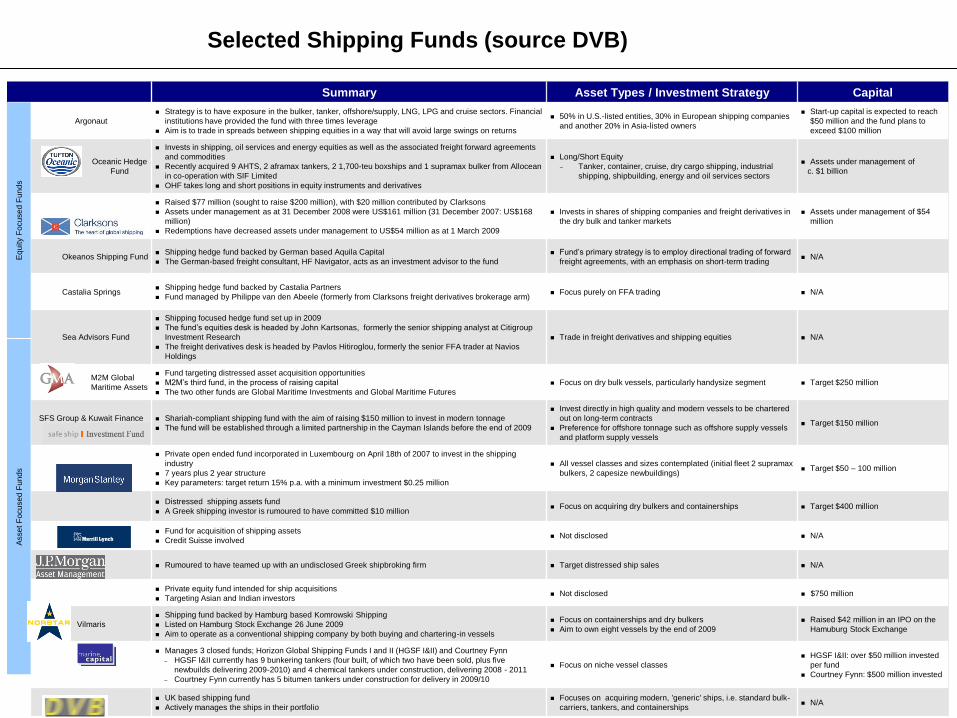
Selected Shipping Funds (source DVB)
Summary Asset Types / Investment Strategy Capital
Argonaut
Strategy is to have exposure in the bulker, tanker, offshore/supply, LNG, LPG and cruise sectors. Financial
institutions have provided the fund with three times leverage
Aim is to trade in spreads between shipping equities in a way that will avoid large swings on returns
50% in U.S.-listed entities, 30% in European shipping companies
and another 20% in Asia-listed owners
Start-up capital is expected to reach
$50 million and the fund plans to
exceed $100 million
Oceanic Hedge
Fund
Invests in shipping, oil services and energy equities as well as the associated freight forward agreements
and commodities
Recently acquired 9 AHTS, 2 aframax tankers, 2 1,700-teu boxships and 1 supramax bulker from Allocean
in co-operation with SIF Limited
OHF takes long and short positions in equity instruments and derivatives
Long/Short Equity
– Tanker, container, cruise, dry cargo shipping, industrial
shipping, shipbuilding, energy and oil services sectors
Assets under management of
c. $1 billion
Raised $77 million (sought to raise $200 million), with $20 million contributed by Clarksons
Assets under management as at 31 December 2008 were US$161 million (31 December 2007: US$168
million)
Redemptions have decreased assets under management to US$54 million as at 1 March 2009
Invests in shares of shipping companies and freight derivatives in
the dry bulk and tanker markets
Assets under management of $54
million
Okeanos Shipping Fund Shipping hedge fund backed by German based Aquila Capital
The German-based freight consultant, HF Navigator, acts as an investment advisor to the fund
Fund’s primary strategy is to employ directional trading of forward
freight agreements, with an emphasis on short-term trading N/A
Castalia Springs Shipping hedge fund backed by Castalia Partners
Fund managed by Philippe van den Abeele (formerly from Clarksons freight derivatives brokerage arm) Focus purely on FFA trading N/A
Sea Advisors Fund
Shipping focused hedge fund set up in 2009
The fund’s equities desk is headed by John Kartsonas, formerly the senior shipping analyst at Citigroup
Investment Research
The freight derivatives desk is headed by Pavlos Hitiroglou, formerly the senior FFA trader at Navios
Holdings
Trade in freight derivatives and shipping equities N/A
M2M Global
Maritime Assets
Fund targeting distressed asset acquisition opportunities
M2M’s third fund, in the process of raising capital
The two other funds are Global Maritime Investments and Global Maritime Futures
Focus on dry bulk vessels, particularly handysize segment Target $250 million
SFS Group & Kuwait Finance
House
Shariah-compliant shipping fund with the aim of raising $150 million to invest in modern tonnage
The fund will be established through a limited partnership in the Cayman Islands before the end of 2009
Invest directly in high quality and modern vessels to be chartered
out on long-term contracts
Preference for offshore tonnage such as offshore supply vessels
and platform supply vessels
Target $150 million
Private open ended fund incorporated in Luxembourg on April 18th of 2007 to invest in the shipping
industry
7 years plus 2 year structure
Key parameters: target return 15% p.a. with a minimum investment $0.25 million
All vessel classes and sizes contemplated (initial fleet 2 supramax
bulkers, 2 capesize newbuildings) Target $50 – 100 million
Distressed shipping assets fund
A Greek shipping investor is rumoured to have committed $10 million Focus on acquiring dry bulkers and containerships Target $400 million
Fund for acquisition of shipping assets
Credit Suisse involved Not disclosed N/A
Rumoured to have teamed up with an undisclosed Greek shipbroking firm Target distressed ship sales N/A
Private equity fund intended for ship acquisitions
Targeting Asian and Indian investors Not disclosed $750 million
Vilmaris
Shipping fund backed by Hamburg based Komrowski Shipping
Listed on Hamburg Stock Exchange 26 June 2009
Aim to operate as a conventional shipping company by both buying and chartering-in vessels
Focus on containerships and dry bulkers
Aim to own eight vessels by the end of 2009
Raised $42 million in an IPO on the
Hamuburg Stock Exchange
Manages 3 closed funds; Horizon Global Shipping Funds I and II (HGSF I&II) and Courtney Fynn
– HGSF I&II currently has 9 bunkering tankers (four built, of which two have been sold, plus five
newbuilds delivering 2009-2010) and 4 chemical tankers under construction, delivering 2008 - 2011
– Courtney Fynn currently has 5 bitumen tankers under construction for delivery in 2009/10
Focus on niche vessel classes
HGSF I&II: over $50 million invested
per fund
Courtney Fynn: $500 million invested
UK based shipping fund
Actively manages the ships in their portfolio
Focuses on acquiring modern, 'generic' ships, i.e. standard bulk-
carriers, tankers, and containerships N/A
Eq
uity F
ocu
se
d F
un
ds
Asse
t F
ocu
se
d F
un
ds
Conclusions
PETROFIN
RESEARCH
www.petrofin.gr
1. Global ship finance conditions to gradually ease over the next few years, as western bank confidence, liquidity and capital adequacy returns.
2. Greek ship finance to remain tight for 2011/2012 but to start easing thereafter, due to
a. The recovery and strengthening of the western banks
b. The growth of Far East lending
c. The anticipated recovery of the Greek banks
d. The expected influx of new lenders
e. The possible easing of overcapacity concerns and
f. The return of market equilibrium and the recovery of vessel values and freight rates
Conclusions, cont.
PETROFIN
RESEARCH
www.petrofin.gr
3. Tight lending conditions affecting particularly small to medium shipping companies shall persist until intense bank competition shall return
4. Ship finance lending conditions and appetite shall be affected by the length and severity of the current slump affecting vessel values and freight rates, as well as the recovery prospects for global shipping

PETROFIN
RESEARCH
www.petrofin.gr