prospective plantings 03/31/2020 · 2020-04-03 · prospective plantings issn: 1949-159x released...
TRANSCRIPT
Prospective Plantings
ISSN: 1949-159X
Released March 31, 2020, by the National Agricultural Statistics Service (NASS), Agricultural Statistics Board, United States Department of
Agriculture (USDA).
Corn Planted Acreage Up 8 Percent from 2019 Soybean Acreage Up 10 Percent All Wheat Acreage Down 1 Percent All Cotton Acreage Down Less Than 1 Percent
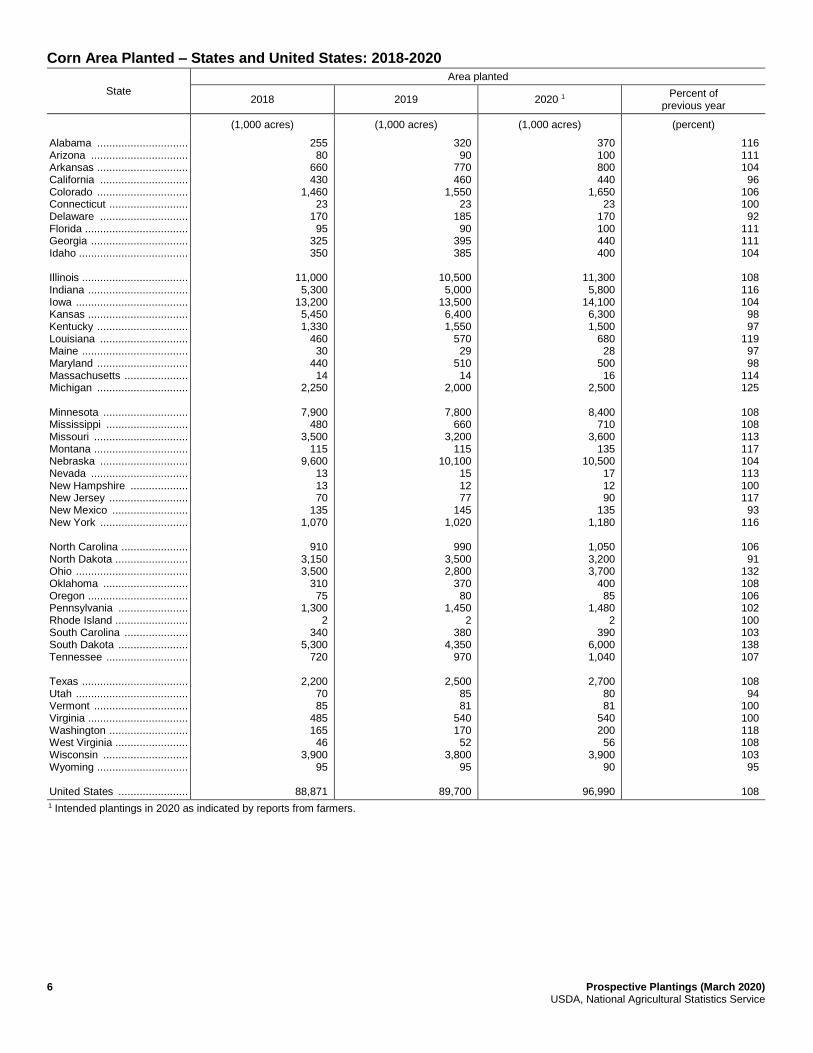
Corn planted area for all purposes in 2020 is estimated at 97.0 million acres, up 8 percent or 7.29 million acres from last
year. Compared with last year, planted acreage is expected to be up or unchanged in 38 of the 48 estimating States.
Soybean planted area for 2020 is estimated at 83.5 million acres, up 10 percent from last year. Compared with last year,
planted acreage is expected to be up or unchanged in 22 of the 29 estimating States.
All wheat planted area for 2020 is estimated at 44.7 million acres, down 1 percent from 2019. This represents the lowest
all wheat planted area since records began in 1919. The 2020 winter wheat planted area, at 30.8 million acres, is down
1 percent from last year and down slightly from the previous estimate. Of this total, about 21.7 million acres are Hard Red
Winter, 5.69 million acres are Soft Red Winter, and 3.42 million acres are White Winter. Area expected to be planted to
other spring wheat for 2020 is estimated at 12.6 million acres, down 1 percent from 2019. Of this total, about 11.9 million
acres are Hard Red Spring wheat. Durum planted area for 2020 is expected to total 1.29 million acres, down 4 percent
from the previous year.
All cotton planted area for 2020 is estimated at 13.7 million acres, down less than 1 percent from last year. Upland area is
estimated at 13.5 million acres, down less than 1 percent from 2019. American Pima area is estimated at 228,000 acres,
down 1 percent from 2019.

2 Prospective Plantings (March 2020) USDA, National Agricultural Statistics Service
This report was approved on March 31, 2020.
Secretary of Agriculture
Designate
Robert Johansson
Agricultural Statistics Board
Chairperson
Joseph L. Parsons

Prospective Plantings (March 2020) 3 USDA, National Agricultural Statistics Service
Contents
Principal Crops Area Planted – States and United States: 2018-2020 .................................................................................... 5
Corn Area Planted – States and United States: 2018-2020 ..................................................................................................... 6
Corn and Soybean Planted Acreage – United States Chart ..................................................................................................... 7
Sorghum Area Planted – States and United States: 2018-2020 .............................................................................................. 7
Oat Area Planted – States and United States: 2018-2020 ....................................................................................................... 8
Barley Area Planted – States and United States: 2018-2020 .................................................................................................. 9
All Wheat Area Planted – States and United States: 2018-2020 .......................................................................................... 10
Winter Wheat Area Planted – States and United States: 2018-2020 .................................................................................... 11
Durum Wheat Area Planted – States and United States: 2018-2020 .................................................................................... 12
Other Spring Wheat Area Planted – States and United States: 2018-2020 ........................................................................... 12
All Hay Area Harvested – States and United States: 2018-2020 .......................................................................................... 13
Rice Area Planted by Class – States and United States: 2018-2020 ..................................................................................... 14
Canola Area Planted – States and United States: 2018-2020................................................................................................ 14
Soybean Area Planted – States and United States: 2018-2020 ............................................................................................. 15
Peanut Area Planted – States and United States: 2018-2020 ................................................................................................ 15
Sunflower Area Planted by Type – States and United States: 2018-2020 ............................................................................ 16
Flaxseed Area Planted – States and United States: 2018-2020 ............................................................................................. 16
Cotton Area Planted by Type – States and United States: 2018-2020 .................................................................................. 17
Sugarbeet Area Planted – States and United States: 2018-2020 ........................................................................................... 18
Tobacco Area Harvested – States and United States: 2018-2020 ......................................................................................... 18
Tobacco Area Harvested by Class and Type – States and United States: 2018-2020 .......................................................... 19
Dry Edible Bean Area Planted – States and United States: 2018-2020 ................................................................................ 20
Chickpea Area Planted – States and United States: 2018-2020 ............................................................................................ 21
Lentil Area Planted – States and United States: 2018-2020 ................................................................................................. 22
Dry Edible Pea Area Planted – States and United States: 2018-2020 .................................................................................. 22

4 Prospective Plantings (March 2020) USDA, National Agricultural Statistics Service
Crop Area Planted and Harvested, Yield, and Production in Domestic Units – United States: 2019 and 2020 ................... 23
Crop Area Planted and Harvested, Yield, and Production in Metric Units – United States: 2019 and 2020 ........................ 25
Winter Weather Summary .................................................................................................................................................... 27
Crop Comments .................................................................................................................................................................... 29
Statistical Methodology ......................................................................................................................................................... 32
Reliability of Prospective Plantings Planted Acreage Estimates .......................................................................................... 33
Information Contacts ............................................................................................................................................................. 34

Prospective Plantings (March 2020) 5 USDA, National Agricultural Statistics Service
Principal Crops Area Planted – States and United States: 2018-2020 [Crops included in area planted are corn, sorghum, oats, barley, rye, winter wheat, Durum wheat, other spring wheat, rice, soybeans, peanuts, sunflower, cotton, dry edible beans, chickpeas, potatoes, sugarbeets, canola, and proso millet. Harvested acreage is used for all hay, tobacco, and sugarcane in computing total area planted. Values for 2020 were carried forward from 2019 for potatoes, proso millet, rye, and sugarcane. Includes double cropped acres and unharvested small grains planted as cover crops]
State 2018 2019 2020 1
(1,000 acres) (1,000 acres) (1,000 acres)
Alabama ...................................................................... Alaska ......................................................................... Arizona ........................................................................ Arkansas ..................................................................... California ..................................................................... Colorado ...................................................................... Connecticut ................................................................. Delaware ..................................................................... Florida ......................................................................... Georgia ....................................................................... Idaho ........................................................................... Illinois .......................................................................... Indiana ........................................................................ Iowa ............................................................................. Kansas ........................................................................ Kentucky ...................................................................... Louisiana ..................................................................... Maine .......................................................................... Maryland ...................................................................... Massachusetts ............................................................. Michigan ...................................................................... Minnesota .................................................................... Mississippi ................................................................... Missouri ....................................................................... Montana ...................................................................... Nebraska ..................................................................... Nevada ........................................................................ New Hampshire ........................................................... New Jersey .................................................................. New Mexico ................................................................. New York ..................................................................... North Carolina ............................................................. North Dakota ............................................................... Ohio ............................................................................. Oklahoma .................................................................... Oregon ........................................................................ Pennsylvania ............................................................... Rhode Island ............................................................... South Carolina ............................................................. South Dakota ............................................................... Tennessee ................................................................... Texas .......................................................................... Utah ............................................................................. Vermont ....................................................................... Virginia ........................................................................ Washington ................................................................. West Virginia ............................................................... Wisconsin .................................................................... Wyoming ..................................................................... United States 2 .............................................................
2,325 28
665 7,282 2,946 6,140
70 453
1,114 3,653
4,177
22,936 12,120 24,241 23,465 5,693 3,287
227 1,572
93
6,390 19,484 4,144
13,782 9,835
19,742 401 52
314 874
2,828 4,593
24,163 10,065 10,036 1,997 3,443
8 1,498
17,300
4,896 21,833
871 255
2,634 3,697
617 8,014 1,474
319,305
2,115 28
634 6,598 2,941 6,091
70 435
1,075 3,354
4,096
21,590 11,250 23,935 23,113 5,712 3,024
229 1,556
65
5,541 18,349 3,822
12,827 9,946
19,176 450 61
282 823
2,591 4,400
23,221 8,595 9,390 1,905 3,686
7 1,428
13,816
4,836 21,419
907 241
2,609 3,542
567 7,624 1,504
302,626
2,175 30
634 7,229 2,809 5,910
76 404
1,103 3,429
4,098
22,950 12,040 24,840 24,075 5,856 3,209
220 1,548
64
6,474 19,492 4,055
13,779 9,847
19,854 457 57
285 793
2,909 4,583
23,429 10,010 9,444 1,845 3,856
7 1,443
17,631
5,023 22,495
911 261
2,712 3,494
596 7,960 1,539
319,088
1 Intended plantings in 2020 as indicated by reports from farmers. 2 States do not add to United States due to rye unallocated acreage.
6 Prospective Plantings (March 2020) USDA, National Agricultural Statistics Service
Corn Area Planted – States and United States: 2018-2020
State
Area planted
2018 2019 2020 1 Percent of
previous year
(1,000 acres) (1,000 acres) (1,000 acres) (percent)
Alabama .............................. Arizona ................................ Arkansas .............................. California ............................. Colorado .............................. Connecticut .......................... Delaware ............................. Florida .................................. Georgia ................................ Idaho .................................... Illinois ................................... Indiana ................................. Iowa ..................................... Kansas ................................. Kentucky .............................. Louisiana ............................. Maine ................................... Maryland .............................. Massachusetts ..................... Michigan .............................. Minnesota ............................ Mississippi ........................... Missouri ............................... Montana ............................... Nebraska ............................. Nevada ................................ New Hampshire ................... New Jersey .......................... New Mexico ......................... New York ............................. North Carolina ...................... North Dakota ........................ Ohio ..................................... Oklahoma ............................ Oregon ................................. Pennsylvania ....................... Rhode Island ........................ South Carolina ..................... South Dakota ....................... Tennessee ........................... Texas ................................... Utah ..................................... Vermont ............................... Virginia ................................. Washington .......................... West Virginia ........................ Wisconsin ............................ Wyoming .............................. United States .......................
255 80
660 430
1,460 23
170 95
325 350
11,000 5,300
13,200 5,450 1,330
460 30
440 14
2,250
7,900 480
3,500 115
9,600 13 13 70
135 1,070
910
3,150 3,500
310 75
1,300 2
340 5,300
720
2,200 70 85
485 165 46
3,900 95
88,871
320 90
770 460
1,550 23
185 90
395 385
10,500 5,000
13,500 6,400 1,550
570 29
510 14
2,000
7,800 660
3,200 115
10,100 15 12 77
145 1,020
990
3,500 2,800
370 80
1,450 2
380 4,350
970
2,500 85 81
540 170 52
3,800 95
89,700
370 100 800 440
1,650 23
170 100 440 400
11,300 5,800
14,100 6,300 1,500
680 28
500 16
2,500
8,400 710
3,600 135
10,500 17 12 90
135 1,180
1,050 3,200 3,700
400 85
1,480 2
390 6,000 1,040
2,700
80 81
540 200 56
3,900 90
96,990
116 111 104 96
106 100 92
111 111 104
108 116 104 98 97
119 97 98
114 125
108 108 113 117 104 113 100 117 93
116
106 91
132 108 106 102 100 103 138 107
108 94
100 100 118 108 103 95
108
1 Intended plantings in 2020 as indicated by reports from farmers.

Prospective Plantings (March 2020) 7 USDA, National Agricultural Statistics Service
Sorghum Area Planted – States and United States: 2018-2020
State
Area planted
2018 2019 2020 1 Percent of
previous year
(1,000 acres) (1,000 acres) (1,000 acres) (percent)
Arkansas 2 ........................... Colorado .............................. Georgia 2 ............................. Illinois 2 ................................ Kansas ................................ Louisiana 2 ........................... Mississippi 2 ......................... Missouri 2 ............................. Nebraska ............................. New Mexico 2 ....................... North Carolina 2 ................... Oklahoma ............................ South Dakota ....................... Texas .................................. United States .......................
12 355 25 18
2,800 8 4
30 230 80
18
300 260
1,550
5,690
(NA) 365
(NA) (NA)
2,600 (NA) (NA) (NA) 200
(NA)
(NA) 300 250
1,550
5,265
(NA) 410
(NA) (NA)
2,800 (NA) (NA) (NA) 200
(NA)
(NA) 340 270
1,800
5,820
(X) 112 (X) (X)
108 (X) (X) (X)
100 (X)
(X)
113 108 116
111
(NA) Not available. (X) Not applicable. 1 Intended plantings in 2020 as indicated by reports from farmers. 2 Estimates discontinued in 2019.
50.0
60.0
70.0
80.0
90.0
100.0
2000 2002 2004 2006 2008 2010 2012 2014 2016 2018 2020
Million acres
Corn and Soybean Planted Acreage - United States
Corn
Soybeans

8 Prospective Plantings (March 2020) USDA, National Agricultural Statistics Service
Oat Area Planted – States and United States: 2018-2020 [Includes area planted in preceding fall]
State
Area planted
2018 2019 2020 1 Percent of
previous year
(1,000 acres) (1,000 acres) (1,000 acres) (percent)
Alabama 2 ............................ Arkansas .............................. California ............................. Colorado 2 ............................ Georgia ................................ Idaho .................................... Illinois ................................... Iowa ..................................... Kansas ................................. Maine ................................... Michigan .............................. Minnesota ............................ Missouri ............................... Montana ............................... Nebraska ............................. New York ............................. North Carolina ...................... North Dakota ........................ Ohio ..................................... Oklahoma ............................ Oregon ................................. Pennsylvania ....................... South Carolina 2 ................... South Dakota ....................... Texas ................................... Washington 2 ........................ Wisconsin ............................ Wyoming 2 ........................... United States .......................
40 10
110 95 60 40 40
135 120 21
75
180 35 70
125 69 30
300 55 50
20 65 19
290 450 17
200 25
2,746
(NA) 5
75 (NA)
70 60 70
215 120 22
70
240 50 70
120 56 22
355 75
100
20 85
(NA) 245 400
(NA) 265
(NA)
2,810
(NA) 8
75 (NA)
70 45
100 240 170 22
60
250 50 75
120 59 28
320 80 90
20 90
(NA) 345 415
(NA) 280
(NA)
3,012
(X) 160 100 (X)
100 75
143 112 142 100
86
104 100 107 100 105 127 90
107 90
100 106 (X)
141 104 (X)
106 (X)
107
(NA) Not available. (X) Not applicable. 1 Intended plantings in 2020 as indicated by reports from farmers. 2 Estimates discontinued in 2019.

Prospective Plantings (March 2020) 9 USDA, National Agricultural Statistics Service
Barley Area Planted – States and United States: 2018-2020 [Includes area planted in preceding fall]
State
Area planted
2018 2019 2020 1 Percent of
previous year
(1,000 acres) (1,000 acres) (1,000 acres) (percent)
Alaska ................................. Arizona ................................ California ............................. Colorado .............................. Delaware ............................. Idaho ................................... Kansas ................................ Maine .................................. Maryland .............................. Michigan .............................. Minnesota ............................ Montana .............................. New York ............................. North Carolina ..................... North Dakota ....................... Oregon ................................ Pennsylvania ....................... South Dakota ....................... Utah ..................................... Virginia ................................ Washington ......................... Wisconsin ............................ Wyoming ............................. United States .......................
5 14 65 60 25
550 17 17 45 20
80
790 10 11
470 43 45 48 21 30
85 25 72
2,548
6 17 60 54 21
540 14 16 32 11
70
920 10 11
580 40 35 37 17 30
95 24 81
2,721
5 17 65 45 22
510 15 13 43 15
65
1,010 10 15
640 35 40 45 21 30
115 30
115
2,921
83 100 108 83
105 94
107 81
134 136
93
110 100 136 110 88
114 122 124 100
121 125 142
107
1 Intended plantings in 2020 as indicated by reports from farmers.

10 Prospective Plantings (March 2020) USDA, National Agricultural Statistics Service
All Wheat Area Planted – States and United States: 2018-2020 [Includes area planted in preceding fall]
State
Area planted
2018 2019 2020 1 Percent of
previous year
(1,000 acres) (1,000 acres) (1,000 acres) (percent)
Alabama .............................. Arizona ................................ Arkansas .............................. California ............................. Colorado .............................. Delaware ............................. Florida 2 ............................... Georgia ................................ Idaho .................................... Illinois ................................... Indiana ................................. Iowa 2 ................................... Kansas ................................. Kentucky .............................. Louisiana 2 ........................... Maryland .............................. Michigan .............................. Minnesota ............................ Mississippi ........................... Missouri ............................... Montana ............................... Nebraska ............................. Nevada 2 .............................. New Jersey .......................... New Mexico ......................... New York ............................. North Carolina ...................... North Dakota ........................ Ohio ..................................... Oklahoma ............................ Oregon ................................. Pennsylvania ....................... South Carolina ..................... South Dakota ....................... Tennessee ........................... Texas ................................... Utah ..................................... Virginia ................................. Washington .......................... West Virginia 2 ..................... Wisconsin ............................ Wyoming .............................. United States .......................
160 96
175 425
2,260 75 15
200 1,191
600
310 16
7,700 450 15
360 510
1,621 55
740
5,390 1,100
23 18
320 110 460
7,735 490
4,400
800 195 80
1,883 380
4,500 130 230
2,220 7
240 130
47,815
130 34
110 420
2,150 60
(NA) 150
1,195 650
330
(NA) 6,900
460 (NA) 345 540
1,450 45
550
5,450 1,070 (NA)
19 360 90
290 7,505
500 4,200
740 180 70
1,500 280
4,500 125 180
2,260 (NA) 195 125
45,158
150 50
160 425
1,850 55
(NA) 190
1,205 570
340
(NA) 6,800
540 (NA) 345 520
1,350 45
480
5,470 920
(NA) 25
330 160 480
6,800 510
4,300
740 240 110
1,500 310
4,800 120 260
2,220 (NA) 160 125
44,655
115 147 145 101 86 92 (X)
127 101 88
103 (X) 99
117 (X)
100 96 93
100 87
100 86 (X)
132 92
178 166 91
102 102
100 133 157 100 111 107 96
144 98 (X) 82
100
99
(NA) Not available. (X) Not applicable. 1 Intended plantings for 2020 as indicated by reports from farmers. 2 Estimates discontinued in 2019.

Prospective Plantings (March 2020) 11 USDA, National Agricultural Statistics Service
Winter Wheat Area Planted – States and United States: 2018-2020 [Includes area planted in preceding fall]
State
Area planted
2018 2019 2020 Percent of
previous year
(1,000 acres) (1,000 acres) (1,000 acres) (percent)
Alabama .............................. Arizona 1 .............................. Arkansas ............................. California ............................. Colorado .............................. Delaware ............................. Florida 1 ............................... Georgia ............................... Idaho ................................... Illinois .................................. Indiana ................................ Iowa 1 .................................. Kansas ................................ Kentucky .............................. Louisiana 1 ........................... Maryland .............................. Michigan .............................. Minnesota 1 .......................... Mississippi ........................... Missouri ............................... Montana .............................. Nebraska ............................. Nevada 1 .............................. New Jersey .......................... New Mexico ......................... New York ............................. North Carolina ..................... North Dakota ....................... Ohio ..................................... Oklahoma ............................ Oregon ................................ Pennsylvania ....................... South Carolina ..................... South Dakota ....................... Tennessee ........................... Texas .................................. Utah ..................................... Virginia ................................ Washington ......................... West Virginia 1 ..................... Wisconsin ............................ Wyoming ............................. United States .......................
160 22
175 380
2,250 75 15
200 720 600
310 16
7,700 450 15
360 510 11 55
740
1,650 1,100
13 18
320 110 460 85
490 4,400
720 195 80
830 380
4,500 120 230
1,700 7
240 130
32,542
130 (NA) 110 390
2,150 60
(NA) 150 730 650
330
(NA) 6,900
460 (NA) 345 540
(NA) 45
550
2,000 1,070 (NA)
19 360 90
290 85
500 4,200
740 180 70
860 280
4,500 125 180
1,750 (NA) 195 125
31,159
150 (NA) 160 400
1,850 55
(NA) 190 730 570
340
(NA) 6,800
540 (NA) 345 520
(NA) 45
480
1,600 920
(NA) 25
330 160 480 60
510 4,300
740 240 110 650 310
4,800 120 260
1,700 (NA) 160 125
30,775
115 (X)
145 103 86 92 (X)
127 100 88
103 (X) 99
117 (X)
100 96 (X)
100 87
80 86 (X)
132 92
178 166 71
102 102
100 133 157 76
111 107 96
144 97 (X) 82
100
99
(NA) Not available. (X) Not applicable. 1 Estimates discontinued in 2019.

12 Prospective Plantings (March 2020) USDA, National Agricultural Statistics Service
Durum Wheat Area Planted – States and United States: 2018-2020 [Includes area planted in preceding fall in Arizona and California]
State
Area planted
2018 2019 2020 1 Percent of
previous year
(1,000 acres) (1,000 acres) (1,000 acres) (percent)
Arizona ................................ California ............................. Idaho .................................... Montana ............................... North Dakota ........................ South Dakota 2 ..................... United States .......................
74 45 11
840 1,100
3
2,073
34 30 5
550 720
(NA)
1,339
50 25 5
570 640
(NA)
1,290
147 83
100 104 89 (X)
96
(NA) Not available. (X) Not applicable. 1 Intended plantings in 2020 as indicated by reports from farmers. 2 Estimate discontinued in 2019.
Other Spring Wheat Area Planted – States and United States: 2018-2020
State
Area planted
2018 2019 2020 1 Percent of
previous year
(1,000 acres) (1,000 acres) (1,000 acres) (percent)
Colorado 2 ............................ Idaho .................................... Minnesota ............................ Montana ............................... Nevada 2 .............................. North Dakota ........................ Oregon 2 .............................. South Dakota ....................... Utah 2 ................................... Washington .......................... United States .......................
10 460
1,610 2,900
10 6,550
80 1,050
10 520
13,200
(NA) 460
1,450 2,900 (NA)
6,700 (NA) 640
(NA) 510
12,660
(NA) 470
1,350 3,300 (NA)
6,100 (NA) 850
(NA) 520
12,590
(X) 102 93
114 (X) 91 (X)
133 (X)
102
99
(NA) Not available. (X) Not applicable. 1 Intended plantings in 2020 as indicated by reports from farmers. 2 Estimates discontinued in 2019.

Prospective Plantings (March 2020) 13 USDA, National Agricultural Statistics Service
All Hay Area Harvested – States and United States: 2018-2020
State
Area harvested
2018 2019 2020 1 Percent of
previous year
(1,000 acres) (1,000 acres) (1,000 acres) (percent)
Alabama .............................. Alaska ................................. Arizona ................................ Arkansas ............................. California ............................. Colorado .............................. Connecticut ......................... Delaware ............................. Florida ................................. Georgia ............................... Idaho ................................... Illinois .................................. Indiana ................................ Iowa ..................................... Kansas ................................ Kentucky .............................. Louisiana ............................. Maine .................................. Maryland .............................. Massachusetts ..................... Michigan .............................. Minnesota ............................ Mississippi ........................... Missouri ............................... Montana .............................. Nebraska ............................. Nevada ................................ New Hampshire ................... New Jersey .......................... New Mexico ......................... New York ............................. North Carolina ..................... North Dakota ....................... Ohio ..................................... Oklahoma ............................ Oregon ................................ Pennsylvania ....................... Rhode Island ....................... South Carolina ..................... South Dakota ....................... Tennessee ........................... Texas .................................. Utah ..................................... Vermont ............................... Virginia ................................ Washington ......................... West Virginia ....................... Wisconsin ............................ Wyoming ............................. United States .......................
850 22
300 1,203
980 1,420
47 13
280 600
1,340
470 510 940
2,360 1,895
380 110 195 79
810
1,220 590
3,070 2,900 2,700
365 39
114 250
1,220
816 2,670
970 3,230 1,000 1,190
6 270
3,250
1,720 4,740
650 170
1,140 760 535
1,360 1,090
52,839
700 22
325 1,253 1,010 1,460
47 14
270 560
1,300
420 520
1,020 2,280 1,945
390 110 189 51
780
1,100 610
3,360 3,000 2,450
435 49 91
245
1,180 816
2,420 920
3,005 970
1,210 5
270 3,350
1,763 4,920
680 160
1,145 640 515
1,300 1,150
52,425
700 25
325 1,340
920 1,430
53 12
270 590
1,350
480 500
1,200 2,700 1,965
420 105 190 48
780
1,150 620
3,250 2,800 2,650
440 45 90
250
1,210 825
2,600 920
2,800 910
1,270 5
270 3,400
1,800 4,900
690 180
1,145 620 540
1,350 1,150
53,283
100 114 100 107 91 98
113 86
100 105
104 114 96
118 118 101 108 95
101 94
100 105 102 97 93
108 101 92 99
102
103 101 107 100 93 94
105 100 100 101
102 100 101 113 100 97
105 104 100
102
1 Intended area harvested in 2020 as indicated by reports from farmers.

14 Prospective Plantings (March 2020) USDA, National Agricultural Statistics Service
Rice Area Planted by Class – States and United States: 2018-2020
Class and State
Area planted
2018 2019 2020 1 Percent of
previous year
(1,000 acres) (1,000 acres) (1,000 acres) (percent)
Long grain Arkansas .............................. California ............................. Louisiana ............................. Mississippi ........................... Missouri ............................... Texas ................................... United States ....................... Medium grain Arkansas .............................. California ............................. Louisiana ............................. Mississippi ........................... Missouri ............................... Texas ................................... United States ....................... Short grain Arkansas .............................. California 2 ........................... United States ....................... All Arkansas .............................. California ............................. Louisiana ............................. Mississippi ........................... Missouri ............................... Texas ................................... United States .......................
1,250
11 395 140 215 187
2,198
190 455 45
- 9 8
707
1 40
41
1,441 506 440 140 224 195
2,946
950 10
370 115 180 153
1,778
205 455 55 2 7 4
728
1 33
34
1,156 498 425 117 187 157
2,540
1,190
10 390 150 190 170
2,100
205 450 40
- 9 2
706
1 40
41
1,396 500 430 150 199 172
2,847
125 100 105 130 106 111
118
100 99 73 (X)
129 50
97
100 121
121
121 100 101 128 106 110
112
- Represents zero. (X) Not applicable. 1 Intended plantings in 2020 as indicated by reports from farmers. 2 Includes sweet rice.
Canola Area Planted – States and United States: 2018-2020
State
Area planted
2018 2019 2020 1 Percent of
previous year
(1,000 acres) (1,000 acres) (1,000 acres) (percent)
Idaho 2 ................................. Kansas ................................. Minnesota ............................ Montana ............................... North Dakota ........................ Oklahoma ............................ Oregon 2 .............................. Washington .......................... United States .......................
43.0 47.0 46.0
120.0 1,590.0
70.0 4.7
70.0
1,990.7
(NA) 29.0 51.0
150.0 1,700.0
35.0 (NA) 75.0
2,040.0
(NA) 10.0 62.0
175.0 1,660.0
12.0 (NA) 70.0
1,989.0
(X) 34
122 117 98 34 (X) 93
98
(NA) Not available. (X) Not applicable. 1 Intended plantings in 2020 as indicated by reports from farmers. 2 Estimates discontinued in 2019.

Prospective Plantings (March 2020) 15 USDA, National Agricultural Statistics Service
Soybean Area Planted – States and United States: 2018-2020
State
Area planted
2018 2019 2020 1 Percent of
previous year
(1,000 acres) (1,000 acres) (1,000 acres) (percent)
Alabama .............................. Arkansas ............................. Delaware ............................. Florida 2 ............................... Georgia ............................... Illinois .................................. Indiana ................................ Iowa ..................................... Kansas ................................ Kentucky .............................. Louisiana ............................. Maryland .............................. Michigan .............................. Minnesota ............................ Mississippi ........................... Missouri ............................... Nebraska ............................. New Jersey .......................... New York ............................. North Carolina ..................... North Dakota ....................... Ohio ..................................... Oklahoma ............................ Pennsylvania ....................... South Carolina ..................... South Dakota ....................... Tennessee ........................... Texas .................................. Virginia ................................ West Virginia 2 ..................... Wisconsin ............................ United States .......................
345 3,270
170 18
145 10,800 6,000 9,950 4,750 1,950
1,340
530 2,330 7,750 2,230 5,850 5,650
110 335
1,650
6,900 5,050
640 640 390
5,650 1,700
175 600 29
2,220
89,167
265 2,650
155 (NA) 100
9,950 5,400 9,200 4,550 1,700
890 480
1,760 6,850 1,660 5,100 4,900
95 235
1,540
5,600 4,300
465 620 335
3,500 1,400
80 570
(NA) 1,750
76,100
260 2,900
145 (NA)
90 10,500 5,400 9,300 5,000 1,800
980 470
2,200 7,400 1,850 5,800 5,100
80 290
1,480
6,600 4,800
550 630 320
5,400 1,500
115 600
(NA) 1,950
83,510
98 109 94 (X) 90
106 100 101 110 106
110 98
125 108 111 114 104 84
123 96
118 112 118 102 96
154 107 144 105 (X)
111
110
(NA) Not available. (X) Not applicable. 1 Intended plantings in 2020 as indicated by reports from farmers. 2 Estimates discontinued in 2019.
Peanut Area Planted – States and United States: 2018-2020
State
Area planted
2018 2019 2020 1 Percent of
previous year
(1,000 acres) (1,000 acres) (1,000 acres) (percent)
Alabama .............................. Arkansas ............................. Florida ................................. Georgia ............................... Mississippi ........................... New Mexico ......................... North Carolina ..................... Oklahoma ............................ South Carolina ..................... Texas .................................. Virginia ................................ United States .......................
165.0 26.0
155.0 665.0 25.0 5.5
102.0 16.0 87.0
155.0 24.0
1,425.5
160.0 34.0
165.0 670.0 20.0 4.7
104.0 15.0 65.0
165.0 25.0
1,427.7
165.0 35.0
175.0 740.0 20.0 5.0
105.0 12.0 75.0
170.0 27.0
1,529.0
103 103 106 110 100 106 101 80
115 103 108
107
1 Intended plantings in 2020 as indicated by reports from farmers.

16 Prospective Plantings (March 2020) USDA, National Agricultural Statistics Service
Sunflower Area Planted by Type – States and United States: 2018-2020
Varietal type and State
Area planted
2018 2019 2020 1 Percent of
previous year
(1,000 acres) (1,000 acres) (1,000 acres) (percent)
Oil California ............................. Colorado .............................. Kansas ................................. Minnesota ............................ Nebraska ............................. North Dakota ........................ South Dakota ....................... Texas ................................... United States ....................... Non-oil California ............................. Colorado .............................. Kansas ................................. Minnesota ............................ Nebraska ............................. North Dakota ........................ South Dakota ....................... Texas ................................... United States ....................... All California ............................. Colorado .............................. Kansas ................................. Minnesota ............................ Nebraska ............................. North Dakota ........................ South Dakota ....................... Texas ................................... United States .......................
58.0 58.0 43.0 45.0 25.0
395.0 520.0 20.0
1,164.0
2.0 8.0
10.0 7.5
12.0 41.0 51.0 5.5
137.0
60.0 66.0 53.0 52.5 37.0
436.0 571.0 25.5
1,301.0
49.0 47.0 37.0 53.0 28.0
470.0 485.0 28.0
1,197.0
1.6 12.0 8.0 5.0 9.0
65.0 48.0 5.0
153.6
50.6 59.0 45.0 58.0 37.0
535.0 533.0 33.0
1,350.6
49.0 43.0 60.0 71.0 30.0
500.0 570.0 33.0
1,356.0
1.0 20.0 20.0 6.0
10.0 70.0 50.0 25.0
202.0
50.0 63.0 80.0 77.0 40.0
570.0 620.0 58.0
1,558.0
100 91
162 134 107 106 118 118
113
63 167 250 120 111 108 104 500
132
99 107 178 133 108 107 116 176
115
1 Intended plantings in 2020 as indicated by reports from farmers.
Flaxseed Area Planted – States and United States: 2018-2020
State
Area planted
2018 2019 2020 1 Percent of
previous year
(1,000 acres) (1,000 acres) (1,000 acres) (percent)
Montana ............................... North Dakota ........................ South Dakota 2 ..................... United States .......................
39 165
4
208
99 275
(NA)
374
80 190
(NA)
270
81 69 (X)
72
(NA) Not available. (X) Not applicable. 1 Intended plantings in 2020 as indicated by reports from farmers. 2 Estimates discontinued in 2019.

Prospective Plantings (March 2020) 17 USDA, National Agricultural Statistics Service
Cotton Area Planted by Type – States and United States: 2018-2020
Type and State
Area planted
2018 2019 2020 1 Percent of
previous year
(1,000 acres) (1,000 acres) (1,000 acres) (percent)
Upland Alabama .............................. Arizona ................................ Arkansas ............................. California ............................. Florida ................................. Georgia ............................... Kansas ................................ Louisiana ............................. Mississippi ........................... Missouri ............................... New Mexico ......................... North Carolina ..................... Oklahoma ............................ South Carolina ..................... Tennessee ........................... Texas .................................. Virginia ................................ United States ....................... American Pima Arizona ................................ California ............................. New Mexico ......................... Texas .................................. United States ....................... All Alabama .............................. Arizona ................................ Arkansas ............................. California ............................. Florida ................................. Georgia ............................... Kansas ................................ Louisiana ............................. Mississippi ........................... Missouri ............................... New Mexico ......................... North Carolina ..................... Oklahoma ............................ South Carolina ..................... Tennessee ........................... Texas .................................. Virginia ................................ United States .......................
510.0 160.0 485.0 48.0
117.0 1,430.0
165.0 195.0 620.0 325.0
77.0
430.0 780.0 300.0 360.0
7,750.0 98.0
13,850.0
14.5 211.0
6.8 18.0
250.3
510.0 174.5 485.0 259.0 117.0
1,430.0 165.0 195.0 620.0 325.0
83.8
430.0 780.0 300.0 360.0
7,768.0 98.0
14,100.3
540.0 160.0 620.0 55.0
112.0 1,400.0
175.0 280.0 710.0 380.0
63.0
510.0 640.0 300.0 410.0
7,050.0 103.0
13,508.0
7.5 205.0
5.3 12.0
229.8
540.0 167.5 620.0 260.0 112.0
1,400.0 175.0 280.0 710.0 380.0
68.3
510.0 640.0 300.0 410.0
7,062.0 103.0
13,737.8
530.0 130.0 590.0 45.0
120.0 1,300.0
200.0 230.0 660.0 400.0
65.0
500.0 680.0 270.0 360.0
7,300.0 95.0
13,475.0
12.0 195.0
8.0 13.0
228.0
530.0 142.0 590.0 240.0 120.0
1,300.0 200.0 230.0 660.0 400.0
73.0
500.0 680.0 270.0 360.0
7,313.0 95.0
13,703.0
98 81 95 82
107 93
114 82 93
105
103 98
106 90 88
104 92
100
160 95
151 108
99
98 85 95 92
107 93
114 82 93
105
107 98
106 90 88
104 92
100
1 Intended plantings in 2020 as indicated by reports from farmers.

18 Prospective Plantings (March 2020) USDA, National Agricultural Statistics Service
Sugarbeet Area Planted – States and United States: 2018-2020 [Relates to year of intended harvest in all States except California]
State
Area planted
2018 2019 2020 1 Percent of
previous year
(1,000 acres) (1,000 acres) (1,000 acres) (percent)
California 2 ........................... Colorado .............................. Idaho .................................... Michigan .............................. Minnesota ............................ Montana ............................... Nebraska ............................. North Dakota ........................ Oregon ................................. Washington .......................... Wyoming .............................. United States .......................
24.6 26.3
163.0 150.0 415.0 43.5 45.5
202.0 9.3 1.8
32.1
1,113.1
24.5 25.1
171.0 146.0 424.0 41.8 44.0
212.0 10.0 2.0
31.6
1,132.0
24.4 25.2
168.0 150.0 427.0 42.5 44.0
214.0 9.9 2.0
31.5
1,138.5
100 100 98
103 101 102 100 101 99
100 100
101
1 Intended plantings in 2020 as indicated by reports from processors. 2 Relates to year of planting for overwintered beets in southern California.
Tobacco Area Harvested – States and United States: 2018-2020
State
Area harvested
2018 2019 2020 1 Percent of
previous year
(acres) (acres) (acres) (percent)
Georgia ................................ Kentucky .............................. North Carolina ...................... Pennsylvania ....................... South Carolina ..................... Tennessee ........................... Virginia ................................. United States .......................
12,500 68,100
152,750 7,800
12,300 15,700 22,280
291,430
9,000 57,400
117,400 5,700 8,300
13,300 16,020
227,120
9,000 51,400
100,300 5,700 7,500
12,900 15,000
201,800
100 90 85
100 90 97 94
89
1 Intended area harvested in 2020 as indicated by reports from farmers.

Prospective Plantings (March 2020) 19 USDA, National Agricultural Statistics Service
Tobacco Area Harvested by Class and Type – States and United States: 2018-2020
Class, type, and State
Area harvested
2018 2019 2020 1 Percent of
previous year
(acres) (acres) (acres) (percent)
Class 1, Flue-cured (11-14) Georgia .............................................................................. North Carolina .................................................................... South Carolina .................................................................... Virginia ............................................................................... United States ...................................................................... Class 2, Fire-cured (21-23) Kentucky ............................................................................. Tennessee .......................................................................... Virginia ............................................................................... United States ...................................................................... Class 3A, Light air-cured Type 31, Burley Kentucky ......................................................................... North Carolina ................................................................ Pennsylvania .................................................................. Tennessee ...................................................................... Virginia ........................................................................... United States .................................................................. Type 32, Southern Maryland Pennsylvania .................................................................. United States .................................................................. Total light air-cured (31-32) .............................................. Class 3B, Dark air-cured (35-37) Kentucky ............................................................................. Tennessee .......................................................................... United States ...................................................................... Class 4, Cigar filler Type 41, Pennsylvania Seedleaf Pennsylvania .................................................................. United States .................................................................. All tobacco United States ......................................................................
12,500
152,000 12,300 21,000
197,800
11,000 7,600
280
18,880
50,000 750
4,000 5,300 1,000
61,050
1,400
1,400
62,450
7,100 2,800
9,900
2,400
2,400
291,430
9,000
117,000 8,300
15,000
149,300
9,500 6,300
320
16,120
41,000 400
2,500 4,000
700
48,600
1,000
1,000
49,600
6,900 3,000
9,900
2,200
2,200
227,120
9,000
100,000 7,500
14,000
130,500
8,000 6,000
300
14,300
37,000 300
2,500 4,000
700
44,500
400
400
44,900
6,400 2,900
9,300
2,800
2,800
201,800
100 85 90 93
87
84 95 94
89
90 75
100 100 100
92
40
40
91
93 97
94
127
127
89
1 Intended area harvested in 2020 as indicated by reports from farmers.

20 Prospective Plantings (March 2020) USDA, National Agricultural Statistics Service
Dry Edible Bean Area Planted – States and United States: 2018-2020 [Excludes beans grown for garden seed. Beginning in 2019, chickpeas are excluded]
State
Area planted
2018 2019 2020 1 Percent of
previous year
(1,000 acres) (1,000 acres) (1,000 acres) (percent)
California ............................. Colorado .............................. Idaho .................................... Michigan .............................. Minnesota ............................ Montana 2 ............................ Nebraska ............................. North Dakota ........................ Texas 2 ................................. Washington .......................... Wyoming .............................. United States .......................
48.0 42.0
185.0 195.0 185.0 395.0 140.2 635.0 20.3
218.0 31.0
2,094.5
27.4 37.0 47.0
185.0 210.0 (NA)
120.0 615.0 (NA) 25.0 21.0
1,287.4
16.0 45.0 48.0
200.0 215.0 (NA)
145.0 650.0 (NA) 26.0 27.0
1,372.0
58 122 102 108 102 (X)
121 106 (X)
104 129
107
(NA) Not available. (X) Not applicable. 1 Intended plantings in 2020 as indicated by reports from farmers. 2 Estimates discontinued in 2019.

Prospective Plantings (March 2020) 21 USDA, National Agricultural Statistics Service
Chickpea Area Planted – States and United States: 2018-2020 [Beginning in 2019, chickpeas are excluded from dry edible beans]
Size and State
Area planted
2018 2019 2020 1 Percent of
previous year
(1,000 acres) (1,000 acres) (1,000 acres) (percent)
Small chickpeas 2 California ............................................................ Colorado 3 ........................................................... Idaho .................................................................. Michigan 3 ........................................................... Minnesota 3 ......................................................... Montana ............................................................. Nebraska 3 .......................................................... North Dakota ...................................................... Texas 3 ............................................................... Washington ........................................................ Wyoming 3 .......................................................... Other States 4 ..................................................... United States ...................................................... Large chickpeas 5 California ............................................................ Colorado 3 ........................................................... Idaho .................................................................. Michigan 3 ........................................................... Minnesota 3 ......................................................... Montana ............................................................. Nebraska 3 .......................................................... North Dakota ...................................................... Texas 3 ............................................................... Washington ........................................................ Wyoming 3 .......................................................... Other States 4 ..................................................... United States ...................................................... All chickpeas California ............................................................ Colorado 3 ........................................................... Idaho .................................................................. Michigan 3 ........................................................... Minnesota 3 ......................................................... Montana ............................................................. Nebraska 3 .......................................................... North Dakota ...................................................... Texas 3 ............................................................... Washington ........................................................ Wyoming 3 .......................................................... Other States 4 ..................................................... United States ......................................................
(D) (D)
62.0 - -
(D) (D)
18.4 (D)
70.0 -
75.3
225.7
(D) (D)
72.0 -
(D) (D) (D)
96.0 (D)
120.0 (D)
349.5
637.5
15.1 (D)
134.0 -
(D) 390.0 12.7
114.4 (D)
190.0 (D)
7.0
863.2
(D)
(NA) 20.0 (NA) (NA) 51.0 (NA)
(D) (NA) 25.0 (NA)
9.0
105.0
(D) (NA) 68.0 (NA) (NA)
148.0 (NA)
(D) (NA) 85.0 (NA)
45.4
346.4
13.4 (NA) 88.0 (NA) (NA)
199.0 (NA) 41.0 (NA)
110.0 (NA)
-
451.4
(D)
(NA) 12.0 (NA) (NA) 56.0 (NA)
(D) (NA) 22.0 (NA)
10.0
100.0
(D) (NA) 50.0 (NA) (NA) 83.0 (NA)
(D) (NA) 54.0 (NA)
19.0
206.0
12.0 (NA) 62.0 (NA) (NA)
139.0 (NA) 17.0 (NA) 76.0 (NA)
-
306.0
(D) (X) 60 (X) (X)
110 (X) (D) (X) 88 (X)
111
95
(D) (X) 74 (X) (X) 56 (X) (D) (X) 64 (X)
42
59
90 (X) 70 (X) (X) 70 (X) 41 (X) 69 (X)
(X)
68
- Represents zero. (D) Withheld to avoid disclosing data for individual operations. (NA) Not available. (X) Not applicable. 1 Intended plantings in 2020 as indicated by reports from farmers. 2 Chickpeas 20/64 inches or smaller. 3 Estimates discontinued in 2019. 4 Includes data withheld above. 5 Chickpeas larger than 20/64 inches.

22 Prospective Plantings (March 2020) USDA, National Agricultural Statistics Service
Lentil Area Planted – States and United States: 2018-2020
State
Area planted
2018 2019 2020 1 Percent of
previous year
(1,000 acres) (1,000 acres) (1,000 acres) (percent)
Idaho .................................... Montana ............................... North Dakota ........................ Washington .......................... United States .......................
35.0 500.0 185.0 60.0
780.0
34.0 295.0 95.0 62.0
486.0
32.0 315.0 85.0 42.0
474.0
94 107 89 68
98
1 Intended plantings in 2020 as indicated by reports from farmers.
Dry Edible Pea Area Planted – States and United States: 2018-2020 [Beginning in 2019, includes Austrian winter peas and wrinkled seed peas]
State
Area planted
2018 2019 2020 1 Percent of
previous year
(1,000 acres) (1,000 acres) (1,000 acres) (percent)
Idaho .................................... Montana ............................... Nebraska ............................. North Dakota ........................ Oregon 2 .............................. South Dakota ....................... Washington .......................... United States .......................
8.0 335.0 58.0
375.0 6.5
22.0 52.0
856.5
29.0 530.0 31.0
425.0 (NA) 16.0 72.0
1,103.0
25.0 495.0 28.0
325.0 (NA) 11.0 87.0
971.0
86 93 90 76 (X) 69
121
88
(NA) Not available. (X) Not applicable. 1 Intended plantings in 2020 as indicated by reports from farmers. 2 Estimates discontinued in 2019.

Prospective Plantings (March 2020) 23 USDA, National Agricultural Statistics Service
Crop Area Planted and Harvested, Yield, and Production in Domestic Units – United States: 2019 and 2020 [Data are the latest estimates available, either from the current report or from previous reports. Current year estimates are for the full 2020 crop year. Blank data cells indicate estimation period has not yet begun]
Crop Area planted Area harvested
2019 2020 2019 2020
(1,000 acres) (1,000 acres) (1,000 acres) (1,000 acres)
Grains and hay Barley .............................................................................................. Corn for grain 1 ................................................................................ Corn for silage ................................................................................. Hay, all ............................................................................................ Alfalfa .......................................................................................... All other ....................................................................................... Oats ................................................................................................. Proso millet ...................................................................................... Rice ................................................................................................. Rye .................................................................................................. Sorghum for grain 1 .......................................................................... Sorghum for silage ........................................................................... Wheat, all ........................................................................................ Winter .......................................................................................... Durum .......................................................................................... Other spring ................................................................................. Oilseeds Canola ............................................................................................. Cottonseed ...................................................................................... Flaxseed .......................................................................................... Mustard seed ................................................................................... Peanuts ........................................................................................... Rapeseed ........................................................................................ Safflower ......................................................................................... Soybeans for beans ......................................................................... Sunflower ........................................................................................ Cotton, tobacco, and sugar crops Cotton, all ........................................................................................ Upland ......................................................................................... American Pima ............................................................................ Sugarbeets ...................................................................................... Sugarcane ....................................................................................... Tobacco ........................................................................................... Dry beans, peas, and lentils Chickpeas ........................................................................................ Dry edible beans .............................................................................. Dry edible peas ................................................................................ Lentils .............................................................................................. Potatoes and miscellaneous Hops ................................................................................................ Maple syrup ..................................................................................... Mushrooms ...................................................................................... Peppermint oil .................................................................................. Potatoes .......................................................................................... Spearmint oil ...................................................................................
2,721
89,700 (NA) (NA) (NA) (NA)
2,810 506
2,540 1,865 5,265 (NA)
45,158 31,159 1,339
12,660
2,040.0 (X)
374 98.0
1,427.7 11.3
165.8 76,100 1,350.6
13,737.8 13,508.0
229.8 1,132.0
(NA) (NA)
451.4 1,287.4 1,103.0
486.0
(NA) (NA) (NA) (NA)
968.3 (NA)
2,921
96,990
(NA)
3,012
2,847
5,820
44,655 30,775 1,290
12,590
1,989.0
270
1,529.0
83,510 1,558.0
13,703.0 13,475.0
228.0 1,138.5
(NA)
306.0 1,372.0
971.0 474.0
2,182
81,482 6,587
52,425 16,743 35,682
826 465
2,472 310
4,675 339
37,162 24,327 1,175
11,660
1,910.0 (X)
319 90.0
1,391.7 10.4
152.7 75,021 1,244.5
11,804.5 11,580.0
224.5 979.3 913.2 227.1
404.0 1,176.5 1,052.0
431.0
56.5 (NA) (NA) 52.4
942.2 18.5
53,283
201.8
See footnote(s) at end of table. --continued

24 Prospective Plantings (March 2020) USDA, National Agricultural Statistics Service
Crop Area Planted and Harvested, Yield, and Production in Domestic Units – United States: 2019 and 2020 (continued) [Data are the latest estimates available, either from the current report or from previous reports. Current year estimates are for the full 2020 crop year. Blank data cells indicate estimation period has not yet begun]
Crop Yield per acre Production
2019 2020 2019 2020
(1,000) (1,000)
Grains and hay Barley ................................................................................... bushels Corn for grain ........................................................................ bushels Corn for silage ........................................................................... tons Hay, all ....................................................................................... tons Alfalfa ..................................................................................... tons All other .................................................................................. tons Oats ...................................................................................... bushels Proso millet ........................................................................... bushels Rice 2 ........................................................................................... cwt Rye ....................................................................................... bushels Sorghum for grain ................................................................. bushels Sorghum for silage ..................................................................... tons Wheat, all .............................................................................. bushels Winter ............................................................................... bushels Durum ............................................................................... bushels Other spring ...................................................................... bushels Oilseeds Canola ...................................................................................pounds Cottonseed ................................................................................ tons Flaxseed ............................................................................... bushels Mustard seed .........................................................................pounds Peanuts .................................................................................pounds Rapeseed ..............................................................................pounds Safflower ................................................................................pounds Soybeans for beans .............................................................. bushels Sunflower ...............................................................................pounds Cotton, tobacco, and sugar crops Cotton, all 2 ............................................................................... bales Upland 2 ................................................................................ bales American Pima 2 ................................................................... bales Sugarbeets ................................................................................ tons Sugarcane ................................................................................. tons Tobacco .................................................................................pounds Dry beans, peas, and lentils Chickpeas 2 .................................................................................. cwt Dry edible beans 2 ........................................................................ cwt Dry edible peas 2 .......................................................................... cwt Lentils 5 ........................................................................................ cwt Potatoes and miscellaneous Hops ......................................................................................pounds Maple syrup ........................................................................... gallons Mushrooms ............................................................................pounds Peppermint oil ........................................................................pounds Potatoes ...................................................................................... cwt Spearmint oil ..........................................................................pounds
77.7
168.0 20.2 2.46 3.28 2.07 64.3 35.7
7,471 34.3 73.0 11.9 51.7 53.6 45.7 48.2
1,781 (X)
20.0 706
3,949 2,160 1,272 47.4
1,562
817 803
1,544 29.2 35.0
2,060
1,544 1,769 2,124 1,250
1,981 (NA) (NA) 104 449 130
169,566
13,691,561 132,807 128,864 54,875 73,989 53,148 16,608
184,675 10,622
341,460 4,019
1,920,139 1,304,003
53,756 562,380
3,402,000 6,232.0
6,395 63,580
5,496,087 22,464
194,295 3,558,281 1,943,435
20,102.0 19,380.0
722.0 28,600 31,937
467,956
6,237 20,811 22,346 5,388
112,041.2 4,240
846,491 5,452
422,890 2,413
(NA) Not available. (X) Not applicable. 1 Area planted for all purposes. 2 Yield in pounds.

Prospective Plantings (March 2020) 25 USDA, National Agricultural Statistics Service
Crop Area Planted and Harvested, Yield, and Production in Metric Units – United States: 2019 and 2020 [Data are the latest estimates available, either from the current report or from previous reports. Current year estimates are for the full 2020 crop year. Blank data cells indicate estimation period has not yet begun]
Crop Area planted Area harvested
2019 2020 2019 2020
(hectares) (hectares) (hectares) (hectares)
Grains and hay Barley ................................................................................. Corn for grain 1 ................................................................... Corn for silage .................................................................... Hay, all 2 ............................................................................. Alfalfa ............................................................................. All other .......................................................................... Oats .................................................................................... Proso millet ......................................................................... Rice .................................................................................... Rye ..................................................................................... Sorghum for grain 1 ............................................................. Sorghum for silage .............................................................. Wheat, all 2 ......................................................................... Winter ............................................................................. Durum ............................................................................. Other spring .................................................................... Oilseeds Canola ................................................................................ Cottonseed ......................................................................... Flaxseed ............................................................................. Mustard seed ...................................................................... Peanuts .............................................................................. Rapeseed ........................................................................... Safflower ............................................................................ Soybeans for beans ............................................................ Sunflower ........................................................................... Cotton, tobacco, and sugar crops Cotton, all 2 ......................................................................... Upland ............................................................................ American Pima ............................................................... Sugarbeets ......................................................................... Sugarcane .......................................................................... Tobacco .............................................................................. Dry beans, peas, and lentils Chickpeas ........................................................................... Dry edible beans ................................................................. Dry edible peas ................................................................... Lentils ................................................................................. Potatoes and miscellaneous Hops ................................................................................... Maple syrup ........................................................................ Mushrooms ......................................................................... Peppermint oil ..................................................................... Potatoes ............................................................................. Spearmint oil ......................................................................
1,101,160
36,300,690 (NA) (NA) (NA) (NA)
1,137,180 204,770
1,027,910 754,750
2,130,690 (NA)
18,274,990 12,609,740
541,880 5,123,380
825,570 (X)
151,350 39,660
577,780 4,570
67,100 30,796,910
546,570
5,559,550 5,466,550
93,000 458,110
(NA) (NA)
182,680 521,000 446,370 196,680
(NA) (NA) (NA) (NA)
391,860 (NA)
1,182,100
39,250,880
(NA)
1,218,930
1,152,150
2,355,300
18,071,430 12,454,330
522,050 5,095,050
804,930
109,270
618,770
33,795,660 630,510
5,545,470 5,453,200
92,270 460,740
(NA)
123,840 555,230 392,950 191,820
883,030
32,974,950 2,665,690
21,215,870 6,775,720
14,440,150 334,270 188,180
1,000,390 125,450
1,891,930 137,190
15,039,090 9,844,890
475,510 4,718,690
772,960 (X)
129,100 36,420
563,210 4,210
61,800 30,360,250
503,640
4,777,160 4,686,310
90,850 396,310 369,560
91,910
163,490 476,120 425,730 174,420
22,880 (NA) (NA)
21,210 381,300
7,490
21,563,100
81,670
See footnote(s) at end of table. --continued

26 Prospective Plantings (March 2020) USDA, National Agricultural Statistics Service
Crop Area Planted and Harvested, Yield, and Production in Metric Units – United States: 2019 and 2020 (continued) [Data are the latest estimates available, either from the current report or from previous reports. Current year estimates are for the full 2020 crop year. Blank data cells indicate estimation period has not yet begun]
Crop Yield per hectare Production
2019 2020 2019 2020
(metric tons) (metric tons) (metric tons) (metric tons)
Grains and hay Barley .............................................................................................. Corn for grain ................................................................................... Corn for silage ................................................................................. Hay, all 2 .......................................................................................... Alfalfa ........................................................................................... All other ........................................................................................ Oats ................................................................................................. Proso millet ...................................................................................... Rice ................................................................................................. Rye .................................................................................................. Sorghum for grain ............................................................................ Sorghum for silage ........................................................................... Wheat, all 2 ...................................................................................... Winter .......................................................................................... Durum .......................................................................................... Other spring ................................................................................. Oilseeds Canola ............................................................................................. Cottonseed ...................................................................................... Flaxseed .......................................................................................... Mustard seed ................................................................................... Peanuts ........................................................................................... Rapeseed ........................................................................................ Safflower .......................................................................................... Soybeans for beans ......................................................................... Sunflower ......................................................................................... Cotton, tobacco, and sugar crops Cotton, all 2 ...................................................................................... Upland ......................................................................................... American Pima ............................................................................. Sugarbeets ...................................................................................... Sugarcane ....................................................................................... Tobacco ........................................................................................... Dry beans, peas, and lentils Chickpeas ........................................................................................ Dry edible beans .............................................................................. Dry edible peas ................................................................................ Lentils .............................................................................................. Potatoes and miscellaneous Hops ................................................................................................ Maple syrup ..................................................................................... Mushrooms ...................................................................................... Peppermint oil .................................................................................. Potatoes .......................................................................................... Spearmint oil ....................................................................................
4.18
10.55 45.20 5.51 7.35 4.65 2.31 2.00 8.37 2.15 4.58
26.58 3.47 3.60 3.08 3.24
2.00 (X)
1.26 0.79 4.43 2.42 1.43 3.19 1.75
0.92 0.90 1.73
65.47 78.40 2.31
1.73 1.98 2.38 1.40
2.22 (NA) (NA) 0.12
50.31 0.15
3,691,860
347,781,670 120,480,480 116,903,450 49,781,760 67,121,690
771,440 376,660
8,376,720 269,810
8,673,480 3,645,980
52,257,620 35,489,150 1,463,000
15,305,480
1,543,120 5,653,580
162,440 28,840
2,492,980 10,190 88,130
96,840,540 881,530
4,376,690 4,219,500
157,200 25,945,480 28,972,760
212,260
282,910 943,970
1,013,600 244,400
50,820 21,200
383,960 2,470
19,181,970 1,090
(NA) Not available. (X) Not applicable. 1 Area planted for all purposes. 2 Total may not add due to rounding.

Prospective Plantings (March 2020) 27 USDA, National Agricultural Statistics Service
Winter Weather Summary
Highlights: Despite fleeting cold outbreaks, warmth dominated the country during the winter of 2019-2020.
Above-normal temperatures were especially notable east of the Mississippi River, leading to one of the ten warmest
winters on record in most States. Meanwhile, wet weather persisted through another season in much of the central and
eastern United States, leading to pockets of mid- to late-winter flooding. Much of the Southeast was especially wet, with
Alabama and Georgia reporting record-high winter precipitation. However, parts of the Deep South, mostly from
southern Texas to peninsular Florida, experienced drier-than-normal weather. In fact, drought appreciably intensified
during the winter in the western Gulf Coast region, including Deep South Texas.
In California, a promising start to the winter wet season faded into a protracted stretch of dry weather. Aside from a brief
period of precipitation in January, the last 2 months of winter were almost completely dry in California’s key watershed
areas. By February 29, the average water equivalency of the Sierra Nevada snowpack stood at 11 inches—just 45 percent
of the end-of-winter normal, according to the California Department of Water Resources. A different scenario unfolded
across the Northwest, where a slow start to the winter wet season was replaced by extremely wet condition—and even
some flooding—in January. Elsewhere, the Southwest experienced several periods of significant winter precipitation, but
continued to deal with chronically low reservoir levels—especially in New Mexico—and premature melting of high-
elevation snowpack.
Winter wheat did not suffer major calamities during the winter months, although several factors contributed to
less-than-ideal crop conditions in some areas. On the central and southern High Plains, pockets of drought and harsh
autumn cold snaps led to locally poor winter wheat stands as the crop entered dormancy. By March 1, at least one-fifth of
the wheat was rated in very poor to poor condition in Texas (23 percent) and Kansas (20 percent). Elsewhere, 22 percent
of Michigan’s winter wheat was rated very poor to poor in late February, partly due to late planting, poor establishment,
and excessive wetness.
According to the United States Drought Monitor, winter drought coverage across the Lower 48 States stayed in a narrow
range from 10 to 13 percent. Prior to the winter of 2019-2020, the last time exceptional drought (D4) was observed
anywhere in the country was March 12, 2019. By winter’s end, primary areas of drought concern included
southern Texas, parts of the Far West, including much of California, and an area stretching from the Four Corners region
eastward to the High Plains. The driest area covered southern Texas. Statewide, extreme drought (D3) affected nearly
6 percent of Texas by early March.
Historical Perspective: According to preliminary data provided by the National Centers for Environmental Information,
it was the Nation’s 6th-warmest, 19th-wettest winter during the 125-year period of record. The country’s winter average
temperature of 36.0°F was 3.8°F above the 1901-2000 mean, while precipitation averaged 7.71 inches (114 percent of
normal).
All Lower 48 States had a December-February ranking on the “warm” side of the historical distribution; Utah, with its
42nd-warmest winter, was the “coolest” State. Meanwhile, top-ten rankings for winter warmth were observed in 24 of
26 States east of the Mississippi River—all but Mississippi and Wisconsin. Statewide precipitation rankings ranged from
the 22nd-driest winter in California to the wettest winter on record in Alabama and Georgia. It was also among the ten
wettest winters in Mississippi, South Carolina, and Tennessee.
December: Active weather prevailed across most of the country, especially in the Southeast and an area stretching from
California and the Southwest to the northern Plains and upper Great Lakes region. Across the far upper Midwest, a
persistently deep snow cover hampered final harvest efforts for corn and sunflowers. In the last national report, dated
December 8, only 92 percent of the Nation’s corn and 73 percent of the sunflowers had been harvested. In North Dakota,
43 percent of the corn had been cut on that date, while 60 percent of the sunflowers had been harvested. By the end of
December, North Dakota’s harvest had advanced to 48 and 66 percent complete, respectively, for corn and sunflowers.
Snow also remained on the ground for much (or all) of the month in parts of the Northeast, following an early-month
storm. In contrast, drier-than-normal weather prevailed across portions of the southern Plains, as well as the western
Gulf Coast region. Several factors, including drought and periodic cold snaps, continued to adversely affect winter wheat
in parts of Colorado, Kansas, Oklahoma, and Texas. During December, as much as 15 percent of the Nation’s winter

28 Prospective Plantings (March 2020) USDA, National Agricultural Statistics Service
wheat production area was in drought, according to the United States Drought Monitor. However, a late-month storm
system provided some of the Plains’ driest wheat areas with highly beneficial moisture.
Portions of the Northwest also experienced drier-than-normal conditions, despite a late-month increase in precipitation. In
addition, Northwestern snow accumulations were limited by mild weather, leaving high-elevation snowpack 25 to
75 percent of the late-December average in much of Idaho, Oregon, and Washington. Elsewhere, near- or above-average
snowpack dominated areas from the Sierra Nevada to the central and southern Rockies, as well as the eastern slopes of the
northern Rockies, courtesy of multiple storms in late November and throughout December.
Above-normal December temperatures dominated the country, despite periodic cold spells. The warmest weather, relative
to normal, stretched from the central and southern Plains into the lower Midwest and the Southeast. East of the Rockies,
impressive warmth developed late in the month, causing the Nation’s snow coverage to retreat to 25.5 percent by
December 24, down from a peak of 48.4 percent just 7 days earlier.
January: Western weather patterns flipped in January, with wetter conditions developing in the Northwest and a drier
regime arriving across California and the Southwest. As a result, Northwestern snowpack dramatically improved to
near-normal values by month’s end, while little snow accumulated in California’s key watershed areas. According to the
California Department of Water Resources, the average water equivalency of the Sierra Nevada snowpack increased only
3 inches (from 9 to 12 inches) during the month—and was only about 70 percent of the late-January average.
Meanwhile, most of the central and eastern United States experienced unsettled January weather. Relative to normal,
precipitation was particularly heavy in the Midwest, further delaying final harvest efforts. By late January, harvesting of
corn and sunflowers was 96 percent complete in South Dakota. In North Dakota, where many areas have experienced
continuous snow coverage since late November, the corn and sunflower harvests were just 49 and 67 percent complete,
respectively.
Heavy precipitation from the Midwest southward to the central Gulf Coast also led to a rare, mid-winter flood event.
Some of the most significant flooding developed around mid-January from Mississippi to Michigan, fueled by a series of
storms. Midwestern basins such as the Illinois and Wabash Rivers experienced mostly minor to moderate flooding.
Flooding also affected the lower Mississippi Valley and environs.
Late in the month, topsoil moisture was rated at least 40 percent surplus in many Midwestern States, including Michigan
(63 percent), Ohio (59 percent), South Dakota (48 percent), Missouri (45 percent), North Dakota (44 percent), and Illinois
(40 percent). In contrast, lingering pockets of drought across the High Plains and the Southwest left topsoil moisture rated
65 percent very short to short in New Mexico, along with 61 percent in Colorado and 32 percent in Kansas. By late
January, nearly one-quarter of the winter wheat was rated in very poor to poor condition in Colorado (24 percent) and
Kansas (23 percent).
Despite brief cold episodes, near- or above-normal January temperatures dominated the country. Warmth was especially
notable east of the Mississippi River, where monthly temperatures averaged as much as 6 to 10°F above normal. For most
areas east of the Rockies, the harshest period of cold weather lasted about a week and culminated with a freeze across
parts of Florida’s peninsula on January 22. During Florida’s brief cold outbreak, high winds and temperatures near the
freezing mark may have reduced the yield potential of highly sensitive vegetables.
February: Significant precipitation deficits persisted through a second consecutive month in much of California and the
Great Basin. In fact, parts of California received no precipitation during the month, setting February records for dryness.
In addition, little mid- to late-winter snow in the Sierra Nevada left the average water equivalency of the high-elevation
snowpack less than one-half of the end-of-February average.
Other areas of the West received occasional rain and snow. Northwestern snowpack, which had stabilized during a wet
January, continued to benefit from periods of stormy weather. Pockets of drought persisted, however, along the eastern
slopes of the Cascades and in south-central Idaho. In contrast, an early-February deluge—following heavy snow—
triggered significant flooding in northeastern Oregon and environs.

Prospective Plantings (March 2020) 29 USDA, National Agricultural Statistics Service
Farther east, most areas from the Plains to the Atlantic Seaboard experienced another wet month. In some cases, Southern
rivers that had flooded in mid- to late January surged to even higher levels during the second half of February. Lowland
flooding also extended northward into the lower Midwest, while parts of the northern Corn Belt continued to brace for
spring flooding. Conversely, drier-than-normal February weather affected a few areas, including southern Texas, the
upper Great Lakes region, parts of New England, and the northern part of peninsular Florida.
Since late November, parts of the upper Midwest, including the eastern Dakotas, have reported a continuous snow cover,
beneath which soils remain saturated. During February, North Dakota’s corn harvest advanced from 49 to 61 percent
complete, while the State’s sunflower harvest advanced from 67 to 79 percent complete. Other States, including
Minnesota and Wisconsin, reported some corn still standing in the field.
Elsewhere, relatively benign weather prevailed on the Plains, as generally mild weather accompanied frequent
precipitation events. However, short-lived cold outbreaks delivered sub-zero temperatures as far south as Colorado and
Nebraska. Similarly, a mid-month cold blast produced Midwestern readings below 0°F into northern Missouri and
central Illinois.
Despite the brief cold waves, above-normal February temperatures dominated the country. The warmest weather, relative
to normal, covered areas east of the Mississippi River, where many locations reported monthly readings more than 5°F
above normal. Slightly cooler-than-normal weather was mostly confined to the Pacific Northwest and Desert Southwest.
Crop Comments
Corn: Growers intend to plant 97.0 million acres of corn for all purposes in 2020, up 8 percent from last year. If realized,
this will be the highest planted acreage since 2012.
Planted acreage for 2020 is expected to be up or unchanged from 2019 in 38 of the 48 estimating States. Record high
acreage is expected in Arizona, Idaho, Nevada, and Oregon. Record low acreage is expected in Connecticut and
Rhode Island. Acreage increases from last year of 800,000 or more are expected in Indiana, Illinois, Ohio, and
South Dakota.
Sorghum: Growers intend to plant 5.82 million acres of sorghum for all purposes in 2020, up 11 percent from last year.
Kansas, the leading sorghum producing State, is expecting 8 percent more sorghum acres in 2020 than last year. Texas
growers are expecting to plant 16 percent more acres in 2020 than last year. As of March 23, Texas growers had planted
31 percent of their expected acreage, 1 percentage point ahead of last year and 6 percentage points ahead of the 5-year
average.
Oats: Area expected to be seeded to oats for the 2020 crop year is estimated at 3.01 million acres, up 7 percent from
2019. If realized, the United States planted area will be the ninth lowest on record. Record low planted acreage is expected
in California and Oregon.
Barley: Producers seeded 2.92 million acres of barley for the 2020 crop year, up 7 percent from the previous year. A
record low planted acreage is estimated for Colorado, Minnesota, New York and Oregon. However, in Montana, planted
acreage is expected to increase by 10 percent from last year.
Winter wheat: The 2020 winter wheat planted area is estimated at 30.8 million acres, down 1 percent from last year and
down slightly from the previous estimate. This represents the second lowest planted acreage on record for the
United States. Of the total acreage, about 21.7 million acres are Hard Red Winter, 5.69 million acres are Soft Red Winter,
and 3.42 million acres are White Winter. Record low planted acreage is estimated in Nebraska and Utah.
Durum wheat: Area seeded to Durum wheat for 2020 is estimated at 1.29 million acres, down 4 percent from 2019.
Acreage decreases are expected in California and North Dakota while increases are expected in Arizona and Montana.
Record low planted acreages are estimated in Idaho and North Dakota. Durum wheat seeding and emergence was nearly
complete in Arizona and California by March 28 at 95 percent and 93 percent, respectively.

30 Prospective Plantings (March 2020) USDA, National Agricultural Statistics Service
Other spring wheat: Growers intend to plant 12.6 million acres of other spring wheat, down 1 percent from 2019. Of this
total, about 11.9 million acres are Hard Red Spring wheat. Compared with last year, acreage increases are expected in all
spring wheat-producing States except Minnesota and North Dakota. Planted area in North Dakota, the largest producing
State, is estimated at 6.10 million acres, down 9 percent from last year.
Hay: Producers intend to harvest 53.3 million acres of all hay in 2020, up 2 percent from 2019. The Northern Plains and
Upper Midwestern States are expecting increases in harvested acres in 2020.
Record low all hay harvested area is expected in California, Indiana, Maine, Massachusetts, Michigan, New Jersey, Ohio,
Oregon, Rhode Island, and Washington in 2020. Meanwhile, Alaska is expecting a record high acreage.
Rice: Area planted to rice in 2020 is expected to total 2.85 million acres, up 12 percent from 2019. Arkansas, the largest
long grain-producing State, is expected to increase long grain acres by 25 percent from the previous year. Compared with
the last year, medium grain acres are expected to decrease 3 percent but short grain acres are expected to increase
21 percent. California, the largest medium and short grain-producing State, is expected to reduce medium grain planted
area by 1 percent but increase short grain planted area by 21 percent in 2020.
Canola: Producers intend to plant 1.99 million acres of canola in 2020, down 3 percent from last year’s planted area.
Despite the decline, planted acreage for the Nation will represent the third highest planted area on record. Compared with
last year, planted area is expected to decline in 4 of the 6 major canola-producing States, with acreage increases only
expected in Minnesota and Montana. Planted area in Oklahoma, at 12,000 acres, is the lowest since 2009, the first year
estimates were published for the State. Planted area in North Dakota, the leading canola-producing State, is down
2 percent from last year. If realized, planted area in Montana, at 175,000 acres, will be a record high.
Soybeans: Growers intend to plant 83.5 million acres in 2020, up 10 percent from last year. Compared with last year,
planted acreage intentions are up or unchanged in 22 of the 29 estimating States. Increases of 250,000 acres or more are
anticipated in Arkansas, Illinois, Kansas, Michigan, Minnesota, Missouri, North Dakota, Ohio, and South Dakota.
Peanuts: Growers intend to plant 1.53 million acres in 2020, up 7 percent from 2019. Compared with last year, all States
are expecting an increase or no change in planted area except for Oklahoma. In Georgia, the largest peanut-producing
State, expected planted area is up 10 percent from 2019. If realized, it will be the most acres planted since 2017.
Sunflower: Growers intend to plant 1.56 million acres in 2020, an increase of 15 percent from 2019. If realized, this will
be the highest planted area for the Nation since 2016, but still the fifth lowest planted area since 1976. Compared with last
year, growers in seven of the eight major sunflower-producing States expect an increase in acreage this year. The only
State expecting a decline is California, where planted area is expected to be down less than 1,000 acres from last year.
Area intended for oil type varieties, at 1.36 million acres, is up 13 percent from 2019, but will be the seventh lowest since
1976, if realized. Compared with last year, growers in seven of the eight major sunflower-producing States expect an
increase in acreage for oil type varieties or are unchanged this year. The only State expecting a decline is Colorado, where
the expected planted area of 43,000 acres will represent the third lowest on record, if realized. Area intended for non-oil
varieties, at 202,000 acres, is up 32 percent from last year and if realized will be the highest planted area for the Nation
since 2015. Record low planted area for non-oil varieties is expected in California.
Flaxseed: Growers intend to plant 270,000 acres of flaxseed in 2020, twenty-eight percent less than was planted in 2019.
Acreage in North Dakota, the largest flaxseed-producing State, is expected to be down 31 percent, or 85,000 acres from
2019.
Cotton: Growers intend to plant 13.7 million acres in 2020, down less than 1 percent from last year. Upland area is
expected to total 13.5 million acres, down less than 1 percent from 2019. American Pima area is expected to total
228,000 acres, down 1 percent from 2019.
The largest increase in acres is expected in Texas. Compared with the previous year, 11 States are expected to plant fewer
Upland cotton acres in 2020. If realized, Upland cotton planted area in Kansas, at 200,000 acres, will be a record high.

Prospective Plantings (March 2020) 31 USDA, National Agricultural Statistics Service
Sugarbeets: Area expected to be planted to sugarbeets for the 2020 crop year is estimated at 1.14 million acres, up
1 percent from 2019. Intended acreages are above the previous year in 5 of the 11 estimating States.
Tobacco: United States all tobacco area for harvest in 2020 is expected to total 201,800 acres, down 11 percent from
2019. If realized, this will be the lowest tobacco acres harvested on record. Flue-cured tobacco, at 130,500 acres, is
13 percent below 2019 and accounts for 65 percent of this year’s total expected tobacco acreage. Total light air-cured
tobacco type area, at 44,900 acres, is down 9 percent from 2019. The burley portion of light-air cured tobacco, at
44,500 acres, is down 8 percent from last year.
Fire-cured tobacco, at 14,300 acres, is down 11 percent from 2019. Dark air-cured tobacco, at 9,300 acres, is
down 6 percent from last year. Cigar filler tobacco, at 2,800 acres, is up 27 percent from the previous year.
Dry beans: Growers intend to plant 1.37 million acres of dry edible beans in 2020, up 7 percent from the previous
season’s 1.29 million acres. Planted area is expected to be above last year in all estimating States except California.
Chickpeas: Area intended to be planted for all chickpeas is estimated at 306,000 acres, down 32 percent from last season.
Small chickpea intentions, at 100,000 acres, are 5 percent below 2019, while large chickpea intentions, at 206,000 acres,
are expected to decrease 41 percent from the previous year. If realized, chickpea acreage will be at the lowest level since
2015.
Lentils: Area planted for the 2020 crop year is expected to total 474,000 acres, down 2 percent from 2019. Planted area is
expected to be lower than last season in Idaho, North Dakota, and Washington, while planting intentions are above last
year in Montana. If realized, this will be the lowest planted area since 2014.
Dry edible peas: Area planted for the 2020 crop year is expected to total 971,000 acres, down 12 percent from last year.
Intended plantings are down from a year ago in Idaho, Montana, Nebraska, North Dakota, and South Dakota. Growers in
Washington intend to plant more acres than last season.

32 Prospective Plantings (March 2020) USDA, National Agricultural Statistics Service
Statistical Methodology Survey Procedures: The acreage estimates in this report are based primarily on surveys conducted during the first two
weeks of March. The March Agricultural Survey is a probability survey that includes a sample of approximately
80,000 farm operators selected from a list of producers that ensures all operations in the United States have a chance to be
selected. Data from operators was collected by mail, internet, telephone, or personal interview to obtain information on
crop acreage intentions for the 2020 crop year.
Estimating Procedures: National, Regional, State, and grower reported data were reviewed for reasonableness and
consistency with historical estimates. Each Regional Field Office submits their analysis of the current situation to the
Agricultural Statistics Board (ASB). Survey data are compiled to the National level and are reviewed at this level
independently of each State's review. Acreage estimates were based on survey data and the historical relationship of
official estimates to the survey data.
Revision Policy: Acreage estimates in the Prospective Plantings report will not be revised. These estimates are intended
to reflect grower intentions as of the survey period. New acreage estimates will be made based on surveys conducted in
June when crop acreages have been established or planting intentions are firm. These new estimates will be published in
the Acreage report scheduled for June 30, 2020. Winter wheat is an exception. Since winter wheat was seeded prior to the
March survey, any changes in estimates in this report are considered revisions. The estimate of the harvested acreage of
winter wheat will be published on May 12, 2020, along with the first production forecast of the crop year.
Reliability: The survey used to make acreage estimates is subject to sampling and non-sampling errors that are common
to all surveys. Sampling errors represent the variability between estimates that would result if many different samples
were surveyed at the same time. Sampling errors for major crops are generally between 1.0 and 3.0 percent, but they
cannot be applied directly to the acreage published in this report to determine confidence intervals because the official
estimates represent a composite of information from more than a single source.
Non-sampling errors cannot be measured directly. They may occur due to incorrect reporting and/or recording, data
omissions or duplications, and errors in processing. To minimize non-sampling errors, vigorous quality controls are used
in the data collection process and all data are carefully reviewed for consistency and reasonableness.
To assist users in evaluating the reliability of acreage estimates in this report, the "Root Mean Square Error," a statistical
measure based on past performance, is computed. The deviations between the acreage estimates in this report and the final
estimates are expressed as a percentage of the final estimates. The average of squared percentage deviations for the latest
20 year period is computed. The square root of the average becomes statistically the "Root Mean Square Error."
Probability statements can be made concerning expected differences in the current estimates relative to the final end of
season estimates, assuming that factors affecting this year's estimates are not different from those influencing recent years.
For example, the "Root Mean Square Error" for the corn planted estimate is 1.6 percent. This means that chances are 2 out
of 3 that the current corn acreage estimate will not be above or below the final estimate by more than 1.6 percent. Chances
are 9 out of 10 (90 percent confidence level) that the difference will not exceed 2.7 percent.
Also, shown in the following table is a 20 year record for selected crops of the difference between the
Prospective Plantings planted acreage estimates and the final estimates. Using corn again as an example, changes between
the intentions estimates and the final estimates during the past 20 years have averaged 1.07 million acres, ranging from
32,000 acres to 3.09 million acres. The prospective plantings estimates have been below the final estimate 10 times and
above 10 times. This does not imply that the planted estimate this year is likely to understate or overstate the final
estimate.
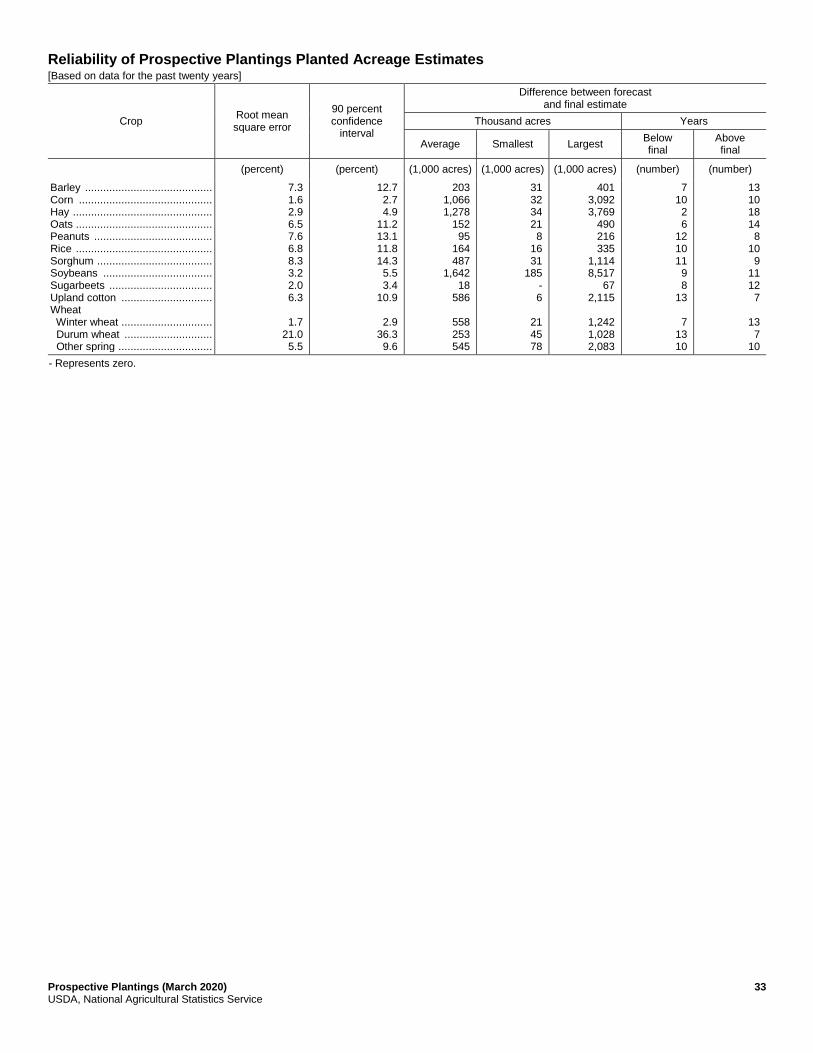
Prospective Plantings (March 2020) 33 USDA, National Agricultural Statistics Service
Reliability of Prospective Plantings Planted Acreage Estimates [Based on data for the past twenty years]
Crop Root mean square error
90 percent confidence
interval
Difference between forecast and final estimate
Thousand acres Years
Average Smallest Largest Below final
Above final
(percent) (percent) (1,000 acres) (1,000 acres) (1,000 acres) (number) (number)
Barley .......................................... Corn ............................................ Hay .............................................. Oats ............................................. Peanuts ....................................... Rice ............................................. Sorghum ...................................... Soybeans .................................... Sugarbeets .................................. Upland cotton .............................. Wheat Winter wheat .............................. Durum wheat ............................. Other spring ...............................
7.3 1.6 2.9 6.5 7.6 6.8 8.3 3.2 2.0 6.3
1.7
21.0 5.5
12.7 2.7 4.9
11.2 13.1 11.8 14.3 5.5 3.4
10.9
2.9 36.3 9.6
203 1,066 1,278
152 95
164 487
1,642 18
586
558 253 545
31 32 34 21 8
16 31
185 - 6
21 45 78
401 3,092 3,769
490 216 335
1,114 8,517
67 2,115
1,242 1,028 2,083
7 10 2 6
12 10 11 9 8
13
7 13 10
13 10 18 14 8
10 9
11 12 7
13 7
10
- Represents zero.
34 Prospective Plantings (March 2020) USDA, National Agricultural Statistics Service
USDA, National Agricultural Statistics Service Information Contacts
Listed below are the commodity statisticians in the Crops Branch of the National Agricultural Statistics Service to contact
for additional information. E-mail inquiries may be sent to [email protected]
Lance Honig, Chief, Crops Branch ....................................................................................................... (202) 720-2127
Chris Hawthorn, Head, Field Crops Section ......................................................................................... (202) 720-2127
David Colwell – Current Agricultural Industrial Reports ................................................................ (202) 720-8800
Chris Hawthorn – Corn, Flaxseed, Proso Millet .............................................................................. (202) 720-2127
James Johanson – County Estimates, Hay ....................................................................................... (202) 690-8533
Jeff Lemmons – Oats, Soybeans ...................................................................................................... (202) 690-3234
Irwin Anolik – Crop Weather ........................................................................................................... (202) 720-7621
Chris Hawthorn – Peanuts, Rice....................................................................................................... (202) 720-2127
Jean Porter – Rye, Wheat ................................................................................................................. (202) 720-8068
Chris Singh – Cotton, Cotton Ginnings, Sorghum ........................................................................... (202) 720-5944
Travis Thorson – Barley, Sunflower, Other Oilseeds ...................................................................... (202) 720-7369
Jorge Garcia-Pratts, Head, Fruits, Vegetables and Special Crops Section ............................................ (202) 720-2127
Joshua Bates – Almonds, Apples, Apricots, Asparagus, Carrots, Coffee, Onions,
Plums, Prunes, Sweet Corn, Tobacco ........................................................................................ (202) 720-4288
Fleming Gibson – Cauliflower, Celery, Grapefruit, Lemons, Macadamia,
Mandarins and tangerines, Mushrooms, Olives, Oranges ......................................................... (202) 720-5412
Greg Lemmons – Cranberries, Cucumbers, Pistachios, Potatoes, Pumpkins,
Raspberries, Squash, Strawberries, Sugarbeets, Sugarcane, Sweet Potatoes,
Tame Blueberries, Wild Blueberries.......................................................................................... (202) 720-4285
Dan Norris – Artichokes, Cantaloupes, Dry Edible Peas, Green Peas, Lentils,
Nectarines, Papayas, Peaches, Snap Beans, Spinach, Walnuts, Watermelons ........................... (202) 720-3250
Krishna Rizal – Dry Beans, Garlic, Hazelnuts, Honeydews, Kiwifruit, Lettuce,
Maple Syrup, Mint, Pears, Sweet Cherries, Tart Cherries, Tomatoes ....................................... (202) 720-2157
Dawn Smoker – Avocados, Bell Peppers, Broccoli, Cabbage, Chickpeas,
Chile Peppers, Dates, Floriculture, Grapes, Hops, Pecans ........................................................ (202) 720-4215

Access to NASS Reports For your convenience, you may access NASS reports and products the following ways:
All reports are available electronically, at no cost, on the NASS web site: www.nass.usda.gov
Both national and state specific reports are available via a free e-mail subscription. To set-up this free
subscription, visit www.nass.usda.gov and click on “National” or “State” in upper right corner above “search”
box to create an account and select the reports you would like to receive.
Cornell’s Mann Library has launched a new website housing NASS’s and other agency’s archived reports. The
new website, https://usda.library.cornell.edu. All email subscriptions containing reports will be sent from the new
website, https://usda.library.cornell.edu. To continue receiving the reports via e-mail, you will have to go to the
new website, create a new account and re-subscribe to the reports. If you need instructions to set up an account or
subscribe, they are located at: https://usda.library.cornell.edu/help. You should whitelist notifications@usda-
esmis.library.cornell.edu in your email client to avoid the emails going into spam/junk folders.
For more information on NASS surveys and reports, call the NASS Agricultural Statistics Hotline at (800) 727-9540,
7:30 a.m. to 4:00 p.m. ET, or e-mail: [email protected].
The U.S. Department of Agriculture (USDA) prohibits discrimination against its customers, employees, and applicants for
employment on the basis of race, color, national origin, age, disability, sex, gender identity, religion, reprisal, and where
applicable, political beliefs, marital status, familial or parental status, sexual orientation, or all or part of an individual's
income is derived from any public assistance program, or protected genetic information in employment or in any program
or activity conducted or funded by the Department. (Not all prohibited bases will apply to all programs and/or
employment activities.)
If you wish to file a Civil Rights program complaint of discrimination, complete the USDA Program Discrimination
Complaint Form (PDF), found online at www.ascr.usda.gov/filing-program-discrimination-complaint-usda-customer, or
at any USDA office, or call (866) 632-9992 to request the form. You may also write a letter containing all of the
information requested in the form. Send your completed complaint form or letter to us by mail at U.S. Department of
Agriculture, Director, Office of Adjudication, 1400 Independence Avenue, S.W., Washington, D.C. 20250-9410, by fax
(202) 690-7442 or email at [email protected].

USDA NASS Data Users’ Meeting
Virtual Meeting Tuesday, April 21, 2020
USDA’s National Agricultural Statistics Service will hold a virtual meeting for users of U.S. domestic and
international agriculture data. NASS is organizing the 2020 Data Users’ Meeting in cooperation with five other
USDA agencies – Agricultural Marketing Service, Economic Research Service, Farm Service Agency, Foreign
Agricultural Service, and World Agricultural Outlook Board – and the Census Bureau’s Foreign Trade
Division. Agency representatives will provide updates on recent and pending changes in statistical and
information programs important to agriculture, answer questions, and welcome comments and input from data
users.
For registration details or additional information about the Data Users’ Meeting, see the meeting page on the
NASS website (https://www.nass.usda.gov/Education_and_Outreach/Meeting/index.php). Contact Vernita
Murray (NASS) at 202-690-8141 or [email protected] or Patricia Snipe (NASS) at 202-720-2248 or
[email protected] for information.