propulsion system study for small … · engine, the general electric ct7-5, in a current...
TRANSCRIPT

NASA CR165330
R80AEG068
(NASA-CB-165330) PSOPULSION SYSTEM STUDY
FOB SMALL T_ANSPOBT AIRCRAFT TECHNOLOGY
(STA_) Final Report (General Electric Co.).... HC A10/MF A01 CSCL 21A
N81-25078
Unclas
G3/07 26510
PROPULSION SYSTEM STUDY FOR SMALL
TRANSPORT AIRCRAFT TECHNOLOGY (STAT)
FINAL REPORT
byC.E. Smith
R. Hirschkron
R.E. Warren
GENERAL ELECTRIC COMPANY
Lynn, Massachusetts
Prepared For
National Aeronautics and Space Administrat,onREPRODUCED BY
NATIONAL TECHNICALINFORMATION SERVICE ,
U.$. OEPkRTMENT OF COMMERCE
SPRINGFIELO,VA. 22161
NASA Lewis Research Center
Contract NAS3-21996
https://ntrs.nasa.gov/search.jsp?R=19810016543 2018-06-16T03:25:45+00:00Z

NOTICE
THIS DOCUMENT HAS BEEN REPRODUCED
FROM THE BEST COPY FURNISHED US BY
THE SPONSORING AGENCY. ALTHOUGH IT
IS RECOGNIZED THAT CERTAIN PORTIONS
AR'E ILLEGIBLE, iT IS BEING RELEASED
IN THE INTEREST OF MAKING AVAILABLE
AS MUCH INFORMATION AS POSSIBLE.


r Repolt No. 2. Government Accession No. 3. Recipient's Catalog No.
NASA CR-. 165 _30
4 Title and Subtitle
Propulsion System Study for Small Transport
Aircraft Technology (STAT), Final Report
7 Author(s)
C._. Smith, R. Hirschkron and R.E. Warren
9. Performing Organization Name and Address
General Electric Company
Aircraft Engine Group
Lynn, Massachusetts 01910
12. Sponsoring Agency Name and Address
National Aeronautics and Space Administration
Washington, D.C. 20546
5, Report Date
May 1981
6. Performing Organization Code
8. PerformingOrganization Report No.
RSOA_G0_8
10. Work Unit No,
11, Contract or Grant No.
NA_-2I qq6;
13. Type of Report and Period Covered
.__C_0 J_LuLc/gX_a.V._./_ _14. Sponsoring Agency Code
15. Supplementary Notes
Project Manager, William C. Strack, Low-Speed Vehicle Section,
NASA Lewis Research Center, Cleveland, Ohio 44!.35
16. Abstract
Propulsion system technologies applicable to the generation of commuter
airline aircraft expected to enter service in the 1990's are identified and
evaluated in terms of their impact on aircraft operating economics and fuel
consumption. The most promising technologies in the areas of engine,
propeller, gearbox, and nacelle design are recommended for future research.
Each item under consideration is evaluated relative to a modern baseline
engine, the General Electric CT7-5, in a current technology aircraft flying a
fixed range and payload. The analysis is presented for two aircraft sizes (30
and 50 passenger), over a range of mission lengths (I00 to II00 kin) an(] fuel
costs ($264 to $396 per m3).
17. Key Words (Suggested by Authorls))
Commuter Aircraft Gearbox
Aircraft Engines CT7-5
Turboprop STAT
Propeller DOC
18. DistributiOn Statement
Unclassified - Unlimited
19. Security Clasif. (of this report) 20. Security Classif, (of this _ge) 21.
Unclassified Unclassified
22. Price"
" For sale by the National Technical Information Service, Springfield, Virginia 22161
NASA-C-168 (Rev. 10-75)

TABLE OF CONTENTS
SUMMARY ....................... 1
INTRODUCTION ..................... 6
DEFINITION OF BASELINE AIRCRAFT AND MISSIONS .....
CT7-5 Baseline Engine ..............Baseline Aircraft ................
Aircraft _ensitivlty Factors ...........
7
7
I0
19
ADVANCED TECHNOLOGY IDENTIFICATION AND EVALUATION . .
Evaluation Procedure .........
Cycle and Engine Arrangement Parametric Analysis_
Advanced Engine Technology Summary ........
Advanced Aerodynamic Design and PerformanceFeatures ..............
Highly Loaded Axial Compressor.
Multiblade Centrifugal Compressor impeiler[.
Advanced Centrifugal Compressor Diffuser...
Active Clearance Control - High-PressureTurbine ............
Compressor Stall Margin Re&uction vl;
Closed-Loop Acceleration Control ......
Advanced Mechanical Design Features ......Two-Material Centrifugal Impeller ......
Advanced Combustor Material ........Advanced Combustor Cooling - Thermal Barrier
Coating and Impingement Cooling Shields . .
Advanced Material _ligh-PressureTurbine Blade ....
Advanced Cooling'Technology High'Pressure
Turbine BladeLow-Pressure Turbine'Disi with'Integrai Cast"
Blades ................Metal Matrix Low-PressureRotor ....Composite Materials for Nacelle .......
Design Factors ..................Modular Construction ........
Inlet Particle Separator (IPS) and Foreign"
Object Protector (FOP) ...........Diagnostic Data Recording ..........
Alternate Engine Ratings ...........
Gearbox Technology ................
Propeller Technology ...............Recommended Advanced Engines ...........
21
2123
46
50505356
59
62
6565
68
69
74
74
78
81
83
8585
87
91
96105
ii0
117
Precedingpageblank
iii
l I
TABLE OF CONTENTS
COMPARATIVE BENEFIT ANALYSIS .............
CT7 Derivative Engine . . . ..........AircraftMissionandBene_it_na1_sis......
I_I
I_7
RECOMMENDATIONS FOR FUTURE RESEARCH ......... 147
APPENDIX A
HAMILTON STANDARD DIVISION GEARBOX DATA ..... 151
APPEND[ X
HAMILTON STANDARD DIVISION PROPELLER DATA .... 159
APPENDIX C
ADVANCED ENGINE PERFORMANCE DATA ........ 177
APPENDIX D
HAMILTON STANDARD DIVISION STUDY RESULTS .... 201
SYMBOLS, ABBREVIATIONS, AND ACRONYMS ........ 203
REFERENCES ...................... 207
DISTRIBUTION ..................... 209
iv
W
....[_ure
]
: 3-
__ 4
5
7
8• $ 9
p
'I0
' ii
12
13
14
15
1617
18
19
20
21
22
2324
25
26
_7
28
29
30
3233
34
3536
"_738
3940
- -. ?:!(, .-
LIST OF FIGURES
Propulsion System Mission Merit Factor Summary .........CT7 Turboprop ............... .....
oo ,o.; i ; : i.,. ......... ::..Baseline Aircraft Drag o a s . z
Selectldn of Wing Loading and Thr s - o a o
30-Passenger Baseline Aircraft ........ .......30-Passenger Baseline Aircraft Doe Breakdown
(Sealed CT7-5 Powered) ..... ," ':_ • :Bo__ _ _do;, .... ....50-Passenger Baseline Aircraft r a w .... -"
(Scaled CT7-5 Powered) . .... .: . . . . :......
rcue o eoo Coo .30-Passenger Baseline Aircraft Trends with o z e ':-
Pressure Ratio . . . _: . . . .
30-Passenger Baseline Aircraft Merit Factor'Trends wlth"
; N6zzle P tl ..... '.'. '._..ressure Ra o ... . . .....
Estimated Turbine Cooling Flow Requirements . . _ .__ :.....
C0mpreS%br Efficlency Trend with size . ...._:_.. .....Engine SFC Trend with Size . . . _:" . :_:_.-_. ? ..._ . .: _ . . . .30-Passenger Aircraft SFC and Engine Weight Trends ._'. .....
30-Passenger Aircraft Price and Maintenance Cost Trends ....
30-Passenger Aircraft DOC Trends ................50-Passenger Aircraft DOC Trends ....... . . .30-Passenger Aircraft TOGW ahd Fuel Burned Trends .......
50-Passenger Aircraft TO(_4' and Fuel Burned Trends . . .Highly Loaded Axial Compressor -Sensitivity of IX)C'Payoff
to Compressor Efficlency'. ......
Multiblade Centrifugal Compressor Impeller C°ncept : : i i " " "Multiblade Centrifugal Compressor Impeller - Sensltlvlt f
DOC Payoff to Compressor Efficiency .............Diffuser Blow Test Results ....
Advanced Centrifugal Compressor'Diffu,er- seLitivit_ ;f'&c"
Payoff to Compressor Efficiency . . . . .
High-Pressure Turbine Active Clearance Control. [D_ i i i _ . .High-Pressure Turbine Active Clearance Control a o f
Sensitivity to Average Stage Length ......_ _Normal Stall Line vs Stall Line for Closed Loop'Accel Schedule
Integrated with Compressor Discharge Mach Sensor ....Closed Loop Acceleration Control - Sensitivity of DOC Payoff
to Compressor Efficiency ........_ _ . . . . . . .Two Material Centrifugal Impeller'Configuratlon" . .......
Two Material Centrifugal Impeller Advantages ......Advanced Combustor Material - DOC Payoff Sensltivity to"
Combustor Life and Price Increase ..............
Advanced Combustor Impingement Cooling Shield ...... . . .Advanced Combustor Cooling - DOC Payoff Sensitivity to
Combustor Life ...............Advanced HPT Blade DOC Payoff Sensltlvlty'to Bl;de _rice . . .
LP Turbine Disc with Integral Blades ........._oBh_kLPTurbine_llsk- sensitivityof_C Payoff
Maintenance Cost ............
Shaft-_ending Mode Critical Speeds.. i i i [ i Li i i i _ . .Composite Materials for Nacelle - Sensl i i y o a o f
to Composite Material Price _ . . . .............
Bearing and sumpArrangementComparison ............T700 Inlet Particle Separator .................
. ga__t i $,_
58
913
19
17
18
-25
27
28
31
3334
35
36
38
3940
41
52
55
57
58
6O
61
63
64
66
67
70
72
73
77
79
RO82
8486
89
v

LIST OF FIGURES - Continued
Figure
41
42
43
44
45
46
47
48
49
50
515_
53
5455
56
57
5859
60
61
62
_-i
B-2
B-3
B-4
B-5
B-6
B-7
_-8
B-9B-10
C-I
C-2
C-1
C-4
C-5
C-_
Page
HP Compressor (Blisks) Maintenance Cost vs FOD Rate ....... 90
Maintenance Management Effects . . .............. 93Example of Projected Hours Remaining Life'Display ....... 94
Diagnostic Data Recording - Sensitivity of DOC Payoff to
Engine Maintenance Savings ................. 95Turboshaft Engine Power for Varying Ambient Temperature .... 97
Comparison of Mission Profiles ................. g9
Rating Temperatures and Thrusts ............... !00Effect of Ratings and Derate on STAT Maintenance Cost ..... 101
Alternate Ratings - Sensitivity of Downsized APR EngineMaintenance on DOC ...................... 104
Gearbox Comparison ....................... 106
GearBox Weight Generalization . . . ........... 108Advanced" TurboshaftCT7 Base Engine Compared to 50-Passenger
Engine Scaled to Equal SHP .................. 120
CT7 Base Engine Compared to 30-Passenger Advanced Turboshaft
Engine Scaled to Equal Slip .................. 12!
Reduction of Parts Count Through Design Simplicity ....... 172
Engine Weight vs Airflow .................... 125Engine Price vs Airflow. . . ........ 125
Engine Maintenance C°st vs Airfl°w i _ i i _" _ _ _ [ i""" 126Propulsion System Comparison - Desi n S z . . . 139Fuel Burned Improvement vs CT7-5 Powered Baseline ........ 143
Fuel Burned Improvement vs CT7-5 Powered Baseline ........ ]44
DOC Improvement vs C.'7-5 Powered Baseline ............ 145
DOC Improvement vs CT7-5 Powered Baseline .....- . . . . 146
Maximum Free Stream Mach Number to Avoid Compatibility
as Function of Advance Ratio and Integrated Design C L ..... 162
Mach Number Adjustment for Effect of Blade Camber . . ..... 163Effective Mach Number vs Advance Ratio and Compressibility
Correction .......................... ]64
Learning Curve . . . 166Maintenance Cost per Flight'Hour per _I000 Acqu_sition $ost vs
Scheduled Time Between Overhaul for Current Technology
Propeller .......................... 167
Performance Decrement Due to Activity Factor for SubcriticalOperation .......................... ]70
Mach Number Adjustment for Effect of Blade Camber ....... 171
Mach Number Adjustment for Effects of Activity Factor ..... 171
Preliminary Effect of Proplets on Thrust Coefficient . . . 174Maintenance Cost per Flight Hour per $1000 Acquisition Cost
vs Scheduled Time Between Overhaul for Advanced Technology
Propeller ............ 17530-Passenger Size Advance_ Engine -'Equivalent Power vs
Altitude and Mach Number . . ................. 181
90-Passenger Size Advanced Engine - Fuel Flow vs Altitude
and Mach Number . . . ................ 182_0-Passenger Size Advanced Engine - Equivalent Power vs
Altitude and T41 ................._ . IRg30-Passenger Size Advanced Engine - Fuel Flow vs Altitude
and T41 ............ 184
30-Passenger _ize Advanced Engine -'Takeoff Equivalent Power
vs Mach Number ........................ 185
30-Passenger _ize Advanced Engine - Takeoff Fuel Flow vsMach Number ......................... 186
vl

_F
LIST OF FIG'0RES - Continued
Figure
C-7
C-8
C-9
C-10
C-ll
C-12
C-13
C-14
C-15
C-16
C-17
C-18
C-19
C-20
30-Passenger Size Advanced Engine - Takeoff Equivalent Power
vs Ambient Temperature .................... 187
30-Passenger Size Advanced Engine - Takeoff Fuel Flow vs188Ambient Temperature ...................
30-Passenger Size Advanced Engine - Climb Equivalent Power vs189Ambient Temperature .....................
30-Passenger Size Advanced Engine - Climb Fuel Flow vs190Ambient Temperature .........
50-Passenger Size Advanced Engine - Equivalent Power vs
Altitude and Mach Number ...... 191
50-Passenger Size Advanced Engine - Fuel Flow vs Altitude"192
and Mach Number .......... "_ L : i " [ r v .....50-Passenger Size Advanced Engine - EgULV_I_nL Powe s
193Altitude and T41 ............... t t d ....50-Passenger Size Advanced Engine - Fuel Flow vs AI i u e
and Tdl ..................... 194
50-Passenger _ize Advanced Engine - Takeoff Equivalent195Power vs Mach Number ............... --- - - -
50-Passenger Size Advanced Engine - Takeoff Fuel Flow'vs196Mach Number .............
50-Passenger Size Advanced Engine'- Takeoff Equivalent Sower197vs Ambient Temperature ............
50-Passenger Size Advanced Engine - Takeoff Fuel Flow'vs...... 198Ambient Temperature .....
50-Passenger Size Advanced Engine'- Climb Equivalent Power vs199Ambient Temperature ...........
50-Passenger Size Advanced Engine - C[imb'Fue{ Flow'vs200Ambient Temperature .....................
vii

LIST OF TABLES
Table
1
2
3
45
8
9
I0
II
12
1314
15
16
17
1819
2O
21
2223
24
25
26
27
28
293O
31
32
33
34
35
36
37
38
39
4O41
4243
44
45
46
47
Merit Factor Summary ...................... 2
Merit Factor Summary ..................... 2Baseline CT7-5 Cycle - Sea Level, Static ............ 10
Mission and Aircraft Requirements ............... I!
Baseline Aircraft Design Summary ................ 14Baseline Aircraft Weight Summary ................ 15
Baseline Aircraft Fuel gum Summary ......... 16Direct Operating Cost Methodology in {q79"Dol{ars ..... 16Mission Merit Factor Sensitivities .............. 19
Mission Merit Factor Sensitivities ............... 20
Engine Sensitivities . . ...... . . . ....... 22Turbofan Versus Turboprop Cruise Performance Comparison. 23
STAT Parametric Engine Study ................ 29Cycle and Arrangement Study Results[ .............. 42
Cycle and Arrangement Study Results ............... 43
Engine Arrangement Comparison .................. 43Engine Arrangement Comparison .................. 44
Engine Arrangement Comparison ..... _ ..........,. 45
Advanced Technology Features and Design Considered ....... 47
Merit Factor Summary - Advanced Technology Features ....... 48
Merit Factor Summary - Design Factors ...... 49Highly Loaded Axial Compressor - Mission Merit Factor Results. 51
Highly Loaded Axial Compressor - Mission Merit Factor Results. . 51Multiblade Centrifugal rompressor Impeller - Mission Merit
Factor Results ...................... 53
Advanced Centrifugal Compressor Diffuser - Mission Merit
Factor Results ........ 56Active Clearance Control HPT - Mission Merit Factor'Results. . 59
Closed-Loop Acceleration Control - Mission Merit Factor Results. 62
Advanced Impeller Design - Mission Merit Factor Results ..... _5Advanced Combustor ODS (MA956) Material Data .... 68Advanced Combustor Material - Mission Merit Factor Resu{ts . . . 69
Advanced Combustor Cooling Thermal Barrier Coating and
Impingement Cooling Shields .............. 71Advanced Combustor Cooling - Mission Merit Factor Results... 79_
Advanced High-Pressure Turbine Blade - Mission Merit FactorResults ................ 75
Advanced High-Pressure Turblne Blade - Mission Merit Factor
Res ul ts ................ 75
Advanced High-Pressure Turbine Blade Mission Merit Factor
Res ul ts ............. 76Advanced High-Pressure Turbine Blade Mission Merit Factor
Results ............... 76Low-Pressure Turbine Disk with Cast'Blades - Mission Merit
Factor Results ...................... 78Metal Matrix LP Shaft - Mission'Merit'Factor Results . . . 81
Composite Materials for Nacelle - Mission Merit Factor Results . 83
Modular Construction - Mission Merit Factor Results ....... 85
Inlet Particle Separator (IPS) - Mission Merit Factor Results. . 87
Foreign Object Protector (FOP) - Mission Merit Factor Results. 88Diagnostic Data Recording - Mission Merit Factor Results .... Q2
Alternate Ratings - Mission Merit Factor Results ........ 102
Alternate Ratings - Mission Merit Factor Results ........ 102
Alternate Ratings - Mission Merit Factor Results ........ 103
Hamilton Standard Advanced Technology Gearbox Factors ...... 105
viii ._
LIST OF TABLES - Continued
Table
48
4950
51
5253
54
55
56
57
5859
6O61
62
63
64
65
66
67
68
69
7071
72
A-I
A-2
B-IC-I
D-I
D-2
D-3
page
Hamilton Standard Division Gearbox Standards ........ 107
Advanced Gearbox - Mission Merit Factor Results ......... 10g
Advanced Propeller - Mission Merit Factor Results ........ 113Advanced Propeller - Mission Merit Factor Results ........ 113
Advanced Propeller - Mission Merit Factor Results ....... 114
Advanced Propeller - Mission Merit Factor Results ........ 114Far Field Noise Levels ................... 116Summary of Technology Payoff Items for Advanced'Engines .... 117
Advanced, 30-Passenger Size Engine Cycle - Sea Level, Static . 118
Advanced, 50-Passenger Size Engine Cycle - Sea Level, Static . . 119Power Extraction Effects ................. 127Bleed Air Extraction Effects and Bleed Air Properties ...... 128
Advanced Technology Engine - Mission Merit Factor Results .... 129
Advanced Technology Engine - Mission Merit Factor Results .... 129
CT7 Derivative Cycle - Sea Level, Static ............ 132
Cycle and Configuration Comparison - Baseline, Derivative,and Advanced Engines ............... 132
Cycle and Configuration Comparison - BaseLine, Derivative,
and Advanced Engines ................ 135Powerplant Comparison- Baseline' Derivative,'a_
Advanced Engines ....................... 137
Powerplant Comparison - Constant Horsepower ....... 138Powerplant and Aircraft Improvements Relative to CT7-5
Powered Baseline ..................... 140aFuel Savings Due to Adv nced Powerplant ............. 141
DOC Savings Due to Advanced Powerplant ............. 142Relative Value Calculations - Advanced Technologies. ...... 148
Design Factor Ranking ...................... 148
Technology Applicability .................... 149
Design Characteristics Comparison ................ 156
Reliability Prediction Comparison ....... 1584-Bladed, I00 Activity Factor, 0.55 Integrated Design'CL .... 160
Advanced Cycle Definitions .................. 178
Baseline Propeller Comparison .................. 201
Advanced Propeller Comparison ............... ?02Advanced Propeller - Mission Merit Factor Results[ ....... 202
ix

--I
SUMMARY
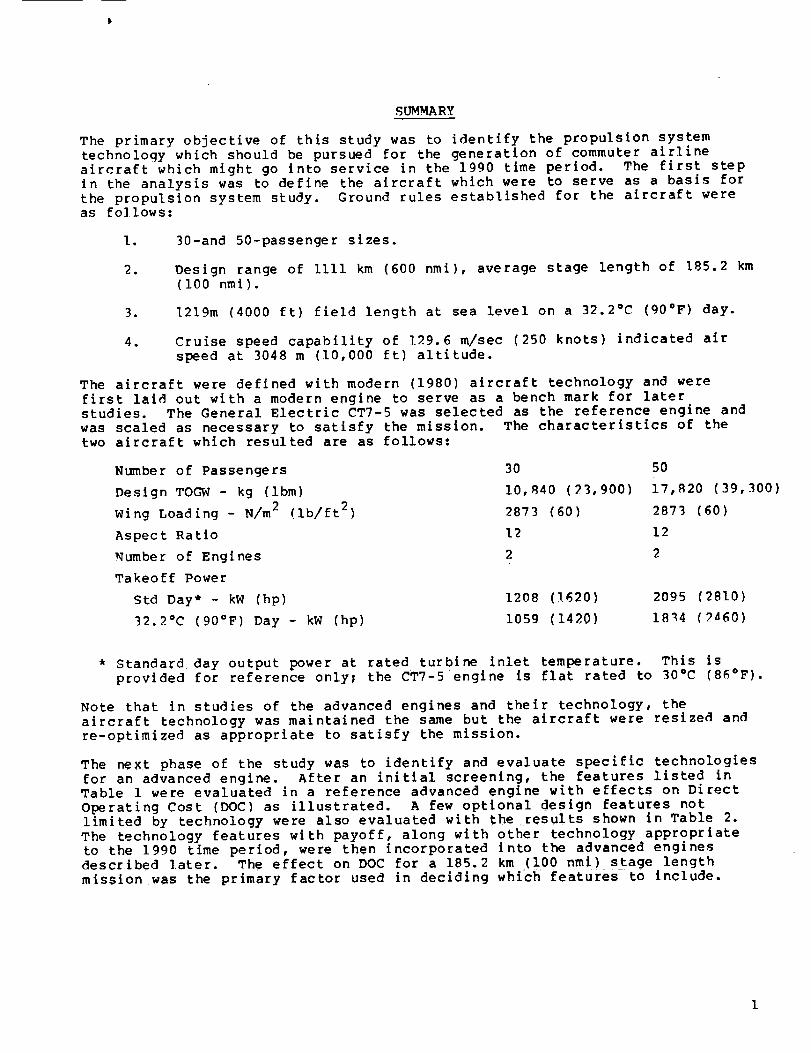
The primary objective of this study was to identify the propulsion systemtechnology which should be pursued for the generation of commuter airline
aircraft which might go into service in the 1990 time period. The first step
in the analysis was to define the aircraft which were to serve as a basis for
the propulsion system study. Ground rules established for the aircraft wereas follows:
I. 30-and 50-passenger sizes.
, Design range of Iiii km (600 nmi), average stage length of 185.2 km
(I00 nmi ).
3. 1219m (4000 ft) field length at sea level on a 32.2"C (90°F) day.
. Cruise speed capability of 129.6 m/sec (250 knots) indicated alr
speed at 3048 m (10,000 ft) altitude.
The aircraft were defined with modern (1980) aircraft technology and were
first lai4 out with a modern engine to serve as a bench mark for laterstudies. The General Electric CT7-5 was selected as the reference engine and
was scaled as necessary to satisfy the mission. The characteristics of the
two aircraft which resulted are as follows:
Number of Passengers
Design TOGW- kg (ibm)
Wing Loading - N/m 2 (ib/ft 2)
Aspect Ratio
Number of Engines
Takeoff Power
Std Day* - kW (hp)
32.2°C (90°F) Day- kW (hp)
30 50
10,840 (23,900) 17,820 (39,300)
2873 (60) 2873 (60)
12 12
2 2
1208 (1620)
1059 (1420)
2095 (2810)
18_4 (_a60)
* Standard day output power at rated turbine inlet temperature. This is
provided for reference only; the CT7-5 engine is flat rated to 30"C (86°F).
Note that In studies of the advanced engines and their technology, the
aircraft technology was maintained the same but the aircraft were reslzed and
re-optimized as appropriate to satisfy the mission.
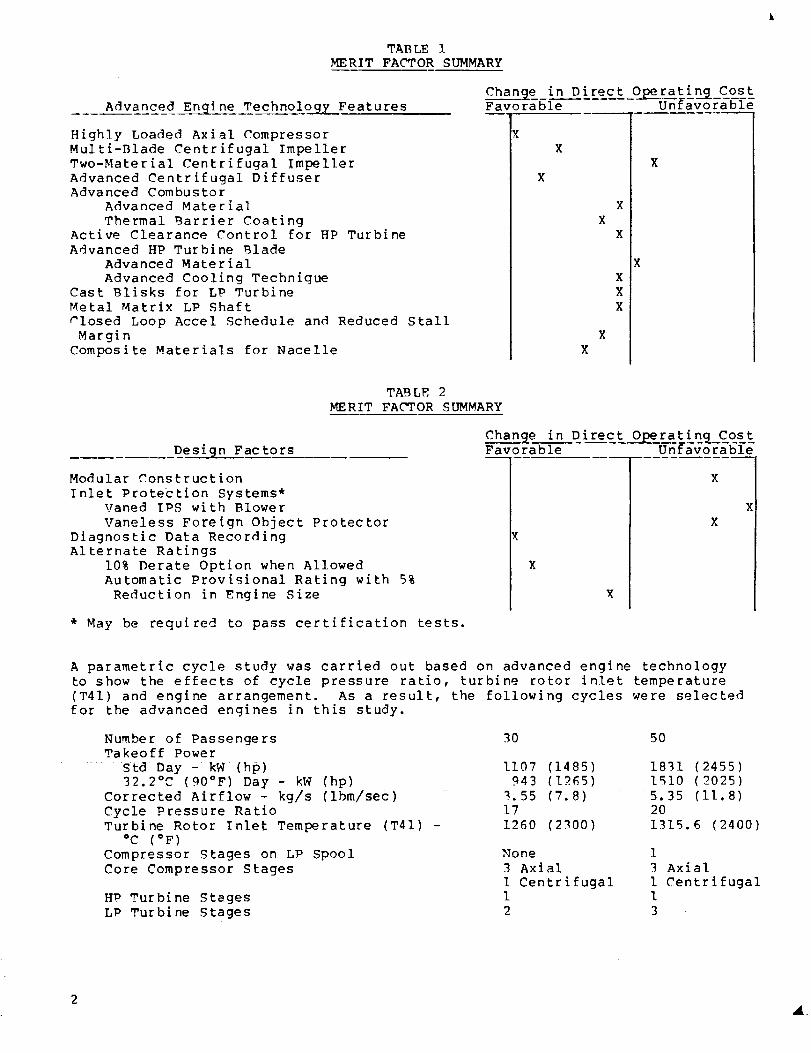
The next phase of the study was to identify and evaluate specific technologies
for an advanced engine. After an initial screening, the features listed inTable 1 were evaluated in a reference advanced engine with effects on Direct
Operating Cost (DOC) as illustrated. A few optional design features not
limited by technology were also evaluated with the results shown in Table 2.
The technology features with payoff, along with other technology appropriateto the 1990 time period, were then incorporated into the advanced engines
described later. The effect on DOC for a 185.2 km (100 rim|) stage length
mission was the primary factor used In deciding which features to include.
TAB LE 1
MERIT FACTOR SUMMARY
Advanced Engine Technology Features
Highly Loaded Axial Compressor
Multi-Blade Centrifugal Impeller
Two-Material Centrifugal ImpellerAdvanced Centrifugal DiffuserAdvanced Combustor
Advanced Material
Thermal Barrier CoatingActive Clearance Control for HP Turbine
Advanced HP Turbine Blade
Advanced Material
Advanced Cooling TechniqueCast Blisks for LP Turbine
Metal Matrix LP Shaft
r'losed Loop Accel Schedule and Reduced Stall
Margin
Composite Materials for Nacelle
Ch_h_e in Direct OE)erating_ CostFavorable Unfavorable
X
X
X
X
X
X
X
X
X
X
TAB LE 2
MERIT FACTOR SUMMARY
Design Factors
Modular Construction
Inlet Prote'ction Systems*Vaned IPS with Blower
Vaneless Foreign Object Protector
Diagnostic Data Recording
Alternate Ratings
10% Derate Option when AllowedAutomatic Prov{sional Rating with 5%
Reduction in Engine Size
Change in Direct O/)erating_ CostFaro rab le U n favo ra ble
X
X
X
X
* May be required to pass certification tests.
A parametric cycle study was carried out based on advanced engine technology
to show the effects of cycle pressure ratio, turbine rotor inlet temperature
(T41) and engine arrangement. As a result, the following cycles were selectedfor the advanced engines in this study.
Number of PassengersTakeoff Power
Std Day- kW (hp)
32.2°C (90°F) Day- kW (hp)Corrected Airflow- kg/s (ibm/sec)
Cycle Pressure RatioTurbine Rotor Inlet Temperature (T41) -
°C (OF)
Compressor Stages on LP Spool
Core Compressor Stages
H_ Turbine Stages
LP Turbine Stages
30 50
1107 (1485)943 (1265)
_.55 (7.8)17
1260 (2300)
None3 Axial
1 Centrifugal1
2
1831 (2455)I_I0 (2025)
5.35 (11.8)20
1315.6 (2400)
I
3 Axial
I Centrifugal1
3
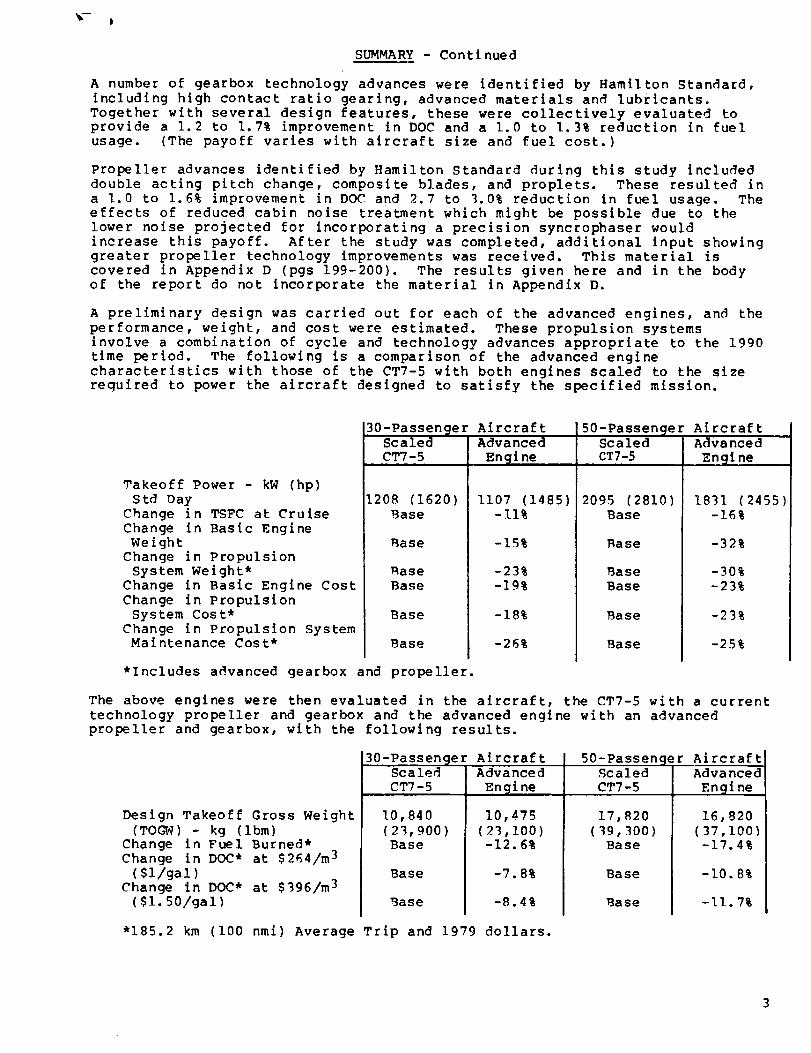
SUMMARY - Conti nued
A number of gearbox technology advances were identified by Hamilton Standard,
including high contact ratio gearing, advanced materials and lubricants.
Together with several design features, these were collectively evaluated toprovide a 1.2 to 1.7% improvement in DOC and a 1.0 to 1.3% reduction in fuel
usage. (The payoff varies with aircraft size and fuel cost.)
propeller advances identified by Hamilton Standard during this study includeddouble acting pitch change, composite blades, and proplets. These resulted in
a 1.0 to 1.6% improvement in DOC and 2.7 to 3.0% reduction in fuel usage. The
effects of reduced cabin noise treatment which might be possible due to the
lower noise projected for incorporating a precision syncrophaser would
increase this payoff. After the study was completed, additional input showinggreater propeller technology improvements was received. This material is
covered in Appendix D (pgs 199-200). The results given here and in the body
of the report do not incorporate the material in Appendix D.
A preliminary design was carried out for each of the advanced engines, and the
performance, weight, and cost were estimated. These propulsion systemsinvolve a combination of cycle and technology advances appropriate to the 1990
time period. The following is a comparison of the advanced engine
characteristics with those of the CT7-5 with both engines scaled to the size
required to power the aircraft designed to satisfy the specified mission.
Takeoff Power - kW (hp)
S td Day
Change in TSFC at Cruise
Change in Basic Engine
WeightChange in Propulsion
System Weight*
Change in Basic Engine Cost
Change in Propulsion
System Cost*
Change in Propulsion SystemMaintenance Cost*
30-Passenger AircraftScaled
CT7 -5
1208 (1620)Base
Base
_ase
Base
Base
Base
Advanced
Engine _
1107 (1485)
-11%
-15%
-23%
-19%
-18%
-26%
50-Passenger AircraftScaledCT7-S
2095 (2810)
Base
Base
Base
Base
Base
Base
Adva riced
Engine
1831 (2455)
-16%
-32%
-30%
-23%
-23%
-25%
*Includes advanced gearbox and propeller.
The above engines were then evaluated in the aircraft, the CT7-5 with a current
technology propeller and gearbox and the advanced engine with an advanced
propeller and gearbox, with the following results.
Design Takeoff Gross Weight
(TOGW) - kg (Ibm)Change in Fuel Burned*Change in DOC* at $264/m 3
($1/gal )Change in DOC* at $996/m 3
($I. 50/gal)
30-Passenger AircraftScaled
CT7-5
10,840
( 2_, 900 )Base
Base
Base
Advanced
Engine
10,475
(2_,I00)-12.6%
-7.8%
-8.4%
50-Passen¢
ScaledCT7 -5
17,R20
(19,300)Base
Base
Base
er Aircraft
Advanced
Engine
16,820
(37,100)-17.4%
-I0.8%
-II. 7%
"185.2 km (I00 nmi) Average Trip and 1979 dollars.
SUMMARY - Continued
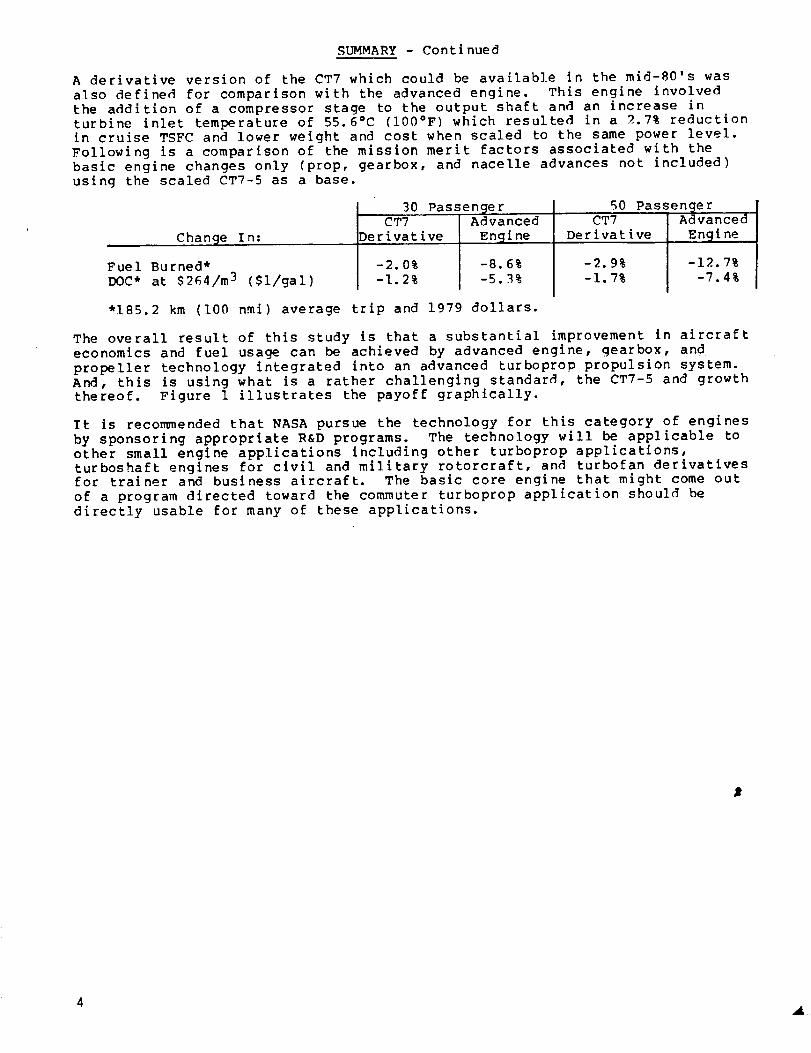
A derivative version of the CT7 which could be available in the mid-80's was
also defined for comparison with the advanced engine. This engine involvedthe addition of a compressor stage to the output shaft and an increase in
turbine inlet temperature of 55.6°C (100°F) which resulted in a 9..7% reduction
in cruise TSFC and lower weight and cost when scaled to the same power level.
Following is a comparison of the mission merit factors associated with the
basic engine changes only (prop, gearbox, and nacelle advances not included)
using the scaled CT7-5 as a base.
Chan@e I n:
Fuel Burned*
DOC* at $264/m 3 ($1/gal)
J 30 Passenger
J CT7 Advanced
Derivative Engine
-2.0% -8.6%
-1.2% -5.3%
50 Passen@e r
CT7 I AdvancedDerivative [ Engine
!
-2.9% J -12.7%
-i. 7% l -7.4%
•185.2 km (I00 nmi) average trip and 1979 dollars.
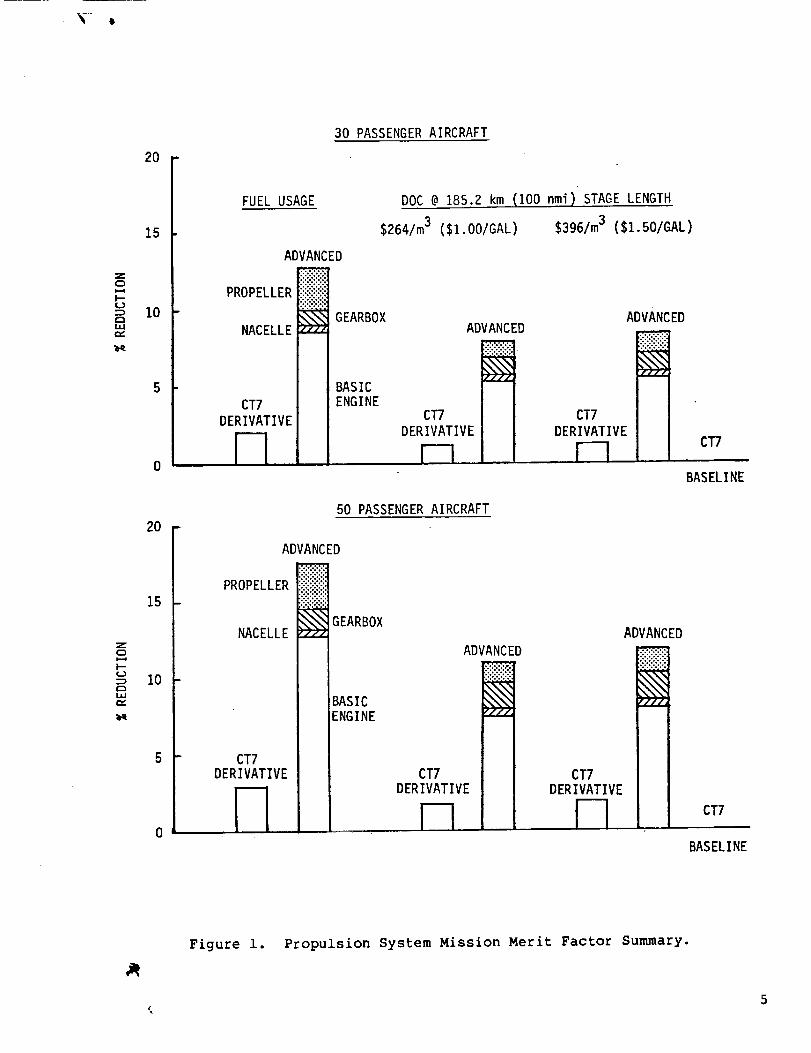
The overall result of this study is that a substantial improvement in aircraft
economics and fuel usage can be achieved by advanced engine, gearbox, and
propeller technology integrated into an advanced turboprop propulsion system.And, this is using what is a rather challenging standard, the CT7-5 and growth
thereof. Figure 1 illustrates the payoff graphically.
It is reconvnended that NASA pursue the technology for this category of engines
by sponsoring appropriate R&D programs. The technology will be applicable toother small engine applications including other turboprop applications,turboshaft engines for civil and military rotorcraft, and turbofan derivativesfor trainer and business aircraft. The basic core engine that might come out
of a program directed toward the commuter turboprop application should be
directly usable for many of these applications.
J
b
20
30 PASSENGER AIRCRAFT
Z0
I'--
¢-,,
,..,...
Z
I--
15
10
20 -
15 -
I0
5
0
FUEL USAGE
ADVANCED
PROPELLER :::::::i:i:_=_=__i._.
NACELLE _
CT7
DERIVATIVE
DOC @ 185.2 km (100 nmi) STAGE LENGTH
$264/m3 ($1.00/GAL) $396/m3 ($1.5O/GAL)
GEARBOX
BASICENGINE
ADVANCED
CT7
DERIVATIVE
[7, .
ADVANCED
CT7
DERIVATIVE
[-7
50 PASSENGER AIRCRAFT
ADVANCED
PROPELLER
NACELLE
CT7DERIVATIVE
_ GEARBOX
BASICENGINE
CT7DERIVATIVE
V-1
ADVANCED
ADVANCED
_:i:i:i:!:!:i
CT7DERIVATIVE
V7... • |, , I
CT7
n
BASELINE
CT7
BASELINE
Figure i. Propulsion System Mission Merit Factor Summary.

INTRODUCTION
Small (15-80 passengers), short-haul (75-1500 km) transport aircraft
constitute a vital and growing element in the worldwide air transportation
system. Although a portion of their operations is from the same airports as
the medium and long range conventional takeoff and landing (CTOL) transports,
the design and operational requirements for the small, short-haul transport
aircraft differ considerably. Current operational experience and recent
studies have indicated that turboprop propulsion is an attractive approach for
both existing and future advanced, small, short-haul transport aircraft. This
type of propulsion system may offer a good solution to the unique operational
problems and requirements of these aircraft; that is, short runway and stage
length capability, operation in adverse low altitude environment, low
operating costs, and the more recent need for fuel conservation.
Aircraft and their engines currently used for this application were for the
most part designed many years ago and in many cases not designed specifically
for commuter airline service. Recently there has been considerable activity
in this area and new airplane developments pointed directly at this
application have been launched. The engines for these new aircraft
incorporate modern technology. The CT7-5, which is a commercial turboprop
derivative of the T700 turboshaft engine is one of these engines which will go
into service in 1983.
NASA is considering Small Transport Aircraft Technology (STAT) pointed toward
this application. The study reported herein is directed at propulsion
technology for advanced commuter airline aircraft which might go into service
in the 1990 time period. The objectives of this study including the following:
I. Identify aircraft for this application in 30-and 50-passenger sizes
to provide a basis for evaluating and selecting engine technology.
Identify and evaluate propulsion system technology and design
features for this application.
Select typical IQg0 commuter turboprop propulsion systems and
evaluate the payoff of these advanced engines relative to a current
technology engine and a growth or derivative of the current
technology engine.
. Recommend programs to develop the propulsion technology identified in
this study.
In conducting this study, General Electric selected the CT7-5 as the current
technology engine. This selection provided a challenge in defining advanced
engines with payoff since the performance and other characteristics of the
CT7-5 already represent a major advance over any small turboprop or tub.shaft
engine now in service.
General _lectric performed the aircraft analysis for this study, coordinating
with NASA. Hamilton Standard was engaged as a subcontractor to provide the
input on gearbox technology. Propeller technology input was provided by
Hamilton Standard under a direct contract to NASA.

DEFINITION OF BASELINE AIRCRAFT AND MISSIONS
CT7-5 BASELINE ENGIN_
The General Electric CT7-5 1193 kW* (1600 hp) turboprop engine was selected as
the baseline engine for both the 30-and 50-passenger aircraft. A challenging
standard, the CT7-5 is a modern powerplant which will be in commuter aircraft
service by early 1983. Figure 2 shows the CT7 power plant, offset gear, and
propeller. This engine is a derivative of the military T700 engines poweringthe Army Black Hawk and Navy Seahawk helicopters. It is also available as the
CT7-2 commercial turboshaft engine.
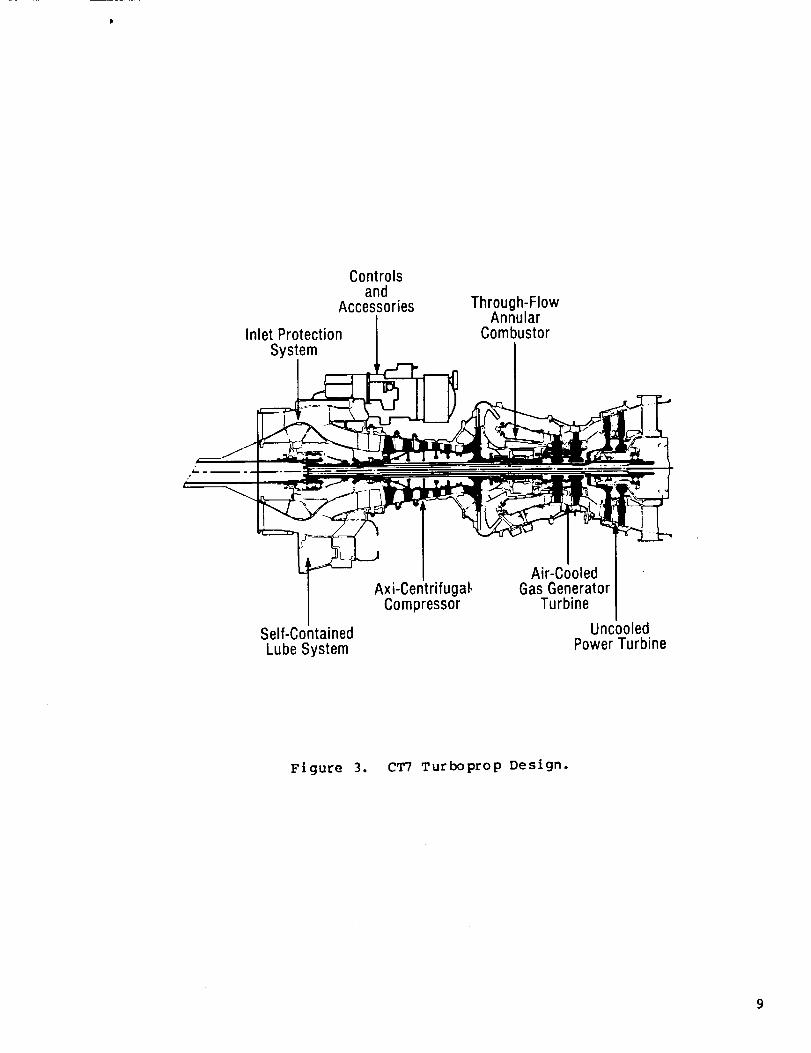
The engine design features are indicated in the cross-section, Figure 3. The
engine consists of 4 major modules: cold section (inlet, compressor, andmldframe); hot section (combustor and high pressure turbine); power turbine;
and accessory module.
A low-loss, vaneless foreign object protector (FOP) prevents foreign object
damage (FOD) by centrifuging runway debris outward. Approximately 15% of theair entering the engine inlet is used tO eject the debris and is ducted and
discharged overboard. The balance of the air plus the small amount of
remaining sand and dust pass through the core. Experience with General
Electric engines like the T58, T64, 385, and T700 indicates that erosion and
damage to the leading edge of the compressor blades in these small engines is
only a problem if the engines are completely unprotected, are exposed tosevere environmental conditions, or are operated from unimproved runways.Under normal commercial operating conditions, the deterioration of performance
caused by the loss of material on blades and vanes is insignificant and doesnot warrant the additional cost of an FOP. All of the mission analysis for
this study was performed for engines without inlet protection. However, an
integral or separate protective device may be required to pass the FAAcertification for small aircraft engines. To pass this test, an engine must
demonstrate the capability of ingesting birds, ice, sand, and gravel of
specified quantities and size with less than 25% permanent power loss. Thisrequirement applies equally to the baseline and advanced engines, and theinclusion of an FOP would not effect the overall results of the study.
The compressor has 5 axial stages and 1 centrifugal stage for high efficiency,
producing a 17:1 pressure ratio. All stages are individual blisks, i.e., diskand blades are forged and machined in one piece, providing a rugged and lowmaintenance cost design. The inlet guide vanes and Stage 1 and 2 stators are
variable. Attached to the rear flange of the axially split compressor casing
is the diffuser and midframe casing assembly. The air leaving the last
compressor stage is diffused in individual radial passages, turned axially bythe casing and deswirled before entering the combustor.
The combustor is a through-flow annular type. The liner is machined and
welded from forged rings providing both durability and even temperature
profile. It can be removed as part of the hot section without removal of the
fuel injectors. The fuel system is a low-pressure system using 12 nozzles andvortex air swirlers to create a very fine fuel dispersion without the use of
fine nozzle orifices.
The high-pressure turbine rotor has two stages with air-cooled blades and
cooling plates. High gas temperatures yield high cycle efficiency while the
effective cooling system maintains low metal temperature for long component
life.
* Flat-rated to 30°C (86OF).

Figure 2. CT7 Turboprop.
ORIGLNAL _AGE it
OF POOR QUAL:TY
Controlsand
Accessories
Inlet ProtectionSystem
Through-FlowAnnular
Combustor
Self-ContainedLube System
Axi-Centrifugal.Compressor
Air-CooledGas Generator
Turbine
UncooledPower Turbine
Figure 3. CT7 Turboprop Design.
9

DEFINITION OF BASELIME AIRCRAFT AND MISSIONS - Continued
CT7-5 BASELINE ENGINE - Continued
The power turbine also has two stages. The blades are tip shrouded and
uncooled; they are attached to the disks by conventional dovetails. The power
(or low-pressure) turbine section, output shaft, exhaust frame, and rear sumpcan be removed as a unit.
The accessories are grouped on a top-mounted gearbox and include the
starter-generator pad for aircraft electrical power, fuel and lube pumps and
filters, fuel control, and most aircraft system attachments•
Cycle and performance parameters of the CT7-5 at takeoff conditions are
summarized in Table 3. Engine performance has been modified to reflect the
removal of the foreign object protector• In performing the mission analysis,
the CT7-5 was scaled as required to satisfy the design payload and range.
Engine SFC, weight, and costs were adjusted to account for the effects of
component physical size. The base cost of the CT7-5 was adjusted to exclude
the cost of the FOP and related parts, and based on 1979 dollars, for an
assumed total production quantity of 1000 engines.
The mode] used for estimating the maintenance cost is based on actual
experience with commercial engines. First engine cost was broken down into
major components and/or parts. The material cost over the life of the engine
was determined by the expected replacement rate of each individual part.
Labor cost was then calculated as a percentage of material cost, ranging in
value from 20% to R5% depending on accessibility of each part. Finally, the
total maintenance cost in dollars per engine flight hour was determined by
dividing the total of material and labor cost by the projected number of
flight hours (i.e., 2800 h/yr utilization x 12 yr = 33,_00 h).
TABLE 3
BASELINE CT7-5 CYCLE - SF_ LEVEL, STATIC
(No inlet Protection)
Ambient Temperature oC (o_,)
Power Setting
Turbine Inlet Temp °C (°F)
Cycle Pressure Ratio
Output Power kW (hp)
Specific Fuel Consumption kg/kW'h(ibm/hp'h)
Inlet Corrected Flow kg/s (ibm/sec)
Inlet Flow kg/s (Ibm/sec)
15 (59)makeof f*
1254 (2290)
16.9
I_65 (IRS0)
• 283 (.465)
4._3 (10.2)
4.63 (10.2)
32.2 (90)
Takeoff
1254 (2_90)
15.7
1212 (1625)
.295 (.485)
4.44 (9.8)
4.31 (9.5)
* Data in this column, at full rated turbine inlet temperature on a standard
day, is provided for reference only. The CT7-5 engine is flat rated to
30°C (86°F).
gASELINE AIRCRAFT
30-and 50-passenger baseline commuter aircraft were designed to be representa-
tive of current technology and to satisfy the STAT requirements as defined in
the Statement of Work I and detailed in Table 4. The baseline aircraft were
used to determine the engine requirements of the short haul commuter mission,
and as a framework to evaluate the proposed propulsion system advances•
i. See list of references, pg 207.
I0

TABLE 4
MISSION AND ArRCRAFT REQUIREMENTS
i. Full payload range of Iiii km (600 nmi) plus reserves for 185.2 km
(100 nmi) alternate and 45 minutes at maximum endurance power at 3048m (i0,000 it) altitude.
2. Field length at sea level not to exceed 1219 m (4,000 it) on a 32.2°C
(90°F) day.
3. Maximum speed capability between 1829 m (6,000 it) and 3048 m (I0,000it) altitude shall be 128.6 m/s (250 knots), indicated.
4. The stall speed shall be less than 47.8 m/sec (93 knots) at the
maximum landing weight, and in the landing configuration.
. A terminal area speed capability of at least 92.6 m/sec (180 knots),
indicated, with the gear and flaps extende_.
. Aircraft shall meet current FAR 36 Stage 3 noise limits minus 8EPNdB at all measurement locations.
. Maximum cabin interior noise level shall be less than 85 dB OASPL and
a speech interference level of less than 65 dB.
8. 90.7 kg (200 ibm) per passenger.
* 9. Two-man crew at 90.7 kg (200 ibm) each plus one flight attendant at
59 kg (130 ibm).
"10. 1.8 m (6 it) minimum interior aisle height.
*ii. Minimum 0.81 m (32 in) seat pitch, 0.46 m (18 in) seat width betweenarmrests and 0.46 m (18 in) aisle width.
• 12. 0.14 m 3 (5 ft 3) per passenger for easily loaded preloaded baggage
storage, plus carry-on baggage provision of 0.51 x 0.51 x 0.28 m (20
x 20 x Ii in) per passenger and garment storage area of 0.02 m (0.8
in) width per passenger.
• 13. One lavatory.
•14. 34.5 kN/m 2 (5 ib/in 2) cabin pressurization, minimum.
• 15. Airframe design life of at least g0,000 hours and 60,000 takeoff and
landing cycles.
*Assumed met by use of airframer layouts and/or subweights.
II
DEFINITION OF _AgELINE AIRCRAFT AND MISSIONS - Continued
BASELINE AIRCRAFT - Continued
The aircraft weight and drag levels were established using the baseline
aircraft designs of two STAT airframe study contractors, Convair 2 and
Lockheed 3, for guidance. General Electric's aircraft design computer
program was modified such that, given the Convair or Lockheed geometries, a
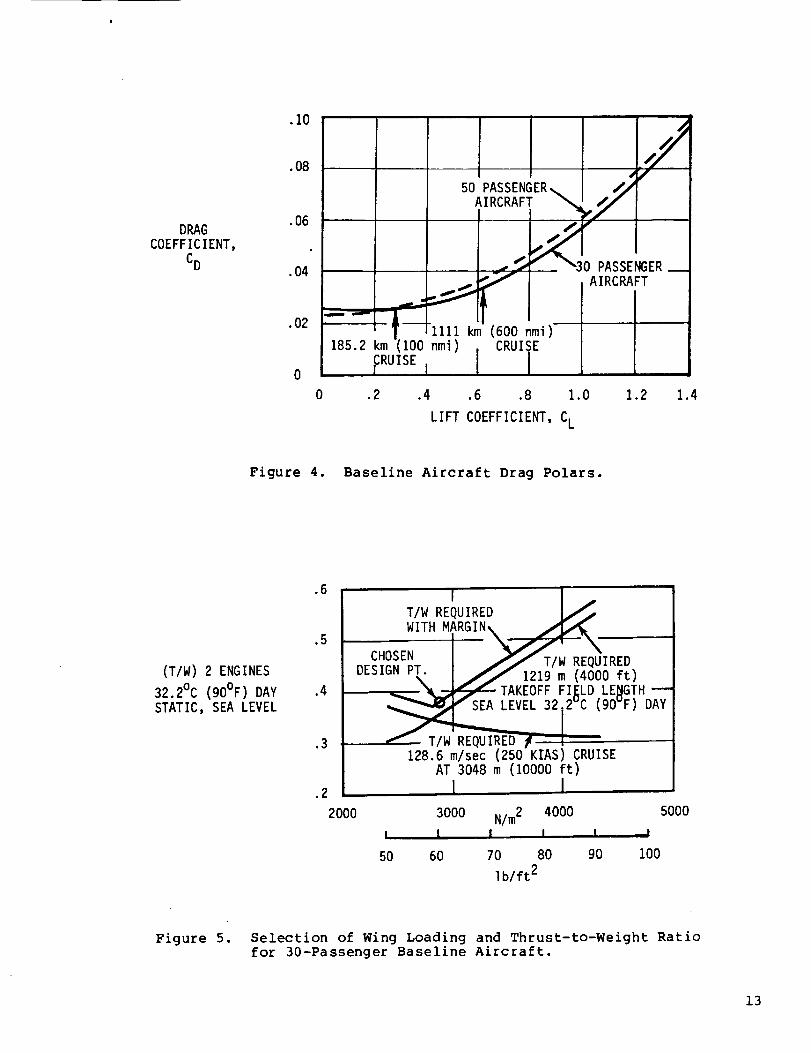
good match in weight and aerodynamics was achieved. The aircraft drag polarsused are shown in Figure 4.
Based on a recent Lockheed study of interior noise control for turboprop
aircraft 4, the acoustic treatment weight was fixed at 2.5% of design gross
weight for both aircraft.
The aircraft fuselage dimensions and the wing and empennage characteristics(thickness/chord, aspect ratio, etc.) were taken from the Convair baseline
aircraft, and were assumed to satisfy all the dimensional requirements in
Table 4. Single slotted, 30% chord, 55% span flaps were selected for thebaseline aircraft.
Both aircraft were twin turboprop powered, each powerplant a combination of a
scaled General Electric CT7-5 engine as described above, a four bladed, 228.6
m/s (750 ft/sec) tip speed prope]ler, and an appropriate gearbox. Propeller
and gearbox characteristics were defined by Hamilton Standard 5,6. Propeller
tip speed was selected to meet the aircraft far field noise requirements.
With tip speed fixed, the other propeller characteristics were selected togive a near minimum DOC for the 185.2 km (I00 nmi) mission. The resulting
propeller had a static thrust to power ratio of 20.3 N/kW (3.4 ib/hp) and a
cruise efficiency of 88 to 89%.
The aircraft wing loading (W/S) and thrust to weight ratio (T/W) were chosen
to insure that all the performance requirements of Table 4 were met. In fact,
only the 1219 m (4000 ft) takeoff field length* and 128.6 m/s (250 kt)indicated air speed cruise requirements were limiting. These limits were
combined (with margin to account for approximations and uncertainties in thedesign procedure) as shown in Figure 5, and a wing loa_ing of 2873 N/m 2 (60
ib/ft 2) selected, which resulted in an aircraft with near minimum design
gross weight and operating cost.
Having completed the above design selections, the aircraft were sized for the
design IIIi km (600 nmi) mission using fixed weight and drag correlations,
fixed fuselage dimensions, and fixed wing, empennage, and powerplantcharacteristics while computing the required design gross weight, wing area,
empennage area, and engine size. The resulting 10,840 kg (23,900 ibm) and17,826 kg (g9,300 Ibm) aircraft, described in Tables 5-6, required engines
providing, respectively, 1208 kW (1620 hp) and 2095 kW (2810 hp) takeoff powerat full rated turbine inlet temperature, statically, at sea level on a
standard day.
* A landing field length of less than 1219m (4000 ft) was assumed for any
design which met the maximum stall speed requirement of Table 4.
12
DRAG
COEFFICIENT,
CD
.10
.08
•06
.04
.02
50 PASSENGER _ /_
J
"-'I- I 111.1km (600 nmi
185.2 km (100 nmi) , CRUISE
CRUISE I I
0 PASSENGERAIRCRAFT
0 .2 .4 .6 .8 1.0 1.2 1.4
LIFT COEFFICIENT, CL
Figure 4. Baseline Aircraft Drag Polars.
(T/W) 2 ENGINES
32.2°C (90°F) DAYSTATIC, SEA LEVEL
.6
.5
.4
.3
.2
2000
IT/W REQUIRED
WITH MARGIN\
._.._._ Y/T/WREQUIREDCHOSEN /'
uLo,_, r<. // 1219 m (4000 ft).___--j_--T_EOFF FIELD LENGTH --__fSEA LEVEL 32.2VC (90VF) DAY
_T/W_QUIRED , I
128.6 m/sec (250 KIAS) CRUISEAT 3048 m (10000 ft)
I I
3000 N/m2 4000 5000
I I I I I !
50 60 70 80 90 100
Ib/ft2
Figure 5. Selection of Wing Loading and Thrust-to-Weight Ratiofor 30-Passenger Baseline Aircraft.
13

TABLE 5
BASF_LINE AIRCRAFT DESIGN SUMMARY
30-PassengerAircraft
Maximum Take-off Weight - kg (Ibm)
Operating Weight Empty - kg (Ibm)
Payload- kg (ibm)Fuel for iiii km (600 nmi) and Reserves -
kg (Ibm)Wing Loading - N/m 2 (ib/ft 2)
Wing Aspect RatioWing Thickness - %
Wing Taper Ratio
Wing Span - m (ft)Sea Level, Static Takeoff Performance
Power, Std Day- kW (hp)Power, 32.2°C (90°F) Day- kW (hp)
Power/Weight (2 engines),32.2°C (90°F) Day- kW/kg (hp/Ibm)
Thrust/Weight (2 engines),
32.2°C (90°F) Day- N/kg (ibf/ibm)
Propeller Diameter - m (ft)
Propeller Speed - rad/sec (rpm)
Propeller Activity Factor/Blade
Propeller Speed - m/s (ft/sec)
Fuselage Length - m (ft)
Seating Abreast
10,840 (23,900)
7150 (15,760)
2720 (6000)
970 (_135)
2873 (60)12
19
.33
21.2 (69.5)
1208 (1620)1059 (1420)
.20 (.12)
3.73 (.38)3.65 (12.0)
125 (1194)I00
.5_
229 (750)20.I (66)
3
50-PassengerAircraft
17,830 (39,900)
11,600 (25,580)4540 (i0,000)
1690 (3728)2873 (60)12
19
.33
27.2 (89.1)
2O95 (7810)1894 (2460)
.21 (.13)
3.92 (.40)4.81 (15.8)
q5 (9O8)i00
.55
229 (750)
22.9 (75)4
14
?ABLE 6
BASELINE AIRCRAft1 _ WEIGHT SUMMARY
30-Passenge rAircraft
Maximum Take-off Weight - kg (ibm)
Operating Weight Empty- kg (Ibm)
Payload- kg (ibm)Fuel for iiii km (600 nmi) and Reserves -
kg (Ibm)
Sub Weights, % of Max Takeoff WeightFuselage 15.9
Wing and Controls 10.4Tail I. 7
Landing Gear 3.8Fuel System 0.7
Hydraulic, Electrical, and Pneumatic Systems 1.7Air Conditioning and Anti-lcing Systems 2.5
Acoustic Shielding 2.5
Furnishings 12.9Operational Equipment 4.4
Engi nes 2.8Gear Boxes 2.3
Propellers 2.9Nacelles I. 2
Engine Accessories 0.3
10,840 (23,900)
7150 (15,760)
2720 (6000)
970 (2135)
50-PassengerAircraft
17,830 (39,300)
11,600 (25,580)
4540 (I0,000)
1690 (3728)
14.4
11.2
2.63.8
0.7
1.7
2.52.5
11.63.4
3.0
3.2
g.l
1.2
0.2
Subtotal 66.0 65. I
Payload 25.1 25.4
Fuel 8.9 9.5
Total I00.0 I00.0
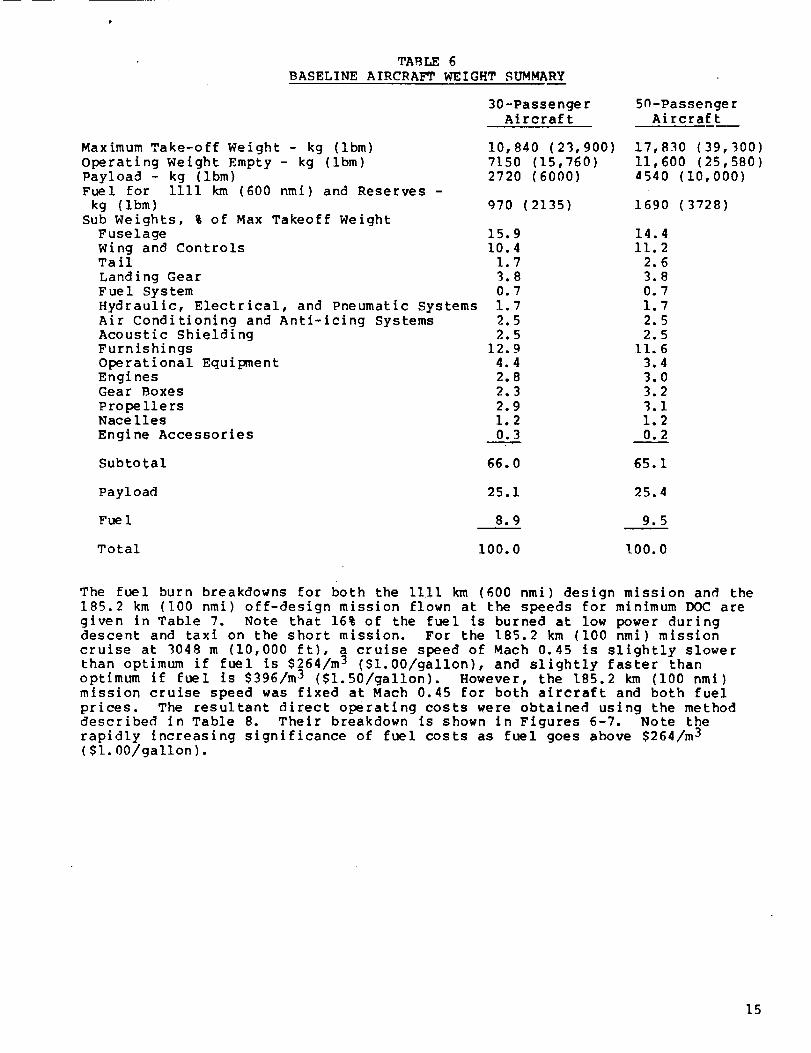
The fuel burn breakdowns for both the IIII km (600 nmi) design mission and the
185.2 km (I00 nmi) off-design mission flown at the speeds for minimum DOC are
given in Table 7. Note that 16% of the fuel is burned at low power duringdescent and taxi on the short mission. For the 185.2 km (100 nmi) mission
cruise at g048 m (10,000 it), a cruise speed of Mach 0.45 is slightly slower
than optimum if fuel is $264/m 3 ($1.00/gallon), and slightly faster than
optimum if fuel is $396/m _ ($1.50/gallon). However, the 185.2 km (I00 nmi)mission cruise speed was fixed at Mach 0.45 for both aircraft an(] both fuel
prices. The resultant direct operating costs were obtained using the methoddescribed in Table 8. Their breakdown is shown in Figures 6-7. Note the
rapidly increasing significance of fuel costs as fuel goes above $264/m 3
($I. 00/gallon).
15

TABLE 7
BASELINE AIRCRAFT FUEL BURN SUMMARY
Fuel Burn - kg (ibm)
30-Passenger 50-PassengerAircraft Aircraft
IIIi km (600 nmi) Mission
Takeoff
Climb
Cruise, Alt = 7620 m (25,000 ft)
Descent
Taxi
TOTAL
I0 (23) 18 (40)147 (324) 258 (567)
465 (I024)(M=0.42) 8P0 (1807)(M=0.41)
21 (46) 35 (78)
21 (46) 36 (80)
664 (1463) 1167 (2572)
Reserves
Climb
Cruise, Alt= 3048 m (I0,000 ft)
Loiter, Alt= 9048 m (10,000 ft)
Descent
TOTAL
44 (96) 74 (164)
86 (191)(M=0.34) 152 (335)(M=0.35)
165 (363)(M=0.23) 281 (620)(M=0.23)
i0 (22) 17 (37)
305 (672) 524 (1156)
185._ km (I00 nmi) Mission
Takeoff
Climb
Cruise, Alt = (3048 m (I0,000 ft)
Descent
Taxi
10 (23) 18 (40)
56 (123) 95 (209)
87 (192)(M=0.45) 148 (325)(M=0.45)
i0 (21) 15 (34)
21 (46) 36 (80)
TOTAL 184 (405) 312 (688)
TABLE 8
DIRECT OPERATING COST METHODOLOGY IN 1979 DOLLARS
Utilization
Crew
Labor
Fuel
2800 Block Hours/Year
$75/Block Hour
$10/Man-Hour + 80% Burden
SI.00/Gallon or $1.50/Gallon
Aircraft Price*
Power plant _rice
Spares
Depreciation
I ns u r a n ce
$175 x Weight + $500,000
As Computed Using Standard Preliminary Design Methods
6% Airframe + 30% Powerplant
12 Years Straight Line to 15% (Including Initial Spares)
1.5%/Year of Flight Equipment (Excluding Initial Spares)
Airframe Maintenance*
Material
Labor
$(.303 x Weight/1000)/Cycle +
$(.243 x Weight/1000)/Flight Hour
[.07345 x (Weight/1000) .7908] Man-Hour/Cycle +
[.2048 x(Weight/1000) -595] Man-Hour�Flight Hour
Powerplant Maintenance As Computed Using Standard Preliminary Design Methods
*In these calculations, the airframe weight (in pounds) is taken as:
Weight = Operating Weight Empty - Operating Equipment - Powerplant -
Powerplant Accessories
16

.-I
...JC_
cr_
O_
C_i-4u')
p-4=E
E
i--Iv
E
8
._J °t-
OO
E
_D
(1)Ul
cr_CO
I'-- rr)U_C_O
..JLJJ (_)
,=l"
rJ
.,,-I
r"
U)
WI--- _)
L_J ,_" r-
z I---
cr_-,-4
17

..J_JO
r_
0
E
c)0
v
E
o_
o0
__1
c_Ln
v
E
_0
i.-
0
G)
od
v
o')
...I
..J
0o
v
(._E
_o
I--
0
.-Jw
LL
-r-,-E
¢0
v
E
u_
"U-
tj0
L4-1
-,J
Z
._ I--
_ m
,-.1
.-1 I.'-
30
QI
0
I
_J
_4
0
0
o,-4
e'
o_4
0.)
_4fl)
e"
I
0
°,-t
18

DEFINITION OF BASELINE AIRCRAFT AND MISSIONS - Continued
AIRCRAFT SENSITIVITY FACTORS
The effects of powerplant technology improvements were evaluated by adjustingthe baseline engine and repeating the 185.2 km (100 nmi) mission and direct
operating cost (DOC) calculations (see Tables 9-10). This procedure Involved
so-called rubber engine and rubber aircraft assumptions, which required
scaling the aircraft and engine for constant payload and mission. Thebaseline aircraft was resized for each powerplant change so that it would
still perform the design mission. Hence, the results include the compounding
effects of improvements which result in a lighter aircraft and a smaller
engine to meet the mission requirements. For example, a 1% SFC decrease wouldresult in a 0.2% decrease in aircraft gross weight, and the engines required
would be correspondingly smaller and less expensive. The combined effect of
such changes was determined at the 185.2 km (100 nmi) range, using theeconomic model to determine the impact of the aircraft and engine cost and
weight changes and the fuel burned changes on DOC.
TABLE 9
MISSION MERIT FACTOR SENSITIVITIES
30-Passenger Turboprop - 185.2 km (I00 nmi) Mission
10,840 kg (23,900 Ibm) Gross Weight - 1208 kW (1620 hp) Engine1979 Dollars - I000 Engines
Parameter
Engine Weight*
Engine Price*
Engine Maintenance*
SFC (Everywhere)
_m
+4.5 kg
(+I0 ibm)/englne
+$1000/englne
+$1/h
+1%
Change in DOC (%1$264/m _ S396/m j
.063
.020
.372
.385
.071
.017
.321
.485
Change inFuel Flow
(%)
.ii
w
m
i. ii
Change inTakeoff
Gross
Weight (%1
.14
w
u
.16
* Also applies to gearbox, propeller or nacelle.
19

TABLEI0MISSION MERIT FACTOR SENSITIVITIES
50-Passenger Turboprop - 185.2 km (I00 nmi)Mission
17,R26 kg (39,300 ibm)Gross Weight- 20q5 kW (7810 hp) Engine1979 Dollars - ]000 Engines
Parameter
Engine Weight*
Engine Price*
Engine Mai ntenance _
SFC (Everywhere)
Change !5264/m _
Change (51.00/Gal)
+4.5 kg .053(+I0 ibm)/engi ne
+51000/engine .014
+51/h .264
+1% .453
n DO= (%_53Q6/m j
(51.50/Gal)
.O58
.012
.224
.558
Change inFuel Flow
(%)
.O8
E
1.13
Change inTakeoff
Gross
Weight (%)
.O9
w
.18
*Also applies to gearbox, propeller, or nacelle.
20
ADVANCED TECHNOLOGY IDENTIFICATION AND EVALUATION
EVALUATION PROCEDURE
The engine technology and cycle evaluation procedure was based on installing
powerplants into the two baseline aircraft and tracing through the total
impact on the aircraft design and mission. In practice this was done for the
many cases which had to be exercised by using the generalized missionsensitivity factors described in the preceding section and summarized in
Tables 9-10. Then the assumption of linearity was made and the sum of all the
influences on each variable computed.
For the advanced technology evaluation procedure, a set of sensitivities of
engine parameters to component changes was also developed. Table II provides
the effects of an arbitrary change in the major component parameters on
mission weighted SFC, compressor flow size, and output turbine flow size. The
flow size changes were used to determine the impact on engine weight andprice. (For example, low-pressure turbine weight and price correlate well
with the average of turbine inlet and exit corrected flow).
In all cases, except for the rating studies and the combustor technology
items, the design changes were applied holding engine life constant.
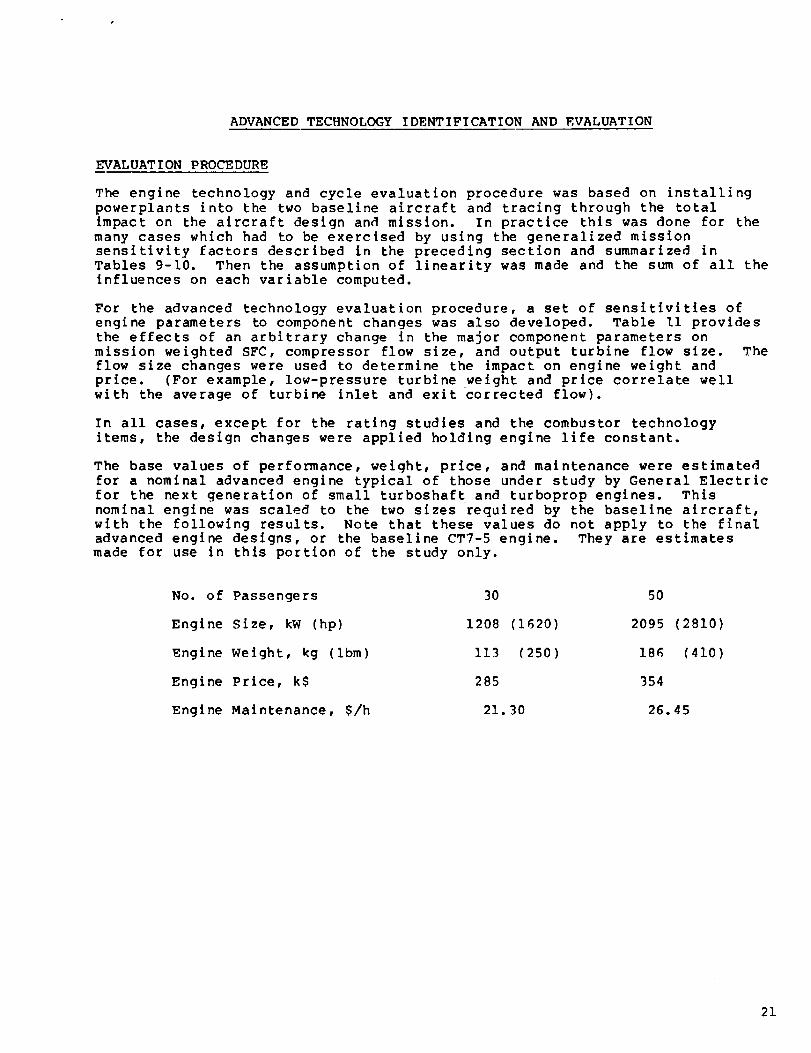
The base values of performance, weight, price, and maintenance were estimated
for a nominal advanced engine typical of those under study by General Electric
for the next generation of small turboshaft and turboprop engines. This
nominal engine was scaled to the two sizes required by the baseline aircraft,
with the following results. Note that these values do not apply to the finaladvanced engine designs, or the baseline CT7-5 engine. They are estimates
made for use in this portion of the study only.
No. of Passengers
Engine Size, kW (hp)
Engine Weight, kg (Ibm)
Engine Price, kS
Engine Maintenance, $/h
30 50
1208 (1620) 2095 (2810)
113 (250) 186 (410)
285 354
21.30 26.45
21
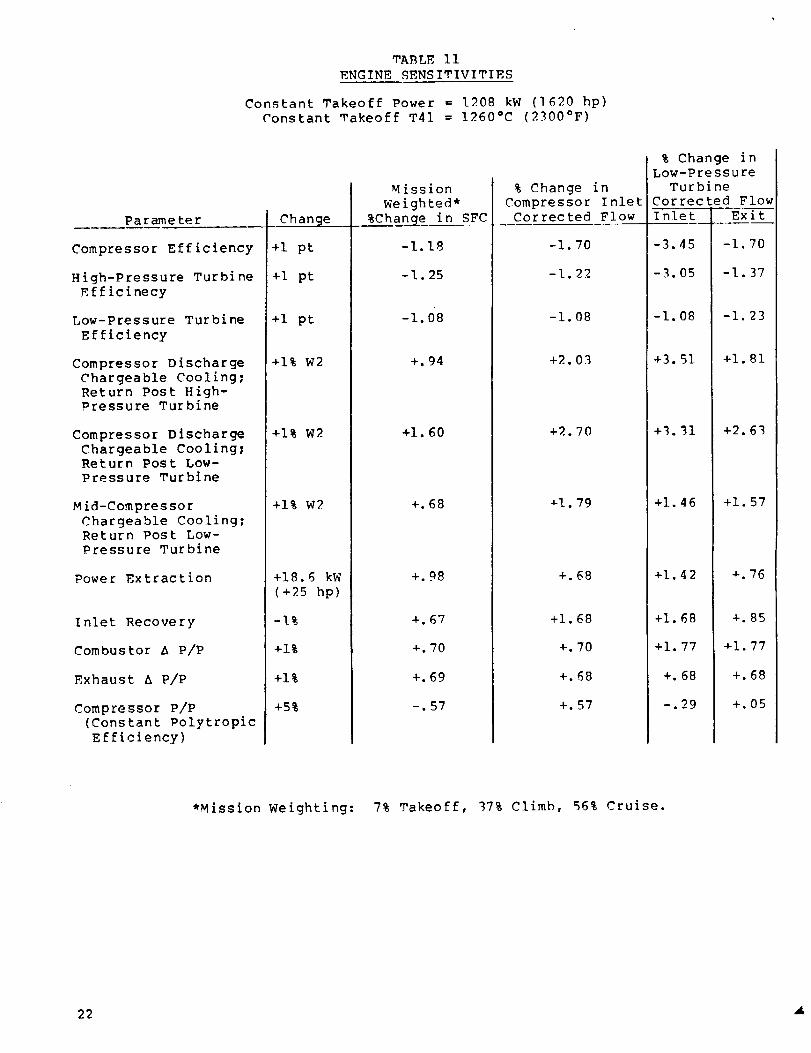
TABLE I iENGINE SENSITIVITIES
Constant Takeoff Power = 1208 kW (1620 hp)
Constant Takeoff T41 = 1260°C (2300=F)
Pa rame te r
Compressor Efficiency
High-Pressure Turbine
Efficinecy
Low-Pressure Turbine
Efficiency
Compressor Discharge
Chargeable Cooling;Return Post High-Pressure Turbine
Compressor Discharge
Chargeable Cooling;Return Post Low-
Pressure Turbine
Mid-Compressor
Chargeable Cooling;Return Post Low-
Pressure Turbine
Power Extraction
Inlet Recovery
Combustor /_ P/P
Exhaust A P/P
Compressor P/P(Constant Polytropic
Efficiency)
Chan@e
+I pt
+I pt
+I pt
+1% W2
+1% W2
+1% W2
+18.6 kW
(+9.5 hp)
-1%
+1%
+1%
+5%
Mission
We ighted*
%Change in SFC
-1.18
-I. 25
-1.08
+. 94
+i. 60
+.68
+.98
+.67
*.70
+.69
-.57
% Change in
Low-Pressure
% Change in
Compressor InletCorrected Flow
-1.08
+2.03
+2.70
*1.79
+.68
+1.68
*.70
+.68
+.57
Turb
Corre____cInlet
-I. 08
+3.51
+_.31
+1.46
+1.42
+I. 68
+i. 77
+.68
-.29
need Flow
Exit
-1.23
+1.81
+2.63
+1.57
+.76
*.85
+1.77
+.68
+.05
*Mission Weighting: 7% Takeoff, 37% Climb, 56% Cruise.
22
ADVANCED TECHNOLOGY IDENTIFICATION AND EVALUATION - Continued
CYCLE AND ENGINE ARRANGEMENT PARAMETRIC ANALYSIS
Propulsion Alternatives
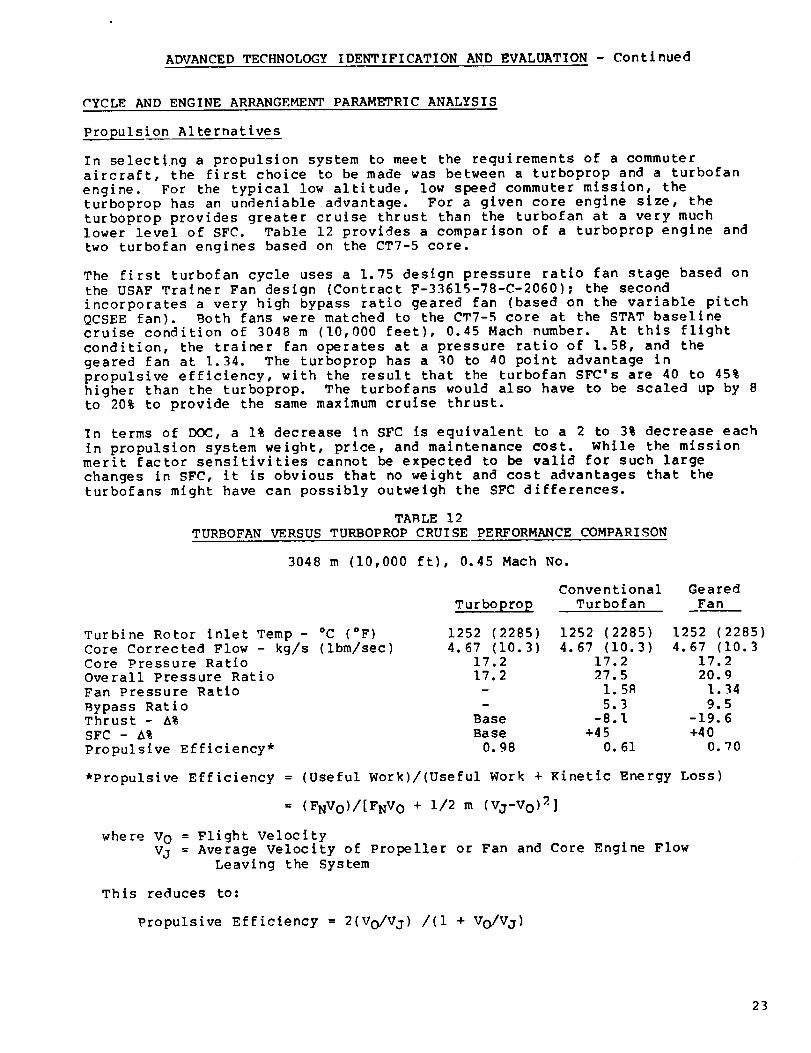
In selecting a propulsion system to meet the requirements of a commuteraircraft, the first choice to be made was between a turboprop and a turbofan
engine. For the typical low altitude, low speed commuter mission, theturboprop has an undeniable advantage. For a given core engine size, the
turboprop provides greater cruise thrust than the turbofan at a very muchlower level of SFC. Table 12 provides a comparison of a turboprop engine and
two turbofan engines based on the CT7-5 core.
The first turbofan cycle uses a 1.75 design pressure ratio fan stage based on
the USAF Trainer Fan design (Contract F-33615-78-C-2060); the second
incorporates a very high bypass ratio geared fan (based on the variable pitch
QCSEE fan). Both fans were matched to the CT7-5 core at the STAT baselinecruise condition of 3048 m (I0,000 feet), 0.45 Mach number. At this flight
condition, the trainer fan operates at a pressure ratio of 1.58, and the
geared fan at 1.34. The turboprop has a g0 to 40 point advantage in
propulsive efficiency, with the result that the turbofan SFC's are 40 to 45%higher than the turboprop. The turbofans would also have to be scaled up by 8to 20% to provide the same maximum cruise thrust.
In terms of DOC, a 1% decrease in SFC is equivalent to a 2 to 3% decrease each
in propulsion system weight, price, and maintenance cost. While the missionmerit factor sensitivities cannot be expected to be valid for such large
changes in SFC, it is obvious that no weight and cost advantages that the
turbofans might have can possibly outweigh the SFC differences.
TAB LE 12
TURBOFAN VERSUS TURBOPROP CRUISE PERFORMANCE COMPARISON
3048 m (i0,000 it), 0.45 Mach No.
Conventional Geared
Turboprop Turbofan Fan
Turbine Rotor inlet Temp- °C (°F)
Core Corrected Flow - kg/s (ibm/sec)Core Pressure Ratio
Overall Pressure Ratio
Fan Pressure Ratio
Bypass RatioThrust- A%
SFC - A%
Propulsive Efficiency*
1252 (2285) 1252 (2285) 1252 (2285)
4.67 (10.3) 4.67 (10.3) 4.67 (10.317.2 17.2 17.217.2 27.5 20.9
- I. 5R 1.34
- 5.3 9.5Base -8.1 -19.6Base _45 +40
0.98 0.61 0.70
*Propulsive Efficiency = (Useful Work)/(Useful Work + l<inetic Energy Loss)
= (FNVo)/[FNV O + 1/2 m (Vj-Vo)2]
where V O = Flight VelocityVj = Average Velocity of Propeller or Fan and Core Engine Flow
Leaving the System
This reduces to:
Propulsive Efficiency = 2(Vo/V J) /(i + Vo/V J)
23
ADVANCED TECHNOLOGY IDENTIFICATION AND EVALUATION - Continued
CYCLE AND ENGINE ARRANGEMENT PARAMETRIC ANALYSIS - Continued
In a prior study of turboprops for large transport aircraft, the turbofan
propulsion system was about g0% lighter in weight than the engine-gearbox-propeller combination, but was within 5% of the cost and maintenance.
Assuming that these trends hold, and that the S_AT sensitivities can be
applied for large changes, the turbofan cycles would have DOC's 15 to 25%
higher than a turboprop. This result applies to the short haul, low speed
mission used here. It is to be expected that the turboprop advantage would
decrease with increasing cruise Mach number. Previous studies have indicated
a potential DOC saving for a turboprop powered, 0.8 Mach number, medium haul
transport on the order of 5% relative to a turbofan aircraft.
_ased on the large estimated difference in DOC, the turbofan was not pursuedas an alternative propulsion system.
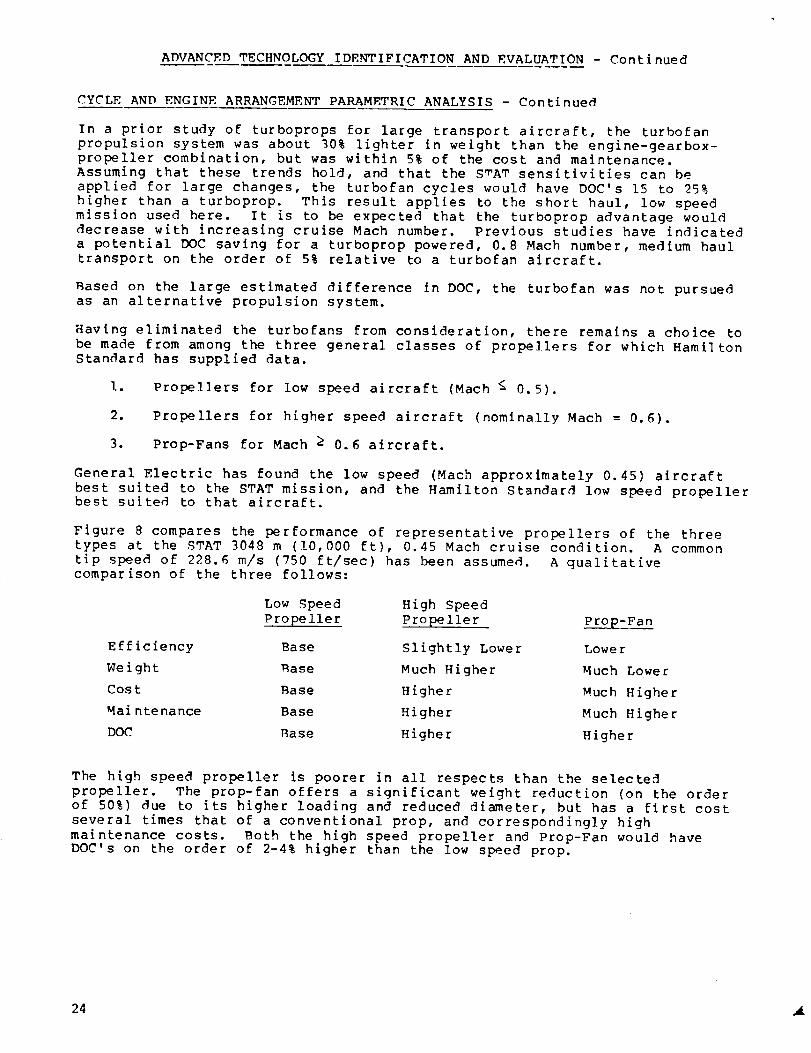
Having eliminated the turbofans from consideration, there remains a choice to
be made from among the three general classes of propellers for which Hami] tonStandard has supplied data.
I. Propellers for low speed aircraft (Mach <- 0.5).
.
3.
Propellers for higher speed aircraft (nominally Mach= 0.6).
Prop-Fans for Mach _ 0.6 aircraft.
General Electric has found the low speed (Mach approximately 0.45) aircraft
best suited to the STAT mission, and the Hamilton Standard low speed propellerbest suited to that aircraft.
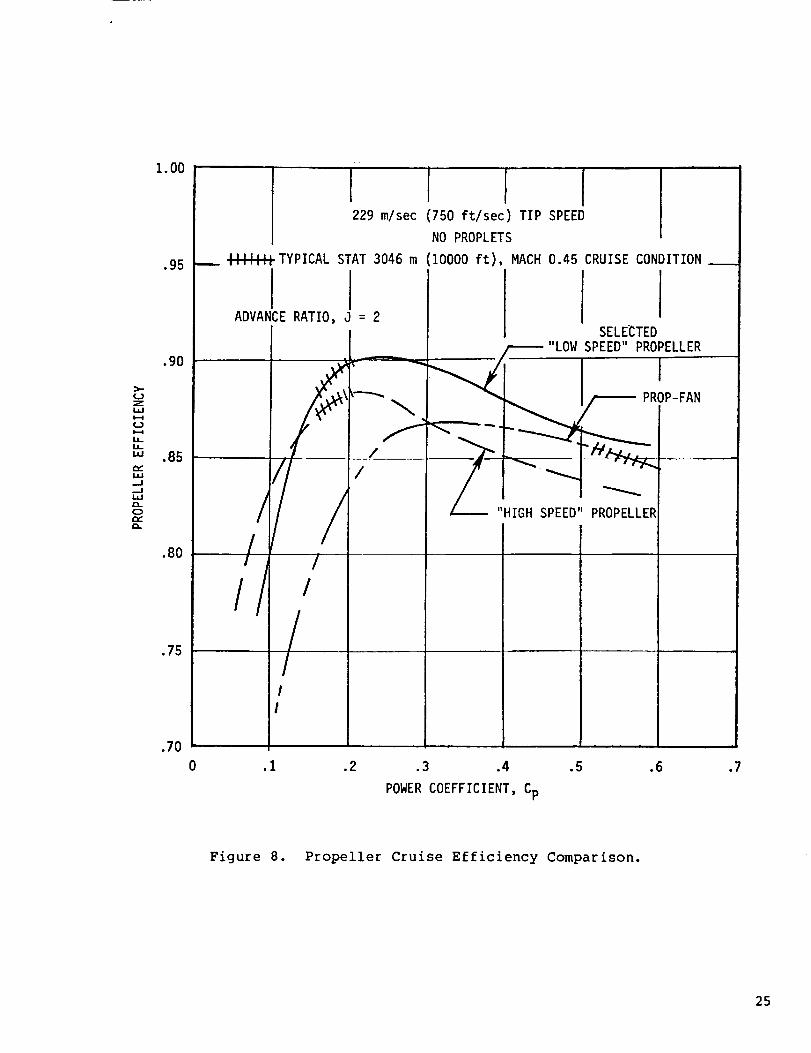
Figure 8 compares the performance of representative propellers of the three
types at the STAT 3048 m (10,000 ft), 0.45 Mach cruise condition. A common
tip speed of 228.6 m/s (750 ft/sec) has been assumed. A qualitativecomparison of the three follows:
Low Speed High Speed
Propeller Propeller Prop-Fan
Efficiency Base Slightly Lower Lower
Weight ;_ase Much Higher Much Lower
Cost Base Higher Much Higher
Maintenance Base Higher Much Higher
DOC Base H ighe r H i ghe r
The high speed propeller is poorer in all respects than the selected
propeller. The prop-fan offers a significant weight reduction (on the order
of 50%) due to its higher loading and reduced diameter, but has a first cost
several times that of a conventional prop, and correspondingly high
maintenance costs. Both the high speed propeller and Prop-Fan would haveDOC's on the order of 2-4% higher than the low speed prop.
24
Z
14-
IJ-
-.J
.--J
(1.
0..
1.00
.95
.90
.85
.80
.75
.70
I229 m/sec (750 ft/sec) TIP SPEED
NO PROPLETS
_-H-I-H+TYPICAL STAT 3046 m
ADVANCE RATIO, J = 2
//
'/ ,/ i
/I
I
//
(10000 ft), MACH 0.45 CRUISE CONDITION_
SELECTED
/-----"LOW SPEED" PR(IPELLER
OP-FAN
_"HIGH SPEED" PROPELLER
.1 .2 .3 .4
POWER COEFFICIENT, Cp
.5 .6 .7
Figure 8. Propeller Cruise Efficiency Comparison.
25

ADVANCED TECHNOLOGY IDF.NTIFICATION AND EVALUATION - Continued
CYCLE AND ENGINE ARRANGEMENT PARAM_ETRIC ANALYSIS - Continued
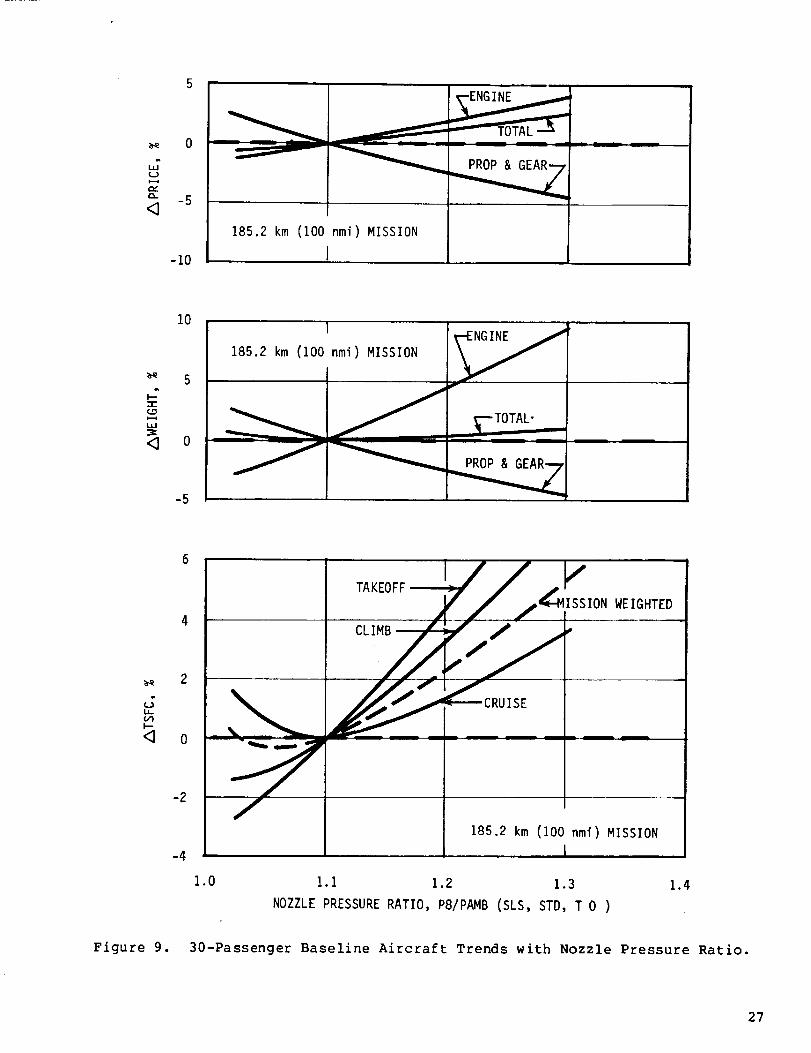
Exhaust Nozzle Pressure Ratio Selection
The selection of nozzle pressure ratio (PS/PAMB) for a turboprop engine has an
impact on both propulsion system size and fuel consumption. The optimum value
of pressure ratio is mission dependent; increasing nozzle pressure ratio tends
to favor SFC at higher flight velocities, while increasing fuel consumption at
takeoff and low flight speeds. Increasing nozzle pressure ratio also results
in a larger engine for the same takeoff thrust, but a smaller propeller and
gearbox. As the pressure ratio is increased, the engine exhaust provides a
larger percentage of the total thrust, and the engine delivers less power to
the propeller. This results in a smaller propeller and gearbox, but requires
an increase in airflow size to maintain the same total thrust. Increasing
PS/PAMB also tends to reduce the size of the low-pressure turbine and exhaust
system, but this is a second order effect; the airflow increase dominates the
engine weight.
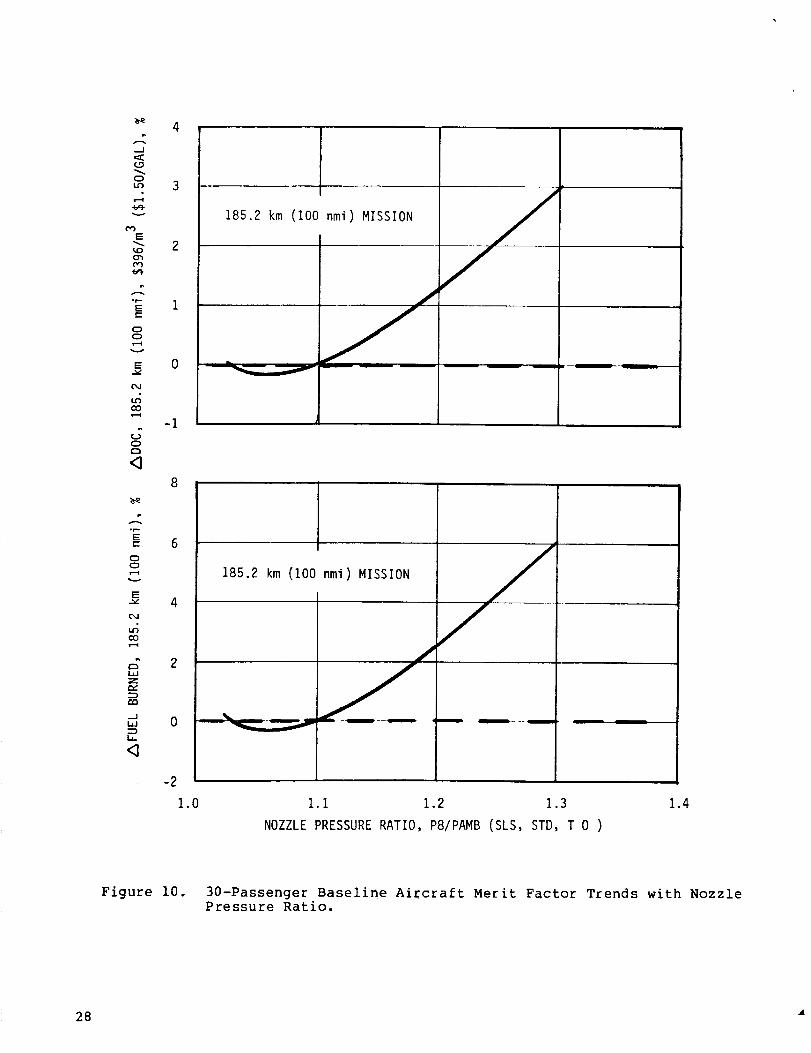
Some of these trends are shown in Figure 9 for the STAT _0-passenger baseline
aircraft. The results in terms of fuel burned and direct operating cost are
shown in Figure 10 for the 185.2 km (100 nmi) mission. The optimum nozzle
pressure ratio for cruise fuel consumption and propulsion weight is 1.10. The
optimum for fuel burned and DOC is somewhat lower, at around 1.06 PS/PAMB. A
value of 1.10 was selected for further use in the study because it is near the
optimum, and tends to favor longer stage length missions where cruise SFCbecomes more dominant.
_arametr ic S tudy__Engi nes
A nominal advanced engine (typical of those under study by General Electric
for the next generation of small engines) was selected as the point of
departure for this portion of the study. This is the same engine used as the
framework for evaluating the advanced technology features and design factors.
Variations in cycle pressure ratio and turbine inlet temerature (T41) from the
nominal cycle were considered, as were a variety of engine arrangements to
achieve the desired cycles.
The nominal advanced engine comprises an advanced axi-centrifugal compressor
with a 17:1 pressure ratio, a high through-flow annular combustor, a single
stage, cooled high-pressure turbine with a 1260°C (2_00°F) inlet temperature,
and a two stage, uncooled, forward drive power turbine. The cycle parametric
study encompasses pressure ratios from 11.5:1 to 30:1 and turbine inlet
temperatures of 999 ° to I_71°C (1890 ° to 2500OF). Selected combinations of
pressure ratio, temperature, and engine arrangement which seemed to have merit
were investigated in some detail.
At the lowest pressure ratio, consideration was given to an uncooled turbine;
at moderate pressure ratios a comparison was made between single and two stage
compressor drive turbines; at moderate to high pressure ratios the addition of
low-pressure compression stages (boosters) to the output shaft was studied; at
the highest pressure ratio, a dual rotor core cycle was investigated.
Altogether, 12 engine designs, summarized in Table 13, were analyzed. The
base (nominal) cycle is Cycle 3.
26
(.J
my-(3_
<_
0
-5
-10
I_EN_
185.2 km (I00 nmi) MISSION
I
_c-r
(.o
<]
10I _N_INF J
185.2 km (100 nmi) MISSION \-"-"_
5 I.
-5
_ 2
I---
<] o
-2
-4
1.0
/
ISSION WEIGHTED
CLIMB ____,r///,
//.,_'J _--_-_CRUISE
""' I
185.2 km (100 nmi) MISSION
1.1 1.2 1.3
NOZZLE PRESSURE RATIO, PS/PAMB (SLS, STD, T 0 )
1.4
Figure 9. 30-Passenger Baseline Aircraft Trends with Nozzle Pressure Ratio.
27
--J
O
v
E
,r-
Ee-
OO
v
E
CO
JO
E
OO
E
CO
W
Z
._J
4
3
2
1
0
-I
185.2 km (I00 nmi) MISSION
185.2 km (100 nmi) MISSION
/2
-2
1.0 1.1 1.2 1.3 1.4
NOZZLE PRESSURERATIO, P8/PAMB (SLS, STD, T 0 )
Figure I0. 30-Passenger Baseline Aircraft Merit Factor Trends with NozzlePressure Ratio.
28

O
15
i, I-- .pJ
-r I=:
_ oO_=
L_O e-
e,..O
•_ ,
E
r-- c-O0 S.- Q-_
C "_ rCS
e-
"r,
I--
S-Ou_
S-
o
e- ¢'_
I'--
e-
4- + + 4-
_ v _ v
O O O O (O
0 0 0 0 0._
g g g _'- o_
oo_ oo_ oo_ oo_ o_ oo oo_
+ + + + ÷ ÷ + +_
8 8 8 8 8 8 8 8
O O O _ O O O
O O O O O O O O
e_
r_$-
(I)
Q_
!e_4-)
°_
E
Q0
-r--
I!
OF--Cnt_
QJ
r_ c_
::1:: I-.-
I._ e--
S- .,1_
I_0 S-S,.- _
_... r-
H |1
tJ, I,--
-J
29
ADVANCED TECHNOLOGY I DENT IFICATION AND EVALUATION - Cont i nued
CYCLE AND ENGINE ARRANGEMENT PARAMETRIC ANALYSIS - Continued
Cycles IA, IB, 2, 3, and 4 combine to illustrate the trends with pressure
ratio and temperature for conventional turboshaft engines with single stage
high-pressure turbines. Cycles IA and IB have uncooled high-pressure turbine
blades. Both are at a pressure ratio of 11.5:1, but differ in turbine
temperature. Cycle IB operates at the maximum temperature allowable for an
uncooled turbine blade of current technology material, Cycle IA operates
83.3°C (150°F) hotter, the estimated capability of an uncooled blade of an
advanced, directionally solidified, eutectic material. Cycle 2 provides a
comparable cycle with a cooled high-pressure turbine at II. 5:], 1260°C
(2300°F) T41. Cycle 3 is the nominal cycle, at In:l, 1260°C (2300°F); Cycle 4
is the same configuration operating at 17:1 and 1371°C (2500°F).
Pressure ratios above 17:1 require other staging arrangements; either 2-stage
turbines, or another compressor. Cycle 8, when compared to Cycle 3, yields
the 2-stage versus 1-stage turbine comparison at the nominal cycle conditions
[17:1, 1260°C (2300°F)]. Cycle 9, also with a 2-stage turbine, extends the
pressure ratio trend to 23:1 at 1260°C (2300°F). This is considered to be the
maximum pressure ratio obtainable with a single spool.
Cycle 5A has a single, I._5:1 pressure ratio compression stage (booster) added
to the low-pressure rotor, and runs to the same overall pressure ratio and T41
as Cycle 9. It also has a 2-stage high-pressure turbine. Thus Cycle 5A
versus Cycle 9 provides a direct comparison of a boosted and conventional
cycle. Cycle 5B differs from 5A in that it has a 2-stage, P:I booster, which
allows a lower pressure ratio core and a single stage high-pressure turbine.
Cycles 6 and 7 both have ?-stage, 1.8:1 pressure ratio boosters, 2-stage
turbines and 30:1 overall pressure ratios. Their turbine inlet temperatures
are 1260 ° and 1371°C (2300 ° and 2500°F), respectively.
Cycle I0 is also 30:1, 1260°C (2300°F), but uses a dual rotor core, 3-turbine
arrangement. The high-pressure compressor is a single centrifugal stage
driven by a single, cooled turbine stage. The low-pressure compressor is an
axi-centrifugal driven by another cooled, single stage turbine. The power
turbine is an uncooled 2-stage design.
Component Cycle Trends
Each engine was modeled in sufficient detail to determine cooling flows,
turbine loading, tip speeds, and other factors affecting engine performance
and size. Performance was established in a common core airflow size, and
costs and weights were estimated. The engines were then scaled to the mission
thrust size required by the STAT baseline aircraft and performance adjusted
for the resulting differences in component size, (e.g., clearance and Reynoldsnumber effects).
Primary emphasis was given to selecting components and a cycle consistent with
technology expected to be avail_able in the early 1990's. The cycle trends are
themselves dependent upon the component technology assumptions made. The
cycle pressure ratio and SFC trend, for example is dependent upon the
compressor arrangement and compressor efficiency trends with pressure ratio,
as well as other pressure ratio related design factors such as turbine cooling
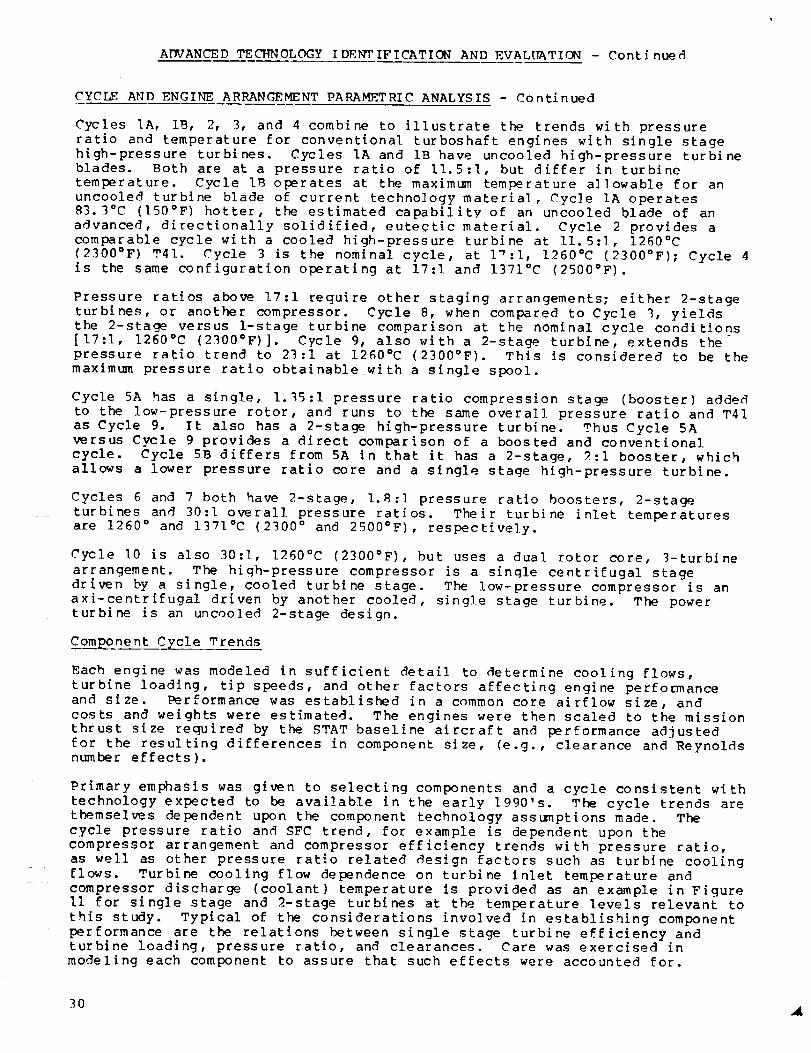
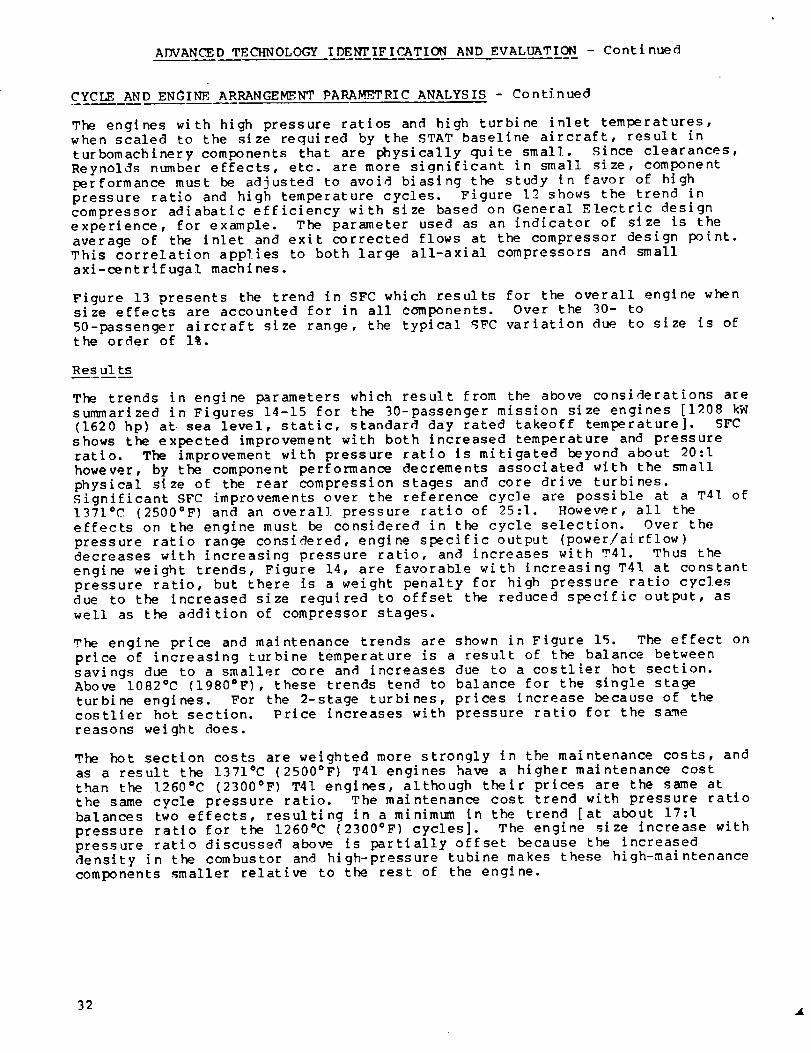
flows. Turbine cooling flow dependence on turbine inlet temperature and
compressor discharge (coolant) temperature is provided as an example in Figure
II _or single stage and 2-stage turbines at the temperature levels relevant to
this study. Typical of the considerations involved in establishing component
performance are the relations between single stage turbine efficiency and
turbine loading, pressure ratio, and clearances. Care was exercised in
modeling each component to assure that such effects were accounted for.
30 •
0
LI_
Z
.,--I00
hl..Jew
,'5.
Z
"r
_J
I-'-
0..J
Z
-J0
LaJ
nn
ILl
C_
-I-(0
l.lJ
nn
-J
I-'-
F--
12
11
10
9
8
7
69
TWO STAGE TURBINE
/ 1371-(2500)1316 (2400)
/
/j// 1260 (2300)
(,,oo,°c (°F)
T41
SINGLE STAGE TURBINE ._ 1371 (2500)j-
7 _/ ,1316 (2400)
5 ,, 1204
° C (OF)
T41
I I
<_¢_vUNCOOLED ROTOR BLADES
IDES DISK & STATOR COOLING)i !
300 400 oC 500 600I I, I :
600 800 (OF) 1000 1200
COMPRESSORDISCHARGETEMPERATURE,T3
700
Figure ii. Estimated Turbine Cooling Flow Requirements.
31
ADVANCED TECHNOLOGY IDENTIFICATION AND EVALUATION - Continued
CYCLE AND ENGINE ARRANGEMENT PARA_TRIC ANALYSIS - Continued
The engines with high pressure ratios and high turbine inlet temperatures,when scaled to the size required by the STAT baseline aircraft, result in
turbomachinery components that are physically quite small. Since clearances,
Reynolds number effects, etc. are more significant in small size, component
performance must be adjusted to avoid biasing the study in favor of highpressure ratio and high temperature cycles. Figure 1-9 shows the trend in
compressor adiabatic efficiency with size based on General Electric design
experience, for example. The parameter used as an indicator of size is the
average of the inlet and exit corrected flows at the. compressor design point.
This correlation applies to both large all-axial compressors and small
axi-cent ri f ugal machines.
Figure 13 presents the trend in SFC which results for the overall engine whensize effects are accounted for in all components. Over the 30- to
50-passenger aircraft size range, the typical gFC variation due to size is ofthe order of 1%.
Res ul ts
The trends in engine parameters which result from the above considerations are
summarized in Figures 14-15 for the 30-passenger mission size engines [1208 kW
(1620 hp) at sea level, static, standard day rated takeoff temperature]. SFC
shows the expected improvement with both increased temperature and pressure
ratio. The improvement with pressure ratio is mitigated beyond about 20:1however, by the component performance decrements associated with the small
physical slze of the rear compression stages and core drive turbines.Significant SFC improvements over the reference cycle are possible at a Tdl of1371°C (2500°F) and an overal! pressure ratio of 25:1. However, all the
effects on the engine must be considered in the cycle selection. Over the
pressure ratio range considered, engine specific output (power/airflow)decreases with increasing pressure ratio, and increases with Tdl. Thus the
engine weight trends, Figure 14, are favorable with increasing T41 at constant
pressure ratio, but there Is a weight penalty for high pressure ratio cyclesdue to the Increased size required to offset the reduced specific output, as
well as the addition of compressor stages.
The engine price and maintenance trends are shown in Figure 15. The effect on
price of increasing turbine temperature is a result of the balance between
savings due to a smaller core and increases due to a costlier hot section.Above 1082°C (1980°F), these trends tend to balance for the single stage
turbine engines. For the 2-stage turbines, prices increase because of thecostlier hot section. Price increases with pressure ratio for the same
reasons weight does.
The hot section costs are weighted more strongly in the maintenance costs, andas a result the 1371°C (2500°F) T41 engines have a higher maintenance cost
than the 1260°C (2300°F) T41 engines, although their prices are the same at
the same cycle pressure ratio. The maintenance cost trend with pressure ratiobalances two effects, resulting in a minimum in the trend [at about 17:1
pressure ratio for the 1260°C (2300°F) cycles]. The engine size increase with
pressure ratio discussed above is partially offset because the increaseddensity in the combustor and high-pressure tubine makes these high-maintenance
components smaller relative to the rest of the engine.
32
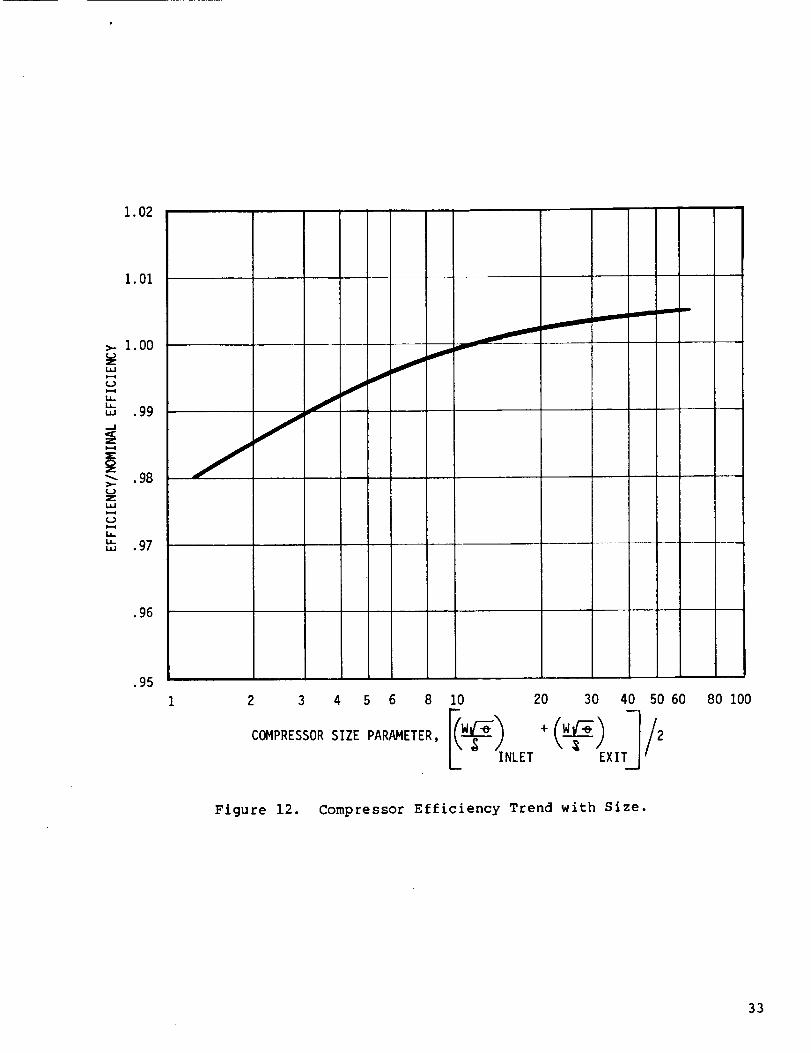
1.02
1.01
>.- 1.00
.99
--_.98/Zu_b-4
U-U.,., .97
fi
.96
.95
2 3 4 5 6 8 10 20 30 40 50 60
os,osz80 I00
Figure 12. Compressor Efficiency Trend with Size.
33

0
1.03
1.02
1.01
1.00
.99
I
4
i L..
APPROXIMATE SIZE REQUIRED FOR
30 PASSENGER AIRCRAFT 0
50 PASSENGER AIRCRAFT ['-]
UNBOOSTED_
BOOSTED
2
I
kg/sec
I I
10 12
(Ibm/sec)
CORRECTED CORE FLOW
6 8
I I I !
14 16 18 20
10
I
22
Figure 13. Engine SFC Trend with Size.
34

wZ z
com,,-
"-,,I--. I--
61.1
r._ r.z)tz')1.61 l.zJ
_, ?,,
-r"
--r- -r
w(_'3
("4J
":::I"I--"
(:3
0 COv w-_
v
0 --0"_
W
0(..)
\o\v_-
L'_ ...-I
0QO
v
CO
v
0
J\ o \0,-._
k _0 _'_ _ l
\ _"'vb")
r'_
b
c,,l C)
L_('%jv
! I
% 'IHgI3M 3NI_N3_7
C3
v _
v(:h _ C44r,_ ,Oh O0
o o_
//0
_r",Oz ?-..,0 _:_ _.J
vL_JO
_.OOZ
,...._mm,
| u_,.,c,,J_
I °| ,--,c_i,,.,,.,m,,
I ml ,.,0¢..3
! \.o_o
0I v_m,-
0 _--J
O_
OZ
0 0 0 0
I
0
!
0
N
I.i.I
hi.=I
0
..=I
I.I.I
i..=I
0
W
Wm,"
I,I--I
...I
.=.I
m,."
r_
0
I=I
.I.I
-F-I
-,=I
I=
t_
4.1
I=I
I=Io,=I
I=I
I=
!0
I,.I
-,-I
35

I._ I.,61Z Z
mm
I'- l,--
l.m.lm,," m,,,
m,." ?,-
•"I- -t-
w
'=C "::C
III
0
ILl
C_¢--)
I--, t"hO II
I.LI e'_' I%
O
° lII
C_
vv
•-,o |
I
vt'_jv
O
0 ¢'J
Q_.=_mOW_',_I mvt,,_
000_mm
I
C_L_
% '/S03
O
_w
v_0
O0
0
v
O
//°° v
1
!
33NVN3ZNIVH_
0¢4j
i
0
l.m.lmr"
Im ..=I,,=C
IZt--_,,:_ bJ
I--• t.-._ 6,,.)
,,,o
OZ0_
e-.l ¢',_
_C_ O0
t"_l {_-) v
• v_h
C_ O 0
% ' 331_d V
r-,.o
,.=_(4d
(,,,j¢_-),--._t'%J
0 O
! !
O
#--
#,#
r_
..Jm
0
#--
w
....$
":C
C
0t.)
t.)C
n_
c
tb.,..4
tb
C
mU_n_
I
,-4
r_
36

ADVANCED TECHNOLOGY IDENTIFICATION AND EVALUATION - Continued
CYCLE AND ENGINE ARRANGEMENT PARAMETRIC ANALYSIS - Continued
The effects of SFC, weight, price and maintenance on the DOC of a 30-passenger
commuter turboprop are combined in Figure 16. The minimum DOC at 1260°C
(2300°F) T41 occurs at a pressure ratio of 20. The minim_ DOC is, however,
only a 1/2% less than the baseline Clearly the payoff of very high pressureratios is very small. The higher fuel cost of $396/m j ($1.50/gal) shows
more justification for the selection of higher pressure ratios and T41. At
$396/m 3 ($1.50/gal) for the 30-passenger aircraft on the 185.2 km (i00 nmi)
mission, fuel represents 41% of the total DOC.
Figure 17 shows the DOC results for the 50-passenger commuter aircraft. Cycle
trends for the 50-passenger aircraft engine show a somewhat higher payoff for
higher T41 and cycle pressure ratio. The absolute size penalties on coolingflows and component efficiencies show up less strongly in the larger engine
size required for the 50-Passenger aircraft.
Results in terms of aircraft design takeoff gross weight and fuel burned on
the 185.2 km (I00 nmi) mission are provided on Figure 18-19.
The specific engine and mission characteristics for each of the study engines
are provided in Tables 14-15 for reference.
Tables 16-18 are illustrative of the impact of configuration and staging
variations. Each table compares two configurations at the same combination of
pressure ratio and T41.
Table 16 compares two engines where the primary difference is a change from a
single stage HP turbine to a 2-stage HP turbine. The 2-stage turbine is
advantageous in terms of loading and efficiency. ;_eing more lightly loaded,the rotor is of smaller diameter resulting in substantial weight savings when
designed to the same stress levels and life as the single stage turbine. In
the case shown here, it was also necessary to reduce the diameter of the
low-pressure turbine by adding a stage to obtain a smooth flowpath transitionbetween turbines. Although the net result of these changes is a reduction in
engine weight, the added complexity increases engine price significantly.Because HP turbine parts are heavily weighted in the engine maintenance model,
maintenance shows an even stronger adverse effect. Another disadvantage of
the 2-stage turbine is that it requires more cooling air. The end result is a
savings of 1.3% in fuel, but a 1.3% increase in DOC.
The tradeoff between a boosted and unboosted engine at 23:1 and 1260°C
(2300°F) is neutral, as shown in Table 17. At a fixed power size, the
supercharging effect of the booster results in small core components, which
confer a weight and price advantage. The overall efficiency of thecompression process is slightly higher for the conventional turboshaft engine,
giving it 1.4% better SFC. The engine size effects on weight and cost just
balance the performance effect, with the result that the boosted engine hasthe same DOC as the unboosted, but burns 1.5% more fuel.
A turboshaft engine with a dual rotor core is compared to a boosted engine at
30:1 and 1260°C (2300°F) in Table 18. The addition of an entire spool to the
core results in a very large weight penalty for the dual rotor engine. Chief
contributions to the weight increase are the additional frame and stm_p
required to support the third rotor, and the large bore diameters required onthe HP rotor (for the three concentric shafts) which result in heavy,
inefficient disk designs.
37

=" Z
L,IJ W
(,/}
,,, ,,, %
-r -r
-I"-
.el:I-- I--
,--i C'.J
rv--
°° II¢x.lOvl,--
Ot_1,0
OJ-.J
l 1 P-
'/]°
0
_ o,-,L_I,I
_(._
0| ,--4O
'q3n3 (lVg/0S'I$) _m/96_$ 0 DOQ_
OZr',
t'_ I--
_-_ I._J 0I--0
"-"0 0
°o_ L °_O'_(_ N I""
vOq
j ,-- ,,.
V
-- !1 o°co _ I I
0
•
% '13na (iv9/00"I$)_m/_gz$0 aoGx7
-- I,¢'3
CD
o
0
0
0
O,J
0
0
I--
We.,-
1.1
r_
1.1._J
>,-
-J
--J
e-,-1,1
0
0
f-
ry,
1.1
rv"
C/3
c/31,1
1.1..J
,Y
1.1
0
0
q_
0iJ
0_nC0u_m
I
C_
1,0
0
_n
3B
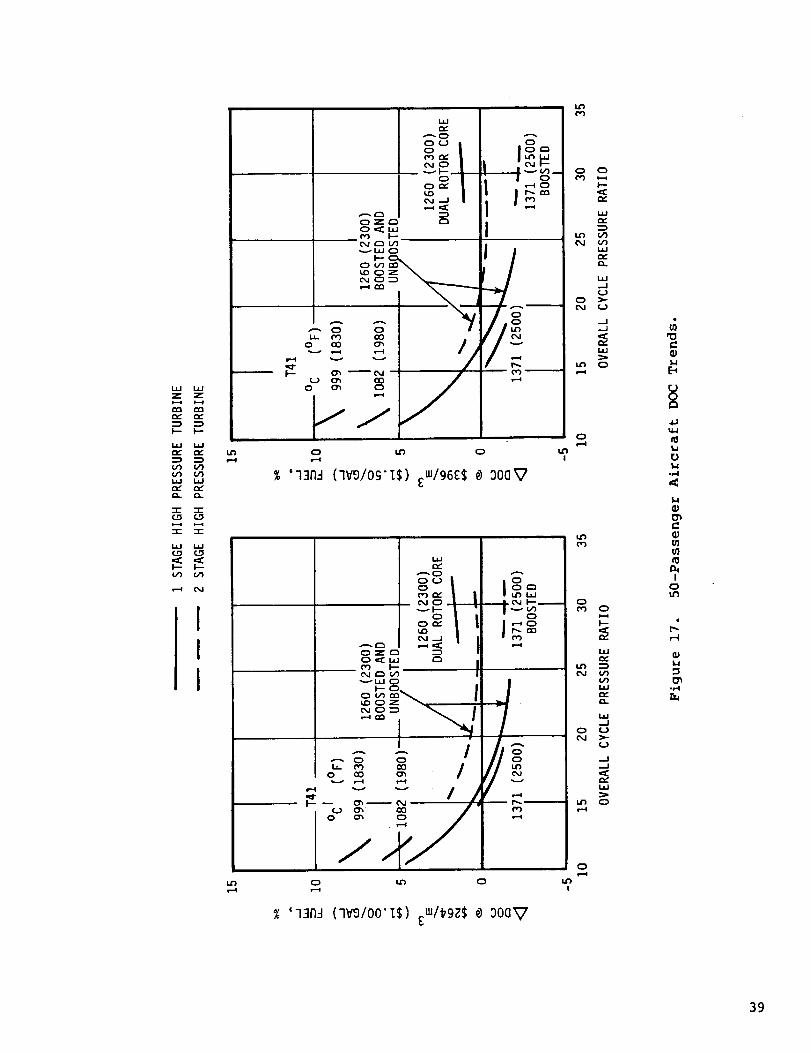
LIJZ Z
_-- F-
I-- I-.-
III
w
o') I.--
vLLIO
J
° _ _ I/
° _ _ _
u'l 0 IX! 0i-4 i..4
g "131"1:1 (7Yg/0s'T$) _m/96_$ # 300_7
!
LI.JQ_
*'-"- O
o_C_
NO
OOr,,*_D
O =:E LIJt'_ I--o.j ,,'_ (/1".,---" I.aJ E_
I °| u_,.,• Iv(,/')
I I °
!
r' ,-
//%,"
'73nJ (7Vg/00"T$) _w/_gZ$ e _0av
t",'!
C:) 0
I--
r_
IJ.I
U'l (/)(',J
i,iCI::
Lid.--I0>--
r,J 0
..I
Lit
Q
C_
I--
I.IJQ::
U'! '--_
U')LIJ
.J
L_
U_ CD
0
I
c
_J
C_JmU_ma_
I
r-I
39

w l,lZ Z
oo
I-- _--
e,,.- m_.
(._ (.#")
ILl i,im,- m,,",-, e.,
II
O
% 'N01SSIW
JJ
c_,J I--I vG, D
_ LJ.I OI=-O
_ rll _' _-"_
O _ O
!
(u,,u 001) '"_ Z'_BI '03NUnB 73nJ_
O
!
CO C_I I
r..j,
O
O
L_
O
l--
m,"
(',,J
LO
...J
i,i
O
'IO
k_E-'
mm
,=Ia_
r,
O
4-_
L_1.a
c:
0"Ju_
t
O0r-I
4O

w w
Or3
I,--
l.l.le_" I",,"
0'I
"I- -r
1,1 W
fJ)
0,,.I
III
0
(,,41r-_
,,_ (:o
L_ t'_ O00 00 O_
Il I_"' t--
_1 _-._1 ,,,- ¢'_
_..).
0 _ 0 0 0
I
% 'NOISSI_ (Lmu OOI) m_ Z'SSI '03N_N8 73NJ_
Ii
cO
I.i.Ir,,,,"
,.-"-0Of.-)0c,_.rv"c_O
0Ot_
p_r_ _o
,_o__c,JO
___'_'_- _
// /
iI
4.,00
v
0 e-.___I_r_ I.i.10,,I l--
_,--m
i I
'Mg01V
c_
0 0
0oJ
.._1
tO 0
0
t.Ot'O
0 0
O_
W
t.O
I,IOC
00 >'-
W
LO 0
0
o
.Io14.4
o
-,-I,<
o
C
mr_
I
0
41
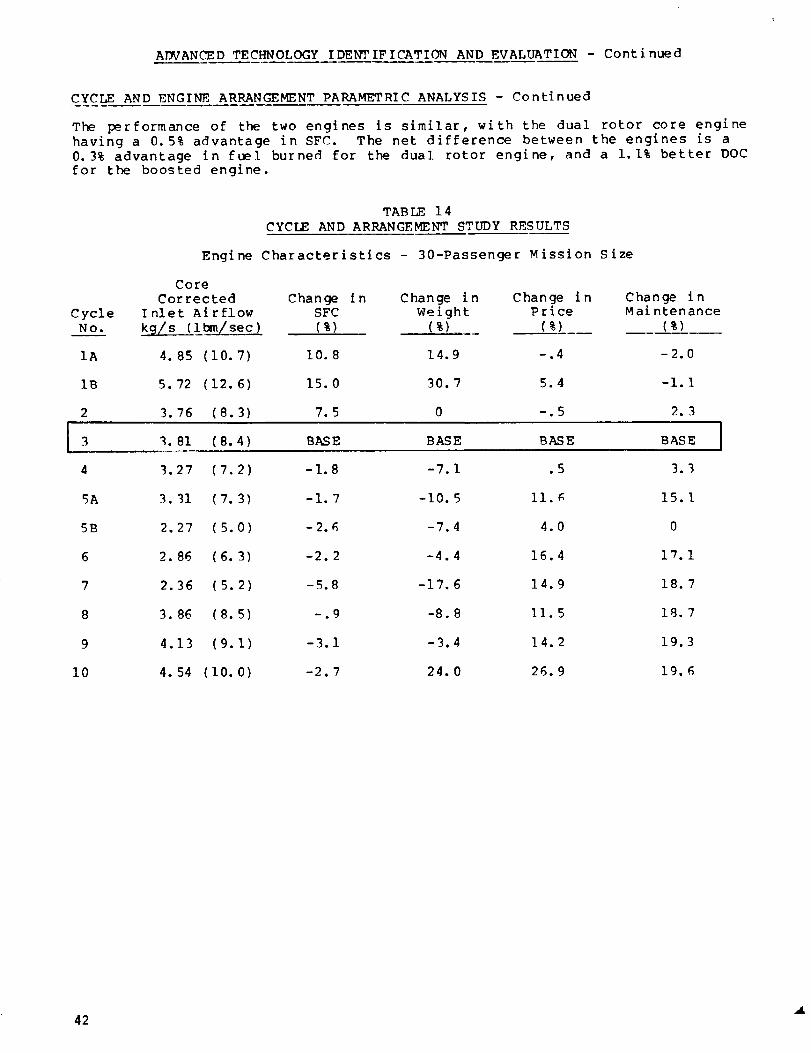
ADVANCED TECHNOLOGY IDENTIFICATION AND EVALUATION - Continued
CYCLE AND ENGINE ARRANGEMENT PARAMETRIC ANALYSIS - Continued
The performance of the two engines is similar, with the dual rotor core engine
having a 0. 5% advantage in SFC. The net difference between the engines is a0.3% advantage in fuel burned for the dual rotor engine, and a 1.1% better DOC
for the boosted engine.
CycleNo.
IA
1B
2
TABLE 14
CYCLE AND ARRANGEMENT STUDY RESULTS
Engine Characteristics - 30-Passenger Mission Size
Core
Corrected Change in Change in Change in Change inInlet Airflow SFC Weight Price Maintenance
k_/s (ibm/see) (%) (%) (%) (%)
4.85 (10.7) 10.8 14.9 -.4 -2.0
5.72 (12.6) 15.0 30.7 5.4 -I.I
3.76 (8.3) 7.5 0 -.5 2.3
g. 81 (8.4 ) BASE BASE BASE BASE I
4
5A
5B
6
7
8
9
I0
3.27 (7.2) -1.8 -7.1 .5 3.3
3.31 (7.3) -1.7 -10.5 Ii._ 15.1
2.27 (5.0) -2.6 -7.4 4.0 0
2. 86 (6. 3) -2. 2 -4. 4 16.4 17. 1
2.36 (5.2) -5.8 -17.6 14.9 18.7
3.86 (8.5) -.9 -8.8 11.5 18.7
4.13 (9.1) -3.1 -3.4 14.2 19.3
4. 54 (I0. 0) -2. 7 24. 0 26. 9 19. 6
42

CycleNo.
IA
1B
2
TABLE 15CYCLE AND ARRANGEMENT STUDY RESULTS
Mission Merit Factors
30-Passenger
Chang_ in DOC - (%_)$264/m_ $396/m_
($1.50/gal)
5.4
8.1
3.8,|i
($1.00/gal)
4.2
6.6
3.0
Mission Size
Change inTakeoff
Gross Weight
2.4
3.7
1.2
50-Passenoer Mission SizeChange in
Change inFuel Flow
12.5
17.7
8.3
Chang_ in DOC -$264/m_
( $1.00/9al )
5.2
7.6
3.4
(%_)$396/mj($i.50/gal)
6.4
9.2
4.2
Takeoff
Gross Weight(%)
2.6
4.0
1.3
Change inFuel Flow
(%)
12.9
17.9
FL]
3 BASE BASE BASE BASE BASE BASE BASE BASE
4
5A
5B
6
7
8
g
10
-.5
1.1
-.9
1.4
-,2
1.5
1.2
2.6
-.8
.6
-1.2
.9
-1.1
1.3
.5
1.9
-.6
-.7
-.7
-.5
-1.7
-.5
-.6
.6
-2.2
-2.2
-3.1
-2.6
-7.0
-1.3
-3.6
-2.2
-.7
.3
-1.5
.3
-1.3
1.4
.4
1.6
-1.o -.6 -2.3
-.2
-1.9
-.3
-2.3
1.0
-,3
.9
-.g
-.9
-.8
-1.9
-,5
-.8
.4
-2.9
-3.8
-3.8
-7.7
-1.2
-4.1
-2.9
TABLE 16ENGINE ARRANGEMENT COMPARISON
30-Passenger Size - $396/m3 ($1.50/gal) - 185.2 km (100 nmi)
Turbine Inlet Temp- °C (°F)Pressure RatioNo. of RotorsNo. of HP Turbine StagesNo. of LP Turbine Stages
Change in SFCChange in Power/AirflowChange in WeightChange in PriceChange in MaintenanceChange in Fuel BurnedChange in DOC
Conventional Turboshaft
1-Stage 2-StageHP Turbine HP Turbine
1260 (2300) 1260 (2300)17212BaseBaseBaseBaseBaseBaseBase
17223-,9
-2.3-8.8+11.5+18.7-1.3+I.3
43

"T--
Ee--
C)C)
V
EV
('XJ
q3
N
_J
l/1tO
I0
tn 0 ° ° "
0 _- _l.._j t"x.I ¢x'J t'_ ¢''_
e- o
QJ4_> __
00
44
o _
t._ _ aJ _ _-_0 _ 0
I "_'_ _'_
o_
,-- 0 _-- _-- V_ C_ _ O- _- _- C_
q.; ,-.,, :_ -J .,-.- .p .,- .,- .,- .,-..,--

G_
0
L_•_ L/)0 0
r_
Ee-
oo
c_J
!
N0r-t_
S-
r--
GL.I
0
8
ov--I+++ 0 +
L_.J
I
0 _
I _ _ _
....... _ _
45

A_rANCED TECHNOLOGY I DF_NT[FICATION AND EVALUATION - Conti nued
ADVANCF:D ENGINE TECHNOLOGY SUMMARY
A list Of advanced technology features and design factor options were
identified at the start of the study and of these, thirteen advance:] technology
features and four design factors were selected for detailed evaluation. Table
19 shows the items initially considered, and those in the detailed evaluation
are indicated by an asterisk. The remaining six items were dropped because
tbey did not show enough promise.
The following paragraphs present the primarily aerodynamic and performance
related advanced technology features first, which are followed by the
primarily mechanical technology features and the design factors.
The technology features considered were advanced aerodynamics and performance,
advanced materials, processes and configurations which, when incorporated in
the engine designs, were expected to show a payoff in DOC.
The design factor options considered were features which could be selected for
incorporation in the engine, but which do not require development to provetheir value.
The evaluation of each of these advanced technology options consisted of
comparing the advanced feature with the current technology base CT7 engine
feature. Characteristics which were compared included weight, cost (or price)
differences, effect on engine maintenance, and effect on engine performance.
For each of these, the percentage differences in direct operating cost were
estimated for both he 30- and 50-passenger aircraft at $2_4/m 3 ($1.00/gal)
and $396/m 3 ($1.50/gal) fuel cost. The separate DOC increments were s_nmed
to give the total (or net) effect on DOC. Total mission fuel burned changeswere evaluated in a similar manner.
Tables 20-21 provide quantitative DOC and fuel burn results of the evaluation
of all the technology items, design factors, and also for the advanced
technology propeller and gearbox discussed separately in the following
paragraphs.
46 •

TABLE 19
ADVANCED TRCHNOLOGY FEATURES AND DESIGN FACTORS CONSIDERED
TOTAL LIST CONSIDERED
ITEMS MARKED (*) EVALUATED IN DETAIL
ADVANCED TECHNOLOGY FEATURES
*Highly Loaded Axial Compressor
*Multi-Blade Centrifugal Impeller
*Advanced Centrifugal Diffuser
*Active HP Turbine Clearance Control
*Closed Loop Accel Schedule and Reduced Stall Margin
Cast Compressor Blisks
*Two Material Impeller
Shingle Combustion Liner
*Thermal Barrier Coating on Combustor
*Advanced Combustor Material
*Advanced Material HI Turbine Blade
*Advanced Cooling Technique HP Turbine Blade
*Cast Blisks for LI Turbine
*Metal Matrix LI Shaft
Ceramic Blades for HP Turbine
Variable Area LI Turbine Nozzle
Titanium Aluminide Materials for Structures
Composite Materials for Structures
*Composite Materials for Nacelle
DFSIGN FACTORS
*Modular Construction
*Inlet Protection Systems
*Diagnostic Data Recording
*Alternate Ratings
47
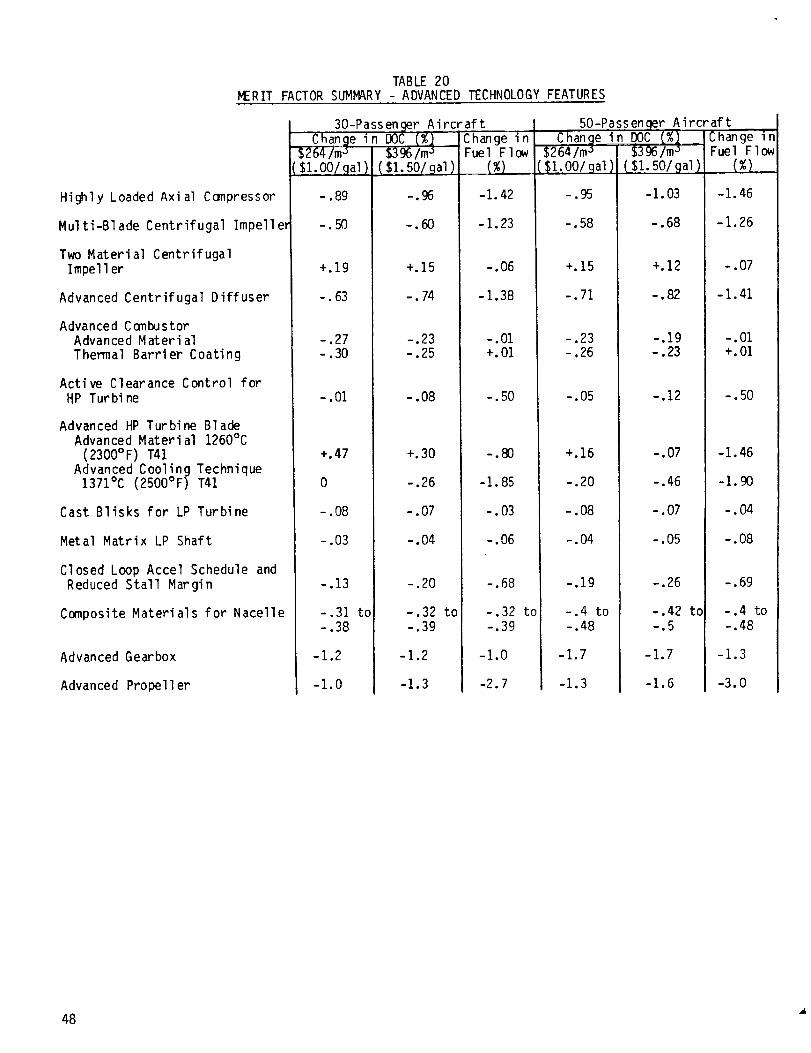
MERIT
Highly Loaded Axial Compressor
Multi-Blade Centrifugal Impelle_
Two Material CentrifugalImpelIer
Advanced Centrifugal Diffuser
Advanced CombustorAdvanced MaterialThermal Barrier Coating
Active Clearance Control forHP Turbine
Advanced HP Turbine BladeAdvanced Material 1260°C(2300°F) T41
Advanced Cooling Technique1371°C (2500°F) T41
Cast Blisks for LP Turbine
Metal Matrix LP Shaft
Closed Loop Accel Schedule andReduced Stall Margin
Composite Materials for Nacelle
Advanced Gearbox
Advanced Propeller
FACTORTABLE 20
SUMMARY - ADVANCED TECHNOLOGY FEATURES
30-Passen _r Aircraft
-- Change in DOG (%]'"$264/mj $396/m_
($I.00/gal)
-.89
-.50
+.19
-.63
-.27-.30
-.01
($1.50/gal)
-.96
-.60
+.15
-.74
-.23-.25
-.08
+.30
-.26
-.07
-.04
-.20
-.32 to-.39
-1.2
-1,3
IChange inFuel Flow
-I.42
-1.23
-.01+.01
-.50
-.80
-1.85
-.03
-.06
-.68
-.32 t(
-.39
-1.0
-2.7
50-Pass en _iChange in DOC (%1
$264/m_ $396/mj($1.00/qal) ($1.50/9ai)
-.95
-.58
+.15
-.71
-.23-.26
-.05
+.16
-.20
-.08
-.04
AircraftChange inFuel Flow
-1.03
-.68
+.12
-.82
-.19-.23
-.12
-.07
-.46
-.07
-.05
+.47
0
-.08
-.03
-.13
-.31 to-.38
-1.2
-1.0
-.19
-.4 to-.48
-1.7
-1.3
-.26
-. 42 to-.5
-1.7
-1.6
-I.46
-1.26
-.01+.01
-.50
-1.46
-1.90
-. 04
-.08
-.69
-.4 to-.48
-1.3
-3.0
48
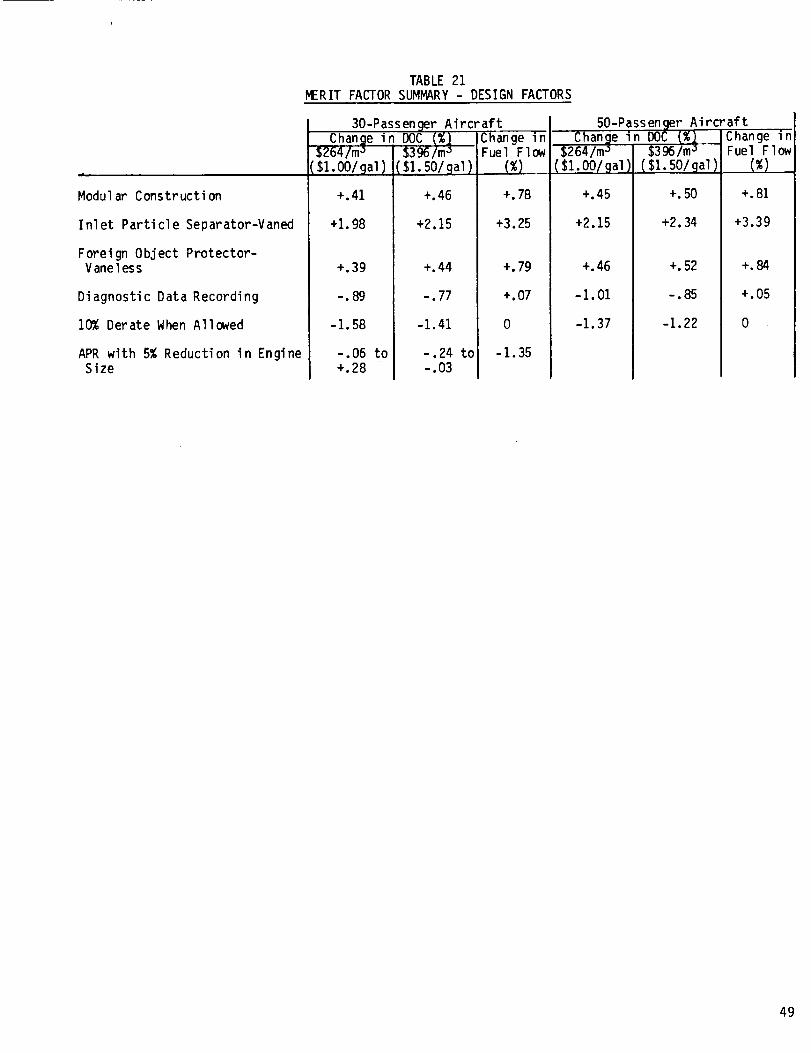
ModularConstruction
Inlet Particle Separator-Vaned
Foreign Object Protector-VaneI ess
Diagnostic DataRecording
10%Derate WhenAllowed
APRwith 5%Reductionin EngineSize
TABLE_RIT FACTORSUMMARY
30-PassengerAircraft_n_Change inFuel FlowI$I. 00/gal)
+.41
+I. 98
+.39
-,8(J
-I.58
-.06 to+.28
($I.50/gal)
+.46
+2.15
21- DESIGN FACTORS
50-Passen9er AircraftChan_e in DOC(%] Change in
$264/m_ $396/ma -- Fuel Flow
(%) ($1.O0/gal) ($I.50/gal) (%)
+.78 +.45 +.50 +.81
+3.25 +2.15 +2.34 +3.39
+.44
-.77
-1.41
-.24 to-.03
+.79
+.07
0
-1.35
+.46
-1.01
-1.37
+.52
-.85
-1.22
+.84
+.05
0
49

AITVANCED TECHNOLOGY IDF_NTIFICATION AND EVALUATION - Continued
ADVANCED AERODYNAMIC DKgIGN AND PERFORMANCE FEATURES
Highly Loaded Axial Compressor
The advanced technology to be applied to the design of a high stage loading
compressor utilizes high speed airfoils uniquely designed for each stage.
Current technology usually consists of the use of modified standard airfoils.
Advanced technology in the field of three dimensional, high speed blade design
is expected to provide capability of positively generating airfoil sectionswhich fit the three dimensional transonic flow field and are designed with
predictable pressure distributions for high efficiency. The base level of
technology for this item is that of the T700 axi-centrifugal compressor; 5
axial stages with an average work coefficient of 0. 82 plus 1 centrifugal stage
(5 + I). The pressure ratio split between the axial and centrifugal portions
for an overall pressure ratio of 17 is approximately 5.5 to 1.1. The advanced
design has an average axial stage work coefficient of 0.92 (+12%), 3 axial
stages and 1 centrifugal stage (3 + i), and a pressure ratio split of 4. 25 to
4.0. The centrifugal stages in the two designs are of the same technology. A
gain of 1 point in overall efficiency is predicted for the 3 + 1 compressor
versus the 5 + 1 baseline.
The merit factor results are st_nmarized in Tables 22-23 for the 30- and
50-passenger turboprops respectively, for nominal estimates of the compressor
efficiency, weight, cost and maintenance differences between the designs. Thesame tabular form will be used to summarize each of the technology items and
_esign factors. It shows the fuel burned and DOC results due to each element
of change, i.e., SFC, costs, and weight. The effect of performance on engine
size and therefore weight, price, and maintenance is included under SFC.
The weight, price, and maintenance effects reported are those resulting from
the design changes prior to resizing the_ aircraft. Note that the results are
very similar for the 30- and 50-passenger aircraft. In the following sections,
results will generally be given only in the 30-passenger size. Results for
both sizes have already been suntmarized in Tables 20-21.
The performance effects for the nominal improvement of 1 point in overall
compressor efficiency represent 3/4 of the DOC improvement potential. Figure
20 shows the sensitivity of this nominal result to the compressor efficiency
improvement prediction at the two levels of fuel cost. Curves such as this
are provided for many of the items which follow because of the uncertainties
inherent in the prediction of the benefits and costs of new and untried
de s i gn s.
5O
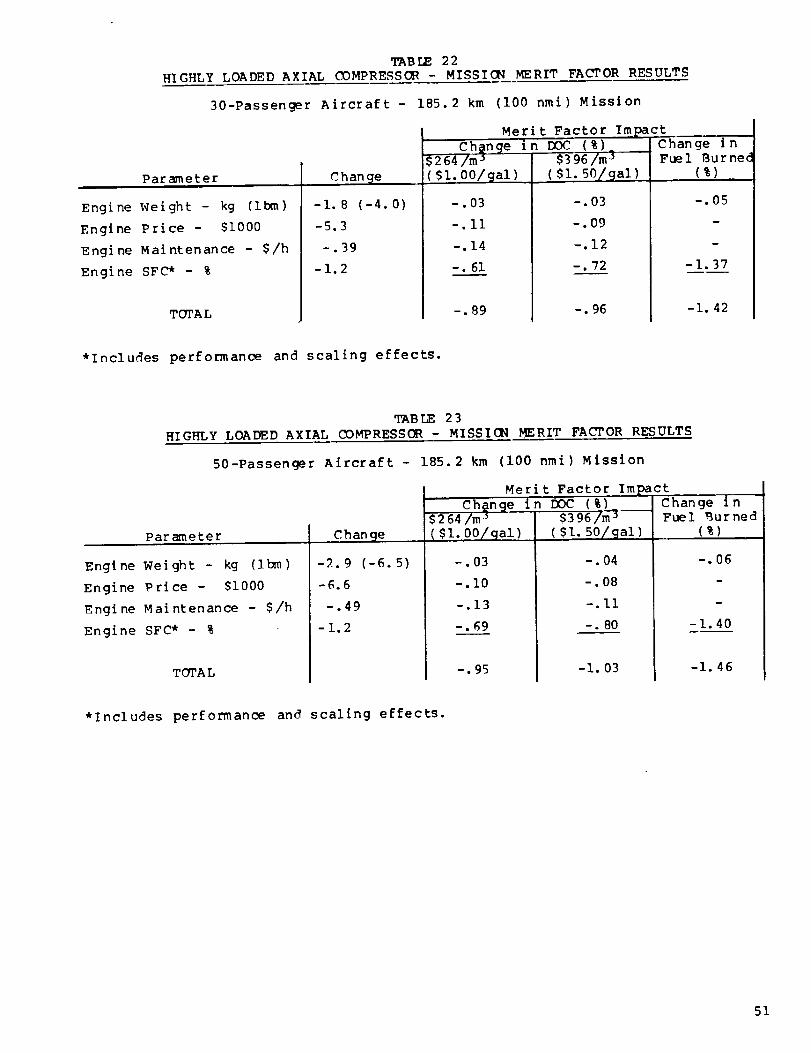
TABLE 22HIGHLY LOADED AXIAL COMPRESSOR - MISSION MERIT FACTOR RESULTS
30-Passenger Aircraft - 185.2 km (i00 nmi) Mission
Parameter
Engine Weight - kg (ibm)
Engine Price - $i000
Engine Maintenance - $/h
Engine SFC* - %
TOTAL
Merit Factor Impact
Chan@e
-1.8 (-4.0)
-5.3
-.39
-1.2
Change in DOC (%)_
_264/m _
($I. 00/@al)
-.03
-.ii
-.14
-. 61
-.89
$3 96/m _
(sl. 50/9al)
-.03
-.09
-.12
-. 72
-. 96
Change i nFuel Bur ned
(%)
-.05
-1.37
-I. 42
*Includes performance and scaling effects.
TABLE 23
HIGHLY LOADED AXIAL COMPRESSOR - MISSION MERIT FACTOR RESULTS
50-Passenger Aircraft - 185.2 km (I00 nmi) Mission
Parameter
Engine Weight- kg (Ibm)
Engine Price - $i000
F_ngine Maintenance - $/h
Engine SFC* - %
TOTAL
Change
-2.9 (-6.5)
-6.6
-.49
-1.2
$264/m -_
($I. 00/gal)
-.03
-.i0
-.13
-.69
Change in DOC (%)_$396/m j
($I. 50/9ai )
-.04
-.08
-.Ii
-. 80
-.95
Merit Factor Tmpact
Change inFuel Rurned
(%)
-i. 03
-.06
-i. 46
*Includes performance and scaling effects.
51
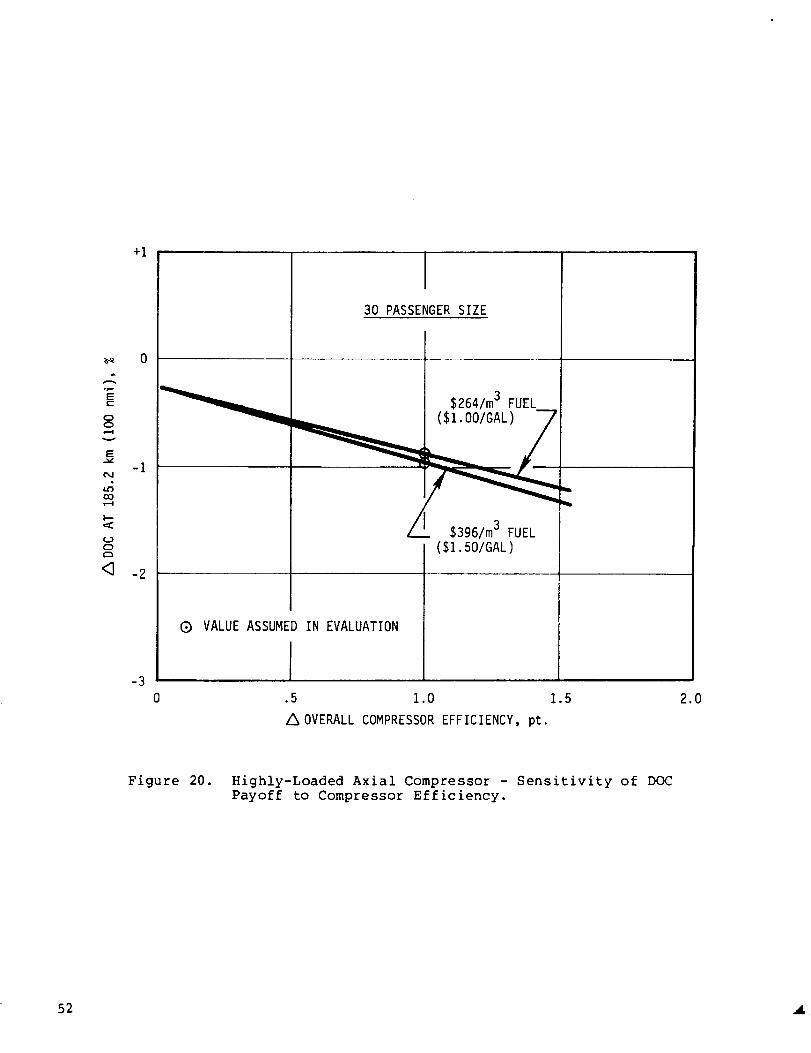
Ec-
OO
v
E
N
OO
I--
0
+1
-2
30 PASSENGER SIZE
$264/m3 FUEL
. $396/m3 FUEL
($1.501GAL)
C) VALUE ASSUMEDIN EVALUATION
.5 1.0 1.5
Z_ OVERALL COMPRESSOR EFFICIENCY, pt.
2.0
Figure 20. Highly-Loaded Axial Compressor - Sensitivity of DOC
Payoff to Compressor Efficiency.
52

ADVANCED TECHNOLOGY IDENT IF ICATION AND EVALUATION - Cont i nued
ADVANCED AERODYNAMIC D_IGN AND PERFORMANCE FEATUR_ - Continued
Multiblade Centrifuclal Compressor Impeller
The concept of a multiblade centrifugal compressor impeller consists of
splitting the energy input into two regions (inducer and impeller), which
permits greater flexibility in aerodynamic blade design. The inducer section,which is fashioned after axial compressor design technology, can more
efficiently handle the transonic flow than conventional continuous impellerblades. When the inducer blade is separate, the design can accommodate higher
spanwise twist gradients to better control blade loading and the passage
throat contour to avoid choking. This design concept permits the use of
higher inlet Mach numbers with satisfactory control of the flows along thesuction side of the blades to avoid separation. The successful execution of
the concept depends upon the development of three-dimensional, viscous flow
analysis computational methods which are not yet available. An illustration
of the design concept is shown in Figure 21 with a 34 bladed-design, the same
number being used in each blade row. The blades would probably be displacedcircumferentially for maxlmun advantage. A 1 to 2 point centrifugal stage
efficiency improvement has been estimated for the multiblade impeller
approach. The improved design estimate was made with a 4:1 pressure ratio
centrifugal stage. The 1 to 2 point centrifugal stage efficiency improvementresults in a 0.6 to 1.2 point improvement in the overall, axi-centrifugal
compressor efficiency. A nominal improvement of 0.9 point was asstmed.
The DOC and fuel burned benefits of the multiblade impeller are summarized in
Table 24 for the 30-passenger commuter turboprop. Owing to small weight and
price increases, the only benefits due to the multiblade impeller are derivedfrom the centrifugal impeller efficiency improvement. The sensitivity of the
result to variations in the compressor efficiency improvement is shown on
F igure 22.
TABLE 24
MULTIBLADE CENTRIFUGAL COMPRESSOR IMPELLER - MISSION MERIT FACTOR RESULTS
30-Passenger Aircraft- 185.2 km (I00 nmi) Mission
Parameter
Engine Weight - kg (ibm)
Engine Price - $i000
Engine Maintenance - $/h
Engine SFC* - %
TC_A L
Change
+.2 (+.4)
+.8
+.08
-I.I
Merit Factor ImpactCh@nge in D0C (%)_
$264/m _ $396/m j -
($i. 00/gal)
0
+. 02
+. 03
-.55
-. 50
($i. 50/_al)
0
+.01
+.03
-. _4
-. 60
Change i nFuel Burned
(%)
0
m
-1.23
-I. 23
*Includes performance and scaling effects.
53
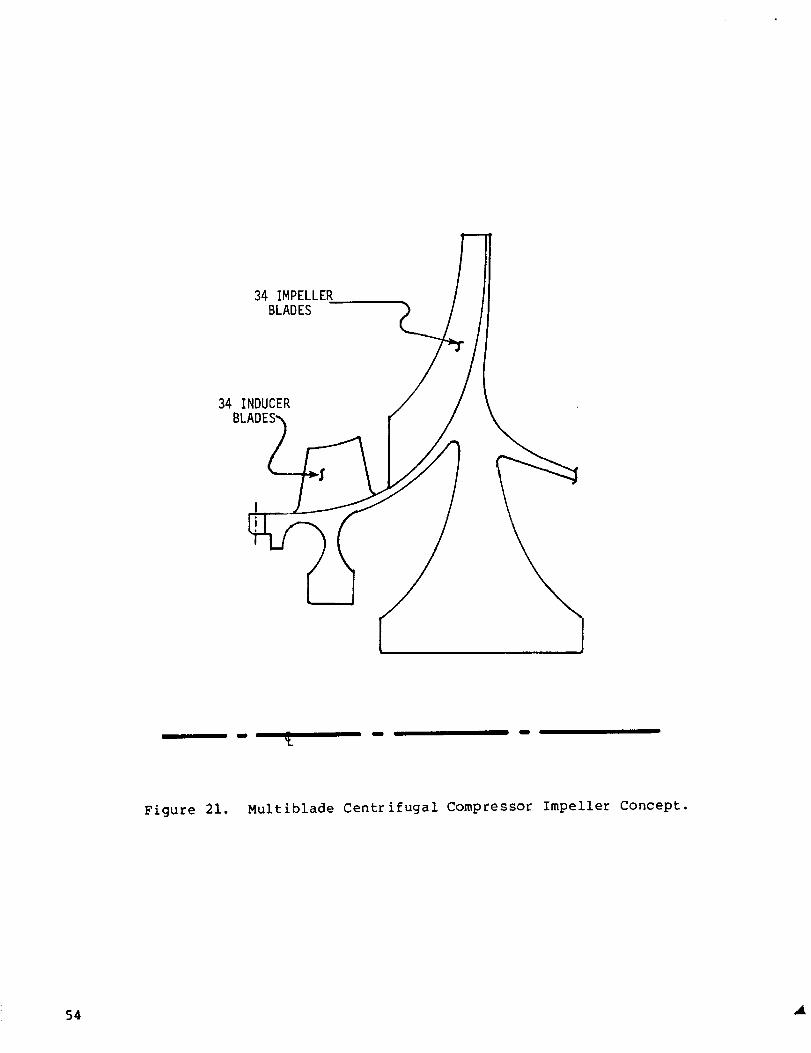
34 IMPELLERBLADES
34 INDUCER
I I
Figure 21. Multiblade Centrifugal Compressor Impeller Concept.
54

OO_-4v
E
cO
I--
0
+1
-1 L
-2
-30
I30 PASSENGERSIZE
$264/m3 FUEL___.
__ ($1.00/GAL)
$396/m 3 FUEL
($I. 50/GAL)
Q VALUE ASSUMEDIN EVALUATION
I.5 1.0 1.5
_OVERALL COMPRESSOREFFICIENCY, pt.
2.0
Figure 22. Multiblade Centrifugal Compressor Impeller-Sensitivity
of DOC Payoff to Compressor Efficiency.
55
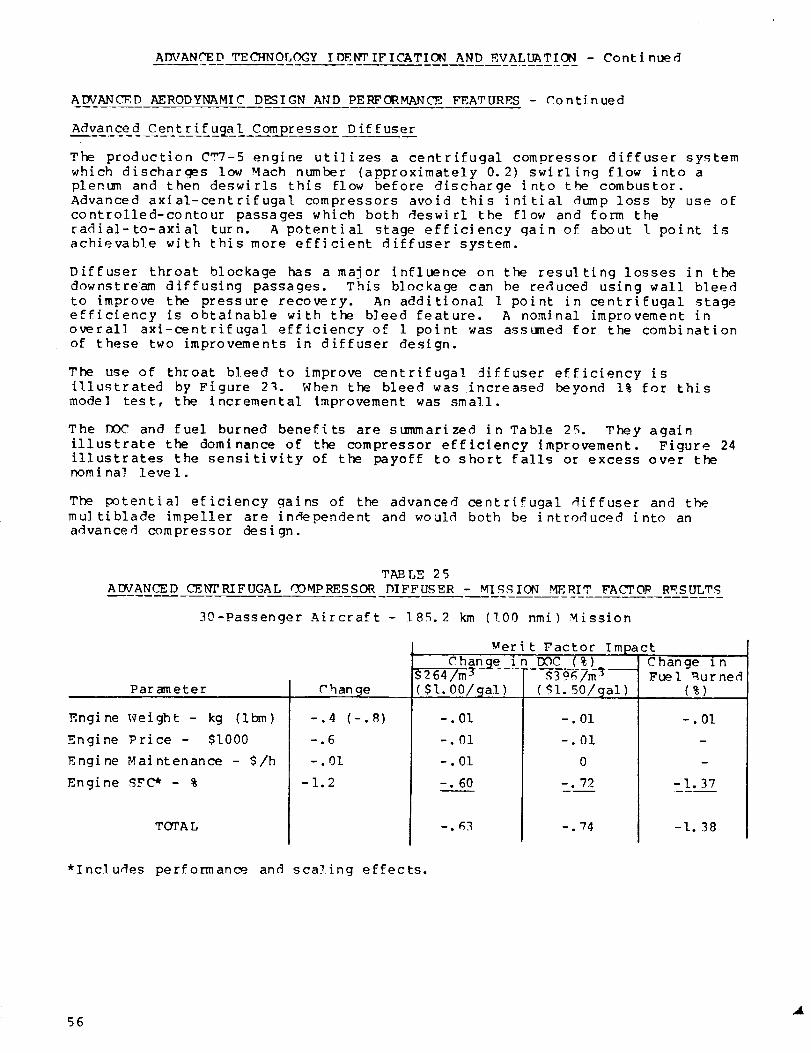
ADVANCED TECHNOLOGY IDENTIFICATION AND EVALUATION - Continued
ADVANCED AERODYNAMIC DESIGN AND PERFORMANCE FEATURES - Continued
Advanced Cent r[fuHa! Compressor Diffuser
The production C"_7-5 engine utilizes a centrifugal compressor diffuser system
which discharges low Mach number (approximately 0.2) swirling flow into a
plenum and then deswirls this flow before discharge into the combustor.
Advanced axial-centrifugal compressors avoid this initial dump loss by use ofcontrolled-contour passages which both deswirl the flow and form the
radial-to-axial turn. A potential stage efficiency gain of about 1 point is
achievable with this more efficient diffuser system.
Diffuser throat blockage has a major influence on the resulting losses in the
downstream aif_using passages. This blockage can be reduced using wall bleed
to improve the pressure recovery. An additional 1 point in centrifugal stage
efficiency is obtainable with the bleed feature. A nominal improvement inoverall axi-centrifugal efficiency of 1 point was assumed for the combination
of these two improvements in diffuser design.
The use of throat bleed to improve centrifugal diffuser e_ficiency is
illustrated by Figure 2_. When the bleed was increased beyond 1% for this
mode] test, the incremental improvement was small.
The DOC and fuel burned benefits are summarized in Table 25. They again
illustrate the dominance of the compressor efficiency improvement. Figure 24illustrates the sensitivity of the payoff to short falls or excess over thenominal level.
The potential eficiency gains of the advanced centrifugal ,@iffuser and the
multiblaae impeller are inc]ependent and would both be introduced into an
advanced compressor design.
TAB LE 2 5
ADVANCED CENTRIFUGAL ,COMPRESSOR DIFFUSER - MISSION MERIT FACTOP RESULTS
30-Passenger Aircraft - 185.2 km (100 nmi) Mission
Parameter
Engine Weight - kg (Ibm)
Engine Price - $1000
Engine Maintenance - $/h
Engine SFC* - %
TOTA L
Change
-.4 (-.S)
--.6
-.01
-1.2
Merit Factor Impact
Change in DOC (%) I_264/m 3 -- _39_7m 3------ Fuel ,_urned
( $I. 00/gal)
-. 01
-.01
-. 01
-. 60
-._3
(gl. 50/gal)
-. 01
-.01
0
-. 72
-. 74
Change i n
(%)
-. 01
-1.37
-I. 38
*Includes performance and scaling effects.
56

l--Zl.JJ
C.)
LLL_0
L_
0_
L_
LLIn,-(3-
I--
I--
ZW
I.I
<_
.82
.80
.78
/.76 f
.74
.72
2.0
1.5
1.0
.5
0 0.5 1.0 1.5 2.0
PERCENT THROAT BLEED
2.5 3.0
0
/
/0 0.5 1.0 1.5 2.0 2.5 3.0
PERCENT THROAT BLEED
Figure 23. Diffuser Blow Test Results.
57
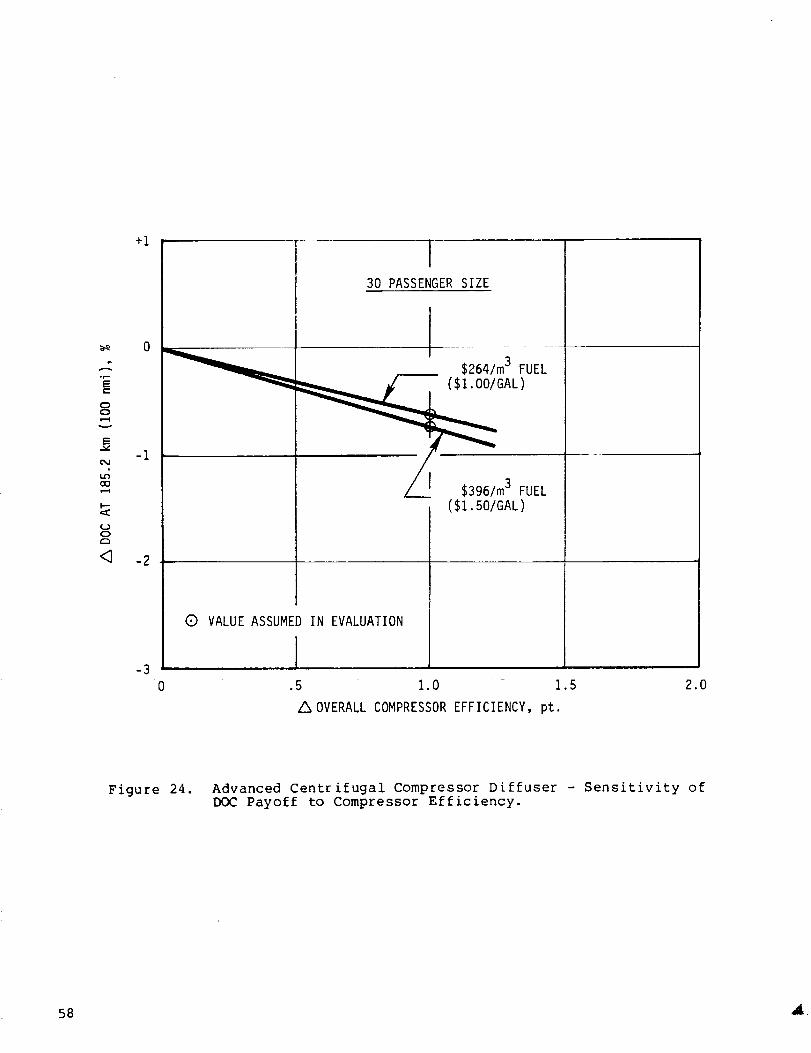
+1
Ec-
O0
v
LC_
CO
F--
0
-I
-2
-3
30 PASSENGERSIZE
' _m FUEL
($I. 50/GAL)
Q VALUE ASSUMEDIN EVALUATION
0 .5 1.0 1.5
A OVERALL COMPRESSOREFFICIENCY, pt.
2.0
Figure 24. Advanced Centrifugal Compressor Diffuser - Sensitivity ofDOC Payoff to Compressor Efficiency.
58
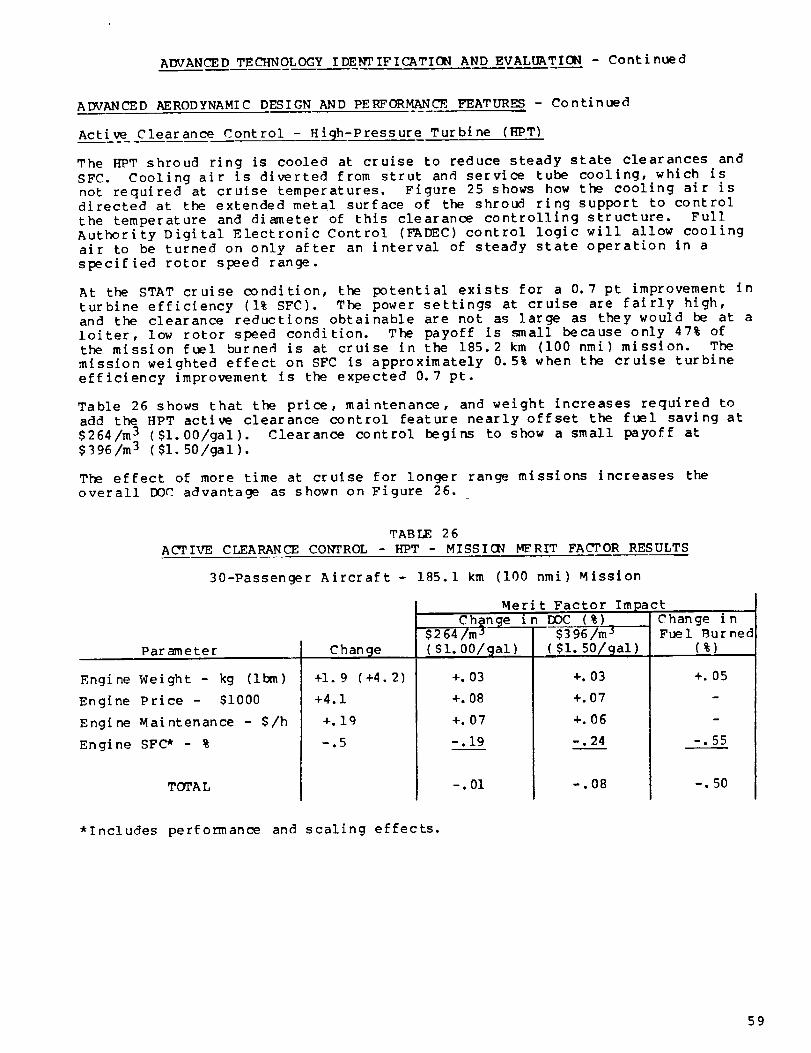
ADVANCED TECHNOLOGY IDENTIFICATION AND EVALUATION - Continued
ADVANCED AERODYNAMIC DESIGN AND PERFORMANCE FEATURES - Continued
Active Clearance Control - High-Pressure Turbine (HPT)
The HPT shroud ring is cooled at cruise to reduce steady state clearances and
SFC. Cooling air is diverted from strut and service tube cooling, which isnot required at cruise temperatures. Figure 25 shows how the cooling air isdirected at the extended metal surface of the shroud ring support to control
the temperature and diameter of this clearance controlling structure. FullAuthority Digital Electronic Control (FADEC) control logic will allow cooling
air to be turned on only after an interval of steady state operation in a
specified rotor speed range.
At the STAT cruise condition, the potential exists for a 0.7 pt improvement in
turbine efficiency (1% SFC). The power settings at cruise are fairly high,and the clearance reductions obtainable are not as large as they would be at a
loiter, low rotor speed condition. The payoff is small because only 47% of
the mission fuel burned is at cruise in the 185.2 km (100 nmi) mission. The
mission weighted effect on SFC is approximately 0.5% when the cruise turbine
efficiency improvement is the expected 0.7 pt.
Table 26 shows that the price, maintenance, and weight increases required toadd the HPT active clearance control feature nearly offset the fuel saving at
$264/m 3 ($1.00/gal). Clearance control begins to show a small payoff at
$396/m j ($i. 50/gal).
The effect of more time at cruise for longer range missions increases the
overall DOC advantage as shown on Figure 26.
TABLE 26
ACTIVE CLEARANCE CONTROL - HPT - MISSIGN MERIT FACTOR RESULTS
30-Passenger Aircraft- 185.1 km (i00 nmi) Mission
Parameter
Engine Weight - kg (ibm)
Engine Price - $i000
Engine Maintenance - $/h
Engine SFC* - %
TOTAL
Change
+I. 9 (+4.2)
+4.1
+.Ig
--.5
Merit Factor Impact
Ch@n e_ge__i_n DOC (%)$2 64/m j $3 96/m 3
($I. 00/@al)
+.03
+.08
+. 07
-.19
-.01
($1.50/_al)
+.03
+.07
+.06
-.24
-.08
Change i nFuel Burned
(%)
+.05
-.55
-. 50
*Includes performance and scaling effects.
59
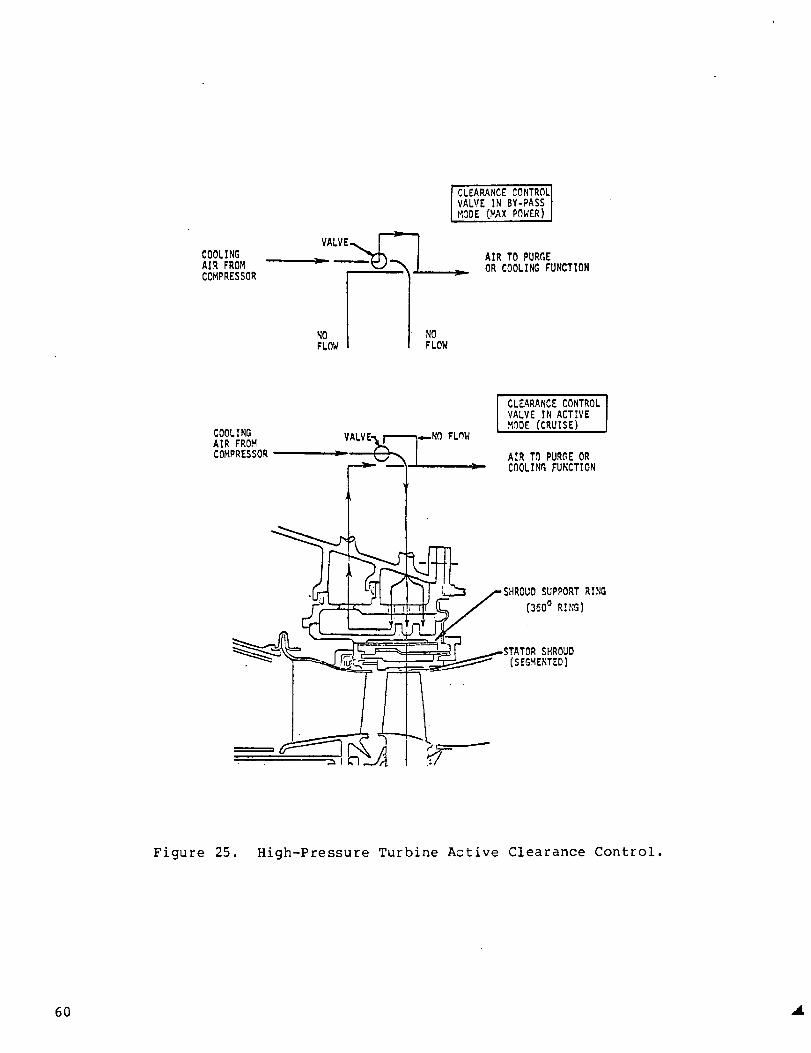
COOLINGAIR FROMCOMPRESSOR
NOFLOW
CLEAP,ANCE CONTRnLiVALVE IN BY-PASS
MODE (MAX POWER)
AIR TO PURGEOR COOLING FUNCTION
NOFLOW
SUPPORT RING'C {360° RINS)
SHROUD(SEGMENTED)
Figure 25. High-Pressure Turbine Active Clearance Control.
60
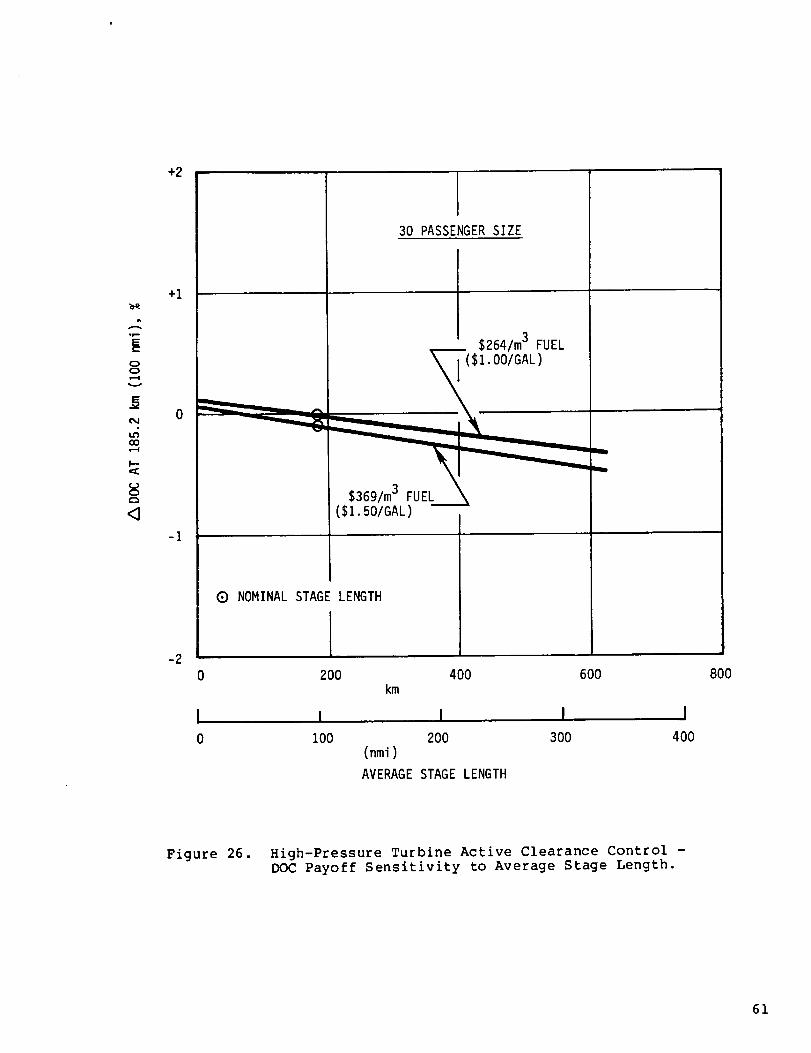
+2
OO
o4
O0r-4
r_
+1
-I
30 PASSENGER SIZE
($1.501GAL)
0 NOMINAL STAGE LENGTH
-2
0 200 400km
I I I I
0 100 200 300(nmi)
AVERAGE STAGE LENGTH
600
I
400
8OO
Figure 26. High-Pressure Turbine Active Clearance Control -DOC Payoff Sensitivity to Average Stage Length.
61

ADVANCED TECHNOLOGY IDENTIFICATION AND EVALUATION - Continued
ADVANCED AERODYNAMIC DESIGN AND PERFORMANCE FEATURFS - Continued
Compressor Stall Margin Reduction via Closed-Loop Acceleration Control
The use of a Full Authority Digital Electronic Control (FADF,C) is asstrned
highly probable for an advanced turboprop engine in the late 1980's. This
technology item explores one of the systems utilization modes of the FADEC.
Specifically, it is proposed, by the addition of a sensing system to measure
compressor discharge Mach number (M3), to schedule acceleration fuel as afunction of M3 on a closed loop basis. The details of the design require
extensive system analysis and engine test data before the anticipated payoff
can be established. However, it is expected that this acceleration fuel
scheduling logic will have the potential of a 5% part speed stall margin
reduction by reducing allowances for some of the variables which enter intothe stall margin stack-up calculation. It is proposed to trade off this part
speed stall margin requirement reduction into an improvement in compressor
efficiency within a range of speeds corresponding to significant power usage
(at the design conditions and generally in the high power range). Figure 27
illustrates the trade off on a schematic compressor map. The compressor
efficiency contours for the compressor designed for reduced stall marginrequirements would be improved in level at high speed. This effect is not
shown in Figure 27. Only the downward shift in part speed stall margin is
shown. The operating lines for the base compressor and the compressordesigned for lower stall margin would be identical.
The benefit analysis results are based on adding the cost of the additional
sensor only. The basic FADEC is asstrned to be part of the advanced engine.
Table 27 illustrates some net DOC and fuel-burned advantage to this system.
If there is any substantial shortfall in the nominal _. 5 pt compressorefficiency gain, the net DOC benefit would be cancelled out as evident From
Figure 28.
TABLE 27
CLOSF_D-LOOP ACCF, LERAmION CONTROL - MISSION MERIT FACTOR RESULTS
Parameter
30-Passenger Aircraft- 185.1 km (I00 nmi) Mission
Engine Weight - kg (Ibm)
Engine Price - $I000
Engine Maintenance - $/h
Engine SFC* - %
Change
+._ (+.6)
+4.6
+.22
--.6
TOTA L
Merit Factor ImpactChanqg_e__in DOC ( %)
S264/m _ S396/m 3----
($I.00/9ai)
0
+.09
_.08
-.30
-.13
(Sl. 50/@al)
0
+. 08
+.07
-.35
-._0
Change i nFuel gut ned
(%)
+. 01
-.69
-.68
*Includes performance and scaling effects.
62
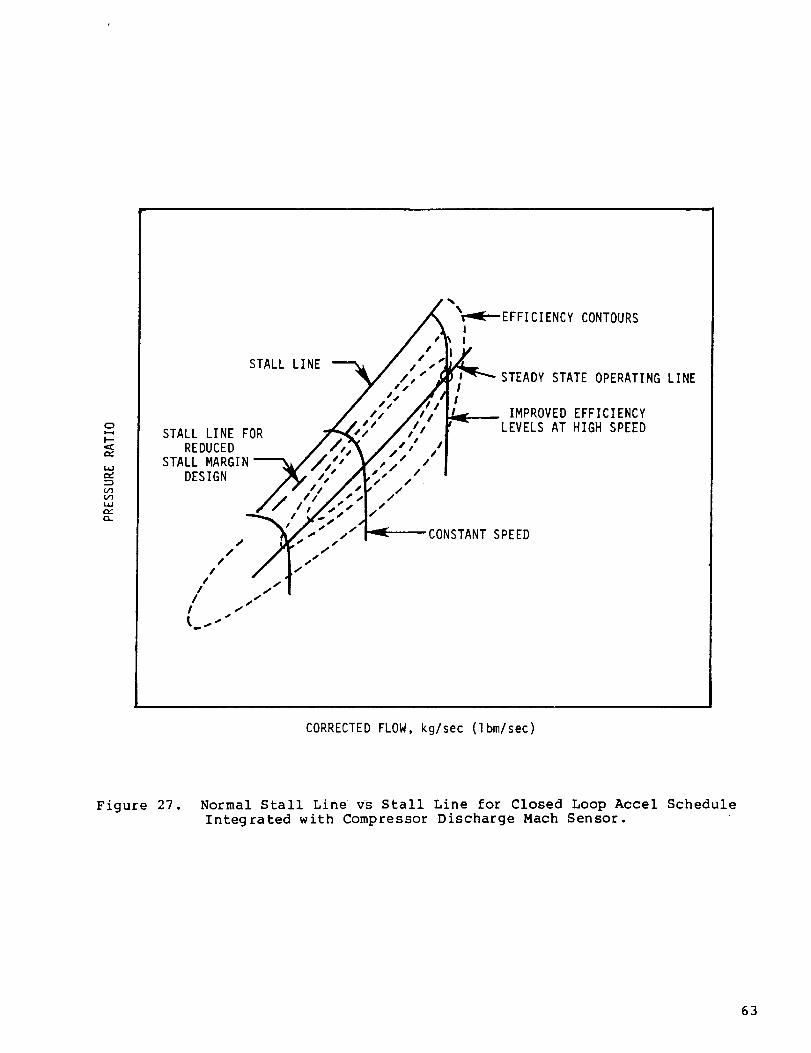
0
we,,"
cz'}
,m,.-
STALL LINE
STALL LINE FORREDUCED
STALL MARGINDESIGN
%
_-9{-'--EFFICIENCY CONTOURSI
I
STEADY STATE OPERATING LINE
IMPROVED EFFICIENCYLEVELS AT HIGH SPEED
CONSTANT SPEED
CORRECTED FLOW, kg/sec (Ibm/sec)
Figure 27. Normal Stall Line vs Stall Line for Closed Loop Accel ScheduleIntegrated with Compressor Discharge Mach Sensor.
63
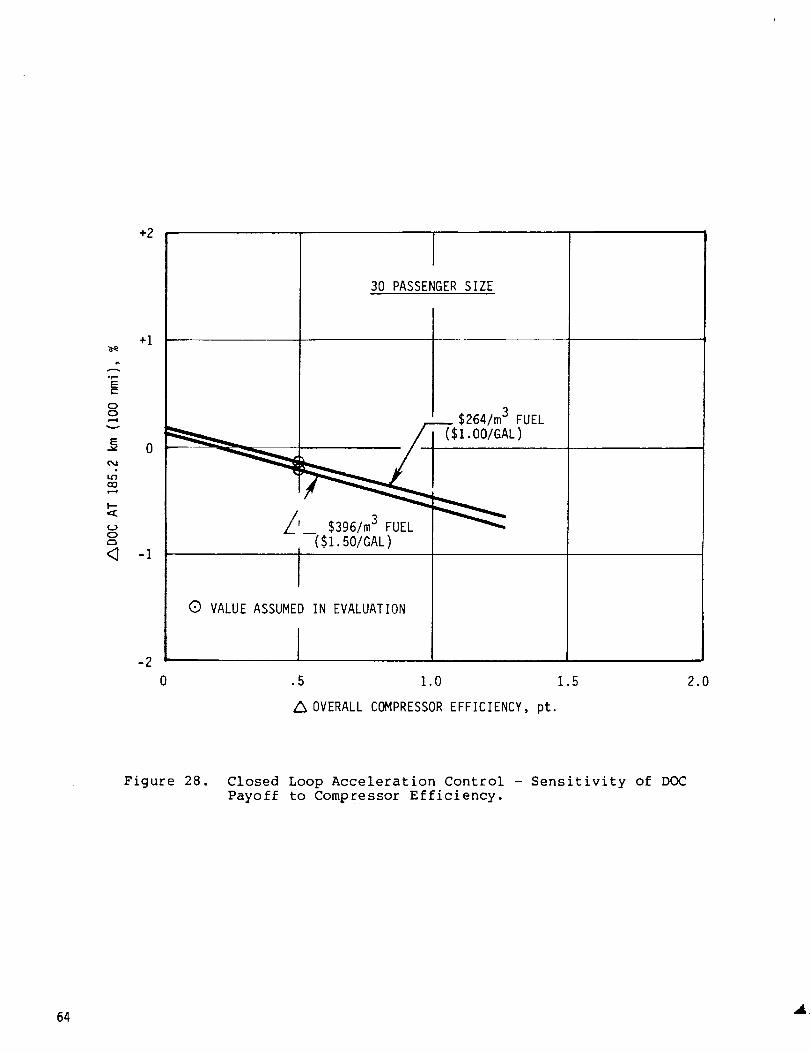
+2
"E
00
CO
00
+1
-1
-2
30 PASSENGERSIZE
$264/m 3 FUEL
($i. 50/GAL)I
I0 VALUE ASSUMEDIN EVALUATION
0 .5 1.0 1.5
OVERALL COMPRESSOREFFICIENCY, pt.
2.0
Figure 28. Closed Loop Acceleration Control - Sensitivity of DOCPayoff to Compressor Efficiency.
64
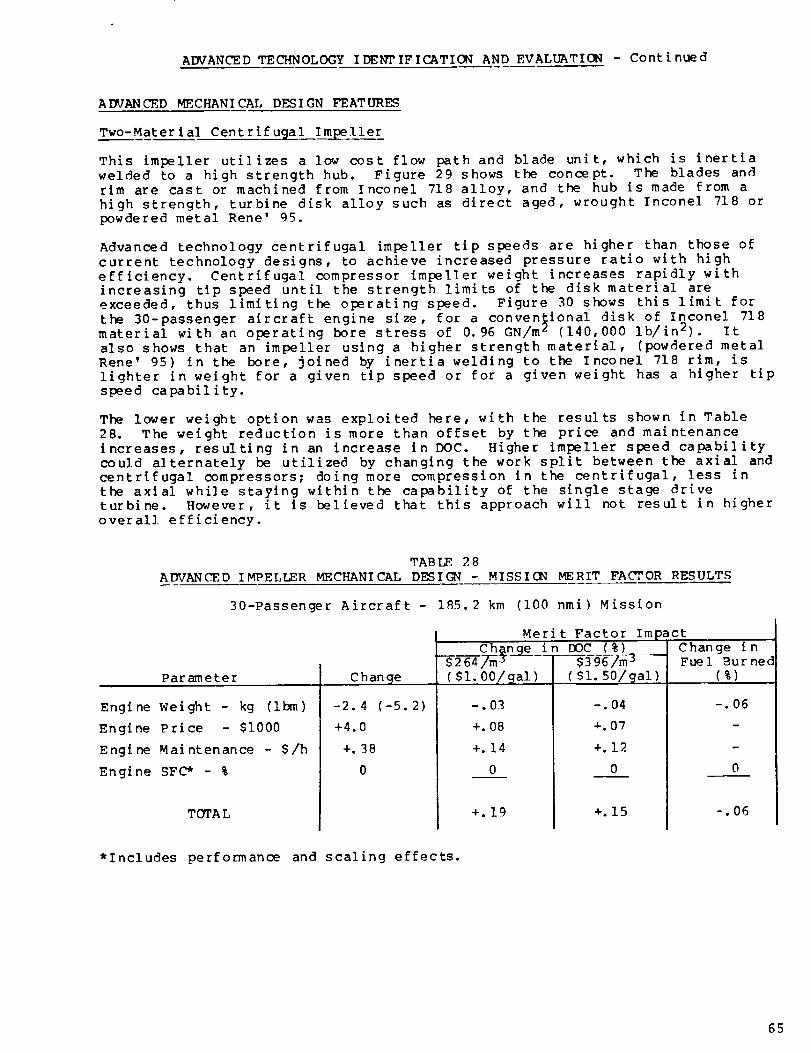
ADVANCED TECHNOLOGY IDENTIFICATION AND EVALUATION - Conti nued
ADVANCED MECHANICAL DESIGN FEATURES
Two-Mater ial Cent rif u@al___Im___ll___er
This impeller uti] izes a low cost flow path and blade unit, which is inertia
welded to a high strength hub. Figure 29 shows the concept. The blades andrim are cast or machined from Inconel 718 alloy, and the hub is made from a
high strength, turbine disk alloy such as direct aged, wrought Inconel 718 or
powdered metal Rene' g5.
Advanced technology centrifugal impeller tip speeds are higher than those of
current technology designs, to achieve increased pressure ratio with high
efficiency. Centrifugal compressor impeller weight increases rapidly withincreasing tip speed until the strength limits of the disk material are
exceeded, thus limiting the operating speed. Figure 30 shows this limit for
the 30-passenger aircraft engine size, for a conventional disk of Inconel 718material with an operating bore stress of 0.96 GN/m z (140,000 Ib/in2). It
also shows that an impeller using a higher strength material, (powdered metalRene' 95) in the bore, joined by inertia welding to the Inconel 718 rim, is
lighter in weight for a given tip speed or for a given weight has a higher tip
speed capability.
The lower weight option was exploited here, with the results shown in Table
28. The weight reduction is more than offset by the price and maintenanceincreases, resulting in an increase in DOC. Higher impeller speed capability
could alternately be utilized by changing the work split between the axial and
centrifugal compressors; doing more compression in the centrifugal, less inthe axial while staying within the capability of the single stage drive
turbine. However, it is believed that this approach will not result in higher
overall efficiency.
TAB LE 2 8
ADVANCED IMPELLER MECHANICAL DESIGN - MISSION MERIT FACTOR RESULTS
30-Passenger Aircraft- 185.2 km (i00 nmi) Mission
Parameter
Engine Weight - kg (Ibm)
Engine Price - Sl000
Engine Maintenance - $/h
Engine SFC* - %
TOTA L
Merit Factor Impact
Ch_ng__ i n DOC (%).____$ 2 64/m 5 -- $-396/m-3-_
Change
-2.4 (-5.2)
+4.0
+.38
0
($1.00/qal)
-.03
+.08
+.14
0
+.19
($1.50/_al)
-.04
+.07
+.12
0
+.15
Change i nFuel Burned
(%)
-.06
0
-.06
*Includes performance and scaling effects.
65
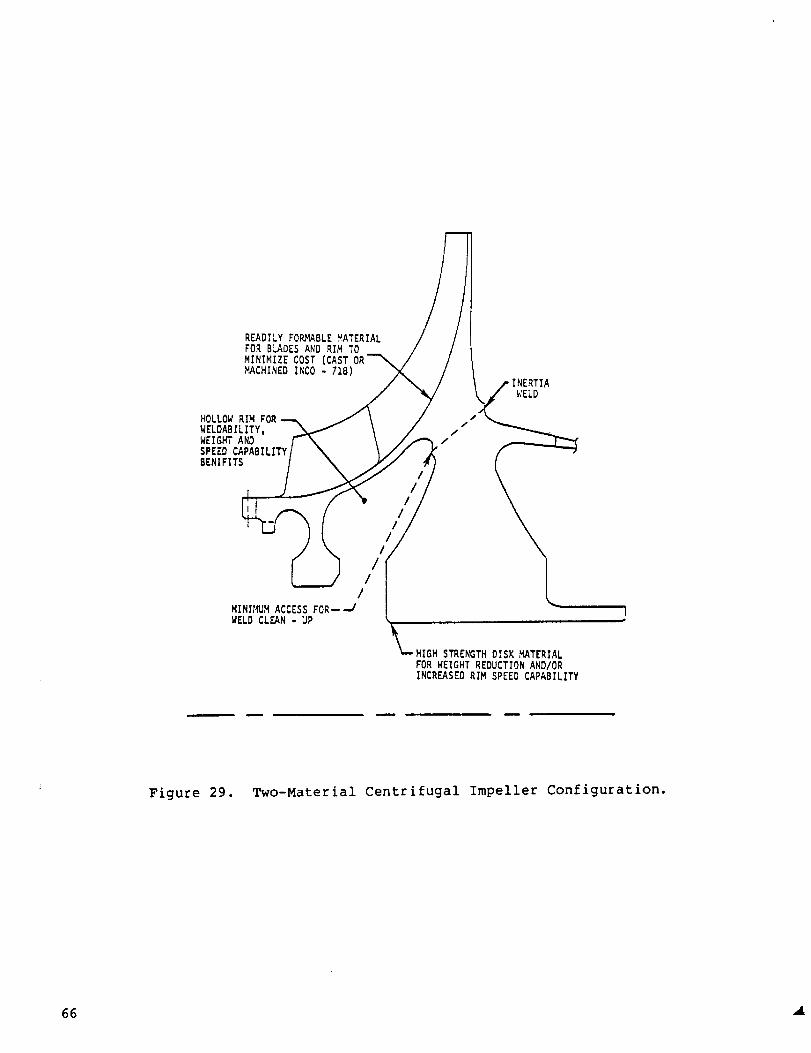
READILY FO_BLE _ATERIALFOR BLADES AND RIM TOMINIMIZE COST (CAST,MACHINEDINCO - 718)
HOLLOW RIM FORWELDABILITY,WEIGHT ANDSPEED CAPABILITYBENIFITS
/I///
/
///
MINII_M ACCESS FOR--JWELD CLEAN - UP
HIGH S_ENGTH DISK MATERIALFOR WEIGHT REDUCTION AND/ORINCREASED RIM SPEED CAPABILITY
Figure 29. Two-Material Centrifugal Impeller Configuration.
66
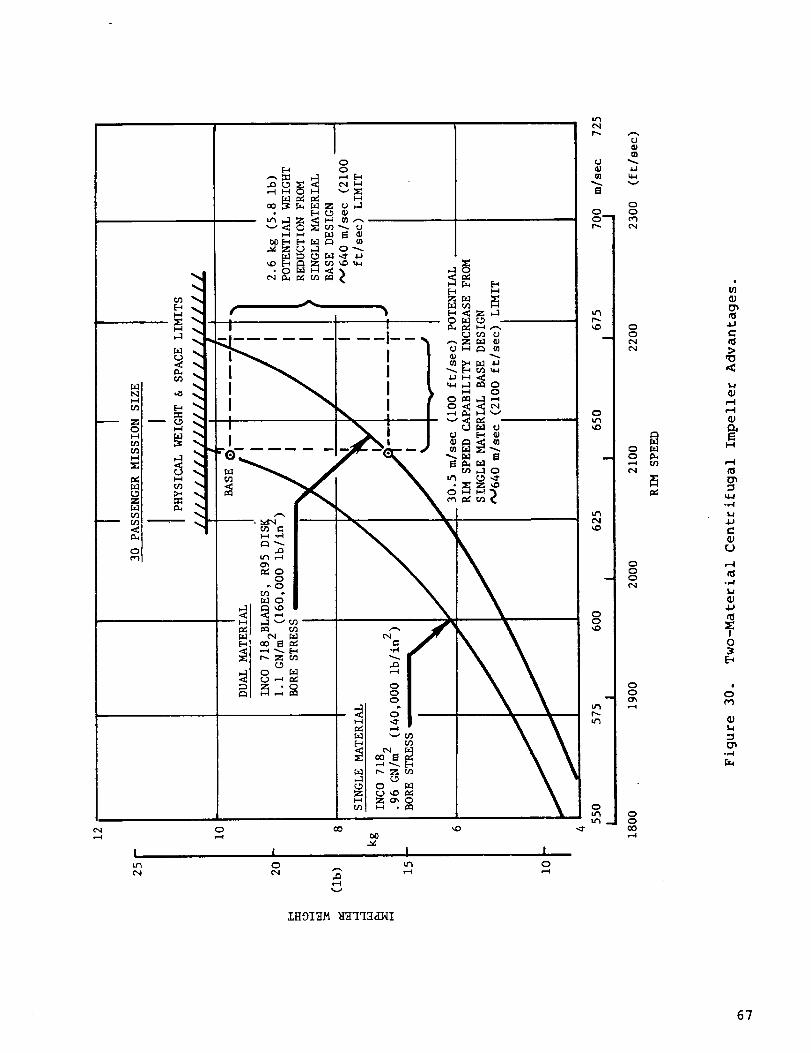
N
ILm
I0
0
v
0
I f o
! \ I "._ _ _
I . I _:_
I _, ®_
M 0
_ F,_
_8_
0
I0
o
_0
b_
I I
r_
¢.IllJm
S
0
m
.1.1
v
00
cq
00
m,l
0
0
00
0
0
0
.-.4
00
_0,--I
_J
4.1
C
>n_
t,.l
lUr-i
i-i
_a
4.J
CaJ
,--I
-l.J
I0
1.4
-,-I
IHOIHM _qq_U41
67
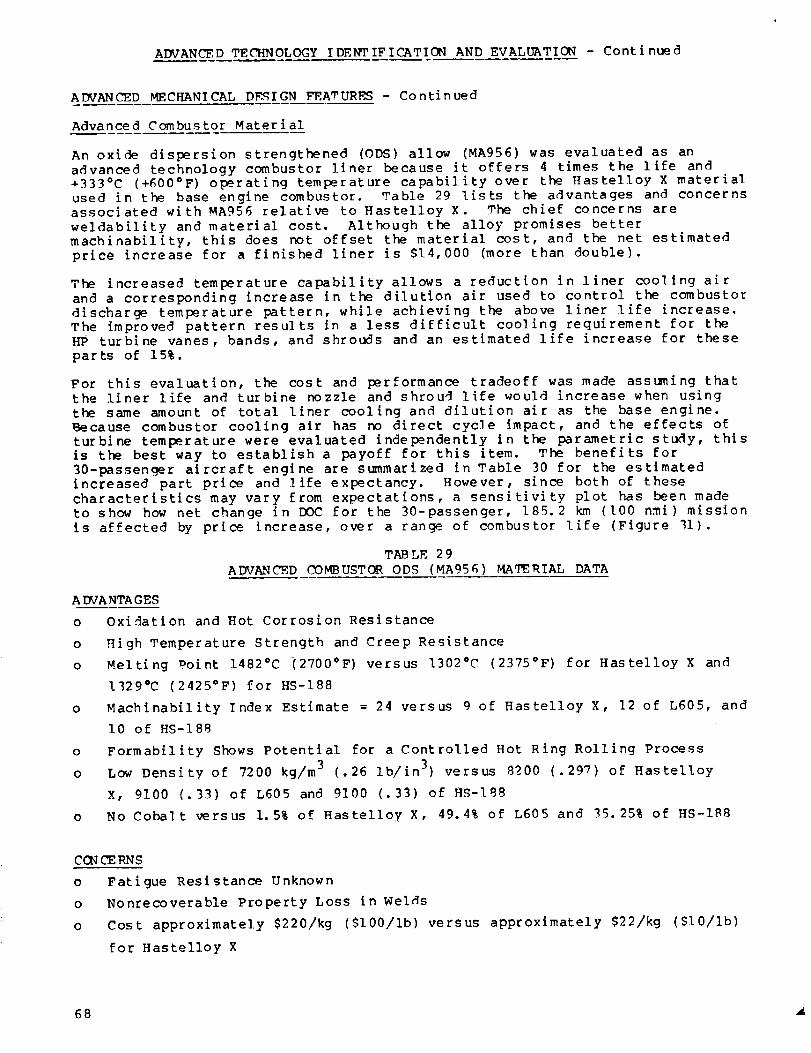
ADVANCED TECHNOLOGY IDENTIFICATION AND EVALUATION - Continued
ADVANCED MECHANICAL DFSIGN FEATURF.S - Continued
Advanced Combustor Material
An oxide dispersion strengthened (ODS) allow (MA956) was evaluated as an
advanced technology combustor liner because it offers 4 times the life and
+333°C (+600°F) operating temperature capability over the Hastelloy X material
used in the base engine combustor. Table 29 lists the advantages and concerns
associated with MA956 relative to Hastelloy X. ,'he chief concerns are
weldability and material cost. Although the alloy promises better
machinability, this does not offset the material cost, and the net estimated
price increase for a finished liner is $14,000 (more than double).
The increased temperature capability allows a reduction in liner cooling air
and a corresponding increase in the dilution air used to control the combustor
discharge temperature pattern, while achieving the above liner life increase.
The improved pattern results in a less difficult cooling requirement for the
HP turbine vanes, bands, and shrouds and an estimated life increase for these
parts of 15%.
For this evaluation, the cost and performance tradeoff was made assuming that
the liner life and turbine nozzle and shroud life would increase when using
the same amount of total liner cooling and dilution air as the base engine.
1_e.cause combustor cooling air has no direct cycle impact, and the effects of
turbine temperature were evaluated independently in the parametric study, this
is the best way to establish a payoff for this item. The benefits for
_0-passenger aircraft engine are summarized in Table 30 for the estimated
increased part price and life expectancy. However, since both of these
characteristics may vary from expectations, a sensitivity plot has been made
to show how net change in DOC for the 30-passenger, 185.2 km (I00 nmi) mission
is affected by price increase, over a range_ of combustor life (Figure gl).
TABLE 29
ADVANCED COMBUSTOR OD,g (MA956) MATERIAL DATA
A DVA NTA G E S
o Oxidation and Hot Corrosion Resistance
o High Temperature Strength and Creep Resistance
o Melting Point 1482°C (2700°F) versus 1302°C (2375°F) for Hastelloy X and
1329°C (2425°F) for HS-188
o Machinability Index Estimate = 24 versus 9 of Hastelloy X, 12 of L605, and
i0 of HS-188
o Formability Shows Potential for a Controlled Hot Ring Rolling Process
o Low Density of 7200 kg/m 3 (.26 ib/in 3) versus 8200 (.297) of Hastelloy
X, 9100 (.33) of L605 and 9100 (.33) of HS-188
o No Cobalt %_rsus 1.5% of Hastelloy X, 49.4% of L605 and 95.25% of HS-188
CON CE RNS
o Fatigue Resistance Unknown
o Nonrecoverable Property Loss in Welds
o Cost approximately $220/kg ($100/ib) versus approximately $22/kg ($10/ib)
for Hastelloy X
68
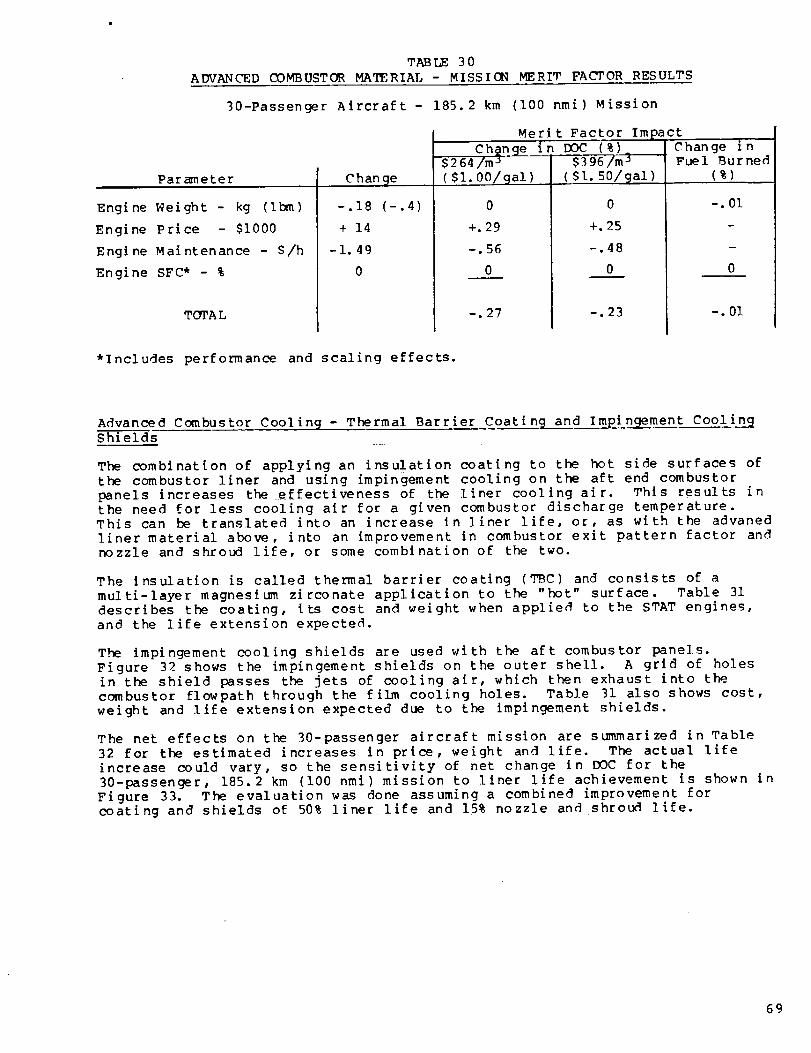
TABLE 30
ADVANCED COMBUSTOR MATERIAL - MISSION MERIT FACTOR RESULTS
Parameter
90-Passenger Aircraft - 185.2 km (100 nmi) Mission
Merit Factor Impact
Engine Weight - kg (Ibm)
Engine Price - $i000
Engine Maintenance - $/h
Engine SFC* - %
Change
-.18 (-.4)
+ 14
-1.49
0
TOTAL
Change in DOC (%)_
-$264/m j
( $i. 00/gal)
0
+.29
-.56
0
-.27
$3 96/m J
( $I. 50/gal)
0
+.25
-.48
0
-.23
Change inFuel Burned
(%)
-.01
m
0
-. 01
*Includes performance and scaling effects.
Advanced Combustor Coolin@- Thermal Barrier Coating and Impingement Cooling
Shields
The combination of applying an insulation coating to the hot side surfaces of
the combustor liner and using impingement cooling on the aft end combustor
panels increases the effectiveness of the liner cooling air. This results in
the need for less cooling air for a given combustor discharge temperature.This can be translated into an increase in liner life, or, as with the advaned
liner material above, into an improvement in combustor exit pattern factor and
nozzle and shroud life, or some combination of the two.
The insulation is called thermal barrier coating (TBC) and consists of a
multi-layer magnesium zirconate application to the "hot" surface. Table 31describes the coating, its cost and weight when applied to the STAT engines,
and the life extension expected.
The impingement cooling shields are used with the aft combustor panels.
Figure 32 shows the impingement shields on the outer shell. A grid of holes
in the shield passes the jets of cooling air, which then exhaust into thecombustor flowpath through the film cooling holes. Table 31 also shows cost,
weight and life extension expected due to the impingement shields.
The net effects on the 30-passenger aircraft mission are summarized in Table
32 for the estimated increases in price, weight and life. The actual life
increase could vary, so the sensitivity of net change in DOC for the
30-passenger, 185.2 km (I00 nmi) mission to liner life achievement is shown in
Figure 33. The evaluation was done assuming a combined improvement for
coating and shields of 50% liner life and 15% nozzle and shroud life.
69

+2
OO
v
¢q
00
O
+i
-!
30 PASSENGER SIZE - $264/m 3 ($1.00/GAL_ FUEL
__ . $14000 INITIAL PRICE INCREASE [
$7000 INITIAL PRICE INCREASE
(_)VALUE ASSUMED IN EVALUATION
5,000 I0,000 15,000 20,000
COMBUSTOR LIFE, hr
Figure 31. Advanced Combustor Material - DOC Payoff Sensitivity toCombustor Life and Price Increase.
70

TABLE31ADVANCEDCOMBUSTORCOOLING
THERMAL BARRIER COATING AND IMPIN_MENT COOLING SHIELDS
THERMAL BARRIER COATING
o 3-Ply Magnesi_ Zirconate (Mg Zr) Process
Material
.
2.3.
Cost:
Weight:
Life:
o
o
o
METCO 450 Base
METCO 450 Plus Mg Zr Blend
Mg Zr
+$300 per unit
+.73 kg (+1.6 Ibm)
Thickness- cm (in.)
.008-.013 (.003-.005)
.008-.013 (.003-.005)
.013-.018 (.005-.007)
Total Thickness
.028-. 043 cm
(.011-.017 in.)
1.5X for liner or 1.15X for nozzle and shrouds via reduced liner
metal temps or improved dilution (reduced pattern factor).
IMPINGEMJ_NT COOLING SHIELDS
o Ref: F404 Aft Outer Panels
o Cost: +500 per Unit
o Weight: +.23 kg (+.5 ibm)
o Life: 1.25X for liner and 1.05 to 1.10 for nozzles and shrouds.
TABLE 32
ADVANCED COMBUSTOR COOLING - MISSION MERIT FACTOP RESULTS
30-Passenger Aircraft - 185.2 km (i00 nmi) Mission
Parameter
Engine Weight - kg (ibm)
Engine Price - $I000
Engine Maintenance - $/h
Engine SFC* - %
_OTA L
Chan@e
+.4 (+.8)
+1.0
-.88
0
Merit Factor ImpactCh@nge in DOC (%)_
$3 96/m i
( $I. 00/gal)
+. 01
+. 02
-.33
0
-.30
($I. 50/gal)
+. 01
+. 02
-.28
0
-.25
Change i nFuel Burned
(%)
+. 01
0
+.DI
*Inc]udes performance and scaling effects.
71

/_ IMP INGEMENT
IELD
o_ _ __i_OF COMBUSTOR l
HIGH PRESSURE
TURBINE NOZZLE
Figure 32. Advanced Combustor Impingement Cooling Shield.
72
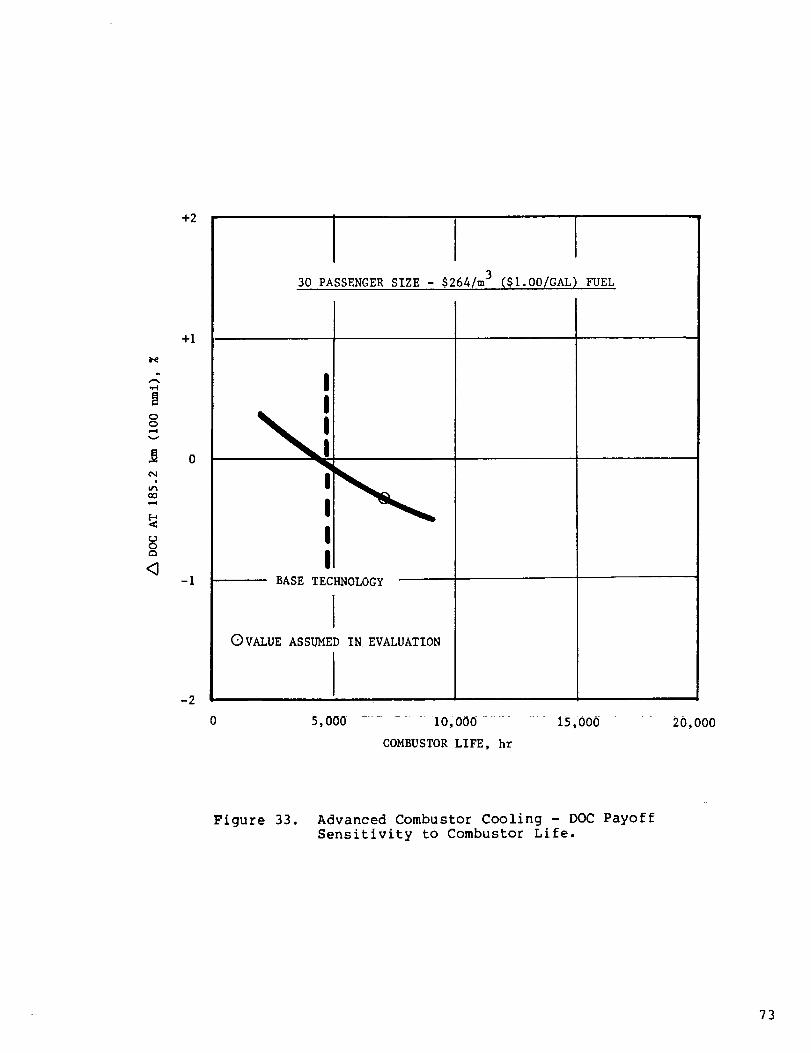
OO
v
O0
<3
+2
+i
-I
-2
30 PASSENGER SIZE - $264/m 3 ($1.00/GAL) FUEL
!
!
!BASE TECHNOLOGY
OVALUE ASSUMED IN EVALUATION
5,000 I0,000
COMBUSTOR LIFE, hr
15,000 20,0O0
Figure 33. Advanced Combustor Cooling - DOC Payoff
Sensitivity to Combustor Life.
73
AF)VANCEDTECHNOLOGYIDENTIFICATIONANDEVALUATION- Continued
ADVANCEDMECHANICALDESIGNFEATURES - Continued
Advanced Material High-Pressure Turbine Blade
Metal turbine blades in engines where turbine rotor inlet temperature (T41)
exceeds I093°C (2000°F) require air cooling which penalizes the cycle,
reducing power available and increasing SFC. As Tdl increases, more cooling
air is required. This technology evaluation is for materials which operate at
higher temperatures than in the base engine, and thus require less coolingair. The materials considered were:
Mater i al s
Rene ' 125
Rene' 1 50
Mo no-Cr ys t al
D irectionally Sol idifed
Eutectic Alloy
Bulk Temperature
Capability
Base
+36°C (+65 °F)+47°C (+85°F)
+92°C (+165 °F)
Chan@e in Cooling Flow (% W2)*T41
1260°C (2300°F)
0
--.6
--°7
-1.2
T41
1371°C (2500°F)
+1.9
+.8+.6
-.I
*Baseline cooling configuration.
The evaluation of the effect on DOC for the mono-crystal material relative to
the base is presented in Tables 33-34. Results for Rene' 125 and mono-crystalblades of the baseline, radial hole, convection cooling configuration are
shown at two levels of Tdl for the 30-passenger engine size. The benefits in
reduced cooling flow and improved SFC increase with temperature, but are
outweighed by the higher cost and maintenance of the advanced material. (The
trade between performance and costs was even more unfavorable for the othertwo materials.)
Advanced Cool inc/ Technolog_t_z_i_@h-Pressure Turbi ne Blade
An additional HP turbine blade evaluation using the base material, but with a
more effective cooling configuration, was made. In this case, the blade is
cooled by a combination of convection, impingement and film techniques. This
"cold bridge" cooling configuration has a series of passages which impinge
flow on the leading edge. This flow then exits the blade through film cooling
holes into the hot gas flowpath. The rest of the blade is cooled byconvection through radial holes. Tables 35-36 show the effect on DOC for
engines operating at 1371°C (2500°F) T41. The advanced cooling system shows
an increasing reduction in DOC for the larger engine and with higher price
fuel. Figure 34 shows the sensitivity of the effect on DOC to blade cost.
After the 50-passenger advanced engine cycle was selected at 1316°C (2400°F)
Tdl, the evaluation was repeated for this item at 1316°C (2400°F_ resultingchanges in DOC of +0.2% and 0% at S264/m 3 ($1.00/gal) and $396/m _
($1.50/gal) fuel costs, respectively, and a fuel burn saving of 1%.
in
74
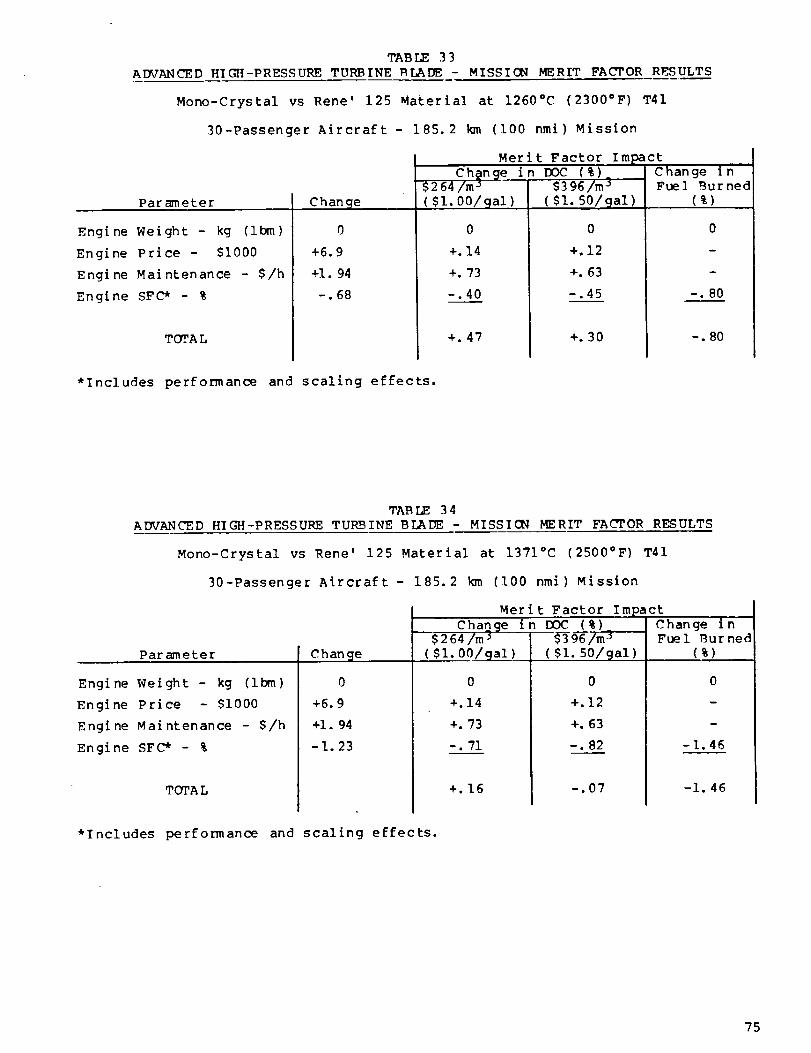
TABLE33ADVANCEDHIGH-PRESSURE TURBINE T%LADE - MISSION MERIT FACTOR RESULTS
Mono-Crystal vs Rene' 125 Material at 1260°C (2300°F) T41
30-Passenger Aircraft- 185.2 km (I00 nmi)Mission
Merit Factor_ Impact
Change in IX)C (%)_$2 64/m s 53 96/m _
Parameter
Engine Weight - kg (ibm)
Engine Price - $1000
Engine Maintenance - $/h
Engine SFC* - %
Change
0
+6.9
+I. 94
-.68
TOTA L
(51.00/gal)
0
+.14
+. 73
-.40
+.47
(51. 50/_al)
0
+.12
+. 63
-.45
+.30
]
Change ir_"Fuel Burned
(%)
0
-. 80
-. 80
*Includes performance and scaling effects.
TABLE 34
ADVANCED HIGH-PRESSURE TURBINE BLADE - MISSION MERIT FACTOR RESULTS
Mono-Crystal vs Rene' 125 Material at 1371°C (2500"F) T41
30-Passenger Aircraft - 185.2 km (100 nmi) Mission
Parameter
Engine Weight - kg (ibm)
Engine Price - 51000
Englne Maintenance - $/h
Engine SFC* - %
TOTA L
C h an _e
0
+6.9
+i. 94
-1.23
Merit Factor ImpactChange in DOC (%)
$2 6_7m j $3 96 7m-3------
(51.00/gal)
0
+.14
+. 73
-. 71
+.16
(51.50/gal)
0
+.12
+. 63
-. 82
-.07
C h an gei nFuel Burned
(%)
0
-1.46
-i. 46
*Includes performance and scaling effects.
75

TABLE_5ADVANCEDHIGH-PRESSURE TURBINE BLADE - MISSION MERIT FACTOR RESULTS
Cold Bridge vs Radial Hole Cooling at 1371°C (2500°F) T41
30-Passenger Aircraft - 185.2 km (100 nmi) Mission
Parameter
Engine Weight - kg (Ibm)
Engine Price - $I000
Engine Maintenance - $/h
Engine SFC* - %
TOTA L
Merit Factor ImpactChange in DOC (%)_
"_r7m-_ S_9_7_ _-Change
-.05 (-.1)
+7.1
+2. 00
-I._
(_1.00/99 %)
0
+.14
+. 75
-.89
0
(51.50/9al)
0
+.12
+. 65
-I. 03
-.26
Change inFuel _ur ned
(%)
0
i
-I. 85
-i. 85
*Includes performance and scaling effects.
TABLE 36
ADVANCED HIGH-PRESSURE TURBINE BLADE. - MISSION MERIT FACTOR RESULTS
Cold Bridge vs Radial Hole Cooling at IS71°C (2500°F) T41
50-Passenger Aircraft- 185.2 km (!00 nmi) Mission
Parameter
Engine Weight - kg (Ibm)
Engine Price - 51000
Engine Maintenance - 5/h
Engine SFC* - %
• OTA L
Change
-.05 (-.i)
+8.8
+2. 58
-1.6
Me r
Charte_n DOC (%)$ 2 6-4/m _ 53 Q_-_3--'---
(51.0019al)
0
+.13
+.68
I. 01
-.20
t Factor ImpactChange i nFuel Burned
(%)( 51. 50/9ai )
0
+.11
+.57
-1.14
-.46
i
-I. 90
-I. 90
*Includes performance and scaling effects.
76
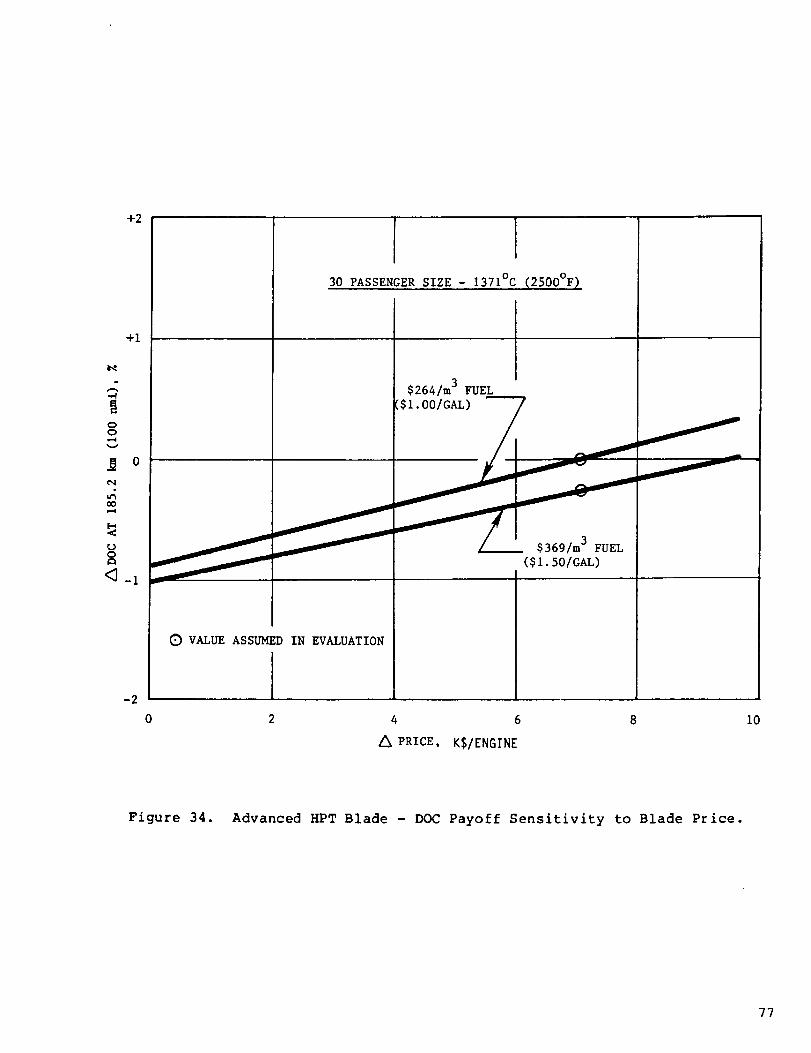
+2
+I
OO,-4v
Oeq
0o,-4
<3_ 1
30 PASSENGER SIZE - 1371°C (2500°F_
I$264/m 3 FUEL
($1.O0/GAL) /
/
$369/m 3 FUEL
($1.50/GAL)
-2
_) VALUE ASSUMED IN EVALUATION
0 2 4 6 8
/k PRICE, KS/ENGINE
i0
Figure 34. Advanced HPT Blade - DOC Payoff Sensitivity to Blade Price.
77

ArYv'ANCEDTECHNOLOGY I DENT IFICATION AND _VALUATION - Cont i nue d
ADVANCED MECHANICAL DF_IGN FEATURES- Continued
Low-Pressure Turbine Disk with Integral Cast glades
The base engine uses forged low-pressure turbine disks with individual castsolid airfoil blades with dovetails and integral tip shrouds. Low maintenancecosts are achieved with the ability to replace or repair individual blades.
This study compared a one piece cast disk and blades (a blisk) to determinewhether lower initial cost and weight would offset the more difficult
maintenance. Figure 35 shows the blisk compared to the base design.
Table 37 shows that there is a small reduction in DOC, regardless of fuel
cost, since no advantage in SFC was assLrned. The elimination of hot gas
leakage paths between separate blades and the disk might even improve turbine
efficiency, but this has not been included because it is difficult tomeasure. The cost and weight reductions more than balance the increase in
maintenance costs.
Since the maintenance cost of the blisks is a variable, and may depend on type
of flight service as we]l as maintenance practices, a sensitivity plot in
Figure 36 shows how DOC is affected by a range in maintenance cost.
TABLE 37
LOW-PRESSURE TURBTNE DISK WITH CAST BLADES - MISSION MERIT FACTOR RESULTS
Par ameter
30-Passenger Aircraft- 185.2 km (100 nmi) Mission
Engine Weight - kg (ibm)
Engine Price - S1000
Engine Maintenance - $/h
Engine SFC* - %
TOTA L
Merit Factor Impact
Chang[e_ in DOC (%)$ 2647m -_ $3 96/m 3
C h an ge
-1.3 (-2.9)
-5.6
+.15
0
( $1.00/cja] )
-.02
-.11
+.05
0
-.08
( Sl. 50/9ai)
-.02
-.!0
+.05
0
-.07
Change i nFuel Burned
(%)
-.03
w
0
-. 03
*Includes performance and scaling effects.
78

BASE ENGINE CONFIGURATION
SEPARATE CAST SHROUDEDBLADES WITH WROUGHT DISK
ADVANCED TECHNOLOGY CONFIGURATION
INTEGRAL CAST BLADES WITHTIP SHROUDS AND DISK
Figure 35. LP Turbine Disc with Integral Blades.
79
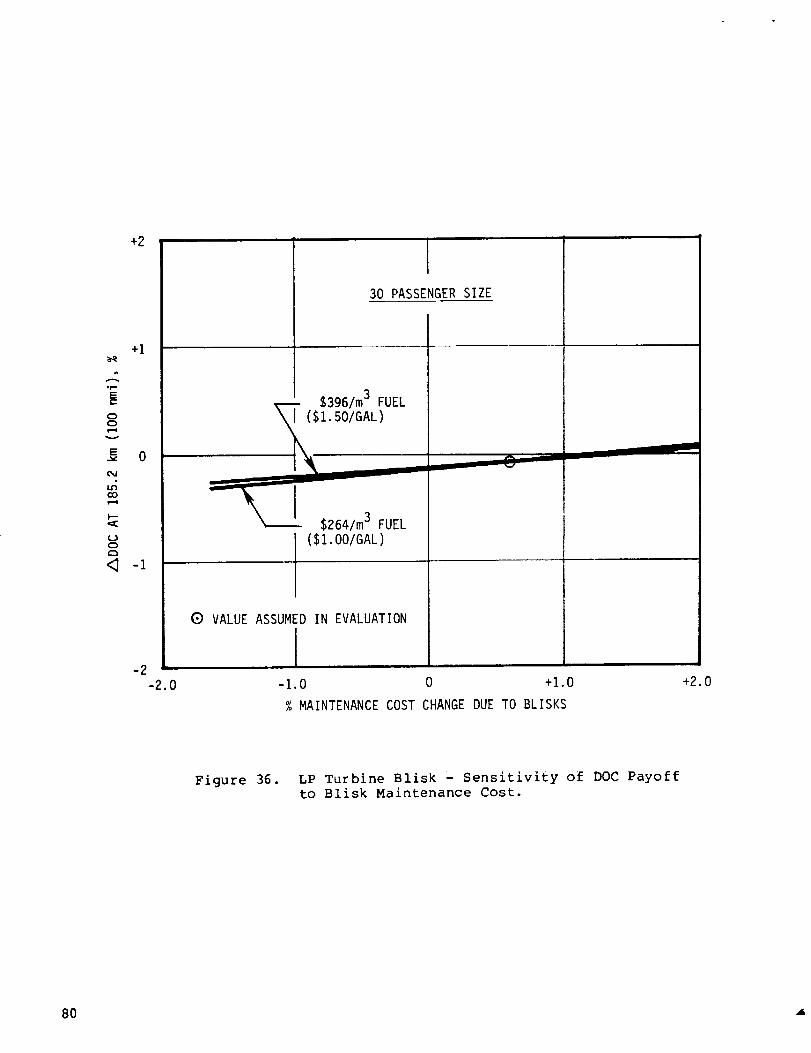
+2
+1
A,r-"
B00
v
0
I'--
0
<_ -1
30 PASSENGER SIZE
- $396/m3 FUEL
($I. 501GAL)
=_ $264/m 3 FUEL
($1. O0/GAL)
Q VALUE ASSUMEDIN EVALUATION
-1.0 0 +1.0
% MAINTENANCE COST CHANGE DUE TO BLISKS
+2.0
Figure 36. LP Turbine Blisk - Sensitivity of DOC PayofEto Blisk Maintenance Cost.
80
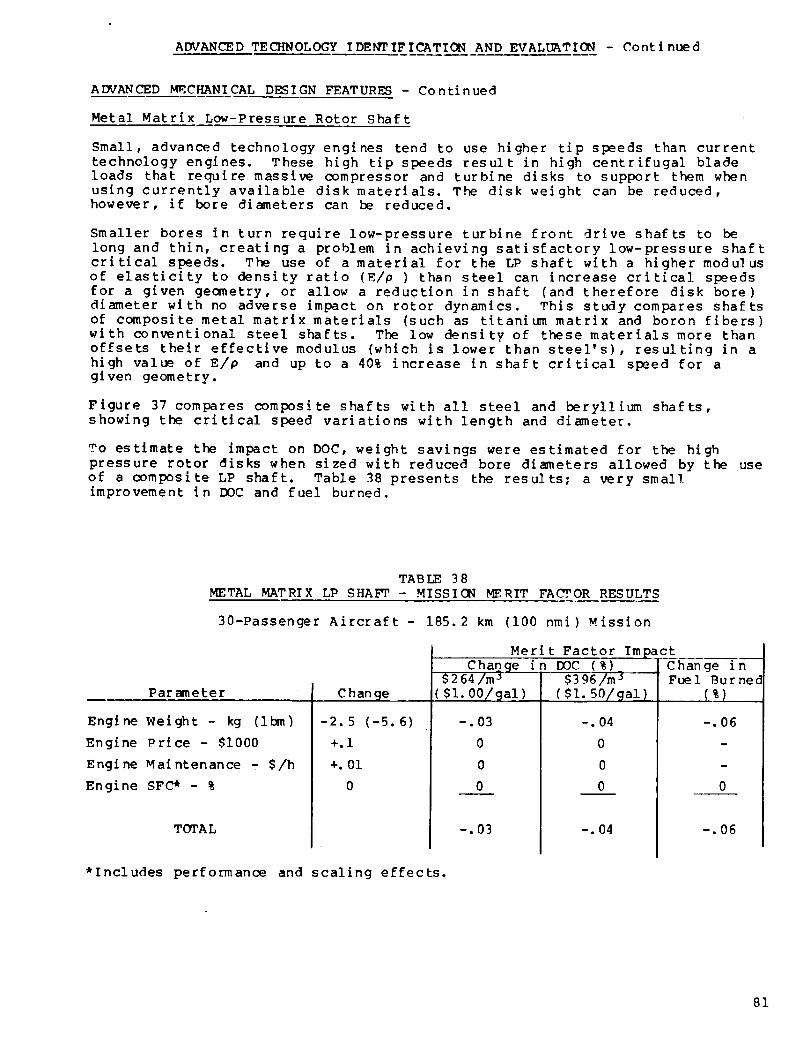
ADVANCED TECHNOLOGY IDENTIFICATION AND EVALUATION - Continued
ADVANCED M_CHANICAL DESIGN FEATURES - Continued
Metal Matrix Low-Pressure Rotor Shaft
Small, advanced technology engines tend to use higher tip speeds than current
technology engines. These high tip speeds result in high centrifugal bladeloads that require massive compressor and turbine disks to support them when
using currently available disk materials. The disk weight can be reduced,however, if bore diameters can be reduced.
Smaller bores in turn require low-pressure turbine front 4rive shafts to be
long and thin, creating a problem in achieving satisfactory low-pressure shaftcritical speeds. The use or a material for the LP shaft with a higher modulus
of elasticity to density ratio (F_/p) than steel can increase critical speedsfor a given geometry, or allow a reduction in shaft (and therefore disk bore)
diameter with no adverse impact on rotor dynamics. This study compares shaftsof composite metal matrix materials (such as titanium matrix and boron fibers)
with conventional steel shafts. The low density of these materials more than
offsets their effective modulus (which is lower than steel's), resulting in a
high value of E/p and up to a 40% increase in shaft critical speed for agiven geometry.
Figure 37 compares composite shafts with all steel and beryllium shafts,
showing the critical speed variations with length and diameter.
To estimate the impact on DOC, weight savings were estimated for the high
pressure rotor disks when sized with reduced bore diameters allowed by the useof a composite LP shaft. Table 38 presents the results; a very smallimprovement in DOC and fuel burned.
TABLE 38
METAL MATRIX LP SHA_ - MISSION MERIT FACTOR RESULTS
30-Passenger Aircraft - 185.2 km (100 nmi) Mission
Parameter
Engine Weight - kg (ibm)
Engine Price - $1000
Engine Maintenance - $/h
Engine SFC* - %
TOTA L
Change
-2. 5 (-5.6)
+.i
+.01
0
Merit Factor ImpactChange in DOC (%)
$ 2 64/m _ $3 96/m _
( $I. 00/gal)
-.03
0
0
0
-.03
($I. 50/gal)
-. 04
0
0
0
-. 04
Change inFuel Burned
(%)
-.06
0
-.06
*Includes performance and scaling effects.
81
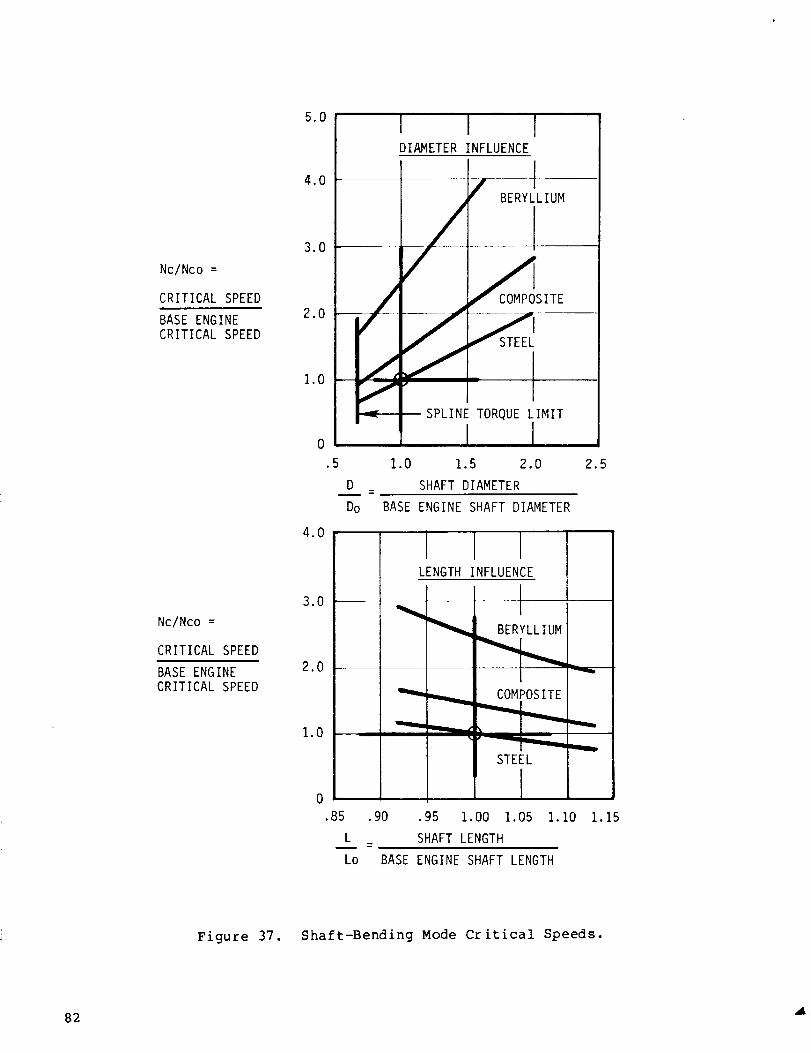
Nc/Nco =
CRITICAL SPEED
BASE ENGINECRITICAL SPEED
Nc/Nco =
CRITICAL SPEED
BASE ENGINECRITICAL SPEED
5.0
DIAMETER INFLUENCE
_o / 1BERYLLIUM
/3.0 _ _/
/COMPOSITE
1.0
0
.5
D
Do
4.0
3.0
2.0 -
1.0
-_m------SPLINE TORQUELIMIT
.l1.0 1.5 2.0
SHAFT DIAMETER=BASE ENGINE SHAFT DIAMETER
2.5
ILENGTH INFLUENCE
BERYLLIUM
COMPOSITE
STEEL
0
.85 .90 .95 1.00 1.05
L SHAFT LENGTHI
Lo BASE ENGINE SHAFT LENGTH
I. I0 1.15
Figure 37. Shaft-Bending Mode Critical Speeds.
82

ADVANCED TECHNOLOGY IDENTIFICATION AND EVALUATION - Continued
ADVANCED MECHANICAL DESIGN FEATURES - Continued
Composite Materials for Nacelle
A COSt and weight COmparison was made to determine the effect of substituting
composite materials such as glass and epoxy or graphite and epoxy for aluminumin the nacelles. These materials draw their high strength-to-weight ratio
from a combination of high tensile strength fibers with an epoxy fillermaterial. The develol:ment and tooling cost required to set up new
manufacturing facilities have delayed their extensive use in aircraft
applications. However, several airframe manufacturers have flight-tested alimited number of nonstructural parts- so far with good results.
Production of these parts is still very labor intensive and new, automated
production methods are needed to make them cost effective. To estimate theeffect of COst and weight savings on DOC, the results of a prior study 7 forNASA have been used.
This analysis showed that the achievable savings vary greatly with size and
location of components but that for the overall nacelle structure a weightreduction of 20 to 25% and a cost reduction fo 25 to 30% are obtainable.
Using the above values, the savings for the 30-passenger installation woul_calculate to be 14 to 16 kg (30 to 36 Ibm) and $6000 to $7400, while values
for the 50-passenger installation would be 23 to 27 kg (50 to 60 ibm) and
$10,000 to $12,500. The resulting benefits in terms of DOC and fuel burnedare shown in Table 39. Because the ultimate cost of producing composite
structures is a matter of great uncertainty throughout the aircraft industry,
sensitivity to material cost is shown in Figure 38.
TABLE 39
COMPOSITE MATERIALS FOR NACELLE - MISSION MERIT FACTOR RESULTS
30-Passenger Aircraft- 185.2 km (I00 nmi) Mission
Parameter
Engine Weight - kg
- (ibm)
Engine Price - $I000
Engine Maintenance - $/h
Engine SFC* - %
TOTAL
Chan@e
-14 to-16
(-30 to -36)
-6 to -7.4
0
0
I Merit Factor Impact Change i nFuel Burned
(%)I $264/m j($I.00/9al)
I .19 to -.23
Change in DOC (%)_
$396/m j
( $i. 50/gal)
-.12 to -.15
0
0
-. 31 to -.38
-.21 to -.26
-.ii to -.13
0
0
-.32 to -.39
-.32 to -.39
i
i
o
-.32 to -.39
*Includes performance and scaling effects.
83
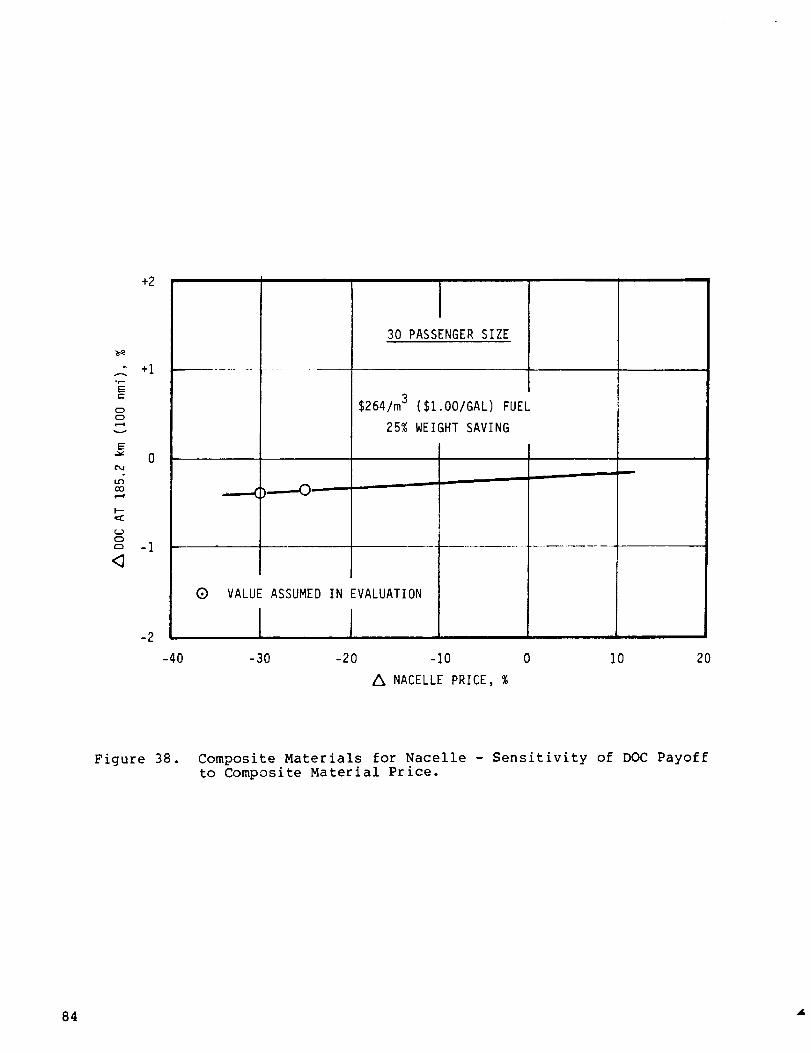
E
oo
v
E
00
,=c
(..)0
+2
+I
-1
-2
30 PASSENGER SIZE
$264/m 3 ($1.O0/GAL) FUEL
25% WEIGHT SAVING
6) VALUE ASSUMED IN EVALUATION
-40 -30 -20 -10 0 10 20
Z_ NACELLE PRICE, %
Figure 38. Composite Materials for Nacelle - Sensitivity of DOC Payoff
to Composite Material Price.
84
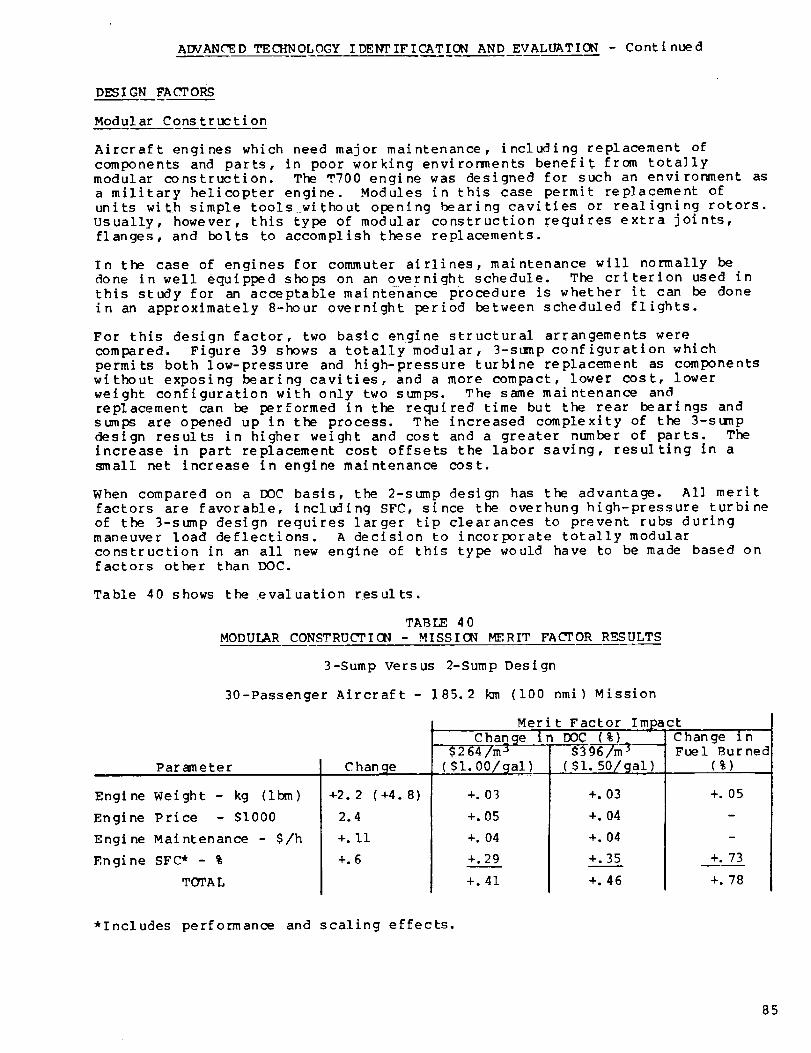
ADVANCEDTECHNOLOGYIDENTIFICATION AND EVALUATION - Continued
DESIGN FACTORS
Modular Construction
Aircraft engines which need major maintenance, including replacement of
components and parts, in poor working environments benefit from totallymodular construction. The T700 engine was designed for such an environment as
a military helicopter engine. Modules in this case permit replacement of
units with simple tools without opening bearing cavities or realigning rotors.
Usually, however, this type of modular construction requires extra joints,
flanges, and bolts to accomplish these replacements.
In the case of engines for commuter airlines, maintenance will normally be
done in well equipped shops on an overnight schedule. The criterion used in
this study for an acceptable maintenance procedure is whether it can be done
in an approximately 8-hour overnight period between scheduled flights.
For this design factor, two basic engine structural arrangements werecompared. Figure 39 shows a totally modular, 3-suap configuration which
permits both low-pressure and high-pressure turbine replacement as components
without exposing bearing cavities, and a more compact, lower cost, lower
weight configuration with only two sumps. The same maintenance andreplacement can be performed in the required time but the rear bearings and
stumps are opened up in the process. The increased complexity of the 3-sump
design results in higher weight and cost and a greater number of parts. Theincrease in part replacement cost offsets the labor saving, resulting in a
small net increase in engine maintenance cost.
When compared on a DOC basis, the 2-sump design has the advantage. All meritfactors are favorable, including SFC, since the overhung high-pressure turbine
of the 3-st_np design requires larger tip clearances to prevent rubs during
maneuver load deflections. A decision to incorporate totally modular
construction in an all new engine of this type would have to be made based onfactors other than DOC.
Table 40 shows the evaluation results.
TAB LE 4 0
MODULAR CONSTRUCTICIg - MISSION MERIT FACTOR R_SULTS
3-Sump Versus 2-Sump Design
30-Passenger Aircraft - 185.2 km (i00 nmi) Mission
Parameter
Engine Weight - kg (ibm)
Engine Price - $I000
Engine Maintenance - $/h
Engine SFC* - %
TOTA L
C h an @e
+2. 2 (+4. 8)
2.4
+.ii
+.6
Merit Factor ImpactChange in DOC (%) Change in
$396/m _ Fuel Burned
($i.00/9ai)
+.03
+.05
+. 04
+.29
+.41
$264/m j
.($I. 50/9ai)
+. 03
+. 04
+. 04
+.35
+.46
(%)
+.05
+. 73
+.78
*Includes performance and scaling effects.
85
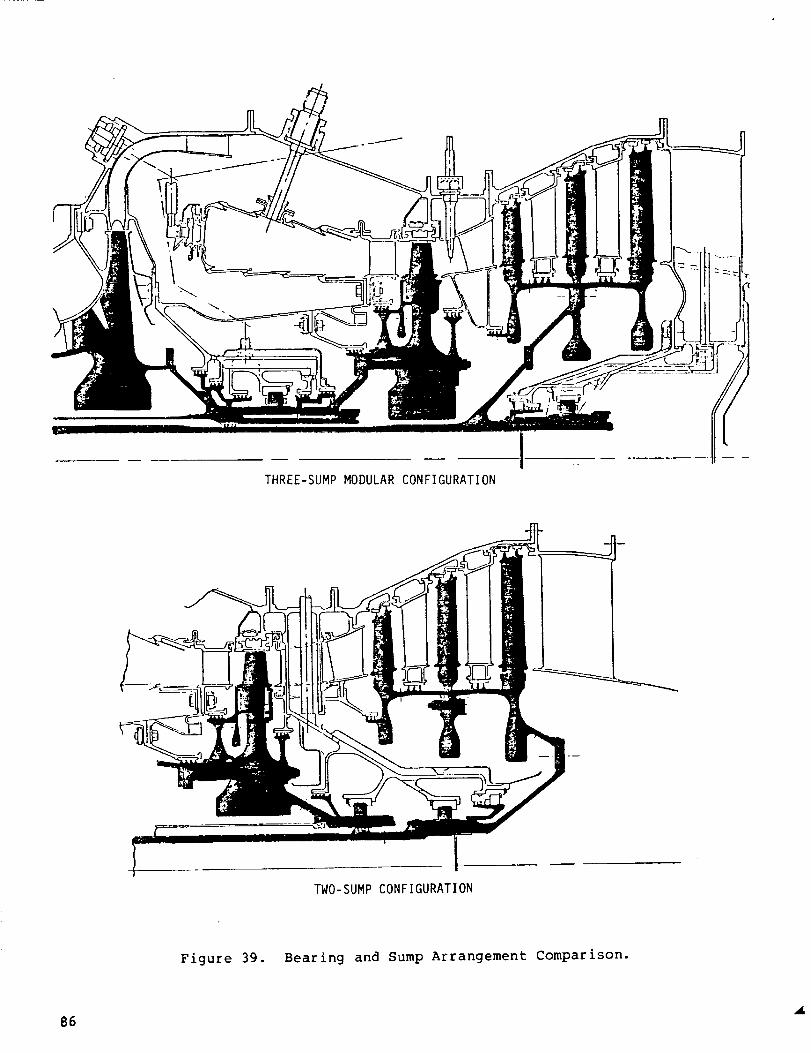
THREE-SUMPMODULARCONFIGURATION
TWO-SUMP CONFIGURATION
Figure 39. Bearing and Sump Arrangement Comparison.
86
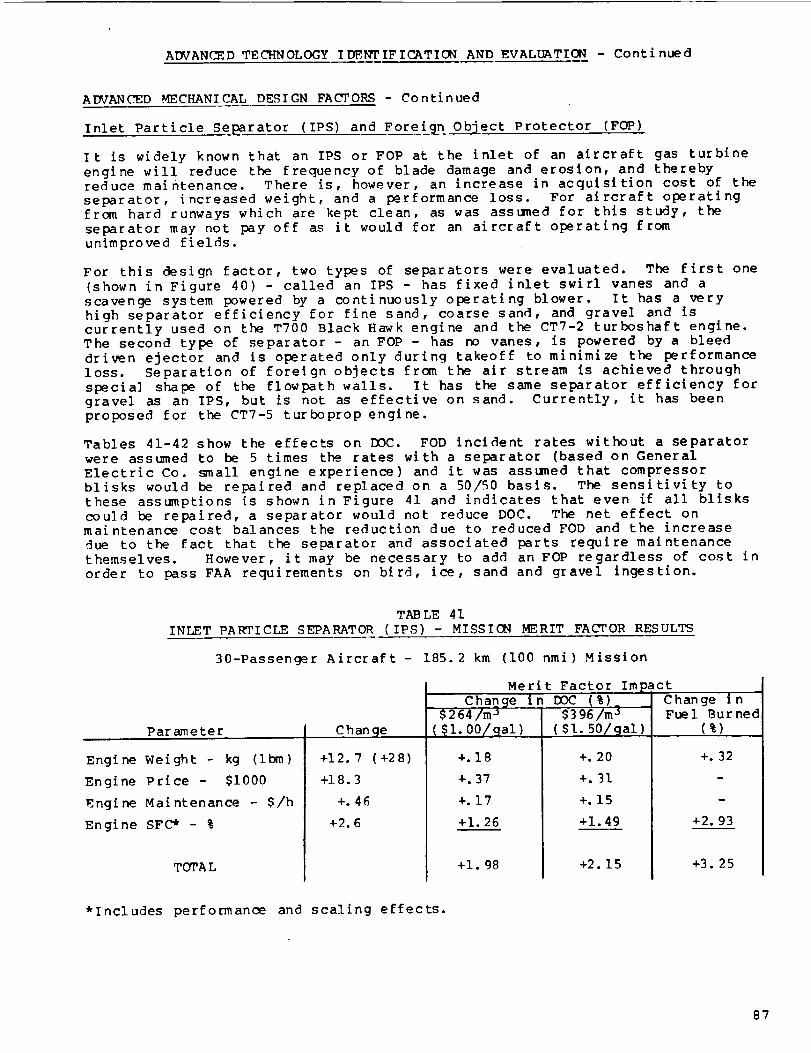
ADVANCED TECHNOLOGY IDENTIFICATION AND EVALL_TION - Continued
ADVANCED MECHANICAL DESIGN FACTORS - Continued
Inlet Particle Separator (IPS) and Foreign Object Protector (FOP)
It is widely known that an IPS or FOP at the inlet of an aircraft gas turbine
engine will reduce the frequency of blade damage and erosion, and therebyreduce maintenance. There is, however, an increase in acquisition cost of the
separator, increased weight, and a performance loss. For aircraft operating
from hard runways which are kept clean, as was assumed for this study, the
separator may not pay off as it would for an aircraft operating from
unimproved fields.
For this design factor, two types of separators were evaluated. The first one
(shown in Figure 40) - called an IPS - has fixed inlet swirl vanes and a
scavenge system powered by a continuously operating blower. It has a very
high separator efficiency for fine sand, coarse sand, and gravel and is
currently used on the T700 Black Hawk engine and the CT7-2 turboshaft engine.The second type of separator- an FOP - has no vanes, is powered by a bleed
driven ejector and is operated only during takeoff to minimize the performance
loss. Separation of foreign objects from the air stream is achieved through
special shape of the flowpath walls. It has the same separator efficiency for
gravel as an IPS, but is not as effective on sand. Currently, it has been
proposed for the CT7-5 turboprop engine.
Tables 41-42 show the effects on DOC. FOD incident rates without a separator
were assumed to be 5 times the_ rates with a separator (based on General
Electric Co. small engine experience) and it was assumed that compressor
blisks would be repaired and replaced on a 50/50 basis. The sensitivity to
these assumptions is shown in Figure 41 and indicates that even if all blisks
could be repaired, a separator would not reduce DOC. The net effect onmaintenance cost balances the reduction due to reduced FOD and the increase
,due to the fact that the separator and associated parts require maintenance
themselves. However, it may be necessary to add an FOP regardless of cost in
order to pass FAA requirements on bird, ice, sand and gravel ingestion.
TABLE 41
INLET PARTICLE SEPARATOR (IPS) - MISSION MERIT FACTOR RESULTS
30-Passenger Aircraft - 185.2 km (I00 nmi) Mission
Parmneter
Engine Weight - kg (ibm)
Engine Price - $I000
Engine Maintenance - $/h
Engine SFC* - %
TOTA L
Change
+12.7 (+28)
+]8.3
+.46
+2.6
Merit Factor ImpactChange in DOC (%)_ ,
$264/m j $396/m _
+.18 +.20
+. 37 +. 91
+. 17 +. 15
+I. 26 +i. 49
+I. 98 +2.15
Change inFuel Burned
(%)
+. 32
w
+2. 93
+3. 25
*Includes performance and scaling effects.
87
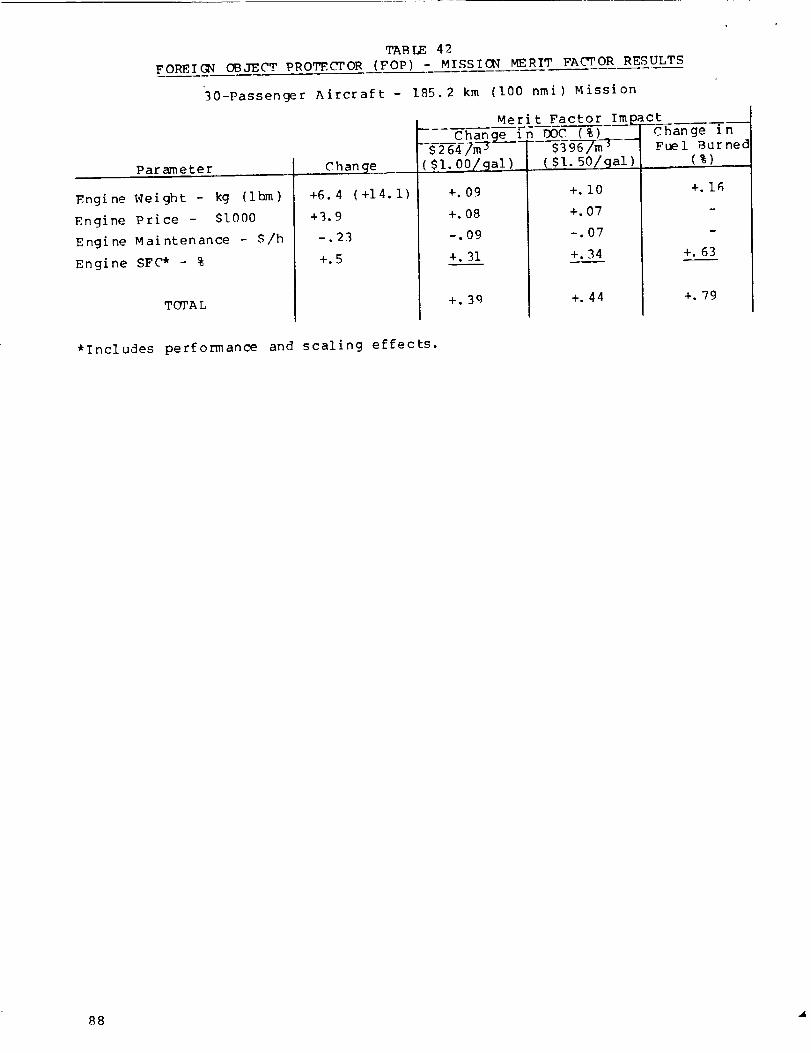
TABLE 42
FORF_[G_; OBJECT PROTECTOR (FOP) - M_SS[ON MERrT FAL'_OR RESULTS
30-Passenger Aircraft- 185.2 km (I00 nmi) Mission
Parameter
Engine Weight- kg (Ibm)
Engine Price - Sl000
Engine Maintenance - S/h
Engine SFC* - %
TOTA L
Change
+6.4 (+14.1)
+3.9
-.23
+.5
Merlt Factor Im
_- Change in DOC (%)_ $26-47-- _ - $396/m _----
i($I. 00/gal)
+.09
+.08
-.09
+. 31
+.3g
(Sl. 501gal)
+.i0
+.07
-.07
+.34
+.44
_act
Change inFuel Burned
(%)
+.16
m
+. 63
+.79
*Includes performance and scaling effects.
88
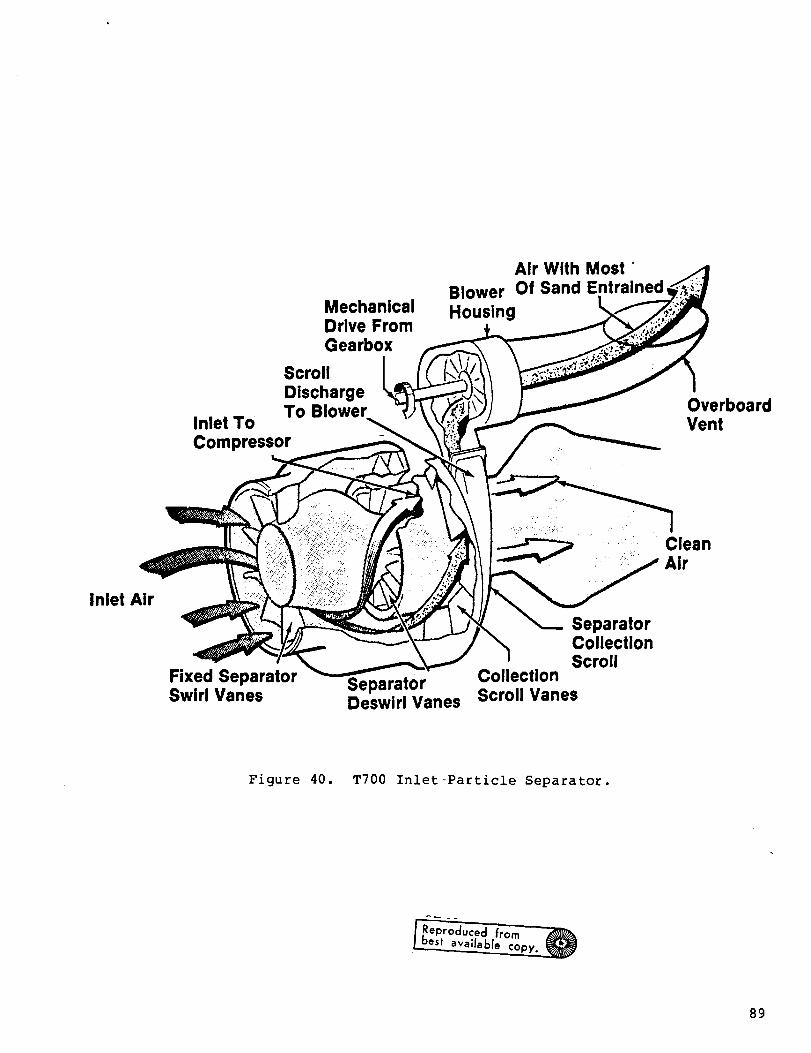
Inlet ToCompressor
MechanicalDrive FromGearbox
ScrollDischargeTo Blower
Air With Most '
Blower Of Sand Entrained
Housing
OverboardVent
Inlet Air
Fixed SeparatorSwirl Vanes
SeparatorDeswirl Vanes
SeparatorCollectionScroll
CollectionScroll Vanes
CleanAir
Figure 40. T700 Inlet Particle Separator.
_od.ced from_best available copy.
89
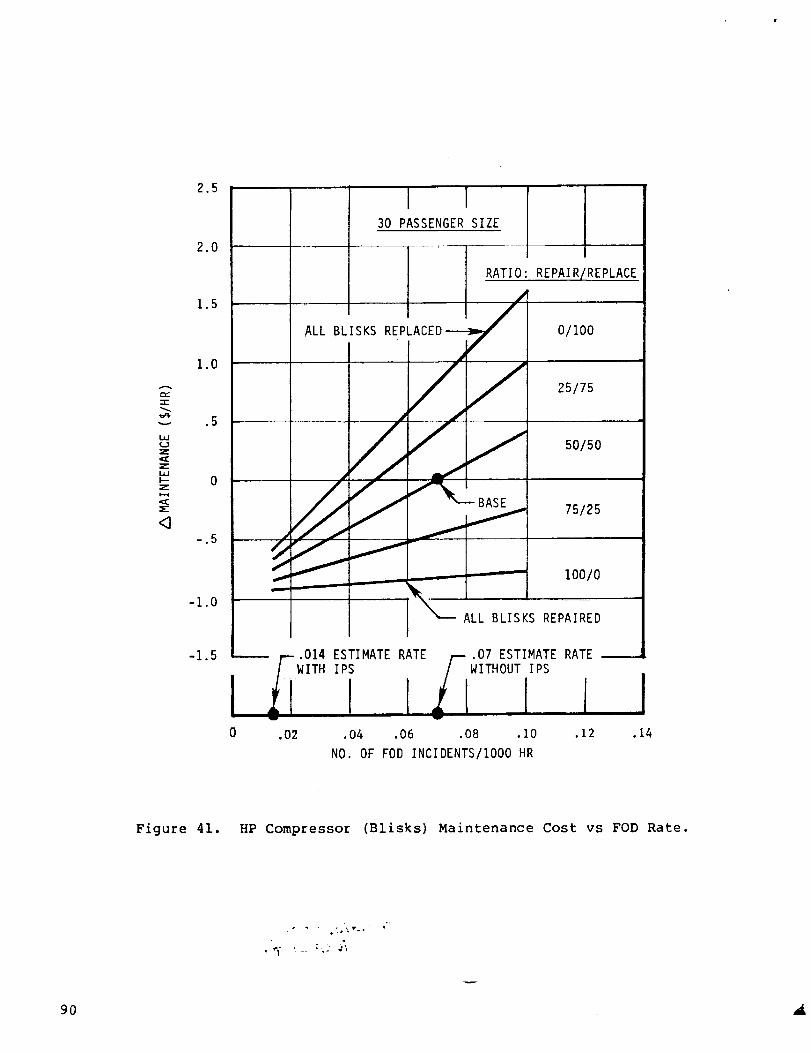
,..,,.-r
v
Z
Z
l,tl-Z
<]
2.5
2.0
1.5
1.0
.5
....
-.5
-1.0
-1.5
I0
30 PASSENGER SIZE
RATIO: REPAIR/REPLACE
ALL BLISKS REPi.ACED 0/100
.#_/ 25/75
//'_RAS'__ 50/50
J
. 75/25J
___"- I00/0
ALL BLISKS REPAIRED
•014 ESTIMATE RATE .07 ESTIMATE RATE _
i .me
.02 .04 .06 .08 .i0 .12 .14
NO. OF FOD INCIDENTS/IO00 HR
Figure 41. HP Compressor (Blisks) Maintenance Cost vs FOD Rate.
90

ADVANCED TECHNOLOGY IDF_NTIFICATION AND EVALUATION - Continued
DESIGN FACTORS - Continued
Diagnostic Data Recording
The practice of scheduled engine overhaul based only on the number of hours of
use contributes to high maintenance costs. It is a fact, however, that all
engines do not deteriorate equally with equal hours of use, because the
severity of usage depends on a large ntm_ber of variables. For example, inwarm weather and at high elevations, takeoff and climb power required is much
higher relative to capability than in cool weather or low elevations. Thischaracteristic, which leads to the practice of flat rating (discussed in more
detail in the following section), significantly affects the rate of
deterioration and the need for overhaul of each engine.
The extreme alternative to regular overhauls is to overahul only when each
life-limited part requires replacement. Figure 42 shows the variation In
maintenance cost and shop visit rate based on the type of life-limited part
replacement plan used. It shows that maintenance cost can be minimized at
very little increase in the minimum shop visit rate, if some parts arereplaced before their lives are completely used up, but not all life-limited
parts are replaced at every overhaul.
To do this requires continuous knowledge of the life remaining (or used up) ineach life-limited part. Decisions on when to overhaul can then be made for
the least disruption of scheduled service.
The design feature evaluated in this study is a diagnostic system called
"Diacorder" which records severity of engine operation and time in service andcomputes the rate of life consumption of each part of interest. The pilot or
maintenance crew can retrieve this information as a display on the screen of
the output unit, Figure 43 at any time. It provides a continuously updated
status of all parts being monitored.
The cost of the system includes cost of the sensors and recorders on each
aircraft plus a prorated share of the system operating costs for the fleet.
The merit study of the diagnostic system compared a fixed-time interval
maintenance plan to an optimized maintenance plan using the Diacorder. Thebaseline fixed-time maintenance plan is based on overhaul intervals set by
consideration of the most severe operations expected anywhere in the fleet.
The interval with the Diacorder is varied according to the severity
experienced on each engine, which on average is substantially milder than themost severe conditions used to establish fixed overhaul intervals. Table 43
shows that the diagnostic system and maintenance as required pays off with
lower DOC. Figure 44 shows the sensitivity of DOC to the reduced maintenance
cost associated with the system.
91

Parameter
TA_ IF, 43
DIAGNOSTIC DATA RECORDING - MISSION MERIT FAL'_OR RESULTS
30-Passenger Aircraft - 185.2 km (I00 nmi) Mission
Engine Weight - kg (Ibm)
Engine Price* - $I000
Engine Maintenance - $/h
Engine SFC - %
TOTA L
Change
2.7 (6)
21.8
-3.70
0
Merit Factor Im
C h an_e i$264/m_
( $I. 00/@al)
•04
.44
-i. 37
0
-.89
)act
n Doc (%)
$396/m _
($I. 50/9ai
• 04
.37
-i. 18
0
-.77
Change i nFuel Burned
(%)
.O7
0
.O7
_Includes aircraft cockpit mounted "Diacorder" and ground facilities.
92

2OO
l.--
150
10o
l.e.l
_.i
o
"' 50
w
0
0
|ll
\\\\
ALL PARTS REPLACEDAT LIFE DEPLETION
ALL PARTS REPLACEDAT EVERY OVERHAUL
COST
i
20 40 60 80
PERCENT UNUSED LIFE REMAININGON SECONDARY PARTS AT OVERHAUL
SHOPVISITRATE
i00
2.0
1.5
c_
co0
La.l
v
1.0 ,.,
I--
0-r-o')
.5
Figure 42. Maintenance Management Effects.
93

, .,',/',',',',',',','_ENGINE (_PROJECTED HOURS REMAINING "_ _;_i_ DIACORDER
ENtwINENO. 1 Er4GIHE NO. 2_ / proiectionTO.INSP T00/H TO INSP /
57 1207 _5 / life _ i'nput267 - 1588 463 "
f
]CO__MPON.__.[N!
IIITURB ROTOR
HI TURB STATOR
COMBUSTOR
I COMPRESSOR
LO TURB ROTOR 2301
LO TURB STATOR 2157
REMAINDER 1525
SPARE
I POWER LOSSLIMIT
I
L
183 - 5560 1761 '
3762 2572 15326 3557 Ii
6...77 1876 - II53 2371 139
- 12005 2016 I
-- 657 - 297..__3
UNDERLINED ITEMS REQUIREACTION SOON OR ARE ABNO_IAL
JJ
®©®
@ @Mi I) Ir IN U'l'i' i
HOURS ARE INTERNALLY COMPUTED BASED ON THE RECENT RATE OF
INCREASE IN APPLICABLE STRESS RUPTURE AND LOW CYCLE FATIGUE INDICES
Figure 43. Example of Projected Hours Remaining Life Display.
94
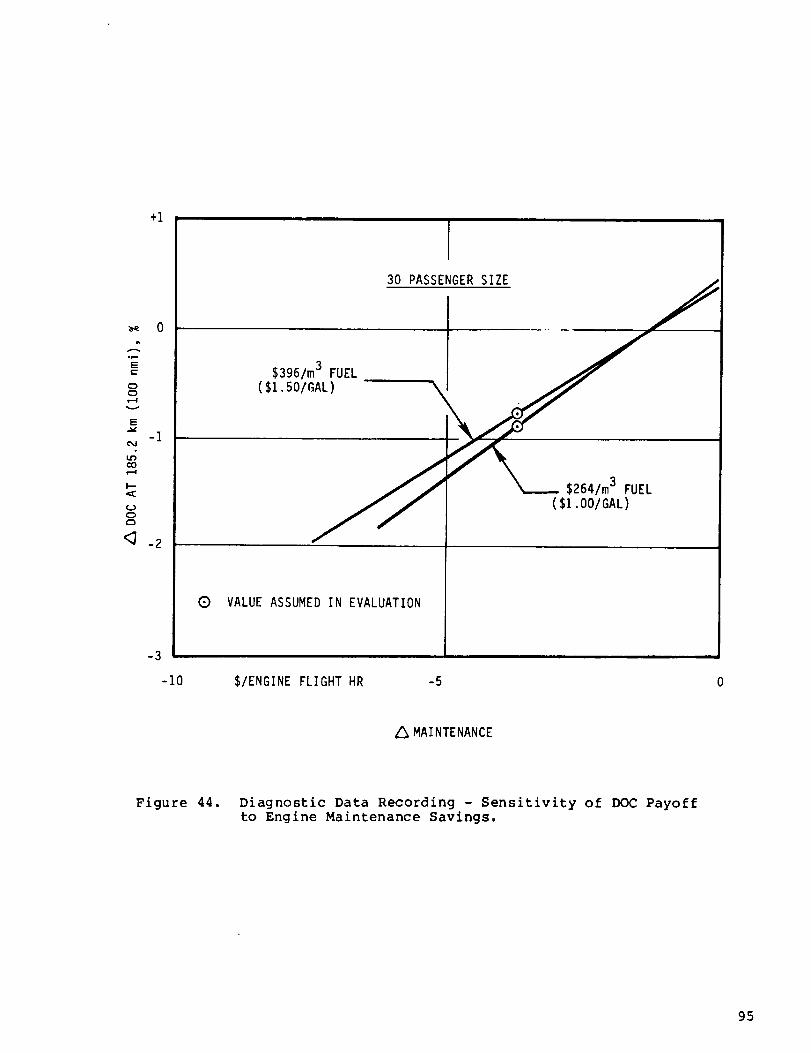
+1
O
.-pEm,-
00
v
E
-I
oO
{_;,0
<7 -2
30 PASSENGER SIZE
$396/m 3 FUEL($I.50/GAL)
G VALUE ASSUMED IN EVALUATION
S/ENGINE FLIGHT HR -5
A MAINTENANCE
Figure 44. Diagnostic Data Recording - Sensitivity of DOC Payoffto Engine Maintenance Savings.
95

ADVANCED TECHNOLOGY IDEkVI"IFICATION AND EVALUATION - Continued
DESIGN FACTORS - Continued
Alternate Engine Ratin@s
The power output capability of a turboshaft engine varies with ambient
temperature. A basic "full" rating characteristic curve is as shown in Curve
"I" of Figure 45. The curve is defined only by maximtm a_lowable turbine
temperature and/or maximum rotor speeds. If the aircraft is to meet
performance goals at a specified ambient temperature, a surplus of output is
available on colder days. Use of full capability at all ambient temperatures
produces high maintenance costs because of excessive time at high turbine
temperatures. Loading on gearing and propellers is also excessive in cold
ambients. Therefore, commercial engines are normally "flat-rated" below the
sizing point ambient temperature as shown by Curve "If" of Figure 45. In this
range, turboprop engines are typically gearbox torque limited and pilots may
set desired power with the aid of applicable tables or curves for various
combinations of conditions. With flat rating, engine service is less abusive,
on average, than if maximum capability was used for every flight.
Two additional rating methods which may be used separately or in combination
for further reduction of maintenance costs are derating and Automatic
Provisional Rating (APR). In derating, an engine is used at less than rated
capacity. If the engine is always run derated, larger engine size will be
required for equivalent performance on a given aircraft. It is more likely,
however, that derating will be applied in varying amounts according to
prevailing combinations of conditions. Conditions favorable to derating
include: cold ambient temperature, lower than maximum gross weight, long
runway available, and low altitude airport.
APR is an alternate rating system in which a device on the aircraft detects
loss of power on one engine and automatically steps power up to a special
rating level, the APR (Automatic Provisional Rating), on the remaining
engine(s). This allows smaller, lower cost engines to he used while still
meeting aircraft performance requirements.
This study compared four rating types, designated A, B, C, and D:
A. Baseline: flat-rated below 30°C (86°F).
B. 10% average thrust (FN) derate relative to A.
C. APR on an engine scaled 5% smaller than A.
D. 8% average FN derate relative to C.
Baseline Engine A is typical of current commercial practice_.
Derated Engine g represents a reasonable average amount of derating, 10%,
which may be obtainable without an engine size increase. The derate increases
the percentage of time at climb and reduces the percentage at cruise. The net
effect is no change in total fuel burned for the 185.2 km (100 nmi) mission,
but a small increase in block time. Through time-related factors such as
maintenance, and crew costs, the increase in block time increases IX)C..
approximately 1% (exclusive of the significant maintenance saving due to
reduced severity).
ORIGINAL PAGE IS
OF POOR QUALrTT
96

THRUST
FLAT RATED
FULL RATED
ENGINE SIZING
POINT
TAMBIENT
Figure 45. Turboshaft Engine Power for Varying Ambient Temperature.
97
ADVANCED TECHNOLOGY IDENTIFICATION AND EVALUATION - Continued
D_I_IGN FACTORS - Continued
APR Engine C is scaled down 5%. This amount of scaling was selected to
provide the same balanced field length with APR for the nominal size
aircraft. Because additional power is available in engine out situations,
this mnaller engine can satisfy aircraft one engine inoperative (OEI) takeoff
field length and minimt_n rate of climb requirements. Engine C operates at a
higher percentage thrust level than he baseline Engine A, to maintain aircraft
climb and cruise performance, and therefore has more favorable TSFC for much
of the mission. The impact on block time is negligible.
Engine D with APR, and 95% size compared to Engine A, cannot be derated as
much, on an average., as Engine A because its smaller size forces the use of a
greater percent of its output capacity. The 8% derating represents the
estimated usable average for this configuration.
To summarize, two physically different Engines A and C are compared, along
with their comparable derated versions, Engines B and D respectively.
Mission profiles for some of these ratings are shown schematically in Figure
46. Total time at takeoff (TO), climb (CL), cruise (CR) and idle (ID) is
plotted against turbine temperature (T41). Note that derating is app]ied at
takeoff and climb only and not at cruise. This asstm_ption minimizes effects
on aircraft speed and block time.
Takeoff power levels applicable with each rating scheme are shown in Figure 47
versus ambient air temperature (TAMB). Climb power fo!lows a similar
pattern. T.hese power differences correlate with severity of operation and
therefore with maintenance costs. Figure 48 shows relative maintenance cost
of the baseline engine at 100% size with no derating. The solid line shows
the favorable effect of derating this engine. The hatched zone shows that the
smaller engine with APR has higher maintenance cost because it runs at higher
average power. Derating this engine gives a similar trend in maintenance cost.
The net effect of engine size, maintenance costs, fuel consumption and block
time for each of the rating choices are charted in Tables 44-46.
Derating is clearly to the operator's advantage whenever conditions permit.
The results in Table 44 should be interpreted as applying to an average 10%
derate. For operator's flying routes where the average derate is lower, the
saving would be correspondingly less.
The APR ratings also reduce DOC, but the result is sensitive to maintenance
costs. In fact, DOC would increase if maintenance costs were higher than
assumed. This is graphically shown by Figure 49 where the, range of DOC change
with _264/m 3 ($1.00/gal) fuel already straddles zero.
98
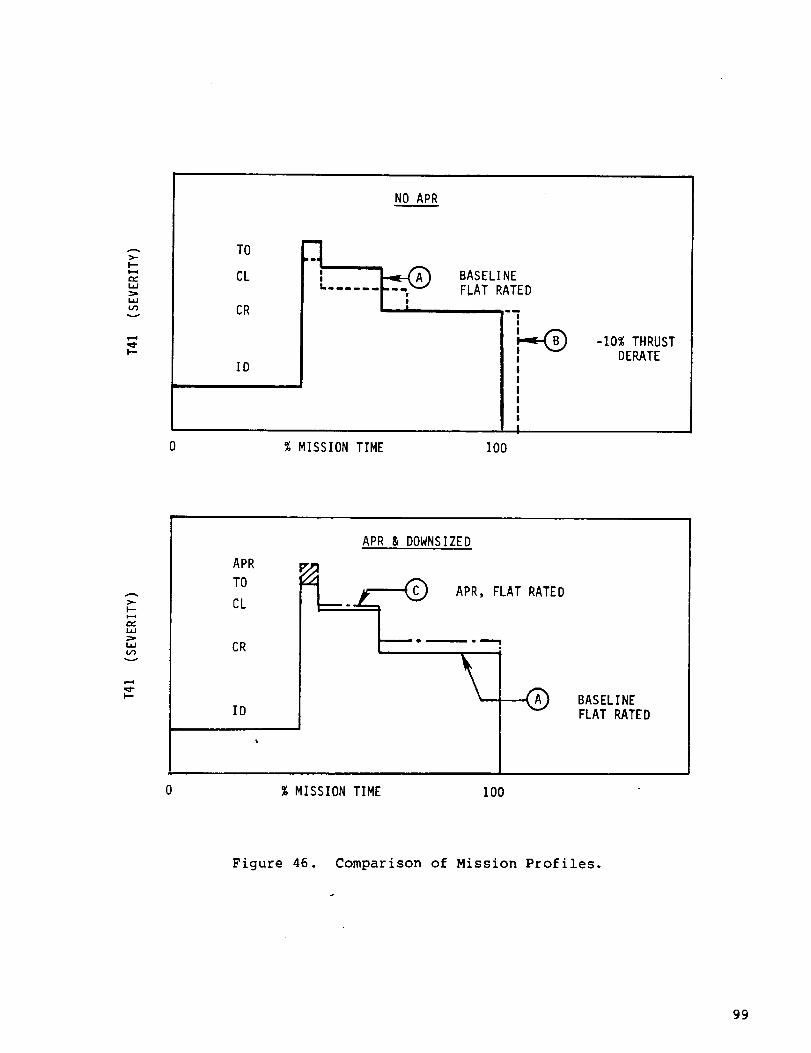
l--m-,l
LaJ
C_
I--
NO APR
TO
CL
CR
ID
% MISSION TIME
BASELINEFLAT RATED
100
!
F-<E)I
I
I
IIII
I
-10% THRUSTDERATE
LaJ
L_GOv
APR & DOWNSIZED
APR
TO
CL
CR
ID
APR, FLAT RATED
BASELINEFLAT RATED
% MISSION TIME 100
Figure 46. Comparison of Mission Profiles.
99
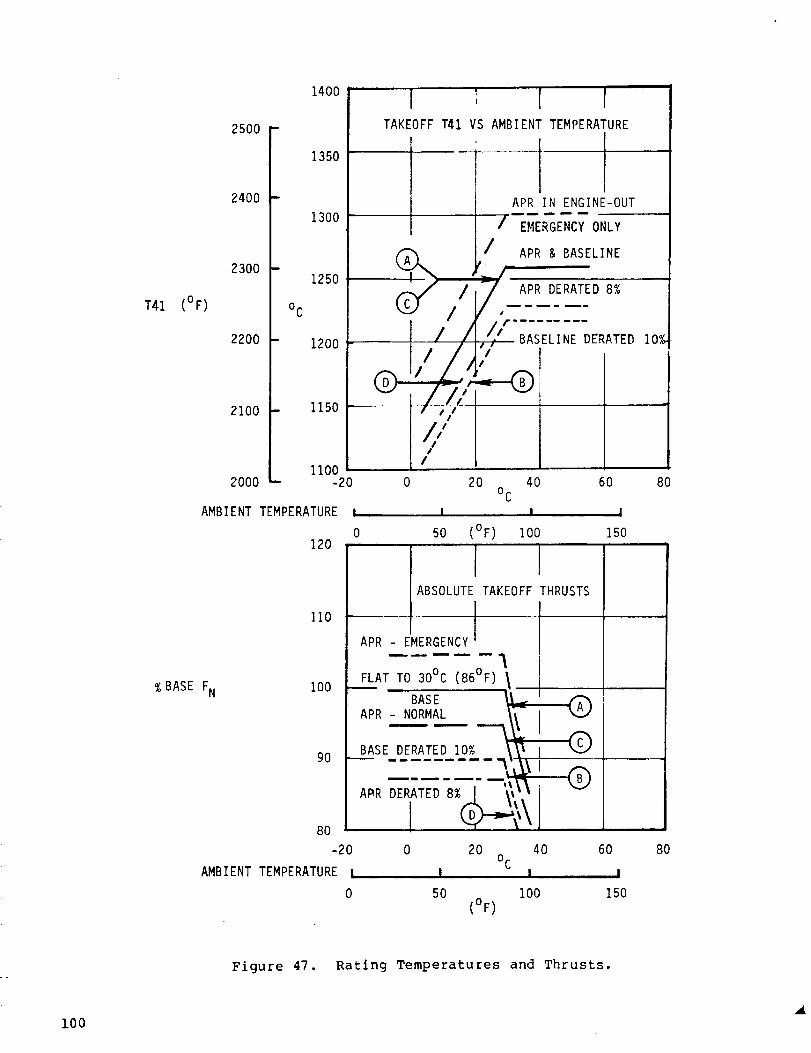
1400......
T41 (OF)
%BASEFN
2500 -
1350
2400 -1300
2300 -1250
°C
2200 - 1200
2100 - 1150
11002000 - -20
AMBIENTTEMPERATUREI0
120
110
i00
90
I
TAKEOFF T41 VS AMBIENT TEMPERATURE
' IAPR IN ENGINE-OUT
/ "E_,_G E_cT ONLY
I_ ¢/ APR & BASELINE=r ' _
I 1,4' ,_As_,,,_o_,_,,.,-_-,_
#
4"/
10%
20 40 60 80° c
I I I
50 (°F) 100 50
ABSOLUTE TAKEOFF THRUSTS
APR - EMERGENCY I
i i
FLATTO 30°C (86°F) _
BASE
APR- NORMAL .... _k_ I _1-_rl
BASE DERATED 10% \_]
- IAPR DE'_iTED 8_1''_'_\ _-'ll I8O
-20 0 20 40 60 80°C
AMBIENT TEMPERATURE! ! I I
0 50 i00 150(OF)
Figure 47. Rating Temperatures and Thrusts.
i00

0f_
w
Z
Zw
Z
:E
m,,-
150
(
I00 (
50
0
DOWNSIZED
ENGINE
WITH APR
_// _ 8% DERATE
BASELINE _, _'_
NO APR10% DERATE
0 -5 -10 -15 -20 -25
AVERAGE OPERATIONAL DERATE, % FN
Figure 48. Effect of Ratings and Derate on STAT Maintenance Cost.
I01
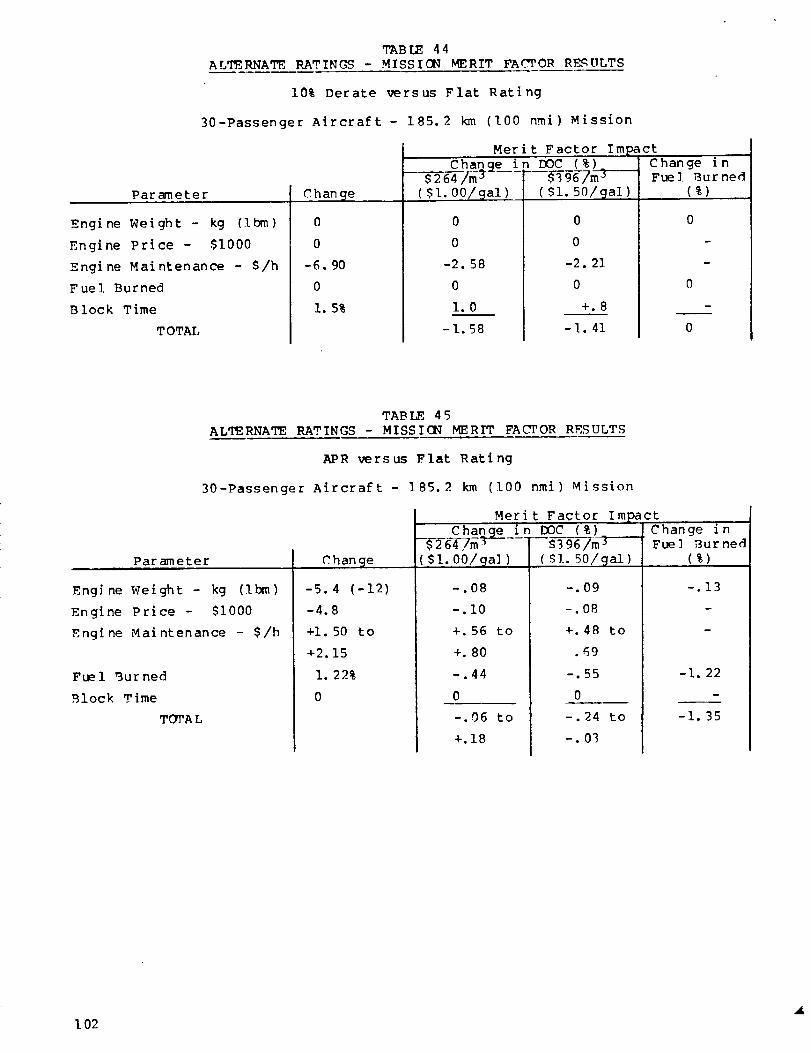
TABU3 44
ALTERNATE RATINGS - MISSION MERIT FACTOR R_SULTS
10% Derate versus Flat Rating
30-Passenger Aircraft - 185.2 km (I00 nmi) Mission
Parameter
Engine Weight - kg (Ibm)
Engine Price - $I000
Engine Maintenance - S/h
Fuel Burned
Block Time
T OTAL
Change
0
0
-6.90
0
i. 5%
Merit Factor Impact
Change in DOC (%)$264/m j - S_ 96 7_3------
($I. 00/9al)
0
0
-2.58
0
1.0
-1.58
($i. 50/@al)
0
0
-2.21
0
+.8
-i. 41
Change i nFuel _ur ned
(%)
0
0
0
TABLE 45
ALTERNATE RATINGS - MISSION MERIT FACTOR RRSULTS
APR versus Flat Rating
30-Passenger Aircraft- 185.2 km (I00 nmi) ,Mission
Merit Factor ImpactChange in DOC (%)
--$ 26_, m T------ S3 96/m _T----
Parameter
Engine Weight - kg (Ibm)
Engine Price - $i000
Engine Maintenance - $/h
C h an ge
-5.4 (-12)
-4.8
+i. 50 to
+2.15
I. 22%
0
Fuel gurned
Block Time
TOTAL
( Sl. 00/gal)
-.08
-.I0
+. 56 to
+. 80
-.44
0
-. 06 to
+.18
(Sl. 50/_al)
-.09
-.08
+. 48 to
.69
-.55
0
-. 24 to
-. 03
Change inFue] Burned
(%)
-.13
-I. 35
102
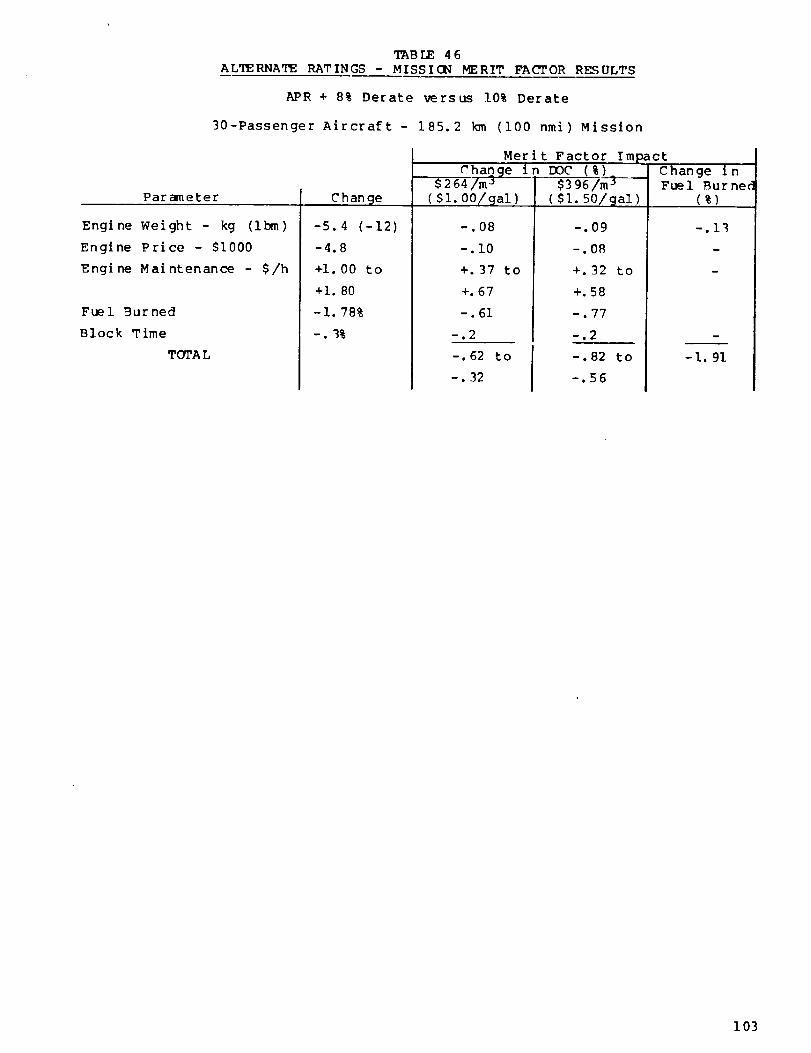
TABLE46ALTERNATE RATINGS - MISSICN MERIT FACTOR RESULTS
APR + 8% Derate versus 10% Derate
30-Passenger Aircraft - 185.2 km (i00 nmi) Mission
Parameter
Engine Weight - kg (Ibm)
Engine Price - 51000
Engine Maintenance - $/h
Fuel Burned
Block Time
TOTA L
Change
-5.4 (-12)
-4.8
+I. 00 to
+I. 80
- I. 78%
-. 3%
-.08
-.I0
+. 37 to
+.67
-.61
--,2
Merit Factor ImpactChange in DOC (%)_ ]
$264/m j $396/m j
($1.00/gal) ($1.50/gal) ]
-.09 I
-.OR
+. 32 to
+.58
-. 77
--.2
-.82 to
-.56
Change i nFuel Bur he6
(%)
m
-I. 91
103

Ee,-
0o
v
E,..+.
(',4
mO
(=.)or-,.
<]
+3
+2
+I
-I
-2
30 PASSENGER AIRCRAFT
$2641m 3 FUEL __($1.O01GAL) _'_#_,_
Q VALUE ASSUMED IN EVALUATION
$396/m 3 FUEL
($1.50/GAL)
0 5 I0 15 2O 25 3O
% INCREASE IN MAINTENANCE COST DUE TO HIGHER CLIMB POWER
35
Figure 49. Alternate Ratings - Sensitivity of Downsized APR
Engine Maintenance on DOC.
104

ADVANCED TECHNOLOGY IDENTIFICATION AND EVALUATION - Continued
GEARBOX TECHNOLOGY
Gearbox Design
Current and advanced technology gearbox designs appropriate for commuter
aircraft have been furnished by Hamilton Standard Division of United
Technologies Corporation under subcontract 6,8. A synopsis of Hamilton
Standard's reports are included as Appendix A (pgs 151-158). The two gear
trains are shown in Figure 50. The key features of the advanced gearbox areindicated in Table 47. The selected design incorporates four advanced
technology features and four design factors not included in state-of-the-art
gearbox designs, as follows:
Advanced Technoloc/ie__s Desi@n Factors
o High Contact Ratio Gearing o Split Power Gear Train
o Advanced Bearing Materials o High Filtration
o Advanced Lubricants o Modular Construction
o Lightweight Housing Material o On-Condition Maintenance
TABLE 47
HAMILTON STANDARD ADVANCED TECHNOLOGY GEARBOX FEATURES
Feature Change Area of Improvement
Gear Train Compound idler system vs offset
Design pinion-bull-star system(6 vs 9 gears).
Construction
Lubricants
F il tratlon
Gear i ng
Design
Housing
Bearings
Improved modularity - externallymounted accessories, accessory drive
gearbox, lube system components;removable with standard tools.
Efficiency, weight,cost.
Mai ntai nabil ity.
Advancements in film strength and Life.
viscosity characteristics.
Reduced debris production, finer Life.filtration level.
High contact ratio gearing vs Weight, noise, andconventional tooth profiles, vibration.
Magnesium vs aluminum. Weight.
Advanced, vacuum melt, high purity Weight and life.
steels.
Operational On-condition maintenance vs fixed Maintenance and Cost.Procedures overhaul intervals.
105

>--
0
__l
0
Z
-I"-
I_1_1
I_l.J
Z
,,:=E
,,,=:E
>-
CD
.._1
0
"-r-
I--"
Z
I..IJ
r'_
'-t-
O0
W
I.JJ
J
0
C:)
w
Z
,<z z
I.-.- o z
I---
z
!
a, _- _j __j
-r-
i,n
<
I--
I
I--
W
L.i_
IJ_
0
0
C_E0C3
0.(3L,
ot_
u_
106
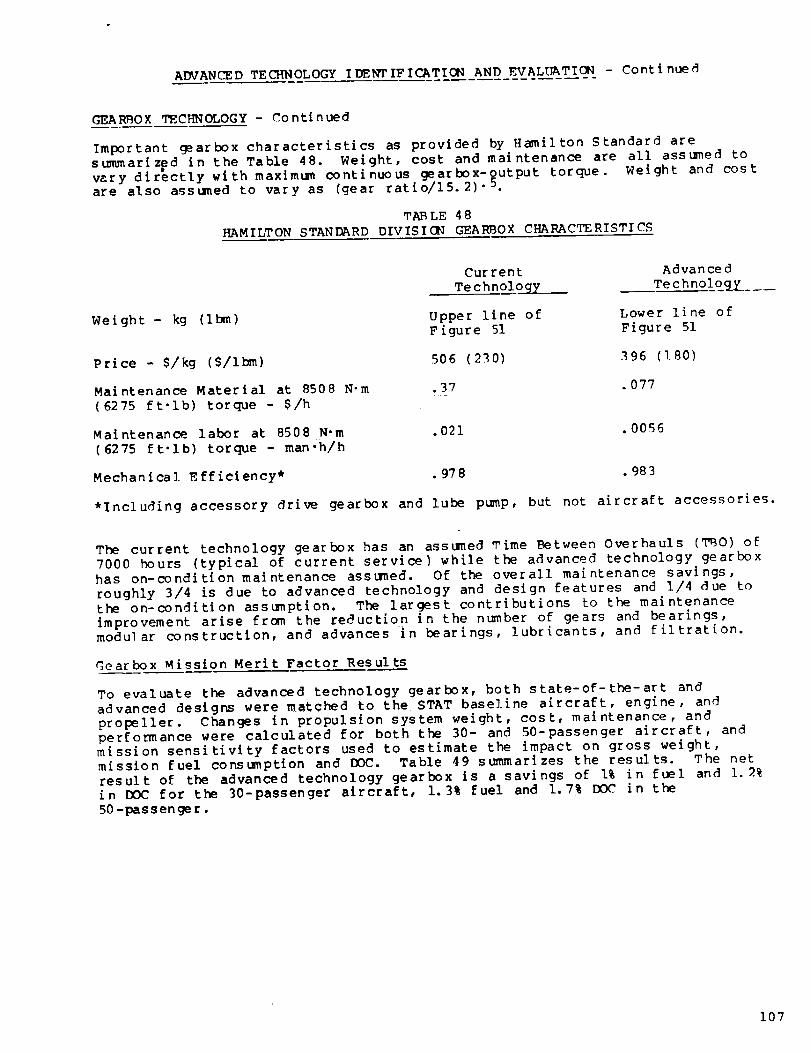
ADVANCED TECHNOLOGY IDENTIFICATION AND EVALUATION - Continued
GEARBOX TECHNOLOGY- Continued
Important gearbox characteristics as provided by Hamilton Standard aresummarized in the Table 48. Weight, cost and maintenance are all asstlned to
vary directly with maximum continuous gearbox-output torque. Weight and costare also assumed to vary as (gear ratlo/15.2) "5.
TABLE 48
HAMILTON STANDARD DIVISICN GEARBOX CHARACTERISTICS
Weight- kg (Ibm)
price - S/kg (S/ibm)
Maintenance Material at 8508 N'm
(6275 ft-lb) torque - $/h
Maintenance labor at 8508 N-m
(6275 ft'Ib) torque - man-h/h
Mechanical F_fficlency*
Current Advanced
Technology Te chnolog_z ....
Upper line of
Figure 51
Lower line of
Figure 51
506 (2_0) 396 (180)
•37 .077
.021 .0056
• 978 .983
*Including accessory drive gearbox and lube pump, but not aircraft accessorieg.
The current technology gearbox has an assumed Time Between Overhauls (TBO) o_7000 hours (typical of current service) while the advanced technology gearbox
has on-conditlon maintenance assumed. Of the overall maintenance savings,
roughly 3/4 _s due to advanced technology and design features and 1/4 due to
the on-condition assumption. The largest contributions to the maintenanceimprovement arise from the reduction in the number of gears and bearings,
modular construction, and advances in bearings, lubricants, and filtration•
Gearbox Mission Merit Factor Results
To evaluate the advanced technology gearbox, both state-of-the-art and
advanced designs were matched to the STAT baseline aircraft, engine, and
propeller. Changes in propulsion system weight, cost, maintenance, andperformance were calculated for both the 30- and 50-passenger aircraft, and
mission sensitivity factors used to estimate the impact on gross weight,
mission fuel consumption and DOC. Table 49 summarizes the results• The net
result of the advanced technology gearbox is a savings of 1% in fuel and i. 2%
in DOC for the 30-passenger aircraft, 1.3% fuel and 1.7% DOC in the
50 -passenger.
107

175
-r
LIJ
360
320
280
240
(Ib)
200
160
120
150
125
kg
100
75B
50
6000
I!
CONVENTIONAL
, C NO OO
TECHNOLOGY
7000 8000 9000 10000 11000
N.m
I l I I
(ft-lb) 5000 6000 7000 8000
OUTPUT TORQUE
12000
!
9000
Figure 51. Gearbox Weight Generalization.
108

TABLE49ADVANCEDGEARBOX - MISSION ME.RIT FACTOR RF_ULTS
30-Passenger Aircraft - 185.2 km (I00 nmi) Mission
Parameter
Gearbox Weight- kg (ibm)
Gearbox Price - $i000
Gearbox Maintenance - $/h
Gearbox Efficiency* - %
TOTAL
-16 (-36)
-21
-.62
+.5
Merit Factor Im
Chan@e in DOC (%_$264/m 3 $396/m j
($I. O0/gal)
--,2
--.4
--,_
--.4
-1.2
(Sl. 50/gal)
--.9
--.3
--,2
--.4
-1.2
)act
Change inFuel Burned
-.4
50-Passenger Aircraft- 185.2 km (i00 nmi)Mission
Parameter
Gearbox Weight - kg (Ibm)
Gearbox Price - $i000
Gearbox Maintenance - $/h
Gearbox Efflc_ency* - %
TOTAL
Se_
Change$264/m j
C han__.C_h@_n.9.9_( $i. O01gal)
-34 (-76)
-45
-1.29
+.5
*Includes performance and scaling effects.
-.4
--.6
--.4
-1.7
it Factor Im
in DOC (%}
$3 96/m j
$I. 50/gal)
--.4
--.6
--.2
--,5
-1.7
_act
Change inFuel Burned
(%)
-.6
109

ADVANCED TECHNOLOGY IDENTIFICATION AND EVALUATION - Continued
PROPF, LLE R TECHNOLOGY
All data relative to both conventional and advanced technology propellers were
obtained from reports prepared for the ,gTAT program under contract to NASA by
Hamilton Standard Division, United Technologies Corporation 5'9. Extracts
from these reports are incorporated as Appendix B (pgs 159-175).
propeller Se] ection
The propeller data provided by Hamilton Standard Division covers a range of
propeller designs appropriate to the commuter turboprop mission. General
Electric's choice of a low speed (0.45 Mach cruise) baseline aircraft dictated
the choice of a conventional, low flight speed propeller rather than a
prop-fan or high flight speed propeller (see pgs 23-24). For this type,
performance over a range of blade activity factors and integrated lift
coefficients is available for 3- and 4-bladed propellers.
In selecting a propeller for the STAT mission analysis, it was desired to
choose one that was near the optimum for the application, without doing an
exhaustive study of all the possibilities. To this end, a propeller in the
mid range of the data provided was selected as a base, and the impact on DOC
at 185.2 km (I00 nmi) of variations in nt_nber of blades, activity factor, lift
coefficient, tip speed, and power loading was estimated. As a result of this
study, a 228.6 m/s (750 ft/sec) tip speed, 4-bladed propeller was selected
with a 100 activity factor and 0.55 lift coefficient. Its power loading
(power/D 2) at 90°F day takeoff conditions is approximately 80 kW/m 2 (i0
hp/ft 2) .
This se]ected propeller design was used throughout the study to provide
consistency between current, derivative, and advanced powerp]ants.
Following completion of the technical effort on this study by Genera]
_lectric, further input relative to propeller selection and advanced
technology payoff was received from Hamilton Standard via NASA. That material
is covered in Appendix D (pgs 201-202).
Propeller Characteristics
Performance: Propeller performance, in the non-dimensional form of net thrust
coe{-f-[cq-e--_ (CTne t) versus power coefficient (Cp) and advance ratio (J)
was provided by Hamilton Standard in tabular form. For a given propeller
design, this basic performance characteristic is identical for conventional
and advanced technology. For the advanced technology propeller, performance
may be modified by the addition of blade tip sweep or blade tip airfoils
("proplets"). Blade tip sweep can eliminate compressibility losses, but is
generally not necessary to improve the propeller performance for low speed
airplanes. The major benefit of sweep is to effect relative Mach ntm_berswhich are below the critical Mach numbers of the airfoil sections. The
addition of blade tip proplets provides a performance improvement of varying
magnitude over most regimes of propeller operation. A correction to CTne t
as a function of Cp an_ J has been provided. (See Appendix B, for a
detailed description of the performance calculation procedure.)
ii0
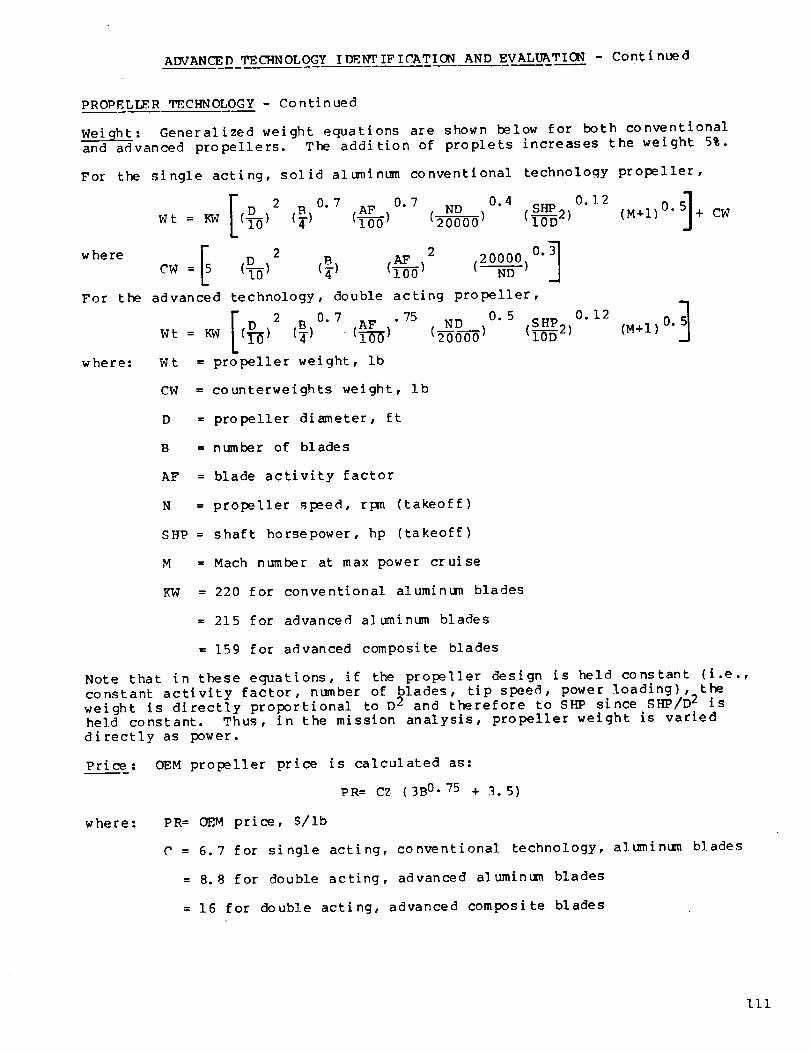
ADVANCED TECHNOLOGY IDENT IF ICATION AND EVALUATION - Cont inued
PROPELLER T}_CHNOLOGY - Continued
Weight: Generalized weight equations are shown below for both conventional
and advanced propellers. The addition of proplets increases the weight 5%.
For the single acting, solid alt_ninum conventional technology propeller,
[ ___ 2_ B 0.7 AF 0.7 ND 0.4 SHP 0.].2Wt : KW ( ) ( ) (T___) (2---0-_) (i--_2) (M+I)t
where [5 _00CW (_0) 2 2 0.= (B 20000._) ( ) (---N-6-J
For the advanced technology, double acting propeller,
0Wt = KW ( ) ( ) (___) (_--_0--0_) (l--_z) (M+I) 0.
where: Wt = propeller weight, ib
CW = counterweights weight, Ib
D = propeller diameter, ft
B = number of blades
AF = blade activity factor
N = propeller speed, rpm (takeoff)
SHP = shaft horsepower, hp (takeoff)
M = Mach number at max power cruise
KW = 220 for conventional aluminum blades
= 215 for advanced alumintm_ blades
= 159 for advanced composite blades
Note that in these equations, if the propeller design is held constant (i.e.,
constant activity factor, number of blades, tip speed, power loading), the
weight is directly proportional to D 2 and therefore to SHP since SHP/D 2 isheld constant. Thus, in the mission analysis, propeller weight is varied
directly as power.
Price: OEM propeller price is calculated as:
PR= CZ (3B 0"75 + 3.5)
where : PR= OEM price, S/ib
C = 6.7 for single acting, conventional technology, aluminum blades
= 8.8 for double acting, advanced aluminum blades
= 16 for double acting, advanced composite blades
III
ADVANCED TECHNOLOGY IDENTIFICATION AND EVALUATION - Continued
PROPF_LLER TE_CHNOLOGY - Continued
B = No. of blades
Z = learning curve factor
= 0.48 for asstuned production rate of I00 units per year.
Proplets increase the cost by 10%.
Maintenance: An on-condition maintenance philosophy was assumed for both
conventional and advanced technology propellers. The total maintenance costs
are (expressed as dollars per flight bout per SI000 of OF_M price) 0.015 for
the conventional propeller and 0.036 for the advanced composite propeller. No
maintenance cost estimate is available for the advanced technology, aluminum
propeller, but it is expected to be only slightly higher than for the
conventional aluminum.
Advanced Propeller _echnology Evaluation
Various advanced technology propeller features were evaluated based on their
impact on DOC at 185.2 km (100 nmi) in the same way that advanced technology
engine features were.
Blade tip sweep was eliminated from consideration because the selected design
did not have any performance losses due to compressibility effects at any of
the STA_" baseline mission flight conditions.
The advanced, aluminum, double acting pitch change propeller was evaluated
against the conventional, a]tminum, single acting propeller. Although the
maintenance cost of the double acting aluminum blade is not available, it is
expected to be similar to that of the single acting conventional, aluminum
airfoil and less than that of the double acting, advance_d, composite design
(i.e., between 0. 015 and 0. 036 dollars per flight hour per $1000 of OEM
price). Table 50 presents the_ evaluation results for the 30-passenger
aircraft size.
An evaluation of composite versus aluminum airfoils was made with the same
maintenance cost assumption. Several composite blade configurations are under
consideration by Hamilton Standard, including fabricated metal spars, hollow
spars of Boron and a]umint_, resin-matrix spars, and composite shells of
materials such as carbon or l<evlar. The cost, weight, and maintenance
estimates are expected to be representative of a final, production design.
Table 51 shows the result of the evaluation of composite blades.
The addition of blade tip proplets improves the performance of the_ propeller,
thereby allowing the entire propulsion system to be scaled down while meeting
the same thrust requirements. The impact of this size reduction on engine and
gearbox price and weight overrides the inherent propeller price and weight
increases due to proplets, resulting in a net savings (Table 52).
Based on the_ results detailed he_re, a composite airfoil design with proplets
and a double acting pitch change mechanism was selected as the advanced
propeller o
112

TABLE 50
ADVANCED PROPF.LLER - MISSIGN MERIT FACTOR RESULTS
Alumintm_ _lade, Double Acting versus Single Acting Pitch Change
g0-Passenger Aircraft- 185.2 km (i00 nmi) Mission
Parameter
Propeller Weight - kg (ibm
Propeller Price - $1000
Propeller Maintenance - $/h
Propeller Efficiency- %
TOTAL
Merit Factor TmDact
_j ($1.00/gal)2. 7(-28)I -.18
J +.05
+.04 to +.01 to +.14+.38
Change in DOC '(%)$2 64/m j S396/m 3
-.12 tO +. 01
($i. 50/gal)
-.20
+. 05
+.0! to +.12
-.14 to -.03
Change i nFuel Burned
(%)
-. 31
TABLE 51
ADVANCED PROPELLER - MISSION MERIT FACTOR RESULTS
Composite Blade vs Aluminum Blade, Double Acting Pitch Change
30-Passenger Aircraft- 185.2 km (I00 nmi) Mission
Parameter
Propeller Weight - kg (ibm)
Propeller Price - $i000
Propeller Maintenance - $/h
Propeller Efficiency- %
TOTAL
Change
-38 (-83)
+5.6
+.20 to+.54
0
geri t Factor Impact
_ Change in D0C (%1 Change in$ 264/m 5
($1.00/gal)
-.52
+.ii
+.07 to +. 20
-.36 to -. 21
[ $396/m j($I. 50/qal)
-.59
+.10
+.06 to +.17
-.43 to-.32
Fuel Burned
(%)
-. 91
0
-. 91
113
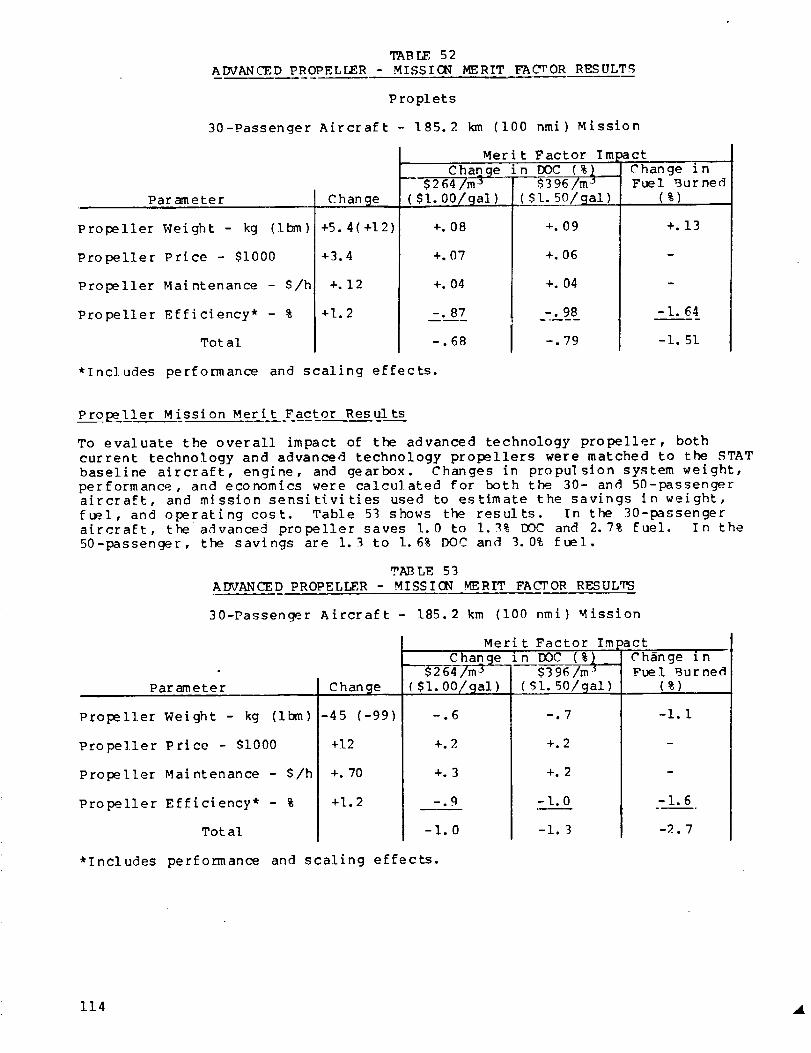
TABLE52ADVANCEDPROPELLER- MISSION MERIT FACTOR RI_SULT_
Proplets
30-Passenger Aircraft - 185.2 km (I00 nmi) Mission
Parameter
Propeller Weight - kg (Ibm)
Propeller Price - $i000
Propeller Maintenance - S/h
Propeller Efficiency* - %
Tot al
+5. 4(+12)
+3.4
+.12
+1.2
Merit Factor Im___ctChanan_in _X)C--_C--6ange {-6---
$264/m _ _-3396/m _ I Fuel Burned
*Includes performance and scaling effects.
+.08
+.07
+. 04
-. 87
-.68
(Sl. 50/gal
*.09
+. 06
+. 04
-. 98
-.79
(%)
+.13
w
-1.64
-I. 51
Propeller Mission Merit Factor Results
To evaluate the overall impact of the advanced technology propeller, both
current technology and advanced technology propellers were matched to the STAT
baseline aircraft, engine, and gearbox. Changes in propulsion system weight,
performance, and economics were calcu]ated for both the_ 30- and 50-passengeraircraft, and mission sensitivities used to estimate the savings in weight,
fuel, and operating cost. Table 53 s.hows the results. In the 30-passenger
aircraft, the a,_vanced propeller saves 1.0 to 1.3% DOC and 2.7% fuel. In the
50-passenger, the savings are I. 3 to 1. 6% DOC and 3. 0% fuel.
TAB LI_ 53
ADVANCED PROPELLER - MISSION MERIT FACTOR RESULTS
30-Passenger Aircraft - 185.2 km (I00 nmi) Mission
Parameter
Propeller Weight - kg (ibm)
Propeller Price - $i000
Propeller Maintenance - $/h
Propeller Efficiency* - %
Total
-4 5 (-99)
+12
+. 70
+1.2
Merit Factor Im
Change{ n ooc (%__$3 96 Im
Sl. oo__/.q_!_-
--°6
+.2
+.3
--°9
-1.0
--,7
+.2
+.2
-1.0
-1.3
)actT---------
Change inFuel _ur ned
(%)
-l. 1
-1.6
-2.7
*Includes performance and scaling effects.
114
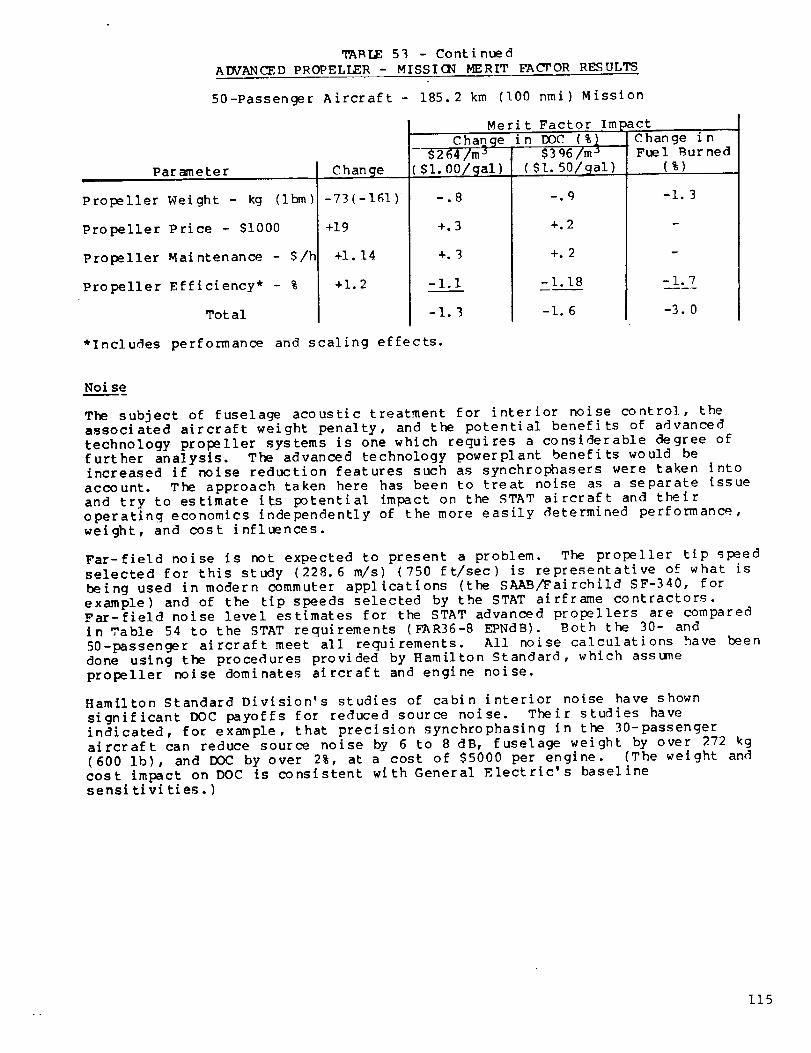
TABLE5_ - ContinuedADVANCED PROPELLER - MISSION MERIT FACTOR RESULTS
50-Passenger Aircraft- 185.2 km (I00 nmi) Mission
Merit Factor Imoact
Chan_ i n DOC$264/m _ $3q6
Change _ ($I. 50/a_9__/_-
-.8
+.3
+.3
-I.I
-1.3
Parameter
Propeller Weight - kg (Ibm)
Propeller Price - $i000
Propeller Maintenance - $/h
Propeller Efficiency* - %
Tot al
-73(-161)
+19
+I. 14
+1.2
*Includes performance and scaling effects.
-.q
+.2
+.2
-1.18
-1.6
Change i nFuel ;_ur ned
(%)
-1.3
m
-1.7
-3. 0
Noise
The subject of fuselage acoustic treatment for interior noise control, the
associated aircraft weight penalty, and the potential benefits of advanced
technology propeller systems is one which requires a considerable degree offurther analysis. The advanced technology powerplant benefits would be
increased if noise reduction features such as synchrophasers were taken into
account. The approach taken here has been to treat noise as a separate issue
and try to estimate its potential impact on the STAT aircraft and theiroperating economics independently of the more easily determined performance,
weight, and cost influences.
Far-field noise is not expected to present a problem. The propeller tip speed
selected for this study (228.6 m/s) (750 ft/sec) is representative of what is
being used in modern commuter appl[cations (the SAAB/Fairch_id SF-340, for
example) and of the tip speeds selected by the STAT airframe contractors.
Far-field noise level estimates for the STAT advanced propellers are comparedin ,_able 54 to the STAT requirements (FAR36-8 EPNdB). Both the 30- and
50-passenger aircraft meet all requirements. All noise calculations have been
done using the procedures provided by Hamilton Standard, which assume
propeller noise dominates aircraft and engine noise.
Hamilton Standard Division's studies of cabin interior noise have shown
significant DOC payoffs for reduced source noise. Their studies have
indicated, for example, that precision synchrophasing in the 30-passenger
aircraft can reduce source noise by 6 to 8 dB, fuselage weight by over 272 kg
(600 lb), and DOC by over 2%, at a cost of $5000 per engine. (The weight and
cost impact on DOC is consistent with General Electric's baselinesensi tivi ties. )
115

APVANCEDTECHNOLOGYI DENTIFICATICN AND EVALUATION - Continued
PROPF, LLER TECHNOLOGY - Continued
The benefit is highly sensitive to the assumed baseline acoustic treatment
weight and the assumed tradeoff between noise and weight. The 30-passengerbaseline aircraft used in this study contains 272 kg (600 Ib) of acoustic
treahnent weight in total, against 383 kg (844 Ib) in the baseline used byHamilton Standard. Based on Reference 4, it is estimated that a propellernoise reduction of I0 dB could save on the order of 1% TOGW in acoustic
treatment on the General Electric 30-passenger baseline aircraft. A 10 c]B
reduction is a reasonable estimate of the total obtainable with tip sweep and
synchro phasing, and the weight saving translates into a 1% DOC saving also.
See Appendix D (pgs 199-200) for more details of Hamilton Standard's results.
TABLE 54
FAR FIELD NOISE LE'_LS
Altitude - m (ft)
True Air Speed- m/s (Knots)
Power Setting
Noise Limit, EPNdB
(FAR-36 Limit-8)
Adv 30-Passenger T/PNoise Level, EPNdB
Adv 50-Passenger T/P
Noise Level, EPNdB
Takeo ff Ap_pr oach S id_____e1_i n___e
914 (3000) 122 (400) 0 (0)
59.2 (115) 63. 3 (123) 59. 2 (115)
Takeoff 40% Max Climb ,'akeoff
81 q0 86
80. 5 89.0 86.0
80.0 88.5 85. 5
116
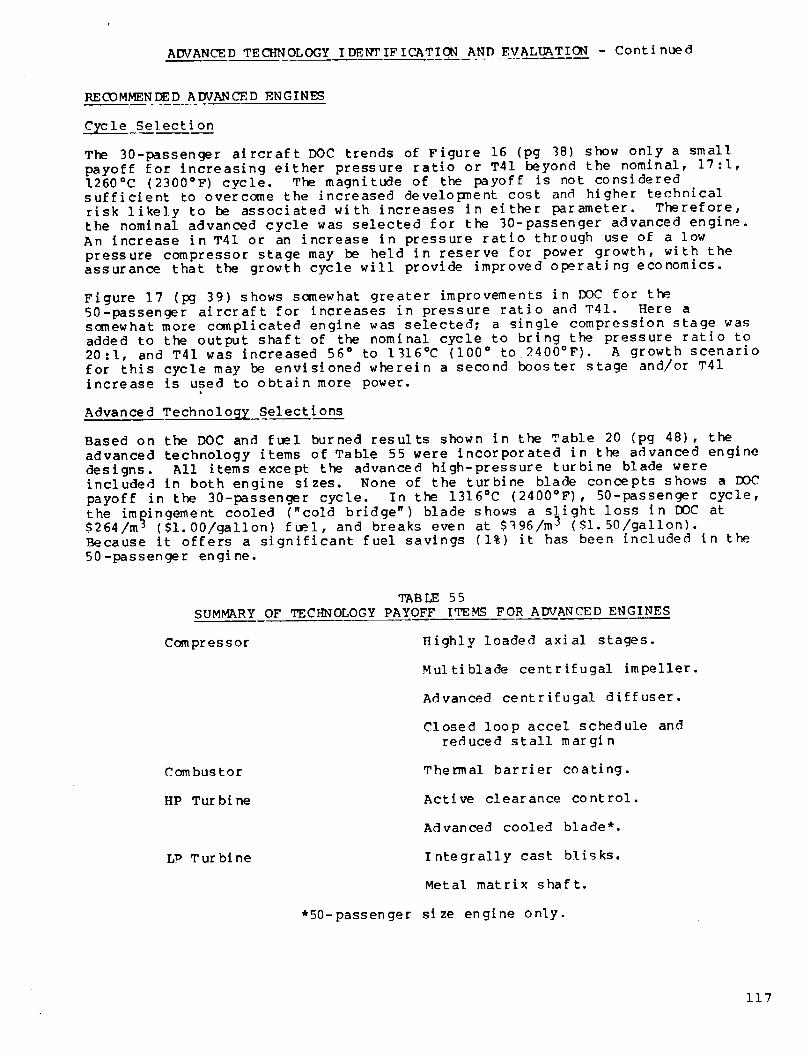
ADVANCED TECHNOLOGY IDENTIFICATION AND EVALUATION - Continued
RECOMMENDED ADVANCED ENGINES
Cycle Selection
The 30-passenger aircraft DOC trends of Figure 16 (pg 38) show only a small
payoff for increasing either pressure ratio or T41 beyond the nominal, 17:1,
1260°C (2300°F) cycle. The magnitude of the payoff is not considered
sufficient to overcome the increased development cost and higher technical
risk likely to be associated with increases in either parameter. Therefore,
the nominal advanced cycle was selected for the 30-passenger advanced engine.
An increase in T41 or an increase in pressure ratio through use of a low
pressure compressor stage may be held in reserve for power growth, with theassurance that the growth cycle will provide improved operating economics.
Figure 17 (pg 39) shows somewhat greater improvements in DOC for the.
50-passenger aircraft for increases in pressure ratio and T41. Here a
somewhat more complicated engine was selected; a single compression stage was
added to the output shaft of the nominal cycle to bring the pressure ratio to
20:1, and T41 was increased 56 ° to 1316°C (100 ° to 2400°F). A growth scenario
for this cycle may be envisioned wherein a second booster stage and/or T41
increase is used to obtain more power.
Advanced Technology Selections
Based on the DOC and fuel burned results shown in the Table 20 (pg 48), the
advanced technology items of Table 55 were incorporated in the advanced engine
designs. All items except the advanced high-pressure turbine blade were
included in both engine sizes. None of the turbine blade concepts shows a DOC
payoff in the 30-passenger cycle. In the 1316°C (2400°F), 50-passenger cycle,
the impingement cooled ("cold bri4ge") blade shows a slight loss in DOC at
S264/m _ ($1.00/gallon) fuel, and breaks even at $_96/m j ($1.50/gallon).
Because it offers a significant fuel savings (1%) it has been included in the
50 -passenger engine.
TABLE 55
SUMMARY OF TECHNOLOGY PAYOFF ITEMS FOR ADVANCED ENGINES
Compressor
Combustor
HP Tur bi ne
LP Turbine
Highly loaded axial stages.
Multiblade centrifugal impeller.
Advanced centrifugal diffuser.
Closed loop accel schedule and
reduced stall margin
Thermal barrier coating.
Active clearance control.
Advanced cooled blade*.
Integrally cast blisks.
Metal matrix shaft.
*50-passenger size engine only.
117

APVANCED TECHNOLOGY IDENTIFICATION AND EVALUATION - Continued
RECOMMEND_,_D ADVANCED ENGINES - Continued
Advanced En@ine Descriptions
All the design work on the advanced engines was done in a size calculated to
match the power of the baseline power plants in the baseline missionanalysis. (See Table 5, pg 14.) This will be referred to hereafter as the
"design size" of the advanced engines. The improvements in power plantcharacteristics result ultimately in a lighter aircraft requiring somewhat
smaller power pl ants. The final advanced engines required to perform themission will be referred to as "mission size".
Preliminary designs were carried out on the aerodynamic components of the
selected advanced engines. The 30-passenger engine has a 3 axial + 1
centrifugal stage compressor driven by a single stage high-pressure turbine.
The cycle pressure ratio is 17 to I, resulting in a high-pressure turbinepressure ratio of 4. 2, which is considered the practical limit that can be
obtained with a single stage turbine. The low-pressure turbine is a two
stage, counter-rotatlng design.
The 50-passenger engine utilizes the same core design as the 30-passenger
engine, scaled up as necessary. A single, ax{al compressor stage ("booster")is added to the output shaft, driven by the low-pressure turbine. The boosterand core are matched such that the HP turbine pressure ratio is approximately
4.2. The low-pressure turbine in this engine is also counter-rotating, and
has three stages.
Tables 56-57 provide cycle and performance summaries of the advanced engines.
Advanced engine performance in terms of equivalent power and fuel flow vs.altitude, Mach number, ambient temperature and power setting is provided in
Appendix C (pgs 177-197).
TABLE 56
ADVANCED, 30-PASSENGER SIZE ENGINE CYCLE - SEA L_VEL, STATIC
Ambient Temperature
Power getting
Turbine Inlet Temp.
Cycle Pressure Ratio
Output Power
Specific Fuel Consumption
Inlet Corrected Flow
Inlet Flow
(No Inlet Protection)
°C (°F) 15 (59) 32.2 (90)
Takeoff* Takeoff
°C (°F) 1260 (2300) 1260 (2300)
17.0 15.3
kW (hp) 1107 (1485) 943 (1265)
kg/k'W'h (lbm/hp'h) .267 (.439) .278 (.457)
kg/s (ibm/sec) 3.55 (7. 8) 3.28 (7. 2)
kg/s (ibm/sec) 3.55 (7.8) 3.18 (7.0)
*Data in this column, at full rated turbine inlet temperature on a standard
day, is provided for reference only. The engine is intended to be flat ratedto 30°C (86°F).
118
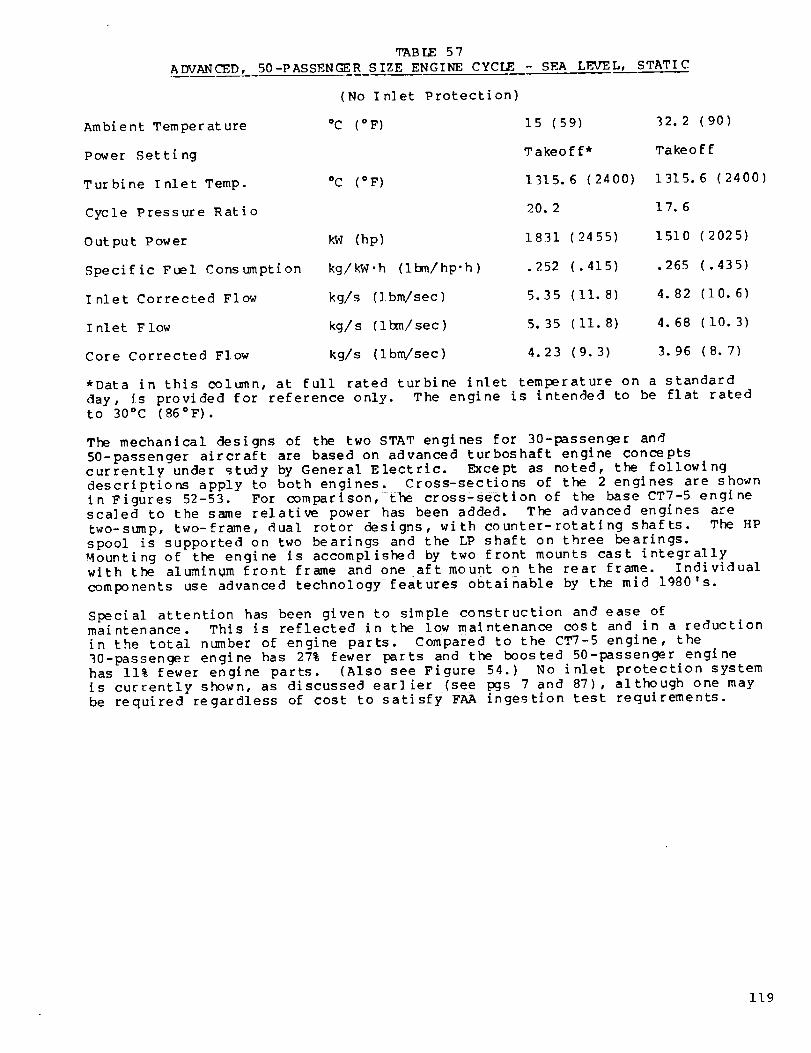
TABLE 57
ADVANCED, 50-PASSENGER SIZE ENGINE CYCLE - SEA LEVEL, STATIC
(No Inlet Protection)
Ambient Temperature °C (OF) 15 (59) _2.2 (90)
Power SettingTakeof f* Takeoff
Turbine Inlet Temp. °C (oF) 1315.6 (2400) 1315.6 (2400)
Cycle Pressure Ratio20.2 17.6
Output Power kW (hp) 1831 (2455) 1510 (2025)
Specific Fuel Consumption kg/kW-h (ibm/hp-h) .252 (.415) • 265 (.435)
Inlet Corrected Flow kg/s (I bm/sec) 5.35 (11.8) 4.82 (10.6)
I nlet F low kg/s (ibm/sec) 5. 35 (Ii. 8) 4. 68 (i0. 3)
Core Corrected Flow kg/s (Ibm/sec) 4.23 (9.3) 3.96 (8.7)
*Data in this col_n, at full rated turbine inlet temperature on a standard
day, _s provided for reference only. The engine is intended to be flat rated
to 30°C (86°F).
The mechanical designs of the two STAT engines for 30-passenger and
50-passenger aircraft are based on advanced turboshaft engine concepts
currently under study by General Electric. Except as noted, the following
descriptions apply to both engines. Cross-sections of the 2 engines are shown
in Figures 52-53• For comparison, the cross-section of the base CT7-5 engine
scaled to the same relative power has been added. The advanced engines are
two-slmlp, two-frame, dual rotor designs, with counter-rotating shafts. The HP
spool is supported on two bearings and the LP shaft on three bearings.
Mounting of the engine is accomplished by two front mounts cast integrally
with the aluminum front frame and one aft mount on the rear frame. Individual
components use advanced technology features obtainable by the mid 1980's.
Special attention has been given to simple construction and ease ofmaintenance. This is reflected in the low maintenance cost and in a reduction
in the total number of engine parts. Compared to the CT7-5 engine, the
30-passenger engine has 27% fewer parts and the boosted 50-passenger engine
has 11% fewer engine parts. (Also see Figure 54.) No inlet protection system
is currently shown, as discussed earlier (see pgs 7 and 87), although one may
be required regardless of cost to satisfy FAA ingestion test requirements.
119
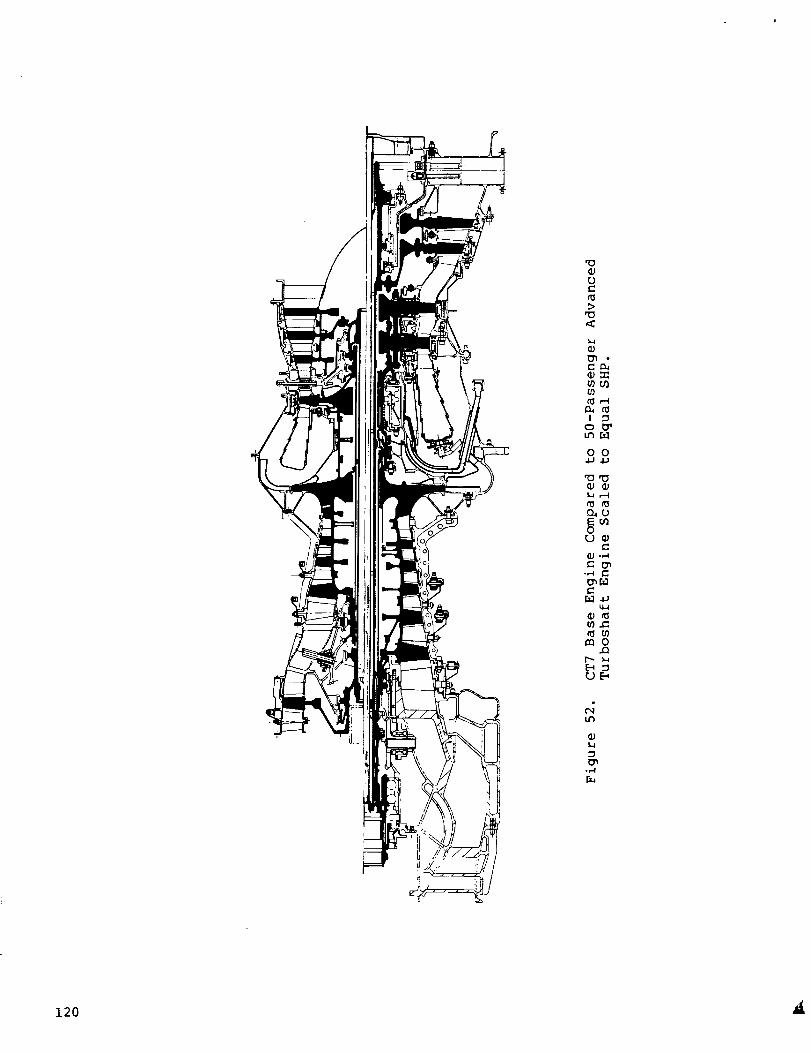
L)
"0
o
I
O0•iJ ,_.J
"o'lo
04L)E_0U_
.,,_
0,.Q
U_
120

ro
rj
:>,lo
o3_r)u_
!
O0
,1_ ,'el
e-
• ,,-I ¢"
e-
_ mmo
u_
llJ
_.Reproduced from
[best available copy..._
121
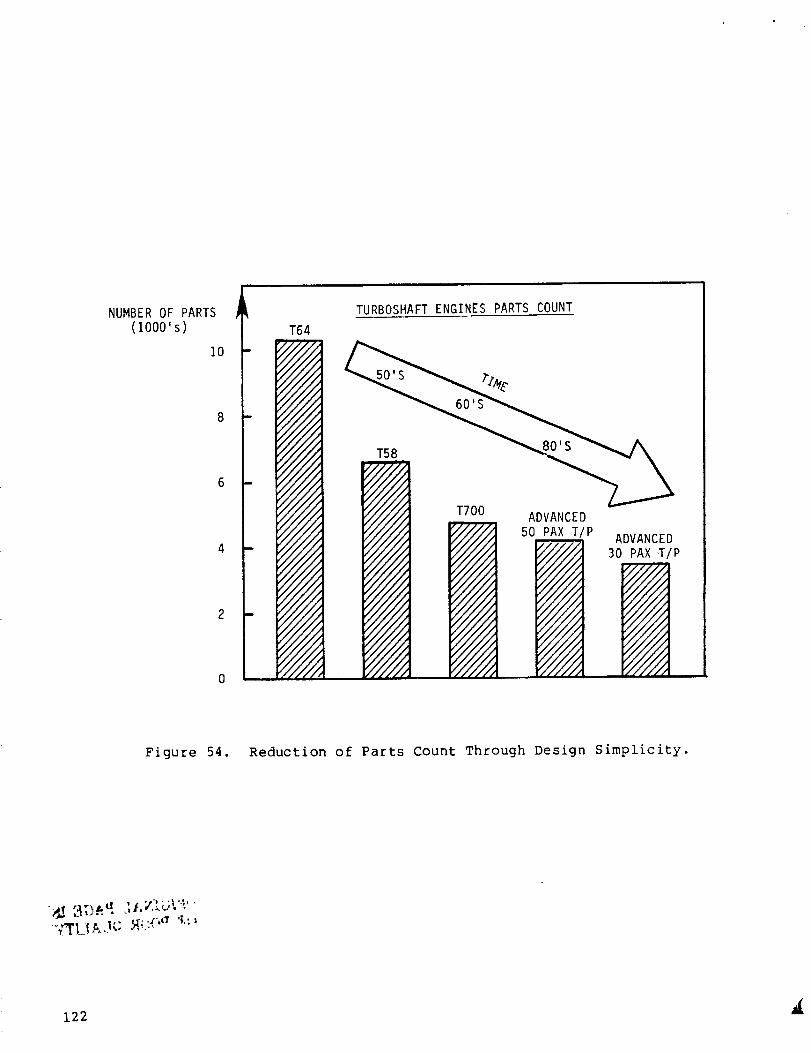
NUMBER OF PARTS(1000's)
I0
i
T64
TURBOSHAFT ENGINES PARTS COUNT
Figure 54. Reduction of Parts Count Through Design Simplicity.
"(TLI_,3¢" _':-'/'"_ -i.:,
122

ADVANCEDTECHNOLOGY IDENT IF ICATIGN AND EVALL_TION - Cont i nued
RECOMMENDED ADVANCED ENGINES - Continued
The compressor has three axial stages and one centrifugal stage. The axial
stages have highly loaded, low aspect ratio, high speed airfoils [472.4 m/s
(1550 ft/sec) tip speed]. Blades and disks are cast integrally in Custom 450
material. Stages 2 and 3 are cast as a unit, and the remaining stages aresingle blisks. The centrifugal impeller is a multibladed Inconel 718 casting
(split into inducer and impeller blades) allowing a better aerodynamic match
than possible with continuous blades. All stages have curvic couplings and
are connected by a central tie bolt. Inlet guide vanes and Stage 1 vanes arevariable and made of A286. Stages 2 and 3 vanes are fixed and are made up of
cast Inconel 718 segments.
The centrifugal compressor diffuser is of the advanced "trumpet" design,
replacing the more conventional "dump" diffuser. After passing through aradial diffuser ring, the air is turned axially in a number of individual
passages (trumpets) made of thin-wall plasma sprayed Inconel 718. Excellentfinish on the flowpath surface guarantees a high diffuser efficiency.
The aero-thermo design of the combustor is based on the CT7-5 configuration,
discussed in the CT7-5 Baseline Engine section (pg 7). For improved life andlower maintenance cost, thermal barrier coating and local impingement cooling
shields have been added.
The HP turbine is a single stage high-pressure ratio design similar to the
General Electric FI01 engine (BI bomber) design. Blades and disk rim are
cooled with compressor discharge air. Turbine blade cooling is achieved by
convection through radial holes for the 30-passenger engine, and by a "cold
bridge" convection plus impingement plus film cooling design for the
50-passenger engine. The rotor disk is made of direct aged Inconel 718, theblades are cast Rene' 125 and the nozzle assembly is an Inconel 713 casting.
A through-bolt curvic coupling design allows for ease of assembly and
maintenance.
The aero design for the LP turbine is a 2-stage (3-stage for 50-passenger
aircraft engine) turbine with a turbine midframe. The frame has struts with
compressor discharge air cooled flowpath walls and service tubes. Surfaces
exposed to hot gases are protected by a thermal barrier coating. Special"flexlink" attachment of the struts allows radial thermal growth while still
providing axial stiffness. All rotor stages are integrally cast Inconel 792blisks with shrouded airfoils. This configuration has both a cost and weight
advantage over the conventional blade/disk configuration. An additional
weight advantage is obtained by using a metal matrix composite shaft.
Controls and accessories are bottom-mounted off the front frame. They are
similar to those currently on the CT7-5 engine except for the change to aFADEC. Use of a FADEC will allow optimtrn control of compressor operating llne
with additional payoffs through the capacity to schedule active clearance
control and provide input for the diagnostic data and history recorder.
123
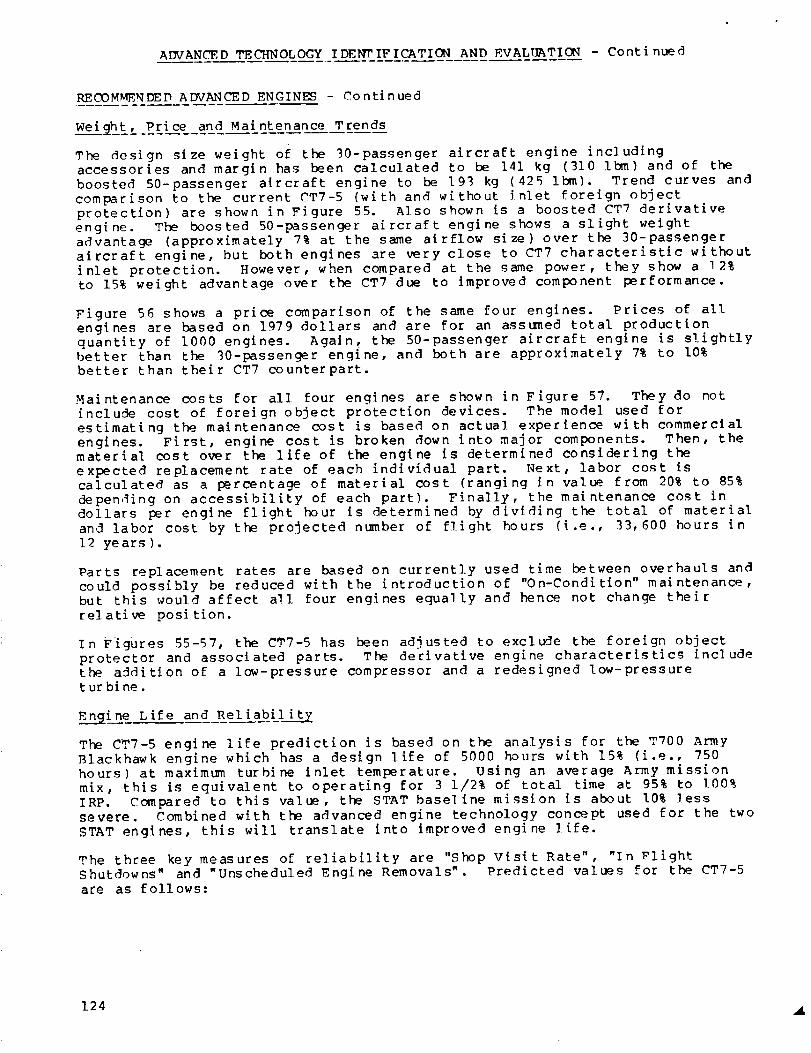
ADVANCE, D TECHNOLOGY IDENTIFICATION AND EVALUATION - Continued
RE CO MMI_N DE D ADVANCED ENGINES - Continued
WeiHht, Price and Maintenance Trends
The design size weight of the 30-passenger aircraft engine including
accessories and margin has been calculated to be 141 kg (310 Ibm) and of the
boosted 50-passenger aircraft engine to be 193 kg (425 ibm). Trend curves and
comparison to the current CT7-5 (with and without inlet foreign object
protection) are shown in Figure 55. Also shown is a boosted CT7 derivative
engine. The boosted 50-passenger aircraft engine shows a slight weight
advantage (approximately 7% at the same airflow size) over the 30-passenger
aircraft engine, but both engines are very close to CT7 characteristic without
inlet protection. However, when compared at the same power, they show a ]2%
to 15% weight advantage over the CT7 due to improved component performance.
Figure 56 shows a price comparison of the same four engines. Prices of all
engines are based on 1979 dollars and are for an assumed total production
quantity of 1000 engines. Again_ the 50-passenger aircraft engine is slightly
better than the 30-passenger engine, and both are approximately 7% to 10%
better than their CT7 counterpart.
Maintenance costs for all four engines are shown in Figure 57. They do not
include cost of foreign object protection devices. The model used for
estimating the_ maintenance cost is based on actual experience with commercial
engines. First, engine cost is broken down into major components. Then, thematerial cost over the life of the engine is determined considering the
expected replacement rate of each individual part. Next, labor cost is
calculated as a percentage of material cost (ranging _n value_ from 20% to 85%
depen._ing on accessibility of each part). Finally, the maintenance cost in
dollars per engine flight hour is determined by dividing the total of material
and labor cost by the projected ntm_ber of flight hours (i.e., 33,600 hours in
I_- years).
Parts replacement rates are based on currently used time between overhauls and
could possibly be reduced with the introduction of "On-Condition" maintenance.,but this would affect all four engines equally and hence not change their
relative position.
In Figures 55-57, the CT7-5 has been adjusted to exclude the foreign object
protector and associated parts. The derivative engine characteristics include
the addition of a low-pressure compressor and a redesigned low-pressure
tur bi ne.
Engine Life and Reliabilit Z
The CT7-5 engine li6e prediction is based on the analysis for the T700 Army
Blackhawk engine which has a design life of 5000 hours with 15% (i.e., 750
hours) at maximum turbine inlet temperature. Using an average Army mission
mix, this is equivalent to operating for 3 1/2% of total time at 95% to ].00%
IRP. Compared to this value, the STAT baseline mission is about 10% less
severe. Combined with the advanced engine technology concept used for the two
STAT engines, this will translate into improved engine life.
The three key measures of reliability are "Shop Visit Rate", "In _'light
Shutdowns" and "Unscheduled Engine Removals". Predicted values for the CT7-5
are as follows:
124

WEIGHT
600 -
500 -
400 "
(Ib)
300 -
200 -
PRICE
(% OF CT7-5)
300
25O
200
kg
150
100
120
110
I00
90
80
70
2
I
4
(ALL WITHOUT FOP)
CT7 DERIVATIVE _ ._
CT7 5 "_ _'1
- _'/ "_-50 PASSENGER ADVANCED
I
ENGINE
30 PASSENGER ADVANCED ENGINE
I
4 6 8kg/sec
I ! I I
12 16 208 (Ib/sec)
ENGINE INLET CORRECTED FLOW
Figure 55. Engine Weight vs Airflow.
CT7 DERIVATIVE--_
.,.#J_50//ir_
(ALL WITHOUT FOP)
PASSENGER ADVANCED ENGINE
I
---30 PASSENGER ADVANCED ENGINE
4 kg/sec 6
I I I
8 (Ib/sec) 12 16
ENGINE INLET CORRECTED FLOW
8
I
20
10
10
Figure 56. Engine Price vs Air flow.
125
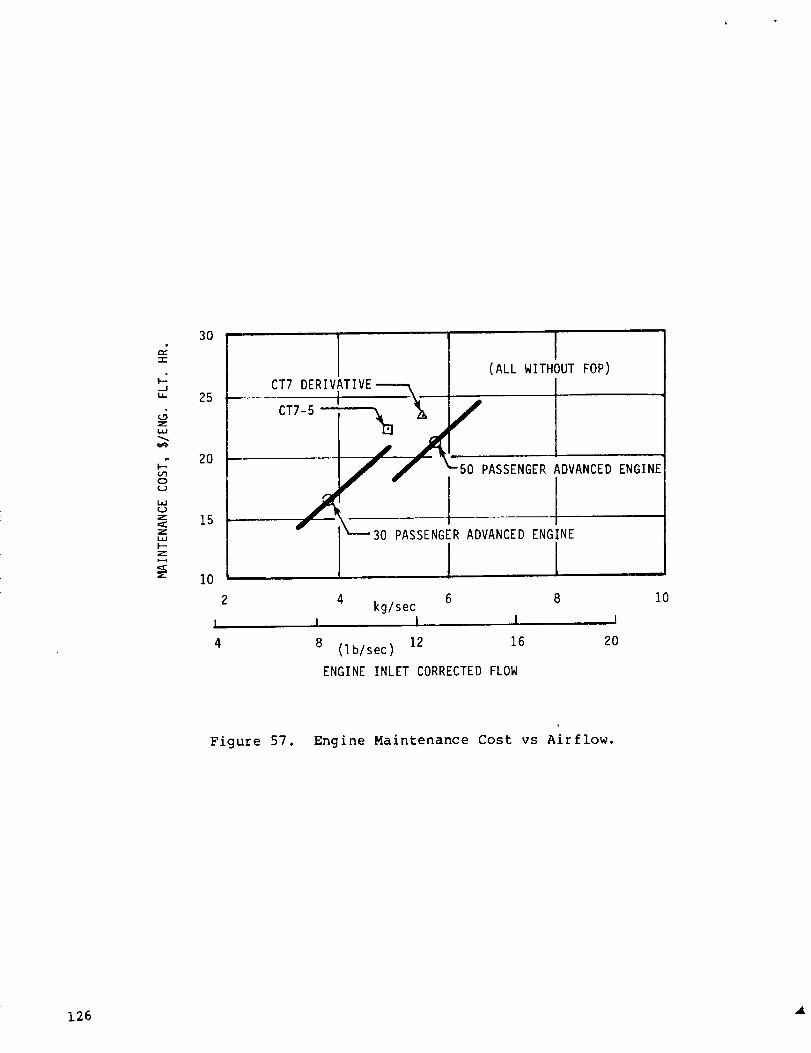
-I-
Z
_C
0(,.)
LLI
Z,:IZ
ZW
F-Z
30
25
20
15
10
2
4
I(ALL WITHOUT FOP)
CT7 DERIVATIVE-----_
CT7-5 I __
L___PASSENGER ADVANCED ENGINE
30 PASSENGJR ADVANCEDENG!NE14 6
kg/secI I I
I8
I
8 (Ib/sec) 12 16 20
ENGINE INLET CORRECTED FLOW
10
Figure 57. Engine Maintenance Cost vs Airflow.
126
ADVANCED TECHNOLOGY IDENTIFTCATION AND EVALUATION - ContJ nued
RECOMMENDED ADVANCED ENGINES - Continued
Shop Visit Rate(on condi ti on maintenance )
Unscheduled Engine Removals
In Flight Shut Downs
Events r___r_!O0_0_E____gjne Flight Hours
Max Initial Mature
0. 55 0.45
0. 50 0.12
0.18 0.05
These values reflect the advantage obtained from extensive engine flight
experience with the T700 engine family prior to service introduction. The
advanced STAT engines having a much simpler core and 11% to 25% fewer parts
are expected to obtain these objectives at a much earlier stage.
Installation Factors
In performing the mission analysis, it has been assumed for both the_conventional and advanced technology engines that aircraft accessory power and
cabin conditioning requirements can be met by the extraction of 37 or 56 kW
(50 or 75 horsepower) from the propeller gearbox for the 30- and 50-passenger
aircraft, respectively. The impact of this power extraction on installed
performance is summarized in Table 58.
Although no core engine customer bleed was assumed in the mission analysis, it
may at times be required for aircraft anti-lcing. Table 59 gives bleed air
properties and engine performance effects for bleed extraction at the maximum
permissible rate (6.5%) at a representative cruise condition.
TAB LE 5 8
POWER EXTRACTION EFFECTS
Advanced Technology Propulsion System
Power Extracted from Propeller Gearbox
30-Passenger 50-Passenqer
Power Extraction- kW (hp) 37 (50) 0 56 (75) 0
System Thrust at Takeoff, SIS,32. l°C (89. 8°F)
Base +3. 6% Base +3. 5%
System Thrust at Max Cruise,3048 m (I0,000 ft)/.45 Mach
_3ase +4. 5% Base +3. 6%
TSFC at Avg. Cruise Thrust,3048 m (i0,000 ft)/.45 Mach
Base -4. 0% Base -3. 4%
127
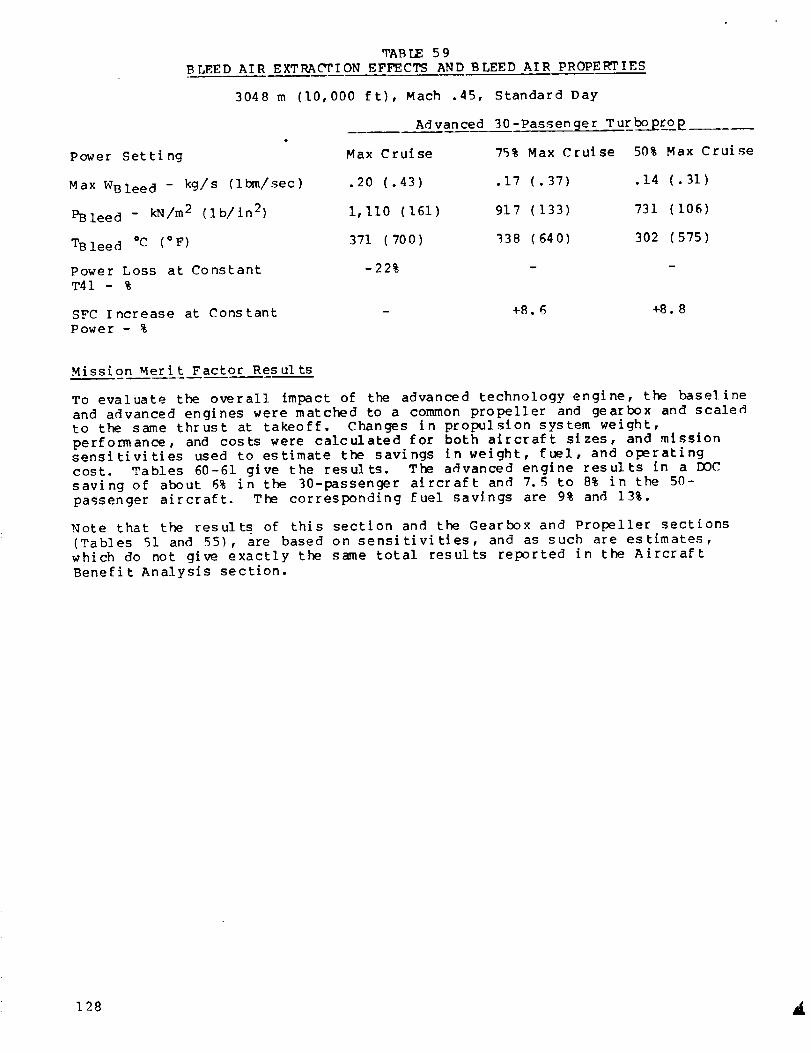
q_ABIZ 59BLEED AIR EXTRACT'ION EFFECTS AND BLEED AIR PROPE_.TIES
3048 m (I0,000 it), Mach .45, Standard Day
Advanced 30-Passenger_ T ur__Rro p
Power Setting
Max WBlee d - kg/s (Ibm/sec)
PBleed- kN/m2 {lb/_n2)
TBlee d °C (°F)
Power Loss at Constant
T41 - %
SFC Increase at Constant
Power- %
Max Cruise 75% Max Cruise 50% Max Cruise
.20 (.43) .17 (.37) .14 (.31)
I, II0 _161) 917 {133) 731 {106)
371 (700) 338 (640) 302 (575)
-22% - -
+8. 6 +8.8
Mission Merit Factor Results
To evaluate the overall Impact of the advanced technology engine, the baseline
and advanced engines were matched to a common propeller and gearbox and scaled
to the same thrust at takeoff. Changes in propulsion system weight,performance, and costs were calculated for both aircraft sizes, and mission
sensitivities used to estimate the savings in weight, fuel, and operating
cost. Tables 60-61 give the results. The advanced engine results in a DOCsaving of about 6% in the 30-passenger aircraft and 7.5 to 8% in the 50-
passenger aircraft. The corresponding fuel savings are 9% and 13%.
Note that the results of this section and the Gearbox and Propeller sections
_Tab]es 51 and 55}, are based on sensitivities, and as such are estimates,
which do not give exactly the same total results reported in the AircraftBenefit Analysis section.
128
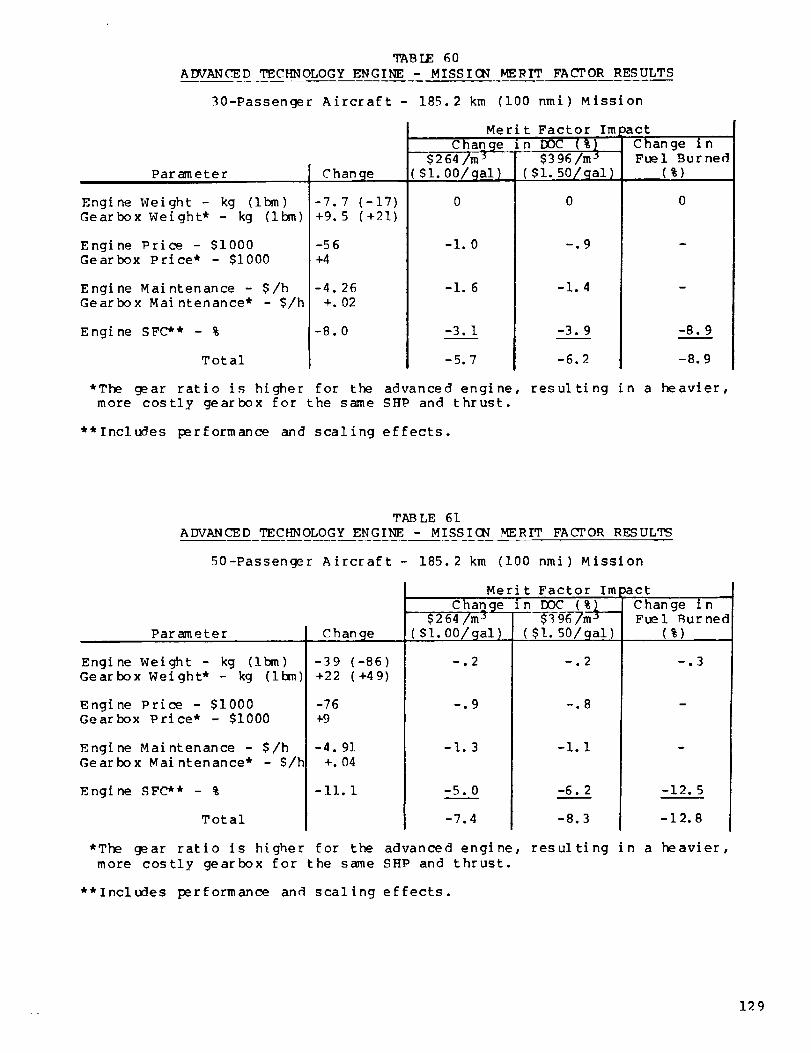
TABLE60ADVANCED TECHNOLOGY ENGINE - MISSION MEI_IT FACTOR RESULTS
30-Passenger Aircraft - 185.2 km (i00 nmi) Mission
Parameter
Engine Weight - kg (ibm)
Gearbox Weight*- kg (Ibm)
Engine Price - $I000Gearbox Price* - 51000
Engine Maintenance - $/h
Gearbox Maintenance* - $/h
Engine SFC** - %
Total
-7. 7 (-17)
+9. 5 (+21)
-56
+4
-4. 26
+. 02
-8.0
Merit Factor Im
(%Change in DOC 1
5264/m s $3 96/m 3
-i. 0
-1.6
(51.5o/9al)
0
-.9
-1.4
)act
Change i nFuel Burned
(%)
*The gear ratio is higher for the advanced engine, resulting in a heavier,more costly gearbox for the same SHP and thrust.
**Includes performance and scaling effects.
TAB LE 61
ADVANCED TECHNOLOGY ENGINE - MISSION MERIT FACTOR RESULTS
50-Passenger Aircraft - 185. 2 km (i00 nmi) Mission
Parameter
Engine Weight - kg (ibm)Gearbox Weight*- kg (ibm)
Engine Price - $I000Gearbox Price* - 51000
Engine Maintenance - $/hGearbox Maintenance* - $/h
Engine SFC** - %
Total
C h an g_e
-39 (-86)+22 (+4 9)
-76
_9
-4. 91
+. 04
-Ii.I
Merit Factor Im
Change in DOC (%1$2 64/m j $3 96/m j
( El. 00/gal)
--.2
-.9
-1.3
(51.50/gal)
--,2
-.8
-i.I
_act
Change i nFuel Burned
(%)
-.3
-12. 5
-12.8
*The gear ratio is higher for the advanced engine, resulting in a heavier,
more costly gearbox for the same SHP and thrust.
**Includes performance and scaling effects.
129

-
,f
/i _
J
F
I
_- il_
130

COMPARATIVE BENEFIT ANALYS IS
CT7 DERIVATIVE ENGINE
The booster stage concept has been demonstrated on a T700 engine. It provides
significant power growth at a very small increase in engine weight and costand with no increase in overall engine dimensions. A boosted version of the
CT7 engine is expected to enter service 2 to 3 years later than the C."_7-5.
The engine selected as a derivative engine for comparison with the current andadvanced engines in the STAT baseline aircraft and missions is an example of a
possible boosted growth version of the CT7-5. A performance stmlmary is
provided in Table 62. A cycle and configuration comparison of the CT7-5, itsbooster derivative, and the two advanced engines is provided in Tables 63-64 .
At takeoff, the core of the boosted engine operates at 3% higher speed and
55.6% (100°F) higher T41 than the basic CT7. ,7o accommodate this increased
severity with durability equivalent to the basic CT7, HP turbine cooling flowis increased, the HP turbine blade material is changed, the core rotating
components are modified to accommodate the increased speed, and casings andstructures are modified to allow for T3 and P3 increases.
The power turbine of the derivative engine is a new, two stage design,somewhat larger in pitch diameter and annulus area than the base CT7 turbine.
The output shaft speeds of the two engines are the same but the pitch diameterincrease results in a turbine with moderate loading and good efficiency. The
alternate approach of adding a third LP turbine stage, which was taken on the
Advanced 50-passenger engine, is a less desirable design for a growth or
derivative engine. Thus a significant growth step can be obtained withoutincreasing engine length or changing the engine envelope.
The boosted engine requires more variable geometry and different control
schedules than the basic engine. Flow matching between the booster and core
is obtained by a combination of three approaches. At high power, output shaft
speed is constant and booster flow is controlled through use of variable inlet
guide vanes (IGV's). At low part power, the IGV's are held at a partiallyclosed position and output shaft speed reduced. This approach has been found
to yield a favorable trade between booster stage efficiency and propellerefficiency. For idle and starting there is provision for intercompressor
bleed. Steady state and transient control of the IGV and variable bleedfunctions has been demonstrated on the T700 booster demonstrator.
A similar control scheme would also be applied to the advanced 50-passenger
turboprop engine.
Precedingpageblank
131
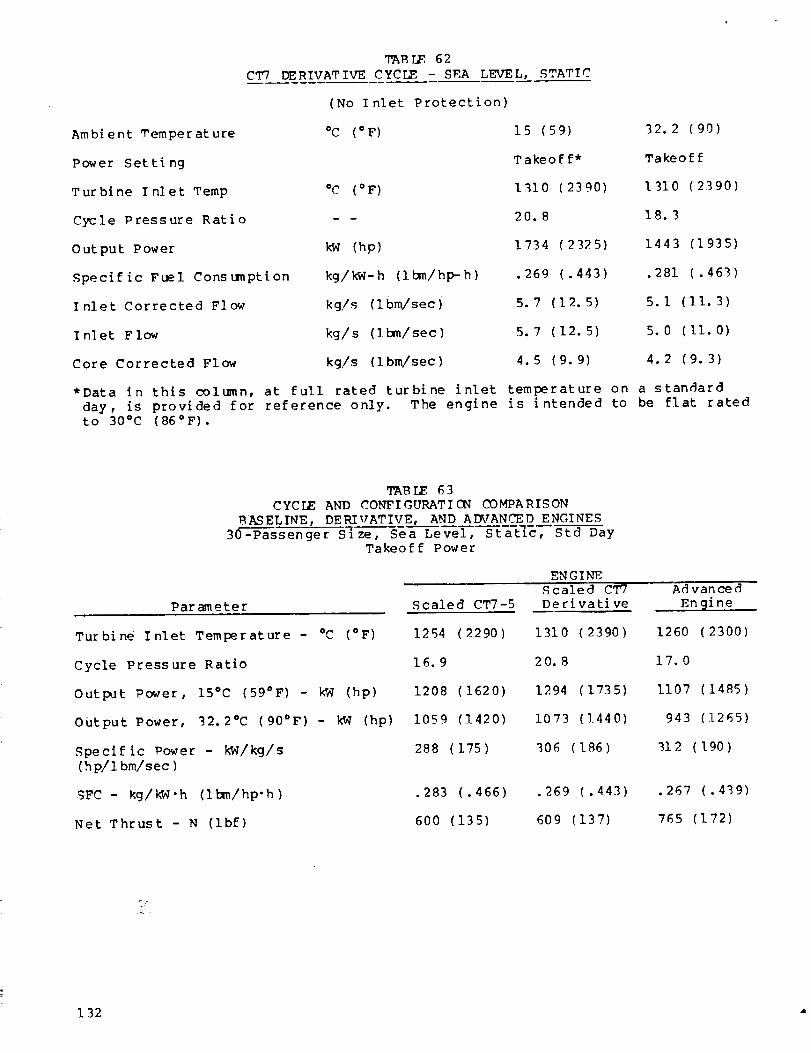
TABLE. 62
CT7 DERIVATIVE CYCLE -SI_.A LEVEL, STATIC
Ambient _'emper at ure
Power Setting
Turbine Inlet Temp
Cycle Pressure Ratio
Output Power
Specific Fuel Consumption
Inlet Corrected Flow
I nl et F low
Core Corrected Flow
(No Inlet Protection)
°C (°F) 15 (59) 32.2 (90)
Takeof f* Takeo f f
oC (°F) 1310 (2390) 1310 (2390)
- - 20. 8 18. 3
k'W (hp) 1734 (2325) 1443 (1935)
kg/kW-h (Ibm/hp-h) .269 (.443) .281 (.463)
kg/s (Ibm/sec) 5.7 (12.5) 5.1 (11.3)
kg/s (lbm/sec) 5. 7 (12. 57 5.0 (Ii. 0)
kg/s (ibm/sec) 4.5 (9.9) 4.2 (9.3)
*Data in this coltmn, at full rated turbine inlet temperature on a stanc]ard
day, is provided for reference only. The engine is intended to be flat rated
to 30°C (86°F).
TABLE 63
CYCLE AND CONFIGURATION COMPARISON
_ASELINE, DERIVATIVE, AND ADVANCED ENGINES
30-Passenger Size, Sea Level, Sta-t-{c, Std Day
Takeoff Power
Parameter
Turbine Inlet Temperature - °C (°F)
Cycle Pressure Ratio
Output Power, 15°C (59°F) - kW (hp)
Output Power, 32.2°C (90°F)- kW (hp)
Specific l_ower - kW/kg/s
(h p/l bm/sec )
SFC - kg/kW.h (Ibm/hp-h)
Net Thrust - N (ibf)
ENGINE
Scaled CT7-5
1254 (2290)
16.9
1208 (1620)
1059 (1420)
288 (175)
Scaled CT7
Deri vati ve
1310 (_390)
20.8
1294 (1735)
1073 (1440)
306 ( 186 )
Ad van ce d
Engine
1260 (2300)
17.0
1107 (1485)
943 (1265)
312 ( 190 )
.283 (.466)
600 (1357
.269 (.443)
609 (137)
• 267 (.439)
765 (172)
132

Parameter
TABLE 63 - Continued
CYCLE AND CONFIGURATION COMPARISON
BASELINE, DERIVATIVE_ AND ADVANCED ENGINES30-Passenger Size, Sea Level, Static, Std Day
Takeoff Power
BOOSTER
Ntm_ber of Stages
Inlet Flow - kg/s (ibm/sec)
Inlet Corrected Flow -
kg/s (i bin/see )
Pressure Ratio
COMPRESSOR
N_nber of Stages
Inlet Flow - kg/s (ibm/sec)
Inlet Corrected Flow -
kg/s (ibm/sec)
Pressure Ratio
HP TURBINE
Ntmber of Stages
Pressure Ratio
LP TURB INE
Nunber of Stages
Co-Rotating or Counter-Rotating
Inlet Temperature - °C (°F)
Pressure Ratio
EXHAUST NOZZLE
Pressure Ratio
Exit Area- m 2 (in 2)
Scaled CT7-5
Scaled CT7Derlvative
None 1
4.2 (9.3)
4.2 (9.3)
1.35
5 Ax + 1 Cent 5 + 1
4.2 (9.3) 4.2 (9.3)
4.2 (9.3) 3.4 (7.4)
None
Ad v an ce d
Engine
3+1
3.5 (7.8)
3.5 (7.8)
16.9 15.7 17. 0
2 2 1
4.4 4.6 4.1
2 2 2
Co Co Co unter
835 (1535) 868 (1595) 866 (1590)
3.3 3.9 3.5
I. 045 i. 045 i. I0
.07 (109) .072 (112) .04 (62)
133
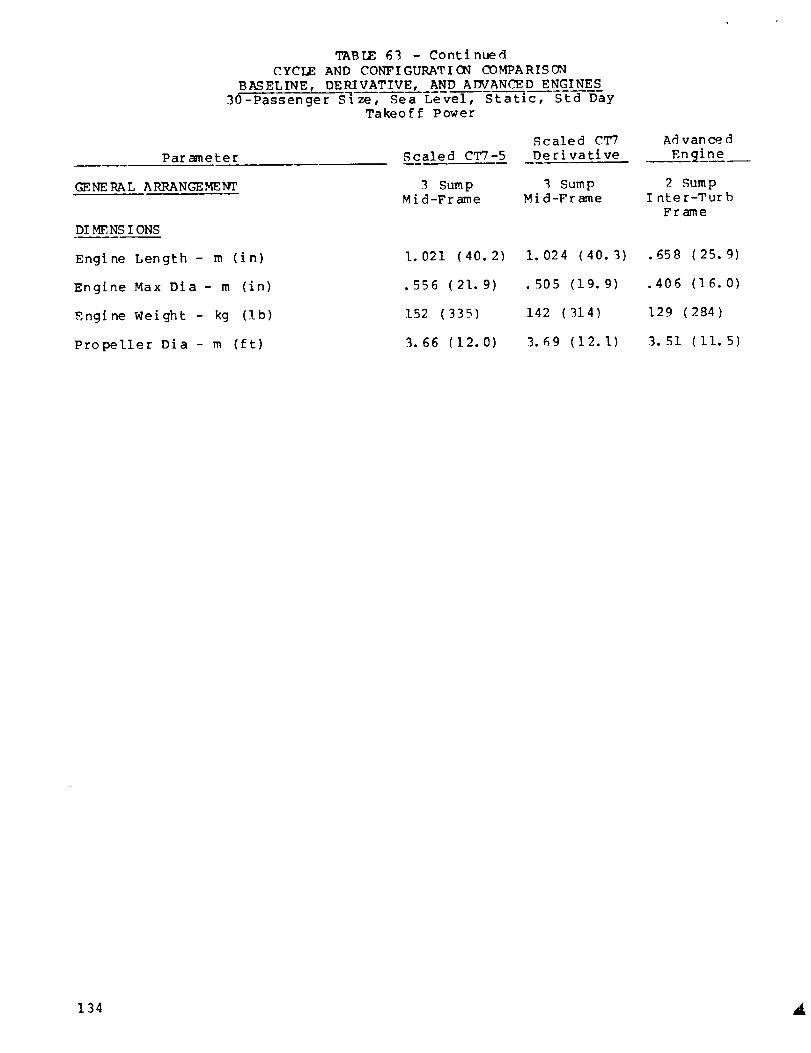
TABLE63 - ContinuedCYCLEANDCONFIGURATIONCOMPARISON
BASELINE, DERIVATIVE, ANDADVANCEDENGINES30-Passenger S-{ze, Sea Level, S_a-_c, Std Day
Takeoff Power
Par_neter Scaled CT7-5
Scaled CT7
Derivative
G_NE RA L ARRANGEMENT 3 Sum pMid-Frame
SumpMid-Frame
DI _ NS IONS
Engine Length - m (in)
Engine Max Dia - m (in)
Engine Weight - kg (Ib)
Propeller Dia - m (ft)
1.021 (40. 2)
.556 (21. 9)
152 (335)
3.66 (12.0)
1.024 (40.3)
.505 (19. 9)
142 (314)
3.69 (12.1)
A_ v an ced
Engine
2 Sum pInter-Turb
Frame
.658 (25.9)
.406 (16.0)
129 ( 284 )
3. 51 (ii. 5)
134

TABLE64CYCLEANDCONFIGURATIONCOMPARISON
BASELINE, DERIVATIVE, AND ADVANCED ENGINES
50-Passenger Size, Sea Level, Static, Std DayTakeoff Power
ENGINE_
Scaled CT7
Parameter Scaled CT7-5 Derivative
Ad vance d
Engine
Turbine Inlet Temperature - °C (°F) 1254 (2290)
Cycle Pressure Ratio 16. 9
Output Power, 15°C (59°F) - kW (hp) 2095 (2810)
Output Power, 32.2°C (90°F) - kW (hp) 1834 (2460)
Specific Power- kW/kg/s (hp/Ibm/sec) 288 (175)
SFC- kg/kW-h (ibm/hp'h) .281 (.462)
Net Thrust- N (ibf) 1041 (234)
IgOOSTE R
Number of Stages None
Inlet Flow - kg/s (ibm/sec)
Inlet Corrected Flow- kg/s (ibm/sec)
Pressure Ratio
COMPRESSOR
Number of Stages
Inlet Flow - kg/s (Ibm/sec) 7.3 (16.0)
Inlet Corrected Flow- kg/s (Ibm/sec) 7.3 (16.0)
Pressure Ratio
HP TURB INE
Number of Stages
Pressure Ratio
1310 (2390)
20.8
2203 (2955)
1834 (2460)
306 ( 186 )
.269 (.443)
1041 (234)
1
7.2 (15.9)
7.2 (15.9)
I._5
5 Ax + 1 Cent 5 + 1
7.2 (15.9)
5.7 (12.6)
16.9 15.7
i_16 (2400)
20.2
1831 (2455)
1510 (2025)
342 (208)
.252 (.415)
1156 (260)
1
5.4 (ll. 8)
5.4 (11.8)
1.35
3+1
5.4 (11.8)
4.2 (9.3)
15.2
2 2 1
4.4 4.6 4.0
135

TABLE64 - ContinuedCYCLEANDCONFIGURATIONCOMPARISON
BASELINE, DERIVATIVE, AND ADVANCED ENGINES
50-Passenger Size, Sea Level, st-a-t-rc, Std DayTakeoff Power
LP T URB INE
Number of Stages
Co-Rotating or Counter-Rotating
Inlet Temperature- °C (°F)
Pressure Ratio
EXHAUST NOZZLE
Pressure Ratio
Exit Area - m 2 (in 2)
GE_NE RAL A RRAN GE ME.NT
DI MENS IONS
Engine Length- m (in)
Engine Max Dia - m (in)
Engine Weight - kg (ib)
Propeller Dia - m (ft)
Scaled CT7-5
Scaled CT7
Deri vative
Ad van ce d
qtne
2 2 3
Co Co Co unter
835 (1535) 868 (1595) 9]6 (1680)
3.3 3.9 4.2
I. 045 I. 045
.123 (191) .122 (190)
3 Sump 3 SumpMid-Frame Mid-Frame
1.3 (51.2)
• 838 (33.0)
243 (536)
4.82 (15.8)
1.306 (51.4)
.732 (28. 8)
264 (581)
4.82 (15.8)
1. I0
.061 (94)
2 SumpI nter-Tur b
Fr ame
.851 (33.5)
.46 (18. I)
180 (397)
4.51 (14.8)
136

COMPARATIVE BENEFIT ANALYSIS - Continued
AIRCRAFT MISSION AND BENEFIT ANALYSIS
Integrated Propulsion System Comparison
Each of the four study engines (CT7-5, CT7 Derivative, Advanced 30-Passenger
Turboprop, and Advanced 50-Passenger Turboprop) was matched with a propeller
of the selected design (see the Propeller Selection section, pg 110) and an
appropriate gearbox. The two current technology engines (i.e., the CT7-5 and
derivative engines) were matched with current technology propel]ers and
gearboxes, and the advanced engines with advanced technology propellers and
gearboxes. Some of the major characteristics of the resulting propulsion
systems are shown on Table 65 in the design size. Table 66 compares the
propulsion systems weight, price, and maintenance when all are scaled to a
common 32.2°C (90°F) day, takeoff shaft power size.
The installed thrust SFC characteristics of the four powerplants are shown in
Figure 58 at the STAT 185.2 km (i00 nml) mission cruise condition; 3048 m
(10000 ft) at 0.45 Mach n_nber. Note that this is the design size SFC
characteristic. When these engines are scaled up or down, the SFC trend of
Figure 13 (pg 34) is applied.
TABLE 65
POWE RP LANT COMPARISON
BASELINE, DERIVATIVE, AND ADVANCED ENGINES
DESIGN SIZE
Propeller and Gearbox
Technology
Adv 30- Adv 50-
CT7-5 CT7-5 Passenger Passenger
Baseline Derivative Turbo_R!p_p - Tur bopro E
Current Current Advanced Advanced
Nominal Gearbox Efficiency .978 .q78 .983 .983
Gear Ratio 18. 5 21.2 22.1 22. 9
Propeller Tip Speed -
m/s (f t/sec)
228.6 (750) 228.6 (750) 228.6 ('I50) 228.6 (750)
Propeller Loading-kW/m z (hp/ft 2)
(Std Day Takeoff)
Propeller Thrust/Power -
N/kW (i b/hp)
(Std Day Takeoff)
90.7 (11.3)
17.9 (3.0)
95. 5 (Ii. 9)
17.9 (3.0)
89.9 (11.2)
18.5 (3.1)
89.9 (11.2)
18.5 (3.1)
Installed TSFC -
kg/N- h (ibm/ibf-h)
[3048 m (i0,000 ft)/
.45 Avg Cruise]
Propeller Efficiency
[3048 m (I0,000 ft)/
.45 Max Cruise]
.049 (.483) .046 (.456) .044 (.430) .041 (.406)
.888 . 884 . 898 . 900
137
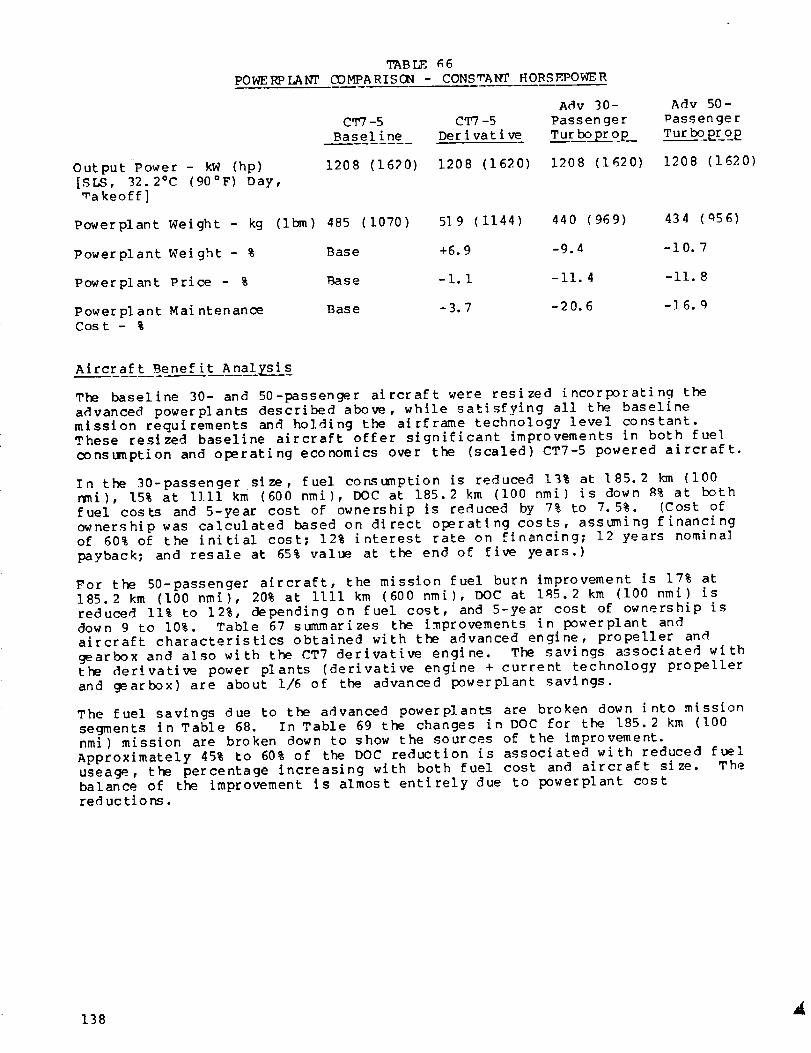
TABLE _6
POWERPLANT COMPARISON - CONSTANT HORSF_OWER
Output Power- kW (hp)
[SLS, 32. 2°C (90°F) Day,_akeoff]
Adv 30- Adv 50-
CT7-5 CT7-5 Passenger Passenger
Baseline Derivative Turboprop Tur bo _rop
1208 (16P0) 1208 (1620) 1208 (1620) 1208 (1620)
Powerplant Weight- kg (Ibm) 485 (1070)
Powerplant Weight - % Base
Powerplant Price - % Base
Powerplant Maintenance BaseCos t - %
519 (1144) 440 (969) 434 (Q56)
+6.9 -9.4 -i0. 7
-i. 1 -ii. 4 -ii. 8
-3.7 -20.6 -16.9
Aircraft Benefit Anal?sis
The baseline 30- and 50-passenger aircraft were resized incorporating the
advanced powerplants described above, while satisfying all the baselinemission requirements and holding the airframe technology level constant.
These resized baseline aircraft offer significant improvements in both fuel
consumption and operating economics over the (scaled) CT7-5 powered aircraft.
In the 30-passenger size, fuel consumption is reduced 13% at 185.2 km (i00nmi), 15% at IIIi km (600 nmi), DOC at 185.2 km (I00 nmi) is down 8% at both
fuel costs and 5-year cost of ownership is reduced by 7% to 7. 5%. (Cost of
ownership was calculated based on direct operating costs, assuming financing
of 60% of the initial cost; 12% interest rate on financing; 12 years nominal
payback; and resale at 65% value at the end of five years.)
For the 50-passenger aircraft, the mission fuel burn improvement is 17% at
185.2 km (100 nmi), 20% at IIii km (600 nmi), DOC at i_5.2 km (i00 nmi) is
reduced 11% to 12%, depending on fuel cost, and 5-year cost of ownership is
down 9 to 10%. Table 67 summarizes the improvements in powerplant andaircraft characteristics obtained with the advanced engine, propeller and
gearbox and also with the CT7 derivative engine. The savings associated with
the derivative power plants (derivative engine + current technology propeller
and gearbox) are about 1/6 of the advanced powerplant savings.
The fuel savings due to the advanced powerplants are broken down into mission
segments in Table 68. In Table 69 the changes in DOC for the 185.2 km (100
nmi) mission are broken down to show the sources of the improvement.
Approximately 45% to 60% of the DOC reduction is associated with reduced fuel
useage, the percentage increasing with both fuel cost and aircraft size. The
balance of the improvement is almost entirely due to powerplant costred uc tio ns.
138
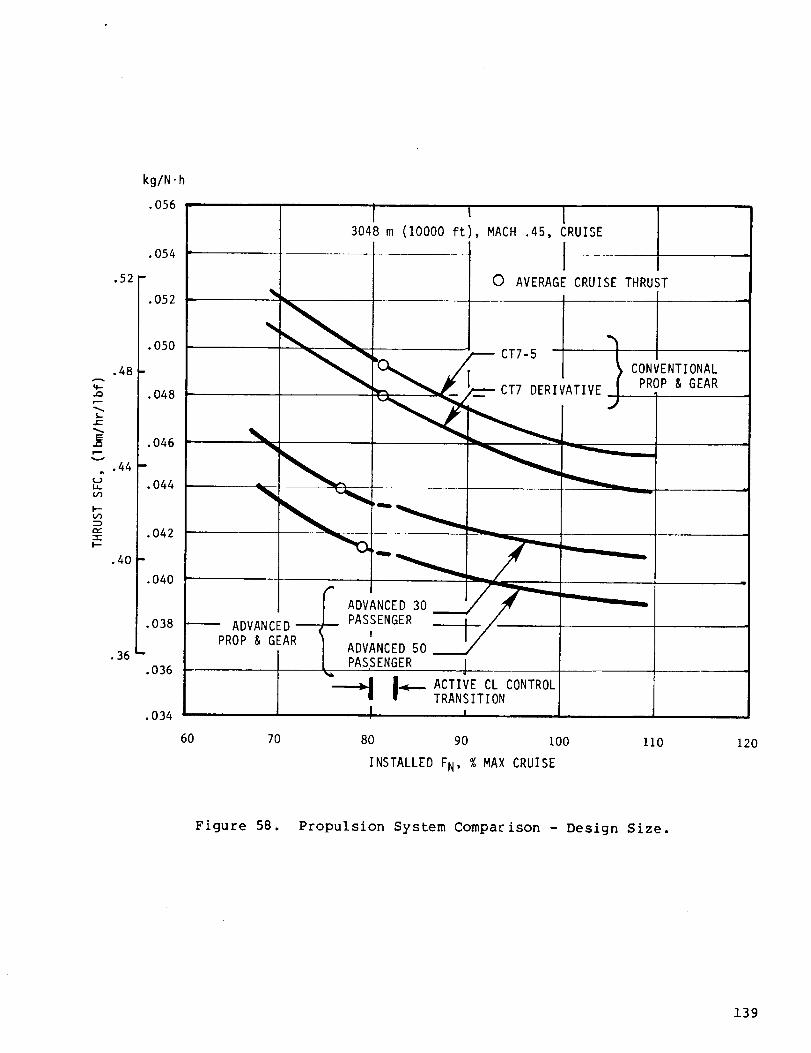
A
.K:
v
dLI-
F'-CO
ev--r
kglN.h
.056
.054
.036
.034
\
ADVANCED
PROP & GEAR
I I
3048 m (I0000 ft) , MACH .45, CRUISE
I 0 AVERAGE CRUISE THRUST
____CT7-5 I CONVENTIONALCT7 DERIVATIVE PROP & GEAR
J
" /7"-ADVANCED30
PASSENGERI _/
ADVANCED 50
PASSENGER ]
TRANSITIONI
60 70 80 90 i00 110 120
INSTALLED FN, % MAX CRUISE
Figure 58. Propulsion System Comparison - Design Size.
139
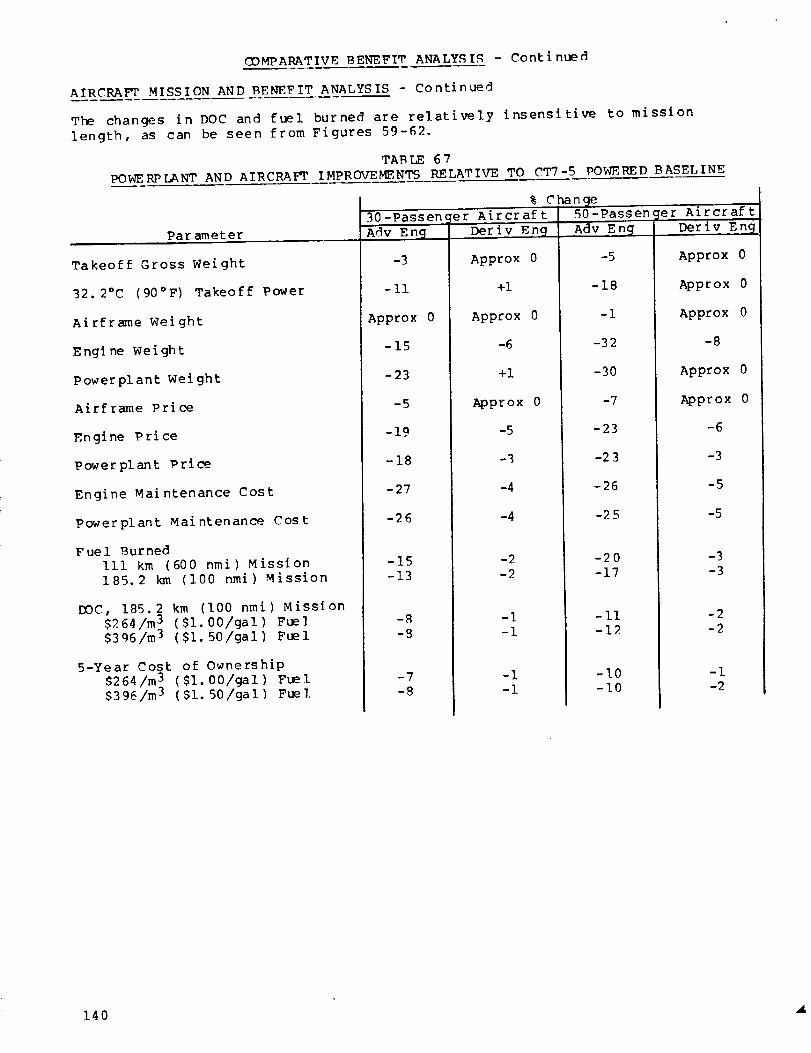
(3DMPARATIVEBENEFIT ANALYSIS - Continued
AIRCRAFT MISSION AND BENEFIT ANALYSIS - Continued
The changes in DOC and fuel burned are relatively insensitive to mission
length, as can be seen from Figures 59-62.
POWE RP [ANT
TABLE 67
AND AIRCRAFT IMPROVEMF, NTS RELATIVE TO CT7-5 POW_,RED BASELINE
Par amet er
Takeoff Gross Weight
32.2°C (90°F) Takeoff Power
Airframe Weight
Engine Weight
Power pl ant Weight
Airframe Price
Engine Price
Power pl ant l_ri ce
Engine Maintenance Cost
Powerplant Maintenance Cost
Fuel Burned
III km (600 nmi) Mission185.2 km (i00 nmi) Mission
IX)C, 185.2 km (I00 nmi) Mission
$2 64 Im 3$3 96/m _
5-Ye ar Cost
$264/m 3
$396/m 3
($1.00/gal) Fuel
($i. 50/gal) Fuel
of Ownership
($I. 00/gal) Fuel
($I. 50/gal) Fuel
% Chan_e30-Passen( er A_t
-9
-II
Approx 0
-15
-23
-5
-19
-18
-27
-26
-15
-13
-S
-8
-7
-8
Deriv _ng
Approx 0
+i
Approx 0
-6
+i
Approx 0
-5
-%
-4
-4
-2
-2
-I
-I
-I-i
50-Passen
A""ff_En______
-5
-18
-1
-32
-30
-7
er AircraftDeriv _'_
Approx 0
Appr ox 0
Approx 0
-8
Approx 0
Approx 0
-23
-23
-26
-25
-20
-17
-II
-IP.
-I0-I0
-6
-3
-5
-5
-3
-3
-2
-2
-I
-2
140
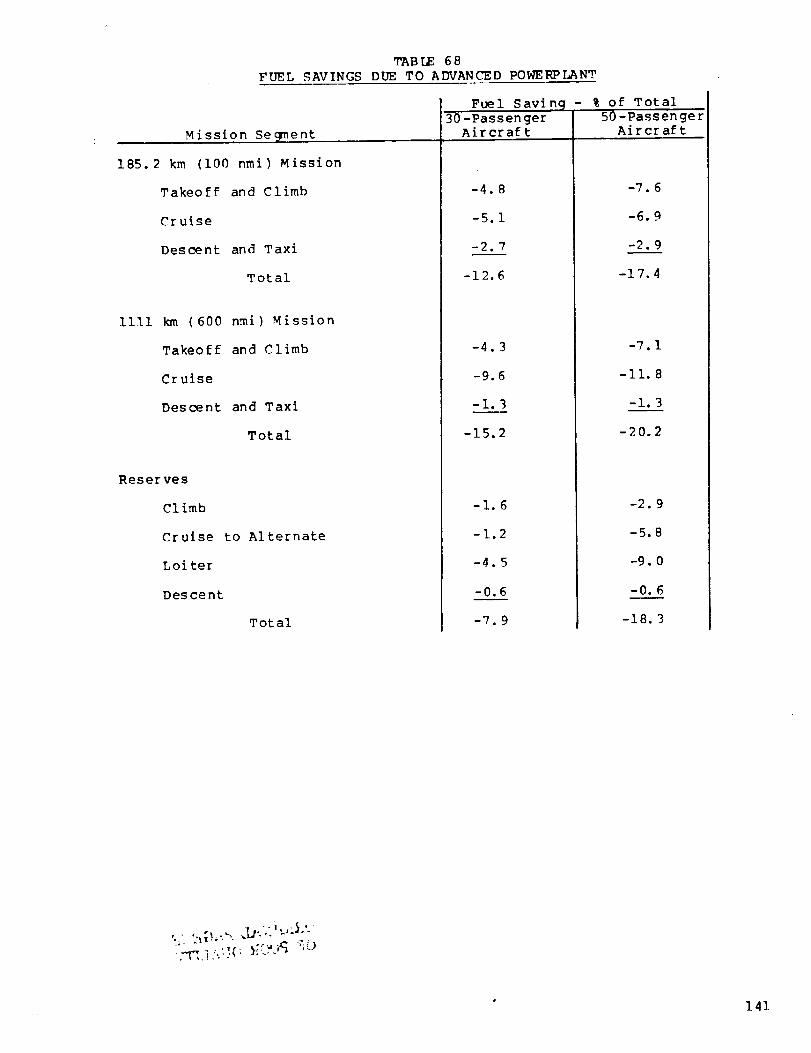
TABLE68FUEL SAVINGS DUE TO ADVANCED POWERPLANT
Mission Se _ment
185.2 km (i00 nmi) Mission
Takeoff
Cruise
Descent
and Climb
and Taxi
Total
iiii km (600 nmi) Mission
Takeo f f
Cruise
Descent
and Climb
and Taxi
Total
Reserves
Climb
Cruise to Alternate
Loi ter
Descent
Total
r Fuel Savin@
30-PassengerAircraft
-4.8
-5.1
-2.7
-12.6
-4.3
-9.6
-1.3
-15.2
-1.6
-1.2
--4.5
-0.6
-7.9
- % of Total
50-PassengerAircraft
-7.6
-6.9
-2.9
-17.4
-7.1
-II. 8
-I. 3
-20.2
-2. 9
-5.8
-9.0
-0.6
-18. 3
141

DOC
Powerp]ant Depreciation
_irframe Depreciation
Powerplant Insurance
Airframe Insurance
Powerplant Maintenance
Airframe
Crew
Fuel
Maintenance
Total
TABLE69SAVINGSDUE,TO ADVANCED_OWERP[ANT
185. 2kin (I00 nmi) Mission
DOCSavings - %of Total30-Passenc_r Aircraft 50-Passenger Aircraft
- -_6e-Y-C-6__...... -F"66[-t-o-_s6................Fuel Cost
$264/m 3
SI. 00/gal )
-1.6
0
-0.3
0
-9..3
0
0
-3.6
-7.8
$3 96/m 3
( S1.50/9a] )
-1.4
0
-0. 2
0
-2.1
0
0
-4.7
-8.4
F ue 1
$2 6;4/m 3
(S]. 00/gal)
-2.0
-0.3
-0._
0
-2.2
-0. I
0
-5.9
-I0.8
Cos t
S39g/m l
-1.7
-0.2
-0. 3
0
-1.9
-0. I
0
-7.5
-ii. 7
142

_FUEL
BURNED, %
_FUEL
BURNED, %
0
-5
-10
-15
-20
-5
-10
-15
-20
l
C) DERIVATIVE ENGINE
50 PASSENGER
ADVANCED ENGINE
0 200 400 600 800 1000km
| l l | ! I J
0 100 200 300 400 500 600
(nmi) MISSION LENGTH
C) DERIVATIVE ENGINE
30 PASSENGER
ADVANCED ENGINE
m
0 km 200 400 600 800 1000
I I I I I I i
O 100 200 300 400 500 600
(nmi) MISSION LENGTH
1200
1200
Figure 59. Fuel Burned Improvement vs CT7-5 Powered Baseline.
143
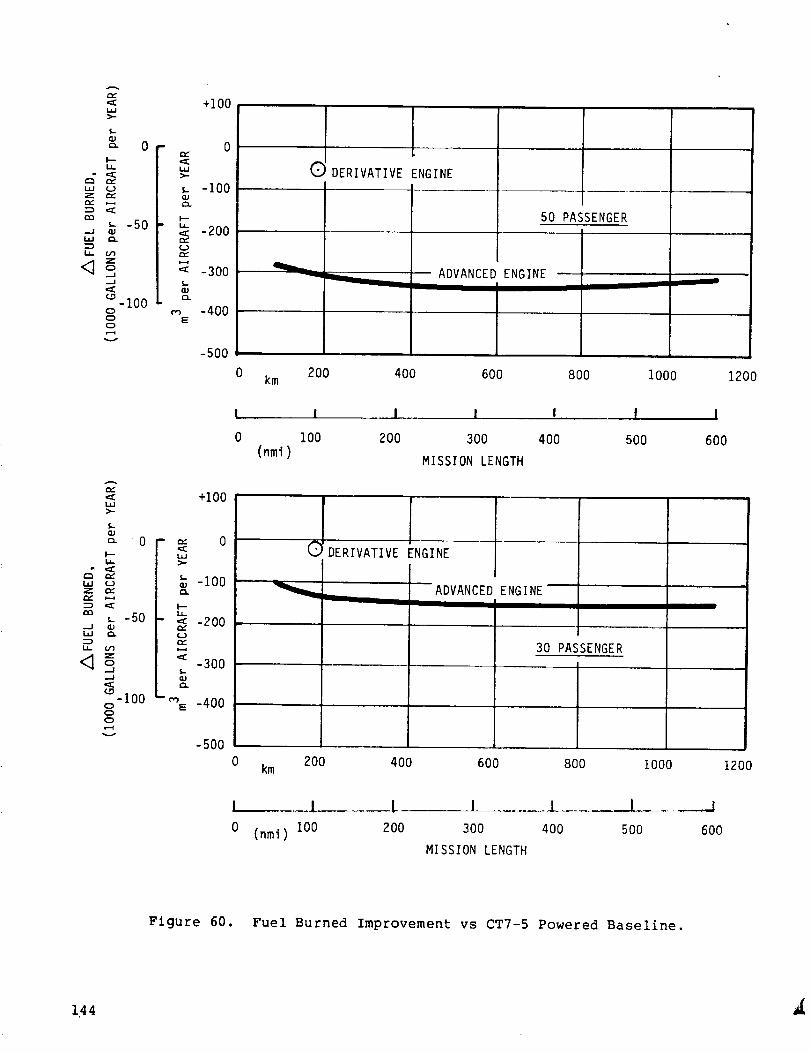
&.u_=
f,=
C_
p--i,
I._ (.3Zr_
_- -50i,i r_
<l 7_J..J
-I000
C)
0 ; ,Y
+I00
W
L -100
-2oo0
•_ -3oof,,_
-400E
-500
i,i>-
_- 0I--i,
r-_
i,i (JZ
"_ __ -50
,....I
+I00
- ,_ 0i,i
-100
i,
- <_-2oo¢..}
-300_Jtn
-I00 - mE -400
-500
C_DERIVATIVE ENGINE
50 PASSENGER
ADVANCED ENGINE m
0 km 200 400 600 800 1000 1200
! I I I I !
5OO0 IO0
(nmi)200 300 400
MISSION LENGTH
G DERIVATIVE ENGINE
__-i_ADVANCEDENGINE
30 PASSENGER
i
I
6O0
0 km 200 400 600 800 1000 1200
J
6OO
I t L ! ! I
0 (nmi) 100 200 300 400 500
MISSION LENGTH
Figure 60. Fuel Burned Improvement vs CT7-5 Powered Baseline.
1.44

ADOC, %
/',DOC, %
-2
-8
-10
-12
-14
0
-2
-6
-8
-10
7
50 PASSENGER
DERIVATIVE ENGINE
!
FUEL $2641m3($1.OOIGAL) 0i
! FUEL $396/m3($1.50/GAL) [] ,--,-,,-,-.
/' ADVANCED ENGINE
kill
(nmi)
200 400 600 800
I t t i
100 200 300 400
MISSION LENGTH
i
500
0 km
I I I ! I I
0 (nmi) 100 200 300 400 500
I000
I
600
1 f3O PASSENGER
DERIVATIVE ENGINEv I
i FUEL $264/m3($1.00/GAL) 0 _ i
FUEL $396/m3($1.50/GAL) I-I,,--,-,,,,-,
"i-,,OVA,C 7200 400 600 800 1000
I
600
MISSION LENGTH
1200
1200
Figure 61. DOC Improvement vs CT7-5 Powered Baseline.
145
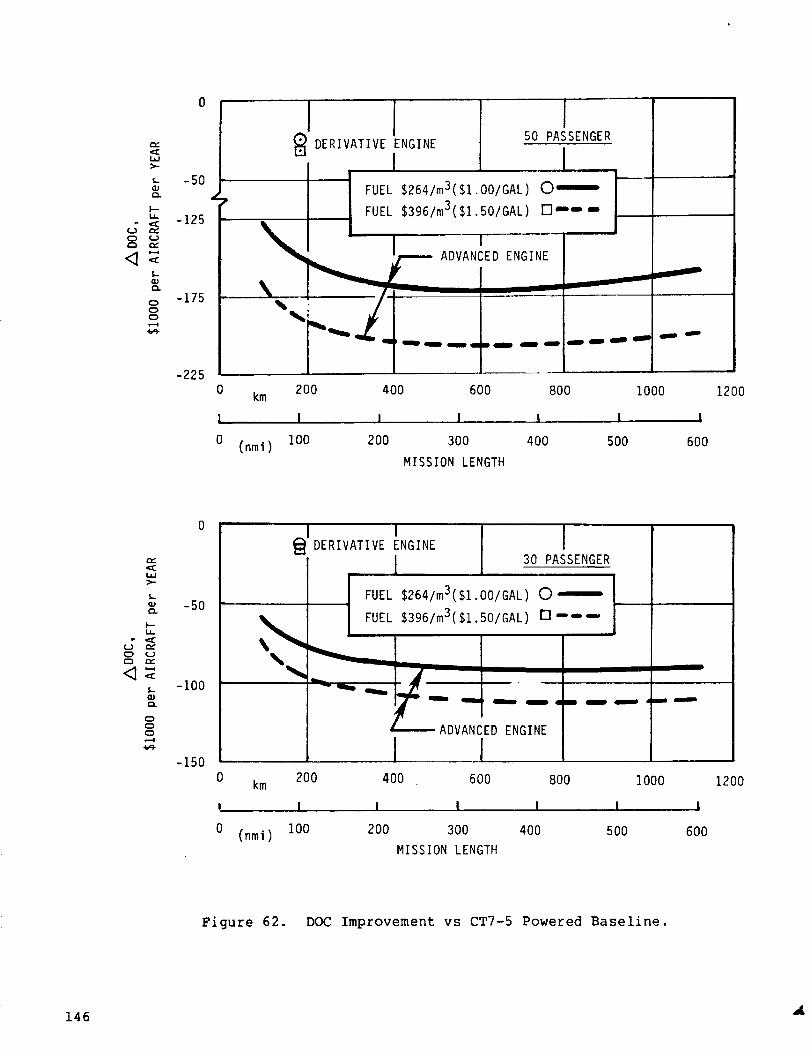
(.J
R<_
m,-,¢
Cur_
I--i,
,:¢n_
r,1
5.-
_Jr_
000
4_
0
-5O
-125
-175
-225
I ]_ DERIVATIVE ENGINE
IFUEL
FUEL
II
J50 PASSENGER
$264/m3($1.OO/GAL) 0 _
$396/m3($1.50/GAL) F-I------
IADVANCED ENGINE
0 km 200 400 600 800
I I i I !
0 (nmi) 100 200 300 400 500
MISSION LENGTH
1000 1200
!
6OO
J(::,
<1
r,,,-
,:Ehi
L
(::L
I--L,_
,::::
(..}.,,.,,,.
S,.,.
00E:,
0
-5O
-I00
-150
DERIVATIVE ENGINE
FUEL $264/m3($1.OO/GAL) 0"-'_"
FUEL $3961m3($1.50/GAL) []--"'"-..__...ADVANCED ENGINE
0 km 200 400 600
I I I !
0 (nmi) 100 200 300
MISSION LENGTH
800 I000
!
400 500
I
600
1200
Figure 62. DOC Improvement vs CT7-5 Powered Baseline.
146

RECOMMENDATIONS FOR FUTURE RESEARCH
RANKING OF ADVANCED TECHNOLOGIES AND DESIGN FACTORS
For each of the advanced technologies recommended for inclusion in the
commuter turboprop designs presented above, a development cost has been
estimated. A probability of successfully achieving the stated improvements inperformance, weight, and cost has also been estimated considering four factors:
i. Availability of analytical design techniques (e.g. computer programs for
3-D flow analysis and airfoil design).
2. Availability of required materials with targeted properties.
3. Availability of new manufacturing techniques.
4. Given the above, the probability of achieving the stated performance goals.
A relative value (RV) has been calculated for each item as
RV = (-i)(_DOC) (Probability of Success)(Development Cost)
These values have then been normalized such that the "best" item has a value
of 100, and the items ranked by their average "score" for the two sizes andtwo fuel costs. Table 70 summarizes the results. It is clear from the
results that those items significantly affecting performance (axial
compressor, impeller, diffuser items) or life (combustor cooling) have the
largest potential payoff in the STAT mission. Those items which are primarilytargeted to weight and/or cost savings have a relatively minor benefit. Note
also that one item, the HP turbine blade, shows no payoff in DOC. It was
included in the 50-passenger design because it saves 1% in fuel for the 185.2
km (100 nmi) mission with no DOC penalty at $396/m 3 ($1.50/gai) fuel.
The design factor options are ranked in Table 71 in terms of their average
predicted DOC savings for the two sizes and two fuel costs. These are optionswhich may be incorporated in the engine without any associated development
programs or technical risks. As such, no development costs or proabilitiesare involved in the ranking. (Where more than one option was investigated in
a category, only the best is ranked.)
OTHER APPLICATIONS OF ADVANCED TECHNOLOGY
The technology items which were examined for applicability to the commuter
turboprop had varying degrees of payoff in DOC. For each of the other
applications considered in Table 72, there is some payoff as well. The
magnitude of the payoff will depend upon time at part cruise, size and otherfactors which will place different relative values on SFC, weight and cost for
each application.
The cores developed for the 30- or 50-passenger turboprops have applicability
in the range of engines shown on Table 73. The only one that is questionable
is a Bizjet derived from the 3.86 kg/sec (8.5 Ib/sec) core which would be less
than 8896 N (2000 ib) thrust.
• 147

o=%
:>
T_
o:O! __z"I-
U
I---
U
0
C) or-
r_ 0.)
bJ
m r..-
..J
gNg:
c.
c_
O .Ic
£_ ¢._
r--
O ,ic
I
c.
c-- ,Ic
q
_ e¢'_ I
e- 4(
O 4(
or,- I/3
"_-u
0 V_f,.._
r.,
e"-
Q.)r'..
_ 0.4 _ O0 0% P..- E:. Lr')
O0 Lt_ _') 0 It') _ _0 O_ 00 Od r,_ 0 o'_
od r_ _-_ 0 O0 _0 O_ C_
o'_ CO od 03 ¢,,J C) r_ i._ _o0 _.0 CO _ _ 0 C_ od
• • • m • • •,---4 I I I" I I I I
I
I* I I I I 4" I I I
C'M 0 i 0 CD
I I I" l" I I I I
CO _o ko 03 0 n 0 0
I I I I I I I
(D
t-_ _ ,,-- .S.,- _ ¢/'} _ U
_J_ _ _- 0 _" '-" "-- __- 0 0 r_ 03 _"
O0
C3_
O") O'_
E E
&- _ ",'- _ L_ (/I EL _'_
0
0I'-- I'--
(D
e.-
1
il_ ""
e-
e-! ,
e_
I
Ot_
I
+. +. ,.4 ,-4I I
_0 _" r_
+. +" ,
+" + ,I
t--
op-
"0L
e- o
o g,p-
O O _
I48
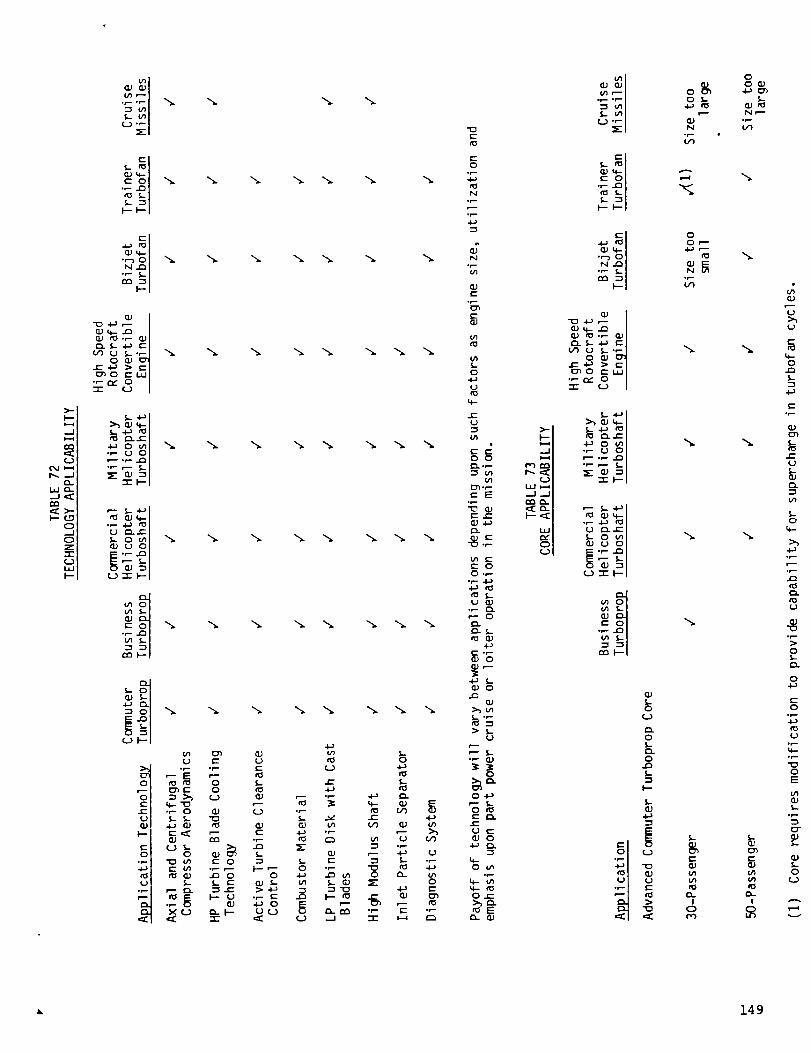
I'--
.-Ii-..ie,m
l J,(M I.-._I",_ -..I
I.ij P,
e,,,,,a:: >-I-"¢..9
E:
I"-
-'--J ON a_
oP"E:I
D..f,- 4-:'V') _ .L.
• "" -.IJ :_I:_ O {"
"_CE O-r- lr..j
>_ (:u4-1!,_ ..l.J, 0'_l_
•_ O w,I•,..- ,u Ol,-- ,,- r-, I•"- ,-- .LI
"r" I-- I
,-- L.._ I
•,,-- 4JU ID.- r" I_- O (_I_JOl
rj -.r- k _
I
4_(._ ,%.
O(.J .IJ
1..E f,.-.IJ
,_ .,,-- ,.I-J
_- _ ._-
f,,.. ,_ _ O::3 "1_ 4J e-
P. {:_ ,r- _ "P(J ,J ::3::: _
..1
__1 _.J
0r- -_-
e-
•r,_ o
°1
_'_-I
13. _- 4-J pE(-_ (.J S--"O
Cn C:) e-..- rv" O::E (-)
>., ,_ q.- I
4._ O Inl•,- L:' OI
""" ,'-- S.-I=E '_ =l
"r" I-- I
..l.a _1
O O
(j '-',,r- I-- I
-i,,--
e,m
o_,LJ,
P,O1-C_.0
1.-
I-_J
Q)O _O4.J r_
P
N
OO_4..a_
.I,'--
v')
.L
121
,m,I
Oo")
OO,_
4-)
N r-"
be-
i
_.)
,-6
0
t-._
t--
0
0r--
u
0
e_
04-_
c-O
0r,-
0
L
.g
0
• 149

/
150

APPENDIX A
HAMILTON STANDARD DIVISION GEARBOX DATA
The following sections contain synopses of the gearbox reports written undersubcontract by Hamilton Standard6,8. Material which is quoted verbatim isindicated as such. Other material is paraphrased.
STATE-OF-THE-ART GEARBOX
The material presented here is representative of current technology andsuitable within the 1119 to 1491 kw (1500 to 2000 hp) range.
"The configuration selected as the state-of-the-art gearbox is the offsetpinion-bull-star system illustrated in Figure 50 (pg 106). This configurationprovides: I) an offset between the input and output shafting to allow accessfor propeller input signals, 2) a common direction of rotation for the inputand output shafts as viewed from the rear of the gearbox, and 3) aself-contained, pressure fed lubrication system except for an airframe mountedheat exchanger. In addition, the gearbox includes an accessory drive gearboxwith provisions to drive an AC generator and an aircraft hydraulic pump."
Weight Generalization
"In examining the factors affecting the weight of gearboxes, it becomesevident that by far the most predominant factor is the maximum continuousoutput torque of the gearbox. Accordingly, the generalized weightpresentation in Figure 51 (pg 108) shows gearbox weight as a function of themaximum output torque and is based on the offset-star power gear reductiondefined above. This relationship can be used to estimate the weight ofoffset-star gearboxes with reduction ratios of 14:1 to 16.5:1 over the outputpower range of 1119 to 1491 kW 11500 to 2000 shp). The estimated weightincludes the main gearbox, accessory drive gearbox, and lube system pump. Thegearbox weight generalization does not include accessories or specialaccessory drives, input drive shafting, propeller brake provisions, and theairframe mounted heat exchanger."
Efficiency
"At the maximum continuous power rating and 100% speed, the estimatedefficiency of the gearbox including the accessory drive gearbox and lube pumpis 97.8%. This value does not include the power extractions of the aircrafthydraulic pump, generator, and special accessories, i.e., tachometer, cabinsupercharger, etc. This efficiency level is believed to be quiterepresentative over the output power range of 1119 to 1491 kW (1500 to 2000shp) ." '
Cost
"The cost per unit weight for offset-star gearboxes within the 1119 to 1491 kW(1500 to 2000 shp) output power range is approximately $507/kg ($230.00 perpound). This value is in terms of a 1979 economy and includes the maingearbox, accessory drive gearbox, and lube system pump."
Reliability and Maintainability
"The reliability prediction for the offset-star gearbox is 106.705repair/replacement events per million hours giving a mean time betweenfailures of 9372 hours. These values represent the repair/replacement events
that arise, regardless of cause, for the main gearbox, accessory drive gearbox,
Precedingpageblank"151

APPENDIX A
HAMILTON STANDARD DIVISION GEARBOX DATA - Continued
STATE-OF-THE-ART GEARBOX - Continued
and the lube system pump. Assuming a consistent design philosophy, thesereliability values will be the same for gearboxes in the 1119 to 1491 kW (1500to 2000 shp) range."
"Maintainability estimates for an offset-star gearbox sized for the 1119 kW(1500 shp) design power level are as follows:
Parts cost: $.37 per flight hour (1979 economy)
Labor: .021 manhours per flight hour
Over the output power range of 1119 to 1491 kW (1500 to 2000 shp), thesemaintainability costs will vary directly with the maximum continuous outputtorque of the gearbox."
This maintenance estimate assumes a fixed TBO of 7000 hours.
Scaling Factors
The baseline gearbox is sized for a torque of 8508 N-m (6275 ft.lb) and agear ratio of 15.2:1. Gearbox parameters may be scaled as follows:
Parameter Scales As
weght (GearIs2Rati°)IJ2Cost/Ib Constant
Maintenance
Linear Dimensions "-(_I I/3
At 8508 N.m (6275 ft-lb) and 15.2:1 gear ratio, the important gearboxparameters are:
Wt, kg (Ib) 102 (225)Cost, kS 51.8
Maintenance Co_t $_h .38Frontal Area mL iin ) .197 (306)
Height, m (in) .541 (21.3)Width, m (in) .493 (19.4)Offset, m (in) .216 (8.5)
ADVANCED TECHNOLOGY GEARBOX
Advanced Technology features are offered " ..... that could conceivably be inservice in the 1985 to 1990 time period."
Advanced Technology Features -- Identification and Screening
"The increased concern with reliability factors and maintenance costs on thepart of commercial airline operators has caused a revitalization in designconcepting and operating philosophies. In order to remain competitive in a
152
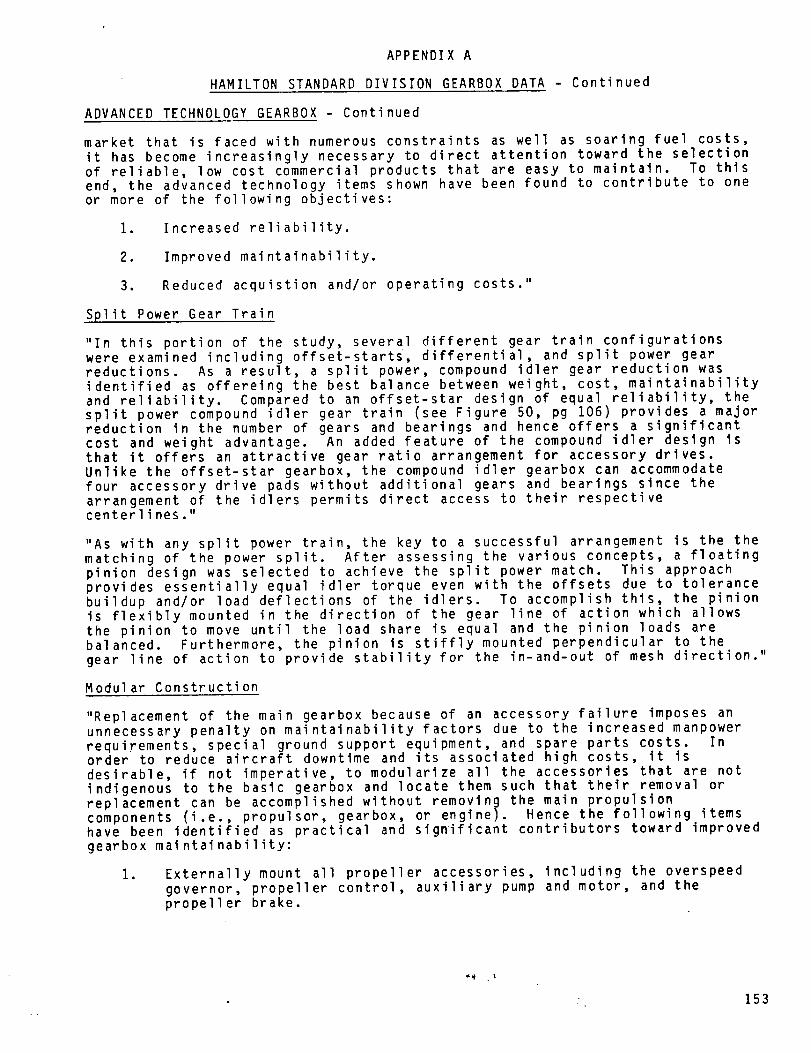
APPENDIXA
HAMILTON STANDARD DIVISION GEARBOX DATA - Continued
ADVANCED TECHNOLOGY GEARBOX - Continued
market that is faced with numerous constraints as well as soaring fuel costs,
it has become increasingly necessary to direct attention toward the selectionof reliable, low cost commercial products that are easy to maintain. To thisend, the advanced technology items shown have been found to contribute to oneor more of the following objectives:
1. Increased reliability.
1
3.
Improved maintainability.
Reduced acquistion and/or operating costs."
Split Power Gear Train
"In this portion of the study, several different gear train configurationswere examined including offset-starts, differential, and split power gearreductions. As a result, a split power, compound idler gear reduction wasidentified as offereing the best balance between weight, cost, maintainabilityand reliability. Compared to an offset-star design of equal reliability, thesplit power compound idler gear train (see Figure 50, pg 106) provides a majorreduction in the number of gears and bearings and hence offers a significantcost and weight advantage. An added feature of the compound idler design isthat it offers an attractive gear ratio arrangement for accessory drives.Unlike the offset-star gearbox, the compound idler gearbox can accommodatefour accessory drive pads without additional gears and bearings since thearrangement of the idlers permits direct access to their respectivecenterl ines ."
"As with any split power train, the key to a successful arrangement is the thematching of the power split. After assessing the various concepts, a floatingpinion design was selected to achieve the split power match. This approachprovides essentially equal idler torque even with the offsets due to tolerance
buildup and/or load deflections of the idlers. To accomplish this, the pinionis flexibly mounted in the direction of the gear line of action which allowsthe pinion to move until the load share is equal and the pinion loads arebalanced. Furthermore, the pinion is stiffly mounted perpendicular to the
gear line of action to provide stability for the in-and-out of mesh direction."
Modular Construction
"Replacement of the main gearbox because of an accessory failure imposes anunnecessary penalty on maintainability factors due to the increased manpowerrequirements, special ground support equipment, and spare parts costs. Inorder to reduce aircraft downtime and its associated high costs, it isdesirable, if not imperative, to modularize all the accessories that are notindigenous to the basic gearbox and locate them such that their removal orreplacement can be accomplished without removing the main propulsioncomponents (i.e., propulsor, gearbox, or engine). Hence the following itemshave been identified as practical and significant contributors toward improved
gearbox maintainability:
1 Externally mount all propeller accessories, including the overspeed
governor, propeller control, auxiliary pump and motor, and thepropeller brake.
153
APPENDIX A
HAMILTON STANDARD DIVISION GEARBOX DATA - Continued
ADVANCED TECHNOLOGY GEARBOX - Continued
. Provide a modular, bolt-on accessory drive gearbox for the aircrafthydraulic pump and generator for easy field replacement and improvedmai ntai nabi I ity.
. Externally mount the gearbox lube system components including thelube pump with attendant screens and relief valves, oil filter, chipdetectors, and magnetic plugs.
, Construct all of the accessories such that their removal andreplacement can be performed with a small number of standard tools."
Advanced Lubricants
"Dramatic improvements in bearing life could be achieved by using lubricantsthat exhibit high film strength and flat viscosity characteristics. The highfilm strength not only spreads the bearing contact pattern, thereby reducingstress, but also prevents small particles from inflicting the surface distressthat forms the focal point for material failures. Both of these factors havea direct impact on bearing life. Flat viscosity characteristics, on the otherhand, help ensure the same quality of lubrication throughout the normalthermal environment of aircraft components."
High Filtration
"Marked improvement in bearing life can also be achieved by reducing thedebris (i.e., wear particles) in the gearbox. However, simply installingfiner filters within the same envelope would only serve to overburden thefilter system and shorten the maintenance interval. The remedy for this is toapproach the gearbox with a new philosophy. In the past, changes within agearbox have generally been made to meet a specific objective or designrequirement. By extending this philosophy a gearbox could be approached as adebris generator whereby the sources would be identified and appropriatechanges made in those areas that need it to reduce the debris generation. Forinstance, if it were found that a certain bearing liner exhibited fretting atthe housing interface, it would be appropriate to alter the hardness of theliner so as to stop the fretting. As more and more debris sources are treatedin this fashion, the overall debris generated in the gearbox could bedrastically reduced, thereby allowing the lubrication system to sustain afiner filtration level without penalizing the maintenance interval or thefilter envelope."
High Contact Ratio Gearing
"High contact ratio gearing offers the advantage of reducing the dynamic loadthat the gear tooth carries thereby producing a smooth load transmission withless noise and vibration. The narrower teeth and reduced pressure anglestypical of high contact ratio gears provide the basis for distributing theload among a larger number of teeth than is possible with conventional toothprofiles. A result of this gearing concept is that it offers reductions inface width approaching 15% with attendant reductions in gear weight."
Lightweight Housing Materials
"The use of lightweight materials in the gearbox housings can offersignificant weight reduction. The candidates include materials such as
z
154
APPENDIX A
HAMILTON STANDARD DIVISION GEARBOX DATA - Continued
ADVANCED TECHNOLOGY GEARBOX - Continued
magnesium, titanium, and composite structures. The weight advantages formagnesium have been well established; however, in order to take full advantageof these benefits, better surface treatments should be developed that willprovide the necessary corrosion protection as well as good resistance tohandling damage. Titanium and composite structures offer weight savingscomparable or better than those for magnesium. However, it was judged thattheir use was economically impractical for incorporation by the 1985 to 1990time period."
Bearin 9 Material Properties
"The advent of vacuum melt, high purity steels offers dramatic improvements inbearing material properties. However, the extent of the potential benefitshas not yet been realized due to the lack of up-to-date material allowables.In fact, the current published material allowables are, for the most part,based on data developed many years ago for airmelt steels. Hence the need
exists to realign the real material capabilities for today's high puritysteels to take full advantage of the potential weight savings and extendedbearing lives."
On-Condition Maintenance
"Fixed time maintenance permits a part or unit to be operated for a prescribedtime before discard or overhaul. Although the overhaul period is subject tochange in service, useful life is frequently forsaken to assure highreliability and safety. On-condition maintenance, on the other hand, relieson the functional and physical inspections of fleet leader units to providethe basis for extending the inspection period for all service units.
Reliability is achieved through the detection of impending problems so thatrepair or replacement of the part can be accomplished before failure occurs inservice units. An on-condition maintenance philosophy offers a substantialpotential cost savings over fixed time overhaul periods."
Selected Gearbox
"The configuration selected as the advanced technology gearbox is the splitpower compound idler system illustrated in Figure 50 (pg 106). This gearreduction provides a major reduction in the number of gears and bearings,improved efficiency because of the fewer gear meshes, and a significant weightadvantage compared to the offset-star design of equal reliability. Inaddition, the compound idler gear is a modular design. A bolt-on accessorydrive gearbox and provisions for the propeller control and auxialiarypump/motor are incorporated on the aft side of the main housing. The lubepump mounts on the front housing while provisions for the propeller brake andpropeller overspeed governor are also included on the front housing."
"The compound idler design is intended for on-condition maintenance. Thisdesign allows for routine maintenance to be performed with a small number of
standard tools and includes features such as lubricant sight gauge, chipdetectors, lube pressure monitoring, and filters with impending bypassindicators. The lubrication system is self-contained except for an airframemounted heat exchanger. The major characteristics of this two-stage powergear reduction are shown in Table A-I along with the offset-starcharacter isti cs ."
155
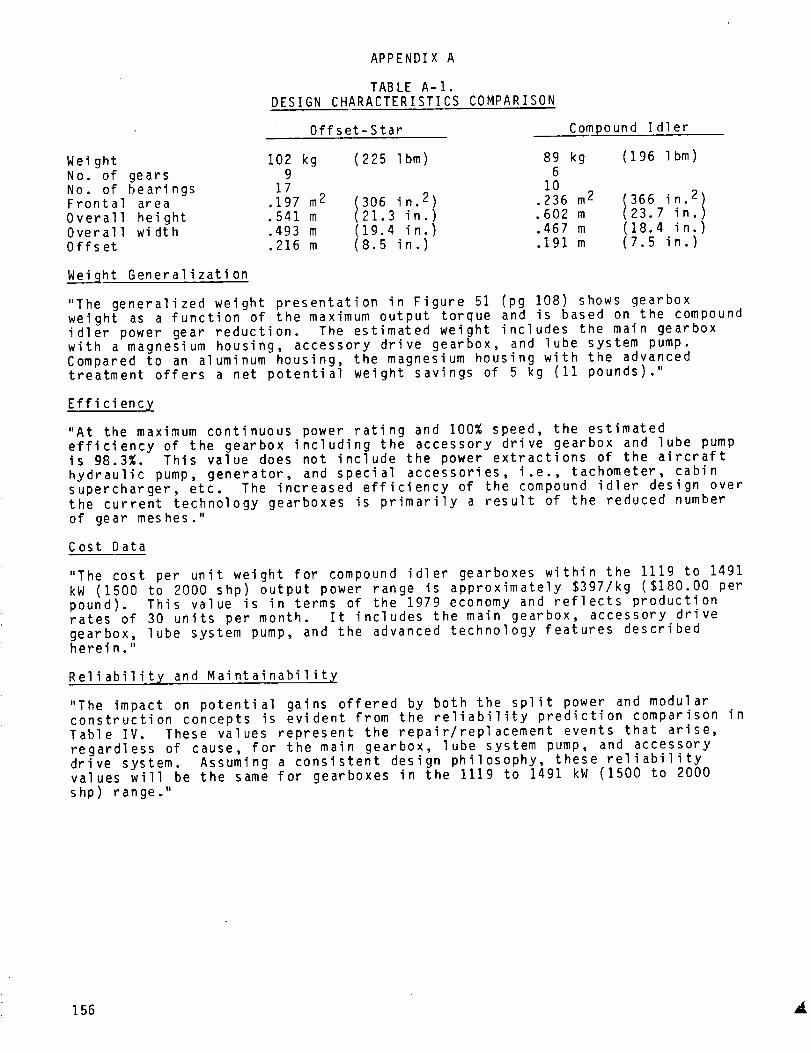
APPENDIX A
TABLE A-I.DESIGN CHARACTERISTICS COMPARISON
Offset-Star Compound Idler
Weight 102 kg (225 Ibm) 89 kg (196 Ibm)No. of gears 9 6No. of bearings 17 I0
Frontal area .197 m2 1306 in.2.1 .236 m2 1366 in. 2)Overall height .541 m 21.3 in .602 m 23.7 in.)Overall width .493 m (19.4 in.) .467 m (18.4 in.)Offset .216 m (8.5 in.) .191 m (7.5 in.)
Weight Generalization
"The generalized weight presentation in Figure 51 (pg 108) shows gearboxweight as a function of the maximum output torque and is based on the compoundidler power gear reduction. The estimated weight includes the main gearboxwith a magnesium housing, accessory drive gearbox, and lube system pump.Compared to an aluminum housing, the magnesium housing with the advancedtreatment offers a net potential weight savings of 5 kg (II pounds)."
Effi ci ency
"At the maximum continuous power rating and 100% speed, the estimatedefficiency of the gearbox including the accessory drive gearbox and lube pumpis 98.3%. This value does not include the power extractions of the aircrafthydraulic pump, generator, and special accessories, i.e., tachometer, cabinsupercharger, etc. The increased efficiency of the compound idler design overthe current technology gearboxes is primarily a result of the reduced numberof gear meshes."
Cost Data
"The cost per unit weight for compound idler gearboxes within the 1119 to 1491kW (1500 to 2000 shp) output power range is approximately $397/kg ($180.00 perpound). This value is in terms of the 1979 economy and reflects productionrates of 30 units per month. It includes the main gearbox, accessory drivegearbox, lube system pump, and the advanced technology features describedherein."
Reliability and Maintainability
"The impact on potential gains offered by both the split power and modularconstruction concepts is evident from the reliability prediction comparison inTable IV. These values represent the repair/replacement events that arise,regardless of cause, for the main gearbox, lube system pump, and accessorydrive system. Assuming a consistent design philosophy, these reliabilityvalues will be the same for gearboxes in the 1119 to 1491 kW (1500 to 2000shp) range."
156

APPENDIXA
HAMILTON STANDARD DIVISION GEARBOX DATA - Continued
ADVANCED TECHNOLOGY GEARBOX - Continued
"Maintainability estimates for an advanced technology gearbox sized for the1119 kW (1500 shp) design power level are as follows:
Parts cost: $.077 per gearbox flight hour (1979 economy)
Labor: .0057 manhours per gearbox flight hour"
Recommendations for Further Work
"Certain technology items discussed herein require continued developmentbefore they become economically attractive. Specifically, the following areasshould be further developed."
Bearing Material Properties
"As mentioned earlier in this report, existing material allowables for bearing
steels are, for the most part, based on data obtained many years ago forair-melt steels. The high purity steels available today potentially offerdramatic improvement in material allowables. Furthermore, today's computercapabilities have greatly enhanced the designer's analytical tools and designmethods but the advertised material properties do not appear to have kept upto date. Therefore, in order to fully exploit the potential weight, cost andreliability benefits, it is necessary to quantify the actual materialallowables for today's high purity vacuum melt bearing steels."
High Contact Ratio Gearing
"Many of the high contact ratio gear applications found today have failed totake full advantage of the benefits offered by this type of gearing. The
physical geometry of the gears in these applications has qualified them ashigh contact ratio gears; however, the design analysis employed wascharacteristic of that used for conventional spur gears. This has resulted in
conservative designs that are heavier than necessary. Hence the advantagesthat ensue from the reduction in dynamic load are lost to an outdated
analysis. Two areas of further attention are recommended: First, update thedesign methods and analyses to specifically address high contact ratio gears;and second, institute a test program to verify the design methods."
Lightweight Housings
"Magnesium housings have offered a distinct weight advantage in aircraftcomponents for several years. One drawback to its use has been the need toprovide protective surface treatments to control corrosion. As with mostsurface coatings, the susceptibility to handling damage is high and specialcare and repair procedures are often required to preserve the integrity of the
coating. It is recommended, therefore, that a program be undertaken todevelop a tough, lightweight coating for magnesium that will survive therigors of a typical maintenance shop."
Advanced Lubricants
"Advanced lubricants appear to offer drastic improvements in component lifeand reliability. Hence, it is recommended that lubricants be developed that
possess the characteristics found most suitable for highly loaded power gearapplications, i.e., high film strength and flat viscosity characteristics."
157

APPENDIXA
TABLEA-2.RELIABILITY PREDICTION COMPARISON
Repai r/Repl acement
Main Drive Configuration
Offset-star, integralaccessory drive system
Compound idler, integralaccessory drive system
Frequency, eventsper million hours
106.705
63. 183
Mean time betweenoccurrence, hours
9,372
15,827
Compound idler, modularaccessory drive system
41.266 24,233
158
APPENDIXB
HAMILTON STANDARD DIVISION PROPELLER DATA
The following sections summarize the material provided by Hamilton Standardunder contract to NASA and used to establish the characteristics of the
propellers in this study.
STATE-OF-THE-ART PROPELLER
"The baseline configuration which has been selected is a single acting,aluminum bladed propeller such as has been manufactured by several propellersuppliers and is currently in service on such commuter aircraft as theDeHavilland Twin Otter, the Beech 99, and the Swearingen Metro."
Aerodynamic Performance
"Tabulated performance data is provided for current technology propellers innon-dimensionsal coefficients of net thrust coefficient (CTNET) versus power
coefficient (Cp) for a range of advance ratios (J) from zero to 3.0 for 3and 4-bladed propellers of the following blade activity factors (AF) and
integrated design lift coefficients (CLi) of 0.40, 0.55, and 0.70. TableB-I is typical of the data provided."
No. of Blades AF
3 100, 130, and 1604 80, 100, and 120
"A compressibility correction factor (FT) is supplied for use with thecurrent technology propellers. Figure B-1 indicates the maximum free streamMach number (M) to avoid compressibility as a function of advance ratio (J)
for the three selected CLi values. Figure B-2 depicts a delta Mach number(AM) correction as a function of CLi. Figure B-3 allows for the estimationof the FT factor."
159

APPENDIXB
HAMILTON STANDARD DIVISION PROPELLER DATA Continued
4-BLADED_ i00
TABLE B-I
ACTIVITY FACTOR_ 0.55 INTEGRATED
PROPELLER PERFORMANCE
DESIGN CL
CJ P
0 0.05680.07370.0926O. 11700.14840.18660.22870.27460.31920.3558
0.2 0.04990.06550.08410.10580.12990.16140.19990.24060.28180.3200
0.4 0.04060.05640.07690.I0010.12530.15470.18850.22340.2673O. 28400.3200
0.6 0.03690.05640.08190.11100.14210.17580.21330.25610.30070.3200
CTNet
0.14560.17320.19650.21790.23270.24560.25310.25590.25650.2541
0.10840.13540.16260.18900.2083
0.23000.24800.25800.26050.2600
O.O6220.09310.12370.15320.18120.2075
0.22900.23710.24700.26200.2640
0.03620.07120.10510.13760.16850.19720.22290.24390.25510.2600
CTj Cp Net J
0.8
1.0
1.2
1.4
0.0482 0.04470.0797 0.08280.1156 0.11860.1541 0.15250.1940 0.18440.2378 0.21360.2850 0.23890.3347 0.25720.3857 0.2649
1.6
0.0323 0.0158 1.80.0697 0.05850.1141 0.09850.1607 0.13550.2093 0.17060.2597 0.20250.3149 0.23210.3722 0.25610.4264 0.26940.4821 0.2696 2.0
0.0536 0.034]0.1070 0.07850.1639 0.11940.2222 0.15270.2821 0.19300.4117 0.25330.4777 0.27400.5345 0.2782
0.0337 0.01080.0965 0.06000.1654 0.10520.2346 0.14620.3055 0.18500.3768 0.21880.4542 0.25050.5307 0.27540.5997 0.2883
2.2
2.4
Cp CTNe t
0.0695 0.03390.1337 0.07440.2001 0.11210.2657 0.14660.3323 0.17960.4006 0.21050.4667 0.23640.5395 0.26240.6084 0.2823
0.0407 0.00940.1134 0.05430.1913 0.09570.2692 0.13380.3464 0.16910.4246 0.20260.5015 0.23180.5815 0.2588
0.0937 0.03680.1836 0.08210.2749 0.12380.3643 0.16170.4542 0.19760.5855 0.2308
0.0773 0.02270.1797 0.07200.2853 0.11700.3891 0.15780.4916 0.19580.5951 0.2312
0.0675 0.01300.1531 0.05320.2433 0.09050.3341 0.12540.4231 0.15760.5103 0.18780.5980 0.2167
rOduced fromst available copy.
160

APPENDIXB
HAMILTON STANDARD DIVISION PROPELLER DATA Continued
4-BLADED_ I00
TABLE B-I - Continued
ACTIVITY FACTOR_ 0.55 INTEGRATED DESIGN
PROPELLER PERFORMANCE
CL
CTj Cp Net
2.6 0.0968 0.02230.1794 0.0576
0.2649 0.09040.3510 0.12130.4361 0.15030.5188 0.17730.6010 0.2031
2.8 0.07590.14730.22300.30050.37840.45560.53120.6046
0.00800.03870.06740.09470.12090.14570.16890.1909
3.0 0.0996 0.01320.1810 0.04510.2666 0.07540.3537 0.10390.4410 0.13090.5272 0.15650.6112 0.1804
161

.48
44
w
w
.36
wu_
i,
x 32
x.28
.24
V
INTEGRATED DESIGN CL
.40
.55
.70
1.0 1.4 1.8 2.2 2.6 3.0
Figure B-I. Maximum Free Stream Mach Number to Avoid Compatibility Losses asFunction of Advance Ratio and Integrated Design C L.
162
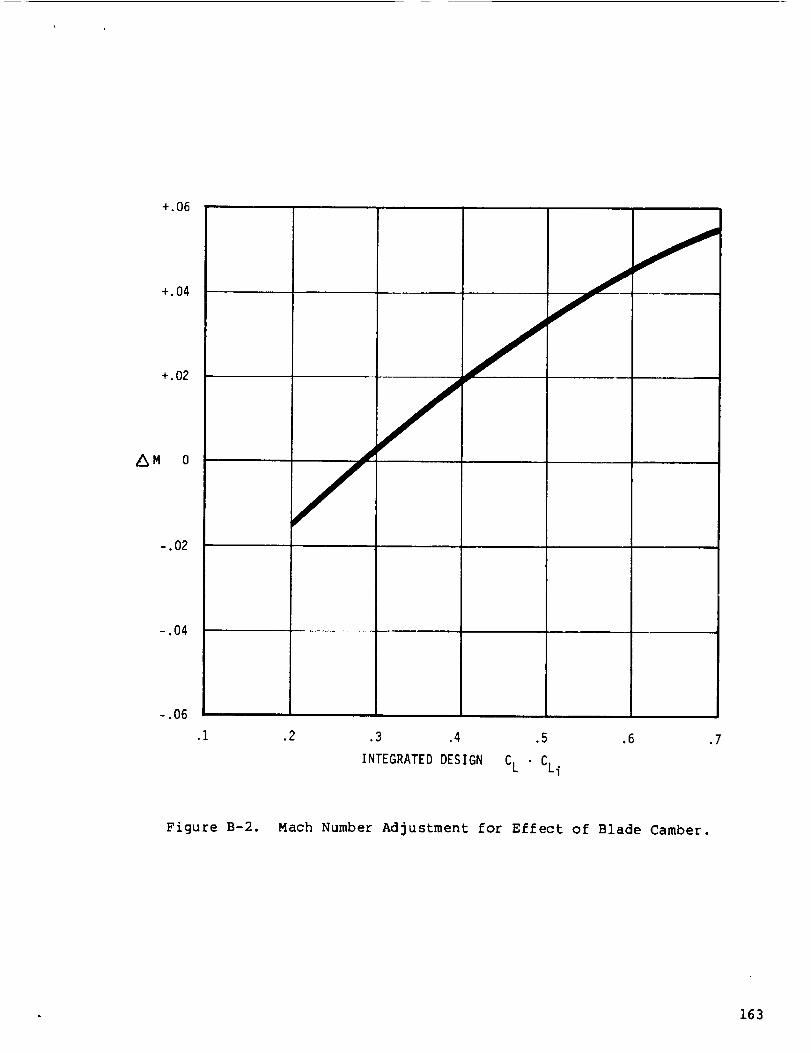
+.06
+.04
+.02
AM 0
-.02
-.04
-.06
J
/
.1 .2 .3 .4 .5 .6
INTEGRATED DESIGN CLiCL
.7
Figure B-2. Mach Number Adjustment for Effect of Blade Camber.
- 163

0
4..I
oJ
0
NO
,_4-_
_,--t
.D
• M _
U_
_0
o"
I
I-I
164
ORIGINAL PAGE iS
OF POOR QUALITY

APPENDIX B
HAMILTON STANDARD DIVISION PROPELLER DATA - Continued
STATE-OF-THE-ART PROPELLER - Continued
Weight and Cost Generalizationsf
The formulae used to calculate propeller weight and cost were provided in thePropeller Characteristics section (pgs 110-112). Figure B-4 is the learningcurve applied to cost.
Reliability and Maintainability
"The current technology propeller system has been analyzed to developmaintenance cost relationships. For this analysis, the current technologypropeller system is a single-acting system consisting of a hub, pitch changemechanism, and blade assembly, including deicing hardware. The blades aresolid aluminum. Results of the analysis are presented in Figure B-5. The costrelationship was developed utilizing frequencies of unscheduled maintenanceactions derived from reliability studies as discussed below."
"Reliability predictions were prepared for the current technology propellersystem. The predictions include both inherent failure causes (those primarilycaused by propeller equipment failure) and non-inherent failure causes (thosecaused by other than propeller equipment failure such as FOD, and accidentdamage) ."
ADVANCED TECHNOLOGY PROPELLER
"Propellers for the new and emerging advanced commuter aircraft included inthis study, must meet stringent performance and low cabin and far field noiserequirements with minimum weight and cost. High thrust levels for takeoff andclimb conditions are essential while maintaining near optimum efficiency atthe cruise conditions. The tip speeds need to be low and special attentionmust be paid to the propeller geometry to achieve the low noise requirementscalled out in the work statement. Moreover, the propeller solidity must beminimal to assure minimum weight. These stringent requirements are unique tothe new commuter aircraft propellers and, to meet them, lead to theexploration of advanced technologies as well as the existing technologies notnow being incorporated in propellers on today's commuter aircraft."
"In undertaking the task of establishing those advanced technologies with thegreatest payoff, it is important to first determine the sources of efficiencylosses, noise generation, weight and cost sensitive components. Then a listof potential remedies and new technologies to alleviate these sources and toimprove performance, noise, weight and cost can be compiled."
"Thus, performance losses associated with round or thick blade roots can be
improved by incorporating reasonably thin airfoils from the tip to the root.Also the spinner blade juncture should be configured to minimize thespinner-to-blade gap. Profile losses may be reduced by utilizing airfoilsdesigned for high critical Mach numbers. In many applications, new airfoilsdesigned to meet special requirements appear to offer improved performance.Compressibility losses may be alleviated by utilizing thinner airfoils alongthe blade, the use of sweep and reduced tip speed. Induced losses may bereduced by use of many blades and by end plates or proplets (akin to wingletson high-speed wings). For high-speed aircraft, Prop-Fans with thin, sweptblades and possibly counter-rotation tandem propellers may permit improved
performance at reduced size and/or tip speed possibly with correspondinglyreduced noise."
165
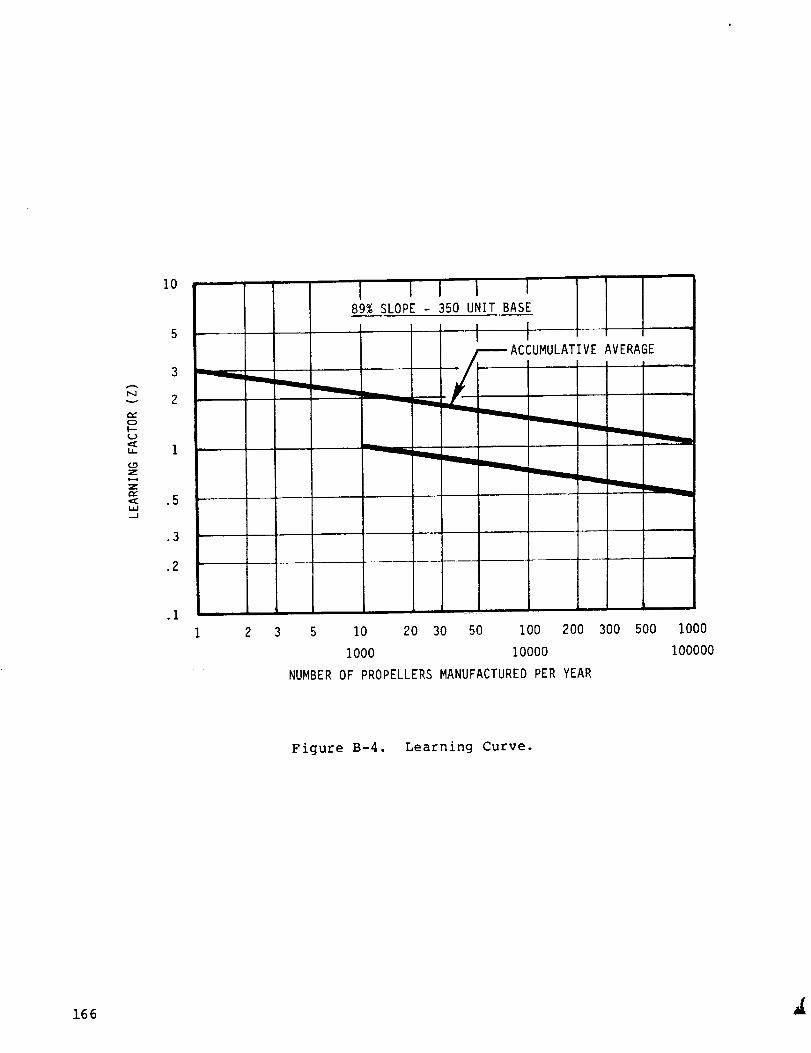
mv
(...}
l.l-
f._;z
Ze,.,.
W
10
.5
.3
.2
89% SLOPE
I350 UNIT BASE
----ACCUMULATIVE AVERAGE
z -
.1
5 10 20 30 50 100 200
IOO0 1OOOO
NUMBER OF PROPELLERS MANUFACTURED PER YEAR
3OO 50O I000
100000
Figure B-4. Learning Curve.
166
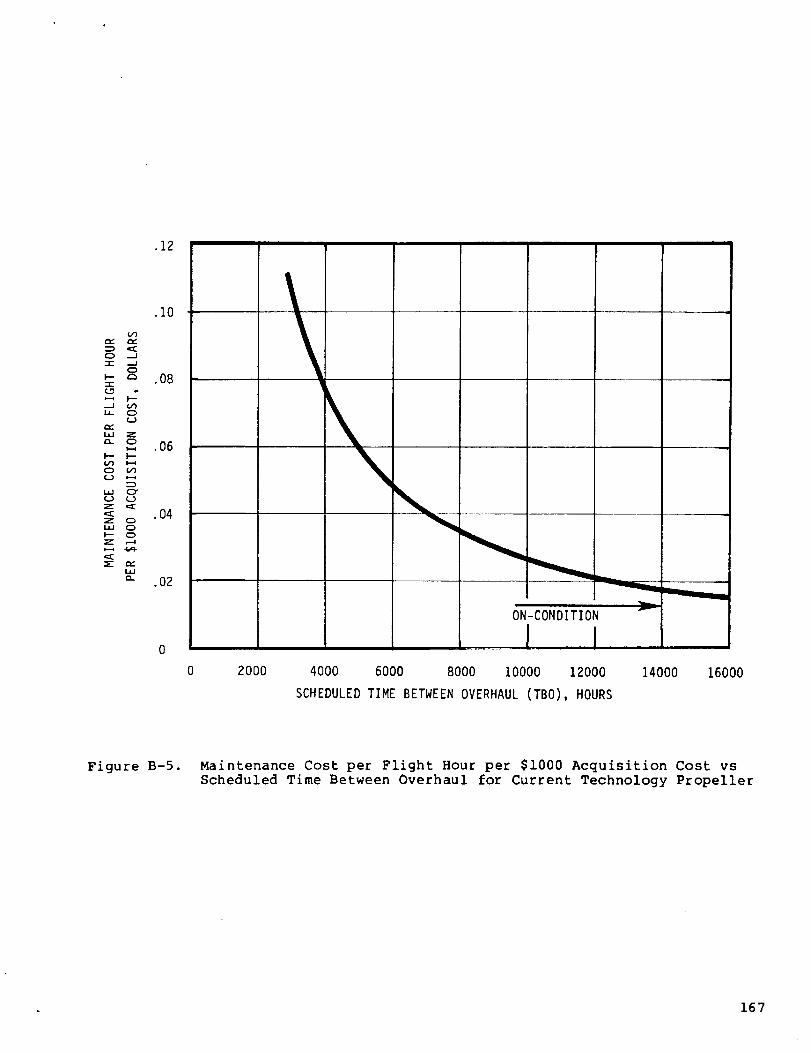
.12
.I0(29
O --J-r ._J
CD
_- _ .08
.._I c_
(.3
Z
_'- I.--
0 (._
u _
< .04
" .02
_N-CONDITION r
0 2000 4000 6000 8000 10000 12000 14000 16000
SCHEDULED TIME BETWEEN OVERHAUL (TBO), HOURS
Figure B-5. Maintenance Cost per Flight Hour per $i000 Acquisition Cost vsScheduled Time Between Overhaul for Current Technology Propeller
167

APPENDIXB
HAMILTON STANDARD DIVISION PROPELLER DATA - Continued
ADVANCED TECHNOLOGY PROPELLER - Continued
"Noise reduction may be achieved with increased number of blades, sweep,
proplets, reduced tip speeds, and in some cases, thinner airfoil sections.Advanced precision synchrophasers may significantly reduce the cabin noise of
multi-engine aircraft."
"Advanced composites offer reduced blade weight, narrower blades required withincreased blade number, maintenance of smooth surfaces to alleviate
performance losses with time."
"Moreover, the concepts mentioned above may be combined in some cases toproduce additional effects as well as to improve performance, noise and weightsimul taneousl y."
"A number of these propeller geometric and aerodynamic parameters and newconcepts could be included in a list of advanced technologies for commuteraircraft propellers. A list of the more promising parameters and concepts ispresented below. Performance, noise, weight, and cost parametric data are
presented herein.
1. Blade sweep.
2. Advanced aerodynamic/acoustic airfoils.
3. Blade tip proplets.
4. Multibladed propellers.
5. Narrow blades (low activity factor).
/
6. Thin blades.
7. Advanced composite structures.
8. Precision synchrophasers ."
"Each of the above technologies have been considered in the study. The
state-of-the-art of several of these are only at the initial stages ofdevelopment. In some cases, the concepts look promising on the basis ofrather crude aerodynamic and/or acoustic analyses. Some are still beinginvestigated under this program. Moreover, the advanced technology which havebeen included in this report are not in all cases based on firm analyses or onexperimental data. Yet in all cases, the concepts look attractive enough forconsideration and further evaluation."
168

APPENDIXB
HAMILTON STANDARD DIVISION PROPELLER DATA - Continued
ADVANCED TECHNOLOGY PROPELLER - Continued
Aerodynamic Performance
Performance data tabulations are provided for the same combinations of blade
number, activity factor (AF)and integrated design lift coefficient (Cli),as for the current technology propellers*, with the addition of one 6BYad- ed,75 AF, .55 CLi propeller. "The data represents the imcompressibleperformance. Corrections are presented to modify the performance data forcompressiblity and for advanced technology features."
"To achieve the low activity factor of the six-bladed propeller, it was
necessary to increase the airfoil thickness ratios in relation to the higherAF propellers• Thicker airfoils were incorporated directly in the performancepredictions for this propeller, but not for the other propellers which areaffected. The thicker airfoils lower the propeller imcompressible performanceand reduce the airfoil critical Mach numbers. The first of these effects is
shown on Figure B-6 as a small correction (ACTN_t_)__,,,AF to theincompressible net thrust coefficient. This in ent is subtracted from the
tabulated CT@ for the propellers which require thicker airfoils."This correc_._'_pplies to both adfanced and conventional technologypropellers.
"A compressibility correction (FT) is provided for use with the tabulatedperformance. This correction is obtained from Figures B-7 and B-8 and FigureB-3 of the preceding section for propellers without blade tip sweep. Nocorrection is required for blades with the 45 ° of tip sweep that wasincorporated in this study."
"The precedure for calculating the compressible propeller performance is:
I •
2.
3.
4.
5.
6.
7.
8.
Incompressible CTNet from Tables.
(ACTNet)AF = f(v_vr_ , AF) from Figure B-6.
Corrected Incom. CTNet = Incomp. CTNet +
AMCLi = f(CLi) from Figure B-7.
AMAF = F(AF, J) from Figure B-8.
MEF F = Flight Mn + AMCLi + AMAF.
FT = f(J, MEFF) from Figure B-3.
Compressible CTNet = FT (Corrected Inc.
(ACTNet)AF-
CTNet)."
* NOTE: Tabulated performance data provided by Hamilton Standard to General
Electric is identical for conventional and advanced technologypropellers.
169
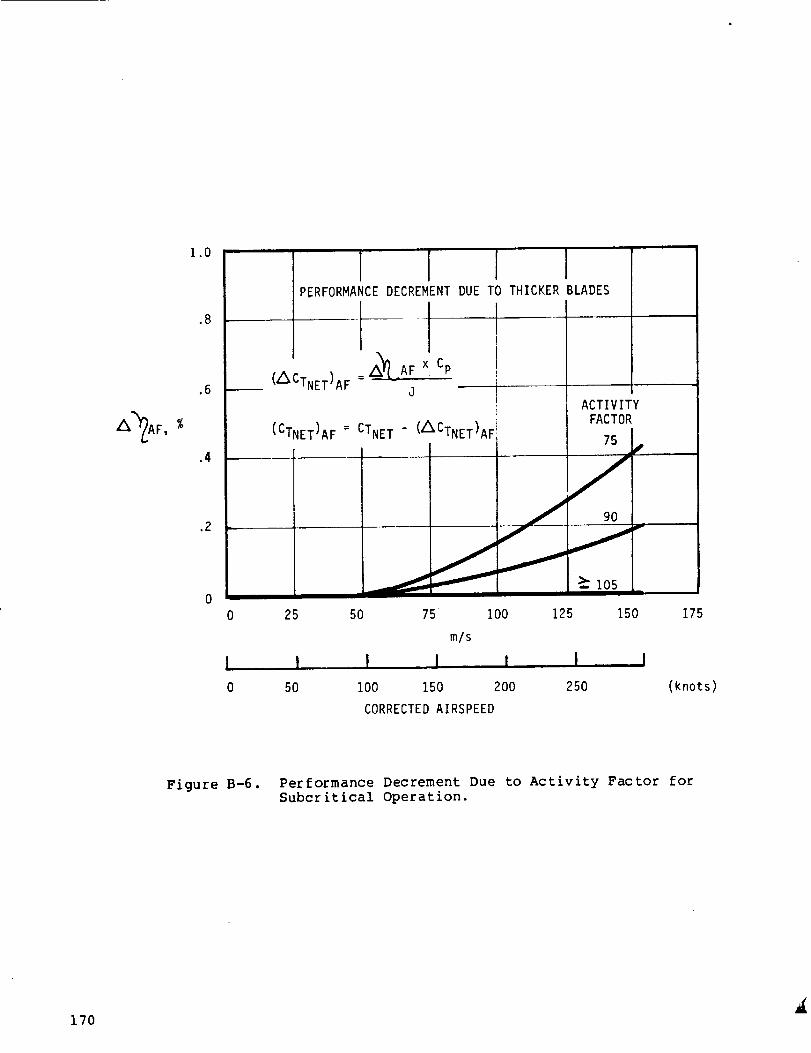
1.0
.8
.6
.4
.2
PERFORMANCEDECREMENTDUETOTHICKERBLADES
Ix Cp
I
J_ AF !CTNET(A )AF- _ J - i
I
]
(CTNET)AF = CTNET (ACTNET)AF i
i
ACTIVITY
0 25 50
I I I
0 50 100
FACTOR
75
// 90
_- lo5
75 100 125 150 175
m/s
i t I .... J
150 200 250 (knots)
CORRECTED AIRSPEED
Figure B-6. Performance Decrement Due to Activity Factor forSubcritical Operation.
170
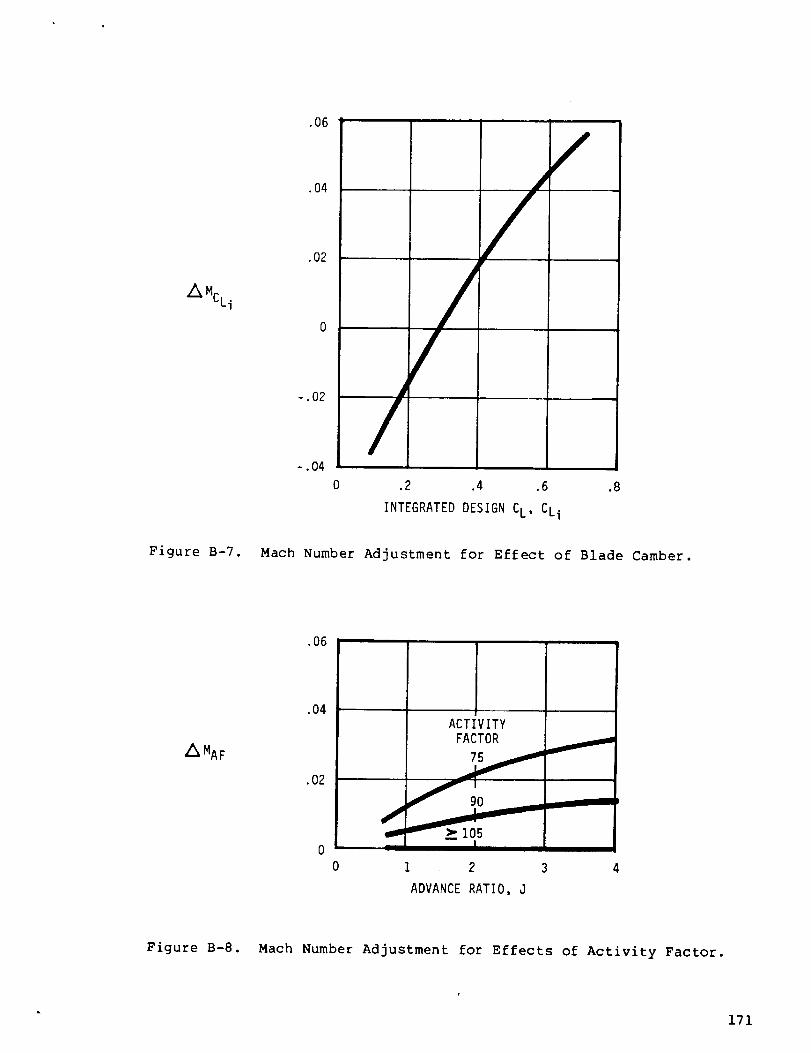
MCLi
.06
.04
.02
-.02
- .04
/
/r
//
0 .2 .4 .6 .8
INTEGRATED DESIGN CL, CLi
Figure B-7. Mach Number Adjustment for Effect of Blade Camber.
A MAF
.06
.04
.02
0
!
ACTIVITY
FACTOR
., I
0 1 2 3 4
ADVANCE RATIO, J
Figure B-8. Mach Number Adjustment for Effects of Activity Factor.
171
APPENDIX B
HAMILTON STANDARD DIVISION PROPELLER DATA - Continued
ADVANCED TECHNOLOGY PROPELLER - Continued
Aerodynamic Performance Correction for the Addition of Blade Tip Proplets
"The propeller performance can be modified for the addtion of blade tip
proplets. The proplet corrections, ACTN_t, is shown in Figure B-9 and wascalculated from vortex drag reduction d_ta measured for wings with wing tipsails. The compressible performance of an advanced technology propeller with
proplets is obtained from:
I. Compressible CTNet = Incomp. CTNet X FT, as shown above.
2. Read ACTNet = f(J, Cp, TAF) from Figure B-9.
Where TAF = Total Activity Factor = AF x No. of Blades.
3. Compressible CTNet with proplets -- Compressible CTNet + ACTNet."
Aerodynamic Performance Correction for the Addition of Propeller Tip Sweep
"The performance tabulations are for propellers with straight or unsweptblades. Tip sweep is generally not necessary to improve the propellerperformance for the low speed airplanes. The major benefit of sweep is toeffect relative Mach numbers which are below the critical Mach numbers of the
airfoil sections. Therefore, the tabulated data including the low activityfactor correction in Figure B-6 can be used to represent the compressibleperformance of propellers with tip sweep for the low speed airplanes."
Weight and Cost Generalizations
See the Propeller Characteristics section (pgs 110-112) for the basic weightand cost calculations.
"Two parameters may be added to propeller design which are not reflected inthe generalized weight formula. These are blade sweep and proplets. If sweepis used, add an additional 10% to the weight. If proplets are used, add anadditional 5% to the weight."
"Three parameters may be added to the propeller design which will affect thecost and are not reflected in the generalized cost formula. These parametersare blade sweep, blade proplets, and advanced precision synchrophasing."
"If sweep is used, add 5% to the cost of a propeller."
"If proplets are used, add 10% to the cost of a propeller."
"If advanced precision synchrophasing is used, add $5000 to the cost of apropeller."
Reliability and Maintainability
"The advanced technology propeller system has been analyzed to developmaintenance cost relationships. For this analysis, a double-acting system
consisting of a hub, pitch change mechanism, and blade assembly, includingdeicing hardware, has been assumed for the advanced technology propeller. Theblades are fabricated with advanced composites for the airfoil. Results of
the analysis are presented in Figure B-tO. The cost relationship wasdeveloped utilizing frequencies of unscheduled maintenance actions derivedfrom reliability studies as discussed below."
172
APPENDIXB
HAMILTON STANDARD DIVISION PROPELLER DATA - Continued
ADVANCED TECHNOLOGY PROPELLER - Continued
"Reliability predictions were prepared for the advanced technology propeller
system. The predictions include both inherent failure caused (those primarilycaused by equipment failure) and non-inherent failure causes (those primarilycaused by other than propeller equipment failure such as FOD, and accidentdam age) ."
Combining Various Advanced Technology Features
"It might appear that if a single advanced technology feature producesattractive results, combining two or more features would be even better. Thisis true in some instances, such as combining multi-blades, thin airfoils,sweep and advanced composite structures, for example. Caution should beexercised in other instances where the procedures that are presented would
permit the superposition of effects. For example, the practicality of addingproplets to a swept propeller has not yet been established, and at this timedoes not appear to be practical. Only those effects for which procedures areactually described in the text are considered practical at this time."
173

cJ
r-_
CD
\
CO _D _ C_ O
L_O tL,<
X
0..(.D
O
_D
C,J
CO
CJ
OU
CD
CJ
tO
OU
CO
_T
O
"D
U,U
k_
O
U
.C
C
O
U_
,-4C_
O
U,4
O
-F.I
.r.4,"4
I
°,'.t
174
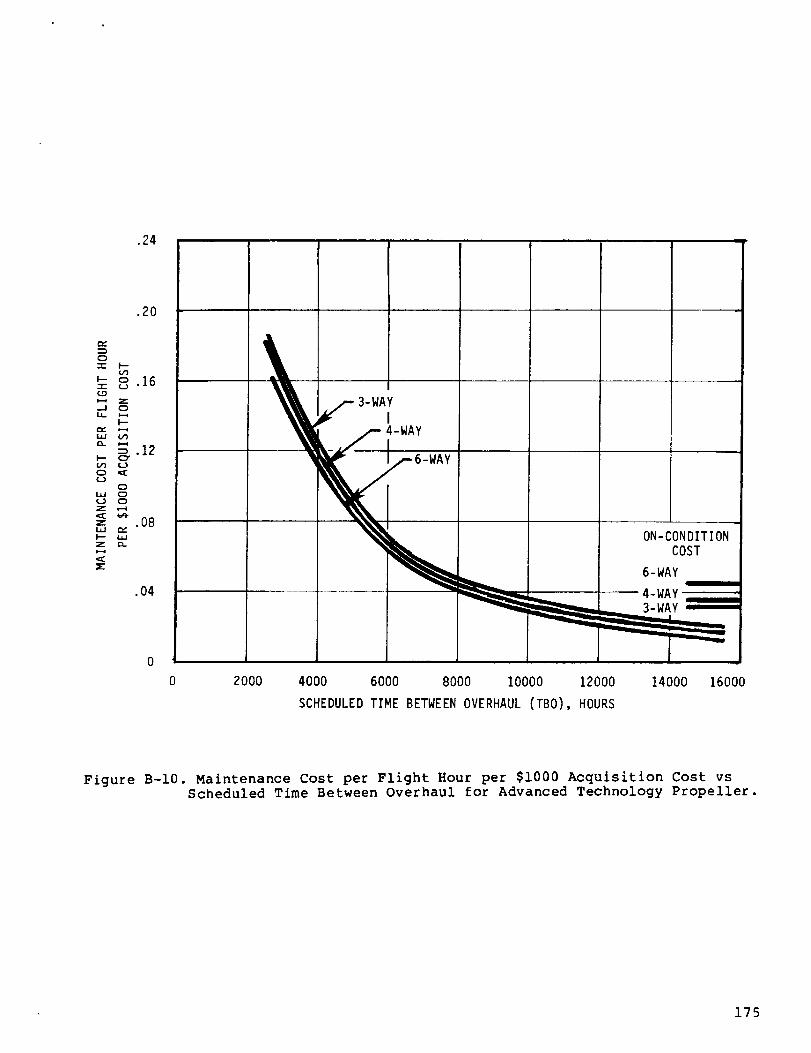
.24
.20
0
c_
_- o 16f_
.,J C_
= .12I-- (:_or) (_)
{,..}C_
I._ C_
z
z .08,,I c_I_ i,,z r_
.04
3-WAY
ON-CONDITIONCOST
6-WAY
4-WAY3-WAY
0
0 2000 4000 6000 8000 10000 12000 14000 16000
SCHEDULED TIME BETWEEN OVERHAUL (TBO), HOURS
Figure B-10. Maintenance Cost per Flight Hour per $i000 Acquisition Cost vsScheduled Time Between Overhaul for Advanced Technology Propeller.
175
L
/i
176

APPENDIXC
ADVANCED ENGINE PERFORMANCE DATA
Table C-1 provides a detailed cycle definition of the two advanced engines inthe final mission size. Figures C-1 through C-10 provide performance data forthe 30-passenger advanced turboprop engine in terms of equivalent power andfuel flow versus altitude, mach number, ambient temperature, and turbine inlettemperature. Figures C-1! through C-2O provide the same information for the
50-passenger advanced turboprop engine. Note that data are provided in thedesign size. To obtain values in the mission size, scale uninstalledequivalent power and fuel flow by 0.916 for the 30-passenger size and by 0.935for the 50-passenger size.
Precedingpageblank
177

TABLE CI
ADVANCED ENGINE CYCLE DEFINITIONS
MISSION SIZE
Sea Level, Static, Std. Day except as noted
Turbine Inlet Temp °C (°F)
Cycle Pressure Ratio
Output Power - kW (hp)15°C (59°F)32.2°C (90°F)
Specific Power - kW/kg/S(hp/l bm/sec)
SFC- kg/kW.h(Ibm/hp.h)
Net Thrust - N (Ib)
Fuel Flow- kg/h (Ibm/h)
Booster
Number of Stages
Inlet Flow- kg/s (Ibm/sec)
Inlet Corrected Flow -
kg/s (I bm/sec)
Inlet Corrected Tlp Speedm/s (ft/sec)
Pressure Ratio
Adiabatic Efficiency
Rotational Speed, rad/s (rpm)
Compressor
Number of Stages
Inlet Flow- kg/s (Ibm/sec)
Inlet Corrected Flow -
kg/s (l bm/sec)
Inlet Corrected Tip Speed
m/s (ft/sec)
Centrifugal Impeller Corr.
Tip Spee_ m/s (ft/sec)
Pressure Ratio
Adiabatic Efficiency
Rotational Speed, rad/s (rpm)
30-Passenger Size
Advanced Engine
1260 (2300)
17.0
1107 (1485 I943 (1265
312 (190)
.267 (.439)
765 (172)
296 (652)
None
2885 (27560)
3 Ax. + I Cent.
3.5 (7.8)
3.5 (7,8)
472 (1550)
640 (2100)
17.0
.840
5350 (51075)
50-Passenger Size
Advanced Engine
1316 (2400)
20.2
1510 202
342 (208)
.252 (.415)
1156 (260)
381 (1019)
i Axial
5.4 (11.8)
5.4 (11.8
335.3 (II00)
1.35
.872
2325 (22190)
3 Ax. + i Cent.
5.4 (11.8)
4.2 (9.3)
459 (15o5)
652 (2140)
15.2
.845
4780 (45650)
178
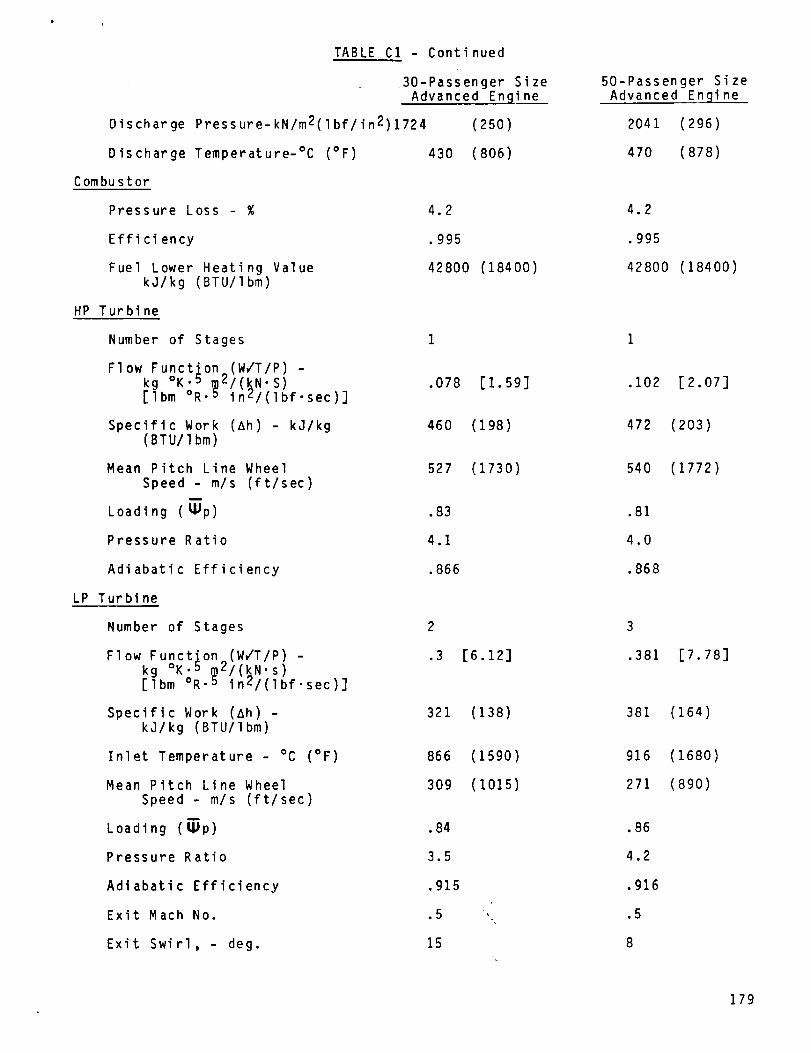
TABLE CI - Continued
Discharge
Discharge
30-Passenger SizeAdvanced Enqine
Pressure-kN/m2(lbf/in2)1724 (25o)
Temperature-°C (°F) 430 (806)
Combustor
Pressure Loss - % 4•2
.995
42800 (18400)
Effi ci ency
Fuel Lower Heating ValuekJ/kg (BTU/I bin)
HP Turbine
Number of Stages I
Flow Functio_(W/T/P) -kg °K-b _I(_N.S) .078[Ibm °R. inZ/(Ibf.sec)]
Specific Work (ah) - kJ/kg 460(BTU/Ibm)
[1.59]
(198)
Mean Pitch Line Wheel
Speed - m/s (ft/sec)
Loading (_p)
527
•83
4•1
.866
(1730)
Pressure Ratio
Adiabatic Efficiency
LP Tur bine
Number of Stages
Flow Function (WJT/P) -kg °K.5 _2/(_N•s)[Ibm mR'b inZ/(Ibf.sec)]
2
• 3 [6.12]
Specific Work (Ah) -kJ/kg (BTU/I bm)
Inlet Temperature - °C (°F)
321 (138)
866 (1590)
309 (1015)Mean Pitch Line Wheel
Speed m/s (ft/sec)
Loading (tlJp) •84
Pressure Ratio 3.5
Adiabatic Efficiency
Exit Mach No.
Exit Swirl, - deg.
.915
.5
15
50-Passenger SizeAdvanced Engine
2041 (296)
470 (878)
4.2
.995
42800 (18400)
•102 [2.07]
472 (203)
540 (1772)
.81
4.0
.868
3
.381 [7.78]
381 (164)
916 (1680)
271 (890)
.86
4.2
.916
.5
8
179

?ABLE CI
Exhaust Nozzle
Pressure Loss,
Pressure Ratio (P8/PAmb)
Exhaust Temperature -
Secondary Flows*
Axial Compressor Disch.
Returned Post LPT
Vented Overboard
Total
Centrifugal Comp. Disch.
Returned Post HPT
Returned Post LPT
Overboard Leakage
Total
oc (°F)
Bleed
Bleed
- Continued
30-Passenger SizeAdvanced Engine
1.9
1.10
586 (1087)
1.4
0.5
1.9
6.2
1.2
0.25
7.65
50-Passenger Size
Advanced Engine
1.2
1.10
588 (I090)
1.4
0.5
1.g
5.75
1.2
0.25
7.20
*Expressed as percent of HP compressor inlet flow.
180
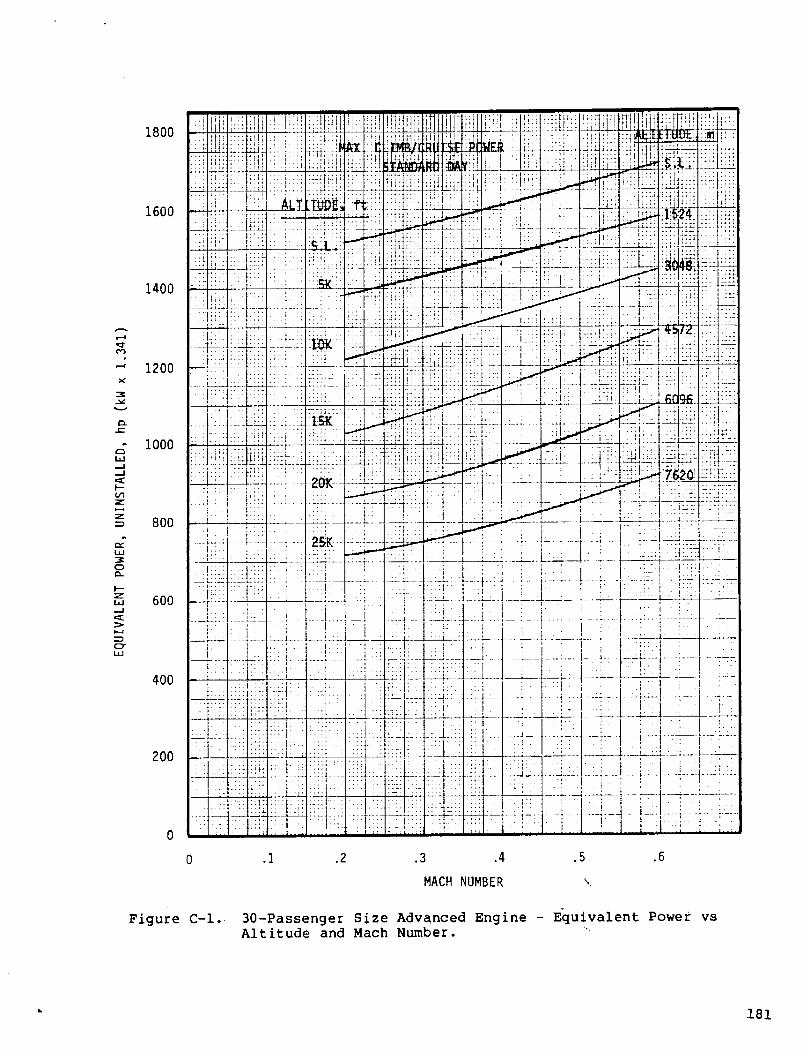
,I::I-
X
vv
r-
r_i,i
I---,I/}Z
ill
0
I--Zi,i
,,..I
i--i
CI"iii
1800
1600
1400
1200
1000
8OO
60O
400
200
_ i _ll,i!I i_:;'_ I ii !E,_i]!I i MIiHF]11: ilbl _!i!iii_lll!iHi!]li_i_:'
.... I ............ ..... I, _'f[+: ........ _+ h'_+ ........ _' " +1 ..... _ ..... J "" !'!'l#:'l '!'_ :::: :;':
::,-7:7 ii 77t:: :i: :-.i.;i_-!::_,_=i.:i::li,.ii{t-7..-:t--_:.;i<..- '_ t ?: I Lii L _:__'_O.;4-t-l_l_L/i!i;i:!!!
i' '1;'1:::: ::: ;::; :: t : ::::l:: _:: ::;_i i+_.: :',:: : _::_: :::: : ' :::: : .... ::t: ::
::,i:l:!i! iTrrl:! .f :7 i!iit! t.t ii-iiii_:;: :i:: __.__,.'._. :] t_t:196:L__
::-'::E_: _ tZL:Tm:_"-":_:-! -:'_:_:
.......................... - 1 ............. l "_
_.:l..:f::::l:::i .:1:.:_!/_ I !:l:d _ :! : :! : ; . ' i : .:::: :!::i-!-: :
---A---:!- -:£::-4 .... f .... ,i-_ :__; t::--:4 ..... _,L ::__.:.a ....... : ........ : - -_. -.h..:: .... ; -:-:-:-- .--
.... _:_:____L__,__ .... _,_--, _.....................
it': - t........ :+...... "-:'............... ,' , ........... .i Li::
" I. :::t :: :::::: :::: :: :::" :: ::7_: ::.: :i _: :: : : i i '
0 .I .2 .3 .4 .5 .6
HACH NUMBER ',.
Figure C-l. 30-Passenger Size Advanced Engine - Equivalent Power vsAltitude and Mach Number. '
• 181
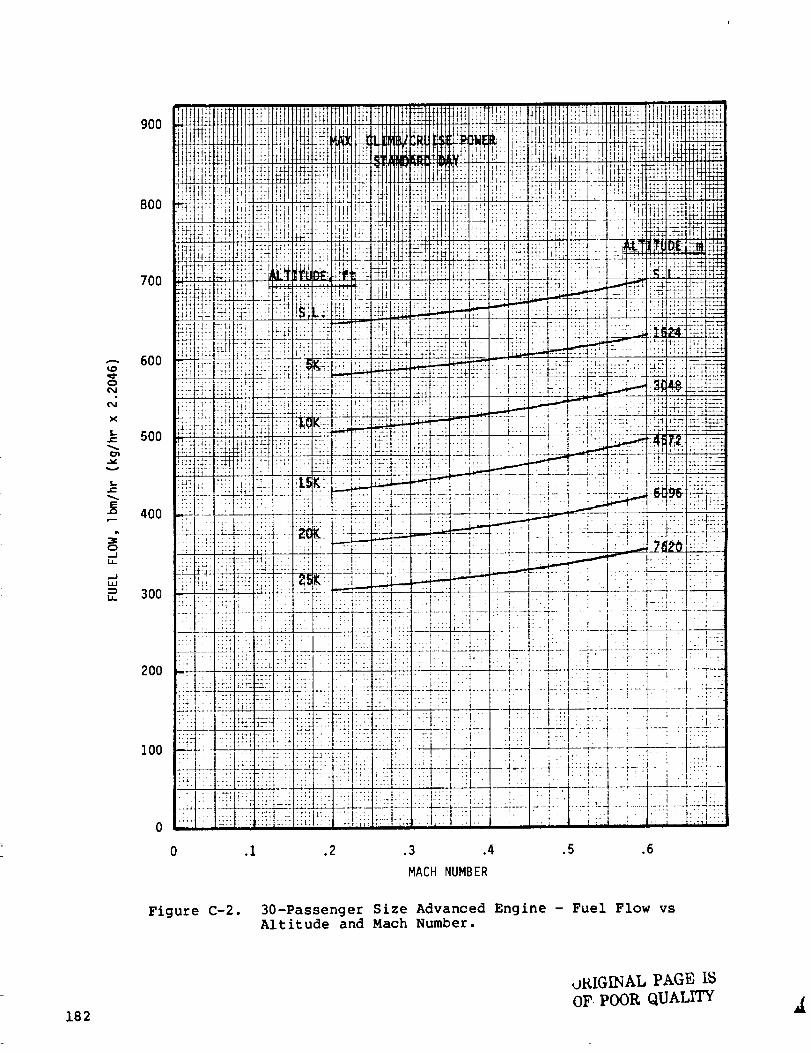
oo4
£-J
X
%.e-..
,,.,,,v
f,...e-
.mi,,--
oJl
h
mlI,I
I.I--
"F,i+ ii+
900 '+.!!)i!!:))i_]l+
]iiiii',m_Jl
800 _++• H2!HI_
.... )4
700 %1:, ,+,_,+"rT,+
!:!_.tJ
2 ZTI-" TT
i_iF+.-i600 _T_
F2'_ !_
.T:_ .']
i ..... It::';;
ii:i :i500 .......,++l+::u!i
!!!!:} +
:_'4ii:!-: i!
400 -_ /
::: ii£.++
.... ++++IL;L:
300 i ,.
200 _:
%!::%i.< =
;£2- Z'
100 '
2_ 2i:;Z :
,2:. ):
: ii
!!!:{!)
,,
++Cilllii ',!i• '_ !!t
., r;+t, ,::: .... i!!
12
,;, d;'" i]!!'+_+; +.,.... +,. ,.:
"_ : t-) !
:+,,; :..•< , ii
:_rl '+- ' _++."iT: +:_. _Zl+.u ......
L:: ,N._+.. +_"t'.++
,Ill : ') :;
_+ , .,:+++ ,
#++ ,
: : r ;.:
p ...._--++ -- + - -+
++
..... i
:: :I+L ...... +_+_
m_:+ ::t +
+:::'.:++I+!+i:::
;'+2 "+2'. 112:
::. .it: -+...... I:11_: :: !', I,
.:: :t:++: +.
;2!i :::_11!..... ! ';
2 2:L2 )!)i<l:_,,,
0 .I .2 .3 .4 .5 .6
MACH NUMBER
Figure C-2. 30-Passenger Size Advanced Engine - Fuel Flow vsAltitude and Mach Number.
182
oKIG[NAL PAGE IS
OF POOK QUALITY
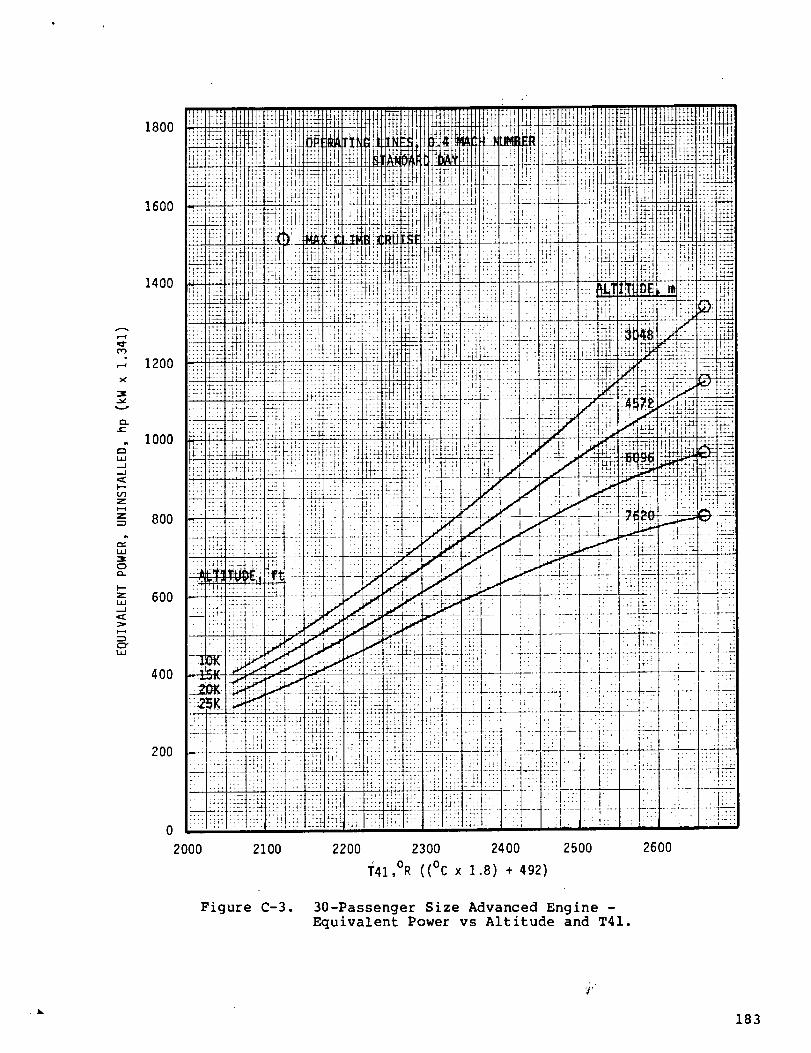
1800
1600
1400
1200
1000
W
Z
z 800
O
z 600
400
200
0
2000 2100 2200 2300 2400 2500 2600
T41,°R ((°C x 1.8) + 492)
Figure C-3. 30-Passenger Size Advanced Engine -Equivalent Power vs Altitude and T41.
183
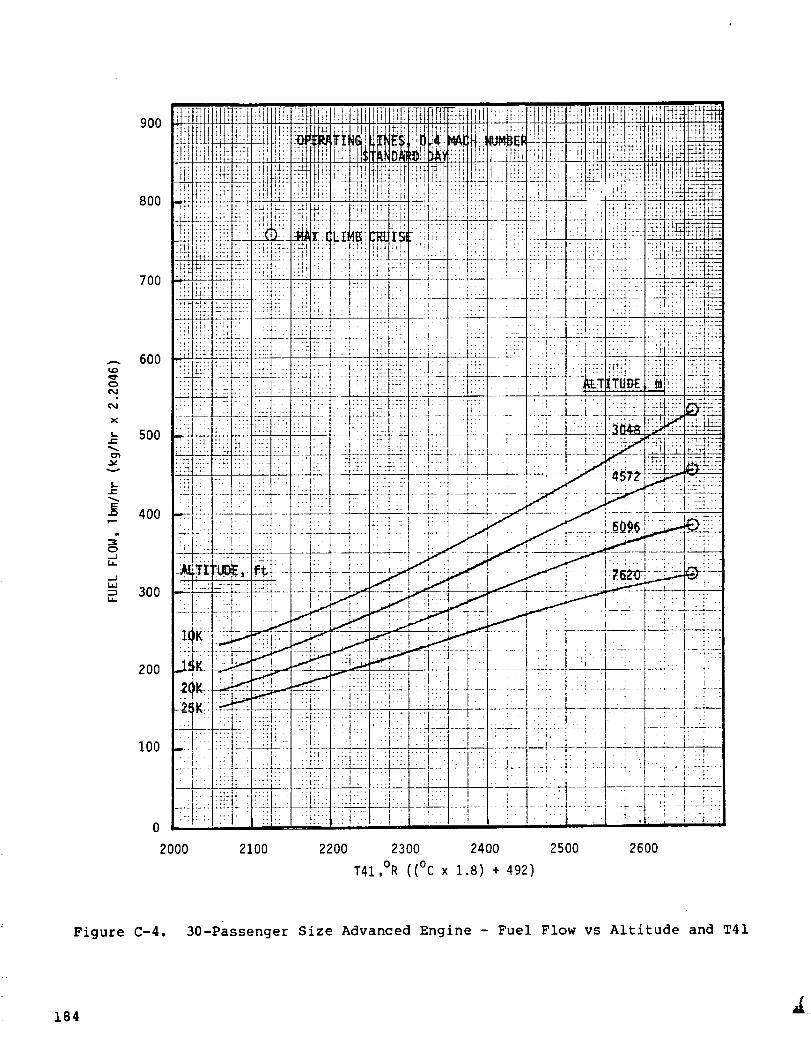
90O
80O
700
':X.
X
=_ 500
400
,p 300
2O0
I00
r
0
ilfl lili I]TI
Tr'_ :'1'
!i27.-!:iEi :_P'
:T':....
-LL_ L:IL :!':
b'_: :i_i 2:L
_.._.t: r: T " t::: :: :
::t !i::: !!:: ::::
!i_ _i; T:[: : ,
:2:! 1-'.£C :[;i ::
,E-:/, T::'T _t .............
• : :]_
u uu
U j:}:i _l-• :_.q i , ,i! i i_ _ _ ' ;
;itI ',l;ilil',: !i.llI.LE:Ji,i;j_,£i![i:;ltli,l'.!;l
ii I i; t:: 'l_i
Z_,.2_+I:!;[::ik :
L ;
:,ii_:_ i !,_ti_iiE:I [ '_t,tL _' ....
:: ,t_rt t '
..... .......'!l't: -..:i : r-'
......i i!liil q::
,_ 111-
.... 'l,,n-;;
:i;!l If:
,.£1! ,
, , . ..... ; ..... tl::lt!b_
I:_t il ;;:_li!;i ii;!I-_IFF _tlI;111
; .... i ,, n -i •,' t "1 l ,
'-._L" _bL_:_L: I-_L.... . I:::.1
;T . : .
:L.: 2:. i:LL .... ::.LL
''' I .._.--
" ' ' ' :: 3 L_::-; ::;::i!"::::• [-" -. :::., : ::':I _ . " -" _ ..a ..... , • ,-,._
:.L: _L::L _: .__ ;.2_- ........ __[_._. ,. _': !:_: ,• ...... : .._ti:i::!. i-. ' '' *" F:::
:_" + :__:::i!. + +:_'_ ;LF- LX___ .......... ': .L----.I --.LL_I--2+ :::: .... Z :_+:
++:.1:: i: +::ii::+:l: .:: !: .+ _i:222 _+_: ::]_,m:.:._'_,:: r:tL2-_
:T , F_'..: ":',_. ": ...... _. ., _........ , .... _-_t 2:: _,F:-_ _'.
-_--_ " ' - ' i _:-' ---:--- .--'_ ./ 6_'I_ ";._.,"_ :, .-::
- " - '.-T-q _-_ - , ...... ]---;- _- ...... -;........ T .......
T_-- .;-:._ --*_-- : " - .--; ........... l - " | : ........: . r_,l i I '_ I __ :. I :.-.,_"_---b_--_._-'t,T.£ .i .. _.... I. ' , I ---_- --1 ' I : ...... ,_
_ _ii•l'!::::il.! : i:: ! t _ _ '"" ' ' !: : " " ] 1
: -: : ::i:::: ::..'t ':!::: : "
:T:I:- ::il:] , .:!i i: i:ii:
_:iii:: i !ili:l:. ,•
' !. ,
rIT---
: !:!:-,
• ' _ ' ! : I i I ::-:.......................... i £-................_ • _ ;' ': :,, i ' , ',
• '1 " ' !
- , '"4:: '' P'i: ,
2000 2100 2200 2300 2400 2500 2600
T41,°R ((°C x 1.8) + 492)
Figure C-4. 30-Passenger Size Advanced Engine - Fuel Flow vs Altitude and T41
184

H H
Ht_ ,*tt!
!" _t4
i II =
fi5N
i!sZff4t
t,tq
!L_N
_+, •
!!!* _t_ _-_-_ +_+,
ttt-, _ t,'d_
[i:i :!Ti
:=h H!"
: ?
1:;;4 ;,4i
.I .2 .3
MACH NUMBER
H-_._
.....IIF_E=_
_-_
IH+ .ul
L-.. :t!t:,_ -
:TT- ;E
_1
ii_? r4
2
_:ii ii.T.; iv
;4M
Figure C-5. 30-Passenger Size Advanced Engine - Takeoff EquivalentPower vs Mach Number.
I Reproduced frombest available copy.
185
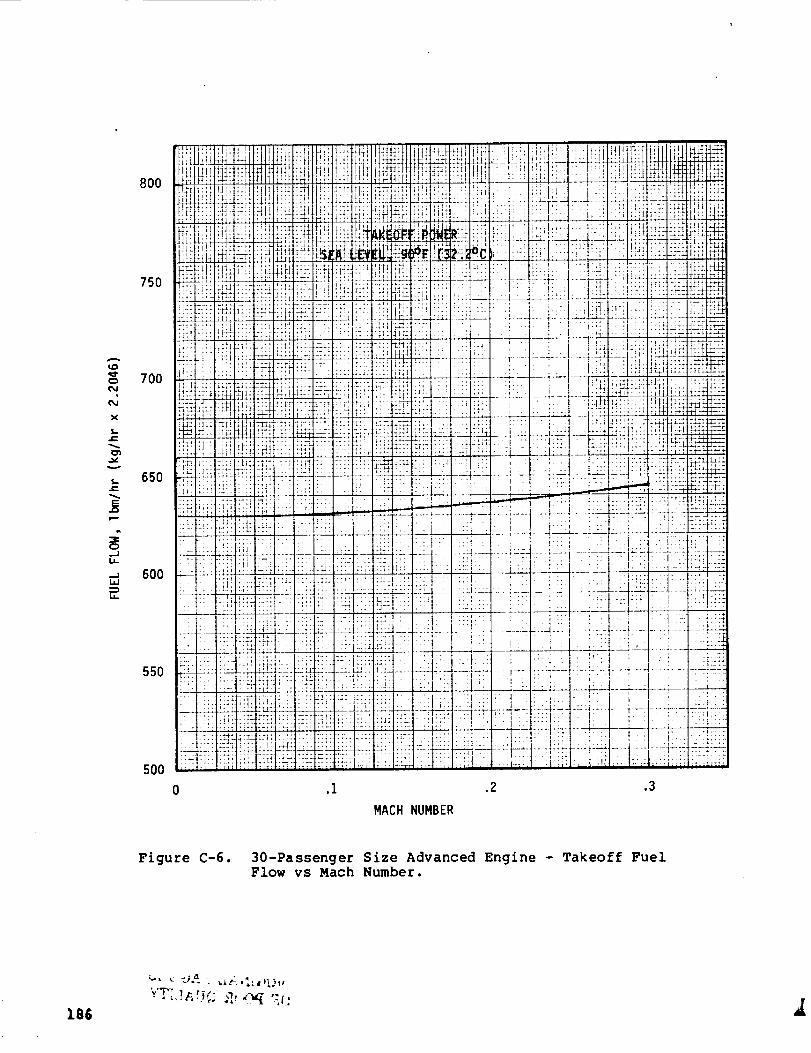
x
i,-r-
f,,,...
o.._1i.i_
,,,_1hi
h
8O0
750
70O
650
600
550
5OO
!I!! !!7
iIi:t +,_:
Jill...............mf....,4t_
!tlL2L: :_t : ::
....... Hf'.
ii!;:::ii-:_-I!]!.i
:t_ 4i12 *::*
!_2NI:
,Y, .... ,- t,,-
"TT7 T_.[ : [ : - - .
•_!i !:! :.:;: :_!iI:';: i -: /t: ;1:i:;_ Lt:; :!i! T[::
--.:h.. :::
"L; 1:-. !', i_J!
: !T'!! "::i! :]i!
• '": ' :t!} ......... !
i-ill'.,. :Hi i;il
: i .... ;.. :;:
L::- ,:: I.A!
• 'F- -:°q t:"
.... I: : i?:i: ,_+!
..:1:-[5:: _::i
.... i.,. , ..... ++,,
i!ii i_il
+H. I_I;.Itbt +_1*t
_m
tttt {;_
I._ 7 1
:]72 T:::
;:!: :1.7
![:! ,r_
,_1 't'*I
Y'TT
, t
' i
T,:T
?iF
i:. : ::::i::7_-
I:;: :it:
n_ .....
ili i:,i ....
l'.!'l;t'_l,;
-L...
fH;I! !i!l ';i:_iLH!'tfti'l_: :
,,+,l-;,tl
-'l': i :.;:.hi'l :':j::"
:_L:l.: .t _::7
_ ;iti:-: i: _:[_:Lli_::i:r._;
! il:; _:t2zt
;i f: t ;'.J_: r:_if"-+L:±
_!iI7{7_-:,._:,,7! :i'_iF ?:_
i_! : ::i F:I?
;;' "'1" !:+:
. .:
_:::
i::i
".12:11;., 2::'
:t_::Z "
:Fi]!2Li:_..
:m 111
f:;T ....
V!" ::t',:: r._;
L.JIL..++
::!1 i;;!
]:1,
:T]_.m,:.: p.-.
L:,-t L_5FZ
[:: :: ,: :;i
F-:I777 ::717
'.1 :!t 4 ,
:::T_,!:;{: T71:71- "":t- _i-T
ti .: o .....
: :q I: I : :::. : :.._ :_.
! : .:. l:ii!- _-4-_. ---I----I-- .,,,
__ :.-._-L-[__ :]::--;-:.:-l:_.!.i.
I , .it,.i 7}
:i :t_A.LI{L:L :;_i_! I{ii!::77
,:t_ LE '-'i L_:,bnt
:tJ i::-
::;-I-]-LI, _ +_+1 i,. ,
!: :l_z_:l _,., :Ztr7ILl _.,::L1'11;I ,
i'::I:; :H_'TZz :: ".<:- _._]<_I"-:: i: ::_] :: +_Z:h+_
_, .. ,: :'!!!T'_t
...........;-;:' :' :":::"::IL:Niiii:::!i!!:I_:_!77:i I!_ :;:: _:: '. " :: : ";::':::: ::_:::_-'::':::._ :: ,_::__- I_.1:-i,:: ,:::._, .___::-:::.. ._,;:_::__::t:::7.i
::- :'-:,..........: ::-- "i:-i!i 7 77:-1:1:7::_: -_:_:_........
::- ! .-:_-:":_ : -T:1 "-: ::: .... :-:,::..- I::: ::::-;TTT "-::'" ."---'v
..... _ .___ ..... , : _, r
_h:!.:! ii:1.:: : : ii !i: ;.:. :::i!ii..]::: '.--:'..L:L.:: :.:.L ::_:."::..:.: ..:. :_., - .- : ;-_::' :"'4-:.-._::: :i::J :n]i-:J T:: :;: ;:' : :: : : .... ;: :: ; : ::_r-l':::
......:_.... :::: : _._i,:_i_i ::, :: : :_:::,::.::-:;.....:: _:i :_ -:-:_:q-:!i - '::-:i;--:--:::-::l:i_'.::_: '--"7_TT _:C" T: ...... '....
' _ " i. ! :Iii ": '
:' _ _ ::I: t _ "_t-- _
" "--i-'--':.
" " ::.. : ':I;, ' ....
0 .I .2 .3
MACH NUMBER
Figure C-6. 30-Passenger Size Advanced Engine - Takeoff FuelFlow vs Mach Number.
186- • .....t_ . '(_;i" -,,f;

1650
1600
1550x
gw 1500
Z
Z
14500
Z
>
C)"1400
1350
1300-60
Figure C-7.
-40 -20 0 +20 +40 +60
Z_ AMBIENT TEMPERATURE, °F (°C x 1.8)
30-Passenger Size Advanced Engine - Takeoff EquivalentPower vs Ambient Temperature.
• 187
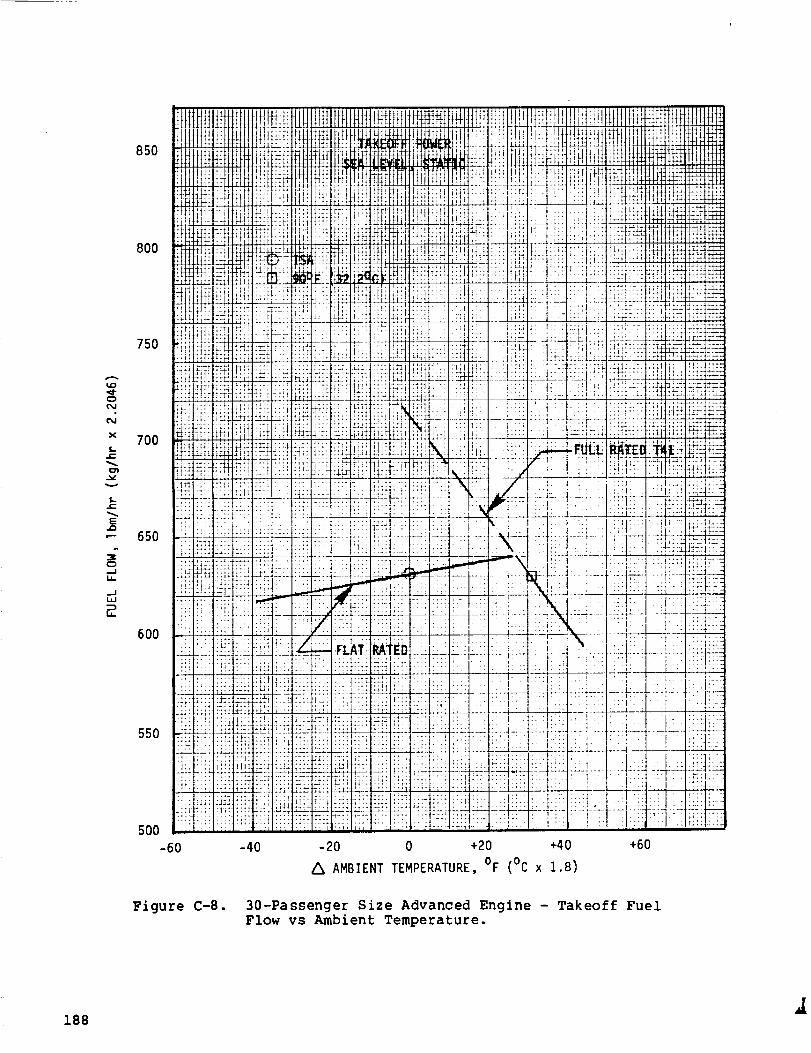
0
N
X
f,.f.-
vv
e'-
r--
,--JIJ-
I.tJ
IJ-
850
8OO
750
700
Hi
-'.H
jt
21-
tH
÷ .
2 ,
:i
650 .-:
T'
:!-!
600 _4ii:
,,o
550 _;,
500 '
11
IIm_
ii!i
4i;
;F
jl:_t
tt
T4: _i
';7:'- 21
:t_: i
!! :
:i?
41. 22
22_
2:
!r
2]"
22:
I iliiitf !I.:,
i,: !!4T:iIi -rl_! L:
!f !l:_f!
g!!:;:l;;_r,_.,o
!!i;:
[2122.
fl!',_<
i!i !
[, ._2;
:4!Ii!• ' I L
:i ii_ii:_i
,4-....ij ,..t
• ' ',t: :x
ii .qlM4
'A •'!! ',:',
:! "'!_i:{
• ]] "H::::
I!
i!;a I
xJ _
,.4
:TI
" i
" i
,..!
Z;2 !.
°7"
J[:
,.a!4
:;r
ii Ill1-tl I!
_iil J!!',i_!!;
t-iL :_:- ....
'.tl .... _}
]_: ::] f ::;:4i--: vr- a _ ,
.......i -_ ' {}:: '> _i__W:_:It::,L;_
" _; :{_!!1!i]! ifii{!!i:-+,-:_'i'_'.:-_ +_
•:;..... tyi{-_iii..... :=:" '"
q}i-ea_:_;'_: :'_. j.:I_!k!;LC:
..... r ' ;'if
; : _!.i.:iiili:. . .: :;;[;:
,:. 4_ ,::.::, _.
,., ....... ,I-.
' . :':T::IT TIIIii!
i:ii :_ i!]7-at;l-LT_ ]_ i _.L_i]: ___
!_i :'ii "i<! ]h]lI7
t;!: :: ..... '1 _!i;!: 1
.'T:i',:.::::i:=:li!
'_;; 1;:; ;;t, :::_i !!,:j ......... .:
: ..... _, _.} i:,,l:_ "_i! _[! }!}i !}!il::.... 2L/. -gt 1
:_ ;.:..:'_• ,.. _ !_m11'..: _+:: 'lit [,::[/
.......... 1- i-- }11_++T "111 ir1; *-"
i;i
!bP
Ill
2
_f
IJ2
U;
-+4
-i
2-2
22:
!'r
i .I..
I:
0-60 -40 -20 +20 +40 +60
A AMBIENT TEMPERATURE, °F (°C x 1.8)
Figure C-8. 30-Passenger Size Advanced Engine - Takeoff FuelFlow vs Ambient Temperature.
188

1700
1600
1500
e-i
1400X
g 1300
1200M
W
O
Z
w II00
>
1000
900
80O-60
Figure C-9.
-40 -20 0 +20 +40 +60
A AMBIENT TEMPERATURE, °F (°C x 1.8)
30-Passenger Size Advanced Engine - Climb EquivalentPower vs Ambient Temperature.
• 189
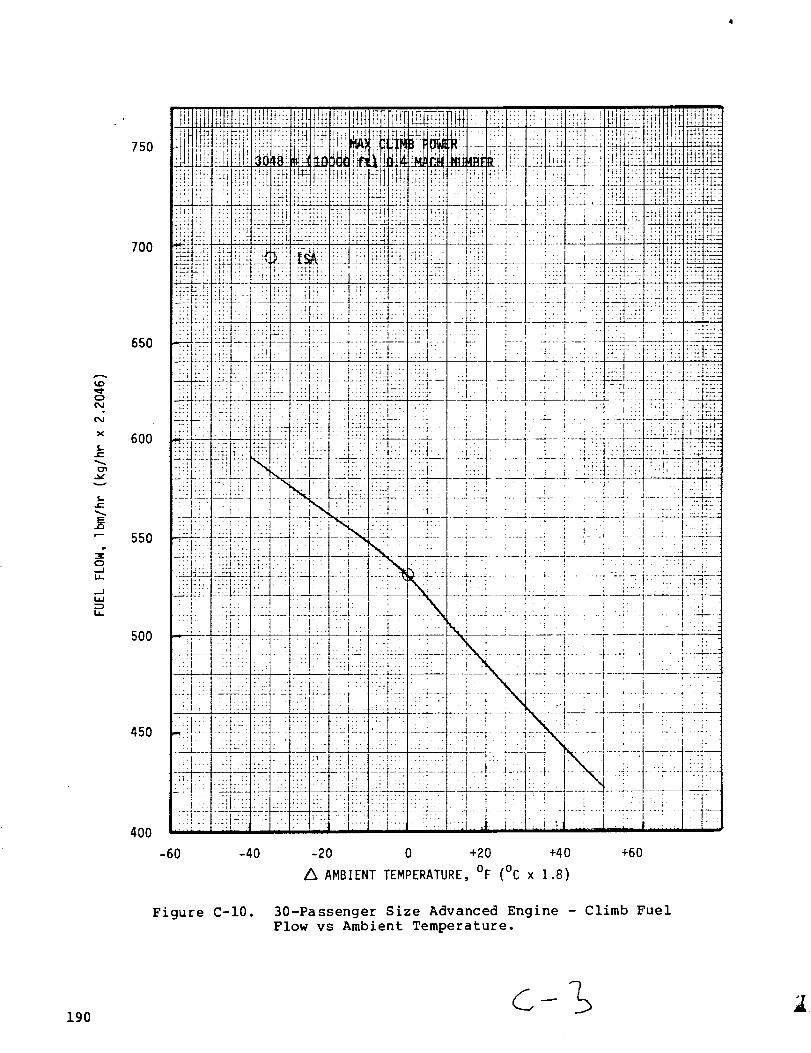
ON
X
I,,..r-
v
$,.
r--
O-,4I..I.
I,.I-
750
700
65O
600
550
50O
450
4OO
:,_,"'iiIi i!._!'_':'4t__u_.,,i!!_,_H,,..I!i! !i!!1'"_:_i-"_,,.i!q_ _!il! '" :" "
• . ÷........... .-.............. ,_t
..................... ..... f 1'_j _ ....
._'-_ ...... • _:,i_:':_: :::-:P ' _: • " ' :: I :!: _::I:_Ii :_:.''-"_,qL:_.:l:i!q!i!l_.N::!t:_,.L_:: i!:ti:i:l:-uil_ii_l_jiq. -I !::iil 1 . I [ l_:i : ::._!t:_!:ti_-:if_-_-fl_.t_'*l " ','_'','' L"'_ : .... 44_J. ....... ' .... _ ''" _. " &_ALLLL: J.".ti]]'" ÷" _. :• + ... :_ ,_ ...... _7: , 0-T-- .... " -, ........... _ .... _ _ _ "_
4 t .............................. ' .: ::.: . r: " J::: J : " " :_::I : ' :TJ;;: ::" ::'_
• _..... : I ' I ........ I ......TT k:".... _ ...... --r---_ :x- T "-: - _c!!_-r -:--'. - ,..
I:- ,,, !, : :_:.::i I i-k/::;i:-"i
:_:[ .... :-: .. [::. • . :: - • :. :..: .-: :.-- .z___ F_ _L.:_-_t___j_-m_z ___i-: _'-4--.__ - : I . ._- , - . .::-,..:-.t_:_'::--4::_
:- ::': . : : I i " ': ..... --r-- -_-- '--_---- '-_ - I -F :-q---_
.::/. t ' ,:lxli_,_l t ::-I_::1:i_ __ _ : _ T : :_:_-_--Ivl_-_-i-::.l....l_b_!-::-.I:../-:?X-_÷:_--_I...._=:--_ " I:= _...._-:__-:-
__'.:.bzz_l.z_.l__:::4_::_':_d._-_l___ -'_._.:z4- ..... :4- ........ _ ..... i .z' .; .: ....................:.:i..-:.':.:.:i :]::1 ....." ." " .i: • . ; . r 'i : ! i : .i . i :.!....l..I.--I...., ..q , ",,: .. . . __.::...., .......- _..
_2_.L_"J...... 4_2 _ -:2 }__L. .... "__ ..... L_.: /._;.2J .... x..-._- . _ t- ', ..... "...... _" "'-J_ -:?.! '[7 ]:qT:"'k ..... li'' / ....... f _ ................
--T-.-. :1--i-: ' . :, . .?--':--_.Y-"_ ....... T-_ .......... I 7---T--T-.'.-TT---_.___ L.___q]_-4._z__. :_-_=:_-_.-_-......--::j .:.\ ......... '...'._ _.!.... _i...._: 4...... !..',---_
! _L_ __i il I = i' i. ; :.li'_itii'_l: i _ ! ,.i "_ .i' " '.. ' ' , ' "....,-- "...---F.--.i"-- :×r ......... I-_'"" -_:7" _-":.... !'-' • '
"I I {:: ::I' =:" I :',I ....I- i..l .II. ' V :\ I " i " i :-:i t :-:'-:': :i'!: ;.: : ..... " :t " t " i __'LI : _ - __._._.... L__ _-- __';---
-6O -40 -20 0 +20 +40 +60
A AMBIENT TEMPERATURE, °F (°C x 1.8)
Figure C-10. 30-Passenger Size Advanced Engine - Climb FuelFlow vs Ambient Temperature.
190
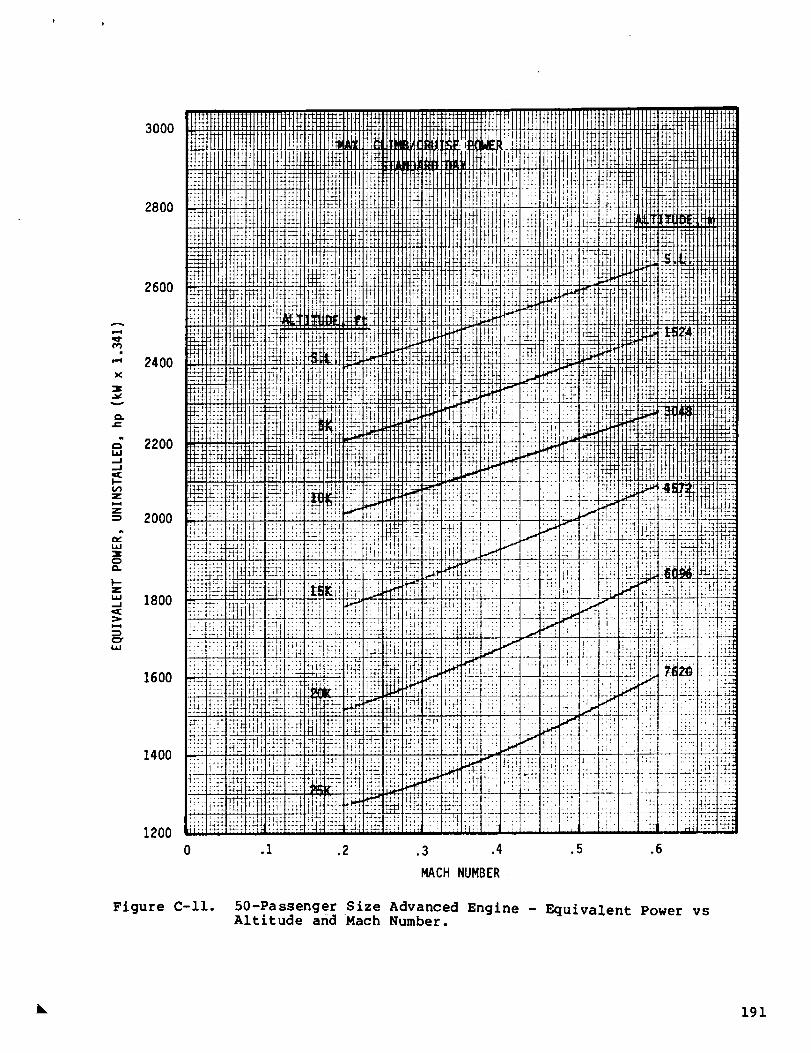
3OOO
2800
2600
2400X
3
2200
Z
Z= 2000
.23
w 1800
1600
1400
12000
Figure C-11.
.1 .2 .5 .6.3 .4
MACH NUMBER
50-Passenger Size Advanced Engine - Equivalent Power vsAltitude and Mach Number.
• 191
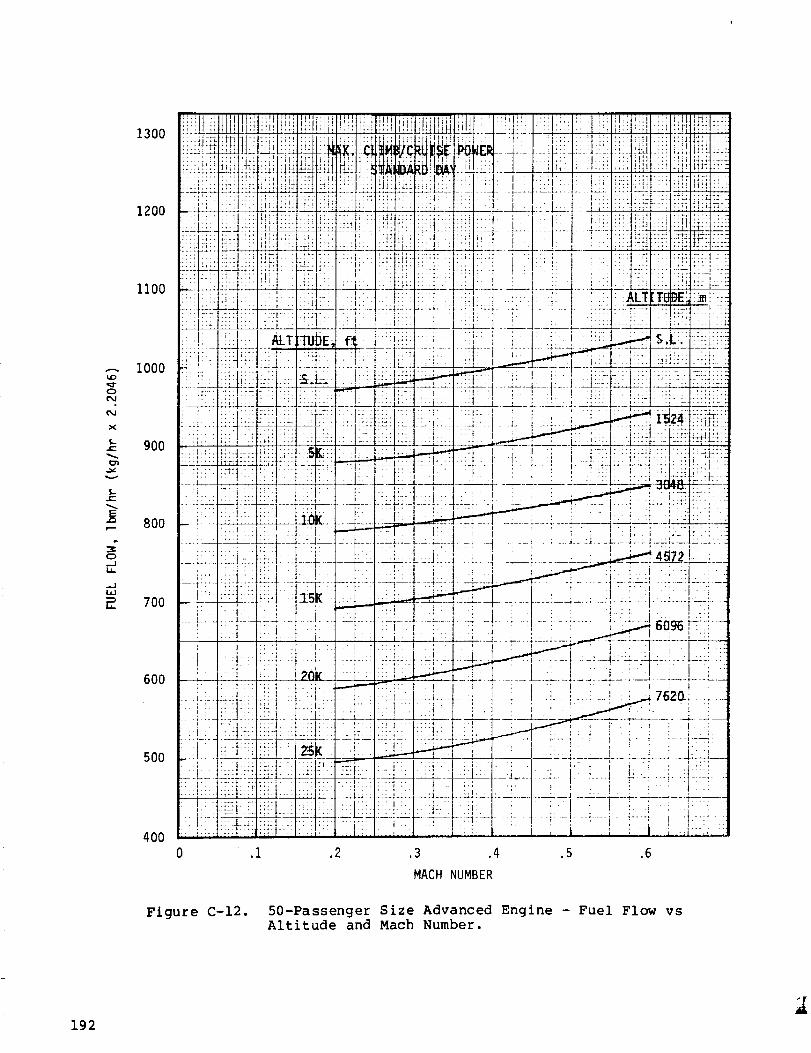
0
N
X
I.,.
f,,.¢,-
E
0
-J
...IL_
LI.
1300
1200
II00
I000
9OO
80O
70O
600
500
400
; U '] _[I_IlI[_[ i t ! =,!J i_ =,i _i-t i :_ = :!! ,I t' :: T _[: ; i i i ] tL _ ;i!
_:''_.fi_.,if_,.tr_ _,.i.i ii i ii_ i _:: i_ H:_I ; _ _,ij i.'. _._._-:t,_," :1-- :: :!i i: ,_ii .--':?.'-_A l_.m_.,,t , , tll T I' L _ ............... ' " I ...... _ _ m I '
;T;:_-T: -_ ,'; : -? .... -T: ,-_: ,-: " : .... ,.-- ._Ti ..... 7- ........... . ..... : --' _-T'_---_:
.......... [ .... = ........... _ ..... _- , ---' ................... .4---
1::;:1t eThEl ! i I ;i ; / t_::':Tii:-':];_.:.:],Liji'::;F] "::'t:.:. _ .::"'--: .t.:_..LL_l-7i.-: -:i.T .... -TT:--i-]:1 .......... .i T,TZ .. ,;;:, ?T_:iT:"
i:iii! .:[.i:l:.._
k_':. l=:., ..lili!t_.._|:,t-:=t. t.... :_!it,_-1 , 1_-._:-_1: :_-[- I-,.-,_:i :, .::h-:'.-;_:.::l::::l/ I '_.1.-..;-I..---_ i q i i j _:i !: ... 'r '1' ::_..:1; ", :.r
_.iLLt_l:i:] t t__Lt :_ l__i __.! ..... ___!_! :__:, '.:_ :., ;T: I . -' _ • ', " ; _ ; . ' : ' :-['---- :
.... ,---_-I--.-L_ ---_.....,---i "-_-:.-J- :-" -I-- ; ...... : -; ..... :-;: -j6""" _ ': _..... • 1 .; _i ..... : i ./ : ; I ' ', ; : " ' . U::_O! " ;
' _ " _ .' I ', . .: .I' ! ; , ' : , , ' 1 ; _ • .; -::
,. ' "! ,,:,,., : .-h::-:!|:}i_-"t--_: il .!. i ' , .; . ,: ':mL............ __
' t 1' '.I,..1::::t. I .:t; .I ' ',' 1.:_:I '1 :: . ! I --_ _-------_---.'r--[-; : I- -:
!_ii _ _ _ _ !....................... --"=---'-- j :.... _"i _ ....' .ii.....; ;
0 .I .2 .3 .4 .5 .6
MACH NUMBER
Figure C-12. 50-Passenger Size Advanced Engine - Fuel Flow vsAltitude and Mach Number.
192
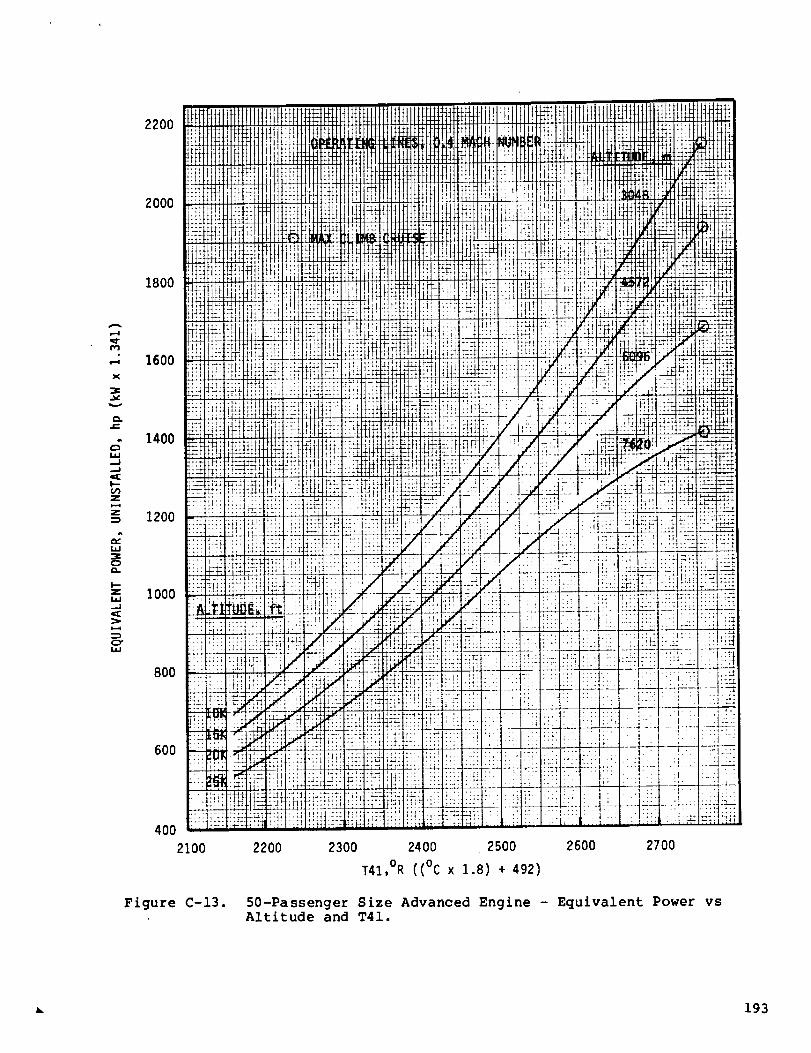
r-i
(,,.}
X
3
v
r-
di.i,.i..,.I._1
l,-t,/'}
la.i
I--zLI.I,.J
i-,i
hi
2200U!41+-
!If
2000 fii
1800 _.
1600 _"_!::1
,,.4
1400 __
1200 --.
2G
::2
lOOO _!'
ax2
800 ;"
600 "
400 '
2100
Figure C-Z3.
He
tft-T,;
II: r,_7i.
?t :1 t
:, H_-
T-:_:!
m+ ii i!!!_H
_.i _+...._: ;ii !
_'t TT ....
i;i :: ::
V:_ :i;!
;:: T-; ; ,:" :_ I:_
.i i /_
2200 2300
T41
-_+* itll"!!H ¢!tt. ,
rC_ii}t!tNIII.... ,,,,ll'i|l'_I_; .... IIII;
r!?_ }!11: ,,: r;,
_ +
............. !i
t' ';t:U,t!;
!!:i {i',{F!!{; ::ii
:t!t ]!il] )i;i
,t- ::], ,,- :
: /'i;i /
• • !,:j
,r:J : ._ •
: IT I+_: '; '
...... r .......
[.j[ 1_; ; ' ; ,i
f':L .... • ;-- I
tj i : ! ':
_;.] ii_; :1, _:.;[
fi2" 2Ji2 ±:/--_]
iili 21 I' "1 %--- ,
2500
x 1.8) + 492)
50-Passenger Size Advanced Engine -Altitude and T4Z.
!li!HilliIu I Ltt ;m Itl
'" '" H_
"* 4 y::
i 'r'l22&_ _ i
!i] i!i _.,?_Iti
_:i ',il :'.! i[!
_'! [;i iT;
:L,_ 1ii" ]::;
zd_; -C :_--
.2'..2::_ :1;
T- f'i ',IT::i:
7-; !_t ;'.T:]I
• " t ._o, _
ZL /"/:r_
: :T] :1 ;;
:; EL - i!q:;:: [: ";!H"
.'; ;; ,;: i.;.
It: .:;t.-:.ili:i
!i! !i :::[]ili
• " ; ...... i.
:T:--T" I : ":-r'l:-:-
_ .... t
":. -i--; I'.];, .; :' 1':'
_:: i:: iH_i!-
li_L ,1:'-4I
W,,,__,.iZ.._! _.- r __
....
.H11 ....... _ ....'.:.", , " : fv "--_---Z"
.......... L: L--- ---
NI [
.... _ .... 4
T:'; :2:_1 ql:[ :; ;:2_
_;: !::i;: : ::: ::it
_I-_ _4-. i ...L.t_
"" • I I ; " .'J:
! . .. ::;
!1 =! T :!1- --: +.r
• , i ....
........ -;;:_----.4.....
.......... t::
2600 2700
Ec]uivalent Power vs
• 193
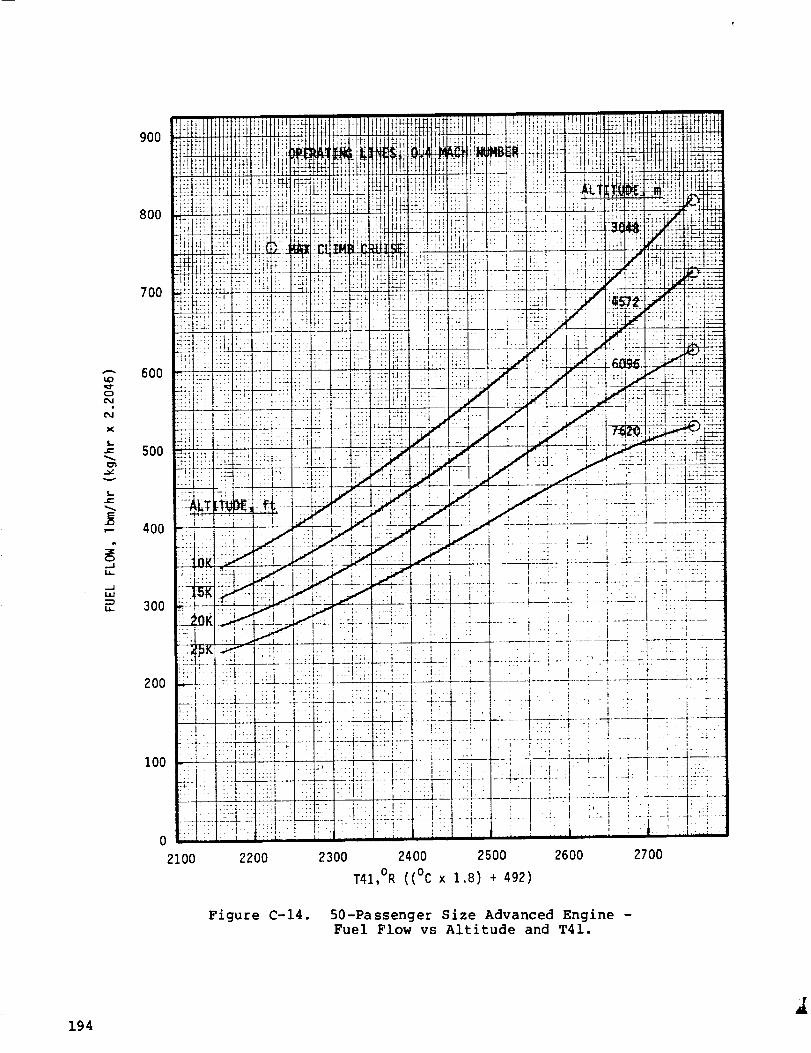
tO
0
¢,,,j
X
I,.
o...IIJ-
,,.,J
900
800
7OO
6O0
5OO
4OO
30O
2OO
100
0
2100
!!!;
H_
:H
u!
:i :
:i!!
=7
i i"
!
:!
:ii
S-
_lt i::" : ::':'.!:t;V_ ; _fllhl_'t_tlH,_t_.//,t.[1
t ....... 1 _ ' -,_-_ _,
:; : ;:_ _ ; .: ,..1;_ ,#I ..... +, .r..I ......
-- _ -t ......... _ _ _LLLL . _ .........
::.(. f ::-T
J __. ,- T_,'",... :,. ;:-'k-:•-: -i _:f_-:L=
il _____ • ........ "....• ___--f-_'. I. :.-:1:::_. :
.. / : : : ; :. _ .;" , ;
'' -/ ' t - I '' ; ......
_ .+-:: .... T.=:_._: .......
-l: i ' . , _ : :"i.,_F_.". : :..... - ---- _-........ _--- --'? t-"_ ....
• z '!- " --- , ......• --- - ! 11--:-!-i _--_' ! :: ' : _ ., : l '" '; ; x
I. :, i __._ ....... _!.. _;_ _..___., ___L_.-----;._-- _z
-: +-].... :.... _ .. -.-[ - .I -i I.:
" !:, :' :- .i..... ,............ ! ........... _ .. ......
_.- .: ¢_ ....._L " _ ........... :-_ ....'---T-:-_-
' ' ::4! ! t:i! iL::. !:: li_:_]-::.. _L..:-_:: ..i_.. .... t ........', I: i.: :/ ': ', • I i ] ' -I i
I _"
2200 2300 2400 2500 2600 2700
T41,°R ((°C x 1.8) + 492)
Figure C-14. S0-Passenger Size Advanced Engine -Fuel Flow vs Altitude and T41,
194
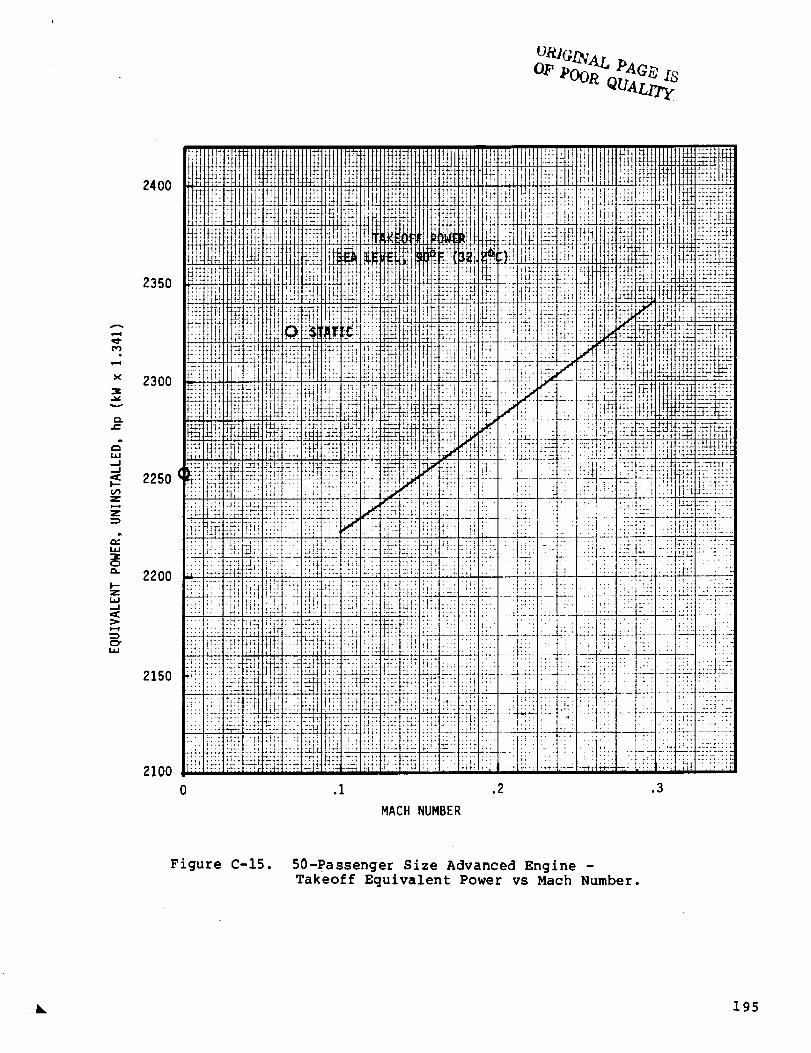
WUaL y
2400
2350
× 2300
m
W
< 2250
2200
Z
>
2150
2100
0 .I .2 .3
MACH NUMBER
Figure C-15. 50-Passenger Size Advanced Engine -Takeoff Equivalent Power vs Mach Number.
• 195
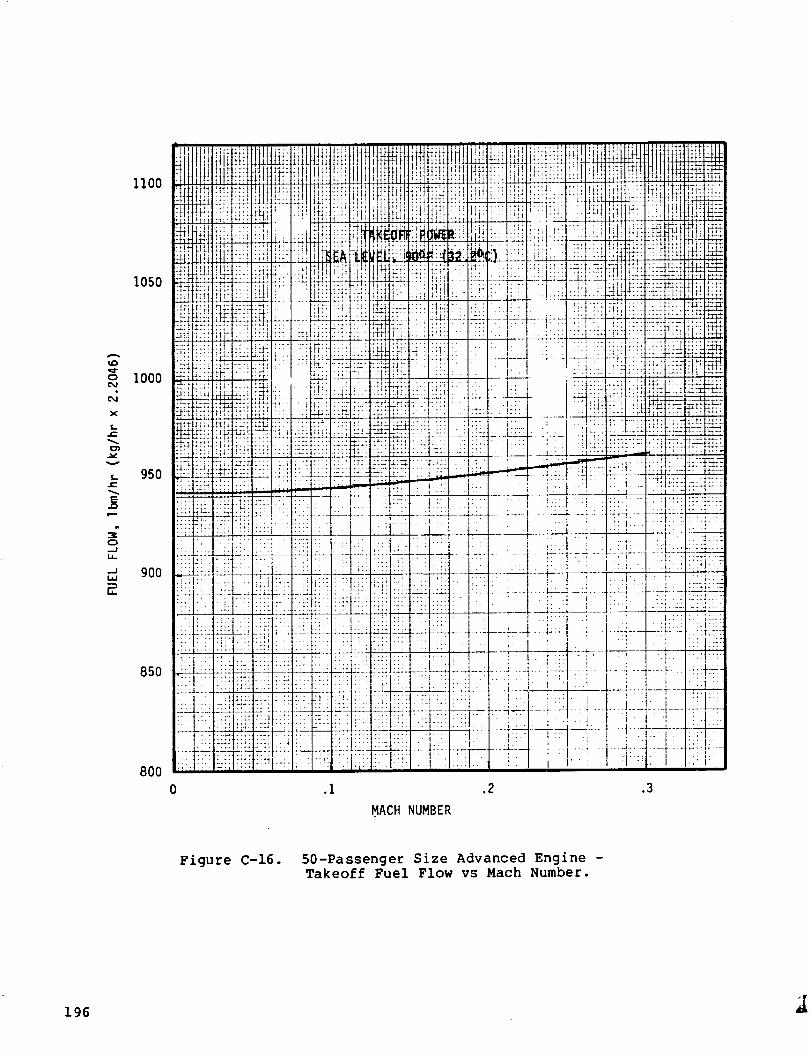
o
X
e-
LJ-
_J
llO0
1050
I000
950
900
850
8OO
!II}'_'*llM .....
i_ii' 'i i
!?,! L,i-ii;i !_i,"! +! }?I:
! 4:':
i ii:
I?_.!::!!:i: i,:z
:{-i ::
L2
L" "
I' '
'--2;I:!::;'!!!i
iiii:l!iiiiii!
-Y !__x*iil[]
_,!Hii?!':I
ili!! ::_:
;i4, .....
Yi :Fi!i i:]!
:i i_];;_ ; ::T
:_ii;'1: I ....
:::1_ ........_ ._LLL" z___
i:/I:;::: ,
;_!iL:
--1 p . .:
"iT!;. : :
'<:I::2 i_E:i;:l:::: : :i;; 1;',1::1 ?
::iiii";i 2:]
ti" ' .... .: ;
0 .I .2 .3
MACH NUMBER
Figure C-16. 50-Passenger Size Advanced Engine -Takeoff Fuel Flow vs Mach Number.
196

2700!
2600
25O0
X
3 2400
W
2300
Z
22000
ZW
2100
2000
1900
1800
-60
Figure C-17.
-40 -20 0 +20 +40 +60
Z_AMBIENT TEMPERATURE, OF (°C x 1.8)
50-Passenger Size Advanced Engine - Takeoff EquivalentPower vs Ambient Temperature.
• 197

X
i-z.-.
v
I,..
Ii
o-.iI.l.,.
,..IILl
1150
II00
1050
I000
-20 0 +20 +40
A AMBIENT TEMPERATURE, °F (°C x 1.8)
+60
Figure C-18. 50-Passenger Size Advanced Engine -Takeoff Fuel Flow vs Ambient Temperature.
198
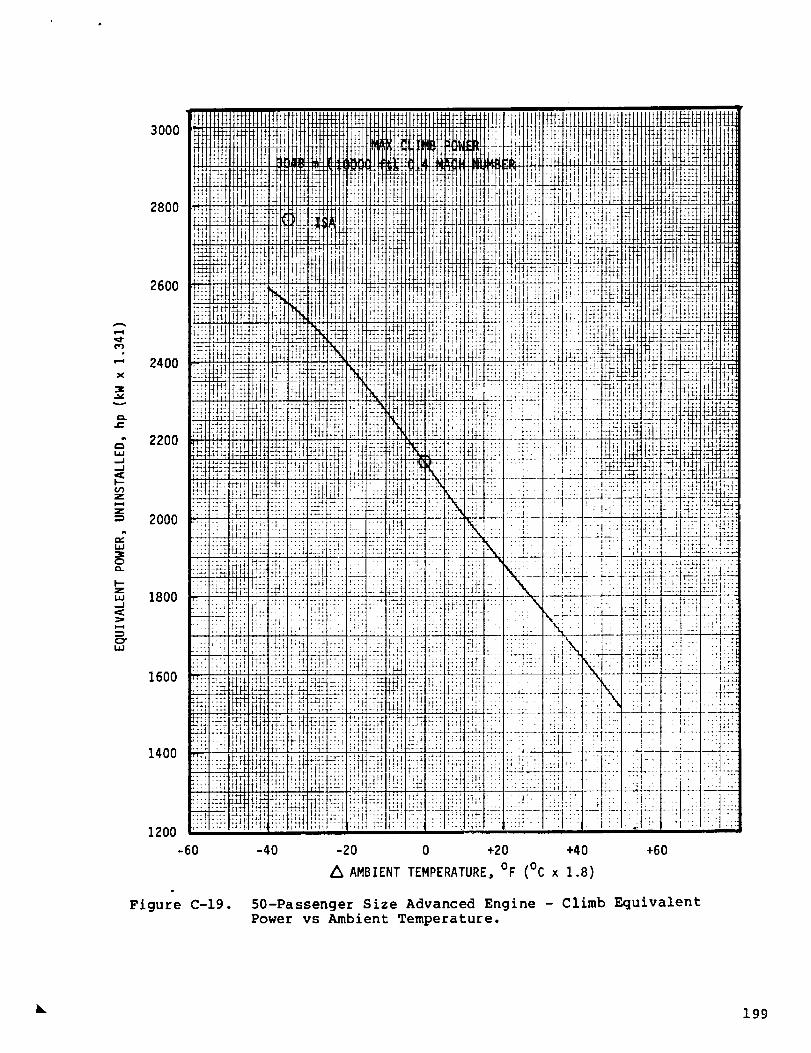
3OOO
2800
2600
2400X
3
2200
Z
Z= 2000
3O
Zw 1800
>
1600
1400
1200
-60
Figure C-19.
-40 -20 0 +20 +40 +60
Z_AMB!ENT TEMPERATURE, OF (°C x 1.8)
50-Passenger Size Advanced Engine - Climb Equivalent
Power vs Ambient Temperature.
• 199
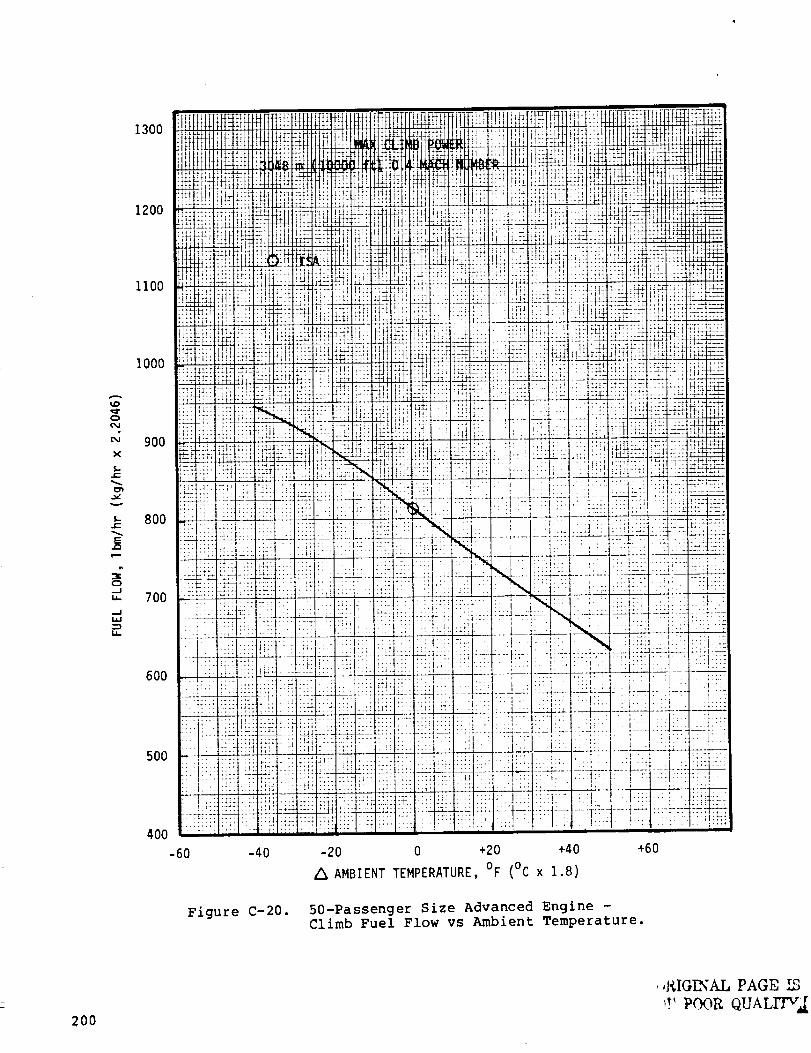
o
X
f,.,
,v-v
,f,,.e-
i,.i,.
.--1
1300
1200
ii00
1000
9O0
.2
800 _:
E::
:;
:
:i
700 -_
i
::
600 4:
Z
500 ':
:2
400 ,,
-60
'.i. c_t; _:**H
,,:::_iiii_iT.llX !4H
I¢ ....
!'. 11ti 41;: ;_,: :!t
:!!:<._:x_!4!!
..... C;!
:111iF_}=i:!i :::;: ::: ::. .:.
:::. :t:t ::x i.T4
_'LL "1"; 7"71 _f"
• : ;::: ". : i;: i_ ;L:L L:L: LL:
': ,;:: :::: ik!_: :i;: !'._i ::i' : '._.__:=::_ Lq
-4O
Figure C-20.
..... '..l-If 7,,_
,,_:t-_t,t. h, I+,.;_.t,m It_; .....
![! [!;]TT'l'! ?;' !:i, ::v _ r .......i t_tt_ 71!:I ........_L _!T_ ?;:i I:'&I-zL;_._,I.I;_L)t.+.* ,,, ,*,+
.., !t7'1 H! HI#,_
...it :; 4!:tl::::t::i; ;;;: ',tt< i_{!:t{
..... ;.=_t;!il _;;: i!_
i! }:'] ?';-Z :3
,. . - :x: -'.::_"::.!x:_ ::::: ::;; _i_¢__" _ ._:-:d-.-:-:-l_ X:'_" _':Z.
;11..... i i ;l::' vt: _ "_
• .! _---7-- ---7-'_--t , ......... t::" ;:" : ! : ] :i:t:.:ii: :: i } ;.ii: :;::t:-::
"4 : -- -'I:::.iy -- :_: ::-. ::.. _:-'l;:: t _ • : • .- . :1 :.:::'1
i;< 1 :::'tm "+ _ --- , .
:_L4____ .... ,.... . .2:. ........_7_:-;-<t "'l:::: ........ • :71-'...... :-':,'_ -..... .:.• '' :, • .,.. ::: :!:. :: ....
::2i:: AL__ :: ":.... x::l :j . l: ,::• .= ..... _,.............
, ,'::",,;: : .:I,.. _11 I'T ]: :: ' " :: :
.: _,+_:.. _L___:.:L : :__.-:: : :t l" :,:'1 .: I: . ' "' ; ........ ::.
d, :i " 1 :- ': :- ..... ' ' . : ;';',
..... _I]: ' ....
::,: :.: i::: ::i <::F:: :-TF-::::iTl?:!il
0 +20 +40 +60
Z_AMBIENT TEMPERATURE, OF (°C x 1.8)
50-Passenger Size Advanced Engine -Climb Fuel Flow vs Ambient Temperature.
4i i;;_++.-_
)-g-
_22X2:i: =X
:t. _
_!:::X!"- ;.iT"
Ll< i .":i
!_i:[:i
N. :
:x .u_;:1 ::_r:l ::T
2__j .4:-171 .11:
:::::::
"TI--
1:] ::::
:j:i.
i]I:=:
200
, ,I{IGINAL PAGE
,P POOR QUALITY i
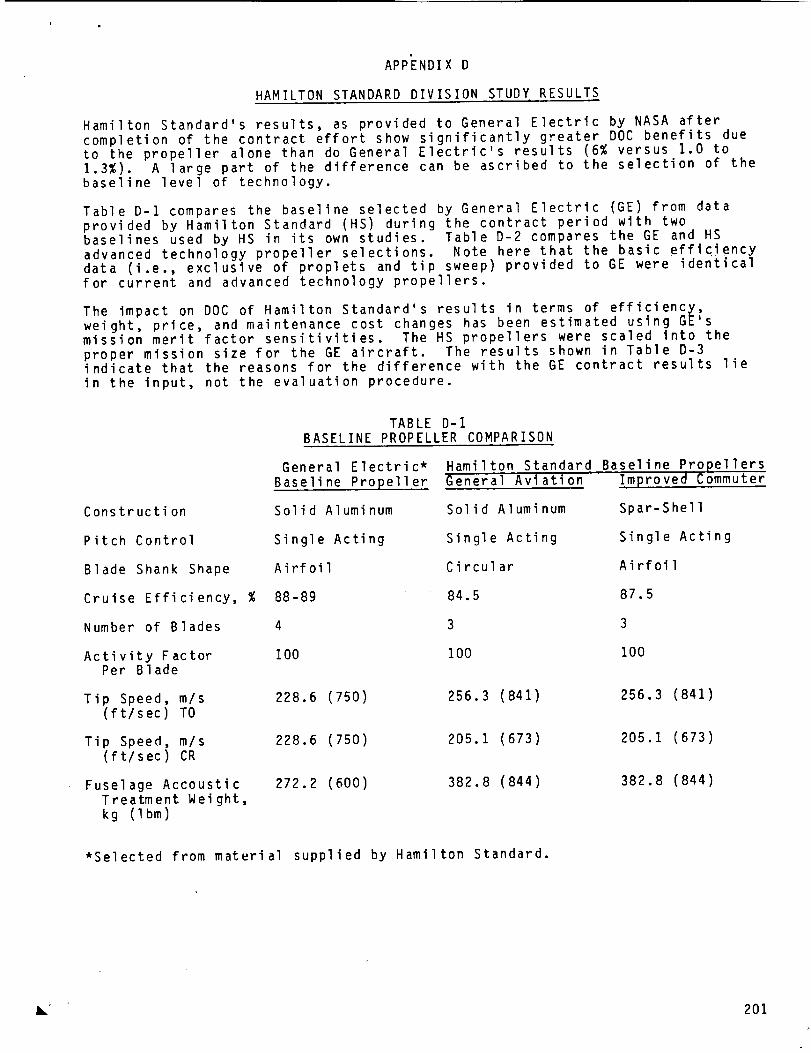
APPENDIX D
HAMILTON STANDARD DIVISION STUDY RESULTS
Hamilton Standard's results, as provided to General Electric by NASA after
completion of the contract effort show significantly greater DOC benefits dueto the propeller alone than do General Electric's results (6% versus 1.0 to1.3%). A large part of the difference can be ascribed to the selection of thebaseline level of technology.
Table D-1 compares the baseline selected by General Electric (GE) from dataprovided by Hamilton Standard (HS) during the contract period with twobaselines used by HS in its own studies. Table D-2 compares the GE and HSadvanced technology propeller selections. Note here that the basic efficiencydata (i.e., exclusive of proplets and tip sweep) provided to GE were identicalfor current and advanced technology propellers.
The impact on DOC of Hamilton Standard's results in terms of efficiency,weight, price, and maintenance cost changes has been estimated using GE'smission merit factor sensitivities. The HS propellers were scaled into the
proper mission size for the GE aircraft. The results shown in Table D-3indicate that the reasons for the difference with the GE contract results lie
in the input, not the evaluation procedure.
Constructi on
Pitch Control
Blade Shank Shape
Cruise Efficiency, %
Number of Blades
Activity FactorPer Blade
Tip Speed, m/s(ft/sec) TO
Tip Speed, m/s(ft/sec) CR
Fuselage AccousticTreatment Weight,kg (Ibm)
TABLE D-1BASELINE PROPELLER COMPARISON
General Electric*
Baseline Propeller
Hamilton Standard Baseline PropellersGeneral Aviation Improved Commuter
Solid Aluminum Solid Aluminum Spar-Shell
Single Acting Single Acting Single Acting
Airfoil Circul ar Airfoil
88-89 84.5 87.5
4 3 3
100 100 100
228.6 (750) 256.3 (841) 256.3 (841)
228.6 (750) 205.1 (673) 205.1 (673)
272.2 (600) 382.8 (844) 382.8 (844)
*Selected from material supplied by Hamilton Standard.
i_; 201
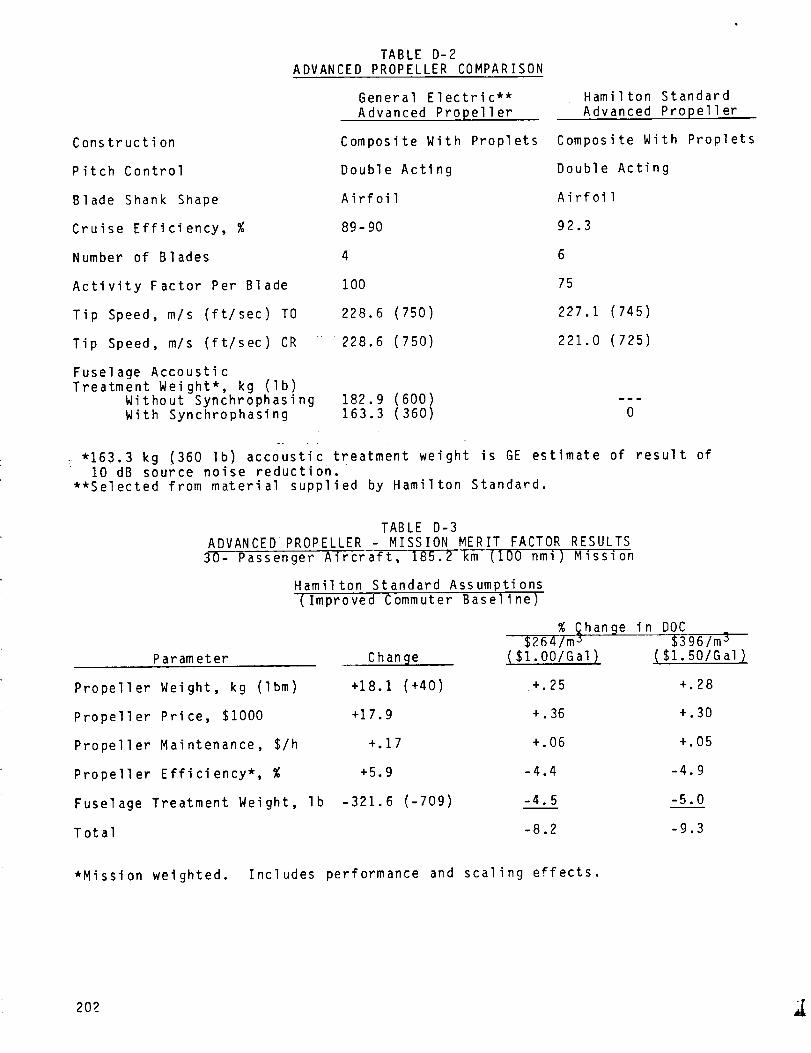
TABLED-2ADVANCED PROPELLER COMPARISON
Constructi on
Pitch Control
General Electric**
Advanced Propeller
Composite With Proplets
Double Acting
Hamilton Standard
Advanced Propeller
Composite With Proplets
Double Acting
Blade Shank Shape Airfoil Airfoil
Cruise Efficiency, % 89-90 92.3
Number of Blades 4 6
Activity Factor Per Blade 100
Tip Speed, m/s (ft/sec) TO 228.6 (750)
Tip Speed, m/s (ft/sec) CR 228.6 (750)
75
227.1
221.0
(745)
(725)
Fuselage AccousticTreatment Weight*, kg (Ib)
Without Synchrophasing 182.9 (600)With Synchrophasing 163.3 (360)
w----
0
"163.3 kg (360 Ib) accoustic treatment weight is GE estimatei0 dB source noise reduction.'
**Selected from material supplied by Hamilton Standard.
of result of
TAB LE D- 3
ADVANCED PROPELLER - MISSION MERIT FACTOR_0- Passenger Aircraft, 185.2 km (100 nmi)
Hamilton Standard Assumptions(Improved Commuter Baseline)
Parameter Chan ge
Propeller Weight, kg (Ibm) +18.1 (+40)
Propeller Price, $1000 +17.9
Propeller Maintenance, $/h +.17
Propeller Efficiency*, % +5.9
Fuselage Treatment Weight, Ib -321.6 (-709)
Total
RESULTSMission
% _hange in DOC$264/m j $396/m 3
($1.00/Gal) ($1.50/Gal)
+.25 +.28
+.36 +.30
+.06 +.05
-4.4 -4.9
-4.5 -5.0
-8.2 -9.3
*Mission weighted. Includes performance and scaling effects.
202
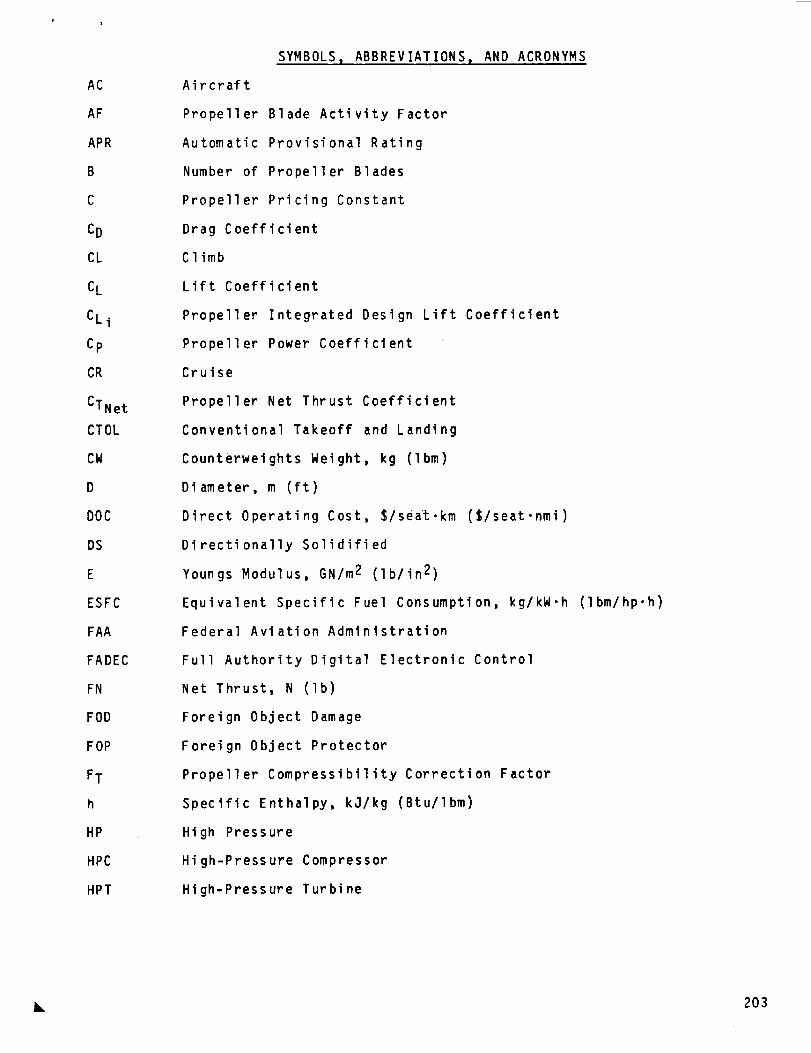
AC
AF
APR
B
C
CD
CL
CL
CLi
Cp
CR
CTNet
CTOL
CW
D
DOC
DS
E
ESFC
FAA
FADEC
FN
FOD
FOP
FT
h
HP
HPC
HPT
SYMBOLSI ABBREVIATIONSt
Aircraft
Propel I er
Automatic
Number of
Propeller Pricing
Drag Coefficient
Climb
Lift Coefficient
Propeller Integrated Design Lift
Propeller Power Coefficient
Cruise
Propeller Net Thrust Coefficient
Conventional Takeoff and Landing
Counterweights Weight, kg (Ibm)
Diameter, m (ft)
Direct Operating Cost, $/seat.km
Blade Activity Factor
Provisional Rating
Propeller Blades
Constant
AND ACRONYMS
Coefficient
(S/seat .nmi )
Di recti onally Solidified
Youngs Modulus, GN/m 2 (Ib/in 2)
Equivalent Specific Fuel Consumption,
Federal Aviation Administration
Full Authority Digital Electronic
Net Thrust, N (Ib)
Foreign Object Damage
Foreign Object Protector
Propeller Compressibility Correction
Specific Enthalpy, kJ/kg (Btu/Ibm)
High Pressure
High-Pressure Compressor
High-Pressure Turbine
kg/kW-h (lbm/hp.h)
Control
Factor
• 203
ID
IGV
IPS
IRP
J
KW
L
LP
LPC
LPT
M
m
M3
ODS
OEI
OEM
P
P3
P8
PAMB
PAX
P/P
PR
QCSEE
RV
SFC
SLS
STAT
T
T3
SYMBOLS_ ABBREVIATIONS_ AND
Idle
Inlet Guide Vane(s)
Inlet Particle Separator
Intermediate Rated Power
Propeller Advance Ratio
Propeller Weight Constant
Length, m (ft)
Low Pressure
Low-Pressure Compressor
Low-Pressure Turbine
Mach number
Mass Flow Rate, kg/s (Ibm/sec)
Compressor Discharge Mach number
Oxide Dispersion Strengthened
One Engine Inoperative
Original Equipment Manufacturer
Pressure, kn/m 2 (Ib/in 2)
Compressor Discharge Pressure
Exhaust Nozzle Discharge Pressure
Ambient Pressure
Passengers
Pressure Ratio
Price, $
Quiet, Clean, Short-Haul Experimental
Relative Value
Specific Fuel Consumption, kg/kW.h
Sea Level, Static
Small Transport Aircraft Technology
Temperature, °C (°F)
Compressor Discharge Temperature
ACRONYMS - CONTINUED
Engine
(Ibm/hp.h)
204
T41
TAF
TAMB
TBO
TO
TOGW
TSFC
T/W
Up
Vo
vj
W
W2
WA
WF
W/S
Z
A
0
O
U/
SYMBOLS, ABBREVIATIONS, AND ACRONYMS -CONTINUED
HP Turbine Rotor Inlet Temperature, °C (°F)
Total Activity Factor, AF*B
Ambient Temperature
Time Between Overhauls, h
Takeoff
Takeoff Gross Weight, kg (Ibm)
Thrust Specific Fuel Consumption, kg/N-h (Ibm/Ibf.h)
Engine Thrust/Aircraft Weight, N/kg (Ib/Ibm)
Pitch Line Wheel Speed, m/s (ft/sec)
Flight Velocity, m/s (ft/sec)
Exhaust Jet Velocity, m/s (ft/sec)
Weight or Airflow, kg (Ibm) or kg/s (Ibm/sec)
Compressor Inlet Airflow, g/s (Ibm/sec)
Airflow, kg/s (Ibm/sec)
Engine Fuel Flow or Mission Fuel Burned, kg/h, (Ibm/h) o._r.rkg (Ibm)
Wing Loading; Aircraft Weight/Wing Area, N/m 2 (Ibm/ft 2)
Propeller Price Learning Curve Factor
Difference, Change
P (Ib/in2)/14.696
Effi ciency
T (°F)/518.67
Density, kg/m 3 (Ibm/ft 3)
Turbine Loading : 2l]-ppE
\
2O5
\
\
//
Jt
/Z
//
2O6 4,