proposed tubidity guidelines for kusile power station2.ppt
TRANSCRIPT

2012/03/19
1
Public Meeting – 13 March 2012Wilge River Turbidity Guidelines
S&I Slogan: "Support, Lead and Innovate"
Welcome and Introduction
Eskom• Siphiwe Mahlangu
• Kaajial Durgapersad
• Mushayi Mudzielwana
• Michael Michael
Zitholele Consulting (public participation):
• André Joubert
• Pat Mnqokoyi
S&I Slogan: "Support, Lead and Innovate"
2012/03/19
2
Agenda
• Background to the Project
• Turbidity Guidelines
3.1 What is turbidity?
3.2 How do you measure turbidity?
3.3 Existing Kusile Water Use License
3.4 Development of the turbidity guidelines
3.5 Proposed turbidity guidelines
3.6 Mitigation Measures
• Discussion
• Next Step/Way Forward
• General
• Closure
S&I Slogan: "Support, Lead and Innovate"
Objectives of the Meeting
• Present information regarding the development of Turbidity Guidelines for the Wilge River during the construction and operation of the Kusile Power Station
• Obtain comments and inputs from stakeholders on these Turbidity Guidelines
S&I Slogan: "Support, Lead and Innovate"

2012/03/19
3
Guidelines for Productive Discussion
• One person at a time
• Work through facilitator
• Agree to disagree
• Cell phones on silent
S&I Slogan: "Support, Lead and Innovate"
Proposed Turbidity Guidelines for Kusile Power Station
Public Participation Meeting – Bronkhorspruit
13 March 2012
Kaajial Durgapersad & Michael Michael
Research, Testing and Development
Sustainability Division

2012/03/19
4
Background
• The Eskom Kusile Power Station construction site is situated, approximately 35km west of Emalahleni (formerly known as Witbank), in the Mpumalanga Province
• DWA – Integrated Water Resource Management Plan for the Upper and Middle Olifants Catchment – July 2009
• This however does not include Turbidity water quality objectives in the Wilge catchment of the Olifants WMA (E-mail 7 June 2011. Trevor Coleman – GolderAssociates)
• DWA Bronkhortspruit – Stanford Macevele consulted
• Because of the absence of Turbidity standards in this catchment it is the aim of this study to propose turbidity guidelines that:
• propose guidelines for Wilge catchment
• will not significantly impact the Wilge River and,
• can be used as a management tool during the construction and operational phases of Kusile Power Station
S&I Slogan: "Support, Lead and Innovate"
Turbidity
• Turbidity occurs as a result of ‘suspensoids’ in the water column. Thissuspended matter, which may include clay, silt, dissolved organic andinorganic matter, plankton and other microscopic organisms, causes thewater to appear turbid (Davies and Day, 1998)
• This causes light to be scattered and absorbed rather than transmitted instraight lines through a water sample and may:
• reduce light penetration,
• smother habitat,
• interfere with the feeding mechanisms of filter-feeding organisms suchas certain macroinvertebrates and,
• reduce visibility, thus leading to a reduction in biodiversity and asystem which is dominated by a few tolerant species (Davies and Day,1998).
• It is measured via turbidity-meter in nephelometric turbidity units (NTU) orsecchi disk in metres
S&I Slogan: "Support, Lead and Innovate"
2012/03/19
5
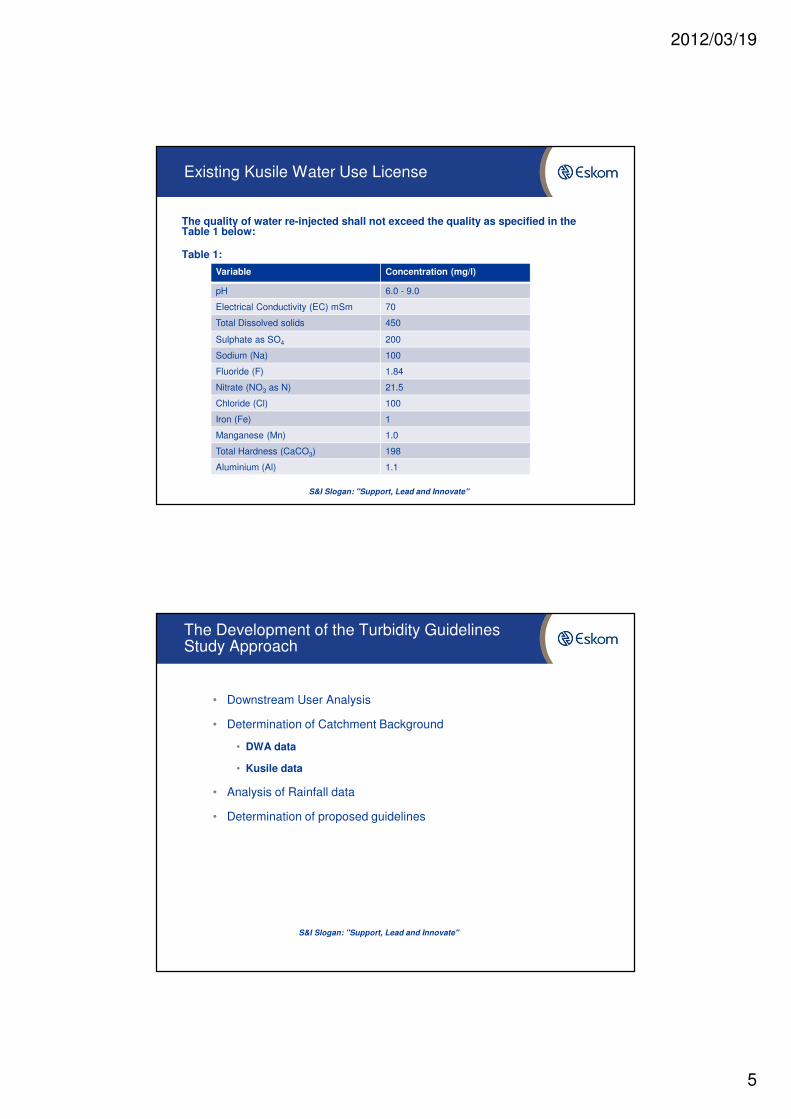
Existing Kusile Water Use License
The quality of water re-injected shall not exceed the quality as specified in the Table 1 below:
Table 1:
S&I Slogan: "Support, Lead and Innovate"
Variable Concentration (mg/l)
pH 6.0 - 9.0
Electrical Conductivity (EC) mSm 70
Total Dissolved solids 450
Sulphate as SO4 200
Sodium (Na) 100
Fluoride (F) 1.84
Nitrate (NO3 as N) 21.5
Chloride (Cl) 100
Iron (Fe) 1
Manganese (Mn) 1.0
Total Hardness (CaCO3) 198
Aluminium (Al) 1.1
The Development of the Turbidity GuidelinesStudy Approach
• Downstream User Analysis
• Determination of Catchment Background
• DWA data
• Kusile data
• Analysis of Rainfall data
• Determination of proposed guidelines
S&I Slogan: "Support, Lead and Innovate"

2012/03/19
6
Olifants Water Management Area
S&I Slogan: "Support, Lead and Innovate"
Downstream User Analysis
S&I Slogan: "Support, Lead and Innovate"
2012/03/19
7
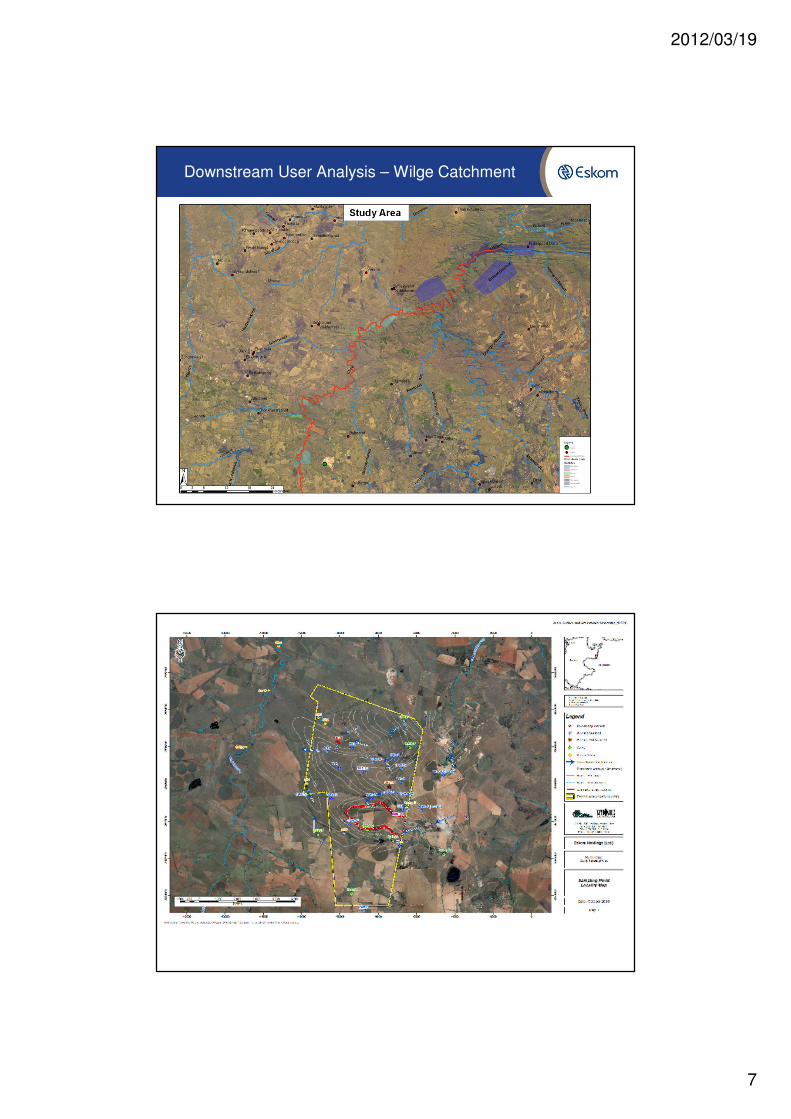
Downstream User Analysis – Wilge Catchment
S&I Slogan: "Support, Lead and Innovate"
Catchment Background Study
S&I Slogan: "Support, Lead and Innovate"

2012/03/19
8
Downstream User Analysis
Table 2: Water Quality Guidelines for Turbidity for the different water users (Integrated Water Resource Management Plan for the Upper and Middle Olifants Catchment – July 2009)
• Main water uses are Agriculture Irrigation and Livestock Watering
• Majority of farmers use borehole water
• These standards is not adequate for the purpose
S&I Slogan: "Support, Lead and Innovate"
Water Use Turbidity (NTU)
Domestic Ideal – Formal Use 0.1
Domestic Acceptable – Informal Use 1.0
Recreational Water Use No available standards
Industrial Water Use watering 0.0
Aquatic Ecosystems/ Aquaculture No available standards
Agricultural Use: Irrigation No available standards
Agricultural Use: Livestock No available standards
Catchment Background Study
S&I Slogan: "Support, Lead and Innovate"

2012/03/19
9
DWA sample points
DWA Sample Point
Latitude LongitudeMonitoring
ActiveSample
Start DateSample End
DateN Min Max Mean
90443 -25.887500 28.725000 No 2005/08/29 2011/06/06 135 0.5 792 7.7
88671 -25.8361 29.21528 No 1997/11/13 1999/04/01 2 0.5 3.13 1.8
88819 -25.7675 29.12167 No 1997/09/13 1999/04/01 2 0.5 1.63 1.1
90408 -25.6733 29.17111 Yes 1997/11/13 1997/11/13 1 2.2 2.2 2.2
90409 -25.6792 29.16861 No 1999/04/01 1999/04/01 1 0.5 0.5 0.5
90430 -25.8217 29.20611 Yes 2002/06/07 2011/01/18 170 0.5 123 5.4
90458 -24.9253 29.32444 Yes 1994/01/20 2011/02/17 321 0.5 262 9.2
90466 -25.0983 28.9177 Yes 2004/07/19 2010/12/23 93 0.5 56.2 6.3
185084 -25.7682 29.121 Yes 2002/06/07 2006/02/07 37 0.5 41.5 5.6
185085 -25.8571 29.1353 Yes 2002/06/07 2006/02/07 34 0.5 91.6 7.7
90431 -25.8917 29.30417 No 2005/09/07 2009/02/11 4 4.37 10.5 7.3
90462 -25.4183 29.3599 Yes 2004/10/15 2010/12/09 108 0.5 341 6.4
S&I Slogan: "Support, Lead and Innovate"
Table 3: DWA Data
Kusile sample points (Un-impacted Sites)
KusileSample
Point Latitude Longitude
Monitoring
Active
Sample
Start Date
Sample End
Date N Min Max Mean
Spring 1 -25.90230 28.93680 Yes 2009/10/01 2011/03/23 18 5.3 68.9 16
Spring 2 -25.88930 28.93372 Yes 2009/10/01 2011/03/23 17 0.38 33.7 4
Spring 3 -25.97322 28.90632 Yes 2009/10/01 2011/03/23 17 0.7 99.4 17
Spring 4 -25.94449 28.88893 Yes 2009/10/01 2011/03/23 17 0.15 79.4 8
Spring 6 -25.94760 28.92797 Yes 2009/10/01 2011/03/23 18 1.46 18.4 6
Spring 10 -25.95428 28.95462 No 2009/10/01 2010/10/19 6 0.31 19 6
Spring 11 -25.93110 28.93460 No 2009/10/01 2010/10/22 15 0.78 153 34
Spring 12 -25.94236 28.91466 Yes 2009/10/01 2011/03/23 18 5.17 56 19
SW16 -25.90237 28.85132 Yes 2010/05/27 2011/03/23 11 4.19 53.3 12
Table 4: Kusile Data
S&I Slogan: "Support, Lead and Innovate"

2012/03/19
10
Turbidity Percentiles based on the data above
S&I Slogan: "Support, Lead and Innovate"
Percentiles B1 (Klip) B2 (Wilge) Upper Olifants
25 0.50 0.72 0.50
50 2.00 2.39 2.04
75 6.00 6.94 6.32
95 26.19 31.11 27.51
Table 5: Kusile Data
Current Status at Kusile (Inflow)
S&I Slogan: "Support, Lead and Innovate"
Turbidity (Inflow)
020406080
100120140160
2009
/10
/01
2009
/11
/01
2009
/12
/01
2010
/01
/01
2010
/02
/01
2010
/03
/01
2010
/04
/01
2010
/05
/01
2010
/06
/01
2010
/07
/01
2010
/08
/01
2010
/09
/01
2010
/10
/01
2010
/11
/01
2010
/12
/01
2011
/01
/01
2011
/02
/01
2011
/03
/01
Turb
idity
(N
TU
)
Spring 1 Spring 2 Spring 3 Spring 4 Spring 6 Spring 10 Spring 11 Spring 12

2012/03/19
11
Rainfall Impacts on Turbidity
S&I Slogan: "Support, Lead and Innovate"
Turbidity (Inflow)
0
10
20
30
40
50
60
70
80
09/1
0/0
1
09/1
1/0
1
09/1
2/0
1
10/0
1/0
1
10/0
2/0
1
10/0
3/0
1
10/0
4/0
1
10/0
5/0
1
10/0
6/0
1
10/0
7/0
1
10/0
8/0
1
10/0
9/0
1
10/1
0/0
1
10/1
1/0
1
10/1
2/0
1
11/0
1/0
1
11/0
2/0
1
11/0
3/0
1
Turb
idity
(N
TU
)
Spring 1 Spring 2 Spring 3 Spring 4 Spring 6 Spring 10 Spring 11 Spring 12
Rainfall Data at Kusile PS
0.00
10.00
20.00
30.00
40.00
50.00
60.00
70.00
80.00
2008-1
1-0
9
2009-0
1-0
9
2009-0
3-0
9
2009-0
5-0
9
2009-0
7-0
9
2009-0
9-0
9
2009-1
1-0
9
2010-0
1-0
9
2010-0
3-0
9
2010-0
5-0
9
2010-0
7-0
9
2010-0
9-0
9
2010-1
1-0
9
2011-0
1-0
9
Date
Total R
ainfall (m
m)
Total rainfall (mm)
Actual Turbidity Percentiles
Table 6: Kusile Data – From 2008 till June 2011
S&I Slogan: "Support, Lead and Innovate"
PercentilesKusile
Inflow
Wilge River
SW16 SW17 SW2
25 1.96 4.59 6.74 9.60
50 6.80 6.73 12.40 25.10
75 15.05 13.15 23.20 61.15
95 53.70 34.45 78.45 201.40

2012/03/19
12
EPA – Turibidity Limit during Construction
EPA - Numeric turbidity Limit for Construction - 280 NTU, that was published in the December 1, 2009, Construction and Development effluent Limitation Guideline
EPA Contact:
Greg Schaner
Attorney Adviser, Permits Division
Office of Wastewater Management
Phone: (202) 564-0721
Fax: (202) 564-6431
S&I Slogan: "Support, Lead and Innovate"
Proposed Turbidity Guidelines
Based on the limited information in this study, the following turbidity guidelines are proposed for Kusile Power Station:
Table 7: Construction Phase
Operational Phase Turbidity (NTU)
Ideal - Catchment Background 2.16
Acceptable - Management Target 7.49
Tolerable - Interim Target 16.56
Maximum allowable level 59.07
Construction PhaseTurbidity (NTU)
Ideal - Catchment Background 9.81
Acceptable - Management Target 34.03
Tolerable - Interim Target 75.25
Maximum allowable level 268.50
Table 8: Operational Phase
S&I Slogan: "Support, Lead and Innovate"

2012/03/19
13
Catchment Background Study
S&I Slogan: "Support, Lead and Innovate"
Mitigation Measures
• Silt curtains have been put into place
• Permanent roads frequently used have been tarred.
• Grass – planting (a mixture of spp) has been used as an economically viable method to reduce the dust on the construction site. To create a natural long-lasting environment. Erosion blankets have been placed on steep slopes (Shirley)
• Gabions in the erosion control channels – full time maintenance contract has been placed (MRMS)
• Parking area completed - tarred
S&I Slogan: "Support, Lead and Innovate"

2012/03/19
14
Conclusion
• These proposed turbidity guidelines are a proactive initiative by Eskom to ensure that a balance is sought between the need to protect and sustain water resources on one hand and the need to develop and use them on the other
• The proposed turbidity guidelines were compiled so as to afford maximum protection to the water resources for all its intended uses and for the measurement of progressive improvement through the system of tiers, in order to maintain the long-term integrity of the water quality in the Wilge catchment of the Olifants WMA
• Due to limited amount of background data, it is recommended that the guidelines be revised at a later date
S&I Slogan: "Support, Lead and Innovate"
Discussion
2012/03/19
15
Way forward
General

2012/03/19
16
Thank you