proposed seismic hazard maps of sumatra and java islands
TRANSCRIPT

Proposed seismic hazard maps of Sumatra and Javaislands and microzonation study of Jakarta city, Indonesia
Masyhur Irsyam1, Donny T Dangkua
1, Hendriyawan1, Drajat Hoedajanto
2,Bigman M Hutapea
3, Engkon K Kertapati4, Teddy Boen
5 and Mark D Petersen6
1Faculty of Civil and Environmental Engineering, Institut Teknologi Bandung,Jl. Ganesha 10 Bandung, West Java.
2Indonesian Society of Civil and Structural Engineers (HAKI),Jl. Tebet Barat Dalam X No. 5, Jakarta 12810, Indonesia.
3Indonesian Society for Geotechnical Engineering (HATTI),Jl. Warung Jati Barat Raya No. 75, Jakarta 12740, Indonesia.
4Geology Research and Development Centre, Jl. Diponegoro 57, Bandung, West Java.5World Seismic Safety Initiative (WSSI), Prisma Kedoya Plaza C 7/C 8,
Jl. Raya Perjuangan Kebun Jeruk, Jakarta 11530, Indonesia.6U.S. Geological Survey USGS-MS966, Box 25046, Denver, CO 80225, USA.
This paper presents the development of spectral hazard maps for Sumatra and Java islands,Indonesia and microzonation study for Jakarta city. The purpose of this study is to propose arevision of the seismic hazard map in Indonesian Seismic Code SNI 03-1726-2002. Some improve-ments in seismic hazard analysis were implemented in the analysis by considering the recent seismicactivities around Java and Sumatra. The seismic hazard analysis was carried out using 3-dimension(3-D) seismic source models (fault source model) using the latest research works regarding the tec-tonic setting of Sumatra and Java. Two hazard levels were analysed for representing 10% and 2%probability of exceedance (PE) in 50 years ground motions for Sumatra and Java. Peak groundacceleration contour maps for those two hazard levels and two additional macrozonation mapsfor 10% PE in 50 years were produced during this research. These two additional maps rep-resent short period (0.2 s) and long-period (1.0 s) spectra values at the bedrock. Microzonationstudy is performed in order to obtain ground motion parameters such as acceleration, amplifica-tion factor and response spectra at the surface of Jakarta. The analyses were carried out usingnonlinear approach. The results were used to develop contour of acceleration at the surface ofJakarta. Finally, the design response spectra for structural design purposes are proposed in thisstudy.
1. Introduction
Indonesia has been well known as one of the mostseismically active countries in the world. This isdue to its location – it is surrounded by threemajor active tectonic plates of the earth: Eurasian,Indo-Australian, and Philippine plates. Therefore,the construction design in Indonesia should con-sider these seismic activities. The most effective
way to reduce disasters caused by earthquakes isto estimate the seismic hazard and to implementthis information on a seismic code for use in buil-ding design and construction so that the structurespossess adequate earthquake resistant capacity (Hu1996).
This paper presents the latest research worksregarding macrozonation study for Sumatra andJava islands, Indonesia. The purpose of this study
Keywords. Seismic hazard assessment; total probability theorem; macrozonation study; microzonation study.
J. Earth Syst. Sci. 117, S2, November 2008, pp. 865–878© Printed in India. 865
866 Masyhur Irsyam et al
is to propose a revision of the seismic hazard mapin Indonesian Seismic Code SNI 03-1726-2002. Thestudy covers the development of spectral hazardmaps of Sumatra and Java islands and microzona-tion study for assessing the effects of local soil con-ditions of Jakarta city to the ground motion at thebedrock.
Sumatra and Java islands were selected forthis research because most of the population,infrastructure and structure facilities are concen-trated in these two islands. Whereas, Jakarta cityis selected because this city is the main businessand administration centre of Indonesia; hence, ithas significant numbers of settlements, high-risebuildings, monumental structures and other criti-cal facilities. Therefore, the risks of this city arerelatively higher than other cities in Indonesia.
2. Background research
Currently, Indonesia has implemented the Indone-sian seismic hazard map into a standard code indesigning earthquake resistance structures (SNI03-1726-2002) as shown in figure 1. The seismichazard map shows the peak ground acceleration(PGA) contours at bedrock for 10% probability ofexceedance (PE) in design time period of 50 yearsor corresponding to return period of approximately475 years.
Since the seismic hazard map was published inSNI 03-1726-2002, there are several issues thatneed to be considered in seismic hazard analysis inorder to obtain more reliable results. Issues, suchas the recent seismic activities, the latest researchworks regarding fault characteristics around Javaand Sumatra, the improvements of the method inseismic hazard analysis, and the latest provisionsin International Building Code 2000 (IBC 2000)should be considered for the future IndonesianSeismic Code.
Several great earthquake occurrences inIndonesia in the last two years necessitate revisionof seismic hazard parameters. Some of the greatearthquakes are the 2004 Aceh Earthquake (Mw
9.0–9.3) which was followed by tsunami, the 2005Nias Earthquake (Mw 8.7), and the 2006 JogyaEarthquake (Mw 6.3). These earthquake eventsmust be considered while determining seismichazard parameters especially maximum credibleearthquake magnitude (MCE).
There are two basic approaches used to modelgeometries of seismic sources in hazard analy-ses: an area and a fault source. The previousIndonesian seismic hazard map was developedusing area sources model. This 2-dimension (2-D)model has some limitations in modelling the faultsource geometries. The fault source model or
3-dimension (3-D) model could improve the mode-lling of seismic sources significantly. This modelcan represent the geometry of fault source morereliably than the 2-D model. Therefore, this modelshould be considered for future Indonesian seismichazard maps.
The recent research works regarding paleo-seismology of the Sumatran Subduction Zone(SSZ) and neotectonic of Sumatran Fault Zone(SFZ) conducted by Sieh and Natawidjaja (2000)and Natawidjaja (2002) showed the uniquecharacteristics of SSZ and the fault segmentationof SFZ. These research works also showed thatthe Sumatran fault is highly segmented. Theseresults could affect the seismic hazard assessmentespecially in modelling the seismic sources forSumatra. Therefore, the results of these seismotec-tonic conditions should be taken into account indeveloping new seismic hazard maps for Sumatraregion.
At this moment, most of seismic designs inIndonesia follow the International Building Code(IBC 2000). This code implements spectral hazardmaps for 2% PE in design time period of 50 years(2500 years return period of earthquakes). Themaps are based on spectral acceleration rather thanpeak ground acceleration (PGA), peak groundvelocity (PGV), or zone factors. Two spectral haz-ard maps are used in this provision: short period(0.2 s) and long-period (1.0 s). Since the existingIndonesian seismic hazard map is based on PGA atbedrock for 10% PE in 50 years (475 years returnperiod of earthquakes), the Indonesian spectralhazard maps for 2% PE in 50 years are necessarilyto be developed.
Geotechnical factors often exert a major influ-ence on damage patterns and loss of life in earth-quake events. In other countries, several attemptshave been made to identify their effects on earth-quake hazards related to geotechnical factors in theform of maps or inventories. Mapping of seismichazards at local scales to incorporate the effects oflocal geotechnical factors is called microzonation.
At this moment, the microzonation study forJakarta city is not well established yet. Onthe other hand, Jakarta city is being rapidlydeveloped, with major installations and high-risestructures being constructed at a rapid pace.Therefore, microzonation study for Jakarta city isurgently required in order to mitigate the effects ofearthquake hazards in the future.
3. Tectonic settings of Sumatra and Java
The identification of seismic sources including allpotential seismic sources capable of generating sig-nificant ground motion at the site is one of the most

Proposed seismic hazard maps of Sumatra and Java islands 867
Fig
ure
.1.
Indones
ian
seism
ichaza
rdm
ap
(SN
I03-1
726-2
002).

868 Masyhur Irsyam et al
Figure 2. Tectonic setting of Sumatra and Java islands (Huchon and Le Pichon 1984).
important in seismic hazard assessment. Seismicsources are identified on the basis of geological,seismological and geophysical data. The associa-tion of geologic structures with historical seismicitymay classify their roles within the present tec-tonic stress regime. In order to differentiate seismicsources, the tectonic features that affected Suma-tra and Java regions are divided into three differentclassifications: subduction zones, transform zones,and diffuse seismicity zones.
3.1 Sumatra segment
Generally tectonic features that affected Suma-tra island can be divided into two seismic sourcezones: subduction and transform fault zones. All ofthose earthquakes that occurred near convergentboundaries where an oceanic plate is being sub-ducted under an island arc or continent are classi-fied as subduction zones. The second classificationis transform zone. Transform zone is a terminologyfor earthquakes that occurred on the boundarybetween two lithospheric plates that are slidingpast one another (transform plate boundary).
Sumatra subduction zone (SSZ) is used to clas-sify all of those earthquakes that occurred nearconvergent boundaries where the Indo-Australianplate is being subducted under the Eurasian plate(figure 2). SSZ defines one of the most activeplate tectonic margins in the world. The Sumatranplate boundary trends northwest; however, the vec-tor of relative plate motion (65 mm/yr) betweenthe Indo-Australian plate and the Eurasian plate
is oriented about N10◦E (Huchon and Le Pichon1984; Prawirodirdjo et al 1997; Sieh et al 1999).Thus, relative motion between the plates is highlyoblique (Rivera et al 2002).
Seismicity and focal mechanisms show that thesubduction interface is very shallow and dips grad-ually; down-dip from near horizontal to about13◦–15◦ beneath the outer arc ridge. The con-vergent component on the interface (megathrust)is 40–45 mm/yr (Sieh et al 1999). The largemegathrust earthquake events in the Sumatrasubduction zone in the last two centuries were inthe year 1833, with a magnitude of 8.8–9.2; in theyear 1861, with a magnitude of 8.3–8.5; in the year2004, with a magnitude of 9.0–9.3 and in 2005, witha magnitude of 8.7.
The Benioff zone extends the SSZ to depthsof the order of 200 km (Newcomb and McCann1987), and formed dip angle to about 40◦–45◦. Thelargest earthquake around this region occurred on28 December 1935 at a longitude of 98.3◦E andlatitude of 0◦S and magnitude, MS, of 8.1.
The transform zone of Sumatra is formed dueto the oblique convergence of Indo-Australia withEurasia plates (figure 2). This mechanism resultsin lateral displacement across the Sumatran fault(Sieh and Natawidjaja 2000). The 1900 km longstructure of Sumatran fault accommodates rightlateral strike slip associated with the oblique con-vergence along the plate margin. The slip ratesalong the fault vary from 6 to 27 mm/year with theslip rate accelerating to the west (Petersen et al2004).

Proposed seismic hazard maps of Sumatra and Java islands 869
Figure 3. Structures of Java island (LAPI ITB 2007).
All of these earthquakes occurred due to strikeslip movement along clearly defined faults inthe frontal arc area of Sumatra Fault classifiedas Sumatra transform zone (STZ). Several largeearthquakes have occurred in this zone. Theseevents were included the 1926 Padang Panjang(MS = 6.75), the 1933 Liwa (MS = 7.5), the 1964Aceh (mb = 6.7) and the 1993 Liwa (MS = 7.2)earthquakes.
3.2 Sunda Strait
Sunda Strait is located in the transitional zonebetween the Sumatra and Java segments of theSunda Arc and it is one of the most active areasin Indonesia in terms of volcanism, seismicity andvertical motion (figure 2). Extension of the SundaStrait has formed a structurally bound graben andis the locus of the historic Krakatau volcanic com-plex. The explosion of the famous Krakatau vol-cano in 1883 occurred right in the middle of thestrait.
3.3 Java segment
Firmansjah and Irsyam (1999) classified the seis-mic source zones of Java island into three: subduc-tion zone, transform zone, and diffuse seismicity.In the subduction zone south of Java, the Java seg-ment of the Sunda Arc extends from Sunda Straiton the west to Bali Basin on the east. Old oceaniccrust (150 my) is relatively converging in a direc-tion essentially normal to the arc at the rate ofabout 6.0 cm/year in the West Java trench and4.9 cm/year in the East Java trench. The Benioffseismic zone along the Java segment dips approxi-mately 50◦ and extends to depths of about 600 km
and a gap in seismicity exists in this segmentbetween a depth of 300 and 500 km.
Three major-to-large earthquakes were reportedin historical records prior to instrumental recor-ding. These events occurred in 1840, 1867 and1875. Several large events were also recorded since1903. The record of historic seismicity along theJava segment indicates that within a period ofabout 300 years, no great interplate (megathrust)earthquakes have occurred that were similar to the1833 and 1861 Sumatra events.
Java transform zones occurred on clearly definedshallow crustal faults on Java island such asSukabumi, Baribis, Lasem, and Semarang faults(figure 3). According to Hamilton (1979), and New-comb and McCann (1987), no faults of regionalextent, similar to the Sumatra fault are present onJava. However, several other workers have reportedevidence of recent right lateral strike-slip deforma-tion on Java. Therefore, the geologic evidence forthe presence of active intraplate structures on Javais equivocal.
Diffuse seismic zones include all earthquakesthat occur in areas where seismicity is not associ-ated with a single fault or fault type. Most of thisdiffuse seismicity is found in back arc areas of col-lision zones, like Flores back-arc faulting behindthe eastern end of Sunda Arc and western end ofBanda Arc (figure 3).
4. Earthquake data
Seismic hazard assessment requires as complete ahistory as possible of earthquakes in or near theregion of interest. The earthquake catalogue used
870 Masyhur Irsyam et al
in this study was based on compilation of severalcatalogues from local and international institu-tions, such as International Seismological Centre(ISC), National Earthquake Information Center,U.S. Geological Survey (NEIC-USGS), and othercatalogues.
The combined catalogue covers an area from90◦E to 125◦E longitude and 10◦S to 10◦N latitude.The minimum magnitude is 5.0 and maximumdepth is 200 km. The total number of earthquakesin the combined catalogue is 14119. The startingdate for the catalogue is 13 May 1897 and thelast event in the catalogue is dated 31 December2004.
Typical characteristics of earthquake cataloguesare as follows:
• the magnitude scales used in the cataloguesare not uniform. This is due to the factthat the earthquake events were recorded usingmore than one type of instrument;
• the earthquake catalogues have contained boththe main shock events and the accessory shockevents (foreshock and aftershock events). There-fore, the data are not valid to be used when thetemporal occurrence of earthquakes are analyzedusing Poisson model; and
• the small events are usually incomplete inearthquake catalogues. This is due to the limitedsensitivity and coverage of the earth by seismo-graphic networks.
The first problem is solved by choosing a con-sistent magnitude for seismic hazard assessment(SHA), and then the other magnitude scales areconverted to the chosen magnitude scale by usingempirical correlation. In this research, a momentmagnitude, Mw, is chosen as a measurement toquantify the size of earthquake. Other types ofmagnitude in the catalogues were then convertedto Mw by using empirical correlations (Geller1976; EPRI 1994; Rong 2002; Hendriyawan 2007).The latest empirical correlations proposed byHendriyawan (2007) were used in this research forconverting the other magnitude scales to momentmagnitude scale.
The second problem is solved by declustering thecatalogue using time and distance windows crite-ria. The criteria proposed by Gardner and Knopoff(1974) were used in this research because thesecriteria have considered the time and distance win-dows for magnitude above 8.0. The algorithm elimi-nates 9059 accessory shock events. The combinedcatalogue, after removal of accessory shock events,contains 5060 records or more than 50% of earth-quake records have been eliminated in the com-bined catalogue. Out of 5060 records, 967 recordsare from the Sumatra faults.
The third problem is solved by performingcatalogue completeness analysis. In this study,historical earthquake data that occurred between1897 and 2004 have been analyzed for complete-ness using Stepp method (1973). Based on thecatalogue completeness analysis of the generalsoutheast Asia regions, the earthquakes withininterval 5.0 ≤ Mw < 6.0 are completely reportedonly during the most recent 28-year interval orsince 1978, interval 6.0 ≤ Mw < 7.0 are completelyreported during the most recent 33-year intervalor since 1972, and magnitude more than 7.0 arecompletely reported over 104-year sample interval(Hendriyawan 2007).
5. Seismic source modelling
The link between the database and any modellingmethods for deriving hazard levels is a regionalseismotectonic model, which should be based ona coherent merging of the regional databases. Theprocedure should integrate the elements of the seis-mological, geophysical and geological databases inorder to construct a coherent seismotectonic model(or alternative models) consisting of a discrete setof seismogenic structures.
A seismic source zone is defined as a seismicallyhomogenous area, in which every point within thesource zone is assumed to have the same probabil-ity of being the epicentre of a future earthquake(Erdik et al 1982). An ideal delineation of seismicsource zones requires a complete comprehension ofthe geology, tectonics, paleoseismology, historicaland instrumental seismicity, and other neotectonicfeatures of the region under study. However, it isnot always possible to compile detailed informa-tion in all these fields for the majority of the world.Thus, frequently, seismic source zones are deter-mined with two fundamental tools: a seismicityprofile and the tectonic regime of the region underconsideration.
There are several model seismotectonic sourcesfor Indonesia that have been proposed by previousresearchers, such as Firmansjah and Irsyam (1999);Kertapati (1999); and Zhang et al (1999). All thesemodels, except the model from Zhang et al (1999),were developed to fulfil the requirement for ana-lyzing the seismic hazard of Indonesia. The latestmodel proposed by Irsyam et al (2007) for revi-sion of Indonesian seismic hazard maps was usedin this study. The seismic source models are shownin figure 4.
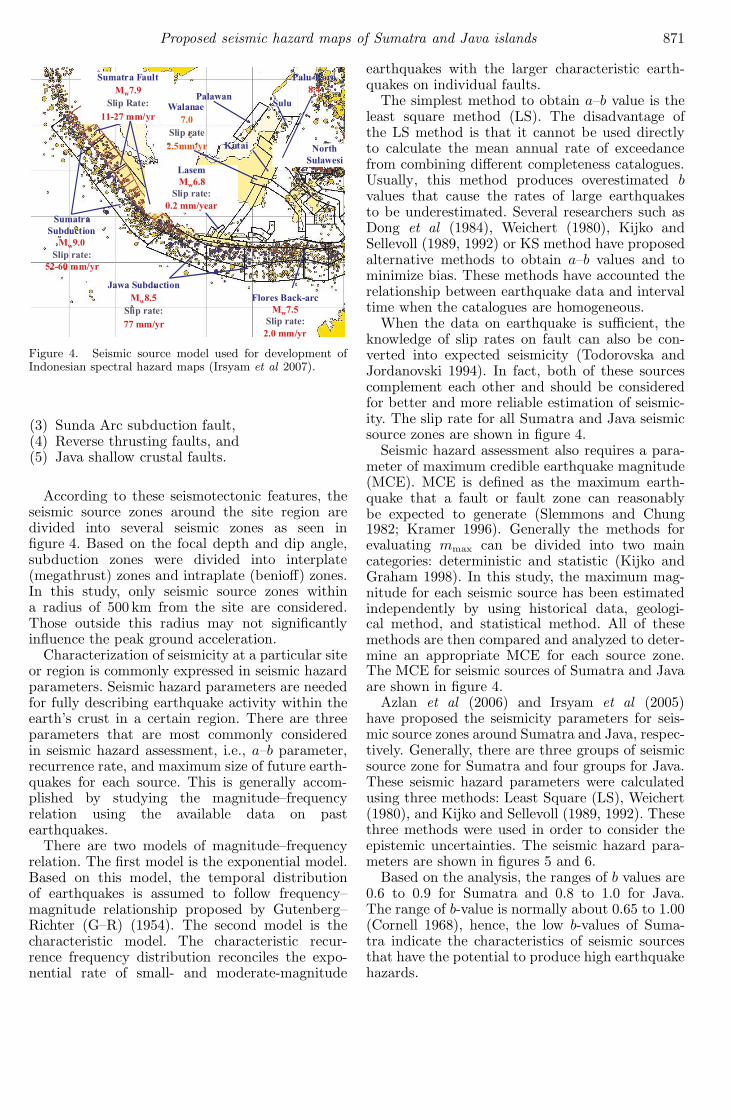
Generally, there are five potential seismogenicsources addressed in this study, which are
(1) Sumatra subduction faults,(2) Sumatran fault,
Proposed seismic hazard maps of Sumatra and Java islands 871
Figure 4. Seismic source model used for development ofIndonesian spectral hazard maps (Irsyam et al 2007).
(3) Sunda Arc subduction fault,(4) Reverse thrusting faults, and(5) Java shallow crustal faults.
According to these seismotectonic features, theseismic source zones around the site region aredivided into several seismic zones as seen infigure 4. Based on the focal depth and dip angle,subduction zones were divided into interplate(megathrust) zones and intraplate (benioff) zones.In this study, only seismic source zones withina radius of 500 km from the site are considered.Those outside this radius may not significantlyinfluence the peak ground acceleration.
Characterization of seismicity at a particular siteor region is commonly expressed in seismic hazardparameters. Seismic hazard parameters are neededfor fully describing earthquake activity within theearth’s crust in a certain region. There are threeparameters that are most commonly consideredin seismic hazard assessment, i.e., a–b parameter,recurrence rate, and maximum size of future earth-quakes for each source. This is generally accom-plished by studying the magnitude–frequencyrelation using the available data on pastearthquakes.
There are two models of magnitude–frequencyrelation. The first model is the exponential model.Based on this model, the temporal distributionof earthquakes is assumed to follow frequency–magnitude relationship proposed by Gutenberg–Richter (G–R) (1954). The second model is thecharacteristic model. The characteristic recur-rence frequency distribution reconciles the expo-nential rate of small- and moderate-magnitude
earthquakes with the larger characteristic earth-quakes on individual faults.
The simplest method to obtain a–b value is theleast square method (LS). The disadvantage ofthe LS method is that it cannot be used directlyto calculate the mean annual rate of exceedancefrom combining different completeness catalogues.Usually, this method produces overestimated bvalues that cause the rates of large earthquakesto be underestimated. Several researchers such asDong et al (1984), Weichert (1980), Kijko andSellevoll (1989, 1992) or KS method have proposedalternative methods to obtain a–b values and tominimize bias. These methods have accounted therelationship between earthquake data and intervaltime when the catalogues are homogeneous.
When the data on earthquake is sufficient, theknowledge of slip rates on fault can also be con-verted into expected seismicity (Todorovska andJordanovski 1994). In fact, both of these sourcescomplement each other and should be consideredfor better and more reliable estimation of seismic-ity. The slip rate for all Sumatra and Java seismicsource zones are shown in figure 4.
Seismic hazard assessment also requires a para-meter of maximum credible earthquake magnitude(MCE). MCE is defined as the maximum earth-quake that a fault or fault zone can reasonablybe expected to generate (Slemmons and Chung1982; Kramer 1996). Generally the methods forevaluating mmax can be divided into two maincategories: deterministic and statistic (Kijko andGraham 1998). In this study, the maximum mag-nitude for each seismic source has been estimatedindependently by using historical data, geologi-cal method, and statistical method. All of thesemethods are then compared and analyzed to deter-mine an appropriate MCE for each source zone.The MCE for seismic sources of Sumatra and Javaare shown in figure 4.
Azlan et al (2006) and Irsyam et al (2005)have proposed the seismicity parameters for seis-mic source zones around Sumatra and Java, respec-tively. Generally, there are three groups of seismicsource zone for Sumatra and four groups for Java.These seismic hazard parameters were calculatedusing three methods: Least Square (LS), Weichert(1980), and Kijko and Sellevoll (1989, 1992). Thesethree methods were used in order to consider theepistemic uncertainties. The seismic hazard para-meters are shown in figures 5 and 6.
Based on the analysis, the ranges of b values are0.6 to 0.9 for Sumatra and 0.8 to 1.0 for Java.The range of b-value is normally about 0.65 to 1.00(Cornell 1968), hence, the low b-values of Suma-tra indicate the characteristics of seismic sourcesthat have the potential to produce high earthquakehazards.

872 Masyhur Irsyam et al
Figure 5. Recurrence relationship models for SSZ and SFZ (Azlan et al 2006).
Figure 6. Recurrence relationship models for Java (Irsyam et al 2007).
6. Attenuation functions
There has been a number of attenuation functionsderived in the last two decades. Most of themwere derived in a certain region where peak groundacceleration records had been available. Due toinsufficient PGA data needed to derive an atten-uation function, there is no attenuation functiondeveloped particularly for Indonesia region. Theonly way is to adapt attenuation function derivedin other regions, which is similar to Indonesiaregion tectonically and geologically. It is of impor-tance that the selection was based on earthquakemechanism, which is generally categorized intosubduction zone earthquakes and shallow crustalearthquakes.
The attenuation relationships for subductionzone at rock sites developed by Youngs (1997) andthat for shallow crustal developed by Boore et al(1997) and Sadigh (1997) for extension tectonicregion are selected. The selection is based on a
low variability compared to others as a result ofthe previous study conducted by Firmansjah andIrsyam (2000).
7. Logic tree
Epistemic uncertainty is included in the PSHAby explicitly including alternative hypothesesand models. The logic tree allows a formalcharacterization of uncertainty in the analysisby including alternative interpretations, models,and parameters that are weighted in the analy-sis according to their probability of being correct.Logic trees (Kulkarni et al 1984; Coppersmith andYoungs 1986) are used in this study in order toallow uncertainty in selection of models for atten-uation, recurrence rate, and maximum magnitudeto be considered.
In this research, the characteristic model andthe exponential model were assigned a relative

Proposed seismic hazard maps of Sumatra and Java islands 873
Figure 7. Logic tree used in the analysis.
likelihood of 0.50 each. Attenuation proposed bySadigh (1997) and Boore et al (1997) were assigned0.7 and 0.3, respectively. The recurrence rates cal-culated according to the method of Weichert (1980)and that of Kijko and Sellevoll (1989, 1992) wereconsidered equally likely to be correct. At finallevel, different relative likelihoods were assigned tothe maximum magnitude. The logic tree model isshown in figure 7.
8. Spectral hazard maps
The spectral hazard maps were developed based ontotal probability theorem as proposed by Cornell(1968) and Merz and Cornell (1973). This modelassumes that the earthquake with magnitude, M ,and the hypocenter distance, R, as a continuousindependent random variable.
Current earthquake design practice for conven-tional structures is nominally based on the use of10% or 2% probability of exceedance (PE) in 50years ground motions (BSSC 1998; Leyendeckeret al 2000). In order to cover those two designground motions, the analyses were performed for10% and 2% PE in design time period of 50 yearsor correspond to return period of approximately500 and 2500 years, respectively.
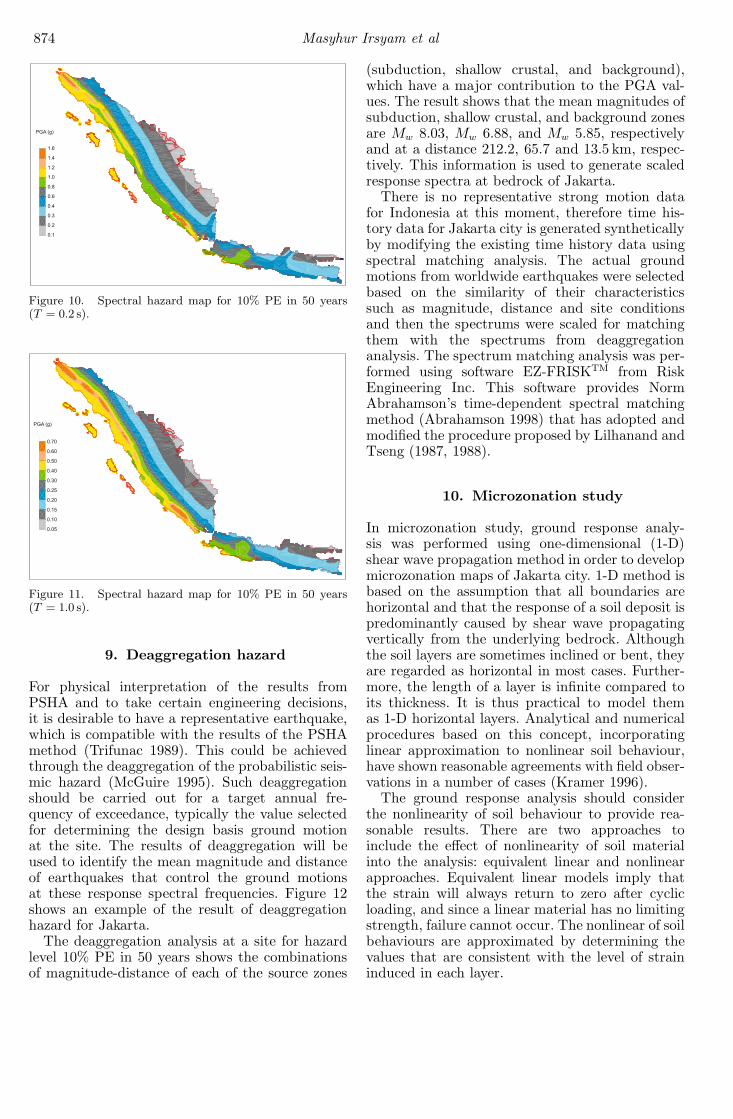
The hazard calculations were performed for sev-eral combinations of attenuation functions, seismichazard parameters, and maximum magnitudes.The result of each analysis is then multiplied by therelative likelihood of its combination of branches inthe logic tree. The macrozonation maps at bedrockwere developed not only for PGA, but also for 0.2 s(short period) and 1.0 s (long period) as shown infigures 8–11.
Generally, the acceleration values in this studyare relatively higher than the PGA maps ofIndonesian Seismic Design Code (SNI 03-1726-2002). The increasing of the acceleration values are
Figure 8. Peak ground acceleration contour maps for 10%PE in 50 years.
Figure 9. Peak ground acceleration contour maps for 2%PE in 50 years.
affected by a few factors such as the determina-tion of maximum magnitude and the use of 3-Dmodels.
874 Masyhur Irsyam et al
Figure 10. Spectral hazard map for 10% PE in 50 years(T = 0.2 s).
Figure 11. Spectral hazard map for 10% PE in 50 years(T = 1.0 s).
9. Deaggregation hazard
For physical interpretation of the results fromPSHA and to take certain engineering decisions,it is desirable to have a representative earthquake,which is compatible with the results of the PSHAmethod (Trifunac 1989). This could be achievedthrough the deaggregation of the probabilistic seis-mic hazard (McGuire 1995). Such deaggregationshould be carried out for a target annual fre-quency of exceedance, typically the value selectedfor determining the design basis ground motionat the site. The results of deaggregation will beused to identify the mean magnitude and distanceof earthquakes that control the ground motionsat these response spectral frequencies. Figure 12shows an example of the result of deaggregationhazard for Jakarta.
The deaggregation analysis at a site for hazardlevel 10% PE in 50 years shows the combinationsof magnitude-distance of each of the source zones
(subduction, shallow crustal, and background),which have a major contribution to the PGA val-ues. The result shows that the mean magnitudes ofsubduction, shallow crustal, and background zonesare Mw 8.03, Mw 6.88, and Mw 5.85, respectivelyand at a distance 212.2, 65.7 and 13.5 km, respec-tively. This information is used to generate scaledresponse spectra at bedrock of Jakarta.
There is no representative strong motion datafor Indonesia at this moment, therefore time his-tory data for Jakarta city is generated syntheticallyby modifying the existing time history data usingspectral matching analysis. The actual groundmotions from worldwide earthquakes were selectedbased on the similarity of their characteristicssuch as magnitude, distance and site conditionsand then the spectrums were scaled for matchingthem with the spectrums from deaggregationanalysis. The spectrum matching analysis was per-formed using software EZ-FRISKTM from RiskEngineering Inc. This software provides NormAbrahamson’s time-dependent spectral matchingmethod (Abrahamson 1998) that has adopted andmodified the procedure proposed by Lilhanand andTseng (1987, 1988).
10. Microzonation study
In microzonation study, ground response analy-sis was performed using one-dimensional (1-D)shear wave propagation method in order to developmicrozonation maps of Jakarta city. 1-D method isbased on the assumption that all boundaries arehorizontal and that the response of a soil deposit ispredominantly caused by shear wave propagatingvertically from the underlying bedrock. Althoughthe soil layers are sometimes inclined or bent, theyare regarded as horizontal in most cases. Further-more, the length of a layer is infinite compared toits thickness. It is thus practical to model themas 1-D horizontal layers. Analytical and numericalprocedures based on this concept, incorporatinglinear approximation to nonlinear soil behaviour,have shown reasonable agreements with field obser-vations in a number of cases (Kramer 1996).
The ground response analysis should considerthe nonlinearity of soil behaviour to provide rea-sonable results. There are two approaches toinclude the effect of nonlinearity of soil materialinto the analysis: equivalent linear and nonlinearapproaches. Equivalent linear models imply thatthe strain will always return to zero after cyclicloading, and since a linear material has no limitingstrength, failure cannot occur. The nonlinear of soilbehaviours are approximated by determining thevalues that are consistent with the level of straininduced in each layer.

Proposed seismic hazard maps of Sumatra and Java islands 875
Figure 12. Deaggregation hazard and scaled response spectra at bedrock for Jakarta.
Figure 13. Proposed ground motion used for Jakarta city.
The equivalent linear approach is incapable ofrepresenting the changes in soil stiffness thatactually occur during the earthquake. It also meansthat it cannot be used directly for problems invol-ving permanent deformation or failure. An alter-native approach is to analyze the actual nonlinearresponse of a soil deposit using direct numerical
integration in the time domain. The advantages ofnonlinear method are (Kramer 1996):
• the stiffness of an actual nonlinear soil changesover the duration of large earthquake, such highamplification levels that occur in equivalent lin-ear approach, will not develop in the field; and
• nonlinear method can be formulated in terms ofeffective stresses to allow modelling of the gen-eration, redistribution, and eventual dissipationof excess pore pressure during and after earth-quake shaking.
In this study, the ground response analyses wereperformed using nonlinear approach. The analyseswere carried out using program NERA (Bardet andTobita 2001), which stands for Nonlinear Earth-quake Response Analysis. This program uses soilmodel proposed by Iwan (1967) and Mroz (1967)to model nonlinear stress-strain curves of soil.
Shear wave propagation analyses were performedfor all existing soil data in Jakarta city to obtainpeak acceleration and amplification factors at thesurface. The classification of a particular sitewas determined by referring specifications from1997 UBC or 2000 IBC. Based on VS−30, the soildata can be classified as soil class SD (mediumstiff) or SE (soft soil) as shown in figure 14. Theresults of site response analysis at several pointswere used to develop design response spectra at thesurface.
11. Design response spectra
The influence of soil conditions on the groundmotion can be translated into the modification ofresponse spectra shapes by using spectral amplifi-cation factors. Since the amplification factors arevery sensitive to the reference site conditions, the

876 Masyhur Irsyam et al
Figure 14. Site classification of Jakarta city in accordance with 1997 UBC.
application of amplification factor must appropri-ately consider the site conditions correspondingto the reference motion. Therefore, in most buil-ding codes or provisions, the influence of local soilconditions is considered by using spectral amplifi-cation factors for different soil classes. These ampli-fication factors are used for constructing the designresponse spectra on a particular site condition(e.g., BSSC 1998; ICBO 1997; and ICC 2000).
The design spectra can also be obtained by aver-aging and smoothing a set of response spectra ata particular level, such as a pth percentile of thespectra from records with similar characteristicssuch as soil conditions, epicentral distance, mag-nitude, and source mechanism. An 84 percentile(mean plus one standard deviation) of the spectrais commonly used by engineers, which is approxi-mately mean-plus-one standard deviation of thespectra (Seed et al 1976; Anderson et al 2006).
In this research, design response spectra weredeveloped by applying the methods proposed by1997 UBC. The amplification factors in those codeswere modified based on mean-plus-one standarddeviation (84.1 percentile) of the response spec-tra from the ground response analyses. The resultswere then compared to the design response spec-tra from the Indonesian Code SNI 03-1726-2002 asshown in figure 15.
Based on the analyses, the proposed designresponse spectra are generally higher than spectra
Figure 15. Proposed design response for Jakarta (475 yearsreturn period of earthquakes).
envelopes from SNI 03-1726-2002. This is due tothe PGA of Jakarta city from this research which ishigher than the PGA from Indonesian Code (SNI03-1726-2002).
12. Summary and conclusion
This research has developed Indonesian spectralhazard maps based on probabilistic seismic hazardanalysis, which gives not only peak ground accele-ration but also short period (0.2 s) and long-period

Proposed seismic hazard maps of Sumatra and Java islands 877
(1.0 s) spectra values at the bedrock of Sumatraand Java. Two hazard levels were considered inthis study to represent 10% and 2% probability ofexceedance (PE) in design time period of 50 yearsor the corresponding to return period of approxi-mately 500 and 2500 years, respectively.
Microzonation study was performed in thisresearch for Jakarta city in order to obtain groundmotion parameters such as acceleration, amplifica-tion factor and response spectra at the surface ofa particular city. Jakarta city was selected in thisstudy because the risks of these areas are relativelyhigher than other cities in Indonesia.
In this study, the analysis was performed usingnonlinear approach in order to consider the actualnonlinear response of a soil deposit. The resultsof site response analysis at several points wereused to develop microzonation maps of Jakarta for500 years return periods. One microzonation mapwas produced in this research that can be usedas input for seismic design, land use management,and estimation of the potential for liquefaction andlandslides.
The design response spectra were proposed inthis research for structural design purposes inJakarta. In this study, the procedures proposed by1997 UBC and SNI 03-1726-2002 were used as ref-erences for developing a smooth or a design spec-trum for site categories of SD (medium stiff soil)and SE (soft soil) in Jakarta. The amplification fac-tors in those codes were modified based on mean-plus-one standard deviation of the response spectrafrom the ground response analyses. Based on theanalyses, the proposed design response spectra aregenerally higher than spectra envelopes from SNI03-1726-2002.
References
Abrahamson N A 1998 Non-Stationary Spectral Match-ing Program RSPMATCH; PG&E Internal Report,February.
Anderson J G, Su F and Zeng Y 2006 Characteristics ofground motion response spectra from recent large earth-quakes and their comparison with IEEE standard 693.2006 SSA Meeting: 100th Anniversary Earthquake Con-ference, Commemorating the 1906 San Francisco Earth-quake, April 18–22, San Francisco.
Azlan Adnan, Hendriyawan, Aminaton Marto and MasyhurIrsyam 2006 Development of Seismic Hazard Mapfor Peninsular Malaysia; Proceeding on Malaysian Sci-ence and Technology Congress, PWTC Kuala Lumpur,Malaysia, 18–26 September.
Bardet J P and Tobita T 2001 NERA – A Computer Pro-gram for Nonlinear Earthquake Site Response Analysesof Layered Soil Deposits; Department of Civil Enginee-ring, University of Southern California.
Boore D M, Joyner W B and Fumal T E 1997 Equationfor Estimating Horizontal Response Spectra and PeakAcceleration from Western North America Earthquakes:
A Summary of Recent Work; Seismol. Res. Lett. 68(1)128–153.
Building Seismic Safety Council 1998, 1997 Edition NEHRPRecommended Provisions for the Development of Seis-mic Regulations for New Buildings, FEMA 302/303.Part 1 (Provisions) and Part 2 (Commentary); Devel-oped for the Federal Emergency Management Agency.Washington DC.
Coppersmith K J and Youngs R R 1986 CapturingUncertainty in Probabilistic Seismic Hazard Assessmentswith Intraplate Tectonic Environments; Proceeding, 3rdUS National Conference on Earthquake Engineering,Charleston, South Carolina 1 301–312.
Cornel C A 1968 Engineering Seismic Risk Analysis; Bull.Seismol. Soc. Am. 58(5) 1583–1606.
Dong W M, Bao A B and Shah H C 1984 Use of MaximumEntropy Principle in Earthquake Recurrence Relation-ships; Bull. Seismol. Soc. Am. 74(2) 725–737.
EPRI 1994 The Earthquake of Stable Continental Regions;Vol. I: Assessment of Large Earthquake Potential. FileReport Electric Power Research Institute, Palo Alto,California.
Erdik M, Doyuran V, Yucemen S, Gulkan P and Akkas N1982 A Probabilistic Assessment of the Seismic Hazardin Turkey for Long Return Periods; Proc. 3rd Inter-national Earthquake Microzonation Conference, Seattle,Washington.
Firmansjah J and Irsyam M 1999 Development of Seis-mic Hazard Map for Indonesia; Prosiding Konfer-ensi Nasional Rekayasa Kegempaan di Indonesia, ITB,Indonesia.
Firmansjah J and Irsyam M 2000 Development of Attenu-ation Model and Engineering Practice Level Acceptance,LAPI ITB Report for ARCO Bali North Inc., TerangSirasun Development.
Gardner J K and Knopoff L 1974 Is the Sequence ofEarthquakes in Southern California, with AftershocksRemoved, Poissonian? Bull. Seismol. Soc. Am. 641363–1367.
Geller R J 1976 Scaling Relations for Earthquake SourceParameters and Magnitudes; Bull. Seismol. Soc. Am. 661501–1523.
Guttenberg B and Richter C F 1954 Seismicity of theEarth; (Princeton, New Jersey: Princeton UniversityPress).
Hamilton W 1979 Tectonics of the Indonesian region: U.S.Geological Survey Prof. Paper 1078.
Hendriyawan 2007 Seismic Macrozonation of PeninsularMalaysia and Microzonation of Kuala Lumpur City Cen-ter and Putrajaya; Universiti Teknologi Malaysia: PhD.Thesis.
Hu Y X 1996 Earthquake Engineering, London: E & FNSpon.
Huchon P and Le Pichon X 1984 Sunda Strait and CentralSumatra Fault; J. Geol. 12 668–672.
International Code Council 2000 International BuildingCode 2000. International Code Council. InternationalConference of Building Officials. Whittier, CA, andothers.
International Council of Building Officials 1997 UniformBuilding Code. Whittier, CA.
International Seismological Centre, On-line Bulletin,http://www.isc.ac.uk/Bull, International SeismologicalCenter, Thatcham, United Kingdom.
Irsyam M, Hoedajanto D, Kertapati E, Boen T,Petersen M D, Dangkua and Asrurifak M 2007 UsulanRevisi Peta Hazard Kegempaan Wilayah Indonesia.National Conference of Indonesian Society of Civil andStructural; August 21–22, Jakarta, Indonesia.

878 Masyhur Irsyam et al
Iwan W D 1967 On a class of models for the yieldingbehavior of continuous and composite systems; Journalof Applied Mechanics, ASME 34 612–617.
Kertapati E 1999 Probabilistic Estimates of the SeismicGround Motion Hazard in Indonesia; Proceeding NationalConference of Earthquake Engineering; Institute of Tech-nology Bandung, Indonesia. p. I-1∼I-16.
Kijko A and Graham G 1998 Parametric-historic Procedurefor Probabilistic Seismic Hazard Analysis Part I: Estima-tion of Maximum Regional Magnitude mmax; Pure Appl.Geophys. 152 413–442.
Kijko A and Sellevol M A 1989 Estimation of EarthquakeHazard Parameters from Incomplete Data Files Part I.Utilization of Extreme and Complete Catalog with Dif-ferent Threshold Magnitudes; Bull. Seismol. Soc. Am.79(3) 645–654.
Kijko A and Sellevol M A 1992 Estimation of EarthquakeHazard Parameters from Incomplete Data Files Part II.Incorporation of Magnitude heterogeneity; Bull. Seismol.Soc. Am. 82(1) 120–134.
Kramer S L 1996 Geotechnical Earthquake Engineering;New Jersey: Prentice-Hall.
Kulkarni R B, Youngs R R and Coppersmith K J 1984Assessment of Confidence Intervals for Results of SeismicHazard Analysis; Proceeding, 8th World Conference onEarthquake Engineering, San Francisco: pp. 90–98.
Lembaga Afiliasi Penelitian Indonesia 2007 Seismic HazardAssessment for PLTU 3 Banten-Teluk Naga 3x (300–400)MW. Final Report for Rekadaya Elektrika. Jakarta,Indonesia.
Leyendecker E V, Hunt R J, Frankel A D and Rukstales K S2000 Development of Maximum Considered EarthquakeGround Motion Maps; Earthquake Spectra 16(1) 21–40.
Lilhanand K and Tseng W S 1987 Generation of SyntheticTime Histories Compatible with Multiple-DampingResponse Spectra. SmiRT-9. Lausanne, K2/10.
Lilhanand K and Tseng W S 1988 Development and Appli-cation of Realistic Earthquake Time Histories Compati-ble with Multiple Damping Response Spectra; 9th WorldConf. Earth. Engineering, Tokyo, Japan 2 819–824.
McGuire R K 1995 Probabilistic Seismic Hazard Analysisand Design Earthquakes: Closing the Loop; Bull. Seismol.Soc. Am. 85 1275–1284.
Merz H A and Cornell C A 1973 Aftershocks in Engineer-ing Seismic Risk Analysis. Report R73-25. Massachusetts:Department of Civil Engineering, MIT, Cambridge.
Mroz Z 1967 On the Description of Anisotropic Work Hard-ening; Journal of Mechanics and Physics of Solids 15163–175.
Natawidjaja D H 2002 Neotectonics of Sumatran Fault andPaleogeodesy of the Sumatran Subduction Zone; Doctorof Philosophy Thesis. California Institute of Technology,Pasadena, California.
National Earthquake Information Center United StatedGeological Survey, http://neic.usgs.gov/neis/epic/epic.html.
Newcomb K R and McCann W R 1987 Seismic Historyand Seismotectonics of The Sunda Arc, J. Geophys. Res.92(B1) 421–439.
Petersen M D, Dewey J, Hartzell S, Mueller C, Harmsen S,Frankel A D and Rukstakels 2004 Probabilistic Seismic
Hazard Analysis for Sumatra, Indonesia and Across theMalaysian Peninsula; Tectonophys. 390 141–158.
Prawirodirdjo L, Bock Y, McCaffrey R, Genrich J, Calais E,Stevens C, Puntodewo S, Subraya C, Rais J, Zwick P andFauzi 1997 Geodetic Observations of Interseismic StrainSegmentation of the Sumatra Subduction Zone; Geophys.Res. Letter. 24 2601–2604.
Rivera L, Sieh K, Helmberger D and Natawidjaja D 2002A Comparative Study of the Sumatran Subduction-ZoneEarthquakes of 1935 and 1984; Bull. Seismol. Soc. Am.92(5) 1721–1736.
Rong Y 2002 Evaluation of Earthquake Potential in China;University of California Los Angeles: PhD. Thesis.
Sadigh K, Chang C Y, Egan J A, Makdisi F and Youngs R R1997 Strong Ground Motion Attenuation Relationsfor Shallow Crustal Earthquakes Based on CalifornianStrong Motion Data; Seismol. Res. Lett. 68(1)190–198.
Seed H B, Ugas C and Lysmer J 1976 Site-Dependent Spec-tra for Earthquake-Resistant Design; Bull. Seismol. Soc.Am. 66 221–243.
Sieh K and Natawidjaja D 2000 Neotectonics of theSumatran Fault, Indonesia; J. Geophys. Res. 10528,295–28,326.
Sieh K, Ward S, Natawidjaja D and Suwargadi W1999 Crustal Deformation at the Sumatran SubductionZone Revealed by Coral Rings; Geophys. Res. Lett. 263141–3144.
Slemmons D B and Chung D H 1982 Maximum Credi-ble Earthquake Magnitudes for the Calaveras and Hay-ward Fault Zone, California; Proceedings Conference onEarthquake Hazards in the Eastern San Francisco BayArea. California Division of Mines and Geology, SpecialPublication 62 115–124.
Standar Nasional Indonesia 2002 Tata Cara PerencanaanKetahanan Gempa untuk Bangunan Gedung (SNI 03-1726-2002), Badan Standardisasi Nasional.
Stepp J C 1973 Analysis of the Completeness of theEarthquake Hazard Sample in the Puget Sound Area;NOAA Technical Report, ERL 267-ESL 30. Boulder, CO:16–28.
Todorovska M I and Jordanovski L R 1994 A ProbabilisticModel for Assessment of the Total Earthquake Losses fora Building; Proceedings, 10th Europ. Conference Earth-quake Engineering, Aug. 28–Sep. 2, Vienna, Austria,1017–1022.
Trifunac M D 1989 Threshold Magnitudes Which CauseGround Motion Exceeding the Values Expected duringthe Next 50 Years in a Metropolitan Area; Geofizika 61–12.
Weichert D H 1980 Estimation of the Earthquake Recur-rence Parameters for Unequal Observation Periods forDifferent Magnitudes; BSSA 70(4) 1337–1346.
Youngs R R, Chiou S J, Silva W J and Humphrey J R1997 Strong Ground Motion Attenuation Relationship forSubduction Zone Earthquakes, Seismol. Res. Lett. 68(1)58–73.
Zhang P, Yang Z, Gupta H K, Bhatia S C and Shedlock K M1999 Global Seismic Hazard Assessment Program(GSHAP) in Continental Asia; Annali Di Geofisica.42(6) 1167–1190.
MS received 1 October 2007; revised 21 April 2008; accepted 24 April 2008