proposed opihi river adaptive management regime
TRANSCRIPT

Opihi Adaptive Management Regime – September 2017
i
Proposed Opihi River
Adaptive Management Regime
Developed by the
Adaptive Management Working Group
September 2017

Opihi Adaptive Management Regime – September 2017
ii
Contents
1 ADAPTIVE MANAGEMENT WORKING GROUP ....................................................................... 1
2 BACKGROUND ..................................................................................................................... 1
2.1 Adaptive management 1
2.2 Opuha Dam, Lake Opuha and the Operation of the Opuha Scheme 2
2.3 The Opihi River Regional Plan 4
2.4 Opuha Environmental Flow Release Advisory Group (OEFRAG) 5
2.5 2014-16 water shortage 5
3 THE OPIHI ADAPTIVE RIVER MANAGEMENT REGIME ............................................................. 6
3.1 Opihi Minimum Flow Regime 6
3.1.1 Background ................................................................................................................ 6
3.1.2 Points of agreement – Opihi (SYB) Minimum flow regime ........................................ 7
3.2 Water Shortage Regime 8
3.2.1 Background ................................................................................................................ 8
3.2.2 Points of agreement – Water Shortage Regime ........................................................ 8
3.3 Opuha Minimum Flow 10
3.3.1 Background .............................................................................................................. 10
3.3.2 Points of agreement – Opuha River minimum flow ................................................. 11
3.4 Irrigation Restriction Regime 11
3.4.1 Background .............................................................................................................. 11
3.4.2 Points of agreement – Abstractors restriction regime for all affiliated users ......... 13
3.4.3 Points of agreement – Abstractors restriction regime for augmented below-dam irrigators ........................................................................................................................ 14
3.4.4 Points of agreement – abstractors restriction regime for above-dam irrigators .... 14
3.5 Community Supply Restrictions 14
3.5.1 Background .............................................................................................................. 14
3.5.2 Points of agreement – abstractors restriction regime for community supplies ...... 15
3.6 Artificial Freshes and flow variability 15
3.6.1 Background .............................................................................................................. 15
3.6.2 Points of agreement - Artificial freshes and flow variability .................................... 16
3.7 Transition between months 17
3.7.1 Background .............................................................................................................. 17
3.7.2 Points of agreement – transition between months ................................................. 17
3.8 Flood buffering 18
3.8.1 Background .............................................................................................................. 18
3.8.2 Points of agreement – flood buffering ..................................................................... 18
3.9 The role of the Opuha Environmental Flow Release Advisory Group (OEFRAG) 18

Opihi Adaptive Management Regime – September 2017
iii
3.10 River health monitoring programme 19
3.10.1 Background .......................................................................................................... 19
3.10.2 Points of agreement – River monitoring ............................................................. 20
4 Conclusion ......................................................................................................................... 20
Appendix 1 Current and proposed flow regime ..................................................................... 22
Appendix 2 Memo: Saleyards Bridge - SH1 Minimum flow monitoring site ............................ 23
Appendix 3 Description of Assessment Factors ..................................................................... 27
Appendix 4 OEFRAG Terms of Reference .............................................................................. 32
Opihi River Adaptive Management Regime - September 2017
1
Proposed Opihi River Adaptive Management Regime Developed by the Adaptive Management Working Group
September 2017
1 ADAPTIVE MANAGEMENT WORKING GROUP
The Adaptive Management Working Group (AMWG) was initiated as a technical group to develop an
‘Adaptive River Management Regime’ for the Opihi River to recommend to the Orari-Temuka-Opihi-
Pareora Zone Committee (OTOP ZC) for their consideration as part of the Healthy Catchments
Project (HCP). This would ultimately replace the river management regime set out in the current
planning framework under the Opihi River Regional Plan (ORRP). The AMWG recognised the value
of bringing together the learnings and research of the last eighteen years of dam operation, and
particularly during the low flow period from November 2014 until January 2016, and utilise the
opportunity to make positive changes to the regime for the benefit of both instream values and out
of stream users.
The AMWG consists of representatives of Central South Island Fish and Game (F&G), Department of
Conservation (DOC), Timaru District Council (TDC), Opuha Water Ltd (OWL), NIWA, and de Joux
Consulting Ltd. Together they have considerable experience and understanding of the Opihi River
system and most are long standing Opuha Environmental Flow Release Advisory Group (OEFRAG)
participants. As such, OEFRAG are considered a member of the AMWG. The AMWG acknowledge
that Arowhenua Rūnanga have not had resources available to contribute to this forum. As a key
member in OEFRAG (especially through the difficult times of 2014-16 when so much was learnt by all
OEFRAG members), Arowhenua Rūnanga’s participation in the AMWG was and still is actively
invited.
The AMWG have met regularly from December 2016 through to June 2017, to discuss the
fundamental components of an adaptive river management regime for the Opihi River. The group
has worked well together, and there is a sense of momentum, collaboration and trust at the table,
built on the solid foundations of OEFRAG.
The work of the AMWG has been reported back to Environment Canterbury monthly, in recognition
of the technical challenges involved in writing an adaptive management regime into an RMA Plan.
The AMWG also presented to the ZC at a public meeting in March 2017 to ensure the ZC understood
the background and rationale behind the development of the regime, and to seek endorsement for
the continued work of the AMWG. While some of the details of the regime have evolved since this
earlier meeting, the underlying principles remain the same.
2 BACKGROUND
2.1 Adaptive management
The experience of operating the dam since its commissioning in 1998, and in particular over the
2014-16 low flow situation has demonstrated that the adaptive management of the Opuha Dam

Opihi River Adaptive Management Regime - September 2017
2
would provide better environmental, economic, cultural and recreational/amenity outcomes for the
Opihi River than the current prescriptive regime in the Opihi River Regional Plan (ORRP).
The aim of incorporating an adaptive management framework in the HCP is to make the best use of
the storage capability of Lake Opuha for the purpose of:
1. Retaining connectivity in the Opihi River and reliability of supply for the river, affiliated
community water supply and affiliated irrigators; and
2. Improving river health in the downstream catchment.
While the AMWG seek as much flexibility as possible in the operating regime, the group
acknowledges the need for some prescription to provide legal certainty and comfort to the wider
community that there are constraints and boundaries around the operation of the river regime. The
group are, therefore, seeking to develop a regime that balances the need for such certainty while
being adaptive enough to respond to various climatic and river health situations.
The Opihi River Adaptive Management Regime incorporates a number of components:
• Opihi River Minimum Flow Regime
• Water Shortage Regime and Decision Process
• Abstraction Restriction regime for Irrigators and Community Supplies
• Artificial Freshes and Flow Variability
• General Operating and Consenting Rules
Fundamentally, in considering each of these components, the AMWG has continued to award
priority to the environment, followed by community supplies and then irrigation, consistent with
the current ORRP as well as the Canterbury Water Management Strategy priorities.
This proposal explores each of these components, providing background and justification as well as
the key points of agreement of the AMWG. For completeness it is noted that this proposal applies
only to water users affiliated to the Opuha Scheme.
2.2 Opuha Dam, Lake Opuha and the Operation of the Opuha Scheme
The Opuha Dam is a 50m high earth dam with a single hydro turbine and a lake covering around
710ha. Water is stored and released for environmental flows, irrigation, urban and industrial supply
in the Timaru District and to generate electricity. Water storage is prioritised for release into the
Opuha River which flows into Opihi River to ensure minimum flows are maintained at all times and
especially in times of drought and/or low natural flows.
The dam has an operating range of 22.2m from RL370 – RL392.2. Within this operating range, Lake
Opuha stores 65.47 million m3 of water. Any derogation of this operating range, through for
instance a higher minimum lake level, could significantly impact on the ability of the lake to satisfy
both environmental flows and irrigation demand. The lake can never be completely drained. Even
at RL370, there is 5 million m3 of stored water remaining behind the dam which protects the fish
population should the lake reach this critical low level. Should the lake drop to RL370, there is no
requirement to release for environmental flows or irrigation, and outflows must equal the inflows.
Lake Opuha is an artificial lake built first and foremost as a reservoir to maintain and improve the
health of the river downstream and supply reliable water for community supplies and irrigation.
With the exception of the old riverbed of the North and South Opuha, the land under Lake Opuha
and lake margins are owned by Opuha Water Ltd (OWL). While it is legally a private facility, Lake
Opihi River Adaptive Management Regime - September 2017
3
Opuha provides amenity and recreational benefits to the community, particularly for fishing, rowing
and other water-based sports, and this use is encouraged by OWL. However, these benefits have
arisen as a result of the dam build as opposed to the dam being built for recreational and amenity
values. The lake fishery, in particular, is considered by Central South Island Fish and Game to be
secondary in value to the downstream river fishery.
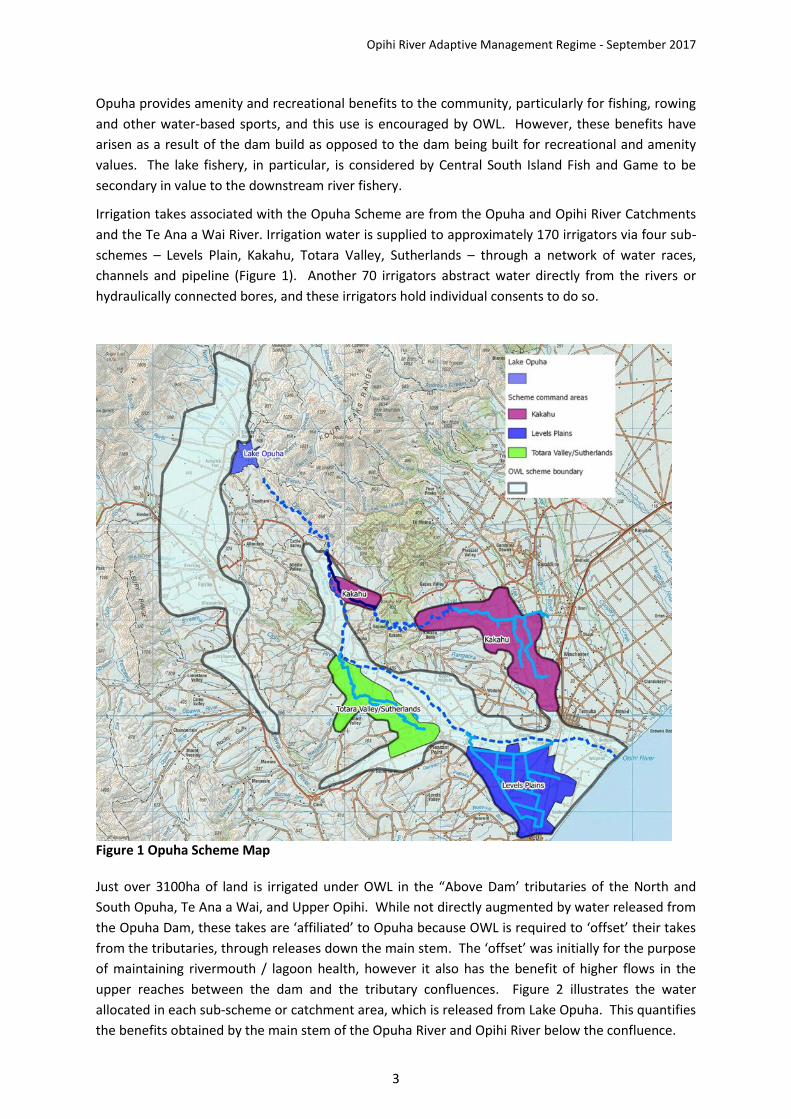
Irrigation takes associated with the Opuha Scheme are from the Opuha and Opihi River Catchments
and the Te Ana a Wai River. Irrigation water is supplied to approximately 170 irrigators via four sub-
schemes – Levels Plain, Kakahu, Totara Valley, Sutherlands – through a network of water races,
channels and pipeline (Figure 1). Another 70 irrigators abstract water directly from the rivers or
hydraulically connected bores, and these irrigators hold individual consents to do so.
Figure 1 Opuha Scheme Map
Just over 3100ha of land is irrigated under OWL in the “Above Dam’ tributaries of the North and
South Opuha, Te Ana a Wai, and Upper Opihi. While not directly augmented by water released from
the Opuha Dam, these takes are ‘affiliated’ to Opuha because OWL is required to ‘offset’ their takes
from the tributaries, through releases down the main stem. The ‘offset’ was initially for the purpose
of maintaining rivermouth / lagoon health, however it also has the benefit of higher flows in the
upper reaches between the dam and the tributary confluences. Figure 2 illustrates the water
allocated in each sub-scheme or catchment area, which is released from Lake Opuha. This quantifies
the benefits obtained by the main stem of the Opuha River and Opihi River below the confluence.

Opihi River Adaptive Management Regime - September 2017
4
All irrigators who hold consents (or operate under sub scheme consents) to take water from the
Opihi catchment must have a Water Supply Agreement (WSA) with OWL. The Opuha scheme
enables the irrigation of a notional 16,000ha, with a maximum irrigation flow of 6.6 cumecs.
Figure 2 Allocation of shared water in sub-schemes and sub-catchments across the Opuha Scheme
2.3 The Opihi River Regional Plan
The Opihi River Regional Plan is the current planning document in the Opihi River catchment. The
purpose of the ORRP is ‘to promote the sustainable management of the natural and physical
resources of the Opihi River, its tributaries including the Temuka River, and hydraulically connected
groundwater and to achieve the integrated management of those resources’. The Plan sets out
objectives, policies, methods and rules to resolve the issues of competing demands for water, the
effects of augmentation, and the discharge of contaminants affecting surface water.
The AMWG believes this ORRP purpose is as relevant now as it was in 2000 when the plan was made
operative. There are also particular aspects of the ORRP that the AMWG seek the retention of
through the Healthy Catchments Project:
• Priority awarded to the environment, then community supplies, then irrigation.
• Recognition that under natural conditions (pre dam), there has on occasion been no surface
flow in parts of the Opihi River system.
• Allocation limits set to protect the availability of water for consent holders who held
consents pre-dam i.e. ‘A permit’ holders.
• Those that augment the river (affiliated water users) receive the benefit of higher reliability
supply of water.

Opihi River Adaptive Management Regime - September 2017
5
2.4 Opuha Environmental Flow Release Advisory Group (OEFRAG)
A fundamental aspect of the Opihi River Adaptive Management Regime is retaining OEFRAG as the
key decision making body.
OEFRAG is the Opuha Environmental Flow Release Advisory Group – a stakeholder representative
group established under the Opihi River Regional Plan (ORRP) to advise on the release of water from
the Opuha Dam. The group comprises representatives from Arowhenua Rūnanga, District Councils,
Federated Farmers, Fish & Game/Doc and Opuha Water Ltd. The group is also supported by a local
hydrologist and an ECan representative.
The mandate for OEFRAG under the ORRP is primarily to manage the transition of minimum river
flows between months, for management of artificial freshes and for releases to provide flood
buffering. Since its inception however, the group has adopted a wider role including, in particular,
that of advising ECan on appropriate pre-cautionary measures in times of anticipated water
shortages. In doing so, OEFRAG utilise the provisions under s329 of the RMA, and recommend to
ECan the imposition of Water Shortage Directions (WSD) which can place more conservative flow
and restriction regimes than specified in the ORRP or affiliated consents, in the hope to preserve
lake storage for as long as possible.
In August 2008, after some extensive review work based on the experience of the operation of the
lake and river since the dam was commissioned, the group completed a Plan Change Application
that proposed some significant changes to the flow regime during water shortages (see Appendix 1
for ‘OEFRAG proposed’ regime). As the 10 year review of the ORRP was initially scheduled for 2010,
this Plan Change was not formally progressed, however it did form the platform from which OEFRAG
dealt with the low flow situations since 2008, and in particular the period from November 2014 until
January 2016.
2.5 2014-16 water shortage
Through the winter and spring of 2014, there were very low inflows and snowfall in the Opuha Dam
catchment. Despite this, dam storage was about 10% above average at 91% full heading into
October, the month with the highest environmental flow requirement. The lack of snow melt and
continuing low inflows, combined with the early start to the irrigation season, saw a very heavy
demand on storage and an unprecedented drawdown in the lake to 67% full. Typically the lake
storage increases through October, driven mainly by melting snow from warming temperatures.
OEFRAG met in early November to review the situation and agreed to implement restrictions via a
WSD if the lake continued to decline to 50%. By the end of November, with lake levels nearing 50%,
OEFRAG recommended a 25% irrigation restriction and a reduction in the minimum river flow of
17%. Within two weeks these restrictions were tightened to 50% and 42% respectively. The group
convened at least fortnightly to adapt the restriction regime in an effort to prolong storage. As the
summer drew on, the situation continued to worsen. When the lake storage reached less than 10%,
OEFRAG reduced river flows to 2 cumecs, a minimum level not seen since the dam was
commissioned. The river was closely monitored by OEFRAG members, particularly representatives
from Fish and Game and Arowhenua Rūnanga, to ensure it stayed ‘connected’ and fish passage was
retained as the flow rate was stepped down to this unprecedented low flow. There was agreement
by OEFRAG members that any reduction beyond 2 cumecs could compromise this connectivity.
Irrigators agreed to an earlier shutdown on Feb 25th in exchange for the ability to keep a 50%
restriction regime to the end and all irrigation ceased with just one metre of storage remaining –

Opihi River Adaptive Management Regime - September 2017
6
with this last metre dedicated to maintaining the river flow at its absolute minimum. Despite these
extreme measures, lack of rain meant storage continued to diminish. OEFRAG formulated a plan to
operate the system below ‘zero storage’, while preparations were made for a massive fish salvage
exercise if the river ran dry. Then, on March 6th, with plans in place and the lake within 50mm of
‘zero’, it rained, enough to keep the river flowing and the lake level above zero. If the minimum
flows had been any higher than this 2 cumec minimum during this low flow period, it is almost
certain that the storage would have depleted earlier and the river would have run dry.
Following that turnaround in early March 2015, OEFRAG continued to meet regularly and irrigation
and river flow restrictions were kept in place until a small buffer was attained. A brief period of
irrigation was agreed to by the group in April to enable farmers, who had been shut down for over
eight weeks, to get some water on desperate pastures before cooler temperatures arrived. OEFRAG
monitored the lake storage throughout winter and WSD’s continued to be ‘rolled over’ throughout
2016 which lowered the minimum flow requirements and enabled the lake to recover by the start of
the 2015/16 irrigation season. Despite there being a full lake, however, OEFRAG continued to
recommend WSD’s through to the start of 2016 in recognition that there was very little snow melt
feeding system.
This demonstrates the value of an adaptive management approach in the Opihi River system.
Despite the 2014/15 summer having the lowest rainfall recorded in the region for forty years, the
Opihi River did not lose connectivity thanks to the effectiveness of OEFRAGs management of the
limited storage available. Without Opuha Dam, it has been estimated that the Opihi River would
have disconnected shortly after New Year. Without the intervention of OEFRAG to ration stored
water and adapt the balance between environmental needs and irrigation demands, the river would
almost certainly have run dry and irrigators would have been shut down before the end of January.
The functioning of OEFRAG enabled all key stakeholders to be involved in the decisions to adapt the
river operating regime to meet the extreme conditions being experienced and to protect, as much as
possible, the environmental well-being of the river and the economic well-being of the community.
The learnings from these two low flow seasons have significantly influenced the development of the
Opihi Adaptive Management Regime, detailed in Section 3 below. In particular, these critically dry
seasons demonstrated that neither the current ORRP regime, nor the regime set out in the OEFRAG
2008 proposed plan change would have achieved the outcomes sought for the Opihi River
Catchment.
3 THE PROPOSED OPIHI ADAPTIVE RIVER MANAGEMENT REGIME
3.1 Opihi Minimum Flow Regime
3.1.1 Background
The ORRP prescribes the operating ‘rules’ for the Opuha Dam in relation to the flows to be
maintained downstream in the Opihi River at Saleyards Bridge (SYB) near Pleasant Point. SYB is
downstream of the confluence of the Opuha and Opihi rivers, 38km downstream of the dam. The
minimum flow requirements broadly reflect the natural hydrograph for the river with higher flows in
spring and autumn and lower flows in summer and winter. Minimum flows are different for each
month of the year to meet the functions and priorities for environmental flows first identified during
the original design/consenting process (see Table 4 later in the document).

Opihi River Adaptive Management Regime - September 2017
7
The ORRP flow regime is based on instantaneous minimum flows so that at any point in time, the
river flow at SYB has to be at or above the specified minimum flow plus the sum of abstraction by
affiliated water users downstream. All water abstracted by affiliated water users is ordered on a
daily basis to ensure OWL release a sufficient quantity of water into the river to meet these
requirements. Operating experience has shown that because of the lag time between the dam and
SYB, as well as diurnal fluctuations, variability in Opihi River flow, and other operational variances, it
is not possible to operate the river on the minimum without the risk of it occasionally dropping too
low. For this reason the flow at SYB always tends to be between 300-500 l/s above the minimum
requirement. While extra water may be considered ‘good’ for the river, any excess flow depletes
lake storage and removes the ability to use this water in the future. The instantaneous minimum
also tends to encourage “flat-lining” the river, maintaining constant flows for extended periods.
One aim of this new proposed regime is to introduce variability without using more water.
3.1.2 Points of agreement – Opihi (SYB) Minimum flow regime
Key points of agreement by the AMWG are as follows:
• Saleyards Bridge (SYB) remains the main minimum flow monitoring site for the Opihi River (see
Appendix 2 for rationale).
• The minimum flow regime set out in Table 1 is adopted.
Table 1. AMWG proposed Opihi minimum flows at SYB
Minimum flow Instantaneous minimum flow
Minimum monthly average flow
Mo
nth
ly m
inim
um
flo
ws
(m3 /
s)
January 3.50 4.50
February 3.50 4.50
March 6.00 7.00
April 6.00 7.00
May 4.00 4.50
June 3.50 4.00
July 3.50 4.00
August 4.00 4.50
September 5.00 6.00
October 6.00 8.00
November 5.00 7.00
December 5.00 6.00
Average
5.59
Total (m3/s x months)
67.00
Total volume (million m3)
176
• OWL is required to release sufficient water to meet the minimum flow plus the sum of affiliated
abstractions occurring downstream of SYB at that time.
• All irrigation water is ordered on a daily basis to ensure sufficient quantities are released from
storage to meet both irrigation demand and minimum flow requirements, ensuring that the
minimum flows are not breached due to high irrigation demand on any one day.

Opihi River Adaptive Management Regime - September 2017
8
• Variability within months is provided for through both a minimum instantaneous flow and a
(higher) minimum monthly average flow. The instantaneous minimum prevents the river
dipping too low at any time, safeguarding its values. Specifying minimum monthly average flows
provides greater (though still restricted) operational flexibility and allows some water to be
banked and released as artificial freshes. Flow variability and artificial freshes are discussed
further in section 3.6.
• The total annual environmental flow volume (minimum monthly average flow) is the same as
the current ORRP (minimum instantaneous flows).
• The minimum flow regime maintains the general pattern of seasonal variability in flows seen in
the ORRP, though the distribution of minimum flows between months changes slightly:
o Higher average monthly minimum flows in January and February
o Lower average monthly flows in March, April and October. The ORRP high flows during
these months are to facilitate conditions for fish passage and angling. By including flow
variability and artificial freshes during these periods these goals can be accomplished
without such high minimum flows.
3.2 Water Shortage Regime
3.2.1 Background
Included in the current ORRP operating ‘rules’ are provisions for the minimum river flows to be
reduced if the storage level of the Opuha Dam reaches the critically low level of RL375m (note the
operating range of the dam is RL392.2m to RL370m). At RL375m there is only 10% of storage left in
the lake and, reflective of such low flow conditions, the minimum flow requirements reduce, and
affiliated irrigators are placed on a 50% restriction.
Experience has highlighted four key issues with the ORRP regime.
• Firstly by the time the lake reaches 375m, it is too late to get any benefit from imposing
restrictions, as there is only 10% of lake volume remaining which will last only a very short
period of time (< two weeks).
• Secondly, there are other factors additional to the lake level – snow pack in particular - that
should to be taken into account when deciding when restrictions are imposed.
• Thirdly, there would be benefit from introducing more ‘levels’ into the restriction system to
reflect the varying degrees of severity of lake depletion and environmental and agricultural
stress.
• Finally, the ORRP does not provide the ability to respond to particular natural events. It has
become evident that the variable nature of the river system means that a prescriptive plan will
not lead to the best outcome for the river.
3.2.2 Points of agreement – Water Shortage Regime
In response to these issues, key points of agreement by the AMWG are as follows:
• There are a number of factors influencing water availability and storage capacity in the Opuha
catchment and a single flow regime is not adequate for such a dynamic system. Times of low
flow will occur, and it is critical that the flow regime anticipates water shortage events
• There are 2 levels of water shortage:

Opihi River Adaptive Management Regime - September 2017
9
o A Level 1 regime reflects a situation where the factors influencing storage capacity are
causing some concern and a cautious approach is warranted to sustain environmental,
community water supply and irrigation flows for an extended period. Based on
historical records since the lake has been operational, it is anticipated that the Level 1
regime will likely occur on a 1:5 year (20%) probability. In the 19 years of record this
would have been triggered possibly 3-4 times (2001, 2007, 2014 and 2015).
o A Level 2 regime reflects a situation of critical low flow where extreme measures are
necessary in order to preserve lake storage for as long as possible. Historically and
statistically, it is anticipated that the Level 2 regime may occur with a frequency around
1:20 to 1:30 years (3-5% probability). In the 19 years of record this would have been
triggered 1-2 times (2001, 2015).
• Lake level and snow pack are the two primary factors influencing lake storage in Lake Opuha.
Converting both factors to a volume and combining them gives the Potential Available Volume
(PAV). This PAV can be compared against historical data to determine the minimum required
PAV levels that could trigger a water shortage (Level 1 or Level 2) situation (Table 2).
Table 2. Monthly minimum required Potential Available Volume (million m3)
Minimum Required PAV
Jan Feb Mar Apr May Jun Jul Aug Sep Oct Nov Dec
Level 1
Level 2
• Should the Level 1 minimum required PAV specified in Table 2 be triggered, ECan will consult
with, and seek recommendation from OEFRAG regarding the need for the imposition of the
Level 1 minimum flow regime (in Table 3).
• Should the Level 2 minimum required PAV specified in Table 2 be triggered, ECan will consult
with, and seek recommendation from OEFRAG regarding the need for the imposition of the
Level 2 minimum flow regime (in Table 3).
• In making their recommendation, OEFRAG will take into account the following assessment
factors (further described in Appendix 3):
o Lake Inflows
o River connectivity
o River mouth status and lagoon health
o Periphyton cover
o Cultural river health
o General river health
o Long term climatic cycle predictions
o Short term weather forecast
o Soil moisture conditions/ irrigation demand
• ECan will retain ultimate decision making authority
• While any Level 1 or Level 2 regime is in place, ECan will review the decision and consult with
OEFRAG fortnightly.

Opihi River Adaptive Management Regime - September 2017
10
• Variability is provided for in the Level 1 regime through both a minimum instantaneous flow and
a (higher) minimum monthly average flow. Only a minimum instantaneous flow is specified for
the Level 2 regime, in recognition that when low flow conditions are critical, there is no room for
variability around an average flow.
• The Level 1 regime continues to maintain the general pattern of seasonal variability in flows.
• The minimum instantaneous flow for the Level 2 regime is 2 cumecs, which is the flow that
maintained connectivity through the entire length of the Opihi River during the 2014/15
summer.
• Should the lake drop below RL370, there is no requirement to release for environmental flows or
irrigation, and outflows must equal the inflows.
Table 3. AMWG proposed Opihi water shortage minimum flows at SYB
Level 1 Level 2
Type of minimum flow: Instantaneous or Average
Instantaneous minimum flow
Minimum monthly average flow
Instantaneous minimum flow
Mo
nth
ly m
inim
um
flo
ws
(m3/s
)
January 3.00 3.50 2.00
February 3.00 3.50 2.00
March 5.00 5.50 2.00
April 5.00 5.50 2.00
May 3.50 4.00 2.00
June 3.00 3.50 2.00
July 3.00 3.50 2.00
August 3.50 4.00 2.00
September 4.00 5.00 2.00
October 5.00 6.00 2.00
November 4.00 4.50 2.00
December 4.00 4.50 2.00
Average 4.42 2.00
Total (m3/s x months) 53.0 24.0
Total volume (million m3) 139 63
Appendix 1 illustrates the proposed AMWG regime against the ORRP and OEFRAG 2008 flow
regimes.
3.3 Opuha Minimum Flow
3.3.1 Background
Additional to the SYB minimum flow requirements, OWL is also required (by its resource consents)
to release a minimum of 1.5 m3/s from the downstream weir into the Opuha River when the lake is
above RL370. There could be situations, however, where this minimum flow is being released but up
to 1.2 m3/s could be abstracted from the river at the Kakahu Irrigation scheme intake just
downstream of Skipton Bridge, leaving the section between Skipton Bridge and the confluence with
the Opihi River very low. A residual flow for the Opuha River would be more appropriate than a
minimum release for this situation.

Opihi River Adaptive Management Regime - September 2017
11
3.3.2 Points of agreement – Opuha River minimum flow
Key points of agreement by the AMWG are as follows
• A minimum flow of 1.5 m3/s plus the sum of abstraction by affiliated irrigators from the Opuha
River, measured at the downstream weir.
• A minimum flow of 1.0 m3/s plus the sum of abstraction by affiliated irrigators from the Opuha
River, measured at the downstream weir, when a Level 2 flow regime is in place.
3.4 Irrigation Restriction Regime
3.4.1 Background
Alongside the minimum flow regime is the need for a restriction regime for community supplies and
irrigators. This restriction regime extends to affiliated water users only; non-affiliated water users
fall outside the scope of this proposal.
The water restrictions currently set out in the ORRP have been made on a blanket basis with the
same restrictions applying to all affiliated irrigators. These irrigators operate under consents that are
subject to constraints based on Dam storage levels and minimum flows in the Opihi River at SYB (as
prescribed by the ORRP). The anticipated (theoretical) reliability of the dam prior to construction
was 92%, though prior to the 2014/15 irrigation season, irrigation reliability for affiliated irrigators
had been 99%. During the 2014/15 irrigation, only 37% reliability was achieved. While there may be
an expectation from affiliated irrigators that high reliability will be upheld in the future, OWL are not
accountable to a specific reliability in any water supply agreements.
Approximately 53% of the water supplied by OWL is utilised on dairy farms within the Scheme. The
remaining irrigation water is used to irrigate mixed crop, sheep and beef, horticultural enterprises,
and lifestyle blocks. The AMWG propose an irrigation restriction framework that reflects the
different criticalities between irrigation and river demand for different times of the year resulting
from this mix of landuse. As the irrigation season progresses, there can be months where
maintaining higher flows/supplies are more critical than others and similarly for the river (see Table
4 and 5). The regime also reflects the fact that the irrigation infrastructure on each farm is different
throughout the scheme and a simple restriction on instantaneous rate is difficult to implement
efficiently on some properties.
The AMWG also propose an irrigation restriction framework that recognises the difference in
reliability between above- and below-dam irrigators. In this instance above-dam relates to affiliated
irrigators whose water takes are not directly augmented by releases of stored water from the Opuha
Dam. This covers the groups of irrigators who take water from:
• The inflowing tributaries of the Opuha Dam of which the main water sources are the South
Opuha and North Opuha Rivers, Ribbonwood and Station Streams.
• The Opihi River and its tributary creeks and streams above the confluence with the Opuha at
Raincliff
OWL water allocation
• For every 1 “Water” share held provides an allocation to receive water (subject to reliability) at a standard flow rate of 0.41336 litres per second based on an application rate equivalent to 25mm of water per hectare per week.
• This water allocation is expected to be spread over the season running from September to May with a total seasonal volumetric allowance of 5625 m3 per share (25mm x 1 share x 22.5 weeks).
• Affiliation to OWL can be by way of shares, entitlements or some other augmentation agreement.
Opihi River Adaptive Management Regime - September 2017
12
• The Te Ana a Wai River
Approximately 3,141 of the 16,000 OWL shares are held by affiliated irrigators in these above-dam
catchments.
The AMWG recognise that the ‘above-dam irrigators’ consents have additional constraints based on
the minimum flows of their specific river/stream (that are not augmented by dam releases).
Historically these minimum flow constraints have resulted in restrictions for the above-dam
irrigators in most seasons, meaning the historical reliability of irrigation water supply to the above-
dam irrigators is less than that of the below-dam irrigators. This inherent discrepancy in reliability
experienced by above-dam irrigators and the inability of these irrigators to get direct benefit from
the dam storage and from any water savings during dry seasons, should be recognised when water
restrictions are imposed during dry seasons. On the basis of experience gained through the dry
seasons of 2014/15 and 2015/16, it is considered appropriate, and equitable, that the restriction
regimes for affiliated above-dam irrigators is different to restrictions for affiliated below-dam
irrigators.
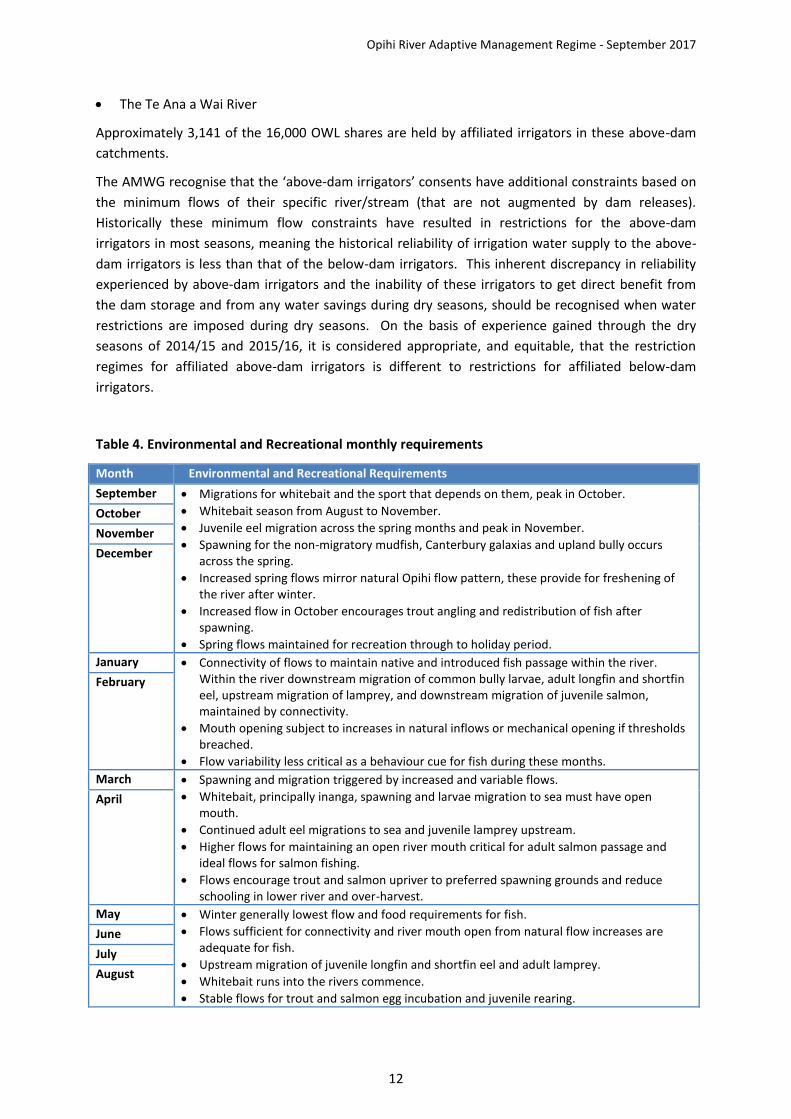
Table 4. Environmental and Recreational monthly requirements
Month Environmental and Recreational Requirements
September • Migrations for whitebait and the sport that depends on them, peak in October.
• Whitebait season from August to November.
• Juvenile eel migration across the spring months and peak in November.
• Spawning for the non-migratory mudfish, Canterbury galaxias and upland bully occurs across the spring.
• Increased spring flows mirror natural Opihi flow pattern, these provide for freshening of the river after winter.
• Increased flow in October encourages trout angling and redistribution of fish after spawning.
• Spring flows maintained for recreation through to holiday period.
October
November
December
January • Connectivity of flows to maintain native and introduced fish passage within the river. Within the river downstream migration of common bully larvae, adult longfin and shortfin eel, upstream migration of lamprey, and downstream migration of juvenile salmon, maintained by connectivity.
• Mouth opening subject to increases in natural inflows or mechanical opening if thresholds breached.
• Flow variability less critical as a behaviour cue for fish during these months.
February
March • Spawning and migration triggered by increased and variable flows.
• Whitebait, principally inanga, spawning and larvae migration to sea must have open mouth.
• Continued adult eel migrations to sea and juvenile lamprey upstream.
• Higher flows for maintaining an open river mouth critical for adult salmon passage and ideal flows for salmon fishing.
• Flows encourage trout and salmon upriver to preferred spawning grounds and reduce schooling in lower river and over-harvest.
April
May • Winter generally lowest flow and food requirements for fish.
• Flows sufficient for connectivity and river mouth open from natural flow increases are adequate for fish.
• Upstream migration of juvenile longfin and shortfin eel and adult lamprey.
• Whitebait runs into the rivers commence.
• Stable flows for trout and salmon egg incubation and juvenile rearing.
June
July
August
Opihi River Adaptive Management Regime - September 2017
13
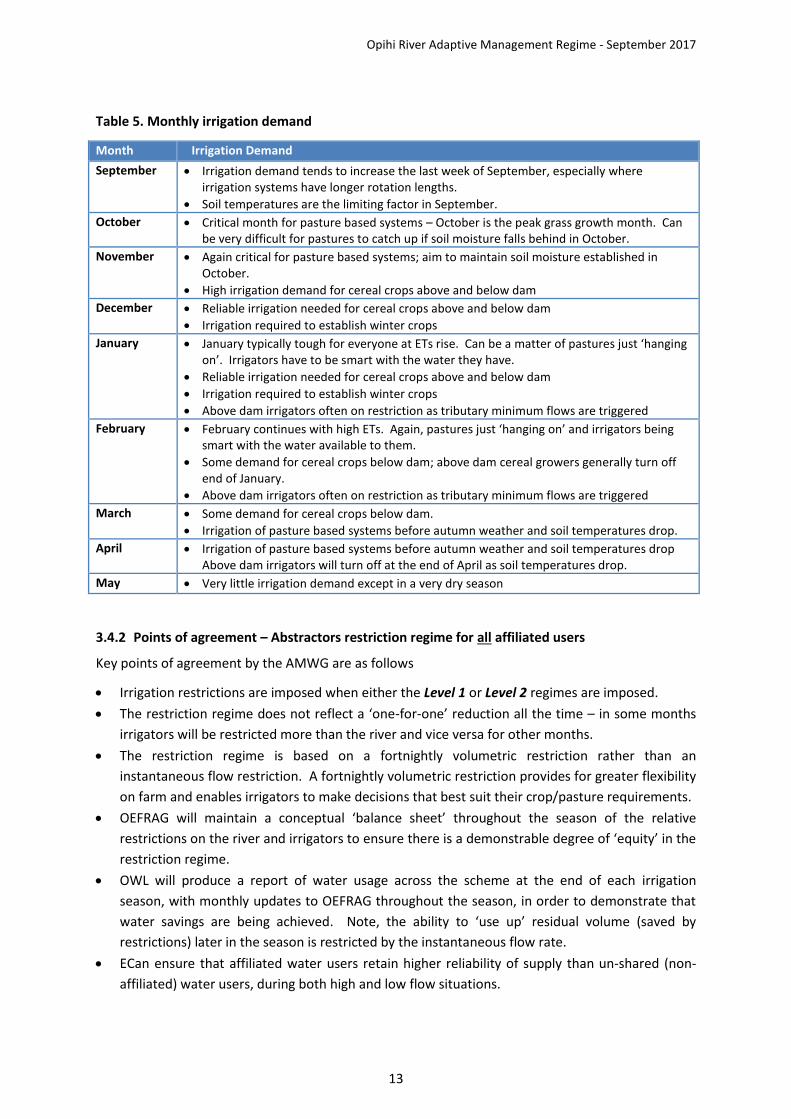
Table 5. Monthly irrigation demand
Month Irrigation Demand
September • Irrigation demand tends to increase the last week of September, especially where irrigation systems have longer rotation lengths.
• Soil temperatures are the limiting factor in September.
October • Critical month for pasture based systems – October is the peak grass growth month. Can be very difficult for pastures to catch up if soil moisture falls behind in October.
November • Again critical for pasture based systems; aim to maintain soil moisture established in October.
• High irrigation demand for cereal crops above and below dam
December • Reliable irrigation needed for cereal crops above and below dam
• Irrigation required to establish winter crops
January • January typically tough for everyone at ETs rise. Can be a matter of pastures just ‘hanging on’. Irrigators have to be smart with the water they have.
• Reliable irrigation needed for cereal crops above and below dam
• Irrigation required to establish winter crops
• Above dam irrigators often on restriction as tributary minimum flows are triggered
February • February continues with high ETs. Again, pastures just ‘hanging on’ and irrigators being smart with the water available to them.
• Some demand for cereal crops below dam; above dam cereal growers generally turn off end of January.
• Above dam irrigators often on restriction as tributary minimum flows are triggered
March • Some demand for cereal crops below dam.
• Irrigation of pasture based systems before autumn weather and soil temperatures drop.
April • Irrigation of pasture based systems before autumn weather and soil temperatures drop Above dam irrigators will turn off at the end of April as soil temperatures drop.
May • Very little irrigation demand except in a very dry season
3.4.2 Points of agreement – Abstractors restriction regime for all affiliated users
Key points of agreement by the AMWG are as follows
• Irrigation restrictions are imposed when either the Level 1 or Level 2 regimes are imposed.
• The restriction regime does not reflect a ‘one-for-one’ reduction all the time – in some months
irrigators will be restricted more than the river and vice versa for other months.
• The restriction regime is based on a fortnightly volumetric restriction rather than an
instantaneous flow restriction. A fortnightly volumetric restriction provides for greater flexibility
on farm and enables irrigators to make decisions that best suit their crop/pasture requirements.
• OEFRAG will maintain a conceptual ‘balance sheet’ throughout the season of the relative
restrictions on the river and irrigators to ensure there is a demonstrable degree of ‘equity’ in the
restriction regime.
• OWL will produce a report of water usage across the scheme at the end of each irrigation
season, with monthly updates to OEFRAG throughout the season, in order to demonstrate that
water savings are being achieved. Note, the ability to ‘use up’ residual volume (saved by
restrictions) later in the season is restricted by the instantaneous flow rate.
• ECan ensure that affiliated water users retain higher reliability of supply than un-shared (non-
affiliated) water users, during both high and low flow situations.

Opihi River Adaptive Management Regime - September 2017
14
3.4.3 Points of agreement – Abstractors restriction regime for augmented below-dam irrigators
Key points of agreement by the AMWG are as follows
• The restriction regime for augmented below dam irrigators set out in Table 6 is adopted.
• Affiliated irrigators are on 100% restriction at a lake level of RL373m (5% lake storage) rather
than RL370m (0% lake storage) which is in the ORRP. The RL373m cut off reflects the fact that at
that very low level of remaining storage, maintaining the connectivity of the river is paramount
and the remaining 5% should be used solely for that purpose.
• When the lake level is between 5-25% that affiliated irrigators are able to abstract water at a
restricted level in certain critical months (October-January inclusive) even when a ‘Level 2’ flow
regime is imposed.
• If the lake level is forecast to move between bands during the fortnightly period this will be
considered when OEFRAG are determining what flow regime to apply.
Table 6: Agreed irrigation restriction framework for OWL below-dam irrigators
Lake Level Flow regime Volumetric restrictions (%)
Sept Oct Nov Dec Jan Feb Mar Apr May
>385m (50%) Level 1 25 25 25 25 25 25 25 25 25
380-385m (25-50%) Level 1 50 50 25 25 25 25 25 25 25
Level 2 75 75 50 50 50 50 50 50 50
373-380m (5-25%) Level 1 75 50 50 50 50 50 50 25 25
Level 2 100 75 75 75 75 100 100 100 100
<373m (<5%) Level 2 100 100 100 100 100 100 100 100 100
3.4.4 Points of agreement – abstractors restriction regime for above-dam irrigators
Key points of agreement by the AMWG are as follows
• Affiliated above-dam irrigators will continue to be tied to the minimum flows on their tributary
river/stream as set out in their consents. Tributary minimum flows are more restrictive than the
proposed regime for below dam irrigators.
• The restriction regime reflects the greater restrictions imposed on affiliated above-dam
irrigators by these tributary minimum flows.
• Affiliated above-dam irrigators will not be subject to the Level 1 restriction regime if imposed.
• If a Level 2 restriction regime is imposed, affiliated above-dam irrigators will be subject to
restrictions in line with Table 6, except when the lake level is rising in which case the affiliated
above-dam irrigators will be subject to the Level 1 restriction regime.
3.5 Community Supply Restrictions
3.5.1 Background
OWL releases water for affiliated community supplies, formalised through an augmentation
agreement with Timaru District Council (TDC). The largest community water supply scheme is the
Opihi River water supply take for TDC near SYB. Over 35,000m3/day is consented to supply both the
Opihi River Adaptive Management Regime - September 2017
15
Timaru community supply and industry. The ORRP currently allows for lesser restrictions to apply to
specified community water supply schemes at times of water restrictions on abstractors, with a
reduction of 50% of restrictions applying to other abstractors specified.
The default policy in the LWRP, however, states that community water supplies are not tied to
minimum flows provided a water supply strategy has been developed and the water supply is
managed to restrict the use of water from those supplies during periods of low flow.
3.5.2 Points of agreement – abstractors restriction regime for community supplies
Key points of agreement by the AMWG are as follows:
• The current region-wide LWRP policy related to community supplies is sufficient for the Opihi
River system.
• The TDC water supply strategy takes into account the abstraction regime imposed for irrigators
outlined in section 3.4.
• If no water supply strategy is developed by the Timaru District Council, the community supplies
restriction defaults to 50% of the irrigation restrictions, with a ‘floor’ of a 40% restriction.
3.6 Artificial Freshes and flow variability
3.6.1 Background
Artificial freshes are a tool to manage nuisance periphyton, and also have a role in improving river
mouth health (although their application for this purpose it not currently well understood). Freshes
have been trialled in the Opuha/Opihi system in an initial programme in 2004-06 and more recently
since 2013, with varying degrees of success. The 2016 modifications to the downstream weir now
enable a fresh of greater peak flow to be released into the Opuha River and monitoring is showing
significant benefits in terms of periphyton removal.
Knowledge regarding the design and effectiveness of artificial freshes to achieve different goals in
the Opuha and Opihi Rivers is still improving. Key points of current understanding regarding artificial
freshes include:
• Artificial freshes are effective at managing didymo coverage and regrowth in the Opuha River
above Skipton Bridge but this effectiveness reduces downstream.
• For a fresh to effectively manage nuisance periphyton in the lower reaches of the Opihi River, it
must be released to coincide with a natural fresh in the Opihi system.
• The rapidly increasing flows as the fresh arrives at a location are the most effective in terms of
clearing periphyton.
• Whilst short duration freshes can be effective near the dam, longer duration releases allow the
peak flow to be sustained as it travels further downstream. 2 hour minimum duration is required
to maximise effectiveness in the Opuha River as far as the Opihi confluence.
• Artificial freshes can deposit debris along channel margins and in the river mouth lagoon. The
likelihood of this can be minimised by increasing fresh duration and timing freshes to reach the
river mouth on a low/rising tides (approx. 14hr +/- 2hrs. travel time from the dam to the coast).
• In general, artificial freshes are more effective in clearing the mid-channel; and not as effective
on channel margins.
Additional to artificial freshes, flow variability over a number of days may have some further
benefits:

Opihi River Adaptive Management Regime - September 2017
16
• Flow variability can complement artificial freshes by reducing growth rates of periphyton in the
channel margins if these areas are occasionally exposed to air. Pre-fresh exposure is also
thought to increase rates of detachment during freshes, however this is less conclusive than the
effect of exposure on growth.
• Flow variability may have significant benefits for river mouth health.
It is noted, however that excessive short-term flow variability can have negative impacts on river
health. In particular sharp reductions in flow can cause issues.
3.6.2 Points of agreement - Artificial freshes and flow variability
The AMWG have discussed the role of artificial freshes in the OTOP sub-regional plan and the
triggers that could prompt the need for a fresh to be released from the dam. The group have also
provided for flow variability to avoid extended periods at constant low flow.
Key points of agreement by the AMWG are as follows:
• Artificial freshes are provided for through the ‘environmental allocation’ i.e. the amount of
water available between the average monthly flow and the monthly minimum flow.
• The OTOP sub-regional plan prescribes a minimum frequency and magnitude of artificial fresh as
follows:
o Artificial freshes of at least 30 cumecs, for not less than 2 hrs are to be provided no less
than 4 times a year, no fewer than 3 of which are to be in the period 1 November to 31
March every year, except during a Level 2 flow regime.
• Beyond this requirement the OTOP sub-regional plan is enabling of artificial freshes (at a policy
level) but provides flexibility to be able to build knowledge and understanding around the
effectiveness of artificial freshes and adapt over time. A ‘statement of best endeavours’ will sit
outside the plan/consents but will outline the expectations of the flow regime in terms of
freshes and flow variability, e.g.
o One fresh per month is targeted
o That flow variability is linked to catchment inflows/variability
o That flow variability occurs within the operating envelop to meet required average
flows.
o Unnatural extended periods of constant low flow will be avoided
• In determining the need for any artificial fresh, OWL will consult with OEFRAG, taking into
account:
o Cultural health of the river (TBC by Arowhenua Rūnanga)
o Phormidium cover
o General river health (acknowledging freshes are most effective in the Opuha River with
diminishing returns further down the catchment
o The need to open the river mouth
o General river mouth health
o Recreational triggers e.g. start of the white baiting and fishing seasons
o Flood buffering/management
o A natural fresh in the Opihi River allowing the opportunity to maximise fresh
effectiveness downstream
o Operational issues (e.g didymo proliferation abundance of didymo in the Opuha River)

Opihi River Adaptive Management Regime - September 2017
17
• OEFRAG have a role to play in advising on the need for freshes but should not be involved in the
day to day operation of the dam.
• At the beginning of each month, OWL will provide a report to OEFRAG reviewing the previous
month’s operation and will set out the intended strategy for river operation (variable flows and
freshes) for the month ahead in light. All OEFRAG members and Environment Canterbury staff
will be given the opportunity to inform this report by providing information to OWL on any
issues related to the artificial fresh triggers and the anticipated need for an artificial fresh.
During unrestricted and Level 1 water shortage regimes, it is the expectation that OWL will
follow the advice of OEFRAG in determining the need for an artificial fresh release. Unless
significant events unfold during the month, it is expected that this intended operational strategy
will be implemented without the need for further input from OEFRAG.
• There is no expectation for variability / freshes when an Level 2 regime is imposed. While it is
recognised that freshes and variability could be beneficial under this regime, any variability will
be a factor of the conditions at the time and should not be prescribed.
• OWL will develop an Artificial Fresh Safety Plan which will specify the procedure to be followed
leading up to and during a fresh to minimise any risk to people, stock and infrastructure resulting
from an artificial fresh. This Safety Plan will include thresholds based on the fresh magnitude
over which OWL would be required to seek external (ECan duty flood controller) approvals prior
to the fresh being released. The Safety Plan may include different procedures for when freshes
are piggy backed onto natural events (as these may occur at shorter notice, but have lower risks
due to an expectation of increased flows).
• Understanding of the benefits and risks associated with flow variability is less well understood
than artificial freshes. The adaptive management regime provides flexibility for the operational
strategy regarding flow variability to be refined over time with input from OEFRAG.
3.7 Transition between months
3.7.1 Background
The ORRP provides for the progressive increase or decrease of flows when the minimum flows
increase or decrease between months. This smoothing of flows between months ensures fish life
are not left stranded when minimum flows drop from one month to the next. It also provides time
for the gravels to fill and the flows to stabilise when the minimum flows increase between months,
reducing the need to release excess water from the dam to ensure minimum flows are met at a
single point in time.
This transition between minimum flow requirements provided for in the ORRP can occur for a period
of up to 48hrs prior and up to 48hrs after the commencement of the month. This must be with the
agreement of OEFRAG and is subject to ECan being advised in advance in writing of the proposed
transition of flows.
3.7.2 Points of agreement – transition between months
Key points of agreement by the AMWG are as follows:
• The change in instantaneous minimum flow requirements between months is achieved over a
transitional period of 24hrs prior and 24hr after the commencement of the month.

Opihi River Adaptive Management Regime - September 2017
18
3.8 Flood buffering
3.8.1 Background
Lake Opuha is fed by Fox Peak and the Two-thumb Range and can experience very high inflows
resulting in rapid lake level increases. In some circumstances, this requires proactive management
to ensure the lake level does not rise at a rate and to a level that may compromise dam
infrastructure, particularly the downstream weir, or risk flooding the Opuha and Opihi Rivers
downstream of the dam. Downstream weir washouts associated with rain events have caused
extreme flows, sediment release and costly repairs for OWL. When full, Lake Opuha is RL391.2 with
spillway gates allowing a slightly higher level. Under current consent conditions, OWL is not able to
take the lake below RL391.2 except for release of irrigation water and environmental flows.
The ORRP states that on the agreement of OEFRAG, releases of water from Opuha Dam storage may
be made to provide buffering for anticipated flood flows. This is reflected in OWL consent
CRC155950 (condition 8) which states that if OWL forwards a ‘Flood Buffering Proposal’ and written
approval of OEFRAG then releases of water from Opuha Dam storage may be made to provide
buffering for anticipated flood inflows, provided that ECan is advised in writing before any such
releases occur.
3.8.2 Points of agreement – flood buffering
Key points of agreement by the AMWG are as follows:
• Flexibility is provided for adequate or responsive flood buffering based on knowledge of the
presence of significant snowpack in the upper catchment or advance warning of rainfall in the
catchment.
• When the lake is >75% full, flood buffering is at the discretion of OWL
• When the lake is <75% full, OWL will seek OEFRAG endorsement to lower the lake for the
purpose of flood buffering.
• OWL will provide in the monthly report to OEFRAG any anticipated requirement to draw down
the lake for flood buffering, but can also provide ‘mid-monthly’ update reports when
unanticipated situations arise.
3.9 The role of the Opuha Environmental Flow Release Advisory Group (OEFRAG)
AMWG propose that OEFRAG continue to play a fundamental role in managing the proposed river
management regime. A draft Terms of Reference for OEFRAG has been drafted by the AMWG to
outline the function and membership of OEFRAG, and specify procedures to be followed in their
deliberations and operation (see Appendix 4).
The AMWG propose the objectives of OEFRAG are as follows:
1. Through best practice river management, protect the environmental, economic, cultural and
social values of the Opihi River;
2. To utilise lake storage with the purpose of retaining continuity and reliability of supply for
both the river and irrigators;
3. To ensure the best possible information, knowledge and experience is considered when
decisions are made;
4. To consider the interests of all stakeholders in decisions about the Opihi river management
regime;

Opihi River Adaptive Management Regime - September 2017
19
5. To adopt an adaptive approach to decision making where accumulated experience and
knowledge is consistently applied to improve decision making outcomes.
Under these objectives, the key role of OEFRAG is to recommend to Environment Canterbury the
need to impose Level 1 or Level 2 water shortage regimes (as has been explained above). Additional
to this function, it is proposed that OEFRAG also have an advisory/liaison role in terms of the
following:
i. the need for artificial freshes;
ii. the operation of the river system within the prescribed river management regime;
iii. the need to lower the lake for the purpose of flood buffering;
iv. communicating the rationale for any decisions made
As a key aspect of adaptive management involves ‘learning’ the TOR for OEFRAG clearly states the
requirement for diligent recording the information contributing to, and justification for, all decisions.
The TOR also outlines Environment Canterbury’s role in OEFRAG. In order to fully understand the
justification for the recommendations being made by OEFRAG, ECan will be invited to participate in
an observer role. The AMWG propose ECan also have a role in financially supporting OEFRAG by
funding, with prior approval, technical specialists to provide assistance to OEFRAG in their decision
making.
3.10 River health monitoring programme
3.10.1 Background
A range of monitoring currently takes place in the Opuha and Opihi Rivers by OWL, ECan, NIWA and
F&G. The monitoring of most relevance to river health and adaptive management are listed below.
Monitoring by OWL required by their consents:
• Lake level monitoring in Lake Opuha.
• Flow monitoring at North Opuha and South Opuha (lake inflows), Downstream Weir (Opuha)
and Saleyards Bridge (Opihi) sites.
• Dissolved oxygen, temperature and conductivity monitoring at two levels in Lake Opuha.
• Chlorophyll A, total nitrogen and total phosphorus in Lake Opuha
• Turbidity, water temperature, dissolved oxygen, electrical conductivity monitoring at
Downstream Weir (Opuha).
• Power Station Cooling Water and Sump Discharges
• Cross sections and macroinvertebrate sampling in Opuha downstream of Skipton
Additional discretionary monitoring by OWL undertaken to inform better understanding of lake and
river processes affecting river health, and to inform operational decisions (e.g. regarding release of
artificial freshes):
• Detailed periphyton coverage monitoring at Gorge Bridge and Skipton Bridge sites in the Opuha
and Raincliff and Saleyards Bridge sites in the Opihi – fortnightly during summer and monthly
during winter.
• Nutrient and dissolved iron/manganese monitoring at the same sites.
• Dissolved oxygen, conductivity and temperature monitoring at an additional (third) level within
Lake Opuha.
Monitoring by ECan:

Opihi River Adaptive Management Regime - September 2017
20
• Flow and water temperature monitoring at Stoneleigh (South Opuha), Skipton Bridge (Opuha),
Rockwood (Opihi) and SH1 (Opihi).
• Phormidium monitoring at SH1 (Opihi)
• Water level and temperature monitoring at the Opihi Mouth.
Monitoring by NIWA:
• Monthly monitoring at Skipton Bridge (Opuha) and Rockwood (Opihi) as part of the National
River Water Quality Network (NRWQN). This includes nutrient concentrations, water chemistry,
periphyton coverage and other parameters.
Monitoring by F&G:
• Monitoring of river mouth opening during the fishing season.
• Monitoring distribution and size of salmon spawning population and angler catch in the Opihi
catchment annually
• Monitoring juvenile trout summer growth and health at representative sites in the catchment
• At approximately seven-year intervals estimate whole catchment angler effort as an indicator of
long term trends in fishery status and recreational value.
3.10.2 Points of agreement – River monitoring
The AMWG has identified, through the development of an adaptive management regime, the
opportunity to better manage the river in order to get the best environmental outcomes possible.
However data is needed to both inform decisions as well as monitor the effectiveness of any regime.
Key points of agreement by the AMWG are as follows:
• That the level of monitoring currently being undertaken continues
• That additional effort is put into ensuring that the monitoring work is adapted to provide
meaningful assessment of the effectiveness of an adaptive regime and to provide data on which
to determine potential improvements to that regime.
4 Conclusion
The work of the Adaptive Management Working Group (AMWG) is driven by two key goals:
1) To preserve lake storage with the purpose of retaining continuity/reliability of supply for
both the river and irrigators
2) To improve river health
The AMWG believe that incorporating an adaptive management framework into the OTOP Healthy
Catchments Project is the most effective way to achieve these goals. Experience of operating the
dam over the last 18 years, and in particular over the 2014-16 low flow period, has demonstrated
that an adaptive management of the Opuha Dam can likely provide better environmental, economic,
cultural and recreational/amenity outcomes for the Opihi River than the current prescriptive regime
in the ORRP. Throughout its deliberations, the AMWG awarded priority to the environment,
followed by community supplies and then irrigation, consistent with the current ORRP as well as the
Canterbury Water Management Strategy priorities.
While the AMWG seek as much flexibility as possible in the operating regime, the group
acknowledges the need for some prescription to provide legal certainty and comfort to the wider

Opihi River Adaptive Management Regime - September 2017
21
community that there are constraints and boundaries around the operation of the river regime. The
group are, therefore, seeking to develop a regime that balances the need for such certainty while
being adaptive enough to respond to various climatic and river health situations. The AMWG believe
that through a combination of set minimum flows, the alternative ‘water shortage’ minimum flow
and restriction regimes, the open and transparent role of OEFRAG in recommending the imposition
of water shortage regimes, and the prescriptive artificial fresh requirements, that the desired
balance between certainty and flexibility can be achieved.
As noted throughout the Report, there are elements of the AMWG’s proposal that require further
work and refinement. It is the AMWG’s intention to complete the necessary work streams over the
coming 6 months.

Opihi River Adaptive Management Regime - September 2017
22
Appendix 1 Current and proposed flow regime
Flow regime:
ORRP OEFRAG proposed AMWG Proposed
Lake
leve
l
>37
5
Lake
leve
l
37
0-3
75
Lake
leve
l
>38
5
Lake
leve
l
38
0-3
85
Lake
leve
l
<38
5
Min
imu
m F
low
Leve
l 1 w
ater
sho
rtag
e
Leve
l 2 w
ater
sho
rtag
e
Type of minimum flow:
Instantaneous/Average Inst Inst Inst Inst Inst Inst Av Inst Av Inst
Mo
nth
ly m
inim
um
flo
ws
(m3 /s
)
January 3.50 3.35 3.50 3.40 3.40 3.50 4.50 3.00 3.50 2.00
February 3.50 3.35 3.50 3.40 3.40 3.50 4.50 3.00 3.50 2.00
March 7.50 5.35 7.50 6.40 5.40 6.00 7.00 5.00 5.50 2.00
April 8.00 5.60 8.00 8.00 5.60 6.00 7.00 5.00 5.50 2.00
May 4.50 3.85 4.50 4.50 3.90 4.00 4.50 3.50 4.00 2.00
June 4.00 3.60 4.00 4.00 3.60 3.50 4.00 3.00 3.50 2.00
July 4.00 3.60 4.00 4.00 3.60 3.50 4.00 3.00 3.50 2.00
August 4.50 3.85 4.50 4.50 3.90 4.00 4.50 3.50 4.00 2.00
September 6.00 4.60 6.00 5.30 4.60 5.00 6.00 4.00 5.00 2.00
October 8.50 5.85 8.50 7.20 5.90 6.00 8.00 5.00 6.00 2.00
November 7.00 5.10 7.00 6.10 5.10 5.00 7.00 4.00 4.50 2.00
December 6.00 4.60 6.00 5.30 4.60 5.00 6.00 4.00 4.50 2.00
Average 5.59 4.40 5.59 5.18 4.42 5.59 4.42 2.00
Total (m3/s x months) 67.0 52.7 67.0 62.1 53.0 67.0 53.0 24.0
Total volume (M m3) 176 139 176 163 139 176 139 63
Annual volume saving† - 21% - 7% 21% - 21% 64%
† Volume saving as a proportion of total volume under ‘default’ minimum flow scenario
0
1
2
3
4
5
6
7
8
9
Jan Feb Mar Apr May Jun Jul Aug Sep Oct Nov Dec
Min
imu
m f
low
at
Sale
yard
s B
rid
ge (
m3/s
)
ORRP: Lake level > RL375m ORRP: Lake level < RL375m
Proposed: Full availability (average flow) Proposed: Full availability (instantaneous flow)
Proposed: Conservative (average flow) Proposed: Conservative (instantaneous flow)
Proposed: Extreme (instantaneous flow)
Opihi River Adaptive Management Regime - September 2017
23
Appendix 2 Memo: Saleyards Bridge - SH1 Minimum flow
monitoring site
MEMORANDUM To : Opuha Water Ltd Attention : Tony McCormick, Julia Crossman, Craig Moore From : Richard de Joux
Subject : Saleyards Bridge – SH1 Minimum flow monitoring site
Date : 27 June 2017 This memo addresses the benefits and disadvantages of retaining a minimum flow monitoring site for Opuha Water Ltd at the present Saleyards Bridge site (operated by Opuha Water Ltd) or at the SH1 Bridge (present ECan site).
Background
Scarf (2002) provides a summary of the historic management of Opihi River Waters. Historically, the Opihi River at Saleyards Bridge was used by the South Canterbury Catchment Board as the primary minimum flow monitoring site for the Opihi River. In 1973 the Levels Plain Irrigation Scheme was
restricted from taking its full allocation of 3.06 m3/s by agreement with the District Commissioner of Works, whereby the irrigation take was reduced and ultimately ceased based on Opihi River flows at Butlers Road (located upstream of the intake for the Levels Plain Irrigation Scheme). That agreement also instructed the South Canterbury Catchment Board to undertake the necessary investigations into “the long term solution” (of low river flows)
The implementation of the Opihi River Water Management Plan (1984-1990) set the minimum flow site at Saleyards Bridge. The rationale being that even with the known flow loss between that site and the confluence with the Temuka River, there would be sufficient flow to maintain a continuous flow
Prior to the installation of a flow recorder site at Saleyards Bridge by Opuha Water Ltd (January 1998), the flow at that site was either measured by spot gaugings, or calculated using a long term regression of flows with the Opihi at Rockwood and the Opuha at Skipton Bridge1.
1 Both these sites have continuous flow records from 1965. The flow recorder for Tengawai at Cave was
installed in 1982 and was not used in the original regressions.
Opihi River Adaptive Management Regime - September 2017
24
All hydrological modelling for the proposed Opuha Dam was based on maintaining a minimum flow at Saleyards Bridge (which at that time was the primary monitoring site for the Opihi River Water Management Plan). Resource consents granted for the Opuha Dam in May 1995 required the then Opuha Dam Company (now Opuha Water Ltd) to install and operate a continuous flow monitoring site at Saleyards bridge, and to maintain specified minimum flows at Saleyards Bridge.
In 2000, Environment Canterbury adopted the Opihi River Regional Plan (ORRP), which specified minimum flow sites at Saleyards Bridge (for Opuha Dam consents) and at SH1 Bridge (for all other resource consents). With the present review of the ORRP, the question has arisen over the need to have two minimum flow monitoring sites for the main stem of the Opihi River – Saleyards Bridge vs SH1. Scarf (2002) recommended that the flow monitoring site for the Opuha Dam consents should be moved from Saleyards Bridge to SH1, arguing that this would “align the requirements with those stated currently on all “AA” and “AN” consents while reducing the number of monitoring sites within the lower river to a single site”. To achieve this, it will be necessary to analyse the available flow data to obtain a reliable correlation of natural flow between Saleyards Bridge and SH1. Hydrology The flow recorder sited at SH1 Bridge was first installed by ECan in May 1998. Prior to that date there was only limited spot flow gaugings at that site.2 The flow at SH1 was based on a preliminary correlation with the derived Saleyards Bridge flow calculated in 1998 as follows: SH1 = 0.976 x Saleyards Bridge – 842 l/s (Established by Graeme Horrell for ECan, April 1998) The correlation has been used by Environment Canterbury3 to predict “unmodified flow” at SH1 Bridge using the following equation: SH1 = 0.156 x North Opuha + 1.758 x South Opuha + 2.438 x Rockwood – 2535.21l/s
That correlation differs from Scarf (2002), who proposed the following:
SH1 = 1.288 x North Opuha + 0.673 x South Opuha + 2.438 x Rockwood – 2415 l/s While the calculation of an “unmodified flow” is the responsibility of Environment Canterbury, the more relevant challenge for Opuha Water Ltd is to be able to obtain a reliable correlation of natural flow between Saleyards Bridge and SH1.
2 Most flow gaugings in the lower Opihi River were based at the site known as Grassy Banks – which is the point where the lower Opihi usually ceased to flow.
3 Letter dated 4 October 2000 from Frank Stewart, ECan Regional Policy Analyst to Frank Scarf, Fish and Game
Officer.
Opihi River Adaptive Management Regime - September 2017
25
Why Change? Scarf (2002) states (section 5.6) “it appears anomalous that Opuha Dam Company is required to comply with a monthly minimum flow schedule at Saleyards bridge while those affiliated to the Dam Company may only operate while ODL maintain an equivalent minimum flow schedule at SH1. Transferring that requirement to the equivalent at SH1 would simplify management while reducing the number of monitoring sites”. The above statement is incorrect because affiliated consents can only be exercised while Opuha Dam is meeting the specified minimum flows at Saleyards Bridge plus the sum of authorised takes downstream of that point. If Opuha Dam cannot meet that requirement, then affiliated consents revert to the “unmodified flow” at SH1.
The presence of two flow monitoring sites in the lower Opihi is not necessarily a bad thing as it provides a backup if one site is not operational, but can lead to conflict if both sites are not well maintained with current flow ratings. SH1 site is publicly visible. More people pass over the SH1 Bridge than the Opihi at Saleyards Bridge. Although the LPIS abstracts water downstream of Saleyards Bridge, the required flow at Saleyards Bridge equals the minimum flow PLUS the sum of consented “AA”, “BA” and “AN” permits downstream of that location (including LPIS).
Retention of Saleyards Bridge as the monitoring site for Opuha Water Ltd minimum flows Saleyards Bridge site now has the benefit of 19 years continuous flow measurement, and operational releases have been developed to maintain flows at that site. Over that time, Opuha Water Ltd have developed procedures and refined their operations to be able to meet the required minimum flows plus downstream abstractions. Opuha Water Ltd has no control over any abstractions downstream of Saleyards Bridge that are exercised by “AN” consent holders. In addition, Opuha water Ltd does not have any access to water use data for “AN” permits, and therefore cannot be expected to release water for those permits. The existing flow monitoring site at Saleyards Bridge allows Opuha Water to receive flow information at ½ hourly intervals. This enables the required minimum flows and abstractions by “AA” and “BA” consents to be maintained. If the minimum flow monitoring site was shifted to the ECan operated SH1 Bridge site, Opuha Water Ltd would need to be provided with direct access to the flow data. It is understood that ECan only interrogate that site at four hourly intervals, however that frequency should be able to be changed to suit requirements. Operationally, Opuha Water Ltd place a high importance on maintaining the accuracy of the Saleyards Bridge site with regular check flow gaugings. Given its other work commitments, ECan hydrological staff do not (and probably cannot) place any high priority on maintaining the accuracy for the SH1 Bridge flow recorder. It is also worth noting that the present monitoring site at SH1 Bridge is located on the south bank of the river. Surface flow is maintained to that site via an artificially cut channel. The majority of the flow remains in channels to the north side of the river. This reduces the percentage of flow being recorder at the site and results in a lower confidence of the accuracy of the flow data. Operational Impacts of changing sites Shifting the monitoring point further downstream from Saleyards Bridge will add further ‘attenuation’ to the flows which in turn will affect the ability of Opuha Water Ltd to accurately meet a prescribed flow. This is partly due to the extra travel time between the sites (4 to 6 hours depending on flow rate) and partly due to the quite dynamic nature of the surface/groundwater interaction within that stretch of river (there are significant losses to groundwater within the reach).

Opihi River Adaptive Management Regime - September 2017
26
Opuha Water Ltd needs to reduce any unplanned excess releases that result from being required to maintain current minimum flows continuously, and this process has developed over the last 19 years. A change in minimum flow site would require Opuha Water Ltd to carry out “recalibration” trials and to amend their operational procedures to maintain a flow at SH1 rather than Saleyards Bridge. In particular, the downstream impact of large changes in the rate of take at LPIS intake has on the downstream flow would need to be managed. Detailed investigations would also need to be carried out to more accurately define the flow relationship between Saleyards Bridge (minus the LPIS take) and SH1 Bridge. There is sufficient data available to obtain a correlation between the sites, which can then be used to transpose the existing (or proposed) minimum flows at Saleyards Bridge to equivalent flows at SH1 Bridge. The correlation should be carried out in conjunction with Environment Canterbury.
Conclusion and recommendation
The primary reason given by Scarf (2002) to change the minimum flow site from Saleyards Bridge to SH1 Bridge appears to be “a reduction in monitoring sites”. The assertion that those affiliated to the Dam Company may only operate while ODL maintain an equivalent minimum flow schedule at SH1” is incorrect. Based on the information available to date, there is no compelling reason to shift the minimum flow site for Opuha Water Ltd compliance monitoring from Saleyards Bridge to SH1. Opuha Water Ltd owns and operates the Saleyards Bridge recorder site. They place high importance on maintaining the flow rating within the operating range required by resource consent conditions and have direct telemetry communication with that site. Conversely, Environment Canterbury operates the SH1 Bridge site and Opuha Water Ltd do not have direct access to that site for operational requirements. There is no hydrological advantage in moving the monitoring site to SH1 Bridge. Operationally, Opuha Dam Ltd would need to recalibrate their operational releases to meet any equivalent flow downstream at SH1 Bridge. This would also require the development of a flow correlation between the 2 sites in conjunction with Environment Canterbury.
It is my recommendation that the minimum flow site for Opuha Water Ltd is retained at Saleyards Bridge.
References: Environment Canterbury, 2000: Opihi River Regional Plan. Environment Canterbury Report R00/16 ISBN 1- 86937-392-8 September 2000 Scarf, F; 2002: Opihi River Regional Plan Review of Minimum Flows – A discussion document. Environment Canterbury Report U02/79 November 2002 Stewart, F: 2000. Opihi River Regional Plan – Unmodified Flow at SH1. Letter to Frank Scarf, Central South Island Fish and Game Council.

Opihi River Adaptive Management Regime - September 2017
27
Appendix 3 Description of Assessment Factors
The Adaptive Management Regime is based on the availability and use of quantitative and
qualitative information and data to inform decisions on the prudent use of the water stored in Lake
Opuha.
The process of determining whether conditions within the catchment indicate that some
intervention and adaptation of the flow regime is required is based on two tiers of information and
assessment. The primary level is based on an assessment of the likely volume of stored water
available compared with the historical demand for stored water (“Is there going to be enough water
in the catchment behind the dam?”). This assessment requires the calculation of the Potential
Available Volume or PAV and if this calculation suggests there may not be enough water for normal,
full availability supply downstream, then a second level of assessment would be triggered which
looks at other factors such as the current state of the rivers within the catchment and climatic
outlook.
The nature of these various assessment factors is covered in the following sections.
Potential Available Volume (PAV) – the concept
The concept of a Potential Available Volume (PAV) is that it is considered feasible to estimate, at any
particular time, the amount of water that will be available to be released from Lake Opuha over the
next period (say one to three months). It is considered equally feasible to estimate the likely demand
for stored water to be released based on historical averages and trends. If both potential available
volume of water (PAV) and water demand for the period ahead can be estimated with some degree
of confidence, then informed decisions can be made about the likely need for any constraints or
restrictions to be implemented.
While the PAV will be determined based on actual prevailing conditions (discussed below), the water
demand will be based on historical data that includes catchment flows, irrigation demand and lake
releases. From this historical demand information, a series of conservative monthly trigger levels
will be determined that represent the minimum amount of stored water required for full availability
over the next 2-3 month period. If the calculated PAV falls below the trigger level at any time, then a
review of the potential need for an interim, conservative regime of water use will be undertaken by
considering a range of secondary factors.
Calculating PAV
Obviously the main factor determining the amount of water available is the actual lake level and the
resultant volume of water stored. Accurate bathymetric data is available for calculating stored
water volume from measured lake level.
The second factor in determining available water is the expected inflows to the lake over the
immediate future period. There are two drivers for inflows – rainfall and snowpack in the catchment
feeding the lake which is essentially the Two Thumb Range catchment.
For the purposes of determining PAV, potential rainfall is accounted for, in the first instance, by
assuming it will be close to long term average for the particular time of year. This assumption would
be reviewed at the second level of assessment if the PAV calculation identifies a potential shortfall.
Snowpack has been identified as a major influence on the Spring inflows into Lake Opuha. This was
particularly evident in the drought of 2014-15 when, despite the lake being reasonably full in
September, the lack of snowpack and resultant low inflows meant the lake was drawn down rapidly

Opihi River Adaptive Management Regime - September 2017
28
to supply the normal downstream demand through October and November. As part of a national
study by NIWA on the effect of snow melt on hydro storage, it was estimated that around 14% of
Lake Opuha’s annual inflows are derived from snowmelt. It needs to be realised, however, that
most of the snowmelt occurs over the 2-3 months of Spring/early summer so the contribution over
those months can be very significant.
Quantifying snowpack and the potential inflows that will result from snowmelt is complex but OWL
has been engaged with experienced scientists who have adapted computer models they have
developed for other catchments to the Opuha catchment. ECan have also recently commissioned
some further work in this area, primarily to determine the potential impact of climate trends on
snowmelt volumes and OWL has extended this work to refine the ability to measure potential
snowmelt volumes for Opuha. While this development work is currently underway, OWL is using the
snowpack model developed by Aqualinc in 2015 that compares current snowpack (as determined
from actual weather data) with historical averages as measure of the relative amount of snow and
potential snowmelt. To improve the quality of information further, OWL has recently (June 2017)
commissioned snow gauges at both Fox Peak and Dobson skifields.
Figure 1 Example from OWL’s current Snowpack Assessment Model
Table 1. Example of Historical Average Lake Level and Stored Volume (Mm3)
Jan Feb Mar Apr May Jun Jul Aug Sep Oct Nov Dec
Max
Level mRL 392.4 391.9 391.7 391.5 393.0 391.7 392.0 392.0 392.3 391.8 392.2 392.0
% full 110% 106% 105% 103% 110% 105% 107% 107% 110% 105% 109% 108%
Vol (Mm3) 71.8 69.6 68.4 67.6 71.8 68.4 70.4 70.4 71.8 68.9 71.5 70.4
Avg Max
Level mRL 390.2 389.6 388.7 387.0 386.6 387.2 387.9 389.1 389.6 390.4 390.7 390.5
% full 93% 89% 81% 70% 67% 70% 75% 83% 87% 93% 96% 95%
Vol (Mm3) 60.6 58.2 53.1 46.0 43.7 46.1 48.9 54.5 57.1 60.9 62.9 62.1
Average
Level mRL 389.45 388.8 387.3 385.5 385.6 386.3 387.1 388.5 389.1 389.5 390.1 389.8
% full 87% 82% 71% 60% 62% 64% 69% 78% 84% 86% 90% 90%
Vol (Mm3) 57.1 53.9 46.3 39.5 40.5 42.0 45.0 51.0 54.8 56.6 59.2 58.7
Avg Min
Level mRL 388.7 387.9 386.0 384.0 384.8 385.5 386.3 387.6 388.8 388.8 389.4 389.2
% full 82% 76% 62% 51% 55% 59% 64% 72% 80% 81% 85% 85%
Vol (Mm3) 53.9 49.7 40.6 33.3 36.2 38.7 41.8 46.9 52.4 53.1 55.5 55.4
Min
Level mRL 376.9 370.8 370.2 373.0 374.1 373.7 374.7 378.3 380.7 380.1 384.4 382.3
% full 15% 1% 0% 5% 7% 6% 9% 19% 29% 26% 48% 36%
Vol (Mm3) 9.5 0.7 0.2 3.2 4.8 4.2 5.7 12.5 18.7 17.1 31.6 23.8

Opihi River Adaptive Management Regime - September 2017
29
Table 2. Example of Historical Average Monthly Releases from Lake Opuha (Volume Mm3)
Jan Feb Mar Apr May Jun Jul Aug Sep Oct Nov Dec Ave
Max 31.8 18.7 39.8 27.3 35.5 34.6 38.1 46.7 21.6 43.8 47.9 28.4
Min 8.5 11.1 4.7 4.2 4.2 4.0 4.1 4.1 4.3 18.4 17.5 17.1
Avg 18.4 14.2 21.5 14.4 18.4 15.5 15.1 14.0 12.9 28.4 31.4 22.5 18.9
Avg (% of lake storage)
28.1% 21.7% 32.8% 22.0% 28.1% 23.7% 23.1% 21.4% 19.7% 43.4% 48.0% 34.4% 28.9%
Other Assessment Factors
Monthly lake inflows
Lake Opuha is a relatively small storage and is reliant on inflows especially in Spring and early
Summer to maintain sufficient storage for the drier summer/autumn period. As an example, the
historical average volume released from the lake over the Oct-Dec period is 125% of the lake volume
- so good inflows are required over this same period to replenish the storage.
OWL has inflow measurement on the two main feeder rivers (North and South Opuha) and can also
determine daily total inflows from accurate lake level measurement. A database of inflows exists for
the history of the dam.
At any time, current and recent inflows and trends can be compared with long term averages as an
indicator of the ‘wetness’ of the upper catchment and contribute to an understanding of the
medium term outlook. The table below indicates the type of data and analysis that is available
where daily average flow records can be analysed to gain an understanding of typical and extreme
conditions for each month and the nature of the range of historical flows.
Table 3 Example of Historical Average Daily Inflows (cumecs)
Jan Feb Mar Apr May Jun Jul Aug Sep Oct Nov Dec
Max 66.4 73.8 55.7 95.2 56.9 87.2 71.8 28.5 61.7 66.9 48.9 80.0
Avg Max 22.1 22.6 15.7 20.2 22.1 22.0 18.9 13.4 18.8 25.3 19.0 25.2
Average 10.5 6.1 4.7 7.2 7.1 6.2 5.3 5.5 6.8 10.9 10.9 9.2
Avg Min 3.4 2.7 2.4 3.8 3.1 3.1 2.9 3.2 3.6 5.6 7.0 4.8
Min 1.2 1.2 1.1 1.0 1.1 1.4 1.4 1.4 1.0 2.2 3.3 2.0
River connectivity
One of the key drivers for the original development of the Opuha Dam was to address the problem
of the Opihi River running dry during summer with the resultant devastating impact on the in-stream
fisheries and habitat. It was considered essential to maintain the ‘connectivity’ of the river such that
fish did not become stranded in isolated pools and a continuous, fresh flow could be maintained
along the entire river bed.
The critical area where the river is most likely to ‘disconnect,’ if flow in the river is reduced too far, is
just above the confluence with the Temuka River (an area referred to as Grassy Banks). During the
extreme low conditions experienced in early 2015, this area was closely monitored as river flows
were reduced and it was agreed that a minimum flow of two cumecs at Saleyards Bridge would
maintain connectivity in the Lower Opihi above the Temuka confluence.
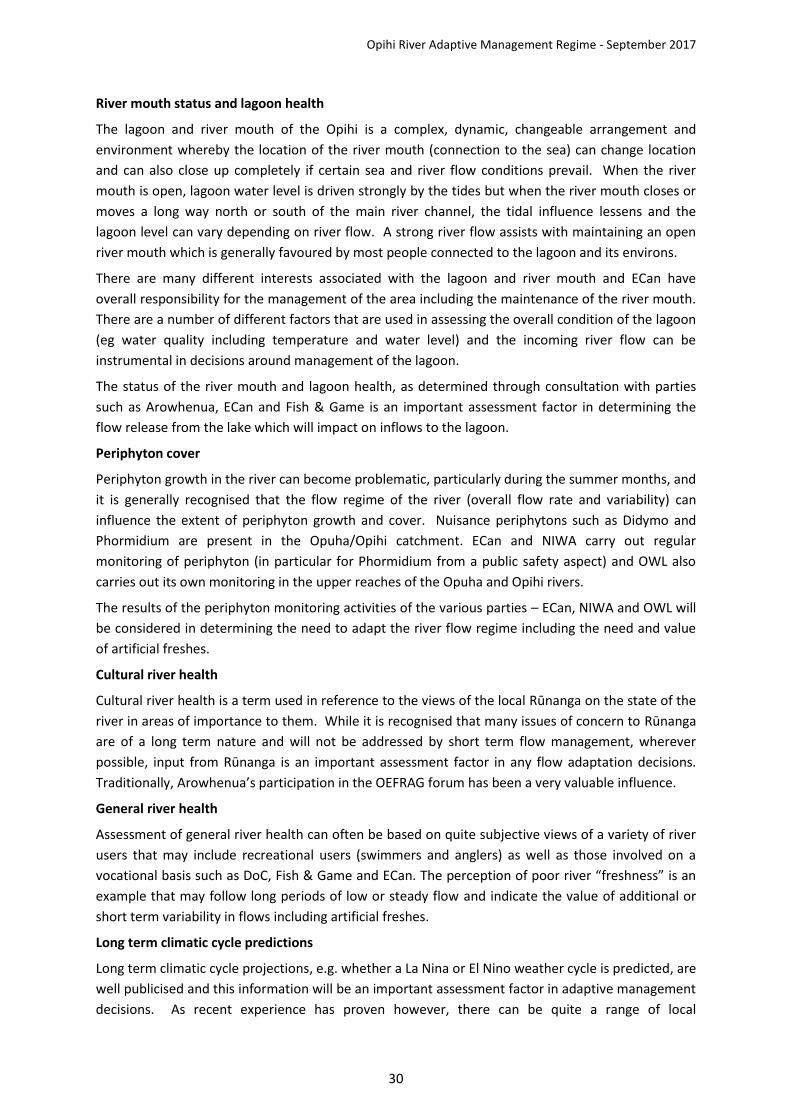
Opihi River Adaptive Management Regime - September 2017
30
River mouth status and lagoon health
The lagoon and river mouth of the Opihi is a complex, dynamic, changeable arrangement and
environment whereby the location of the river mouth (connection to the sea) can change location
and can also close up completely if certain sea and river flow conditions prevail. When the river
mouth is open, lagoon water level is driven strongly by the tides but when the river mouth closes or
moves a long way north or south of the main river channel, the tidal influence lessens and the
lagoon level can vary depending on river flow. A strong river flow assists with maintaining an open
river mouth which is generally favoured by most people connected to the lagoon and its environs.
There are many different interests associated with the lagoon and river mouth and ECan have
overall responsibility for the management of the area including the maintenance of the river mouth.
There are a number of different factors that are used in assessing the overall condition of the lagoon
(eg water quality including temperature and water level) and the incoming river flow can be
instrumental in decisions around management of the lagoon.
The status of the river mouth and lagoon health, as determined through consultation with parties
such as Arowhenua, ECan and Fish & Game is an important assessment factor in determining the
flow release from the lake which will impact on inflows to the lagoon.
Periphyton cover
Periphyton growth in the river can become problematic, particularly during the summer months, and
it is generally recognised that the flow regime of the river (overall flow rate and variability) can
influence the extent of periphyton growth and cover. Nuisance periphytons such as Didymo and
Phormidium are present in the Opuha/Opihi catchment. ECan and NIWA carry out regular
monitoring of periphyton (in particular for Phormidium from a public safety aspect) and OWL also
carries out its own monitoring in the upper reaches of the Opuha and Opihi rivers.
The results of the periphyton monitoring activities of the various parties – ECan, NIWA and OWL will
be considered in determining the need to adapt the river flow regime including the need and value
of artificial freshes.
Cultural river health
Cultural river health is a term used in reference to the views of the local Rūnanga on the state of the
river in areas of importance to them. While it is recognised that many issues of concern to Rūnanga
are of a long term nature and will not be addressed by short term flow management, wherever
possible, input from Rūnanga is an important assessment factor in any flow adaptation decisions.
Traditionally, Arowhenua’s participation in the OEFRAG forum has been a very valuable influence.
General river health
Assessment of general river health can often be based on quite subjective views of a variety of river
users that may include recreational users (swimmers and anglers) as well as those involved on a
vocational basis such as DoC, Fish & Game and ECan. The perception of poor river “freshness” is an
example that may follow long periods of low or steady flow and indicate the value of additional or
short term variability in flows including artificial freshes.
Long term climatic cycle predictions
Long term climatic cycle projections, e.g. whether a La Nina or El Nino weather cycle is predicted, are
well publicised and this information will be an important assessment factor in adaptive management
decisions. As recent experience has proven however, there can be quite a range of local
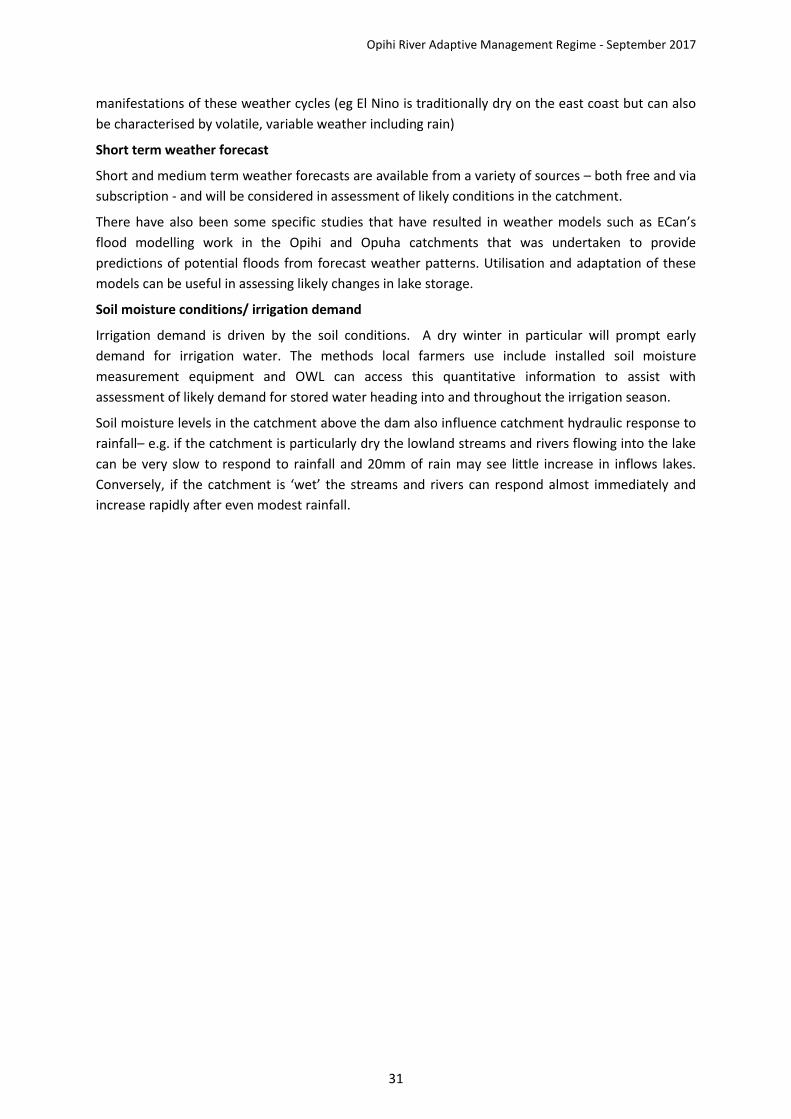
Opihi River Adaptive Management Regime - September 2017
31
manifestations of these weather cycles (eg El Nino is traditionally dry on the east coast but can also
be characterised by volatile, variable weather including rain)
Short term weather forecast
Short and medium term weather forecasts are available from a variety of sources – both free and via
subscription - and will be considered in assessment of likely conditions in the catchment.
There have also been some specific studies that have resulted in weather models such as ECan’s
flood modelling work in the Opihi and Opuha catchments that was undertaken to provide
predictions of potential floods from forecast weather patterns. Utilisation and adaptation of these
models can be useful in assessing likely changes in lake storage.
Soil moisture conditions/ irrigation demand
Irrigation demand is driven by the soil conditions. A dry winter in particular will prompt early
demand for irrigation water. The methods local farmers use include installed soil moisture
measurement equipment and OWL can access this quantitative information to assist with
assessment of likely demand for stored water heading into and throughout the irrigation season.
Soil moisture levels in the catchment above the dam also influence catchment hydraulic response to
rainfall– e.g. if the catchment is particularly dry the lowland streams and rivers flowing into the lake
can be very slow to respond to rainfall and 20mm of rain may see little increase in inflows lakes.
Conversely, if the catchment is ‘wet’ the streams and rivers can respond almost immediately and
increase rapidly after even modest rainfall.

Opihi River Adaptive Management Regime - September 2017
32
Appendix 4 Opuha Environmental Flow Release Advisory Group
(OEFRAG) Terms of Reference
1. Introduction
1.1 Section 14 of the Land and Water Regional Plan contains the policies and rules developed
specifically for the Orari-Temuka-Opihi-Pareora Zone. This ‘OTOP sub-regional plan’ sets
out a minimum flow regime for the Opihi River Catchment. It also specifies a 2-level water
shortage regime which includes restrictions for irrigators and community supplies as well
as alternative minimum flow requirements. This tiered regime recognises that there are a
number of factors influencing water availability and storage capacity and a single flow
regime for the Opihi River is not sufficient for such a dynamic system.
1.2 In accordance with the OTOP sub-regional plan, Opuha Water Ltd hold resource consents
….. to operate the Opuha Dam and Downstream weir in accordance with this 3-tiered
regime…to be developed further as OTOP sub-regional plan develops.
1.3 The OTOP sub-regional plan also establishes the Opuha Environmental Flow Release
Advisory Group (OEFRAG), and defines OEFRAG as the group to make the
recommendations to Environment Canterbury on the movement between river
management regimes for the Opihi River, in times of water shortage. OEFRAG also has an
oversight role…to be developed further as OTOP sub-regional plan develops.
1.4 To describe how OEFRAG fits legislatively and into the planning framework.
2. Purpose and objectives of this Terms of Reference (TOR)
2.1 The purpose of this TOR is to outline the function and membership of OEFRAG, and specify
procedures to be followed in their deliberations and operation.
2.2 Nothing in this TOR shall affect the statutory rights and/or obligations of any party to this
TOR, including those rights and/or obligations set out in resource consents.
3. The objectives of OEFRAG are:
3.1 Through best practice river management, protect the environmental, economic, cultural
and social values of the Opuha and Opihi Rivers;
3.2 To utilise lake storage with the purpose of retaining continuity and reliability of supply for
both the river and irrigators;
3.3 To ensure the best possible information, knowledge and experience is considered when
decisions are made;

Opihi River Adaptive Management Regime - September 2017
33
3.4 To consider the interests of all stakeholders in decisions about the Opihi River
management regime;
3.5 To adopt an adaptive approach to decision making where accumulating experience and
knowledge is consistently applied improve decision making outcomes.
4. The Functions of OEFRAG
OEFRAG shall have the following functions:
4.1 To make recommendations to Environment Canterbury, on the need to impose Level 1 or
Level 2 water shortage regimes set in the OTOP sub-regional plan, and in consents held by
Opuha Water Ltd or affiliated water users (see clause 6);
4.2 To advise OWL on the need for artificial freshes, guided by the triggers set out in the OTOP
sub-regional plan (see clause 7);
4.3. To monitor the operation of the river system within the prescribed river management
regime;
4.4 To endorse recommendations by OWL to lower the level of Lake Opuha for the purpose of
flood buffering;
4.5 To record, in an annual report, the decisions and the justification and information relevant
to all decisions on lake and river management so that, over time, the accumulated
knowledge and experience can be applied to improve decision making outcomes.
5. Parties involved
5.1 The membership of OEFRAG shall include representative(s) from each of the following
Parties:
Te Rūnanga o Arowhenua
Central South Island Fish and Game Council (CSIF&G)
Department of Conservation (DOC), Geraldine District
Opuha Water Ltd (OWL), management
Opuha Water Ltd (OWL), Board representative
Timaru District Council (TDC) – water user / community water supply
Mackenzie District Council (MDC) – lake and river amenity [TBC]
5.2 While each party may have more than one representative, with the exception of OWL, only
one person for each party may vote. OWL management and the OWL Board representative
shall each have one vote.
5.3 Each of the Parties is obligated to inform OEFRAG of any changes in representation.
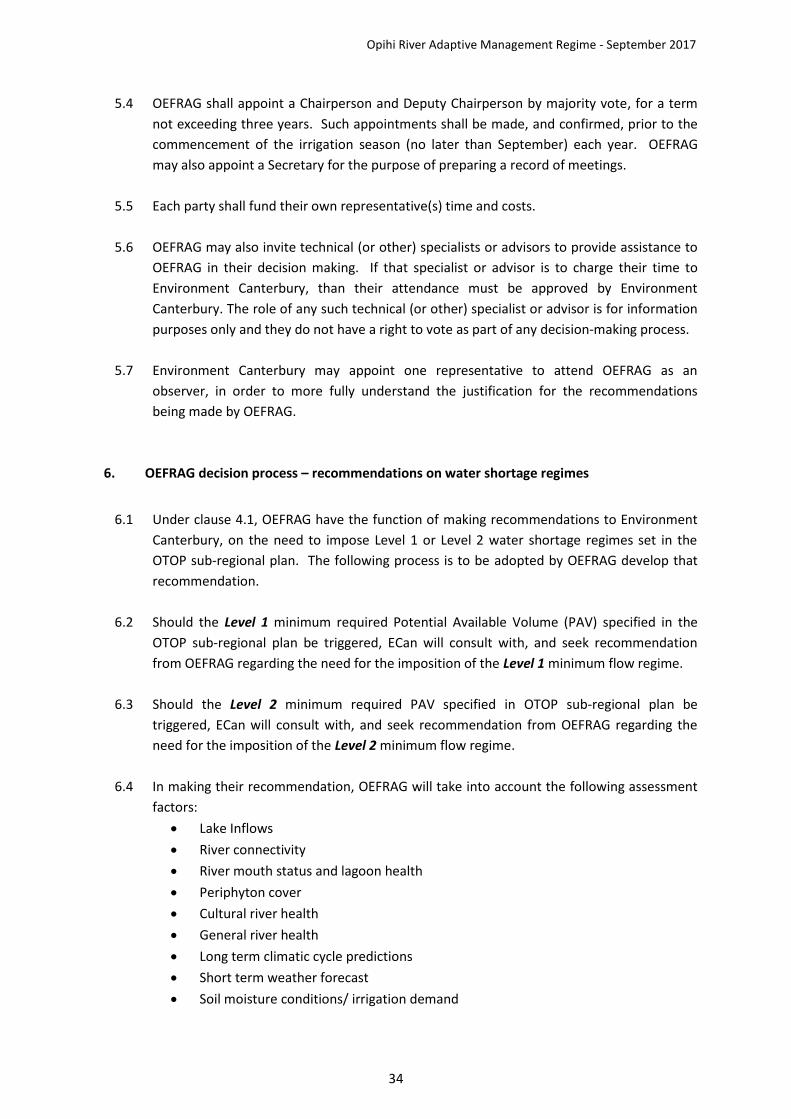
Opihi River Adaptive Management Regime - September 2017
34
5.4 OEFRAG shall appoint a Chairperson and Deputy Chairperson by majority vote, for a term
not exceeding three years. Such appointments shall be made, and confirmed, prior to the
commencement of the irrigation season (no later than September) each year. OEFRAG
may also appoint a Secretary for the purpose of preparing a record of meetings.
5.5 Each party shall fund their own representative(s) time and costs.
5.6 OEFRAG may also invite technical (or other) specialists or advisors to provide assistance to
OEFRAG in their decision making. If that specialist or advisor is to charge their time to
Environment Canterbury, than their attendance must be approved by Environment
Canterbury. The role of any such technical (or other) specialist or advisor is for information
purposes only and they do not have a right to vote as part of any decision‐making process.
5.7 Environment Canterbury may appoint one representative to attend OEFRAG as an
observer, in order to more fully understand the justification for the recommendations
being made by OEFRAG.
6. OEFRAG decision process – recommendations on water shortage regimes
6.1 Under clause 4.1, OEFRAG have the function of making recommendations to Environment
Canterbury, on the need to impose Level 1 or Level 2 water shortage regimes set in the
OTOP sub-regional plan. The following process is to be adopted by OEFRAG develop that
recommendation.
6.2 Should the Level 1 minimum required Potential Available Volume (PAV) specified in the
OTOP sub-regional plan be triggered, ECan will consult with, and seek recommendation
from OEFRAG regarding the need for the imposition of the Level 1 minimum flow regime.
6.3 Should the Level 2 minimum required PAV specified in OTOP sub-regional plan be
triggered, ECan will consult with, and seek recommendation from OEFRAG regarding the
need for the imposition of the Level 2 minimum flow regime.
6.4 In making their recommendation, OEFRAG will take into account the following assessment
factors:
• Lake Inflows
• River connectivity
• River mouth status and lagoon health
• Periphyton cover
• Cultural river health
• General river health
• Long term climatic cycle predictions
• Short term weather forecast
• Soil moisture conditions/ irrigation demand

Opihi River Adaptive Management Regime - September 2017
35
This list of factors does not preclude other matters being considered if judged relevant
by the group.
6.5 OEFRAG members must gather relevant information and be prepared to contribute their
knowledge on the state of these Assessment Factors at any meeting convened. Where
practical, this information shall be circulated around the group in advance of any OEFRAG
meeting. The group shall also consider relevant information provided by Environment
Canterbury and/or Government Agencies.
6.6 While any Level 1 or Level 2 regime is in place, ECan will review the decision and consult
with OEFRAG fortnightly.
6.7 The Chairperson, or any person delegated by the Chairperson, will forward any
recommendation of OEFRAG to the Chief Executive of Environment Canterbury or any
person within Environment Canterbury delegated to make the final decision.
6.7 ECan will retain ultimate decision making authority.
7. OEFRAG advisory role – artificial freshes
7.1 Under clause 4.2, OEFRAG have the function of advising OWL on the need for artificial
freshes.
7.2 The OTOP sub-regional plan prescribes a minimum frequency and magnitude of artificial
fresh.
• Artificial freshes of at least 30 cumecs, for not less than 2 hrs are to be provided no
less than 4 times a year, no fewer than 3 of which are to be in the period 1
November to 31 March every year, except during a Level 2 flow regime.
7.3 Beyond this formal plan requirement the OTOP sub-regional plan is enabling of artificial
freshes but provides flexibility to be able to build knowledge and understanding around the
effectiveness of artificial freshes and adapt over time. A ‘statement of best endeavours’
outlines the expectations of the flow regime in terms of freshes and flow variability:
• One fresh per month is targeted
• That flow variability is linked to catchment inflows/variability
• That flow variability occurs within the operating envelop to meet required average
flows.
7.4 In determining when artificial freshes should occur, OWL will consult with OEFRAG, taking
into account:
• Cultural health of the river (TBC by Arowhenua Rūnanga)
• Phormidium cover
• General river health (acknowledging freshes are most effective in the Opuha River
with diminishing returns further down the catchment
• The need to open the river mouth

Opihi River Adaptive Management Regime - September 2017
36
• General river mouth health
• Recreational triggers e.g. start of the white baiting and fishing seasons
• Flood buffering/management
• A natural fresh in the Opihi River allowing the opportunity to maximise fresh
effectiveness downstream
• Operational issues (e.g didymo proliferation abundance of didymo in the Opuha
River)
7.5 At the beginning of each month, OWL will provide a report to OEFRAG reviewing the
previous month’s operation and will set out the intended strategy for river operation
(variable flows and freshes) for the month ahead in light. All OEFRAG members and
Environment Canterbury staff will be given the opportunity to inform this report by
providing information to OWL on any issues related to the artificial fresh triggers and the
anticipated need for an artificial fresh. During unrestricted and Level 1 water shortage
regimes, it is the expectation that OWL will follow the advice of OEFRAG in determining the
need for an artificial fresh release. Unless significant events unfold during the month, it is
expected that this intended operational strategy will be implemented without the need for
further input from OEFRAG.
7.6 There is no expectation for variability / freshes when a Level 2 regime is imposed. While it
is recognised that freshes and variability could be beneficial under this regime, any
variability will be a factor of the conditions at the time and should not be prescribed.
8. Decision procedures
8.1 All decisions, factors influencing decisions, key decision points, and all actions shall be
recorded. Upon request, a member’s dissenting views may be recorded.
8.2 Meetings4 will be held at such times and places as OEFRAG or the Chairperson of the Group
decides.
8.3 At any meeting, a quorum will consist of 5 members (assuming OEFRAG has 7 members). A
quorum must include either the Chairperson or Deputy Chairperson. An effort will be
made to ensure reasonable representation of members are available for each meeting.
8.4 Any OEFRAG member may exercise the right to vote by being represented by a deputy or
via proxy. A deputy for an OEFRAG member is entitled to attend and be heard at a meeting
as if the deputy were the member. A proxy will require the pending absentee to make
contact with an OEFRAG member prior to the meeting and make their views and voting
4 A meeting may be held in person or in attendance via teleconference, video links or other electronic forum including email exchange.

Opihi River Adaptive Management Regime - September 2017
37
preference clear. They may also delegate their proxy to vote as the proxy determines at
the meeting.
8.5 The need to follow up after meeting with absent members shall be at the discretion of the
Chairperson.
8.6 Every decision at any meeting shall preferably be determined by consensus decision-
making. Where a consensus cannot be reached, a decision supported by majority vote of
no more than one dissenting vote will apply, otherwise the status quo shall be maintained.
9. Duties and responsibilities of a member
9.1 The following duties and responsibilities are intended to aid members by providing them
with a common set of principles for appropriate conduct and behaviour and serves to
protect OEFRAG and its members.
9.2 OEFRAG members should have a commitment to work in the best interests of the
community as a whole.
9.3 Members are expected to make every effort to attend all the Group’s meetings and devote
sufficient time to become familiar with the affairs of the Group and the wider environment
within which it operates.
9.4 OEFRAG will not accept any liability for costs incurred or actions undertaken by any party in
their capacity as an OEFRAG member, and/or on behalf of OEFRAG, except with the prior
approval of OEFRAG.
9.5 Members will:
• be diligent, prepared and participate
• be respectful and supportive
• not denigrate or harm the image of OEFRAG.
9.6 The Group as a whole will:
• ensure that the independent views of members are given due weight and
consideration
• ensure fair and full participation of members
• regularly review its own performance
• adhere to the notion of ‘collective responsibility’, where all individuals will
publically support the decision of OEFRAG even if they are individually opposed
to the decision.
10. Media and public comment

Opihi River Adaptive Management Regime - September 2017
38
10.1 Releases to the media or public relating to OEFRAG activities are to occur only via the
Chairperson, or any person delegated by the Chairperson
11. Succession
11.1 It is the responsibility of each of the Parties represented in OEFRAG to manage their own
succession planning.
11.2 Parties are encouraged to take into account the benefits of continuity of membership in
appointed their representative, and to allow for a transitional period should a new
representative be appointed.
12. Dispute Resolution
12.1 In the event that a matter cannot be resolved by agreement within these TOR, the matter
may be referred to ECan as the regulating authority to make a determination providing
such is within their authority.
13. TOR Amendments and Review
13.1 If required, any OEFRAG member may recommend changes to this TOR, for the group’s
consideration.
13.2 This TOR must be reviewed at least every five years in consultation with the parties listed
in clause 5.1
13.3 Any amendment to the TOR must be recommended to ECan for approval.