proposed modifications to api 581 risk …...proposed modifications to api 581 risk-based inspection...
TRANSCRIPT

PROPOSED MODIFICATIONS TO API 581 RISK-BASED INSPECTION TECHNOLOGY
EVOLUTIONS PROPOSEES POUR L' API 581 «TECHNOLOGIE RBI »
P. Henry and D. A. Osage The Equity Engineering Group, Inc., Shaker Heights, Ohio USA
ABSTRACT
The application of Risk Based Inspection (RBI) has increased significantly over the last decade. The American Petroleum Institute (API) provides two documents pertaining to risk-based inspection (RBI). API Recommended Practice (RP) 580, “Risk-based Inspection”, provides the minimum requirements and the corresponding basic elements for developing and implementing an RBI program to establish inspection plans for fixed equipment. API RP 581, “Risk-Based Inspection Technology”, provides specific details and quantitative calculation procedures for establishment of inspection plans for fixed equipment that are in compliance with all requirements and basic elements defined in API RP 580. The 2nd Edition of API RP 581 is currently being revised and balloted by a task force set up underneath the API Subcommittee on Inspection (SCI). Significant improvements to the document are being proposed including improvements to the calculation of probability of failure, implementation of ISO-risk plotting and modifications to the atmospheric tank module. These improvements will be published in the 3rd Edition of API RP 581, currently scheduled for early 2014. An overview of the current state-of-the-art in API 581 is provided together with a discussion on additional proposed changes that are being implemented to further improve the methodology.
RESUME
La mise en place d'inspections basées sur des analyses de risque (Risk Based Inspection - RBI) s'est accrue de manière significative dans la dernière décennie. L'American Petroleum Institute (API) propose 2 documents traitant de ce sujet. Le document API Recommended Practice (RP) 580, “Risk-based Inspection”, décrit les exigences minimum à respecter et fournit les éléments de base pour établir et mettre en œuvre un programme RBI pour l'établissement de plans d'inspection pour les équipements fixes. Le document API RP 581, “Risk-Based Inspection Technology”, détaille ces exigences et fournit des procédures quantitatives pour les équipements fixes en adéquation avec les principes exposés dans l'API RP 580. La deuxième édition de l'API RP 581 est en cours de révision et d'approbation par une taskforce qui dépend du Sous-comité Inspection (SCI) de l'API. Des améliorations significatives sont proposées dont des améliorations pour le calcul de la probabilité de ruine, une représentation graphique iso-risque et des modifications dans le module traitant des réservoirs de stockage sous pression atmosphérique. Ces améliorations seront publiées dans la troisième édition de l'API RP 581 dont la parution est prévue début 2014. Une revue de l'état de l'art dans l'API 581 est proposée ainsi qu'une discussion sur les révisions en cours d'incorporation pour encore améliorer la méthodologie.
1
Copyri
ght ©
2013
E²G
| The
Equ
ity E
ngine
ering
Grou
p, Inc
. All R
ights
Reserv
ed.
INTRODUCTION
The API Risk-Based Inspection (API RBI) methodology may be used to manage the overall risk of a plant by focusing inspection efforts on the process equipment with the highest risk. API RBI provides the basis for making informed decisions on inspection frequency, the extent of inspection, and the most suitable type of NDE. In most processing plants, a large percent of the total unit risk will be concentrated in a relatively small percent of the equipment items. These potential high-risk components may require greater attention, perhaps through a revised inspection plan. The cost of the increased inspection effort may sometimes be offset by reducing excessive inspection efforts in the areas identified as having lower risk.
API 580 [1] provides guidance on developing a risk-based inspection program for fixed equipment and piping in the hydrocarbon and chemical process industries. API 581 provides quantitative RBI methods and step-by step procedures to establish an inspection program. A complete re-write of API 581 [2] as an API Recommended Practice was published as the 2nd Edition in December 2008 to capture new technology that was developed by the API JIP, to provide a logical step-by-step procedure that enables practitioners to better understand the methodology, and to make the technology clear to facilitate an effective peer review. The title of the document was changed to API RBI Technology to emphasize the fact that significant technology, including industry best practices, is required to effectively implement an RBI program.
Coincident with the publication of the second edition was the completion of the API JIP. Future technical development including the publication of new editions is now the responsibility of the API 581 task force which was formed in 2008 and is part of the API Subcommittee on Inspection (SCI). Future changes will be balloted and voted on by industry members in accordance with the API/ANSI consensus process within the API 581 task force.
The third edition of API 581 is targeted for publication during 2014 and the purpose of this paper is to update the reader with the most important changes being incorporated into the methodology. A complete list of changes being incorporated into the third edition is summarized in Table 1.
API 581 presents the API RBI methodology in a three part volume: • Part 1 – Inspection Planning Using API RBI Technology • Part 2 – Determination of Probability of Failure in an API RBI Assessment • Part 3 – Consequence Analysis in an API RBI Assessment
The calculation of risk in API RBI involves the determination of a probability of failure (POF) combined with the consequence of failure (COF). For pressurized equipment, failure in API RBI is defined as a loss of containment from the pressure boundary resulting in leakage to the atmosphere or rupture of a pressurized component. As damage accumulates in a pressurized component during in-service operation the risk increases. At some point, a risk tolerance or risk target is exceeded and an inspection is recommended of sufficient effectiveness to better quantify the damage state of the component. The inspection action itself does not reduce the risk; however, it does allow better quantification of the damage present in the component, thereby reducing the amount of uncertainty used in calculation of the POF.
In API RBI, a component is defined as any part that is designed and fabricated to a recognized code or standard. For example, a pressure vessel or atmospheric tank may consist of multiple components (cylindrical shell sections, formed heads, nozzles, tank shell courses, tank bottom plate, etc.). Equipment is defined as an assemblage of components.
2
Copyri
ght ©
2013
E²G
| The
Equ
ity E
ngine
ering
Grou
p, Inc
. All R
ights
Reserv
ed.

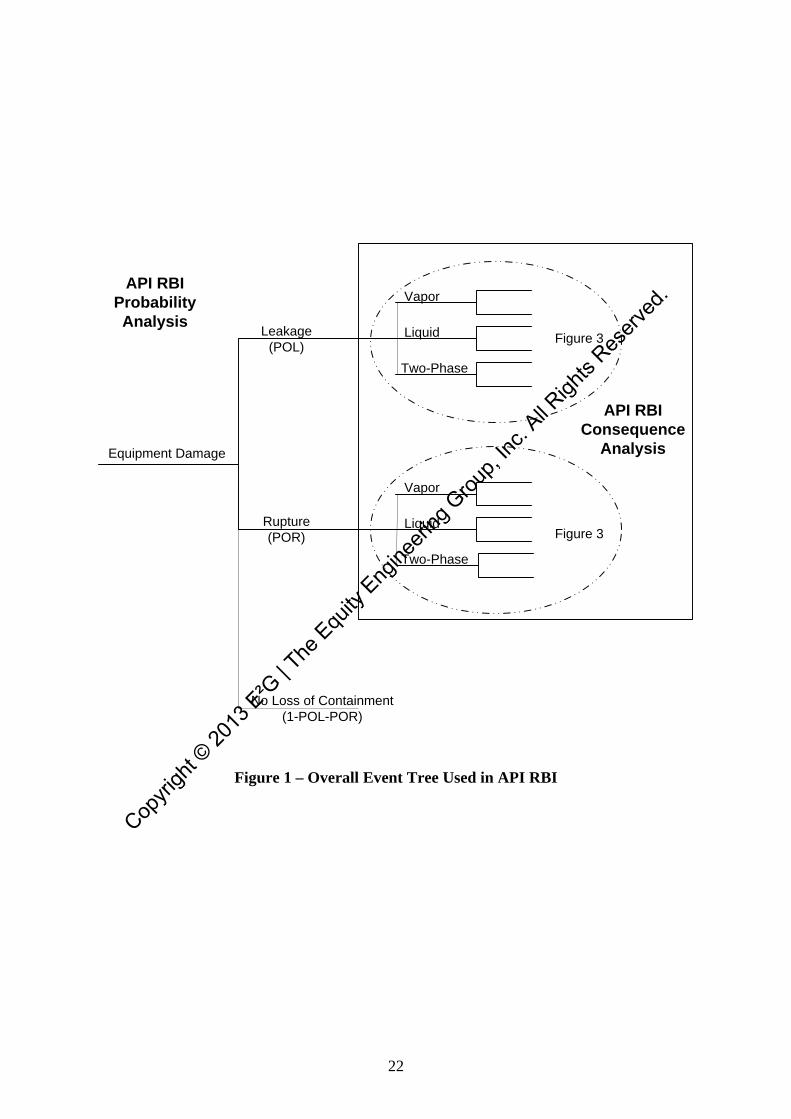
An overall event tree for the API RBI methodology is presented in Figure 1. This figure illustrates how the probability of loss of containment from in-service process equipment and the consequence analysis portions of API RBI fits within the overall RBI methodology. Probabilities of loss of containment are a function of the generic failure frequencies for particular components and the calculated damage state (damage factors) of the component being evaluated.
PROBABILITY OF FAILURE
The probability of failure used in API RBI is computed from Equation (1).
( ) ( )f total f MSP t gff D t F= ⋅ ⋅ (1)
In this equation, the probability of failure, ( )fP t , is determined as the product of a generic failure frequency , totalgff , a damage factor, ( )fD t , and a management systems factor, MSF .
The generic failure frequency for different component types was set at a value representative of the refining and petrochemical industry’s failure data. The generic failure frequency is intended to be the failure frequency prior to any specific damage occurring from exposure to the operating environment, and are provided for several discrete hole sizes for various types of processing equipment (i.e. process vessels, drums, towers, piping systems, tankage, etc.). Discrete hole sizes and an associated failure frequency are introduced into the assessment to model release scenarios as part of the consequence of failure calcualtions. API RBI use four hole size to model the release scenarios covering a full range events (i.e. small leak to rupture).
Adjustment factors are applied to the generic failure frequencies to reflect departures from the industry data to account for damage mechanisms specific to the components’ operating environment and to account for reliability management practices within a plant. The damage factor is determined based on the applicable damage mechanisms (local and general corrosion, cracking, creep, etc.) relevant to the materials of construction and the process service, the physical condition of the component, and the inspection techniques used to quantify damage. The damage factor modifies the industry generic failure frequency and makes it specific to the component under evaluation.
The management systems adjustment factor, MSF , accounts for the influence of the facility’s management system on the mechanical integrity of the plant equipment. This factor accounts for the probability that accumulating damage which results in loss of containment will be discovered in time and is inversely proportional to the quality of a facility’s mechanical integrity program. This factor is derived from the results of an evaluation of a facilities or operating unit’s management systems that affect plant risk.
The damage factor is applied on a component and damage mechanism specific basis while the management systems factor is applied equally to all equipment within a plant. Damage factors with a value greater than 1.0 will increase the probability of failure, and those with a value less than 1.0 will decrease it. Both adjustment factors are always positive numbers.
Damage factors do not provide a definitive Fitness-For-Service assessment of the component. The basic function of the damage factor is to statistically evaluate the amount of damage that may be present as a function of time in service and the effectiveness of an inspection activity to quantify that damage.
Methods for determining damage factors appear in API 581 for the following damage mechanisms:
3
Copyri
ght ©
2013
E²G
| The
Equ
ity E
ngine
ering
Grou
p, Inc
. All R
ights
Reserv
ed.

• Thinning – thinfD
• Component Linings – elinfD
• External Damage (corrosion and stress corrosion cracking) – extdfD
• Stress Corrosion Cracking (internal) – sccfD
• High Temperature Hydrogen Attack – hthafD
• Mechanical Fatigue (Piping Only) – mfatfD
• Brittle Fracture – britfD
If more than one damage mechanism is present, then the principal of superposition, with a special modification for general thinning and external damage, and component linings, is used to determine a total damage factor in accordance with Equation (2).
min ,thin elin extd scc htha brit mfatf total f f f f f f fD D D D D D D D− = + + + + + (2)
In the 3rd edition of API 581, the damage factor calculation for thinning, thinfD , is being modified in
several ways. The documentation of the existing method is being modified to give the reader more background into the development of the methodology and to provide an analysis procedure to illustrate how the damage factors are determined. Additionally, a Level 2 method is being implemented based on a new structural reliability limit state equation which provides a Remaining Strength Factor (RSF) approach and will tie it more directly to the API 579 [8] Fitness for Service methodology.
CONSEQUENCE OF FAILURE
General
Loss of containment of hazardous fluids from pressurized processing equipment may result in damage to surrounding equipment, serious injury to personnel, production losses, and undesirable environmental impacts. In API RBI, the consequences of loss of containment are determined using well established consequence analysis techniques [3], [4], [5] and are expressed as an affected impact area or in financial terms. Impact areas from such event outcomes as pool fires, flash fires, fireballs, jet fires and vapor cloud explosion (VCEs) are quantified based on the effects of thermal radiation and overpressure on surrounding equipment and personnel. Additionally, cloud dispersion analysis methods are used to quantify the magnitude of flammable releases and to determine the extent and duration of personnel exposure to toxic releases. Event trees are utilized to assess the probability of each of the various event outcomes and to provide a mechanism for probability-weighting the loss of containment consequences.
An overview of the API RBI consequence analysis methodology is provided in Figure 2. Methodologies for two levels of consequence analysis are provided in API RBI. A Level 1 consequence analysis provides a simplistic method to estimate the consequence area based on lookup tables for a limited number of generic or reference hazardous fluids. A Level 2 consequence analysis methodology has been added to API 581 that is more rigorous in that it incorporates a detailed calculation procedure that can be applied to a wider range of hazardous fluids.
Level 1 Consequence Analysis
API 581 [2] provides a simple but effective method for evaluating the consequences of hazardous
4
Copyri
ght ©
2013
E²G
| The
Equ
ity E
ngine
ering
Grou
p, Inc
. All R
ights
Reserv
ed.
releases for a limited number of reference fluids. The available reference fluids are shown in Table 2. A reference fluid is selected from Table 2 that closely matches the normal boiling point (NBP) and molecular weight (MW) of the actual fluid contained within the process equipment. The consequence area is then determined from a simple polynomial expression that is a function of the release magnitude.
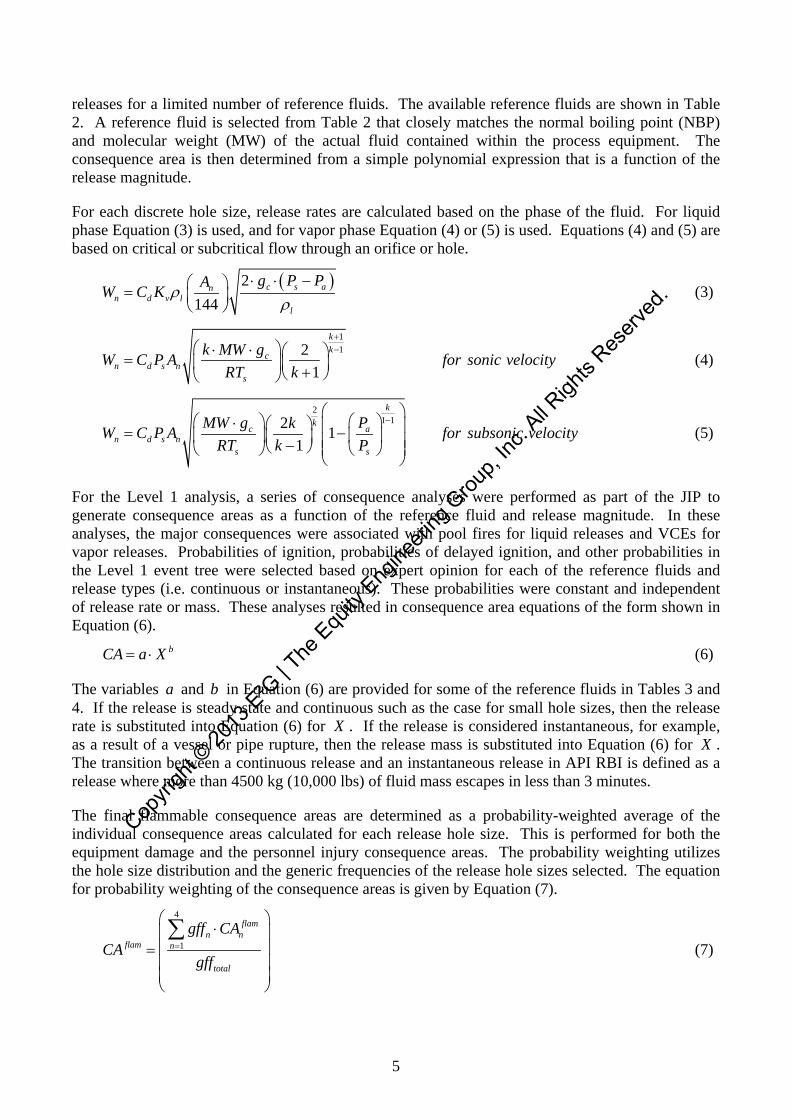
For each discrete hole size, release rates are calculated based on the phase of the fluid. For liquid phase Equation (3) is used, and for vapor phase Equation (4) or (5) is used. Equations (4) and (5) are based on critical or subcritical flow through an orifice or hole.
( )2144
c s ann d v l
l
g P PAW C K ρρ
⋅ ⋅ − =
(3)
112
1
kk
cn d s n
s
k MW gW C P A for sonic velocityRT k
+− ⋅ ⋅ = +
(4)
21 12 1
1
k
kc a
n d s ns s
MW g PkW C P A for subsonic velocityRT k P
−
⋅ = − −
(5)
For the Level 1 analysis, a series of consequence analyses were performed as part of the JIP to generate consequence areas as a function of the reference fluid and release magnitude. In these analyses, the major consequences were associated with pool fires for liquid releases and VCEs for vapor releases. Probabilities of ignition, probabilities of delayed ignition, and other probabilities in the Level 1 event tree were selected based on expert opinion for each of the reference fluids and release types (i.e. continuous or instantaneous). These probabilities were constant and independent of release rate or mass. These analyses resulted in consequence area equations of the form shown in Equation (6).
bCA a X= ⋅ (6)
The variables a and b in Equation (6) are provided for some of the reference fluids in Tables 3 and 4. If the release is steady state and continuous such as the case for small hole sizes, then the release rate is substituted into Equation (6) for X . If the release is considered instantaneous, for example, as a result of a vessel or pipe rupture, then the release mass is substituted into Equation (6) for X . The transition between a continuous release and an instantaneous release in API RBI is defined as a release where more than 4500 kg (10,000 lbs) of fluid mass escapes in less than 3 minutes.
The final flammable consequence areas are determined as a probability-weighted average of the individual consequence areas calculated for each release hole size. This is performed for both the equipment damage and the personnel injury consequence areas. The probability weighting utilizes the hole size distribution and the generic frequencies of the release hole sizes selected. The equation for probability weighting of the consequence areas is given by Equation (7).
4
1
flamn n
flam n
total
gff CACA
gff=
⋅ =
∑ (7)
5
Copyri
ght ©
2013
E²G
| The
Equ
ity E
ngine
ering
Grou
p, Inc
. All R
ights
Reserv
ed.

The total generic failure frequency, totalgff , in the above equation is determined using Equation (8).
4
1total n
ngff gff
=
=∑ (8)
The Level 1 consequence analysis procedure is a simple but effective method for approximating the consequence area of a hazardous release. The only inputs required are basic fluid properties (such as MW, density and ideal gas specific heat ratio, k) and operating conditions. A calculation of the release rate or the available mass in the inventory group (i.e. the inventory of attached equipment that contributes fluid mass to a leaking equipment item) is also required. Once these terms are known, the consequence area is determined from Equations (6) and (7).
A similar procedure is used for determining the consequences associated with releases of toxic chemicals such as H2S, ammonia or chlorine. Toxic impact areas are based on probit equations and can be assessed whether the stream is pure or a percentage of a hydrocarbon stream.
One of the main limitations of the Level 1 consequence analysis is that it can only be used in cases where the fluid in the component can be represented by one of the reference fluids. The Level 1 consequence analysis has been used in the refining industry over the past 15 years. However, as international interest has grown in API RBI in the refining and petrochemical industries, as well as in the chemical industries, it became apparent that the limited number of reference fluids available in the consequence area tables was not sufficient. As a result, the Level 2 analysis was developed to calculate consequence areas for releases of hazardous fluids using a more rigorous approach. The Level 2 analysis also resolves inconsistencies in the Level 1 analysis related to release type and event probabilities.
Level 2 Consequence Analysis
A detailed calculation procedure is provided for determining the consequences of loss of containment of hazardous fluids from pressurized equipment. The Level 2 consequence analysis was developed as a tool to use where the assumptions of the simplified Level 1 consequence analysis were not valid. Examples of where the more rigorous Level 2 calculations may be necessary are cited below: 1. The specific fluid is not represented adequately within the list of reference fluid provided in
Table 2, including cases where the fluid is a wide-range boiling mixture or where the fluids toxic consequences are not represented adequately by any of the reference fluids.
2. The stored fluid is close to its critical point, in which case, the ideal gas assumptions for the vapor release equations are invalid.
3. The effects of two-phase releases, including liquid jet entrainment as well as rainout should be included in the assessment.
4. The effects of BLEVEs and non-flammable explosions are to be included in the assessment (not included in the Level 1 Assessment).
5. The effects of pressurized non-flammable explosions, such as are possible when non-flammable pressurized gases (e.g. air or nitrogen) are released during a vessel rupture, are to be included in the assessment (not included in the Level 1 Assessment).
6. The meteorological assumptions used in the dispersion calculations that form the basis for the Level 1 consequence analysis table lookups do not represent the site data.
The Level 2 consequence analysis procedures presented in API 581 provide equations and background information necessary to rigorously calculate consequence areas for several flammable
6
Copyri
ght ©
2013
E²G
| The
Equ
ity E
ngine
ering
Grou
p, Inc
. All R
ights
Reserv
ed.

and toxic event outcomes. A summary of these events are provided in Table 5.
To perform Level 2 consequence analysis calculations, the actual composition of the fluid stored in the equipment is modeled. Fluid property solvers are available which allow the analyst to calculate fluid physical properties more accurately. The fluid solver will also provide the ability to perform flash calculations to better determine the release phase of the fluid and to account for two-phase releases. In many of the consequence calculations, physical properties of the released fluid are required at storage conditions as well as conditions after release to the atmosphere.
A cloud dispersion analysis must be performed as part of a Level 2 consequence analysis to assess the quantity of flammable material or toxic concentration throughout vapor clouds that are generated after a release of volatile material. Modeling a release depends on the source conditions, the atmospheric conditions, the release surroundings, and the hazard being evaluated. Employment of many commercially available models, including SLAB or DEGADIS [6], account for these important factors and will produce the desired data for a Level 2 API RBI consequence analysis.
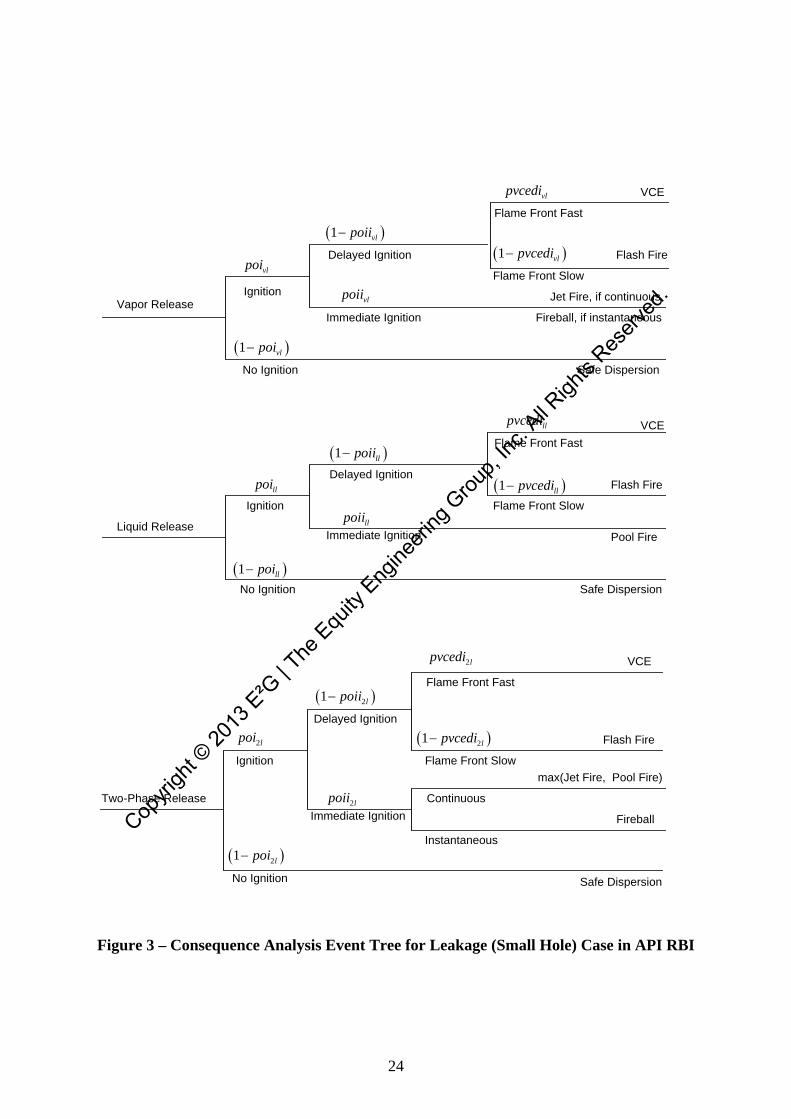
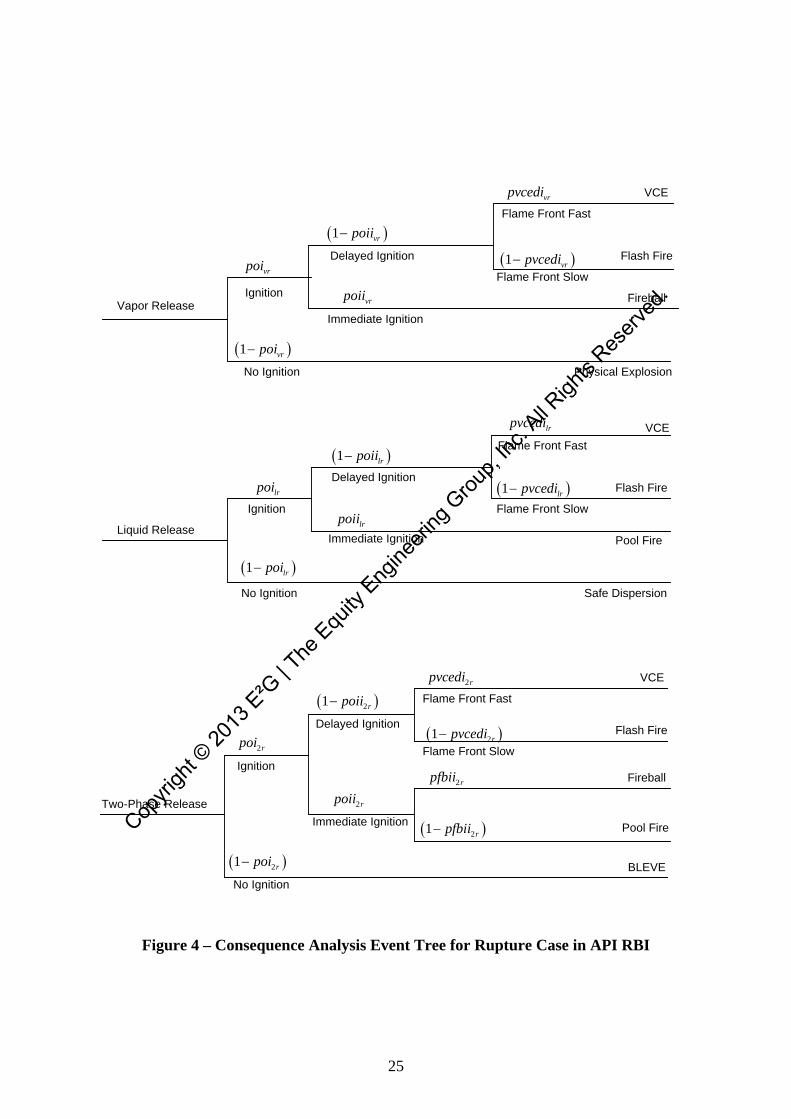
The event trees used in the Level 2 consequence analysis are shown in Figures 3 and 4. Significant improvement in the calculations of the probabilities on the event trees have been made in the Level 2 analysis procedure. Unlike the Level 1 analysis, the probabilities of ignition and other nodal probabilities on the event tree are not constant with release magnitude. Consistent with work of Cox, Lee and Ang [7], the Level 2 event tree ignition probabilities are directly proportional to the release rate. In the second edition of API 581, the probabilities of ignition (POI) were a strong function of the MW of the fluid. In the third edition, an improvement is being made in the event tree assessment, by making the POI a function of flash point temperature instead of MW. The probability that an ignition will be a delayed ignition is also a function of the release magnitude and how close the operating temperature is to the auto-ignition temperature (AIT) of the fluid. These improvements to the event tree calculations will result in consequence impact areas that are more strongly dependent on the size of release and the flammability and reactivity properties of the fluid being released.
RISK ANALYSIS
Determination of Risk The calculation of risk can be determined as a function of time in accordance with Equation (9). This equation combines the probability of failure and the consequence of failure as described earlier in this paper.
( ) ( ) ( )fR t P t C t= ⋅ (9)
Note that the probability of failure, ( )fP t , is a function of time since the damage factor as shown in Equation (1) increases as the damage in component due to thinning, cracking or other damage mechanisms accumulate with time. Figure 5 illustrates that the risk associated with individual damage mechanisms can be added together by superposition to provide the overall risk as a function of time.
In API RBI, the consequence of failure, ( )C t , is assumed to be invariant with time. Therefore, Equation (9) can be rewritten as shown in Equations (10) and (11) depending on whether the risk is expressed as an impact area or in financial terms.
( ) ( )fR t P t CA for Area Based Risk= ⋅ − (10)
7
Copyri
ght ©
2013
E²G
| The
Equ
ity E
ngine
ering
Grou
p, Inc
. All R
ights
Reserv
ed.
( ) ( )fR t P t FC for Financial Based Risk= ⋅ − (11)
In these equations, CA is the consequence impact area expressed in units of area and FC is the financial consequence expressed in economic terms. Note that in Equations (10) and (11), the risk is varying with time since the probability of failure is a function of time.
Risk Matrix
Presenting the results in a risk matrix is an effective way of showing the distribution of risks throughout a plant or process unit without numerical values. The risk matrix used in API RBI is shown in Figure 6. In this figure, the consequence and probability categories are arranged such that the highest risk ranking is toward the upper right-hand corner. Numerical values associated with consequence and probability categories are also shown in Figure 6.
Risk categories (i.e. High, Medium High, Medium, and Low) are assigned to the boxes on the risk matrix. In API RBI the risk categories are asymmetrical to indicate that the consequence category is given higher weighting than the probability category.
Component items residing towards the upper right-hand corner of the risk matrix will most likely take priority for inspection planning because these items have the highest risk. Similarly, items residing toward the lower left-hand corner of the risk matrix tend to take lower priority because these items have the lowest risk. Once the plots have been completed, the risk matrix can then be used as a screening tool during the prioritization process.
The 5 x 5 risk matrix is limited in its effectiveness since components that may have a calculated risk value an order of magnitude different from each other could appear in the same box on the matrix. Additionally, the 5 x 5 matrix does not show much relation to a risk target, which is an integral part of the inspecting planning process in API 581. A better way to represent risk for components is by using an Iso-Risk matrix as shown in Figure 7, which enables a direct visual reference to the risk target (the line separating the MEDIUM and MEDIUM-HIGH regions on the Iso-Risk matrix . An Iso-Risk matrix is being proposed in the third edition of API 581.
INSPECTION PLANNING
Overview
The premise of inspection planning using API RBI is based on the fact that at some point in time, the risk as defined in Equations (10) and (11) will reach a specified risk target. The risk target is established by the Owner-User. When or before the risk target is reached, an inspection of the equipment is recommended targeting the component damage mechanisms that have the highest calculated damage factors. Although the act of inspecting a piece of equipment does not necessarily reduce the inherent risk associated with that piece of equipment, inspection does provide knowledge of the damage state of the vessel and reduces uncertainty. As a result, the probability that loss of containment will occur is directly related to the amount of information that is available from inspection and the ability to quantify that damage.
In API RBI, reduction in uncertainty is a function of the effectiveness of the inspection in identifying and quantifying the type and extent of the damage. Some inspection techniques are better, for example, in detecting thinning (general corrosion) damage than others. On the other hand, an inspection technique appropriate for general corrosion will not likely be very effective in detecting and quantifying damage due to local thinning or cracking.
8
Copyri
ght ©
2013
E²G
| The
Equ
ity E
ngine
ering
Grou
p, Inc
. All R
ights
Reserv
ed.

From this discussion, the calculated risk as performed in API RBI is not only a function of time but it is also a function of the knowledge obtained on the condition or damage state of the component determined in an effective inspection program. When inspection effectiveness is introduced into the risk Equations (10) and (11), the equations can be rewritten as Equations (12) and (13):
( , ) ( , )E f ER t I P t I CA for Area Based Risk= ⋅ − (12)
( , ) ( , )E f ER t I P t I FC for Financial Based Risk= ⋅ − (13)
Inspection Effectiveness
In API RBI, the inspection effectiveness is graded A through E, with an A inspection providing the most effective inspection available (90% effective) and E representing no inspection. A description of the inspection effective levels for general thinning damage is given in Table 6. An inspection effectiveness table is provided in API 581 for each damage mechanism. In the third edition of API 581, the inspection effectiveness tables are being moved to Annex C and it will be stressed that the tables provided are only examples and that the user should work within their own inspection organizations to develop tables that more accurately reflect the companies’ inspection philosophy.
To illustrate the method in which different inspection levels effect the damage factor and probability of failure, consider the example of the general thinning damage mechanism (procedures for modifying damage factors based on inspection effectiveness are provided in API 581 for all damage mechanisms). For general thinning, API RBI utilizes an approach based on a metal loss parameter,
rtA . The damage factor is calculated as a function of this parameter and is based on the premise that as a pressure vessel or piping wall corrodes below the construction code minimum wall thickness plus the available corrosion allowance, the damage factor will increase. An inspection program for general thinning will result in a reduction of the damage factor based on the effectiveness of the inspection to quantify the corrosion rate. As an example, the general thinning damage factor, thin
fD , for a component with an rtA equal to 0.5 is 1200 if there is no inspection (i.e. Inspection Effectiveness is E) as shown in Table 6. If a B level inspection is performed, the damage factor is reduced to 600. If two B level inspections have been completed, the damage factor is further reduced to 200. When these damage factors are substituted into Equation (1), it becomes apparent that an effective inspection program can reduce the probability of failure of a component and the risk of loss of containment.
Inspection Planning
In planning inspections using API RBI, a plan date is typically chosen far enough out into the future to include a time period covering one or several future maintenance turnarounds. Within this period, three cases are possible based on predicted risk and the specified risk target. 1. Case 1 – Risk target is exceeded at a point in the future prior to the inspection plan date – This is
the classical case and is represented in Figure 7. In this case, the results of an inspection plan will be the number of inspections required during the plan period, as well as the type or inspection effectiveness required, to reduce the risk at the future plan date down below the risk target. The target date is the date where the risk target is expected to be reached and is the date of the recommended inspection.
2. Case 2 – Risk already exceeds the risk target at the time the RBI analysis is performed – This case is shown in Figure 8 and indicates that the current risk at the time of the RBI analysis exceeds the risk target. This often results when an Owner-User shifts from a conditioned-based inspection program to a risk-based inspection program. An immediate inspection will be
9
Copyri
ght ©
2013
E²G
| The
Equ
ity E
ngine
ering
Grou
p, Inc
. All R
ights
Reserv
ed.

recommended at a level sufficient to reduce the risk at the future plan date down below the risk target.
3. Case 3 – Risk at the future plan date does not exceed the risk target – This case is shown in Figure 9 and indicates the predicted future risk at the plan date will not exceed the risk target and therefore, no inspection is recommended during the plan period.
The concept of how the different inspection techniques with different effectiveness levels can reduce risk is shown in Figure 7. In the example shown, a B Level inspection was recommended at the target date. This inspection level was sufficient since the risk predicted after the inspection was performed was determined to be below the risk target at the plan date. Note that in Figure 7, a D Level inspection at the target date would not have been sufficient to satisfy the risk target criteria. The projected risk at the plan date would have exceeded the risk target.
API RBI AND FFS – COMPLEMENTARY TECHNOLOGIES
Integration of the FFS assessment procedures with the in-service inspection codes also facilitates effective use of the emerging API RBI technologies to maximize equipment availability and to improve sustainable maintenance performance. The FFS and RBI relationship depends upon the type of RBI study. In a RBI study using a qualitative evaluation, FFS assessment procedures can be used to alter the risk-ranking of equipment based on the level of damage and the results of the assessment. In a RBI study using a quantitative evaluation, the FFS assessment procedures provide a model for flaw and damage analysis that can be used to establish a probability of failure. The probably of failure can be combined with a consequence of failure model to produce risk that can be subsequently utilized in the RBI study. Work is underway to identify areas to improve API 579-1/ASME FFS-1 [8] to facilitate use with the API in-service inspection codes, API 510 [9], API 570 [10], and API 653 [11]. When work is complete, API 581 can be used to set the scope, method of inspection, and inspection interval for a piece of equipment. If excessive or unexpected damage is found, the inspection interval can be modified based on the results of a FFS assessment performed in accordance with API 579-1/ASME FFS-1.
FUTURE DEVELOPMENT WORK
Overview The technology embedded within API RBI is continuing to progress. As the technology is improved, the methodology will be modified and revisions to API 581 will be issued. It is likely that after the third edition is published, more frequent annual supplements to API 581 will be issued to account for continuing technical development. Highlights of the known technological improvements planned for the probability of failure, consequence analysis and inspection planning methods in API RBI are provided below.
Probability of Failure
Currently, probability of failure (POF) is based on superposition of applicable damage factors calculated for each of the damage mechanisms present in equipment. An alternative methodology for calculating probability of failure is being developed based on fitness for service (FFS) damage models as described by Osage [8]. Inputs to these structural reliability models will include statistical continuous distributions for material properties, physical dimensions, applied loadings, inspection effectiveness, and metal loss. The result of this approach will be a probabilistic calculation of the POF. Initial efforts using the new probabilistic approach will be in evaluating the damage from general and local metal loss. This method will not be published in the third edition of API 581 schedule in 2014 but will be issued shortly thereafter in one of the supplements to the third edition.
10
Copyri
ght ©
2013
E²G
| The
Equ
ity E
ngine
ering
Grou
p, Inc
. All R
ights
Reserv
ed.

Other areas to be examined will be brittle fracture, environmental cracking, high temperature hydrogen attack (HTHA), and creep damage. A Joint Industry Project was established in 2012 for the further technical development of NDE methods and procedures and RBI methodology for HTHA.
Currently, API RBI utilizes four discrete hole sizes with a hole size probability distribution based on generic failure frequencies established after review of industry failure data. These hole size failure distributions are applied to all damage mechanisms covered within API RBI. Intuitively, the hole sizes used in the risk assessment should be strongly dependent on the active damage mechanisms. A case in point is stress corrosion cracking or any other damage mechanism likely to result in a crack. A crack size distribution as well as calculation procedures to determine the crack opening area would be more appropriate than using a discrete set of holes sizes and release areas. It is also possible that a single hole size may be developed based on damage mechanism. Development work is planned for this area.
Another planned development activity is to perform a more detailed assessment of the industry failure data to re-evaluate the generic failure frequencies. Inherently, the industry failure data is not generic in nature, that is, the data includes the effects of in-service damage accumulated during operation. The concept of generic failure frequency is that the failure data should be independent of service life or damage mechanism. It is believed that the generic failure frequencies currently used are too conservative.
Finally, the management systems factor, MSF , used to quantify the impact that the plant mechanical integrity program has on the probability of failure should be further evaluated.
Consequence Analysis
The consequence analysis procedures in API RBI suggests a dense gas (heavier than air) cloud dispersion modeler to evaluate the impact areas associated with flammable and toxic releases. This is an adequate assumption for most refinery and petrochemical process fluids. However, for light gas releases, such as hydrogen and methane, the use of a dense gas model may be too conservative. Future modifications to the Level 2 Consequence analysis in API RBI will incorporate the use of a neutrally buoyant cloud dispersion model.
There is also some room for improvement in the calculation of the event tree probabilities. Research has recently been completed by the Energy Institute [13], including a review of ignition probabilities and correlations. This work needs to be reviewed to determine the need to modify the correlations currently being used in API RBI. There is also the need to improve the methods for determining the probability that a delayed ignition will result in either a flash fire or VCE. The probability that a delayed ignition will result in a VCE can easily be tied to the NFPA reactivity value of the fluid, which is a qualitative measure of a fluid’s propensity to detonate.
A technology of interest to the petrochemical industry is the ability to analyze the consequences associate with dust explosions. Currently, API RBI does not provide a method for evaluating the consequences of solid (powder) releases.
Inspection Planning
One of the most common questions asked when performing an API RBI analysis is related to risk targets. Some Owner-Users have internal corporate guidelines for risk tolerance; however, using risk tolerance guidelines to develop risk targets for use in an RBI analysis is not straightforward. In
11
Copyri
ght ©
2013
E²G
| The
Equ
ity E
ngine
ering
Grou
p, Inc
. All R
ights
Reserv
ed.

many cases, Owner-Users have no internal guidelines on risk targets. Future work to develop consistent guidelines for determining both area-based and financial-based risk targets is needed.
The current algorithm used for inspection planning, whereby inspection recommendations to reduce overall risk are based on targeting the damage mechanism that has the highest calculated damage factor needs improvement. Currently, there is no economic evaluation made to determine the most cost effective inspection plan for a particular combination of damage mechanisms. An optimization methodology that considers all damage mechanisms, inspection costs, inspection effectiveness and risk reduction needs to be developed.
NOMENCLATURE age is the time since the last thickness reading
nA is the cross sectional hole area associated with the thn release hole size
rtA is the metal loss parameter
aC is the corrosion allowance
rC is the corrosion rate
dC is the coefficient of discharge
( )C t is the consequence of failure as a function of time CA is the consequence impact area
cmdCA is the final component damage consequence area
injCA is the final personnel injury consequence area
f totalD − is the total damage factor thinfD is the damage factor for thinning elinfD is the damage factor for component linings extdfD is the damage factor for external damage, i.e. corrosion under insulation sccfD is the damage factor for stress corrosion cracking hthafD is the damage factor for high temperature hydrogen attack mfatfD is the damage factor for mechanical fatigue britfD is the damage factor for brittle fracture
( )fD t is the damage factor as a function of time, equal to f totalD − evaluated at a specific time
MSF is the management systems factor FC is the financial consequence
cg is the gravitational constant
totalgff is the total generic failure frequency k is the release fluid ideal gas specific heat capacity ratio
vK is the viscosity correction factor MW is the release fluid molecular weight
2rpfbii is the probability of a fireball given an immediate ignition of a rupture release of a two-phase fluid
llpoi is the probability of ignition given a leakage release of a flammable liquid
12
Copyri
ght ©
2013
E²G
| The
Equ
ity E
ngine
ering
Grou
p, Inc
. All R
ights
Reserv
ed.

vlpoi is the probability of ignition given a leakage release of a flammable vapor
2lpoi is the probability of ignition given a leakage release of a flammable two-phase fluid
lrpoi is the probability of ignition given a rupture release of a flammable liquid
vrpoi is the probability of ignition given a rupture release of a flammable vapor
2rpoi is the probability of ignition given a rupture release of a flammable two-phase fluid
llpoii is the probability of immediate ignition given ignition of a leakage release of a flammable liquid
vlpoii is the probability of immediate ignition given ignition of a leakage release of a flammable vapor
2lpoii is the probability of immediate ignition given ignition of a leakage release of a flammable two-phase fluid
lrpoii is the probability of immediate ignition given ignition of a rupture release of a flammable liquid
vrpoii is the probability of immediate ignition given ignition of a rupture release of a flammable vapor
2rpoii is the probability of immediate ignition given ignition of a rupture release of a flammable two-phase fluid
llpvcedi is the probability of VCE given a delayed ignition of a leakage release of a flammable liquid
vlpvcedi is the probability of VCE given a delayed ignition of a leakage release of a flammable vapor
2lpvcedi is the probability of VCE given a delayed ignition of a leakage release of a flammable two-phase fluid
lrpvcedi is the probability of VCE given a delayed ignition of a rupture release of a flammable liquid
vrpvcedi is the probability of VCE given a delayed ignition of a rupture release of a flammable vapor
2rpvcedi is the probability of VCE given a delayed ignition of a rupture release of a flammable two-phase fluid
aP is the atmospheric pressure
sP is the storage or normal operating pressure
( )fP t is the probability of failure as a function of time
( ),f EP t I is the probability of failure as a function of time and inspection effectiveness POL is the probability of leakage POR is the probability of rupture
lρ is the liquid density R is the universal gas constant ( )R t is the risk as a function of time
( ), ER t I is the risk as a function of time and inspection effectiveness
mint is the minimum required thickness for the component established using the applicable construction code
13
Copyri
ght ©
2013
E²G
| The
Equ
ity E
ngine
ering
Grou
p, Inc
. All R
ights
Reserv
ed.

rdt is the thickness reading
sT is the storage or normal operating temperature
nW is the release rate associated with the thn release hole size
REFERENCES [1] API, API RP 580 Recommended Practice for Risk-Based Inspection, American Petroleum
Institute, Washington, D.C. [2] API, API RP 581 API RBI Technology, American Petroleum Institute, Washington, D.C, In
Preparation. [3] CCPS, Guidelines for Consequence Analysis of Chemical Releases, ISBN 0-8169-0786-2,
published by the Center for Chemical Process Safety of the American Institute of Chemical Engineers, 1999.
[4] van den Bosch, C.J.H., and Weterings, R.A.P.M., Ed., Methods for Calculation of Physical Effects (TNO Yellow Book, Third Edition), Chapter 6: Heat Flux from Fires, CPR 14E (ISSN 0921-9633/2.10.014/9110), Servicecentrum, The Hague, 1997."
[5] CCPS, Guidelines for Evaluating the Characteristics of Vapor Cloud Explosions, Flash Fires, and BLEVEs, ISBN 0-8169-0474-X, published by the Center for Chemical Process Safety of the American Institute of Chemical Engineers, 1994.
[6] OFCM , Directory of Atmospheric Transport and Diffusion Consequence Assessment Models (FC-I3-1999), published by the Office of the Federal Coordinator for Meteorological Services and Supporting Research (OFCM) with the assistance of SCAPA members, the document is available at http://www.ofcm.gov/atd_dir/pdf/frontpage.htm.
[7] Cox, A.W., Lees, F. P., and Ang, M.L., Classification of Hazardous Locations, Rugby: Instn Chem. Engrs., 1990.
[8] Osage, D.A., “API 579-1/ASME FFS-1 2006 – A Joint API/ASME Fitness-For-Service Standard For Pressurized Equipment”, ESOPE Conference, Paris, France, 2007.
[9] API, API 510 Pressure Vessel Inspection Code: Maintenance Inspection, Rerating, Repair and Alteration, American Petroleum Institute, Washington, D.C., 1999.
[10] API, API 570 Piping Inspection Code: Inspection, Repair, Alteration, and Rerating of In-Service Piping Systems, American Petroleum Institute, Washington, D.C., 1998.
[11] API, API 653 Tank Inspection, Repair, Alteration, and Reconstruction, American Petroleum Institute, Washington, D.C., 1998.
[12] Valbuena, R.R, Implementing and Evergreening RBI in Process Plants, ISBN #1-57698-040-5, published by the Materials Technology Institute of the Chemical Process Industries, Inc., 2005.
[13] EI Publ., Ignition Probability Review, Model Development and Look-up Correlations, First Edition, Energy Institute, London, ISBN 978-0-85293-454-8, 2006.
[14] NFPA, SPFE Handbook for Fire Protection, Society of Fire Protection Engineering and the National Fire Protection Association, ISBN 0-87765-354-2 (NFPA No. HFPE-95), 1995.
[15] Lees, F.P., Loss Prevention in the Process Industries, Butterworths, London, 1986 [16] CCPS, Estimating the Flammable Mass of a Vapor Cloud, ISBN 0-8169-0778-1, published by
the Center for Chemical Process Safety of the American Institute of Chemical Engineers, 1999.
14
Copyri
ght ©
2013
E²G
| The
Equ
ity E
ngine
ering
Grou
p, Inc
. All R
ights
Reserv
ed.

Table 1 – Summary of Proposed Changes in 3rd Edition of API 581
Part Paragraph Item Description
1 4.0 Iso-Risk Matrix
An iso-risk matrix will be included as the preferred method of presenting risk results
1 7.0 POF as a
function of overpressure
For the PRD module, improvements are made to the determination of protected equipment POF as a function of overpressure
2 General Damage Factors
All damage factor tables are being recalibrated down to a minimum value of 0.0 instead of 1.0. This will enable undamaged components to have calculated POF values less than the generic failure frequency, which is considered to be very conservative.
2 4.0 Tank Components
Separated the tank bottom into two components; tank bottom plate and a new edge component. The edge component will allow correct calculation minimum thickness of the bottom plate immediately adjacent to the shell. This will result in increased inspection focus in this area.
2 5.0 Addition of
Level 2 approach for
thinning
The structure of Section 5.0 is being modified to allow a Level 1 or a Level 2 approach for calculating thinning damage factors. Section 5.0 will point to a new Annex D for the existing method (Level 1) and point to a new Annex E for the new approach (Level 2)
2 5.0 Tank
Thinning Damage Factor
Improvements have been made to determination of the tank settlement and management factors.
2 5.0, 16.0 & 17.0
Tank Thinning and
External Damage Factors
A distinction is being made between the wall loss that accumulates internally versus externally. The combined damage factor is being modified to accommodate a measured external wall loss, where available.
2 10.0 & 15.0
Cracking Susceptibility
for pipe materials
Reduction in Susceptibility to HIC/SOHIC and/or HIC/SOHIC-HF for equipment items constructed from wrought pipe materials.
2 11.0 Carbonate Cracking Module
Modifications to the damage factor calculation to make consistent with the latest NACE information on carbonate cracking.
2 16.0 – 19.0 Coating
Adjustment Factor
Modifications/improvements to the coating adjustment factor in the external damage factor calculations.
2 Annex B, Section 2.B.7
Sour Water Corrosion Module
Modification of Sour Corrosion Module to reflect latest technology
15
Copyri
ght ©
2013
E²G
| The
Equ
ity E
ngine
ering
Grou
p, Inc
. All R
ights
Reserv
ed.

Table 1 – Summary of Proposed Changes in 3rd Edition of API 581
Part Paragraph Item Description
2 Annex C Inspection
Effectiveness Tables
All tables are being removed from the individual damage factors chapters of Part 2 and will be consolidated in a new Annex C. It will be stressed that the tables presented in API 581 are only examples and that users must customized each table to their individual company’s inspection philosophy. New inspection effectiveness tables have been developed for Heat Exchanger bundles which will be incorporated into Annex C
2 Annex D Level 1 Thinning
More detail and background is being provided for the current thinning method to address limitations of the original AROT table based approach. A step by step procedure for reproducing damage factor tables will be provided.
2 Annex E Level 2 Thinning
A new approach is being introduced as Annex E which is consistent with the API. An improved limit state equation is being implemented which can be expanded to included local thinning effects using an RSF approach.
3 5.0 Tank Module
Modifications to tank module include:
• Addition of API 620 Tanks
• Modification of repair costs tables to make a function of tank diameter
• Increase in outage day costs for leaks and ruptures
3 6.0 TNO Energy method
Added discussion on TNO Energy method for use in determining explosive overpressure magnitude
3 7.0 Tank Consequences
Modifications to tank consequence calculations include:
• Ability to calculated safety consequences
• Calculation procedures to determine dike over-topping volume
16
Copyri
ght ©
2013
E²G
| The
Equ
ity E
ngine
ering
Grou
p, Inc
. All R
ights
Reserv
ed.

Table 2 – List of Reference Fluids Available for Level 1 Consequence Analysis
Reference Fluid Examples of Applicable Materials C1 - C2 methane, ethane, ethylene, LNG, fuel gas C3 - C4 propane, butane, isobutane, LPG
C5 pentane C6 - C8 gasoline, naphtha, light straight run, heptane C9 - C12 diesel, kerosene C13 - C16 jet fuel, kerosene, atmospheric gas oil C17 - C25 gas oil, typical crude
C25+ residuum, heavy crude, lube oil, seal oil H2 hydrogen only
H2S hydrogen sulfide only HF hydrogen fluoride
Water Water Steam Steam Acid Acid, caustic
Aromatics Benzene, Toluene, Xylene, Cumene Ammonia Ammonia Chlorine Chlorine
17
Copyri
ght ©
2013
E²G
| The
Equ
ity E
ngine
ering
Grou
p, Inc
. All R
ights
Reserv
ed.

Table 3 – Equipment Damage Flammable Consequence Area Equation Constants
Reference Fluid
Continuous Releases Constants Instantaneous Releases Constants
Auto-Ignition Not Likely (CAINL)
Auto-Ignition Likely (CAIL)
Auto-Ignition Not Likely (IAINL)
Auto-Ignition Likely (IAIL)
Gas Liquid Gas Liquid Gas Liquid Gas Liquid a b a b a b a b a b a b a b a b
C1-C2 43.0 0.98 280.0 0.95 41.0 0.67 1079 0.62
C3-C4 49.48 1.00 313.6 1.00 27.96 0.72 522.9 0.63
C5 25.17 0.99 536.0 0.89 304.7 1.00 13.38 0.73 1.49 0.85 275.0 0.61
C6-C8 29.0 0.98 182.0 0.89 312.4 1.00 525.0 0.95 13.98 0.66 4.35 0.78 275.7 0.61 57.0 0.55
C9-C12 12.0 0.98 130.0 0.90 391.0 0.95 560.0 0.95 7.1 0.66 3.3 0.76 281.0 0.61 6.0 0.53
C13-C16 64.0 0.90 1023 0.92 0.46 0.88 9.2 0.88
C17-C25 20.0 0.90 861.0 0.92 0.11 0.91 5.6 0.91
C25 + 11.0 0.91 544.0 0.90 0.03 0.99 1.4 0.99
H2 64.5 0.992 420.0 1.00 61.5 0.657 1430 0.618
H2S 32.0 1.00 203.0 0.89 148.0 0.63 357.0 0.61
HF
Aromatics 17.87 1.097 103.0 1.00 374.5 1.055 11.46 0.667 70.12 1.00 512.6 0.713 701.2 1.00
Table 4 – Personnel Injury Flammable Consequence Area Equation Constants
Reference Fluid
Continuous Releases Constants Instantaneous Releases Constants
Auto-Ignition Not Likely (CAINL)
Auto-Ignition Likely (CAIL)
Auto-Ignition Not Likely (IAINL)
Auto-Ignition Likely (IAIL)
Gas Liquid Gas Liquid Gas Liquid Gas Liquid a b a b a b a b a b a b a b a b
C1-C2 110.0 0.96 745.0 0.92 79.0 0.67 3100 0.63
C3-C4 125.2 1.00 836.7 1.00 57.72 0.75 1769 0.63
C5 62.05 1.00 1545 0.89 811.0 1.00 28.45 0.76 4.34 0.85 959.6 0.63
C6-C8 68.0 0.96 516.0 0.89 828.7 1.00 1315 0.92 26.72 0.67 12.7 0.78 962.8 0.63 224.0 0.54
C9-C12 29.0 0.96 373.0 0.89 981.0 0.92 1401 0.92 13.0 0.66 9.5 0.76 988.0 0.63 20.0 0.54
C13-C16 183.0 0.89 2850 0.90 1.3 0.88 26.0 0.88
C17-C25 57.0 0.89 2420 0.90 0.32 0.91 16.0 0.91
C25 + 33.0 0.89 1604 0.90 0.081 0.99 4.1 0.99
H2 165.0 0.933 1117 1.00 118.5 0.652 4193 0.621
H2S 52.0 1.00 375.0 0.94 271.0 0.63 1253 0.63
HF
Aromatics 64.14 0.963 353.5 0.883 1344 0.937 487.7 0.268 18.08 0.686 0.14 0.935 512.6 0.713 1.404 0.935
18
Copyri
ght ©
2013
E²G
| The
Equ
ity E
ngine
ering
Grou
p, Inc
. All R
ights
Reserv
ed.

Table 5 – Consequence Event Outcome for Level 2 Analysis
Event Outcome Description General Procedure
Pool Fire [3], [4],
[7]
Occurs as a result of immediate ignition of a flammable liquid from a pressurized process vessel or pipe that leaks or ruptures.
1. Determine pool fire size 2. Calculate burning rate 3. Calculate flame length and tilt 4. Determine radiant energy emitted 5. Determine energy received at distant points (need view factor
and atmospheric transmissivity) 6. Calculate safe distance
Jet Fires [3]
Occurs as a result of immediate ignition of a flammable vapor or two-phase jet release from a pressurized process vessel or pipe that develops a hole.
1. Calculate flame length 2. Determine radiant energy emitted 3. Determine energy received at distant points (need view factor
and atmospheric transmissivity) 4. Calculate safe distance
Fireball [3]
Occurs as result of the immediate ignition of a flammable, superheated liquid/vapor released due to a vessel or pipe rupture. Fireballs always occur in combination with a physical explosion or a BLEVE.
1. Determine available flammable mass 2. Determine fireball diameter, height and duration 3. Determine radiant energy emitted 4. Determine energy received at distant points (need view factor
and atmospheric transmissivity)
Flash Fire [3], [5]
Occurs as a result of a delayed ignition of a vapor cloud. The source of the vapor cloud could either be from a vapor or two-phase jet release or evaporation off the surface of an un-ignited liquid flammable pool.
1. Determine if cloud source is continuous (plume) or instantaneous (puff)
2. Utilize cloud dispersion model to determine the amount of flammable material (greater than LFL) that is in the source cloud
Vapor Cloud
Explosion[3], [5],
[15], [16]
1. Determine if cloud source is continuous (plume) or instantaneous (puff)
2. Utilize cloud dispersion model to determine the amount of flammable material (between LFL and UFL) that is in the source cloud
3. Determine equivalent amount of TNT 4. Calculate overpressure as a function of distance
BLEVE [5]
Occurs upon rupture of a vessel containing a superheated but pressurized liquid that flashes to vapor upon release to atmosphere
1. Determine equivalent amount of TNT which is a function of the storage pressure and the amount of fluid that flashes
2. Calculate overpressure as a function of distance.
Physical Explosion
[5]
Occurs upon rupture of a vessel containing a pressurized flammable or non-flammable vapor
1. Determine equivalent amount of TNT which is a function of the storage pressure and volume of vapor
2. Calculate overpressure as a function of distance.
Toxic Release
Occurs upon release of toxic fluid to the atmosphere through a hole or due to a rupture
1. Determine if cloud source is continuous (plume) or instantaneous (puff)
2. Utilize cloud dispersion model to determine the portion of the cloud that exceeds the toxic limit (concentration and duration) of the fluid
19
Copyri
ght ©
2013
E²G
| The
Equ
ity E
ngine
ering
Grou
p, Inc
. All R
ights
Reserv
ed.

Table 6 – Guidelines for Assigning Inspection Effectiveness – General Thinning
Inspection Category
Inspection Effectiveness
Category Intrusive Inspection
Example Non-intrusive Inspection Example
A Highly Effective
50 to 100% examination of the surface (partial internals removed), and accompanied by thickness measurements
50 to 100% ultrasonic scanning coverage (automated or manual) or profile radiography
B Usually Effective
Nominally 20% examination (no internals removed), and spot external ultrasonic thickness measurements
Nominally 20% ultrasonic scanning coverage (automated or manual), or profile radiography, or external spot thickness (statistically validated)
C Fairly Effective Visual examination without thickness measurements
2 to 3% examination, spot external ultrasonic thickness measurements, and little or no internal visual examination
D Poorly Effective External spot thickness readings only
Several thickness measurements, and a documented inspection planning system
E Ineffective No inspection Several thickness measurements taken only externally, and a poorly documented inspection planning system
20
Copyri
ght ©
2013
E²G
| The
Equ
ity E
ngine
ering
Grou
p, Inc
. All R
ights
Reserv
ed.

Table 7 – Thinning Damage Factors
rtA Inspection Effectiveness
E 1 Inspection 2 Inspections 3 Inspections
D C B A D C B A D C B A 0.02 1 1 1 1 1 1 1 1 1 1 1 1 1 0.04 1 1 1 1 1 1 1 1 1 1 1 1 1 0.06 1 1 1 1 1 1 1 1 1 1 1 1 1 0.08 1 1 1 1 1 1 1 1 1 1 1 1 1 0.10 2 2 1 1 1 1 1 1 1 1 1 1 1 0.12 6 5 3 2 1 4 2 1 1 3 1 1 1 0.14 20 17 10 6 1 13 6 1 1 10 3 1 1 0.16 90 70 50 20 3 50 20 4 1 40 10 1 1 0.18 250 200 130 70 7 170 70 10 1 130 35 3 1 0.20 400 300 210 110 15 290 120 20 1 260 60 5 1 0.25 520 450 290 150 20 350 170 30 2 240 80 6 1 0.30 650 550 400 200 30 400 200 40 4 320 110 9 2 0.35 750 650 550 300 80 600 300 80 10 540 150 20 5 0.40 900 800 700 400 130 700 400 120 30 600 200 50 10 0.45 1050 900 810 500 200 800 500 160 40 700 270 60 20 0.50 1200 1100 970 600 270 1000 600 200 60 900 360 80 40 0.55 1350 1200 1130 700 350 1100 750 300 100 1000 500 130 90 0.60 1500 1400 1250 850 500 1300 900 400 230 1200 620 250 210 0.65 1900 1700 1400 1000 700 1600 1105 670 530 1300 880 550 500
rtA Inspection Effectiveness
E 4 Inspections 5 Inspections 6 Inspections
D C B A D C B A D C B A 0.02 1 1 1 1 1 1 1 1 1 1 1 1 1 0.04 1 1 1 1 1 1 1 1 1 1 1 1 1 0.06 1 1 1 1 1 1 1 1 1 1 1 1 1 0.08 1 1 1 1 1 1 1 1 1 1 1 1 1 0.10 2 1 1 1 1 1 1 1 1 1 1 1 1 0.12 6 2 1 1 1 2 1 1 1 1 1 1 1 0.14 20 7 2 1 1 5 1 1 1 4 1 1 1 0.16 90 30 5 1 1 20 2 1 1 14 1 1 1 0.18 250 100 15 1 1 70 7 1 1 50 3 1 1 0.20 400 180 20 2 1 120 10 1 1 100 6 1 1 0.25 520 200 30 2 1 150 15 2 1 120 7 1 1 0.30 650 240 50 4 2 180 25 3 2 150 10 2 2 0.35 750 440 90 10 4 350 70 6 4 280 40 5 4 0.40 900 500 140 20 8 400 110 10 8 350 90 9 8 0.45 1050 600 200 30 15 500 160 20 15 400 130 20 15 0.50 1200 800 270 50 40 700 210 40 40 600 180 40 40 0.55 1350 900 350 100 90 800 260 90 90 700 240 90 90 0.60 1500 1000 450 220 210 900 360 210 210 800 300 210 210 0.65 1900 1200 700 530 500 1100 640 500 500 1000 600 500 500
Notes: Determine the row based on the calculated rtA parameter shown below. Then determine the thinning damage factor based on the number and category of highest effective inspection. Interpolation may be used for intermediate values.
min
max 1 , 0.0rd rrt
a
t C ageAt C
− ⋅= − +
21
Copyri
ght ©
2013
E²G
| The
Equ
ity E
ngine
ering
Grou
p, Inc
. All R
ights
Reserv
ed.
Equipment Damage
Leakage(POL)
Rupture(POR)
No Loss of Containment(1-POL-POR)
Vapor
Two-Phase
Liquid
Vapor
Two-Phase
Liquid
API RBI Consequence
Analysis
API RBI Probability Analysis
Figure 3
Figure 3
Figure 1 – Overall Event Tree Used in API RBI
22
Copyri
ght ©
2013
E²G
| The
Equ
ity E
ngine
ering
Grou
p, Inc
. All R
ights
Reserv
ed.

Calculate Thoeretical
Release Rate
Estimate the Amount of Fluid Available for Release
Determine if Release is Continuous or Instantaneous
Assess the Impact of Detection and Isolation
Systems
Calculate Flammable Consequence Area
Calculate Toxic Consequence Area
Calcualte Final Probability-Weighted Consequence Areas
Fluid Properties at Storage
(Operating) and Ambient Conditions
Range of Hole Sizes: 6 mm, 25 mm, 100 mm,
Rupture
Calculate Non-Flammable, Non-Toxic Consequence
Area
Determine the Release Rate and the Release Mass
Calculate Financial Consequences
Figure 2 – Consequence Analysis Procedure in API RBI
23
Copyri
ght ©
2013
E²G
| The
Equ
ity E
ngine
ering
Grou
p, Inc
. All R
ights
Reserv
ed.
Safe DispersionNo Ignition
Vapor Release
( )1 vlpoi−
vlpoi
Ignition
Flash Fire
Jet Fire, if continuousvlpoii
( )1 vlpoii−
Delayed Ignition
Flame Front Slow
( )1 vlpvcedi−
VCE
Immediate Ignition
Flame Front Fast
Fireball, if instantaneous
Safe DispersionNo Ignition
Liquid Release
( )1 llpoi−
llpoiIgnition
Flash Fire
Pool Firellpoii
( )1 llpoii−Delayed Ignition
Flame Front Slow( )1 llpvcedi−
VCE
Immediate Ignition
Flame Front Fastllpvcedi
Two-Phase Release
No Ignition
Delayed Ignition
VCE
Flash Fire
Safe Dispersion
( )21 lpoi−
2lpoiIgnition
2lpoiiImmediate Ignition
( )21 lpoii−
2lpvcedi
Flame Front Fast
Flame Front Slow
( )21 lpvcedi−
max(Jet Fire, Pool Fire)
Fireball
vlpvcedi
Continuous
Instantaneous
Figure 3 – Consequence Analysis Event Tree for Leakage (Small Hole) Case in API RBI
24
Copyri
ght ©
2013
E²G
| The
Equ
ity E
ngine
ering
Grou
p, Inc
. All R
ights
Reserv
ed.
Physical ExplosionNo Ignition
Vapor Release
( )1 vrpoi−
vrpoi
Ignition
Flash Fire
vrpoii
( )1 vrpoii−
Delayed Ignition
Flame Front Slow( )1 vrpvcedi−
VCE
Immediate Ignition
Flame Front Fast
Safe DispersionNo Ignition
Liquid Release
( )1 lrpoi−
lrpoiIgnition
Flash Fire
Pool Fire
( )1 lrpoii−Delayed Ignition
Flame Front Slow( )1 lrpvcedi−
VCE
Immediate Ignition
Flame Front Fastlrpvcedi
Two-Phase Release
No Ignition
Delayed Ignition
VCE
Flash Fire
BLEVE( )21 rpoi−
2rpoiIgnition
2rpoiiImmediate Ignition
( )21 rpoii−2rpvcedi
Flame Front Fast
Flame Front Slow( )21 rpvcedi−
Fireball
vrpvcedi
lrpoii
Fireball
2rpfbii
Pool Fire( )21 rpfbii−
Figure 4 – Consequence Analysis Event Tree for Rupture Case in API RBI
25
Copyri
ght ©
2013
E²G
| The
Equ
ity E
ngine
ering
Grou
p, Inc
. All R
ights
Reserv
ed.

Total Risk
Thinning Risk
SCC Risk
Brittle Fracture Risk
time
Risk
InstallationDate
t
C
B
A
A+B+C
Figure 5 – Superposition Principle for the Calculation of Risk in API RBI
26
Copyri
ght ©
2013
E²G
| The
Equ
ity E
ngine
ering
Grou
p, Inc
. All R
ights
Reserv
ed.

Prob
abili
ty
5
4 RISK High
3 Medium High
Medium
2 Low
1
A B C D E
Consequence
Numerical Values Associated with Consequence and Probability Categories in API RBI
Probability Category (1) Consequence Category (2) Category Range Category Range
1 2f totalD − ≤ A 100CA ≤
2 2 20f totalD −< ≤ B 100 1000CA< ≤
3 20 100f totalD −< ≤ C 1000 3000CA< ≤
4 100 1000f totalD −< ≤ D 3000 10000CA< ≤
5 1000f totalD − > E 10000CA >
Notes: 1. In terms of the total damage factor. 2. In terms of maximum component consequence area.
max ,cmd injCA CA CA =
Figure 6 – Risk Matrix
27
Copyri
ght ©
2013
E²G
| The
Equ
ity E
ngine
ering
Grou
p, Inc
. All R
ights
Reserv
ed.

Figure 7 – Iso-Risk Matrix
Consequence
Prob
abili
ty RISK
High
Medium high
Medium
Low
28
Copyri
ght ©
2013
E²G
| The
Equ
ity E
ngine
ering
Grou
p, Inc
. All R
ights
Reserv
ed.

time
Risk
InstallationDate
RBI Date
Target Date,Inspection Performed
PlanDate
Risk Target
Total Risk with Inspection at the Risk Target Date
Total Risk without Inspection at the Risk Target Date
A
B
C
D
Figure 7 – Case 1: Inspection Planning When the Risk Target is Exceeded Between the RBI Date and the Plan Date
29
Copyri
ght ©
2013
E²G
| The
Equ
ity E
ngine
ering
Grou
p, Inc
. All R
ights
Reserv
ed.

time
Risk
InstallationDate
RBI & Risk TargetDate, Inspection
Performed
Plan Date
Total Risk with Inspection at the Risk Target Date
Risk Target
Total Risk without Inspection at the Risk Target Date
Figure 8 – Case 2: Inspection Planning When the Risk Target has been Exceeded Prior to the RBI Date
time
Risk
InstallationDate
RBIDate
PlanDate
Risk Target
Total Risk withoutInspection
Figure 9 – Case 3: Inspection Planning When Risk Target is Not Exceeded Prior to the Plan Date
30
Copyri
ght ©
2013
E²G
| The
Equ
ity E
ngine
ering
Grou
p, Inc
. All R
ights
Reserv
ed.