proposed development at helensburgh flood risk assessment risk... · proposed development at...
TRANSCRIPT
Prepared for
Argyll and Bute Council
Proposed Development at Helensburgh Flood Risk Assessment November 2011
Argyll and Bute Council Proposed Development at Helensburgh
URS Scott Wilson 23 Chester Street Edinburgh EH3 7EN Tel 0131 718 1230 www.urs-scottwilson.com
Revision Schedule Proposed Development at Helensburgh November 2011
Rev Date Details Prepared by Reviewed by Approved by
00 August 2011 Draft Issue Gavin Mulroy Project Engineer
David Ashton Senior Engineer
David Wright Technical Director
01 October 2011 Final Issue 1 Gavin Mulroy Project Engineer
David Ashton Senior Engineer
David Wright Technical Director
02 November 2011
Final Issue 2 Gavin Mulroy Project Engineer
David Ashton Senior Engineer
David Wright Technical Director
Argyll and Bute Council Proposed Development at Helensburgh
Limitations
This document has been prepared in accordance with the scope of URS Scott Wilson's appointment with its client and is subject to the terms of that appointment. It is addressed to and for the sole and confidential use and reliance of URS Scott Wilson's client. URS Scott Wilson accepts no liability for any use of this document other than by its client and only for the purposes for which it was prepared and provided. No person other than the client may copy (in whole or in part) use or rely on the contents of this document, without the prior written permission of the Company Secretary of URS Scott Wilson Ltd. Any advice, opinions, or recommendations within this document should be read and relied upon only in the context of the document as a whole. The contents of this document do not provide legal or tax advice or opinion.
The conclusions and recommendations contained in this Report are based upon information provided by others and upon the assumption that all relevant information has been provided by those parties from whom it has been requested and that such information is accurate. Information obtained by URS Scott Wilson has not been independently verified by URS Scott Wilson, unless otherwise stated in the Report.
The methodology adopted and the sources of information used by URS Scott Wilson in providing its services are outlined in this Report. The work described in this Report was undertaken between June 2011 and October 2011 and is based on the conditions encountered and the information available during the said period of time. The scope of this Report and the services are accordingly factually limited by these circumstances.
Where assessments of works or costs identified in this Report are made, such assessments are based upon the information available at the time and where appropriate are subject to further investigations or information which may become available.
URS Scott Wilson disclaim any undertaking or obligation to advise any person of any change in any matter affecting the Report, which may come or be brought to URS Scott Wilson’s attention after the date of the Report.
Certain statements made in the Report that are not historical facts may constitute estimates, projections or other forward-looking statements and even though they are based on reasonable assumptions as of the date of the Report, such forward-looking statements by their nature involve risks and uncertainties that could cause actual results to differ materially from the results predicted. URS Scott Wilson specifically does not guarantee or warrant any estimate or projections contained in this Report.
Unless otherwise stated in this Report, the assessments made assume that the sites and facilities will continue to be used for their current purpose without significant changes.
Where field investigations are carried out, these have been restricted to a level of detail required to meet the stated objectives of the services. The results of any measurements taken may vary spatially or with time and further confirmatory measurements should be made after any significant delay in issuing this Report.
Copyright
© This Report is the copyright of both URS Scott Wilson Ltd and Argyll and Bute Council. Any unauthorised reproduction or usage by any person other than the addressees is strictly prohibited.
Argyll and Bute Council Proposed Development at Helensburgh
Table of Contents
1 Executive Summary ....................................................................... 1
2 Introduction ..................................................................................... 2
3 Background ..................................................................................... 3
3.1 Site Description .............................................................................................................. 3 3.2 Proposed Development .................................................................................................. 4 3.3 Available Data ................................................................................................................ 5 3.4 FRA Terminology............................................................................................................ 6
4 Regulatory Framework and Consultation...................................... 7
4.1 Scottish Planning Policy – Flooding and Drainage.......................................................... 7 4.2 Consultations................................................................................................................ 8
5 Flood Flow and Level Estimation................................................. 11
5.1 Historical Flooding ........................................................................................................ 11 5.2 Fluvial Flooding ............................................................................................................ 11 5.3 Fluvial Hydrological Model Results and Climate Change .............................................. 13 5.4 Sea Level and Wave Estimation ................................................................................... 14 5.5 Joint Probability Analysis .............................................................................................. 17 5.6 Residual Wave Effects.................................................................................................. 19 5.7 Freeboard Allowances .................................................................................................. 19
6 Flood Risk Assessment ................................................................ 20
6.1 Extreme Sea Levels...................................................................................................... 20 6.2 Wave Overtopping Analysis and Results ...................................................................... 24 6.3 Wave Overtopping Discussion...................................................................................... 29 6.4 Fluvial Flood Risk ......................................................................................................... 31 6.5 Flood Risk Management for Proposed Development .................................................... 34 6.6 BREEAM Compliance................................................................................................... 35
7 Conclusions and Recommendations........................................... 36
7.1 Conclusions .................................................................................................................. 36 7.2 Recommendations........................................................................................................ 37
Argyll and Bute Council Proposed Development at Helensburgh
8 Appendix A .................................................................................... 38
Figure 1 – Site Location.............................................................................................................. 38 Figure 2 – Subject Site(s) ........................................................................................................... 39 Figure 3 – Proposed CHORD Development ............................................................................... 40 Figure 4 – Swimming Pool Development.................................................................................... 41 Figure 5 – Office Development ................................................................................................... 42 Figure 6 – Catchment Boundaries .............................................................................................. 43 Figure 7 – EurOtop Profile Locations.......................................................................................... 44 Figure 8 – EurOtop Profile Sections 1 - 5 ................................................................................... 45 Figure 9 – EurOtop Profile Sections 6 - 10 ................................................................................. 46 Figure 10 –Flood Extents map.................................................................................................... 47
9 Appendix B – Photographs .......................................................... 48
10 Appendix C – Brief and Correspondence.................................... 53
Argyll and Bute Council Proposed Development at Helensburgh
1 November 2011
1 Executive Summary URS Scott Wilson was engaged by Mace on behalf of Argyll and Bute Council (ABC), under a framework
agreement, to undertake a Flood Risk Assessment (FRA) for three adjacent sites in Helensburgh along
West Clyde Street and East Clyde Street. This FRA supports planning applications for two of these sites.
The planning applications to which this FRA relates are the Swimming Pool and mixed development area
on the Pier Head site and the Office development site on West Clyde Street.
The scope of works for this FRA included : -
1) A basic coastal flood risk analysis using existing available data and simplified methodologies to
derive an extreme design flood level at a 1:200 annual exceedence probability (AEP).
2) A fluvial and surface water runoff flood risk analysis at a 1:200 AEP.
3) Joint coastal/fluvial/surface water assessment including wave overtopping/tidal effects and
fluvial surface flow effects.
The reporting covered the regulatory framework and consultations, flood flow and level estimation and flood
risk assessment, leading to conclusions and recommendations.
Extreme estimates for a 1:200 AEP event give a ‘still water’ tidal water level in the order of 3.96m AOD.
Taking into account climate change, joint probability and wave effects the flood level experienced at the
subject sites could rise to a maximum of between 4.7m and 4.9m AOD. Wave overtopping rates assessed
for existing sea defences provided discharges well in excess of a safe rate of 10 l/s/m for pedestrians.
The flood levels assessed indicate that flooding depths up to 1.0m on the Swimming Pool site and 0.2m on
the Office site could be expected under existing conditions. Under future conditions these depths could be
expected to rise to 1.6m and 0.8m respectively.
The effects of overtopping volumes and overland flow from fluvial sources are in addition to the flood levels
assessed and would require to be taken into account in setting finished floor levels and in the detailed
design of the structure skeleton, fabric and ground surfacing. For the Swimming Pool and Office sites, and
subject to further analysis, providing a minimum finished floor level of 5.1m AOD would therefore be
recommended to take account of a 1:200 AEP event including climate change, with a freeboard of 300mm
above an average design flood level of 4.8m AOD.
Additional investigations would be required during the detailed design phase of the works to address the
effects of overtopping of the sea defences and the requirements for surface water drainage arrangements.
Argyll and Bute Council Proposed Development at Helensburgh
2 November 2011
2 Introduction URS Scott Wilson was engaged by Mace on behalf of Argyll and Bute Council (ABC), under a framework
agreement, to undertake a Flood Risk Assessment (FRA) for three adjacent sites in Helensburgh along
West Clyde Street and East Clyde Street (Figure 1 and 2 ). This FRA supports planning applications to be
submitted for two of these three sites.
The three subject sites are situated on the northern side of the Clyde Estuary in the centre of Helensburgh,
where historically the sites have been at risk of coastal flooding. The sites are also in close proximity to two
culverted watercourses running through the town of Helensburgh before discharging to the Firth of Clyde.
ABC has requested that a study be undertaken to investigate the risk of flooding to the subject sites from
both coastal and fluvial flooding.
This study comprises work to determine the cause of flooding, the extent of flooding, and to give outline
flood management solutions in association with a future planning application for the proposed
developments. The planning applications to which this FRA relates are the Swimming Pool and mixed
development on the Pier Head site and the Office development site on West Clyde Street.
Argyll and Bute Council Proposed Development at Helensburgh
3 November 2011
3 Background 3.1 Site Description The study area compromises three adjacent sites located along the sea front on the northern shore of the
Firth of Clyde in the centre of Helensburgh (Refer to Figure 1). The subject sites are situated on the sea
front between East and West Clyde Street (the A814) and the foreshore. The three subject sites have been
defined by ABC as; the CHORD site, the Swimming Pool site and the Office site (Refer to Figure 2). The
development proposed for each site is described in Section 2.2.
The existing CHORD site occupies a narrow strip of land, some 10m to 15m wide, between the A814 and
the foreshore, and to the west of the swimming pool site at the pier. (See Photo 1 and Photo 2 in Appendix
B). The site is relatively flat and comprises landscaped grassed areas with planting beds and architectural
features. There is a footpath strip, 3m to 4m wide, immediately above the sea wall at a level between 3.4m
and 3.9m AOD compared to 0.50 m to 1.00m AOD for the adjacent beach area. The remainder of the area
is landscaped with a general level of between 4.0m to 4.5 m AOD with a seating wall adjacent to the sea
wall footpath.
At the centre of the CHORD site the Glennan Burn discharges into the Firth of Clyde via a rectangular low
arched culvert that crosses beneath the A814 with a bed level of approximately 1.00m AOD (Photo 3). The
Glennan Burn is predominantly culverted through Helensburgh though there are a number of open channel
sections along its length, all sections being in private property other than the culvert sections under roads.
The Swimming Pool site is presently used mainly as a car park, with the Swimming Pool building and
amusement park located towards the north end. The site is approximately 2.80Ha in size and roughly
rectangular in shape, predominantly surfaced in tarmac, of varying condition (Photo 4). The eastern and
southern boundaries of the site are bounded by the beach and the Firth of Clyde, whilst the western and
northern sides provide access between the pierhead itself and East and West Clyde Street. Sea defences
– rock armour and rock filled gabion baskets/mattresses - have been constructed where the site is subject
to wave effects from the Firth of Clyde. Along the eastern edge, the sea defences are in the form of heavily
eroded gabions (Photo 5) and there is rock armour on the southern side (Photo 6) and a vertical stone sea
wall on the western side.
The Swimming Pool Site is generally flat with an approximate level of 3.10m-3.20m AOD; however there is
a depression adjacent to the amusement park with a level of approximately 2.95m AOD (Photo 7). The
profile of the A814 at the northern end of this site is some 1.5m above the levels of the road to the east and
west, and the general level of the Swimming Pool Site.
Argyll and Bute Council Proposed Development at Helensburgh
4 November 2011
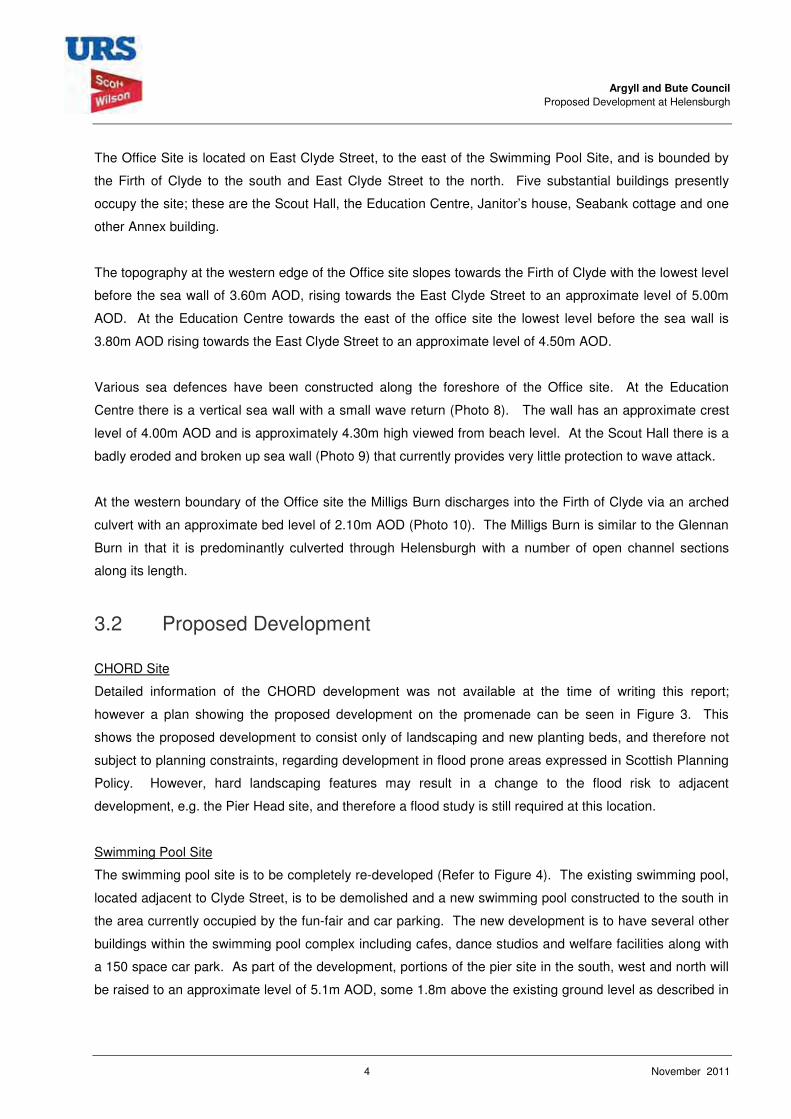
The Office Site is located on East Clyde Street, to the east of the Swimming Pool Site, and is bounded by
the Firth of Clyde to the south and East Clyde Street to the north. Five substantial buildings presently
occupy the site; these are the Scout Hall, the Education Centre, Janitor’s house, Seabank cottage and one
other Annex building.
The topography at the western edge of the Office site slopes towards the Firth of Clyde with the lowest level
before the sea wall of 3.60m AOD, rising towards the East Clyde Street to an approximate level of 5.00m
AOD. At the Education Centre towards the east of the office site the lowest level before the sea wall is
3.80m AOD rising towards the East Clyde Street to an approximate level of 4.50m AOD.
Various sea defences have been constructed along the foreshore of the Office site. At the Education
Centre there is a vertical sea wall with a small wave return (Photo 8). The wall has an approximate crest
level of 4.00m AOD and is approximately 4.30m high viewed from beach level. At the Scout Hall there is a
badly eroded and broken up sea wall (Photo 9) that currently provides very little protection to wave attack.
At the western boundary of the Office site the Milligs Burn discharges into the Firth of Clyde via an arched
culvert with an approximate bed level of 2.10m AOD (Photo 10). The Milligs Burn is similar to the Glennan
Burn in that it is predominantly culverted through Helensburgh with a number of open channel sections
along its length.
3.2 Proposed Development CHORD Site
Detailed information of the CHORD development was not available at the time of writing this report;
however a plan showing the proposed development on the promenade can be seen in Figure 3. This
shows the proposed development to consist only of landscaping and new planting beds, and therefore not
subject to planning constraints, regarding development in flood prone areas expressed in Scottish Planning
Policy. However, hard landscaping features may result in a change to the flood risk to adjacent
development, e.g. the Pier Head site, and therefore a flood study is still required at this location.
Swimming Pool Site
The swimming pool site is to be completely re-developed (Refer to Figure 4). The existing swimming pool,
located adjacent to Clyde Street, is to be demolished and a new swimming pool constructed to the south in
the area currently occupied by the fun-fair and car parking. The new development is to have several other
buildings within the swimming pool complex including cafes, dance studios and welfare facilities along with
a 150 space car park. As part of the development, portions of the pier site in the south, west and north will
be raised to an approximate level of 5.1m AOD, some 1.8m above the existing ground level as described in
Argyll and Bute Council Proposed Development at Helensburgh
5 November 2011
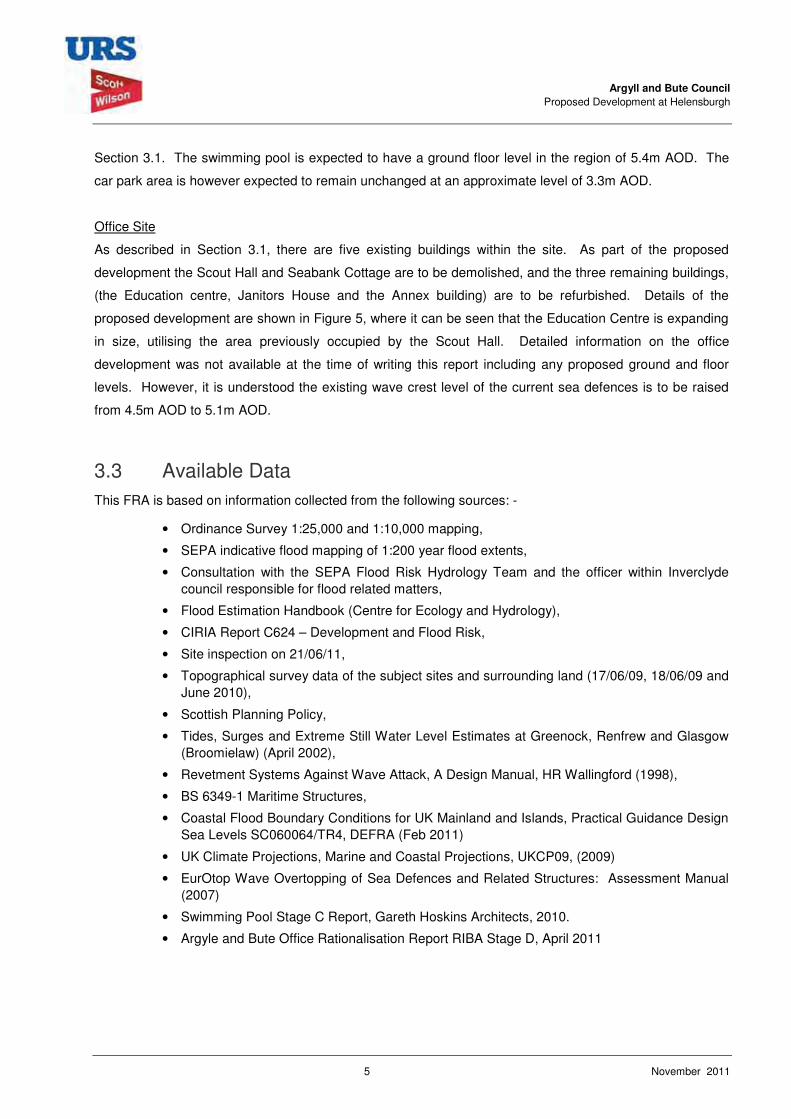
Section 3.1. The swimming pool is expected to have a ground floor level in the region of 5.4m AOD. The
car park area is however expected to remain unchanged at an approximate level of 3.3m AOD.
Office Site
As described in Section 3.1, there are five existing buildings within the site. As part of the proposed
development the Scout Hall and Seabank Cottage are to be demolished, and the three remaining buildings,
(the Education centre, Janitors House and the Annex building) are to be refurbished. Details of the
proposed development are shown in Figure 5, where it can be seen that the Education Centre is expanding
in size, utilising the area previously occupied by the Scout Hall. Detailed information on the office
development was not available at the time of writing this report including any proposed ground and floor
levels. However, it is understood the existing wave crest level of the current sea defences is to be raised
from 4.5m AOD to 5.1m AOD.
3.3 Available Data This FRA is based on information collected from the following sources: -
• Ordinance Survey 1:25,000 and 1:10,000 mapping,
• SEPA indicative flood mapping of 1:200 year flood extents,
• Consultation with the SEPA Flood Risk Hydrology Team and the officer within Inverclyde council responsible for flood related matters,
• Flood Estimation Handbook (Centre for Ecology and Hydrology),
• CIRIA Report C624 – Development and Flood Risk,
• Site inspection on 21/06/11,
• Topographical survey data of the subject sites and surrounding land (17/06/09, 18/06/09 and June 2010),
• Scottish Planning Policy,
• Tides, Surges and Extreme Still Water Level Estimates at Greenock, Renfrew and Glasgow (Broomielaw) (April 2002),
• Revetment Systems Against Wave Attack, A Design Manual, HR Wallingford (1998),
• BS 6349-1 Maritime Structures,
• Coastal Flood Boundary Conditions for UK Mainland and Islands, Practical Guidance Design Sea Levels SC060064/TR4, DEFRA (Feb 2011)
• UK Climate Projections, Marine and Coastal Projections, UKCP09, (2009)
• EurOtop Wave Overtopping of Sea Defences and Related Structures: Assessment Manual (2007)
• Swimming Pool Stage C Report, Gareth Hoskins Architects, 2010.
• Argyle and Bute Office Rationalisation Report RIBA Stage D, April 2011
Argyll and Bute Council Proposed Development at Helensburgh
6 November 2011
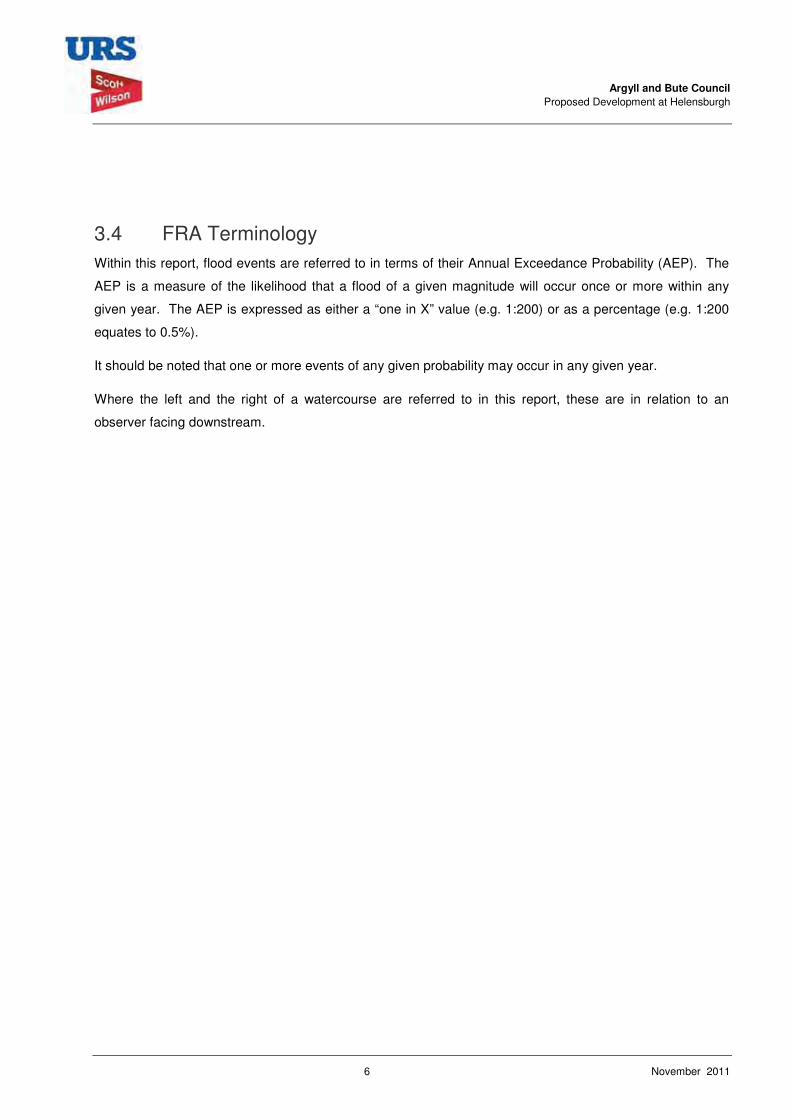
3.4 FRA Terminology Within this report, flood events are referred to in terms of their Annual Exceedance Probability (AEP). The
AEP is a measure of the likelihood that a flood of a given magnitude will occur once or more within any
given year. The AEP is expressed as either a “one in X” value (e.g. 1:200) or as a percentage (e.g. 1:200
equates to 0.5%).
It should be noted that one or more events of any given probability may occur in any given year.
Where the left and the right of a watercourse are referred to in this report, these are in relation to an
observer facing downstream.
Argyll and Bute Council Proposed Development at Helensburgh
7 November 2011
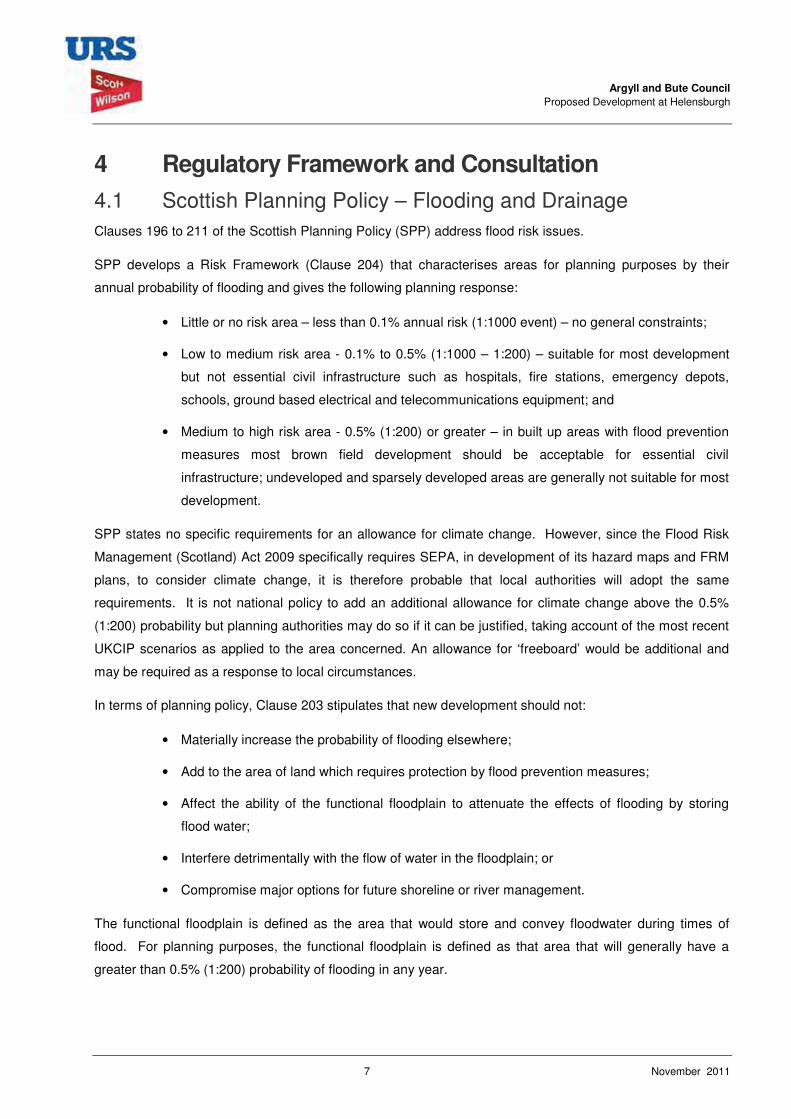
4 Regulatory Framework and Consultation 4.1 Scottish Planning Policy – Flooding and Drainage Clauses 196 to 211 of the Scottish Planning Policy (SPP) address flood risk issues.
SPP develops a Risk Framework (Clause 204) that characterises areas for planning purposes by their
annual probability of flooding and gives the following planning response:
• Little or no risk area – less than 0.1% annual risk (1:1000 event) – no general constraints;
• Low to medium risk area - 0.1% to 0.5% (1:1000 – 1:200) – suitable for most development
but not essential civil infrastructure such as hospitals, fire stations, emergency depots,
schools, ground based electrical and telecommunications equipment; and
• Medium to high risk area - 0.5% (1:200) or greater – in built up areas with flood prevention
measures most brown field development should be acceptable for essential civil
infrastructure; undeveloped and sparsely developed areas are generally not suitable for most
development.
SPP states no specific requirements for an allowance for climate change. However, since the Flood Risk
Management (Scotland) Act 2009 specifically requires SEPA, in development of its hazard maps and FRM
plans, to consider climate change, it is therefore probable that local authorities will adopt the same
requirements. It is not national policy to add an additional allowance for climate change above the 0.5%
(1:200) probability but planning authorities may do so if it can be justified, taking account of the most recent
UKCIP scenarios as applied to the area concerned. An allowance for ‘freeboard’ would be additional and
may be required as a response to local circumstances.
In terms of planning policy, Clause 203 stipulates that new development should not:
• Materially increase the probability of flooding elsewhere;
• Add to the area of land which requires protection by flood prevention measures;
• Affect the ability of the functional floodplain to attenuate the effects of flooding by storing
flood water;
• Interfere detrimentally with the flow of water in the floodplain; or
• Compromise major options for future shoreline or river management.
The functional floodplain is defined as the area that would store and convey floodwater during times of
flood. For planning purposes, the functional floodplain is defined as that area that will generally have a
greater than 0.5% (1:200) probability of flooding in any year.
Argyll and Bute Council Proposed Development at Helensburgh
8 November 2011
4.2 Consultations
4.2.1 Argyll and Bute Council
Grant Whyte (ABC Flood Liason Officer (FLO)) has advised there are flooding problems on a culverted
section of the Glennan Burn between West Princes Street and West King Street. Debris snagging on the
culvert support structure caused flooding of property and overland flow down William Street and onto the
foreshore.
Flooding problems also exist on West Clyde Street where gully tails close to William Street surcharge
during high tides causing flooding to adjacent properties. This is understood to be a long term problem
associated with the combined drainage systems in the area under the control of Scottish Water.
It is understood there are also flooding problems on East Clyde Street adjacent to George Street, east of
the Office site, associated with the capacity of the Scottish Water network though this does not impact upon
the present sites being addressed in this report.
Council Biennial Reports (2009) provide no flooding information with respect to flooding in Helensburgh
adjacent to the sites in question. A data-base of the flooding problems in Helensburgh is in the process of
being compiled, although much of the information appears to be anecdotal and of a local nature.
4.2.2 SEPA
The SEPA indicative flood map shows that the subject site lies within the 1:200 flood envelope. Although
this mapping is not suitable to determine flood risk to individual development sites, it does indicate a
potential risk to an area from coastal flooding.
SEPA were consulted in relation to historical flooding records and guidance on the methodology to be used
in estimating extreme sea levels/wave heights, climate change and joint probabilities.
In an email dated 14/07/11, SEPA advised that no records of historical flooding exist for the subject site.
SEPA also reported a 1:200 extreme sea level in the area of 3.69 m AOD using the DEFRA publication
“Coastal Flood boundary Conditions for Mainland and Islands” (SC060064/TR4) – (DEFRA method). SEPA
also reported that the River Clyde Flood Management Strategy Hydrodynamic Modelling Report prepared
by consulting engineers Halcrow and Fairhurst would suggest a 1:200 level of 3.96m AOD.
Following liaison with SEPA, the higher figure (3.96m AOD) was adopted for this present study, with tide
levels for other AEP events derived from the DEFRA method and adjusted on a pro rata basis. (see section
5.5.1).
Argyll and Bute Council Proposed Development at Helensburgh
9 November 2011
4.2.3 Scottish Water
Scottish Water Connections were contacted to provide information on the surface and combined drainage
systems in Helensburgh. There would appear to be limitations to the capacity of the system especially
during high tide scenarios, and large storage tanks are understood to have been constructed beneath the
esplanade on West and East Clyde Street to handle excess runoff during high tide events.
Further details of the drainage network are unknown at the time of preparing this report. Based on
information available, it is understood there are no direct flooding issues that might impact on the three sites
on West and East Clyde Street. Indirect flooding could potentially occur as a result of surcharging of the
drainage system causing overland flow to pass through or adjacent to the sites.
4.2.4 Local Residents
During the site visit on 21st June 2011, one local resident (from 26 East Clyde Street) reported that coastal
flooding had occurred within their property and garden. The resident reported that high sea levels and
breaking waves have been known to enter the property.
This property is located between the Swimming Pool and Office Developments where ABC currently have
to establish a shoreline pedestrian walkway to connect the two sites with a potential slipway to allow sea-
kayakers access to the shore.
4.2.5 Network Rail
Network Rail were contacted to provide information on any flooding issues that have occurred at the
culverts on the Glennan Burn and Milligs Burn where these cross beneath the railway. Network Rail
responded with the following comments;
‘The railway at these locations is in a cutting and we experience an inflow of water either during heavy
periods of rainfall and from a combination of surface water runoff from the surrounding environment. We
have in place crest drains that lead into channels which are connected into the track drainage which in turn
is culverted under the railway and outfalls to the appropriate watercourse or sewer network.
However the main location in which we experience an inflow of water form the surrounding area above the
railway cutting is along East Rossdhu Drive (Milligs Burn), especially at the overbridge at which the track
and rock cutting experiences constant trickling from the road above, and similarly the cutting adjacent to
Butt Avenue/Easterhill Road.’
Argyll and Bute Council Proposed Development at Helensburgh
10 November 2011
The cutting in this area is primarily a rock fall and we have a programme of works to undertake substantial
rock fall protection and associated drainage works in 2015/16.
These drainage effects are however not directly relevant to the subject sites.
4.2.6 Web Search
Various articles were found, during a basic web search, relating to localised flooding in and around
Helensburgh. There were several cases of flooding following periods of heavy rainfall, causing Scottish
Water storm networks to surcharge. In some of these cases it is possible that the surcharged flows would
cross the subject sites as overland flow. Flooding occurring after heavy rainfall has also flooded low lying
areas and basements along Sinclair Street, which required Fire and Rescue teams to pump away excess
flood waters.
Argyll and Bute Council Proposed Development at Helensburgh
11 November 2011
5 Flood Flow and Level Estimation
5.1 Historical Flooding Following discussions with ABC, it is understood that the sea front at Helensburgh along East/West Clyde
Street is susceptible to coastal flooding. Historical photographs and newspapers supplied by ABC show
widespread coastal flooding dating back to 1922. The records show that coastal flooding has taken place in
1922, 1961, 2002 and 2004. Previous studies have highlighted the potential impact of coastal flooding. A
report compiled by Halcrow in 20011 stated that the highest sea level recorded at Helensburgh was
experienced on 5th January 1991 (3.71m AOD). This report incorporated future climate change and
concluded that future developments along the sea front should have ground floor levels in the range from
4.0m to 5.1m AOD in order to protect against extreme tide levels. The report also identified that wave
barriers and sea walls should be installed to protect against future wave action. (Note: The current general
ground level along East/West Clyde Street is between 4.2 and 4.5m AOD and rising to around 5.0m AOD
locally either side of Sinclair Street).
ABC has also reported that in other events, flooding has occurred along the Glennan Burn due to high
rainfall coinciding with high tides. In an event in 2005 this resulted in water surcharging the culverts along
the Glennan Burn and flooding local properties adjacent to open channel portions of the burn.
The Council biennial flooding report for 2009, which covers flooding incidents recorded between November
2007 and November 2009, does not record any flooding along Helensburgh sea front over that period.
However, Grant Whyte, (ABC FLO), has advised that the recording of flooding incidents has not been fully
documented and that it is common practice for ABC Roads DLO to put out sandbags along Helensburgh
sea front to protect properties during high tide events. He noted that localised flooding is more frequent
than the records portray.
5.2 Fluvial Flooding Although coastal flooding is considered to be the dominant source of flood risk, it is recognised that fluvial
flooding must also be considered, as the sea levels can impact the Glennan and Milligs Burns. As full
fluvial modelling is not part of the scope of this report, a simplified hydraulic model of each burn has been
constructed to determine potential flooding along the watercourses.
The culverts on both the watercourses are key constraints, and the hydraulic modelling allowed the effect of
these constraints to be determined and assessed. A full analysis of the culvert capacity is described later in
this report. (Section 6.4)
1 Ref. URS Helensburgh Pier Head Desk Study Report, July 2008
Argyll and Bute Council Proposed Development at Helensburgh
12 November 2011
Based on a site walkover survey and the general topography of the area, flood water arising from either of
these watercourses would appear not to have a direct impact on the subject sites. However, overland flow
arising from these watercourses could pass onto, or adjacent to, the subject sites prior to finding an
overland flow route to the Firth of Clyde.
5.2.1 Catchment Descriptions
Catchment descriptors for the Glennan Burn and the Milligs Burn were assessed at several locations within
Helensburgh (refer to Figure 6).
Glennan Burn
The Glennan Burn drains an area of the Fruin Hill which rises to the north west of Helensburgh (see Figure
6). Above the railway line, it flows in a natural watercourse. From the railway line down to the A814 and its
outfall at the Firth of Clyde, the burn runs in segments of open channel, interspersed with sections of
culverting. The catchment area of the outfall is estimated to be 1.62km2, based on the FEH CD-ROM
Version 2.
Milligs Burn
The Milligs Burn also drains an area of the Fruin Hill (see Figure 6). Above the railway line the watercourse
course has been modified to incorporate two reservoirs, however as a worst case design consideration no
attenuation effects have been considered. Again, from the railway line down to the A814 and its outfall at
the Firth of Clyde, the burn runs in segments of open channel, interspersed with sections of culverting. The
catchment area of the outfall is estimated to be 2.34km2, based on the FEH CD-ROM Version 2.
5.2.2 Hydrological Fluvial Model Options and development
The industry standard for the assessment of flood flows in the UK is the ‘Flood Estimation Handbook’
(FEH), published by the Institute of Hydrology in 1999 (now the Centre for Ecology and Hydrology). Current
methods of flood flow estimation in the UK can be broadly defined as follows:
• Statistical analysis procedures using gauged data. The FEH recommends this as the
preferred method in most instances;
• Rainfall-runoff based approaches using hydrological models and generating a runoff
hydrograph;
• The Institute of Hydrology Report Number 124 (IH124) method for small catchments
• Combinations of the above.
Argyll and Bute Council Proposed Development at Helensburgh
13 November 2011
The FEH discusses the factors influencing the choice between the methods for flow estimation. In general,
flood flow estimations determined by the Rainfall Runoff method are typically more uncertain than those
obtained from the statistical method. Furthermore, for use of either method, adjustments should be made
by data transfers from nearby or similar catchments. Further details relevant to the selection of the flood
flow estimation method for the subject site are as follows:
• Statistical methods are generally more applicable to large catchments exceeding 100 km2.
The Glennan and Milligs Burn catchment areas at the site are significantly below this
threshold. Furthermore, no gauged flow data is available for these burns entering
Helensburgh. Gauged flow data should always be used where possible. No flow data is
available for these watercourses either.
• Rainfall-runoff approaches using hydrological models are more appropriate for smaller
catchments that are more likely to experience a catchment-wide design storm, with the FEH
rainfall-runoff procedures relevant to catchments of a size larger than 0.5 km2. The Rainfall-
runoff method is therefore appropriate and has been used in this assessment.
• The IH124 Method is a flood estimation method for small catchments below 25 km2.
Rainfall Runoff Method
The FEH Rainfall-Runoff (FEH R-R) method applies a unit hydrograph to standardised rainfall data in order
to compute a final flood hydrograph. The FEH R-R method relies on three key variables to reflect the
catchment characteristics: TP (0) (time to peak of the unit hydrograph), SPR (standard percentage runoff)
and BF (base flow).
Local data for verification of the above parameters was not readily available, and therefore the flow estimate
was based on catchment descriptors provided by the FEH CD-ROM. The results of the Rainfall-Runoff
analysis are summarised in Table 1.
IH124 Method
The IH124 method calculates return period flow values based on parameters including soil type and
catchment descriptors obtained from the FEH CD-ROM Version 2. This method generates an average
stream flow (Qbar). Regional growth curves for the British Isles which were presented in the earlier Flood
Studies Report can then be used to convert Qbar to return period flows. The results of the IH124 analysis
are contained in Table 1.
5.3 Fluvial Hydrological Model Results and Climate Change In this assessment design flows were estimated using the IH124 and the FEH Rainfall Runoff method. The
results from each method provided in Tables 1 and 2.
Argyll and Bute Council Proposed Development at Helensburgh
14 November 2011
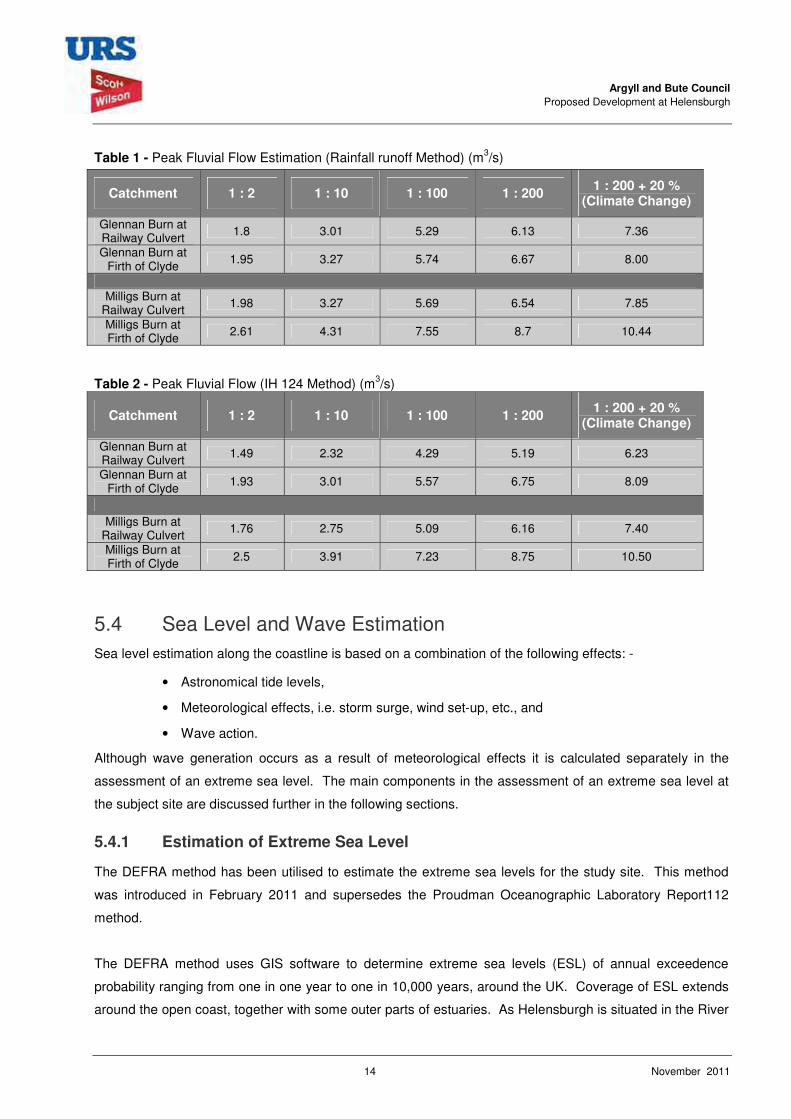
Table 1 - Peak Fluvial Flow Estimation (Rainfall runoff Method) (m3/s)
Catchment 1 : 2 1 : 10 1 : 100 1 : 200 1 : 200 + 20 % (Climate Change)
Glennan Burn at Railway Culvert 1.8 3.01 5.29 6.13 7.36
Glennan Burn at Firth of Clyde
1.95 3.27 5.74 6.67 8.00
Milligs Burn at
Railway Culvert 1.98 3.27 5.69 6.54 7.85
Milligs Burn at Firth of Clyde 2.61 4.31 7.55 8.7 10.44
Table 2 - Peak Fluvial Flow (IH 124 Method) (m3/s)
Catchment 1 : 2 1 : 10 1 : 100 1 : 200 1 : 200 + 20 % (Climate Change)
Glennan Burn at Railway Culvert 1.49 2.32 4.29 5.19 6.23
Glennan Burn at Firth of Clyde
1.93 3.01 5.57 6.75 8.09
Milligs Burn at
Railway Culvert 1.76 2.75 5.09 6.16 7.40
Milligs Burn at Firth of Clyde
2.5 3.91 7.23 8.75 10.50
5.4 Sea Level and Wave Estimation Sea level estimation along the coastline is based on a combination of the following effects: -
• Astronomical tide levels,
• Meteorological effects, i.e. storm surge, wind set-up, etc., and
• Wave action.
Although wave generation occurs as a result of meteorological effects it is calculated separately in the
assessment of an extreme sea level. The main components in the assessment of an extreme sea level at
the subject site are discussed further in the following sections.
5.4.1 Estimation of Extreme Sea Level
The DEFRA method has been utilised to estimate the extreme sea levels for the study site. This method
was introduced in February 2011 and supersedes the Proudman Oceanographic Laboratory Report112
method.
The DEFRA method uses GIS software to determine extreme sea levels (ESL) of annual exceedence
probability ranging from one in one year to one in 10,000 years, around the UK. Coverage of ESL extends
around the open coast, together with some outer parts of estuaries. As Helensburgh is situated in the River
Argyll and Bute Council Proposed Development at Helensburgh
15 November 2011
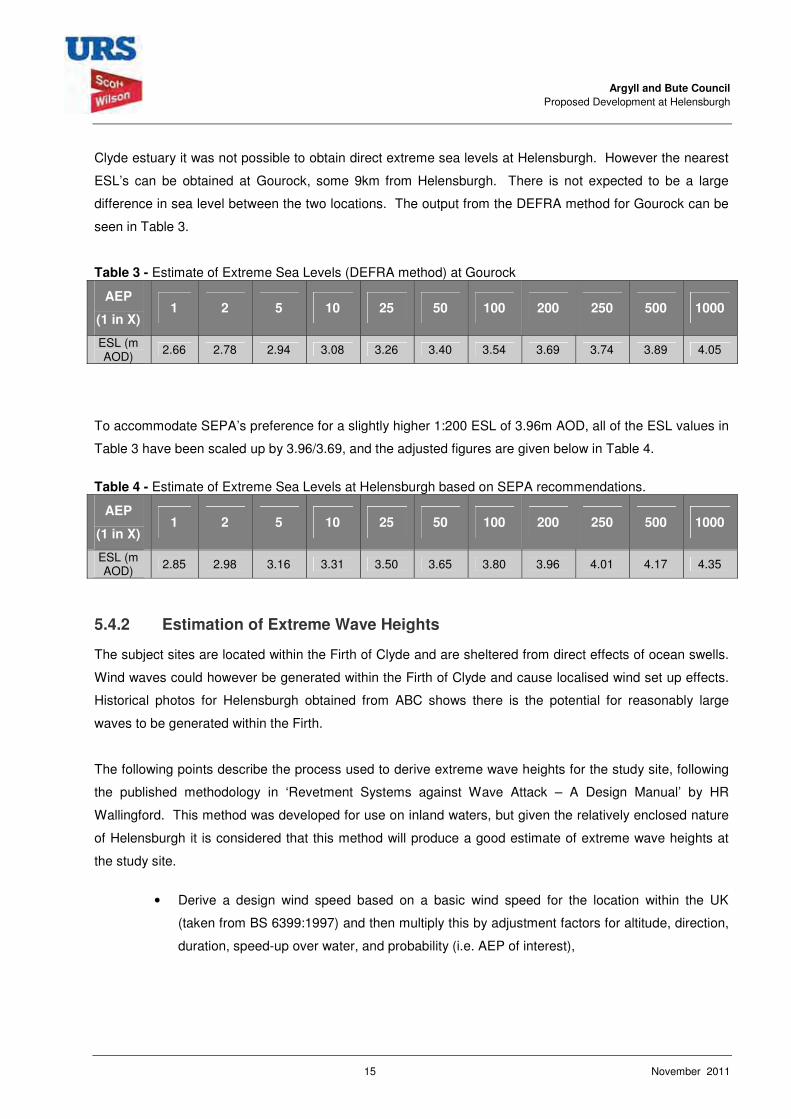
Clyde estuary it was not possible to obtain direct extreme sea levels at Helensburgh. However the nearest
ESL’s can be obtained at Gourock, some 9km from Helensburgh. There is not expected to be a large
difference in sea level between the two locations. The output from the DEFRA method for Gourock can be
seen in Table 3.
Table 3 - Estimate of Extreme Sea Levels (DEFRA method) at Gourock
AEP
(1 in X) 1 2 5 10 25 50 100 200 250 500 1000
ESL (m AOD)
2.66 2.78 2.94 3.08 3.26 3.40 3.54 3.69 3.74 3.89 4.05
To accommodate SEPA’s preference for a slightly higher 1:200 ESL of 3.96m AOD, all of the ESL values in
Table 3 have been scaled up by 3.96/3.69, and the adjusted figures are given below in Table 4.
Table 4 - Estimate of Extreme Sea Levels at Helensburgh based on SEPA recommendations.
AEP
(1 in X) 1 2 5 10 25 50 100 200 250 500 1000
ESL (m AOD) 2.85 2.98 3.16 3.31 3.50 3.65 3.80 3.96 4.01 4.17 4.35
5.4.2 Estimation of Extreme Wave Heights
The subject sites are located within the Firth of Clyde and are sheltered from direct effects of ocean swells.
Wind waves could however be generated within the Firth of Clyde and cause localised wind set up effects.
Historical photos for Helensburgh obtained from ABC shows there is the potential for reasonably large
waves to be generated within the Firth.
The following points describe the process used to derive extreme wave heights for the study site, following
the published methodology in ‘Revetment Systems against Wave Attack – A Design Manual’ by HR
Wallingford. This method was developed for use on inland waters, but given the relatively enclosed nature
of Helensburgh it is considered that this method will produce a good estimate of extreme wave heights at
the study site.
• Derive a design wind speed based on a basic wind speed for the location within the UK
(taken from BS 6399:1997) and then multiply this by adjustment factors for altitude, direction,
duration, speed-up over water, and probability (i.e. AEP of interest),
Argyll and Bute Council Proposed Development at Helensburgh
16 November 2011
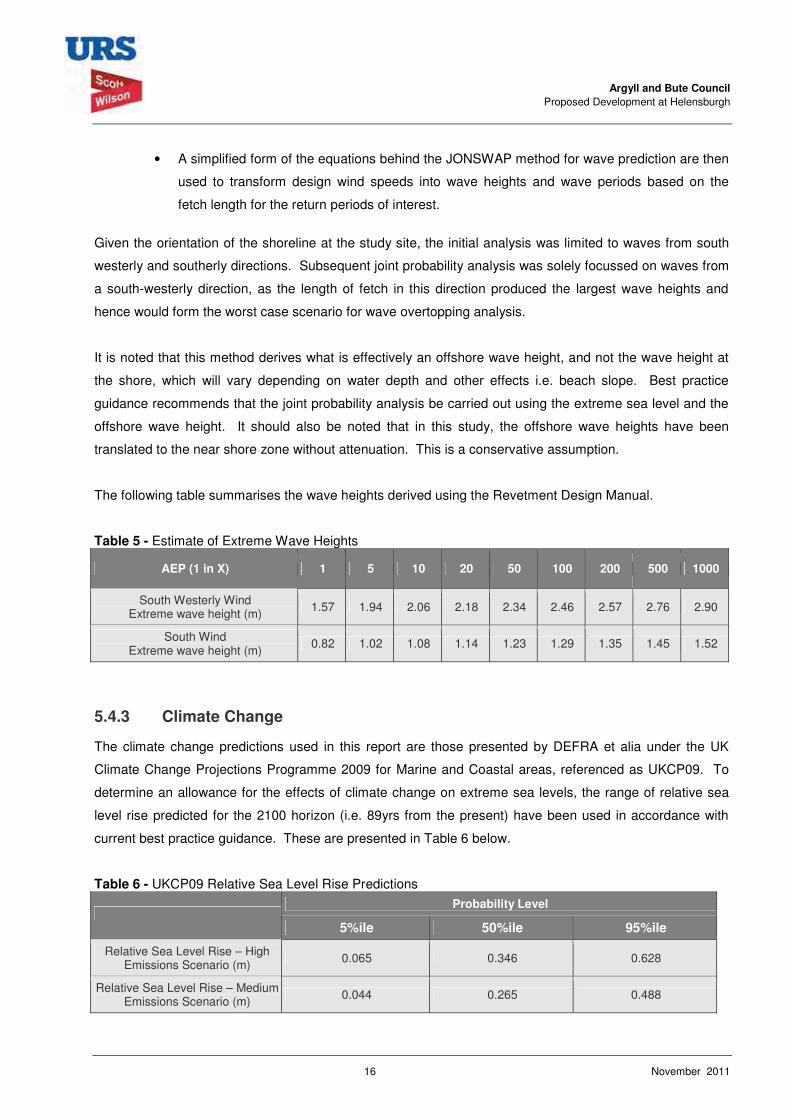
• A simplified form of the equations behind the JONSWAP method for wave prediction are then
used to transform design wind speeds into wave heights and wave periods based on the
fetch length for the return periods of interest.
Given the orientation of the shoreline at the study site, the initial analysis was limited to waves from south
westerly and southerly directions. Subsequent joint probability analysis was solely focussed on waves from
a south-westerly direction, as the length of fetch in this direction produced the largest wave heights and
hence would form the worst case scenario for wave overtopping analysis.
It is noted that this method derives what is effectively an offshore wave height, and not the wave height at
the shore, which will vary depending on water depth and other effects i.e. beach slope. Best practice
guidance recommends that the joint probability analysis be carried out using the extreme sea level and the
offshore wave height. It should also be noted that in this study, the offshore wave heights have been
translated to the near shore zone without attenuation. This is a conservative assumption.
The following table summarises the wave heights derived using the Revetment Design Manual.
Table 5 - Estimate of Extreme Wave Heights
AEP (1 in X) 1 5 10 20 50 100 200 500 1000
South Westerly Wind Extreme wave height (m) 1.57 1.94 2.06 2.18 2.34 2.46 2.57 2.76 2.90
South Wind Extreme wave height (m)
0.82 1.02 1.08 1.14 1.23 1.29 1.35 1.45 1.52
5.4.3 Climate Change
The climate change predictions used in this report are those presented by DEFRA et alia under the UK
Climate Change Projections Programme 2009 for Marine and Coastal areas, referenced as UKCP09. To
determine an allowance for the effects of climate change on extreme sea levels, the range of relative sea
level rise predicted for the 2100 horizon (i.e. 89yrs from the present) have been used in accordance with
current best practice guidance. These are presented in Table 6 below.
Table 6 - UKCP09 Relative Sea Level Rise Predictions Probability Level
5%ile 50%ile 95%ile
Relative Sea Level Rise – High Emissions Scenario (m) 0.065 0.346 0.628
Relative Sea Level Rise – Medium Emissions Scenario (m) 0.044 0.265 0.488
Argyll and Bute Council Proposed Development at Helensburgh
17 November 2011
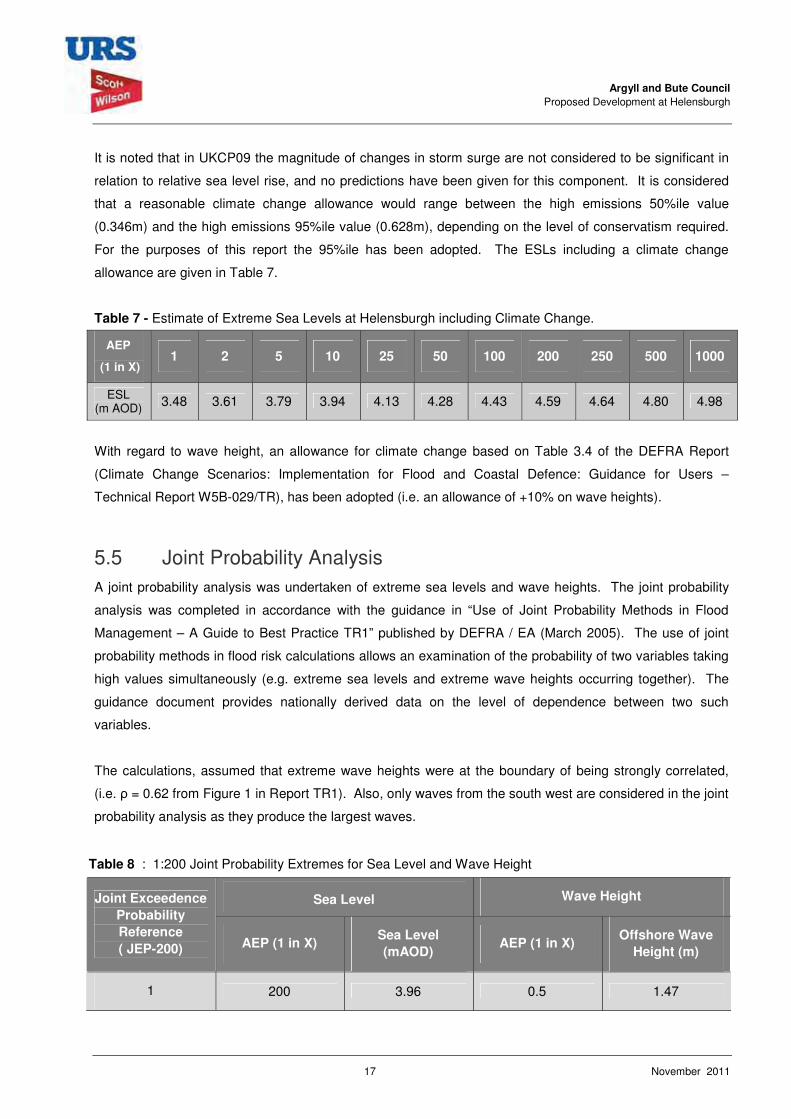
It is noted that in UKCP09 the magnitude of changes in storm surge are not considered to be significant in
relation to relative sea level rise, and no predictions have been given for this component. It is considered
that a reasonable climate change allowance would range between the high emissions 50%ile value
(0.346m) and the high emissions 95%ile value (0.628m), depending on the level of conservatism required.
For the purposes of this report the 95%ile has been adopted. The ESLs including a climate change
allowance are given in Table 7.
Table 7 - Estimate of Extreme Sea Levels at Helensburgh including Climate Change.
AEP
(1 in X) 1 2 5 10 25 50 100 200 250 500 1000
ESL (m AOD) 3.48 3.61 3.79 3.94 4.13 4.28 4.43 4.59 4.64 4.80 4.98
With regard to wave height, an allowance for climate change based on Table 3.4 of the DEFRA Report
(Climate Change Scenarios: Implementation for Flood and Coastal Defence: Guidance for Users –
Technical Report W5B-029/TR), has been adopted (i.e. an allowance of +10% on wave heights).
5.5 Joint Probability Analysis A joint probability analysis was undertaken of extreme sea levels and wave heights. The joint probability
analysis was completed in accordance with the guidance in “Use of Joint Probability Methods in Flood
Management – A Guide to Best Practice TR1” published by DEFRA / EA (March 2005). The use of joint
probability methods in flood risk calculations allows an examination of the probability of two variables taking
high values simultaneously (e.g. extreme sea levels and extreme wave heights occurring together). The
guidance document provides nationally derived data on the level of dependence between two such
variables.
The calculations, assumed that extreme wave heights were at the boundary of being strongly correlated,
(i.e. = 0.62 from Figure 1 in Report TR1). Also, only waves from the south west are considered in the joint
probability analysis as they produce the largest waves.
Table 8 : 1:200 Joint Probability Extremes for Sea Level and Wave Height
Sea Level Wave Height Joint Exceedence Probability Reference ( JEP-200) AEP (1 in X)
Sea Level (mAOD)
AEP (1 in X) Offshore Wave
Height (m)
1 200 3.96 0.5 1.47
Argyll and Bute Council Proposed Development at Helensburgh
18 November 2011
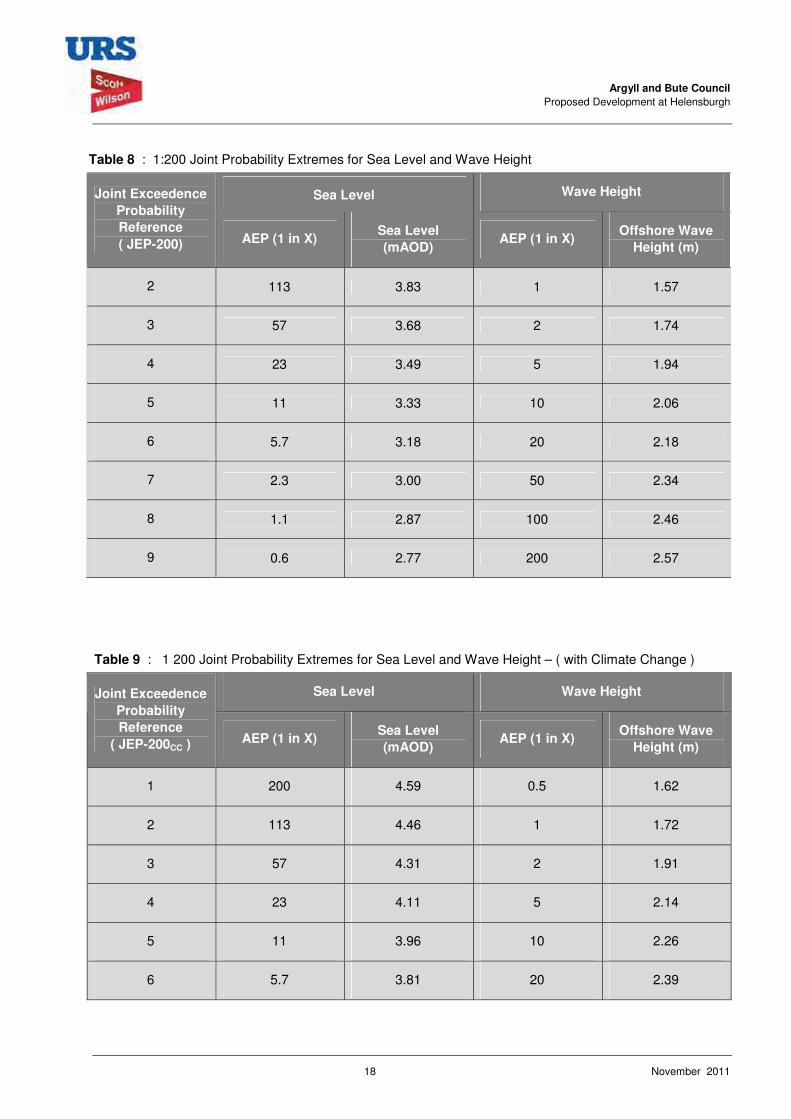
Table 8 : 1:200 Joint Probability Extremes for Sea Level and Wave Height
Sea Level Wave Height Joint Exceedence Probability Reference ( JEP-200) AEP (1 in X)
Sea Level (mAOD)
AEP (1 in X) Offshore Wave
Height (m)
2 113 3.83 1 1.57
3 57 3.68 2 1.74
4 23 3.49 5 1.94
5 11 3.33 10 2.06
6 5.7 3.18 20 2.18
7 2.3 3.00 50 2.34
8 1.1 2.87 100 2.46
9 0.6 2.77 200 2.57
Table 9 : 1 200 Joint Probability Extremes for Sea Level and Wave Height – ( with Climate Change )
Sea Level Wave Height Joint Exceedence Probability Reference
( JEP-200CC ) AEP (1 in X) Sea Level (mAOD)
AEP (1 in X) Offshore Wave
Height (m)
1 200 4.59 0.5 1.62
2 113 4.46 1 1.72
3 57 4.31 2 1.91
4 23 4.11 5 2.14
5 11 3.96 10 2.26
6 5.7 3.81 20 2.39
Argyll and Bute Council Proposed Development at Helensburgh
19 November 2011
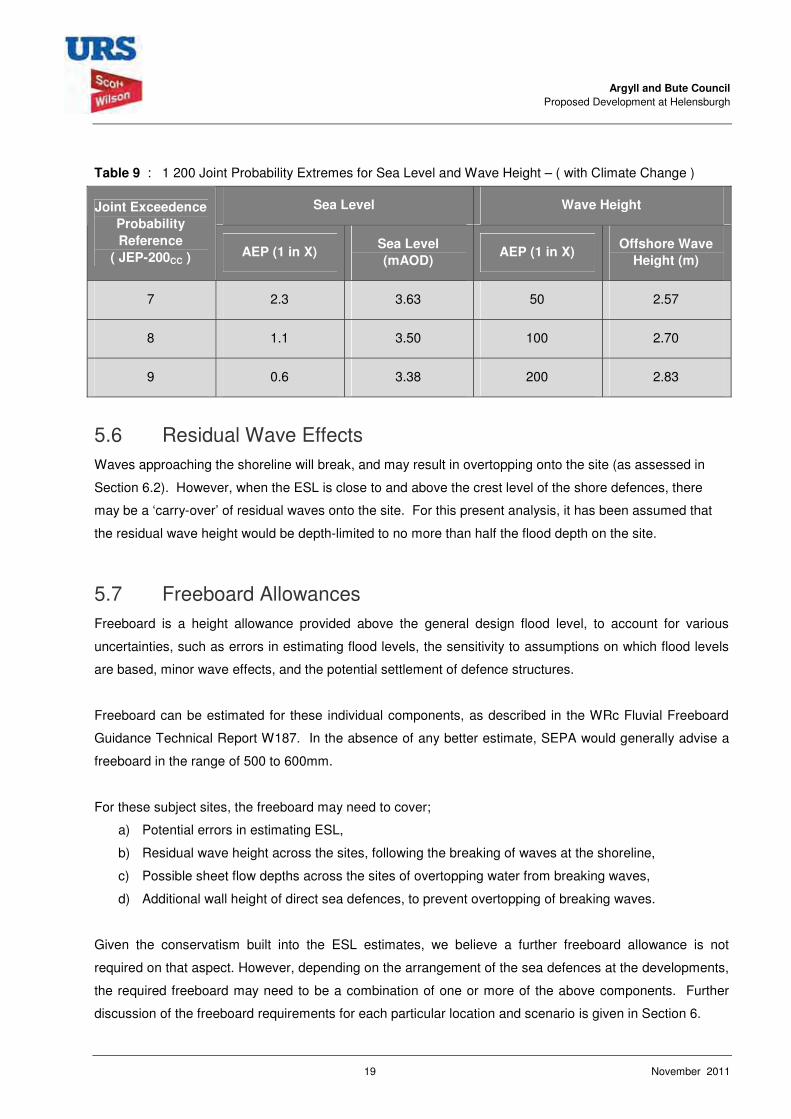
Table 9 : 1 200 Joint Probability Extremes for Sea Level and Wave Height – ( with Climate Change )
Sea Level Wave Height Joint Exceedence Probability Reference
( JEP-200CC ) AEP (1 in X) Sea Level (mAOD)
AEP (1 in X) Offshore Wave
Height (m)
7 2.3 3.63 50 2.57
8 1.1 3.50 100 2.70
9 0.6 3.38 200 2.83
5.6 Residual Wave Effects Waves approaching the shoreline will break, and may result in overtopping onto the site (as assessed in
Section 6.2). However, when the ESL is close to and above the crest level of the shore defences, there
may be a ‘carry-over’ of residual waves onto the site. For this present analysis, it has been assumed that
the residual wave height would be depth-limited to no more than half the flood depth on the site.
5.7 Freeboard Allowances Freeboard is a height allowance provided above the general design flood level, to account for various
uncertainties, such as errors in estimating flood levels, the sensitivity to assumptions on which flood levels
are based, minor wave effects, and the potential settlement of defence structures.
Freeboard can be estimated for these individual components, as described in the WRc Fluvial Freeboard
Guidance Technical Report W187. In the absence of any better estimate, SEPA would generally advise a
freeboard in the range of 500 to 600mm.
For these subject sites, the freeboard may need to cover;
a) Potential errors in estimating ESL,
b) Residual wave height across the sites, following the breaking of waves at the shoreline,
c) Possible sheet flow depths across the sites of overtopping water from breaking waves,
d) Additional wall height of direct sea defences, to prevent overtopping of breaking waves.
Given the conservatism built into the ESL estimates, we believe a further freeboard allowance is not
required on that aspect. However, depending on the arrangement of the sea defences at the developments,
the required freeboard may need to be a combination of one or more of the above components. Further
discussion of the freeboard requirements for each particular location and scenario is given in Section 6.
Argyll and Bute Council Proposed Development at Helensburgh
20 November 2011
6 Flood Risk Assessment 6.1 Extreme Sea Levels
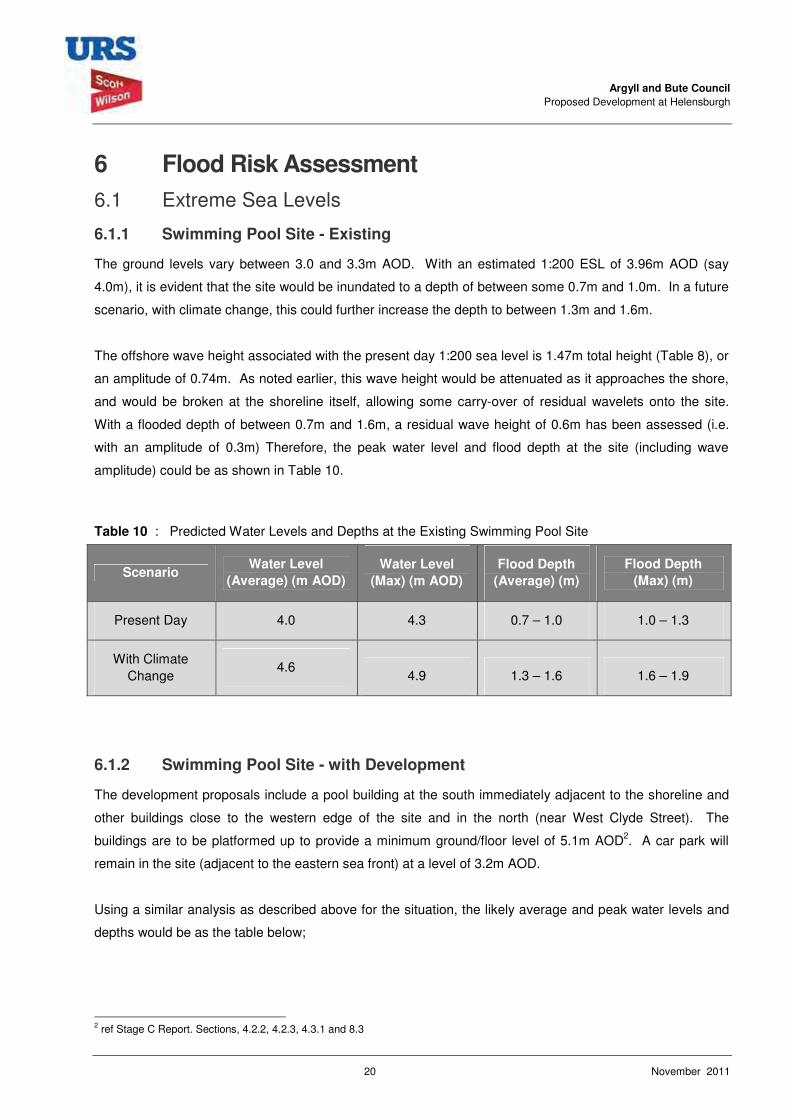
6.1.1 Swimming Pool Site - Existing
The ground levels vary between 3.0 and 3.3m AOD. With an estimated 1:200 ESL of 3.96m AOD (say
4.0m), it is evident that the site would be inundated to a depth of between some 0.7m and 1.0m. In a future
scenario, with climate change, this could further increase the depth to between 1.3m and 1.6m.
The offshore wave height associated with the present day 1:200 sea level is 1.47m total height (Table 8), or
an amplitude of 0.74m. As noted earlier, this wave height would be attenuated as it approaches the shore,
and would be broken at the shoreline itself, allowing some carry-over of residual wavelets onto the site.
With a flooded depth of between 0.7m and 1.6m, a residual wave height of 0.6m has been assessed (i.e.
with an amplitude of 0.3m) Therefore, the peak water level and flood depth at the site (including wave
amplitude) could be as shown in Table 10.
Table 10 : Predicted Water Levels and Depths at the Existing Swimming Pool Site
Scenario Water Level
(Average) (m AOD) Water Level
(Max) (m AOD) Flood Depth
(Average) (m) Flood Depth
(Max) (m)
Present Day 4.0 4.3 0.7 – 1.0 1.0 – 1.3
With Climate Change
4.6 4.9 1.3 – 1.6 1.6 – 1.9
6.1.2 Swimming Pool Site - with Development
The development proposals include a pool building at the south immediately adjacent to the shoreline and
other buildings close to the western edge of the site and in the north (near West Clyde Street). The
buildings are to be platformed up to provide a minimum ground/floor level of 5.1m AOD2. A car park will
remain in the site (adjacent to the eastern sea front) at a level of 3.2m AOD.
Using a similar analysis as described above for the situation, the likely average and peak water levels and
depths would be as the table below;
2 ref Stage C Report. Sections, 4.2.2, 4.2.3, 4.3.1 and 8.3
Argyll and Bute Council Proposed Development at Helensburgh
21 November 2011
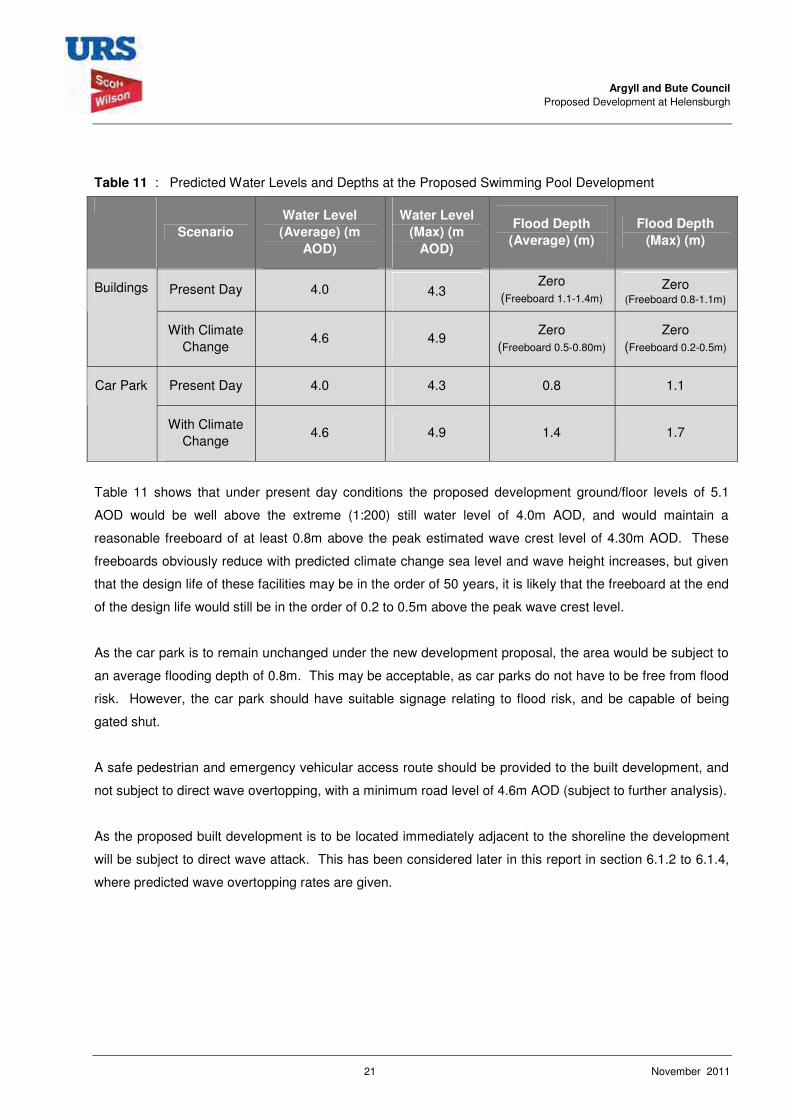
Table 11 : Predicted Water Levels and Depths at the Proposed Swimming Pool Development
Scenario Water Level (Average) (m
AOD)
Water Level (Max) (m
AOD)
Flood Depth (Average) (m)
Flood Depth (Max) (m)
Present Day 4.0 4.3 Zero
(Freeboard 1.1-1.4m) Zero
(Freeboard 0.8-1.1m) Buildings
With Climate Change
4.6 4.9 Zero
(Freeboard 0.5-0.80m) Zero
(Freeboard 0.2-0.5m)
Present Day 4.0 4.3 0.8 1.1 Car Park
With Climate Change
4.6 4.9 1.4 1.7
Table 11 shows that under present day conditions the proposed development ground/floor levels of 5.1
AOD would be well above the extreme (1:200) still water level of 4.0m AOD, and would maintain a
reasonable freeboard of at least 0.8m above the peak estimated wave crest level of 4.30m AOD. These
freeboards obviously reduce with predicted climate change sea level and wave height increases, but given
that the design life of these facilities may be in the order of 50 years, it is likely that the freeboard at the end
of the design life would still be in the order of 0.2 to 0.5m above the peak wave crest level.
As the car park is to remain unchanged under the new development proposal, the area would be subject to
an average flooding depth of 0.8m. This may be acceptable, as car parks do not have to be free from flood
risk. However, the car park should have suitable signage relating to flood risk, and be capable of being
gated shut.
A safe pedestrian and emergency vehicular access route should be provided to the built development, and
not subject to direct wave overtopping, with a minimum road level of 4.6m AOD (subject to further analysis).
As the proposed built development is to be located immediately adjacent to the shoreline the development
will be subject to direct wave attack. This has been considered later in this report in section 6.1.2 to 6.1.4,
where predicted wave overtopping rates are given.
Argyll and Bute Council Proposed Development at Helensburgh
22 November 2011
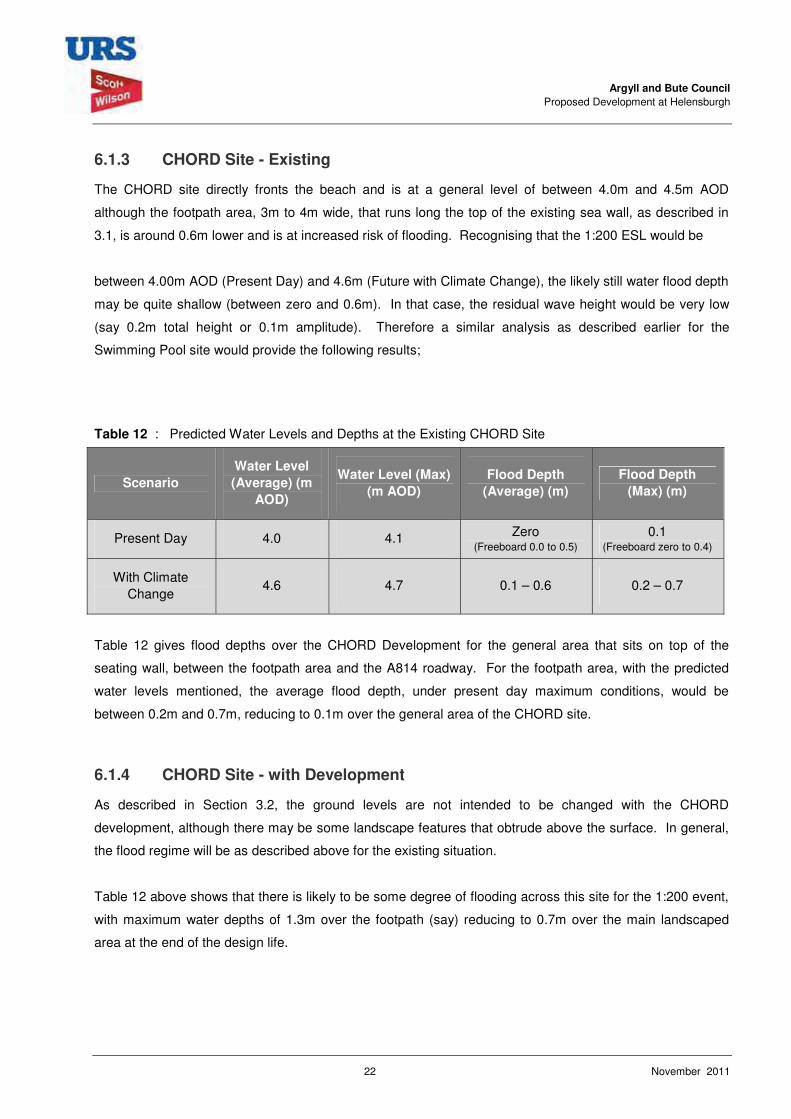
6.1.3 CHORD Site - Existing
The CHORD site directly fronts the beach and is at a general level of between 4.0m and 4.5m AOD
although the footpath area, 3m to 4m wide, that runs long the top of the existing sea wall, as described in
3.1, is around 0.6m lower and is at increased risk of flooding. Recognising that the 1:200 ESL would be
between 4.00m AOD (Present Day) and 4.6m (Future with Climate Change), the likely still water flood depth
may be quite shallow (between zero and 0.6m). In that case, the residual wave height would be very low
(say 0.2m total height or 0.1m amplitude). Therefore a similar analysis as described earlier for the
Swimming Pool site would provide the following results;
Table 12 : Predicted Water Levels and Depths at the Existing CHORD Site
Scenario Water Level (Average) (m
AOD)
Water Level (Max) (m AOD)
Flood Depth (Average) (m)
Flood Depth (Max) (m)
Present Day 4.0 4.1 Zero (Freeboard 0.0 to 0.5)
0.1 (Freeboard zero to 0.4)
With Climate Change
4.6 4.7 0.1 – 0.6 0.2 – 0.7
Table 12 gives flood depths over the CHORD Development for the general area that sits on top of the
seating wall, between the footpath area and the A814 roadway. For the footpath area, with the predicted
water levels mentioned, the average flood depth, under present day maximum conditions, would be
between 0.2m and 0.7m, reducing to 0.1m over the general area of the CHORD site.
6.1.4 CHORD Site - with Development
As described in Section 3.2, the ground levels are not intended to be changed with the CHORD
development, although there may be some landscape features that obtrude above the surface. In general,
the flood regime will be as described above for the existing situation.
Table 12 above shows that there is likely to be some degree of flooding across this site for the 1:200 event,
with maximum water depths of 1.3m over the footpath (say) reducing to 0.7m over the main landscaped
area at the end of the design life.
Argyll and Bute Council Proposed Development at Helensburgh
23 November 2011
The redevelopment proposals and surface form should ensure that any flooding or wave overtopping over
the site can readily drain back to the sea when the tide changes. The landscape proposals should also be
suitable to withstand infrequent inundation by sea water.
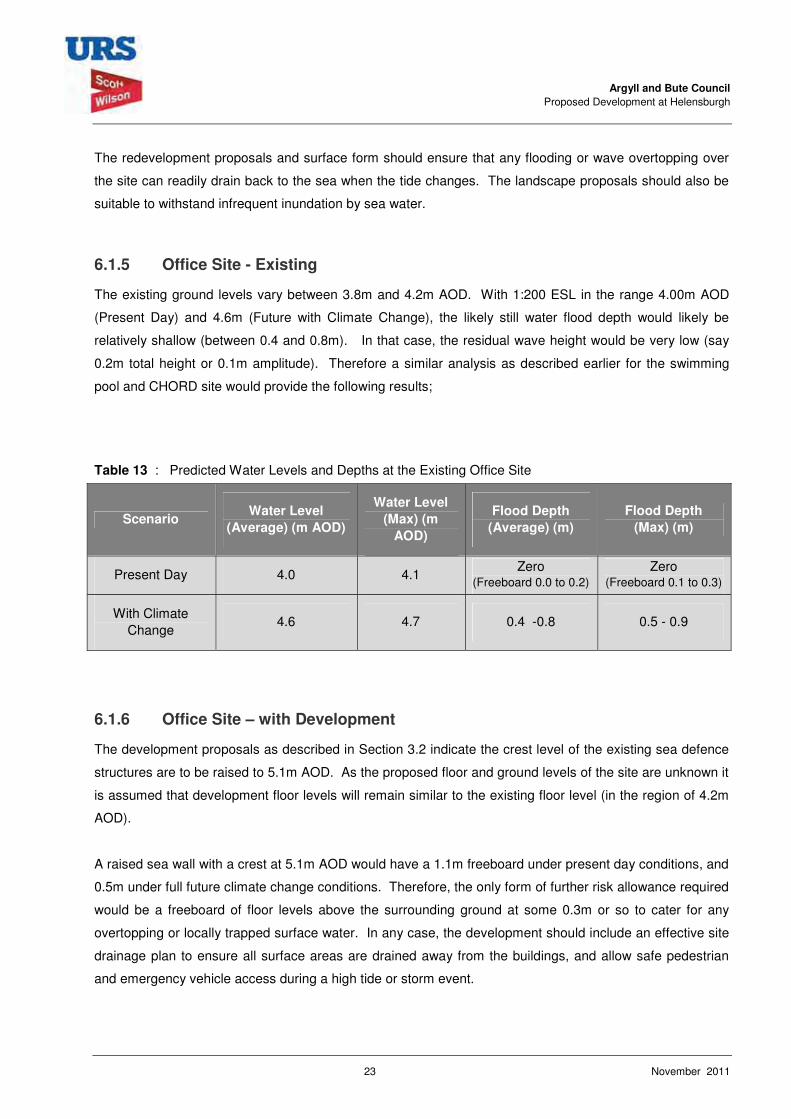
6.1.5 Office Site - Existing
The existing ground levels vary between 3.8m and 4.2m AOD. With 1:200 ESL in the range 4.00m AOD
(Present Day) and 4.6m (Future with Climate Change), the likely still water flood depth would likely be
relatively shallow (between 0.4 and 0.8m). In that case, the residual wave height would be very low (say
0.2m total height or 0.1m amplitude). Therefore a similar analysis as described earlier for the swimming
pool and CHORD site would provide the following results;
Table 13 : Predicted Water Levels and Depths at the Existing Office Site
Scenario Water Level
(Average) (m AOD)
Water Level (Max) (m
AOD)
Flood Depth (Average) (m)
Flood Depth (Max) (m)
Present Day 4.0 4.1 Zero
(Freeboard 0.0 to 0.2) Zero
(Freeboard 0.1 to 0.3)
With Climate Change
4.6 4.7 0.4 -0.8 0.5 - 0.9
6.1.6 Office Site – with Development
The development proposals as described in Section 3.2 indicate the crest level of the existing sea defence
structures are to be raised to 5.1m AOD. As the proposed floor and ground levels of the site are unknown it
is assumed that development floor levels will remain similar to the existing floor level (in the region of 4.2m
AOD).
A raised sea wall with a crest at 5.1m AOD would have a 1.1m freeboard under present day conditions, and
0.5m under full future climate change conditions. Therefore, the only form of further risk allowance required
would be a freeboard of floor levels above the surrounding ground at some 0.3m or so to cater for any
overtopping or locally trapped surface water. In any case, the development should include an effective site
drainage plan to ensure all surface areas are drained away from the buildings, and allow safe pedestrian
and emergency vehicle access during a high tide or storm event.
Argyll and Bute Council Proposed Development at Helensburgh
24 November 2011
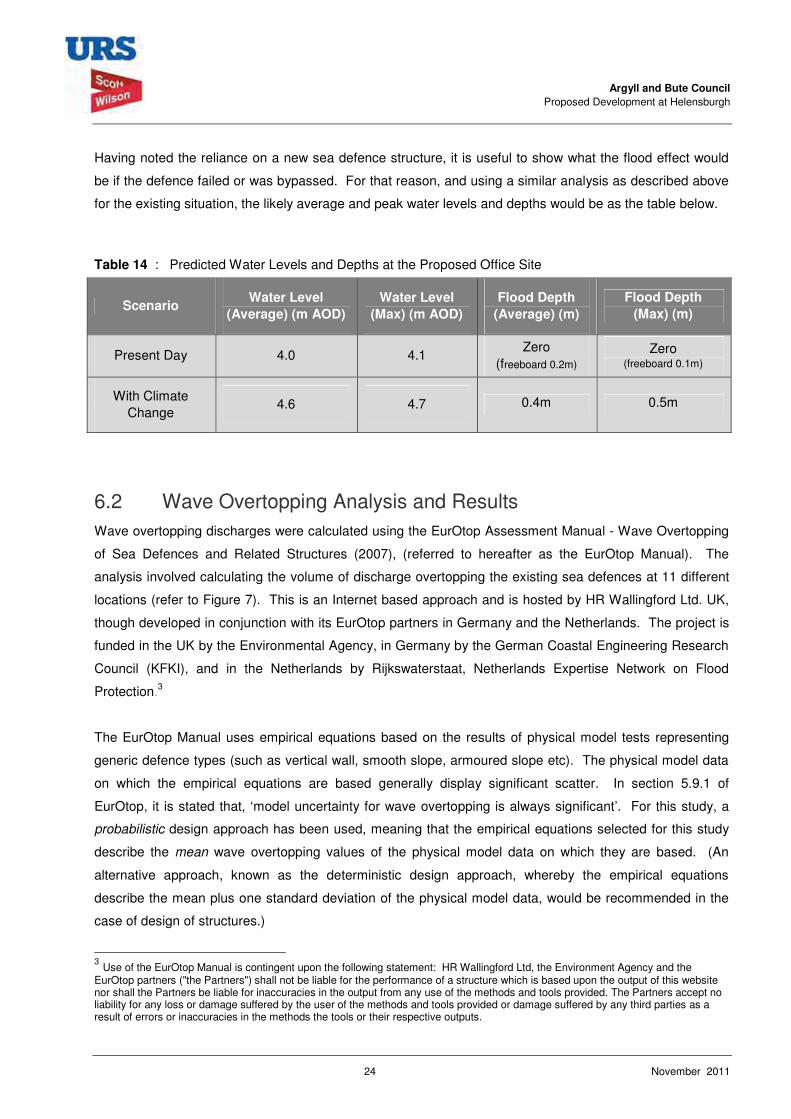
Having noted the reliance on a new sea defence structure, it is useful to show what the flood effect would
be if the defence failed or was bypassed. For that reason, and using a similar analysis as described above
for the existing situation, the likely average and peak water levels and depths would be as the table below.
Table 14 : Predicted Water Levels and Depths at the Proposed Office Site
Scenario Water Level
(Average) (m AOD) Water Level
(Max) (m AOD) Flood Depth
(Average) (m) Flood Depth
(Max) (m)
Present Day 4.0 4.1 Zero
(freeboard 0.2m) Zero
(freeboard 0.1m)
With Climate Change
4.6 4.7 0.4m 0.5m
6.2 Wave Overtopping Analysis and Results Wave overtopping discharges were calculated using the EurOtop Assessment Manual - Wave Overtopping
of Sea Defences and Related Structures (2007), (referred to hereafter as the EurOtop Manual). The
analysis involved calculating the volume of discharge overtopping the existing sea defences at 11 different
locations (refer to Figure 7). This is an Internet based approach and is hosted by HR Wallingford Ltd. UK,
though developed in conjunction with its EurOtop partners in Germany and the Netherlands. The project is
funded in the UK by the Environmental Agency, in Germany by the German Coastal Engineering Research
Council (KFKI), and in the Netherlands by Rijkswaterstaat, Netherlands Expertise Network on Flood
Protection.3
The EurOtop Manual uses empirical equations based on the results of physical model tests representing
generic defence types (such as vertical wall, smooth slope, armoured slope etc). The physical model data
on which the empirical equations are based generally display significant scatter. In section 5.9.1 of
EurOtop, it is stated that, ‘model uncertainty for wave overtopping is always significant’. For this study, a
probabilistic design approach has been used, meaning that the empirical equations selected for this study
describe the mean wave overtopping values of the physical model data on which they are based. (An
alternative approach, known as the deterministic design approach, whereby the empirical equations
describe the mean plus one standard deviation of the physical model data, would be recommended in the
case of design of structures.)
3 Use of the EurOtop Manual is contingent upon the following statement: HR Wallingford Ltd, the Environment Agency and the EurOtop partners ("the Partners") shall not be liable for the performance of a structure which is based upon the output of this website nor shall the Partners be liable for inaccuracies in the output from any use of the methods and tools provided. The Partners accept no liability for any loss or damage suffered by the user of the methods and tools provided or damage suffered by any third parties as a result of errors or inaccuracies in the methods the tools or their respective outputs.

Argyll and Bute Council Proposed Development at Helensburgh
25 November 2011
In addition, wave overtopping rates are very sensitive to small variations in the geometry of the defence and
the use of empirical methods (rather than physical modelling) necessitates the simplification of the cross
section in order to conform to one of the empirical methods available.
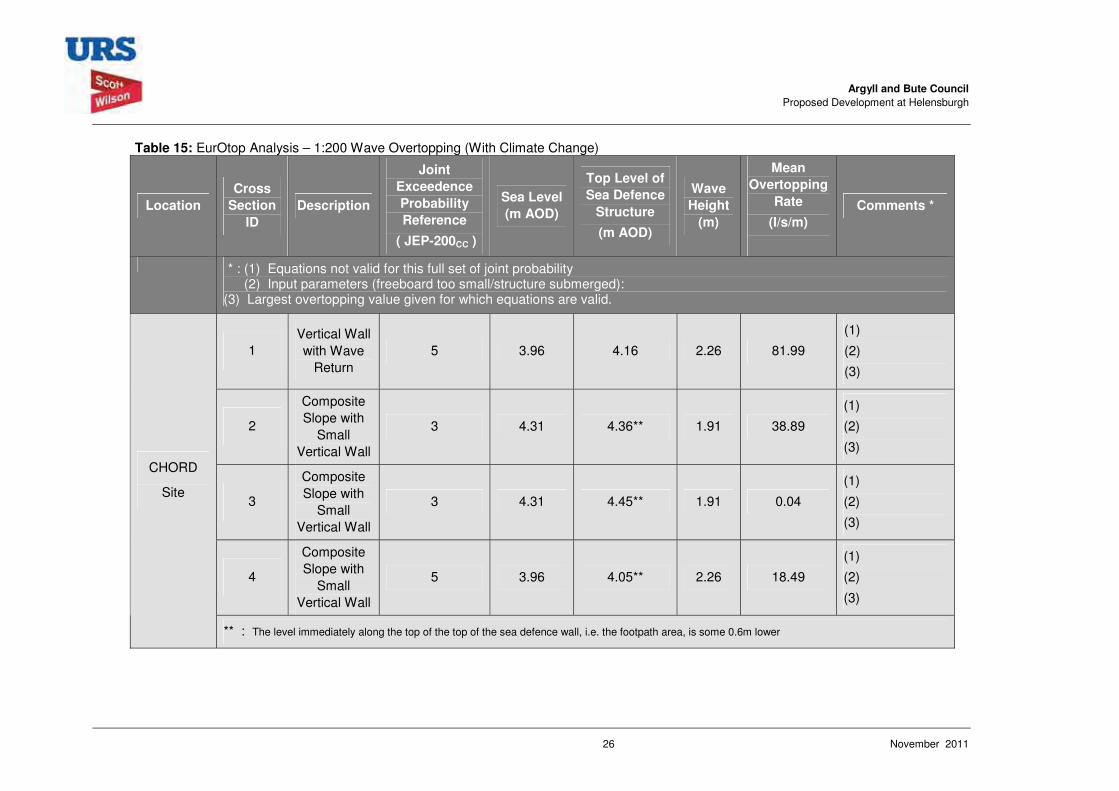
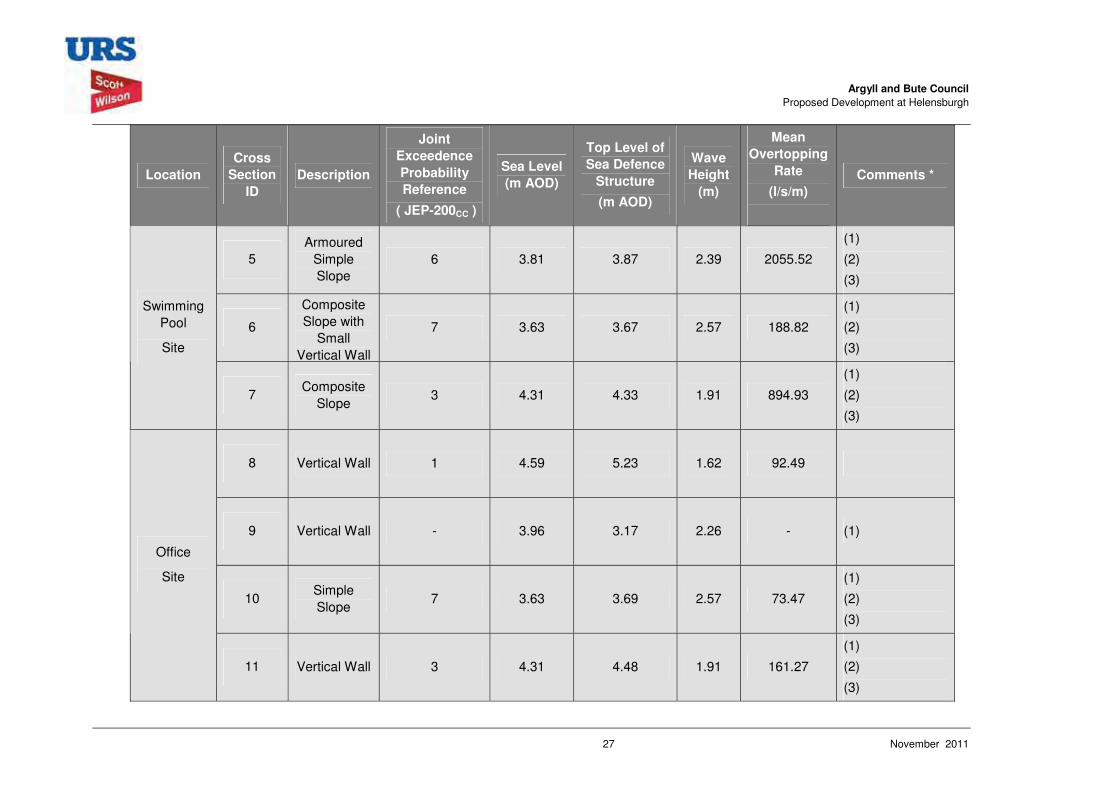
Calculations were undertaken for the 11 profiles (refer to Figure 7) and for the range of joint probability
events given in Table 15. The results of the study are summarised in Table 15. Only the largest wave
overtopping rate at each profile has been presented. In a number of cases, the geometry of the defence,
combined with the wave conditions, was such that the conditions fell beyond the physical model data on
which the empirical equations are based. This has been flagged up in the comments column, and the table
shows the largest overtopping rate for which the empirical equations are valid.
Argyll and Bute Council Proposed Development at Helensburgh
26 November 2011
Table 15: EurOtop Analysis – 1:200 Wave Overtopping (With Climate Change)
Location Cross
Section ID
Description
Joint Exceedence Probability Reference
( JEP-200CC )
Sea Level (m AOD)
Top Level of Sea Defence
Structure
(m AOD)
Wave Height
(m)
Mean Overtopping
Rate
(l/s/m)
Comments *
* : (1) Equations not valid for this full set of joint probability (2) Input parameters (freeboard too small/structure submerged):
(3) Largest overtopping value given for which equations are valid.
1 Vertical Wall with Wave
Return 5 3.96 4.16 2.26 81.99
(1)
(2)
(3)
2
Composite Slope with
Small Vertical Wall
3 4.31 4.36** 1.91 38.89
(1)
(2)
(3)
3
Composite Slope with
Small Vertical Wall
3 4.31 4.45** 1.91 0.04
(1)
(2)
(3)
4
Composite Slope with
Small Vertical Wall
5 3.96 4.05** 2.26 18.49
(1)
(2)
(3)
CHORD
Site
** : The level immediately along the top of the top of the sea defence wall, i.e. the footpath area, is some 0.6m lower
Argyll and Bute Council Proposed Development at Helensburgh
27 November 2011
Location Cross
Section ID
Description
Joint Exceedence Probability Reference
( JEP-200CC )
Sea Level (m AOD)
Top Level of Sea Defence
Structure
(m AOD)
Wave Height
(m)
Mean Overtopping
Rate
(l/s/m)
Comments *
5 Armoured
Simple Slope
6 3.81 3.87 2.39 2055.52
(1)
(2)
(3)
6
Composite Slope with
Small Vertical Wall
7 3.63 3.67 2.57 188.82
(1)
(2)
(3)
Swimming Pool
Site
7 Composite
Slope 3 4.31 4.33 1.91 894.93
(1)
(2)
(3)
8 Vertical Wall 1 4.59 5.23 1.62 92.49
9 Vertical Wall - 3.96 3.17 2.26 - (1)
10 Simple Slope
7 3.63 3.69 2.57 73.47
(1)
(2)
(3)
Office
Site
11 Vertical Wall 3 4.31 4.48 1.91 161.27
(1)
(2)
(3)
Argyll and Bute Council Proposed Development at Helensburgh
28 November 2011
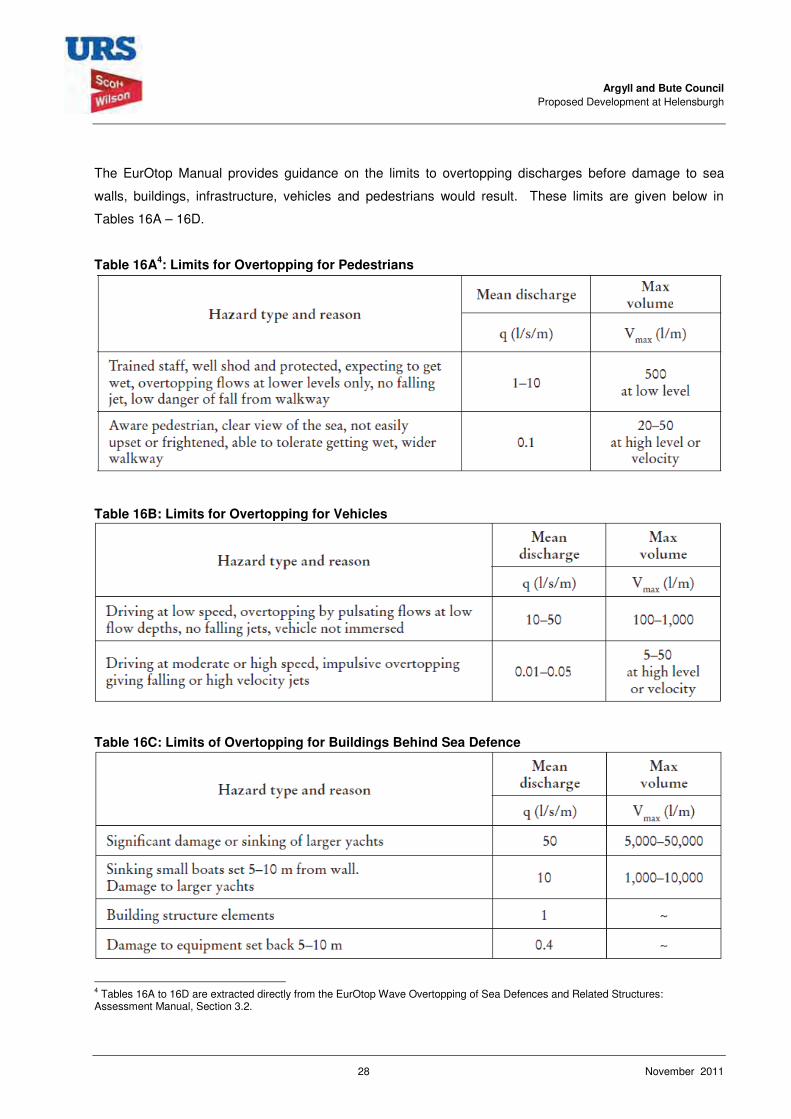
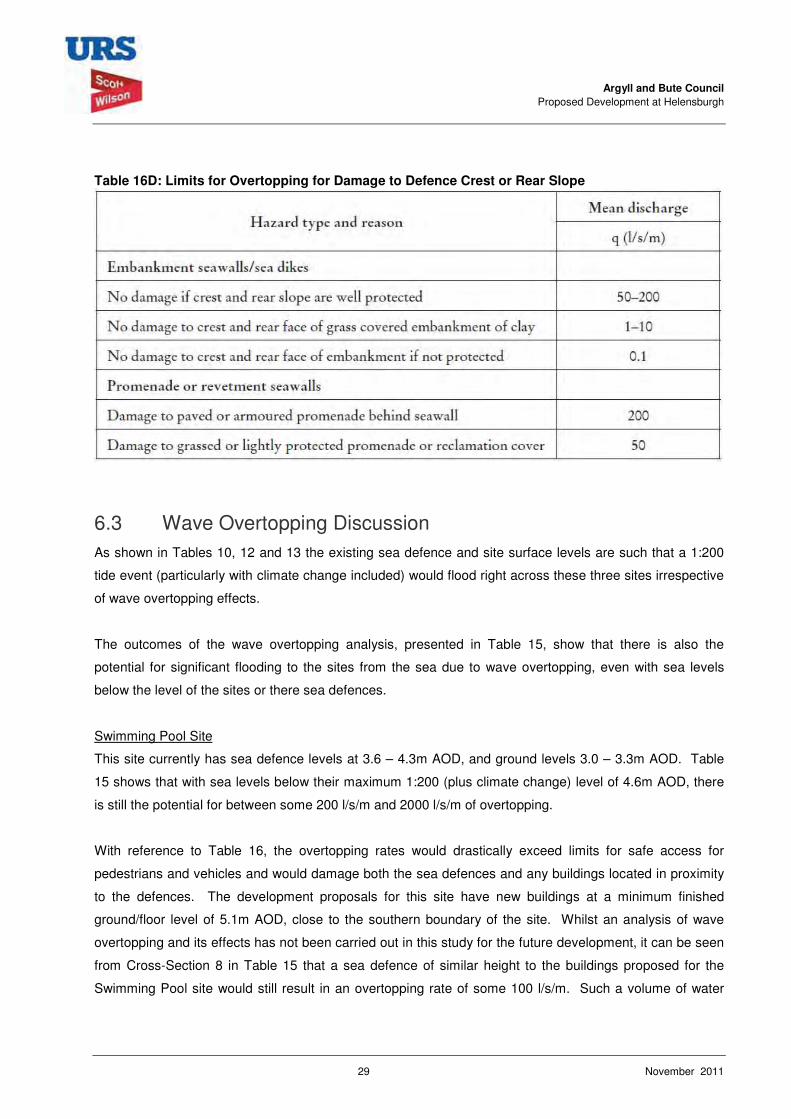
The EurOtop Manual provides guidance on the limits to overtopping discharges before damage to sea
walls, buildings, infrastructure, vehicles and pedestrians would result. These limits are given below in
Tables 16A – 16D.
Table 16A4: Limits for Overtopping for Pedestrians
Table 16B: Limits for Overtopping for Vehicles
Table 16C: Limits of Overtopping for Buildings Behind Sea Defence
4 Tables 16A to 16D are extracted directly from the EurOtop Wave Overtopping of Sea Defences and Related Structures: Assessment Manual, Section 3.2.
Argyll and Bute Council Proposed Development at Helensburgh
29 November 2011
Table 16D: Limits for Overtopping for Damage to Defence Crest or Rear Slope
6.3 Wave Overtopping Discussion As shown in Tables 10, 12 and 13 the existing sea defence and site surface levels are such that a 1:200
tide event (particularly with climate change included) would flood right across these three sites irrespective
of wave overtopping effects.
The outcomes of the wave overtopping analysis, presented in Table 15, show that there is also the
potential for significant flooding to the sites from the sea due to wave overtopping, even with sea levels
below the level of the sites or there sea defences.
Swimming Pool Site
This site currently has sea defence levels at 3.6 – 4.3m AOD, and ground levels 3.0 – 3.3m AOD. Table
15 shows that with sea levels below their maximum 1:200 (plus climate change) level of 4.6m AOD, there
is still the potential for between some 200 l/s/m and 2000 l/s/m of overtopping.
With reference to Table 16, the overtopping rates would drastically exceed limits for safe access for
pedestrians and vehicles and would damage both the sea defences and any buildings located in proximity
to the defences. The development proposals for this site have new buildings at a minimum finished
ground/floor level of 5.1m AOD, close to the southern boundary of the site. Whilst an analysis of wave
overtopping and its effects has not been carried out in this study for the future development, it can be seen
from Cross-Section 8 in Table 15 that a sea defence of similar height to the buildings proposed for the
Swimming Pool site would still result in an overtopping rate of some 100 l/s/m. Such a volume of water
Argyll and Bute Council Proposed Development at Helensburgh
30 November 2011
would present a significant risk to a new building sited so close to the shoreline, and the design of the site
should include a further overtopping analysis to set appropriate sea defence parameters.
Section 6 illustrates the wave overtopping impacts for the new car park on this site. With a mean
overtopping rate of some 190 l/s/m, there would be damage to vehicles close to the shore line and possibly
to the surfacing. Again, the design for the site will need to account for, and mitigate this effect.
CHORD Site
The CHORD site is at or, slightly below the present-day 1:200 ESL, and Table 15 shows that for a range of
ESL/wave conditions, there would be from 0.04 up to some 80 l/s/m of overtopping, depending on the site
levels. Based on Table 16A it is evident that for most of the CHORD site, a 1:200 event would result in
overtopping rates that are hazardous to pedestrians.
Given that the development proposals are only for improvements to landscaping of this site, and that public
access is not limited, it would recommended that signage be included that indicates the dangers during
high tide and high wave conditions. The development proposals for any hard landscaping features should
also take account of the possible overtopping effects, and be designed to withstand those forces.
Office Site
This site has ground levels of 3.8 – 4.2m and is currently protected by segments of sea wall that are above
those levels (4.5m – 5.1m). There is therefore a wide range of overtopping rates, around 70 – 160 l/s/m in
some locations. In one area (e.g. Section 9), the sea defence levels are particularly low, and the
overtopping equations are not valid for any of the ESL/wave conditions.
The results to hand indicate that the shore front and the areas immediately behind it would be subject to
significant wave overtopping effects.
The development proposals (see Figure 5) indicate that a landscaped area some 10m – 20m wide will
separate the new buildings from the shoreline. It is also noted that a continuous sea wall up to a 5.1m
AOD crest level is to be constructed to protect the site. On that basis, it is considered that the buildings
should be protected from wave overtopping damage assuming that an effective surface water drainage
system is developed to remove any overtopping water from the frontage area. The landscaped area
should also be designed to withstand the overtopping effects that may arise in the 1: 200 design event.
Argyll and Bute Council Proposed Development at Helensburgh
31 November 2011
6.4 Fluvial Flood Risk Fluvial flood risk potentially occurs due to the presence of the Glennan Burn crossing beneath the CHORD
site, and the Milligs Burn which outfalls just to the west of the Office site. The focus of the analysis of this
flood risk is in the lower reaches of these burns. However, it was recognised that the railway
embankment/cutting that cuts across the catchment of these two watercourses (and the culverts provided
for each watercourse) may result in significant attenuation of the flows that could arrive at the lower
reaches.
For that reason, an analysis was carried out on the capacity of both railway culverts to determine the
potential flood flows that might be passed downstream through the town.
6.4.1 Railway Culvert Capacity
A basic hydraulic model of both the culverts at the railway was developed to predict the culvert capacities
and determine the potential flood flows that might be passed downstream. The ISIS software package was
chosen to develop the model. The model of the culverts was based on site observations and 1:25,000 OS
Mapping. The modelling disregarded the possible attenuating effects of reservoirs further upstream on
flows in the Milligs Burn.
The analysis indicated that the Glennan Burn would start to surcharge at a 1:22 event. When a 1:200
event occurs (6.13m3/s) the culvert would surcharge but no out of bank flow is predicted. Similarly for the
Milligs Burn the culvert would start to surcharge when there is a 1:10 event and no out of bank flow is
expected during a 1:200 event (6.54m3/s). Therefore, it is concluded that the railway culverts do not
represent significant constraints to flows passing downstream towards the subject sites.
Between the railway culverts and the culverts that pass beneath the subject sites, there may be other
constraints and culverts that force flood flows out of bank and flow down streets and through property
towards East and West Clyde Street. Due to the lack of specific topographical information within the
centre of Helensburgh it is difficult to determine where any overland flow would actually accumulate.
6.4.2 Culvert Capacities at Firth of Clyde
These culverts are subject to both fluvial flow and tidal conditions. An assessment of the Glennan Burn
was carried out to determine the capacity of the culvert with no tidal influences. An analysis shows that the
maximum 1 in 200 year fluvial flow of 6.67m3/s (Refer to Table 1) is able to pass through the culvert with
no surcharging and no bank overtopping.
Argyll and Bute Council Proposed Development at Helensburgh
32 November 2011
An assessment of the Milligs Burn showed that the culvert would start to surcharge when the flow exceeds
4.1m3/s, which corresponds to approximately a 1:30 event flow, based on flows determined in Table 1.
During a 1:200 event (i.e. a flow of 6.54m3/s) it is predicted that the culvert would need to surcharge above
the soffit by 1.5m in order to pass this flow, excluding any blockage effects. Based on site observations
this surcharge pondage would be contained within the burn watercourse.
A joint probability assessment was carried out for extreme fluvial flood flows occurring at the same time as
an extreme high tide event. Based on earlier studies and interaction with SEPA, a suitable combination is
a 1:10 fluvial flow with a 1:200 tidal level, and a 1:200 fluvial flow with a 1:10 tidal level.
The capacity of the Glennan Burn was analysed for a 1 in 200 fluvial flow (6.67m3/s) with a 1 in 10 year
extreme sea level (3.31m AOD). The analysis shows that the Glennan Burn culvert at the Firth of Clyde
becomes surcharged, however there is no predicated out of bank flow upstream of the culvert. Similarly
surcharging also occurs when there is a 1 in 10 year fluvial flow (3.27ms/s) and 1 in 200 extreme sea level
(3.96m AOD) is analysed and again there is no out of bank flow predicted up stream of the culvert.
Therefore the Glennan Burn, which passes beneath the CHORD site, is not predicted to cause a direct
flood risk to this site. However, as previously mentioned in Section 4.2.1, it is believed that a number of
road gullies are connected to the culvert and in the past these have surcharged and flooded parts of the
A814 and surrounding properties.
The Milligs Burn was similarly analysed using a 1:200 fluvial flow (8.7m3/s) with a 1:10 extreme sea level.
For this case out of bank flow is likely to occur upslope of where the Milligs Burn culvert crosses under the
A814, some 100 - 200m from either the Swimming Pool site or the Office site. It is not anticipated that out
of bank flow from this source would pose any direct impact on the proposed developments. For the 1:10
fluvial flow (3.27ms/s) with the 1 in 200 extreme sea level (3.96m AOD) the analysis showed there was no
out of bank flow predicted up stream of the culvert.
Consideration has been given to overland flow arising either from a surcharged culvert or road gully
reaching the subject sites. Provided that such flow can find an overland flow route that leads to an outfall
point on the foreshore the flooding effects en-route are likely to be local depending on road/pavement
cambers and gully locations. Our site inspection showed that generally, overland flow generated upslope
of the subject sites, from whatever source, would be able to find a route to the foreshore and that it is likely
to present no more than an inconveniencing effect on one or all of the sites, with a depth of flow in the
order of 100 to 200 mm.
Argyll and Bute Council Proposed Development at Helensburgh
33 November 2011
6.4.3 Other Flood Risks
Other flooding scenarios caused by localised rainfall events, burst water mains, groundwater rise or
surcharging of surface water or foul drainage systems are not likely to have a direct or major impact on any
proposed development, provided there is an overland flow route for such water to escape to the shore. As
indicated in Section 6.4.2, overland flow would generally be generated upslope of the subject sites, from
whatever source, and would be able to find a route to the foreshore and is likely to present no more than
an inconveniencing effect on one or all of the sites,
Biennual Reports and Press coverage have reported extreme rainfall events causing localised flooding in
Helensburgh due to surface water not being able to drain away, either naturally or to the appropriate
underground drainage system. Suitable drainage design at the development sites, including the provision
of overland flow paths, to pass floodwater safely from the A814 to the shoreline, will minimise these risks.
Argyll and Bute Council Proposed Development at Helensburgh
34 November 2011
6.5 Flood Risk Management for Proposed Development
There are various aspects to be considered here though the major consideration is defining the ground
level and how high this should be set above the assessed flood level to provide an adequate freeboard
allowance. Many of the required flood risk management measures have been discussed earlier in this
report. These and other aspects are summarised below for each site.
CHORD Site
• The final design levels for this landscaped area are not critical but should not make the risk of flooding any worse than at present unless a complete re-design is to be considered to take
account of future extreme sea levels and wave overtopping,
• Site surface water drainage to allow not only for local runoff but also for overland flow generated upslope of the CHORD site which requires an outfall to the foreshore.
• Site drainage to allow for rapid drain-back of overtopping flows,
• Signage for the car park to recognise the risk to pedestrians and vehicles from wave effects.
Swimming Pool Site
• Final design floor level for the Swimming Pool building and other facilities to be set based on a
refined overtopping analysis that accounts for the exact proximity to the shoreline, and the sea defence wall height to be developed,
• Site surface water drainage to allow not only for local runoff but also for overland flow generated
upslope of the Swimming Pool site which requires an outfall to the foreshore,
• The design for all buildings to take account of wave overtopping impacts and effects,
• Building and surface water drainage to allow for rapid drain-back of overtopping flows,
• The design of the car park and its materials to allow for wave overtopping effects,
• The design of the site to allow safe pedestrian and emergency vehicular access to all buildings above a level of 4.6m AOD (allowing for a proportion of climate change effects),
• Signage for the car park to recognise the risk to pedestrians and vehicles from wave effects.
Office Site
• Final design floor level for the Office building to be set based on a refined overtopping analysis that accounts for the exact proximity to the shoreline, and the sea defence wall height to be developed,
• Site surface water drainage to allow not only for local runoff but also for overland flow generated upslope of the Office site which requires an outfall to the foreshore,
• The design for all buildings to take account of wave overtopping impacts and effects,
• Building site and surface water drainage to allow for rapid drain-back of overtopping flows,
Argyll and Bute Council Proposed Development at Helensburgh
35 November 2011
• The design of the car park and its materials to allow for wave overtopping effects,
• The design of the site to allow safe pedestrian and emergency vehicular access to all buildings
above a level of 4.3m AOD (allowing for a proportion of climate change effects).
• Signage for the car park to recognise the risk to pedestrians and vehicles from wave effects.
6.6 BREEAM Compliance BREEAM is a benchmark environmental performance and design tool for buildings. The Building
Research Establishment’s Environmental Assessment Method (BREEAM) was developed in the UK to
evaluate the environmental performance of both new and existing buildings, and includes standard and
bespoke versions.
With respect to the developments covered by this report the aim would be to encourage development in
low flood risk areas or to take measures to reduce the impact of flooding on buildings in areas with a
medium or high risk of flooding.
Two BREEAM credits can be awarded where the assessed development is situated in a flood zone that is
defined as having a low annual probability of flooding and where a site specific Flood Risk Assessment
(FRA) confirms that there is a low risk of flooding from all sources. One credit can be issued where : -
(a) The assessed development is situated in a flood zone that is defined as having a medium or high
annual probability of flooding,
(b) A site specific Flood Risk Assessment (FRA) confirms to the satisfaction of the local authority and
statutory body that the development is appropriately flood resilient and resistant from all sources of
flooding,
(c) The ground level of the building, and access to it and the site, are designed (or zoned) so they
are at least 600mm above the design flood level of the flood zone in which the assessed
development is located.
Additional credits can be awarded relating to attenuation measures to provide sustainable surface water
drainage and attenuation relating to climate change.
On the basis of the above it might be possible to acquire 1 credit for each of the two sites with the planning
applications proposed, although further detailed design work would be required prior to a full BREEAM
assessment being undertaken.
Argyll and Bute Council Proposed Development at Helensburgh
36 November 2011
7 Conclusions and Recommendations 7.1 Conclusions This report has addressed the flood risks to the subject sites in Helensburgh from tidal, wave and fluvial
effects, for the present day and for the future.
The main conclusion is that, with respect to a 1:200 (plus climate change) design criteria, all three sites are
presently exposed to significant flood risk, mostly due to direct extreme sea level effects. There are also
significant direct wave effects on the sea defences for all three sites, and effects due to large amounts of
predicted wave overtopping flows onto the sites.
The CHORD site has the highest existing ground levels of all three sites, but would still be subject to some
still water flooding (0.0 to 0.5m) and wave attack during 1:200 flood conditions.
The development proposals for this site do not raise or lower ground levels and so the flood risk to the site
will remain as it presently exists.
The Swimming Pool site, with the lowest ground level and exposed sea defences is most at risk, with likely
maximum flood depths of 0.7m to 1.0m under present day conditions, and an additional 0.3 to 0.6m in the
future due to climate change effects.
The development proposals recognize this risk and seek to elevate buildings to a flood-free level, with the
car park remaining at the current level.
The Office site has ground levels similar to those for the CHORD site, and is exposed to possible
inundation of up to 0.2m under present conditions with some 0.3m to 0.6m greater inundation under a
climate change scenario.
The development proposals for this site will be set back some 10 to 20m from the shoreline and be
protected by a new sea wall. The site should remain flood free under these conditions, except for some
possible wave overtopping water which will need to be accommodated.
Section 6.5 provides a summary of the required flood management measures for each site.
Argyll and Bute Council Proposed Development at Helensburgh
37 November 2011
7.2 Recommendations
There are a number of further analyses and design phases required in order to fully address the flood
management for the three subject sites. These are listed below :
General
1) Carry out further overtopping analysis to assess more accurately the overtopping rates that
might be expected at proposed developments so that building structures and surface water collection systems can be designed adequately.
2) Prepare detailed surface water drainage designs to receive overland flow from either
surcharged drains, overtopping or extreme rainfall events for the sea front area.
3) Planning, design and construction of new sea defences.
4) Upgrade the frontage of buildings to cope with more extreme sea conditions.
CHORD ( including West Clyde Street)
5) Prepare detailed surface water drainage designs to receive overland flow from either
surcharged drains, overtopping or extreme rainfall events.
6) Review the need for re-profiling of street carriageways to allow overland flow to reach the foreshore more easily.
Swimming Pool Site
7) Raise levels to provide a minimum built floor elevation level of 5.10m AOD as outlined in the Stage C report. (subject to further analysis)
8) Increase rock armouring height around the site to limit overtopping during an extreme event to
a level of protection yet to be agreed.
9) Replace gabion mattresses with rip rap armour.
10) Surface water drainage works for proposed developments.
Office Site (including East Clyde Street)
11) Carry out further overtopping analysis to assess more accurately the current overtopping rates
that might be expected under the proposed development so that a built floor level can be
finalised.
12) Provide a new surface water collection system designed to handle overland flow and
overtopping volumes of water.
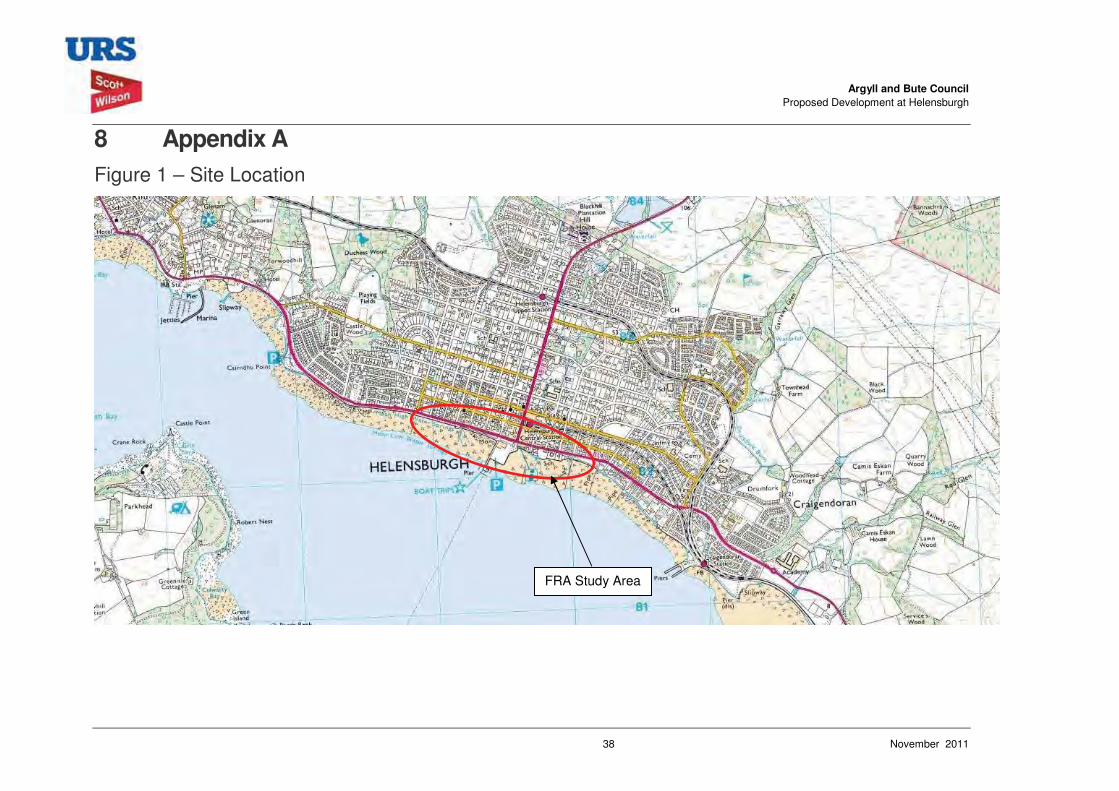
Argyll and Bute Council Proposed Development at Helensburgh
38 November 2011
8 Appendix A Figure 1 – Site Location
FRA Study Area
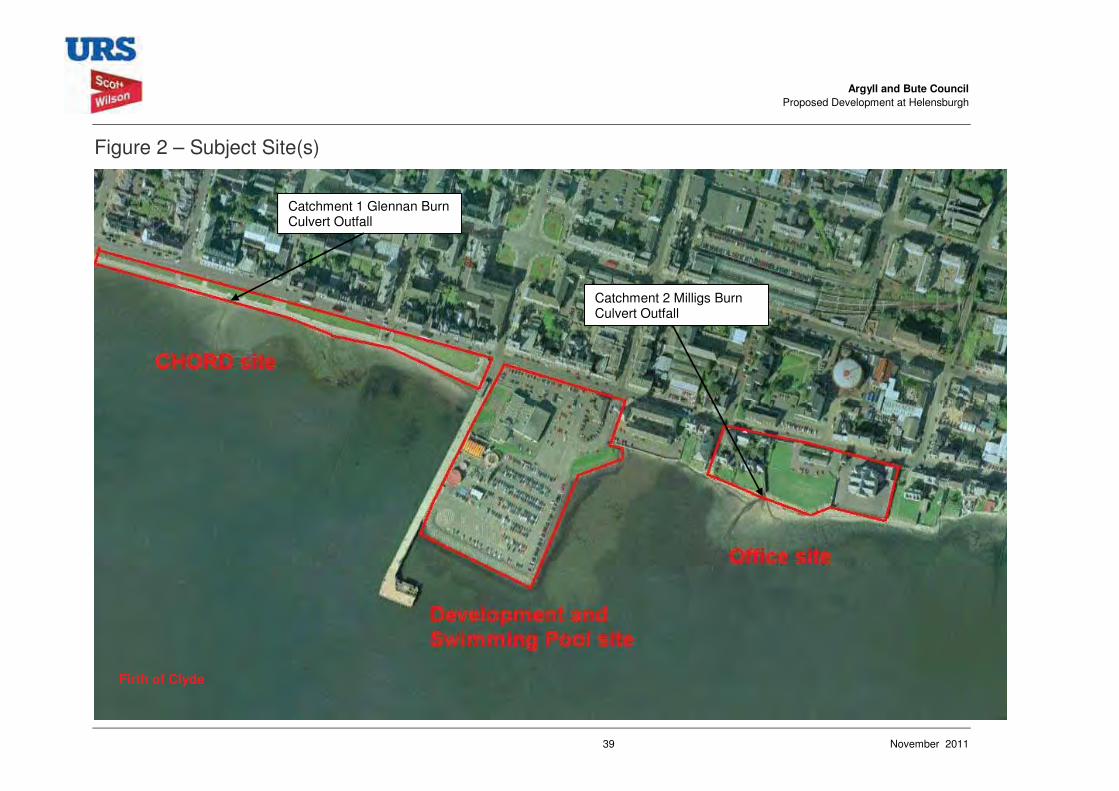
Argyll and Bute Council Proposed Development at Helensburgh
39 November 2011
Figure 2 – Subject Site(s)
Catchment 1 Glennan Burn Culvert Outfall
Catchment 2 Milligs Burn Culvert Outfall
Firth of Clyde
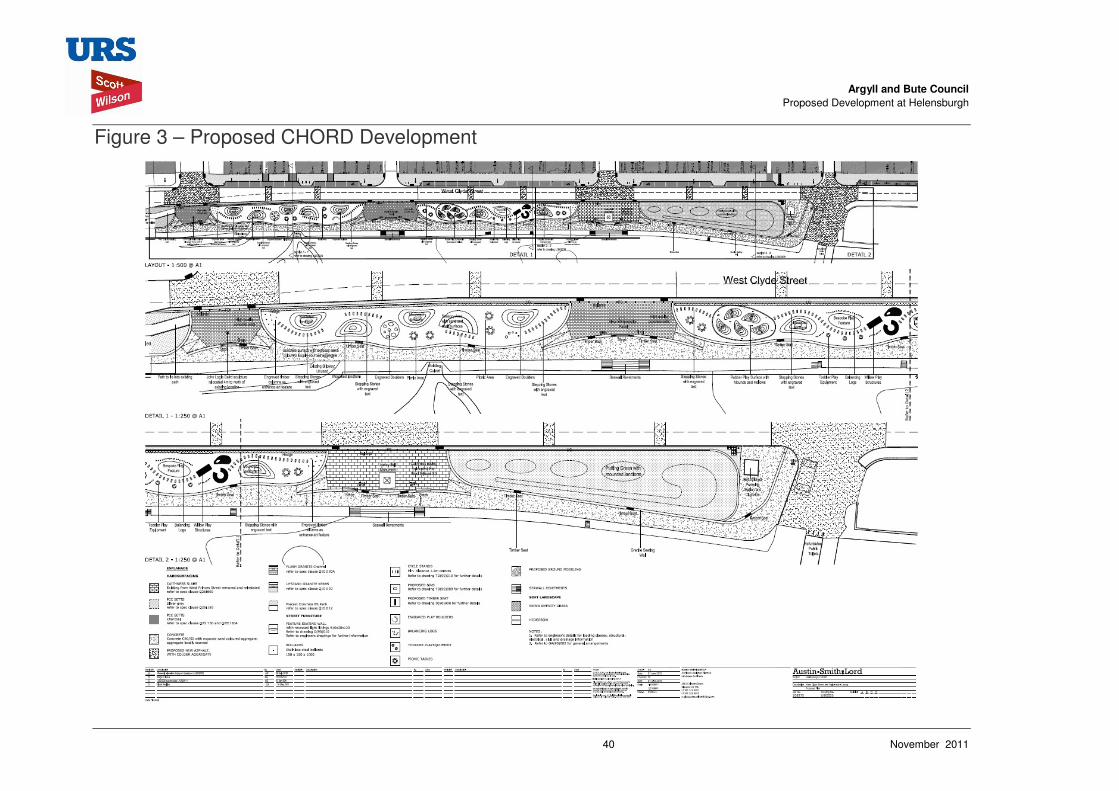
Argyll and Bute Council
Proposed Development at Helensburgh
40 November 2011
Figure 3 – Proposed CHORD Development

Argyll and Bute Council Proposed Development at Helensburgh
41 November 2011
Figure 4 – Swimming Pool Development
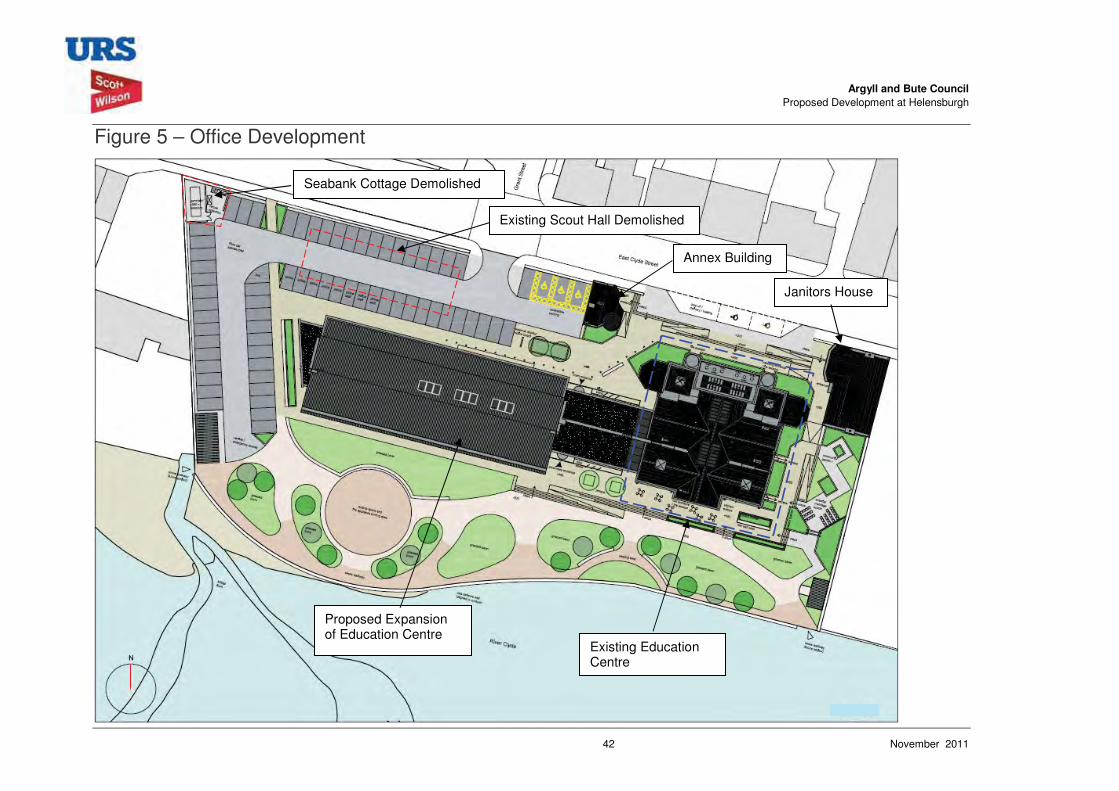
Argyll and Bute Council Proposed Development at Helensburgh
42 November 2011
Figure 5 – Office Development
Existing Scout Hall Demolished
Seabank Cottage Demolished
Proposed Expansion of Education Centre
Existing Education Centre
Annex Building
Janitors House
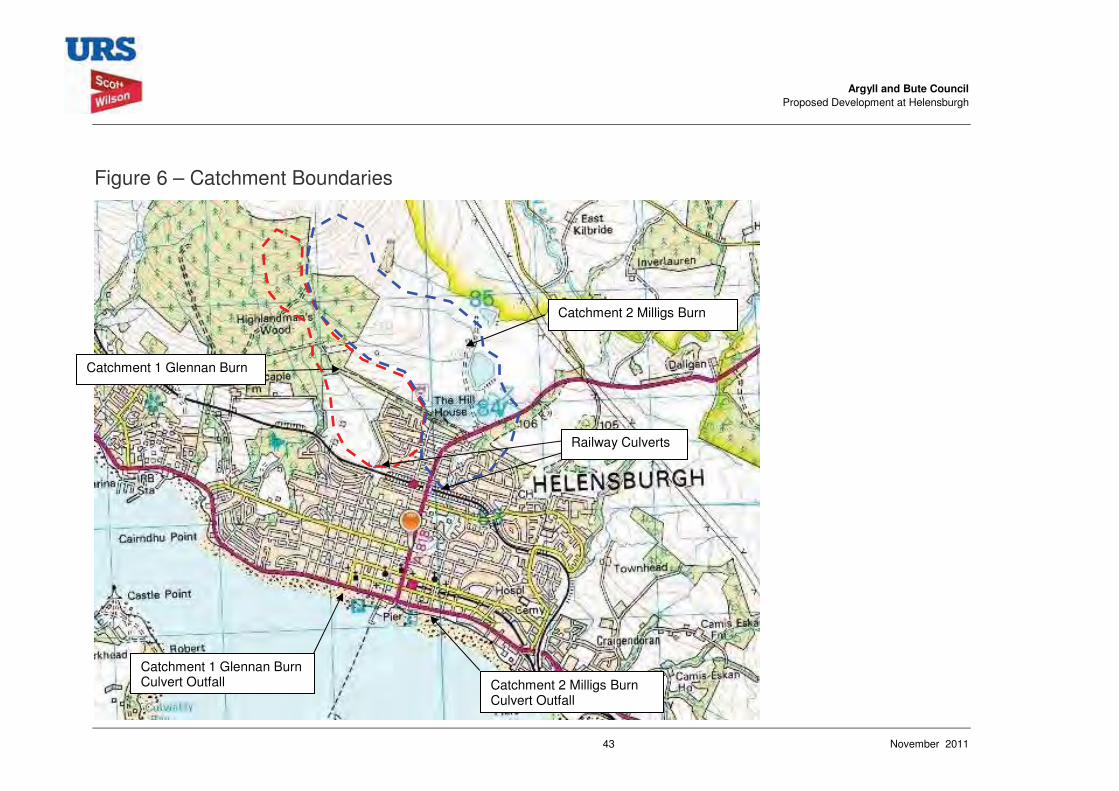
Argyll and Bute Council Proposed Development at Helensburgh
43 November 2011
Figure 6 – Catchment Boundaries
Catchment 1 Glennan Burn
Catchment 2 Milligs Burn
Railway Culverts
Catchment 1 Glennan Burn Culvert Outfall Catchment 2 Milligs Burn
Culvert Outfall
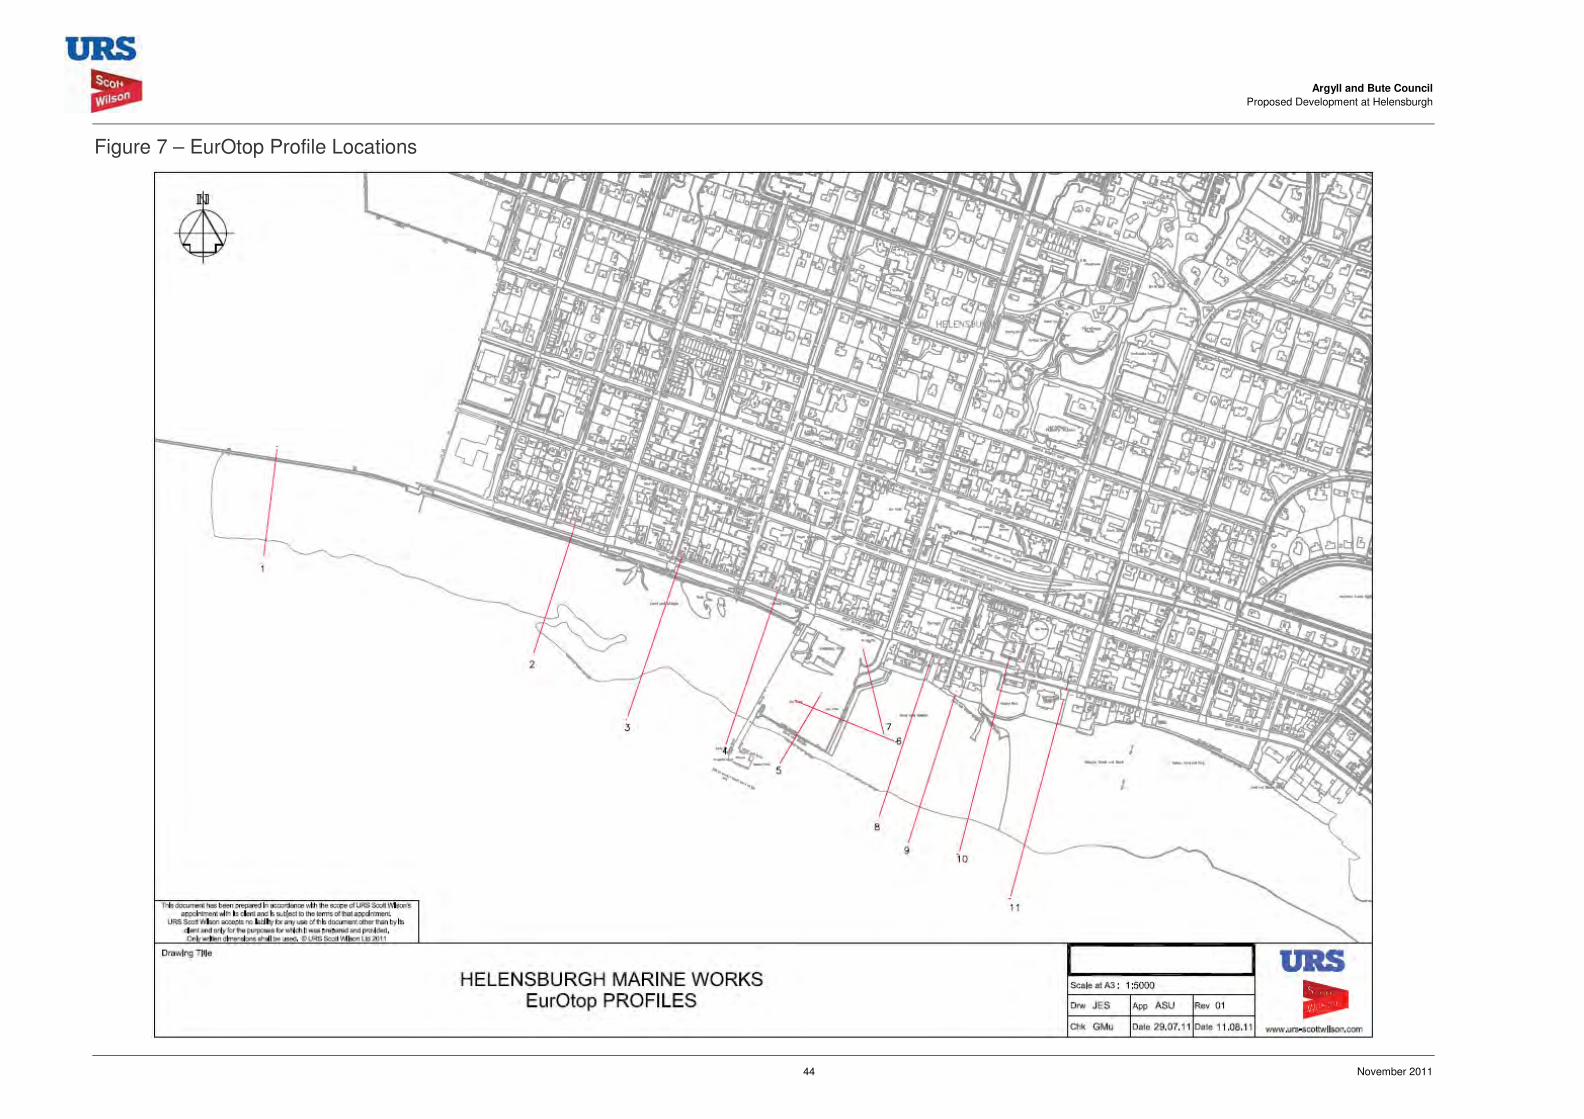
Argyll and Bute Council Proposed Development at Helensburgh
44 November 2011
Figure 7 – EurOtop Profile Locations
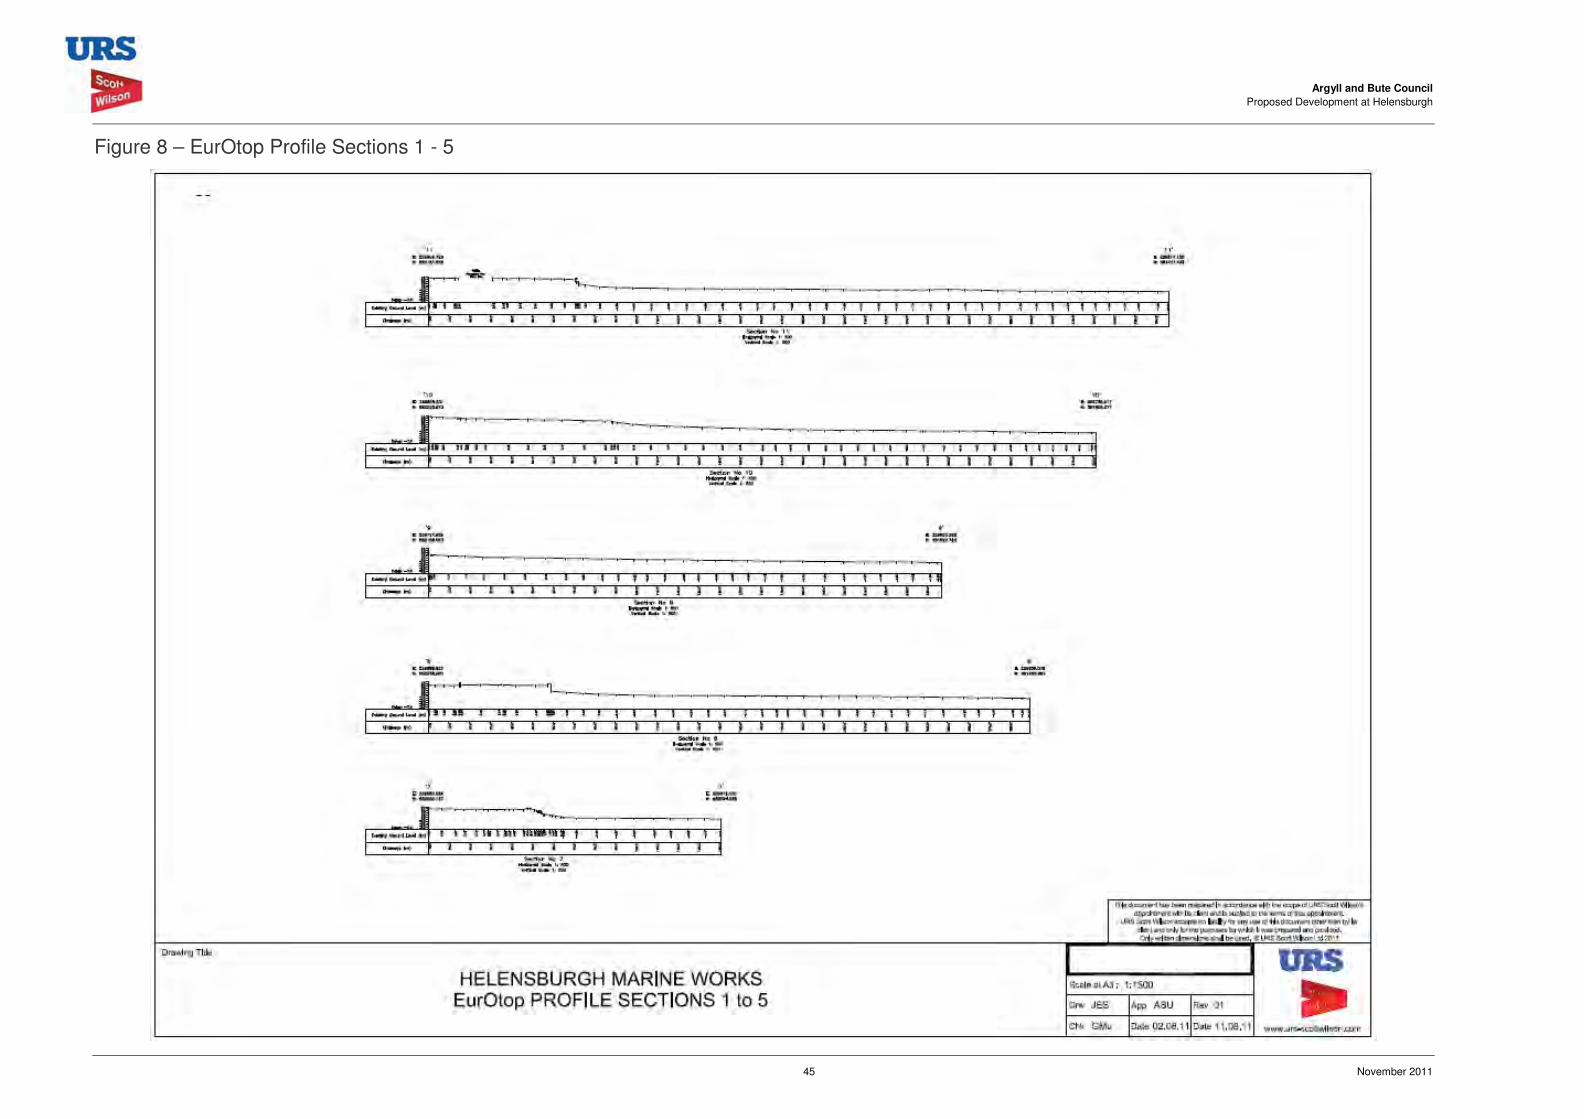
Argyll and Bute Council Proposed Development at Helensburgh
45 November 2011
Figure 8 – EurOtop Profile Sections 1 - 5
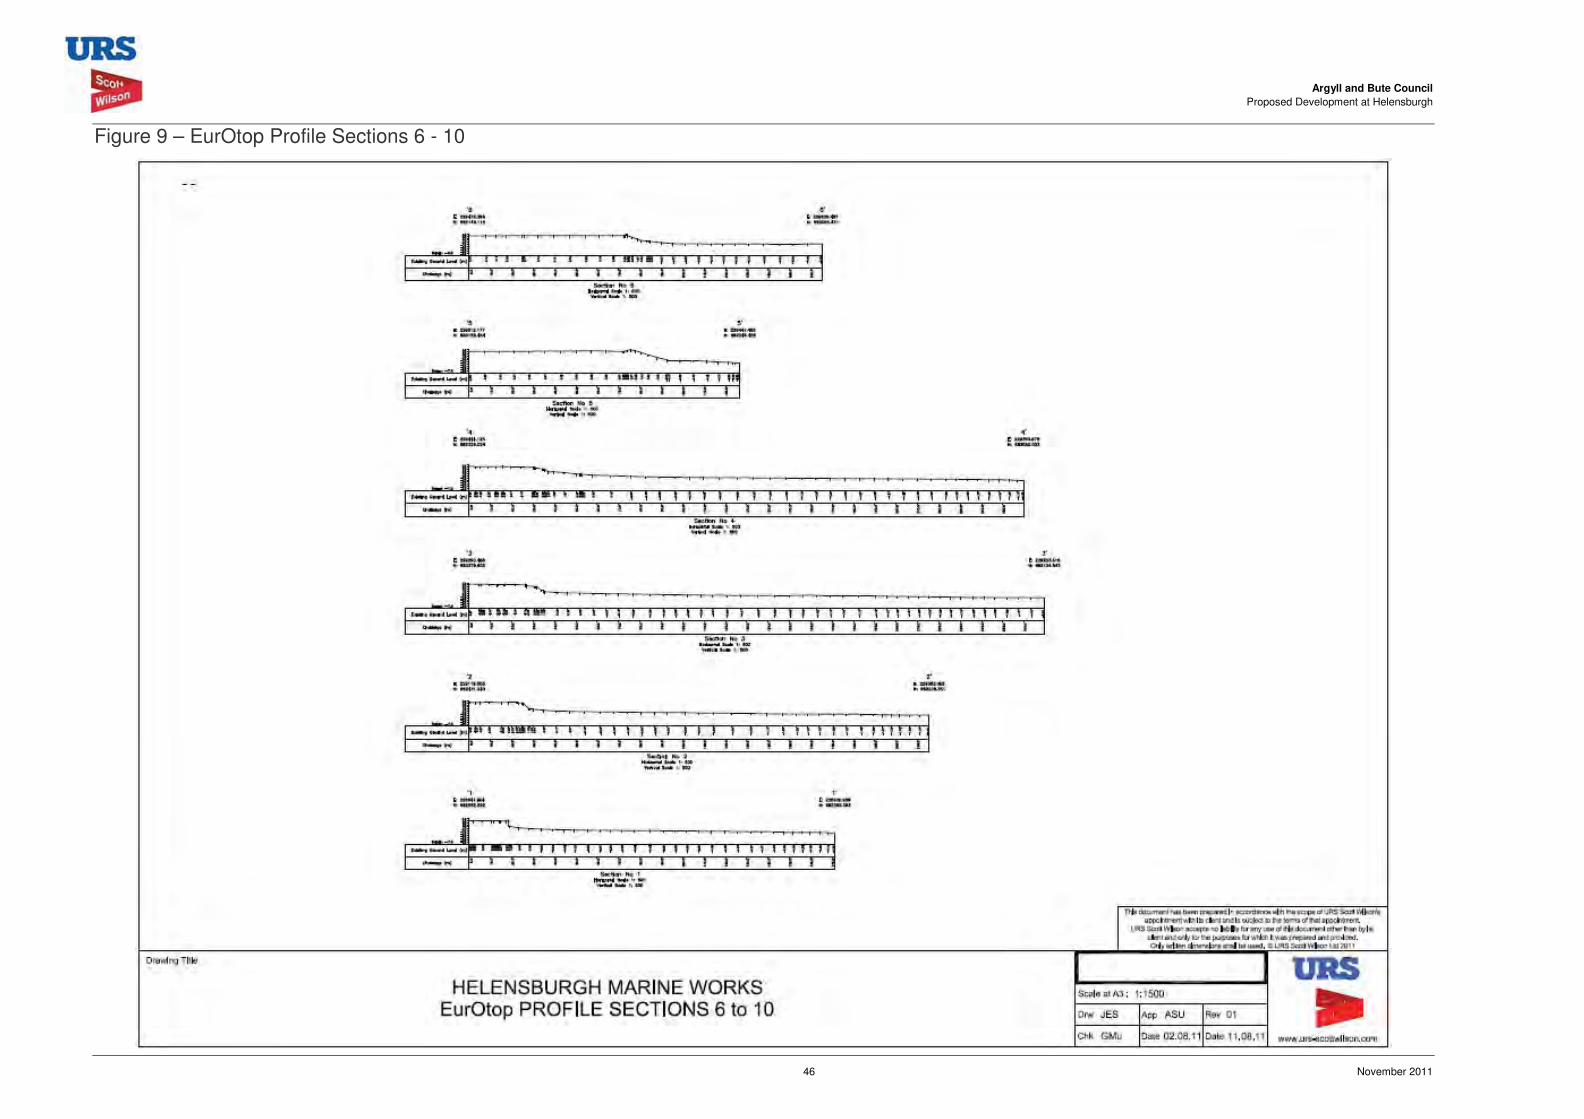
Argyll and Bute Council Proposed Development at Helensburgh
46 November 2011
Figure 9 – EurOtop Profile Sections 6 - 10
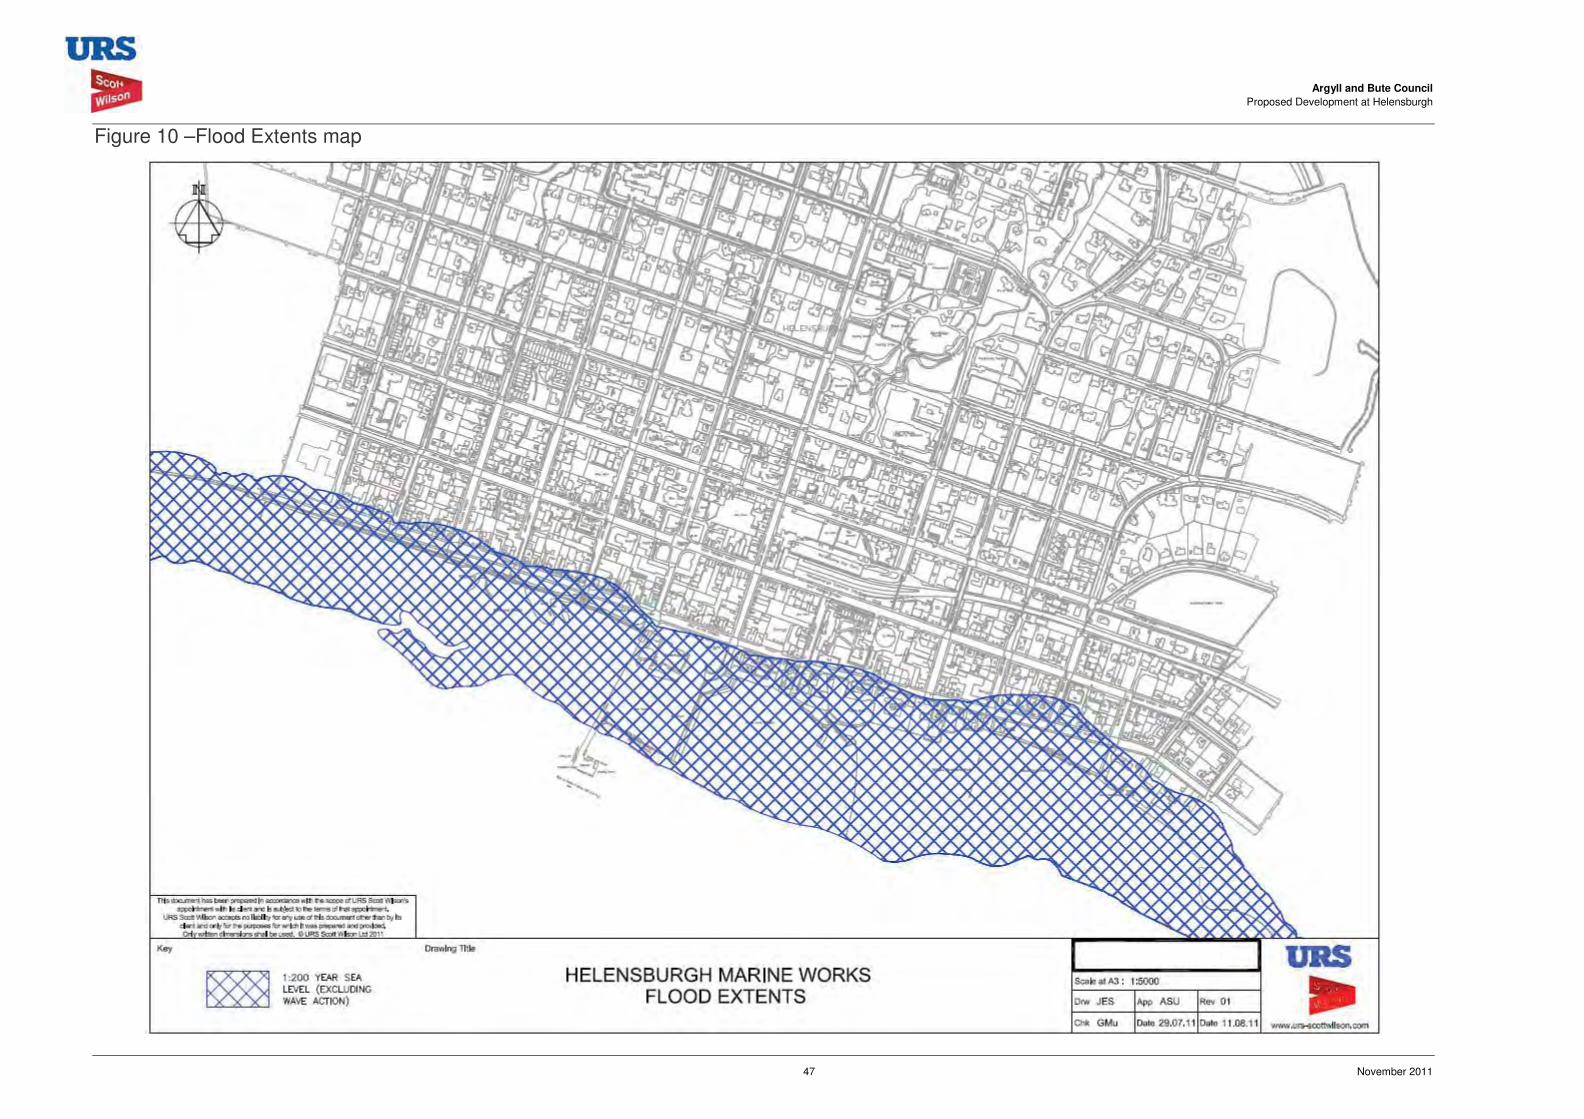
Argyll and Bute Council Proposed Development at Helensburgh
47 November 2011
Figure 10 –Flood Extents map
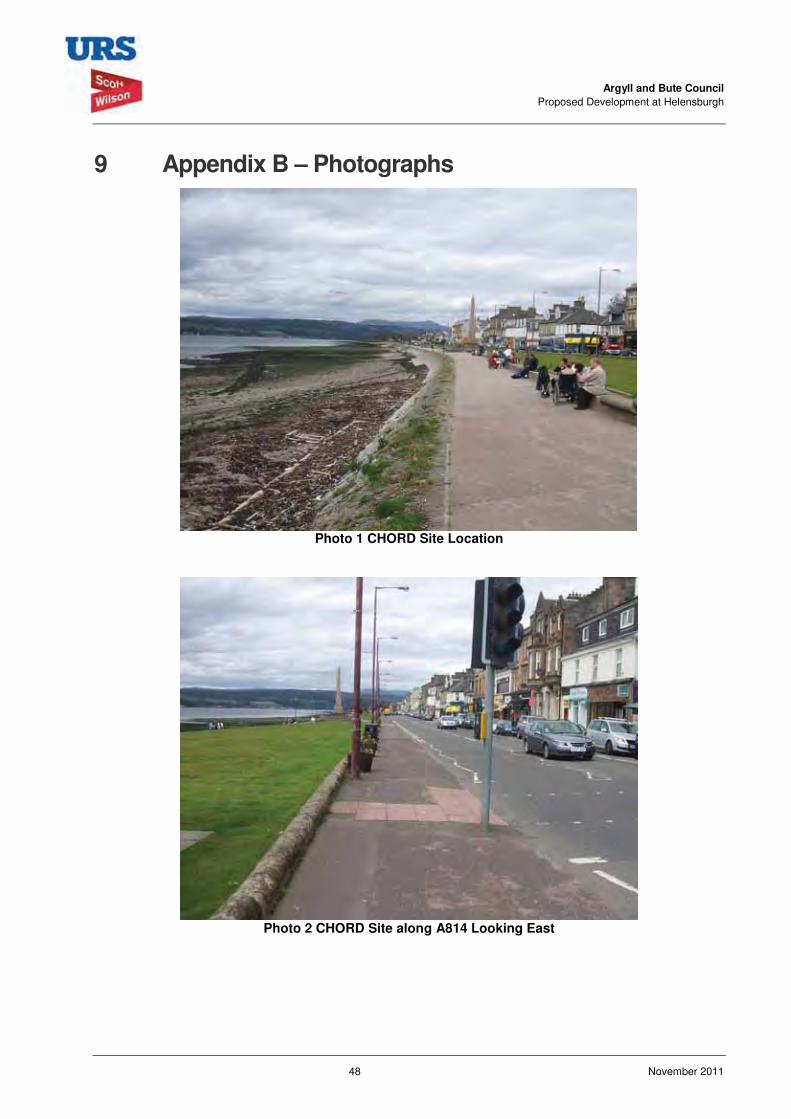
Argyll and Bute Council Proposed Development at Helensburgh
48 November 2011
9 Appendix B – Photographs
Photo 1 CHORD Site Location
Photo 2 CHORD Site along A814 Looking East
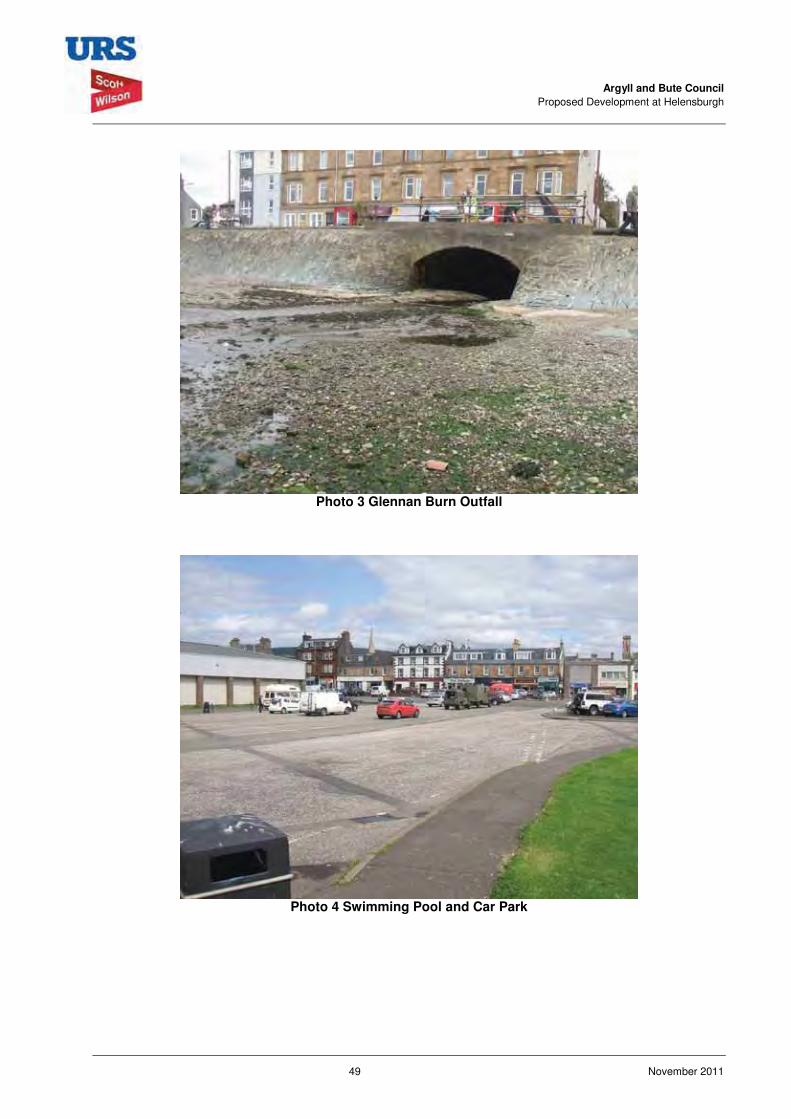
Argyll and Bute Council Proposed Development at Helensburgh
49 November 2011
Photo 3 Glennan Burn Outfall
Photo 4 Swimming Pool and Car Park
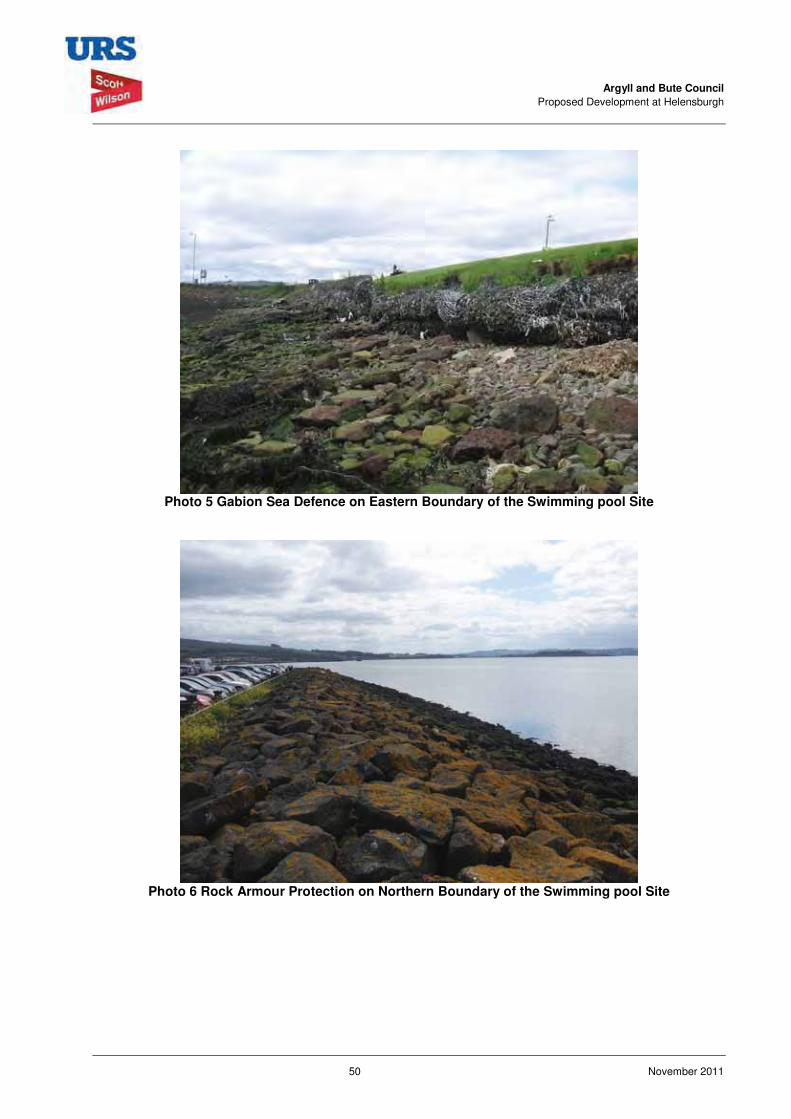
Argyll and Bute Council Proposed Development at Helensburgh
50 November 2011
Photo 5 Gabion Sea Defence on Eastern Boundary of the Swimming pool Site
Photo 6 Rock Armour Protection on Northern Boundary of the Swimming pool Site
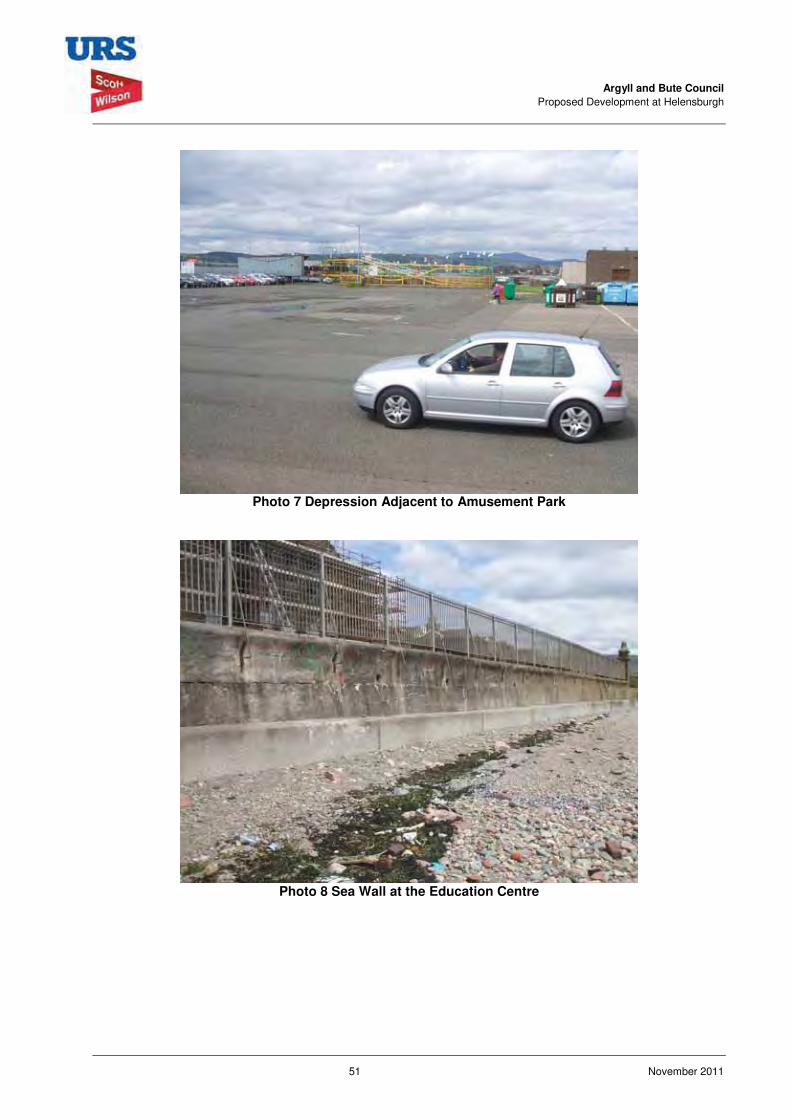
Argyll and Bute Council Proposed Development at Helensburgh
51 November 2011
Photo 7 Depression Adjacent to Amusement Park
Photo 8 Sea Wall at the Education Centre
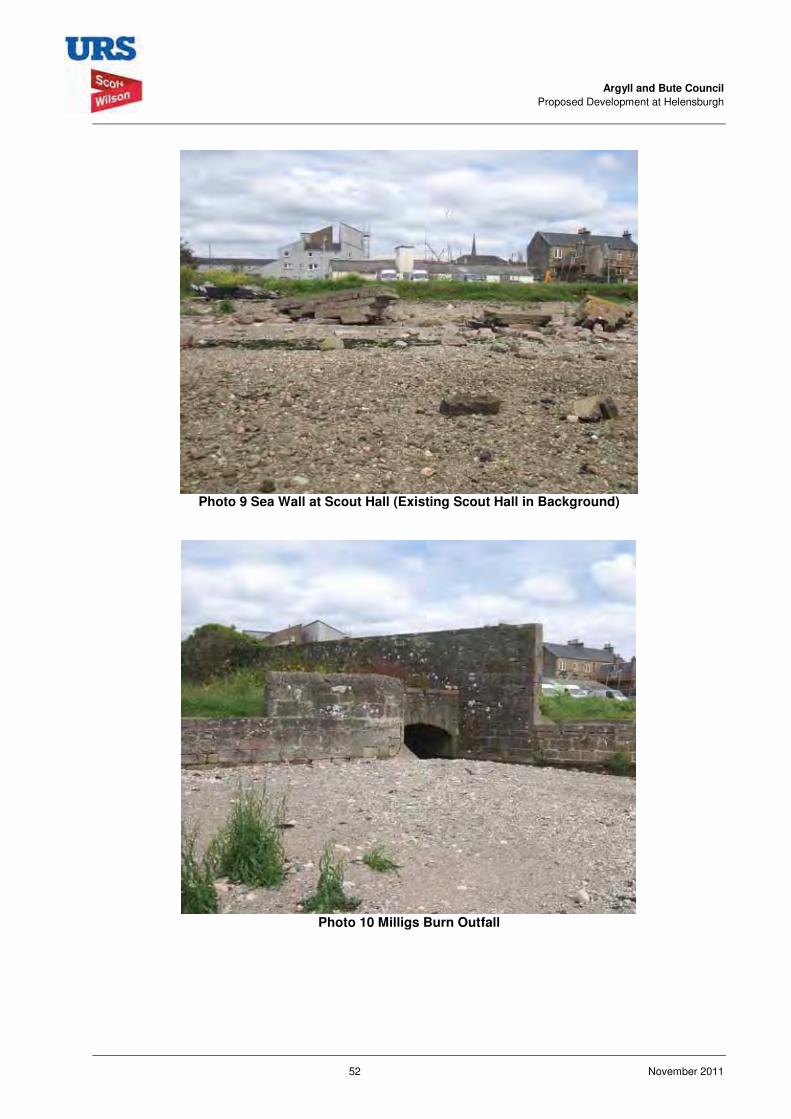
Argyll and Bute Council Proposed Development at Helensburgh
52 November 2011
Photo 9 Sea Wall at Scout Hall (Existing Scout Hall in Background)
Photo 10 Milligs Burn Outfall
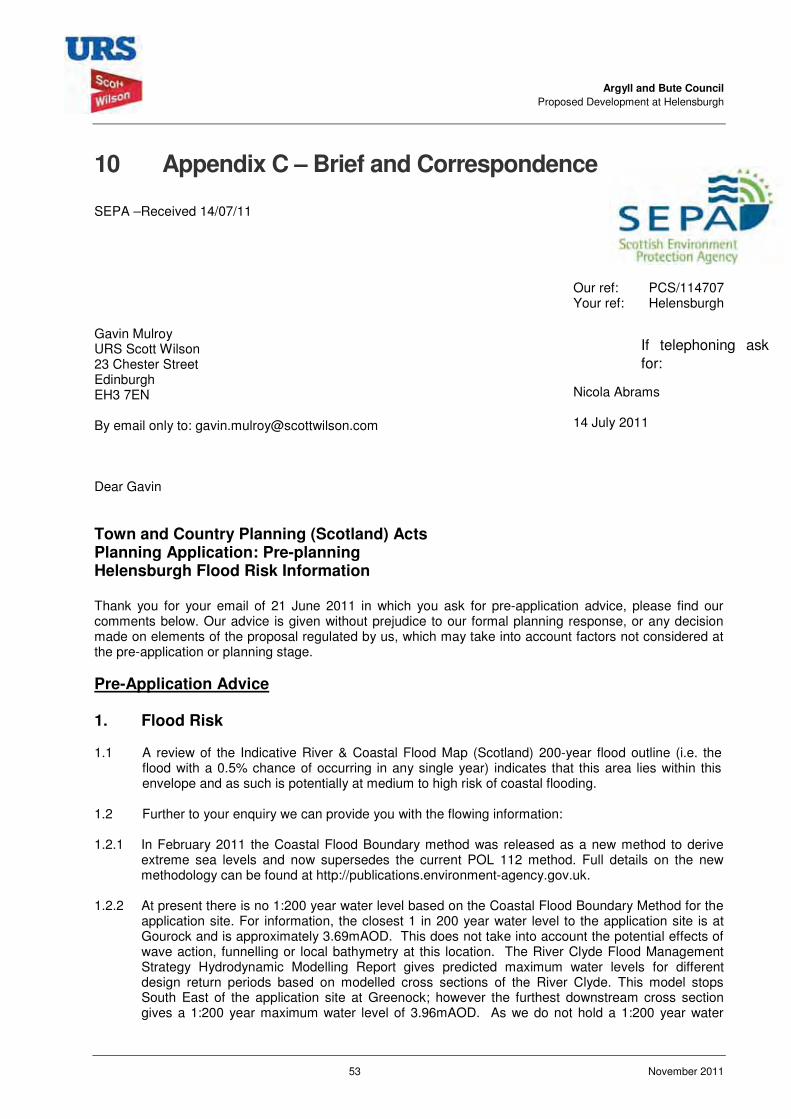
Argyll and Bute Council Proposed Development at Helensburgh
53 November 2011
10 Appendix C – Brief and Correspondence SEPA –Received 14/07/11
Our ref: PCS/114707 Your ref: Helensburgh
Gavin Mulroy URS Scott Wilson 23 Chester Street Edinburgh EH3 7EN By email only to: [email protected]
If telephoning ask for:
Nicola Abrams 14 July 2011
Dear Gavin Town and Country Planning (Scotland) Acts Planning Application: Pre-planning Helensburgh Flood Risk Information Thank you for your email of 21 June 2011 in which you ask for pre-application advice, please find our comments below. Our advice is given without prejudice to our formal planning response, or any decision made on elements of the proposal regulated by us, which may take into account factors not considered at the pre-application or planning stage. Pre-Application Advice 1. Flood Risk 1.1 A review of the Indicative River & Coastal Flood Map (Scotland) 200-year flood outline (i.e. the
flood with a 0.5% chance of occurring in any single year) indicates that this area lies within this envelope and as such is potentially at medium to high risk of coastal flooding.
1.2 Further to your enquiry we can provide you with the flowing information: 1.2.1 In February 2011 the Coastal Flood Boundary method was released as a new method to derive
extreme sea levels and now supersedes the current POL 112 method. Full details on the new methodology can be found at http://publications.environment-agency.gov.uk.
1.2.2 At present there is no 1:200 year water level based on the Coastal Flood Boundary Method for the
application site. For information, the closest 1 in 200 year water level to the application site is at Gourock and is approximately 3.69mAOD. This does not take into account the potential effects of wave action, funnelling or local bathymetry at this location. The River Clyde Flood Management Strategy Hydrodynamic Modelling Report gives predicted maximum water levels for different design return periods based on modelled cross sections of the River Clyde. This model stops South East of the application site at Greenock; however the furthest downstream cross section gives a 1:200 year maximum water level of 3.96mAOD. As we do not hold a 1:200 year water
Argyll and Bute Council Proposed Development at Helensburgh
54 November 2011
level for the application site it is recommended that an approximate 1:200 year water level at the application site is determined using the two water levels provided. We also recommend that contact is made with the Flood Prevention Authority with regard to the appropriate levels of freeboard for the area.
1.2.3 We currently hold no information regarding historical flooding from either the Glennan Burn or the
Milligs Burn however we do hold a record of point source tidal flooding in this area. 1.2.4 For information a Flood Risk Assessment (FRA) has previously been carried out in this area by
Halcrow Group Ltd in November 2001. 1.3 We recommend that consideration should be given for joint probabilities between tide
levels/waves/fluvial effects and the effects of climate change. 1.4 We also recommend that you contact the Roads Department of Argyll & Bute Council who, as
Flood Prevention Authority, should be able to provide further information regarding flooding and flood alleviation in the area.
1.5 If we were formally consulted through the planning process on a development at this location we
would require additional information such as a detailed planning drawing of the development site detailing the site boundary and topographic information. We would also require information on flood protection measures proposed within the development to ensure that flood risk to the site is kept to a minimum.
2. Caveats & Additional Information for Applicant 2.1 The Indicative River & Coastal Flood Map (Scotland) has been produced following a consistent,
nationally-applied methodology for catchment areas equal to or greater than 3km2 using a Digital Terrain Model (DTM) to define river cross-sections and low-lying coastal land. The outlines do not account for flooding arising from sources such as surface water runoff, surcharged culverts or drainage systems. The methodology was not designed to quantify the impacts of factors such as flood alleviation measures, buildings and transport infrastructure on flood conveyance & storage. The Indicative River & Coastal Flood Map (Scotland) is designed to be used as a national strategic assessment of flood risk to support planning policy in Scotland. For further information please visit www.sepa.org.uk/flooding/flood_map.aspx.
2.2 We refer the applicant to the document entitled: “Technical Flood Risk Guidance for Stakeholders”.
This document provides generic requirements for undertaking Flood Risk Assessments and can be downloaded from www.sepa.org.uk/flooding/flood_risk/planning__flooding.aspx. Please note that this document should be read in conjunction with Annex B in SEPA Policy 41: “Development at Risk of Flooding, Advice and Consultation – a SEPA Planning Authority Protocol”, available from www.sepa.org.uk/flooding/flood_risk.aspx.
2.3 Our Flood Risk Assessment checklist should be completed and attached within the front cover of
any flood risk assessments issued in support of a development proposal which may be at risk of flooding. The document will take only a few minutes to complete and will assist our review process. It can be downloaded from www.sepa.org.uk/flooding/flood_risk/planning__flooding/fra_checklist.aspx
2.4 Please note that we are reliant on the accuracy and completeness of any information supplied by
the applicant in undertaking our review, and can take no responsibility for incorrect data or interpretation made by the authors.
2.5 The flood advice contained in this letter is supplied to you by SEPA under the Environmental
Information (Scotland) Regulations 2004 in response to your request for information under these regulations.

Argyll and Bute Council Proposed Development at Helensburgh
55 November 2011
If you have any queries relating to this letter, please contact me by telephone on 01224 266698 or by e-mail to [email protected] Yours Sincerely Nicola Abrams Senior Planning Officer Planning Service
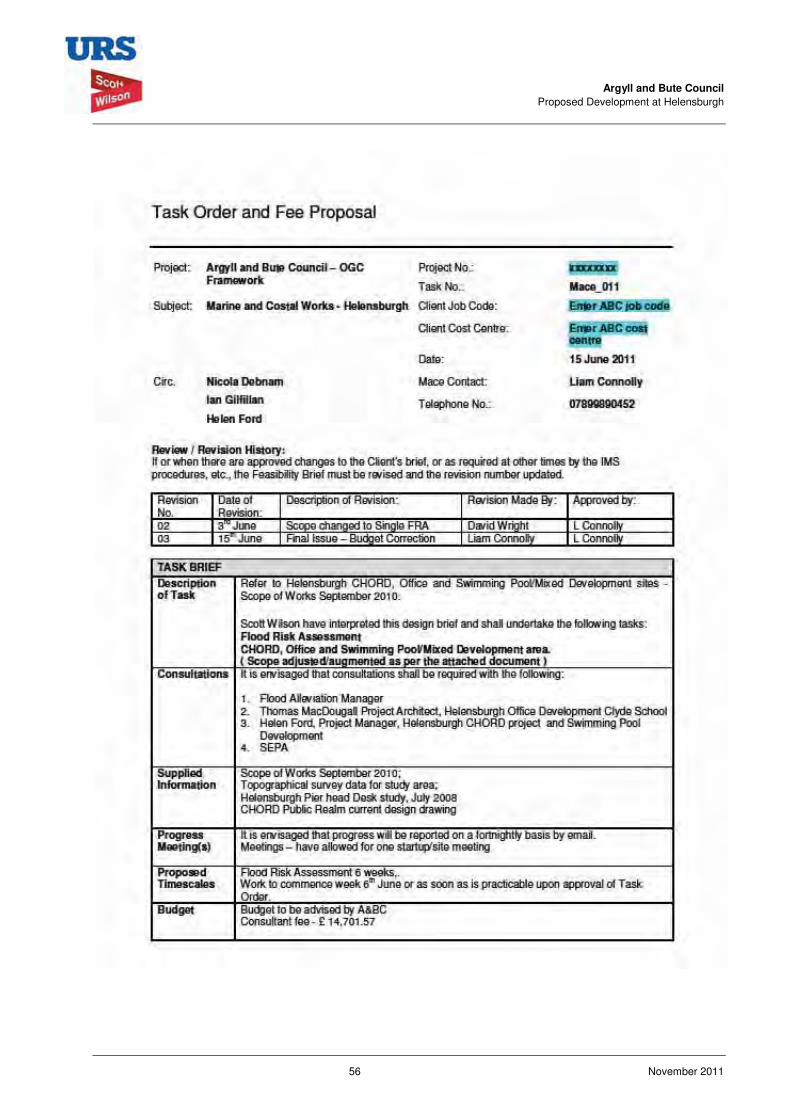
Argyll and Bute Council Proposed Development at Helensburgh
56 November 2011

Argyll and Bute Council Proposed Development at Helensburgh
57 November 2011

Argyll and Bute Council Proposed Development at Helensburgh
58 November 2011
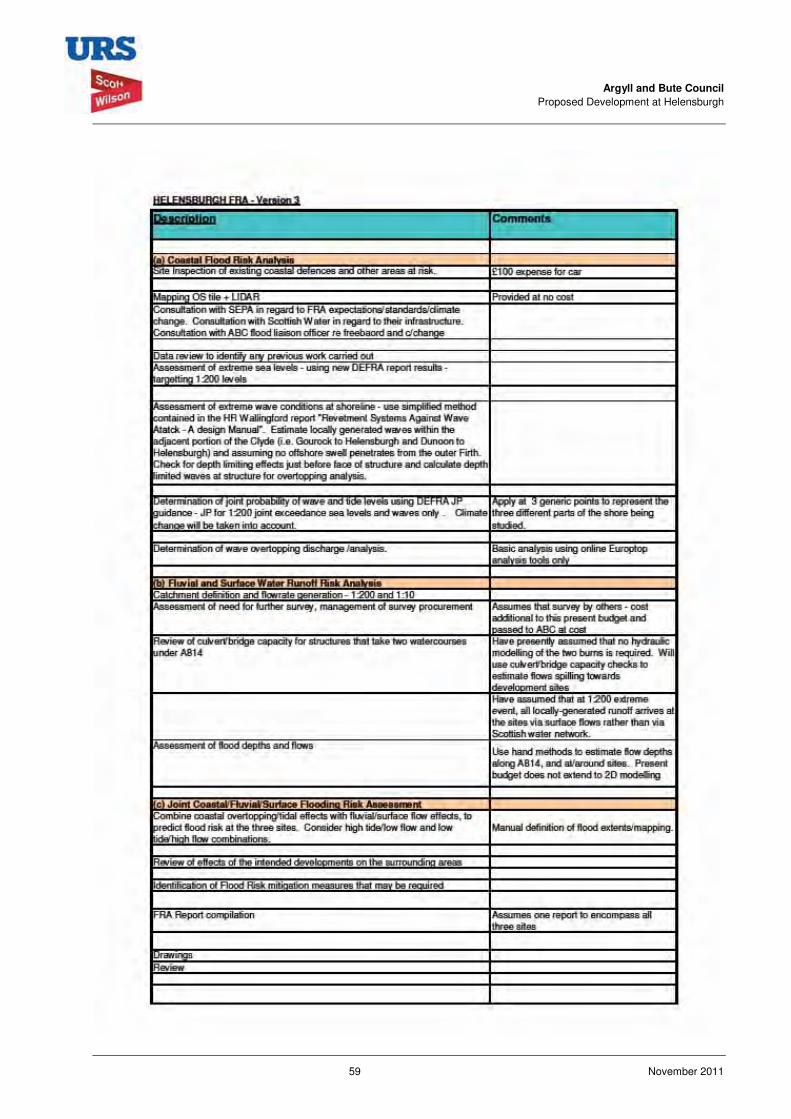
Argyll and Bute Council Proposed Development at Helensburgh
59 November 2011