proposed action plan for industrial cluster at aurangabad · bibi-ka-maqbara. hence it deserves the...
TRANSCRIPT
Environmental status and action plan for prevention and control of pollution at Aurangabad
Maharashtra Pollution Control Board. 1
PROPOSED ACTION PLAN FOR INDUSTRIAL CLUSTER AT AURANGABAD
MAHARASHTRA POLLUTION CONTROL BOARD KALPATARU POINT, SION (E)
MUMBAI
Environmental status and action plan for prevention and control of pollution at Aurangabad
Maharashtra Pollution Control Board. 2
ACTION PLAN FOR CRITICALLY POLLUTED INDUSTRIAL AREAS/CLUSTERS OF AURANGABAD
CONTENTS Sr.No
Contents Page No.
INTRODUCTION 1-11 1.1 Area Details including brief history (background information) 6 1.2 Location 6 1.3 Digitized Map with Demarcation of Geographical Boundaries and Impact
Zones 6
1.4 CEPI Score (Air, Water, Land and Total) 8 1.5 Total Population and sensitive receptors (hospitals, educational
institutions, courts, etc.) residing in the area comprising of geographical area of the cluster and its impact zone (minimum 2 km)
8
Eco-geological features Impact Zones [the area comprising of geographical area of the cluster and its impact zone (min. 2 km)] 9
1.6.1 Major Water Bodies (Rivers, Lakes, Ponds, etc.) 9 1.6.2 Ecological parks, Sanctuaries, Flora and Fauna or any eco-
sensitive zones 9
1.6
1.6.3 Buildings or Monuments of Historical / archaeological/religious importance 10
Industry classification and distribution (no. of industries per 10 sq.km area or fraction) 10
1.7.1 Highly Polluting industries (17 categories) 11 1.7.2 Red category industries (54 categories) 11 1.7.3 Orange and Green category industries 11
1
1.7
1.7.4 Grossly Polluting industries 11 WATER ENVIRONMENT 12-24
Present status of water environment supported with minimum one year analytical data 12
2.1.1 Water bodies/effluent receiving drains in the area important for water quality monitoring 12
2.1.2 Present levels of pollutants in water bodies/effluent receiving drains / ground water (routine parameters, special parameters and water toxics relevant to the area in three categories – known carcinogens, probable carcinogens and other toxics)
14
2.1
2.1.3 Predominant sources contributing to various pollutants 15 Sources of water pollution 15 2.2.1 Industrial 15 2.2.2 Domestic 16 2.2.3 Others(Agricultural runoff, leachate from MSW dump, illegal dump site etc.) 16
2.2
2.2.4 Impact on surrounding area (outside the CEPI Area) on the water courses/drainage system of the area under consideration 16
2.3 Details of Water Polluting Industries in the area/cluster 16 2.4 Effluent Disposal Method- Recipient water bodies etc. 17
2
2.5 Quantification of wastewater pollution load and relative contribution by different sources viz industrial/domestic 17

Environmental status and action plan for prevention and control of pollution at Aurangabad
Maharashtra Pollution Control Board. 3
Action Plan for compliance and control of pollution 18 2.6.1 Existing infrastructure facilities – water quality monitoring network, ETPs, CETP, Sewage Treatment Plant of industry (STPs), surface drainage system, effluent conveyance channels/outfalls, etc.
2.6.2 Pollution control measures installed by Industries 20 Technological Intervention 21 2.6.3.1 Inventorisation of prominent industries with technological gaps 21
2.6.3
2.6.3.2 Identification of low cost and advanced cleaner technology for pollution control 21
Infrastructure Renewal 21 2.6.4.1 Details of existing infrastructural facilities 21 2.6.4.2 Need of up gradation of existing facilities 21 2.6.4.3 De-silting of water tanks, drains, rivulets, etc. 22 2.6.4.4 Construction of lined drains/connections 22 2.6.4.5 Treatment and management of contaminated surface water
bodies 22
2.6.4.6 Rejuvenation/Management Plan for important eco-geological features. 22
2.6.4
2.6.4.7 Carrying of effluent from industrial units located in non-industrial locations to CETP facilities by lined drains/pipelines only and prevention of their disposal into city sewage/surface drains
2.6.4.8 Installation of gen set.
22
Managerial and Financial aspects 23 2.6.5.1 Cost and time estimates 23 2.6.5.2 Identified Private/Public sector potential investors & their contribution/obligation 24
2.6.5.3 Government Budgetary support requirement 24
2.6.5
2.6.5.4 Hierarchical and structured managerial system for efficient implementation
24
2.6.6 Self monitoring system in industries (ETPs etc.) 24
2.6
2.6.7 Data linkages to SPCB/CPCB (of monitoring devices) 24 AIR ENVIRONMENT 25 -
31 Present status of Air environment supported with minimum one year analytical data 25
3.1.1 Critical locations for air quality monitoring 25 3.1.2 Present levels of pollutants in air (routine parameters, special parameters and air toxics relevant to the area in three categories – known carcinogens, probable carcinogens and other toxics)
26
3.1
3.1.3 Predominant sources contributing to various pollutants 26 3.2 Source of Air Pollution viz industrial, domestic (Coal & Biomass burning),
natural and Transport & Heavy Earth Movers 27
3.3 Air Polluting Industries in the area/cluster 27 3.4 Impact of activities of nearby area on the CEPI Area 27 3.5 Quantification of the air pollution load and relative contribution by different
sources 27
3
3.6 Action Plan for compliance and control of pollution 28

Environmental status and action plan for prevention and control of pollution at Aurangabad
Maharashtra Pollution Control Board. 4
3.6.1 Existing infrastructure facilities – Ambient air quality monitoring network 28
3.6.2 Pollution control measures installed by the individual sources of pollution 28
Technological Intervention 29 3.6.3.1 Inventorisation of prominent industries with technological
gaps 29
3.6.3.2 Identification of low cost and advanced cleaner technology for air pollution control 29
3.6.3
3.6.3.3 Introduction and switch over to clearer fuel 29 Need of infrastructure Renovation 29 3.6.4. 3.6.4.1 Development of roads 29
3.6.5 Impact on CEPI score after installation/commissioning of full fledged air pollution control system. 29
3.6.6 Managerial and Financial aspects – Cost and time estimates 30 3.6.6.1 Cost and time estimates 30 3.6.6.2 Identified private/Public sector potential investors & their
contribution/obligation 31
3.6.6.3 Government Budgetary support requirement 31 3.6.6.4 Hierarchical and structured managerial system for efficient
implementation 31
3.6.7 Self monitoring system in industries (Stacks, APCDs) 31 3.6.8 Data linkages to SPCB/CPCB (of monitoring devices) 31 LAND ENVIRONMENT (Soil and Ground Water) 32 –
42 Soil Contamination 32 4.1.1 Present status of land environment supported with minimum one year analytical data 32
4.1.2 Critical locations for land/soil pollution assessment and ground water monitoring 32
4.1.3 Present levels of pollutants in land/soil and ground water (routine parameters, special parameters and water toxics relevant to the area in three categories – known carcinogens, probable carcinogens and other toxics)
32
4.1.4 Predominant sources contributing to or posting danger of pollution of land and ground water such as hazardous/toxic wastes or chemicals dumps/storage etc.
32
4.1.5 Sources of Soil Contamination 33 4.1.6 Types of existing pollution 33
4.1
4.1.7 Remedies for abatement, treatment and restoration of normal soil quality 33
Ground water contamination 35 4.2.1 Present status/quality of ground water 35 4.2.2 Source Identification (Existing sources of Ground water Pollution) 36 4.2.3 Ground water quality monitoring program 37 4.2.4 Action Plan for control of pollution including cost/time aspects 37 4.2.5 Treatment and management of contaminated ground water bodies, etc. 38
4.2
4.2.6 Impact on CEPI score after abatement of pollution 39 4.3 Solid Waste Generation and Management 39
4
4.3.1 Waste Classification and Quantification 39

Environmental status and action plan for prevention and control of pollution at Aurangabad
Maharashtra Pollution Control Board. 5
4.3.1.1 Hazardous waste 39 4.3.1.2 Bio-medical waste 39 4.3.1.3 Electronic waste 40 4.3.1.4 Municipal Solid Waste/Domestic Waste/Sludges from
ETPs/CETPs/STPs and other industrial sources 40
4.3.1.5 Plastic waste 40 4.3.1.6 Quantification of wastes and relative contribution from
different sources 41
4.3.2 Identification of waste minimization and waste exchange options 41 4.3.3 Reduction /Reuse /Recovery / Recycle options in the co-processing
of wastes 41
Infrastructure facilities 41 4.3.4.1 Existing TSDF/Incineration facilities including capacities 41 4.3.4.2 Present status/performance and need of up gradation of
existing facilities including enhancement of capacities 41
4.3.4.3 Treatment and management of contaminated waste disposal sites, etc. 41
4.3.4
4.3.4.4 Impact on CEPI score after proper management of Solid Wastes 42
PPP Model 43 5.1 Identification of project proposals (for both the options i.e. technology
intervention and infrastructure renewal) for implementation under the PPP model under the Action Plan.
42
5
5.2 Identification of stakeholders / agencies to be involved and to evolve financial and managerial mechanisms for implementation of PPP projects. 42
Other infrastructural Renewal measures 42 6.1 Green Belts 42 6.2 Development of Industrial Estate(s) 43
6
6.3 Development of shifting of industries located in the non-industrial areas to the existing/new industrial estates 43
Specific Schemes 43 7.1 GIS-GPS system for pollution sources monitoring 43 7.2 Hydro-geological fracturing for water bodies rejuvenation 43 7.3 In-situ remediation of sewage 43 7.4 Utilization of MSW inert by gas based brick kilns 43
7
7.5 Co-processing of wastes in cement industries 43 8 Public awareness and training Programmes 43 9 Overall Impact of Installation/commissioning of pollution control
equipments/measures on the CEPI score 44
10 Assessment of Techno-economical feasibility of pollution control systems in clusters of small/medium scale industries 45
11 Efforts shall be made to encourage use of Bio-compost and Bio-fertilizer alongwith the chemical fertilizer in the state to minimize the unutilized chemical fertilizer run-off into the natural water resources from agriculture fields (through Govt. Policy)
45
Summary of proposed action points 45 12.1 Short Term Action Points ((upto 1 year, including continuous
Activities) 46
12
12.2 Long Term Action Points (more than 3 year) 48

Environmental status and action plan for prevention and control of pollution at Aurangabad
Maharashtra Pollution Control Board. 6
1. INTRODUCTION
1.1 Area Details including brief history (background information)
Aurangabad city was founded by Malik Ambar in 1610 A.D. From ancient times, Aurangabad has been a place of great importance due to its location on the famous Silk Route that traversed across the breadth of Asia to reach Europe. The city occupies an important place on the tourist’s map of the world. The city is festooned all around with an amazing variety of monuments such as rock-cut temples in the mountain ravines of Ellora and Ajanta, strategic forts such as the one at Daulatabad and mosques and mausoleums with their minarets and domes such as Bibi-Ka-Maqbara. Hence it deserves the epithet as tourist district of India.
Aurangabad city typifies the landscape and the climatic conditions of the entire Marathwada region and is the Divisional Head Quarters of the Marathwada Region.
1.2 Location Aurangabad District is located mainly in the Godavari River Basin and partly in the Tapi River Basin. The district is from 19 to 20 degrees north longitude and 74 to 76 degrees east latitude. Aurangabad city is situated on the bank of river Kham a tributary of the Godavari River. The entire city is situated at the latitude of 19o53’50” N and longitude of 75o22’46” E. It is located 512 meters above Sea Level. The city is surrounded by hills of the Vindhya Ranges and the river Kham passes through it.
1.3 Digitized Map with Demarcation of Geographical Boundaries and Impact Zones
Municipal Corporation Aurangabad and adjacent polluted industrial area Waluj is roughly identified for preparing the Development of Comprehensive Environmental Pollution Abatement Action Plan. In the limit of Corporation area there is one Old Industrial Cluster at Chikalthana and another very small as well as sick industrial area near the Railway Station. A digitized map is prepared on a map of 50000:1. The impact zone with most of the details are marked on it.

Environmental status and action plan for prevention and control of pollution at Aurangabad
Maharashtra Pollution Control Board. 7
Map showing location of industrial clusters in Aurangabad

Environmental status and action plan for prevention and control of pollution at Aurangabad
Maharashtra Pollution Control Board. 8
1.4 CEPI Score (Air, Water, Land and Total) Aurangabad is one of the critically polluted industrial clusters identified by CPCB and its CEPI Score is 77.44. This critically polluted industrial cluster needs further detailed study in terms of the extent of damage and formulation of appropriate remedial action plan.
A1 A2 A B1 B2 B3 B C1 C2 C3 C D TotalAir 5.75 5.0 28.75 6.0 3.0 3.0 12.0 3.0 3.0 5.0 14.0 10.0 60.50
A1 A2 A B1 B2 B3 B C1 C2 C3 C D TotalWater 5.5 5.0 27.5 8.0 3.0 3.0 14.0 3.0 3.0 5.0 14.0 5.0 64.75
A1 A2 A B1 B2 B3 B C1 C2 C3 C D TotalLand 5.5 5.0 27.5 7.0 3.0 3.0 13.0 3.0 3.0 5.0 14.0 5.0 59.5
Water CEPI = 60.50 Air CEPI = 64.75 Land CEPI = 59.5 Aggregate CEPI= 77.44
1.5 Total Population and sensitive receptors (hospitals, educational
institutions, courts, etc.) residing in the area comprising of geographical area of the cluster and its impact zone (minimum 2 km) The Aurangabad Municipal Council was formed in 1936 when the geographical area of the town was 54.40 sq.km. In 1982, the Council was converted into Municipal Corporation including 18 nearby villages measuring 138.5 sq.km. area. Due to the rapid industrialization and urbanization, the city emerged as a educational hub, commercial centre, tourist attraction etc. Aurangabad has diverse economic activities ranging from industries, services to tourism and education. There is a drastic change in the city population and Aurangabad city emerged as the fastest growing city in Asia. The population in 2001 was about 872667, which represents a decadal growth of 79.32. (Source: Census of India 2001 & D.P. Report, Aurangabad).
Status of Population of Aurangabad city
Year Population Increase in souls Decadal Growth Rate 1931 29288 -- -- 1941 41644 12356 42.19 1951 57949 16305 39.15 1961 87579 29630 51.13 1971 150483 62904 71.83 1981 284807 134324 89.26 1991 487025 202218 71.00 2001 872667 385642 79.32
(Source: Census of India 2001 & D.P. Report, Aurangabad)
Environmental status and action plan for prevention and control of pollution at Aurangabad
Maharashtra Pollution Control Board. 9
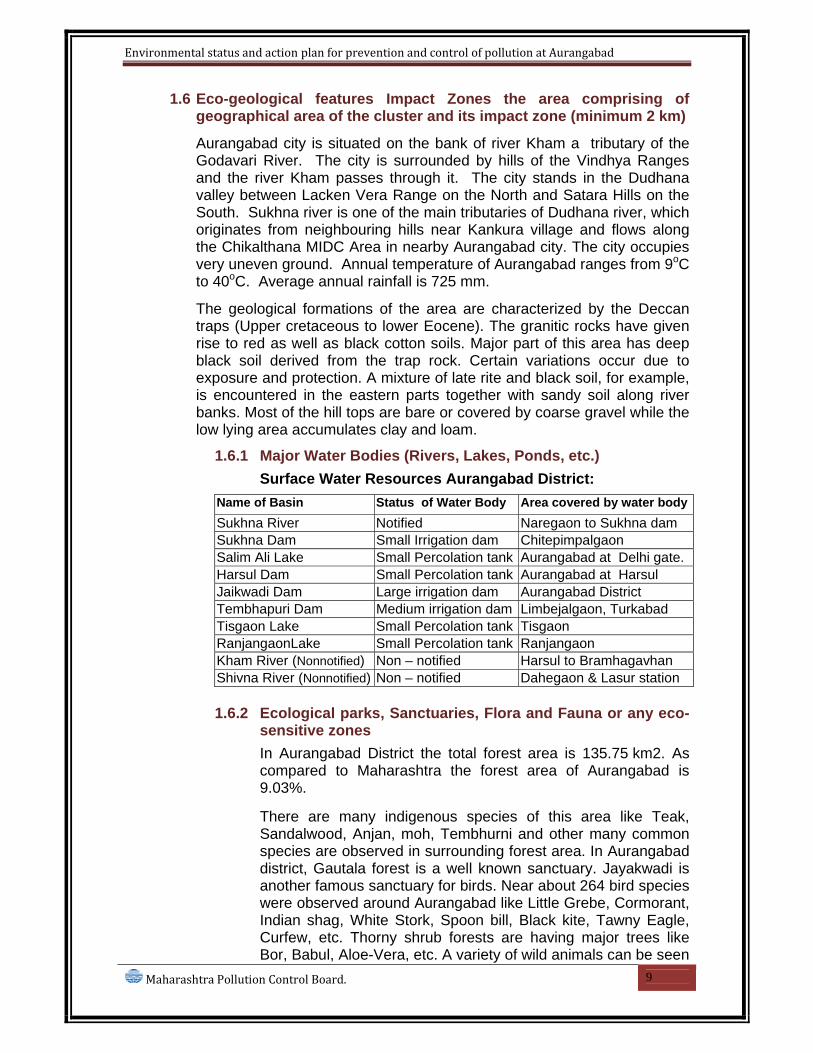
1.6 Eco-geological features Impact Zones the area comprising of geographical area of the cluster and its impact zone (minimum 2 km)
Aurangabad city is situated on the bank of river Kham a tributary of the Godavari River. The city is surrounded by hills of the Vindhya Ranges and the river Kham passes through it. The city stands in the Dudhana valley between Lacken Vera Range on the North and Satara Hills on the South. Sukhna river is one of the main tributaries of Dudhana river, which originates from neighbouring hills near Kankura village and flows along the Chikalthana MIDC Area in nearby Aurangabad city. The city occupies very uneven ground. Annual temperature of Aurangabad ranges from 9oC to 40oC. Average annual rainfall is 725 mm.
The geological formations of the area are characterized by the Deccan traps (Upper cretaceous to lower Eocene). The granitic rocks have given rise to red as well as black cotton soils. Major part of this area has deep black soil derived from the trap rock. Certain variations occur due to exposure and protection. A mixture of late rite and black soil, for example, is encountered in the eastern parts together with sandy soil along river banks. Most of the hill tops are bare or covered by coarse gravel while the low lying area accumulates clay and loam.
1.6.1 Major Water Bodies (Rivers, Lakes, Ponds, etc.)
Surface Water Resources Aurangabad District: Name of Basin Status of Water Body Area covered by water bodySukhna River Notified Naregaon to Sukhna dam Sukhna Dam Small Irrigation dam Chitepimpalgaon Salim Ali Lake Small Percolation tank Aurangabad at Delhi gate. Harsul Dam Small Percolation tank Aurangabad at Harsul Jaikwadi Dam Large irrigation dam Aurangabad District Tembhapuri Dam Medium irrigation dam Limbejalgaon, Turkabad Tisgaon Lake Small Percolation tank Tisgaon RanjangaonLake Small Percolation tank Ranjangaon Kham River (Nonnotified) Non – notified Harsul to Bramhagavhan Shivna River (Nonnotified) Non – notified Dahegaon & Lasur station
1.6.2 Ecological parks, Sanctuaries, Flora and Fauna or any eco-
sensitive zones
In Aurangabad District the total forest area is 135.75 km2. As compared to Maharashtra the forest area of Aurangabad is 9.03%. There are many indigenous species of this area like Teak, Sandalwood, Anjan, moh, Tembhurni and other many common species are observed in surrounding forest area. In Aurangabad district, Gautala forest is a well known sanctuary. Jayakwadi is another famous sanctuary for birds. Near about 264 bird species were observed around Aurangabad like Little Grebe, Cormorant, Indian shag, White Stork, Spoon bill, Black kite, Tawny Eagle, Curfew, etc. Thorny shrub forests are having major trees like Bor, Babul, Aloe-Vera, etc. A variety of wild animals can be seen

Environmental status and action plan for prevention and control of pollution at Aurangabad
Maharashtra Pollution Control Board. 10
in the surrounding forests like wild boars, Foxes, Hares, etc. Leopards are seen but rarely. There are many monkeys and Baboons in the Aurangabad City area. The major agricultural crops are Cotton, Oilseeds, Bajra, Jawar, Groundnut, Wheat and Safflower and irrigated crops like sugarcane which is one of the important irrigated crops. Other irrigated crops like Grapes, Bananas, Sweet Limes and Oranges etc. are also grown in the soil of Aurangabad. There are variety of vegetables are also grown in the soil of Aurangabad like Brinjals, Tomatoes, Onions, Potatoes and Leafy vegetables, etc.
1.6.3 Buildings or Monuments of Historical / archaeological / religious importance
There are no Buildings or Monuments of Historical / archaeological / religious importance within a radius of 2 km from these 4 industrial areas.
Aurangabad is the gateway to World heritage sites of Ajanta and Ellora Caves, besides Aurangabad also has quite a few tourists attraction like Bibi ka Maqbara, Daulatabad fort and mosques and mausoleums with their minarets and domes.
1.7 Industry classification and distribution (no. of industries per 10 sq.km area or fraction)
There are four clusters of industries in Aurangabad district. However, also there is scattered Industrial development along the periphery of Aurangabad city along Beed Road and Paithan road. Renowned companies such as Wockhardt Ltd., United Spirits Ltd., Bajaj Auto Ltd., Orchid Chemicals & Pharmaceuticals Ltd., Skoda Ltd., Johnson & Johnson Ltd., Colgate Palmolive Ltd., Garware Polyesters Ltd., Sterlite Technologies Ltd., etc are in operation in Aurangabad.
Details of Industrial Cluster of Aurangabad
Sr No
Name of Industrial Cluster
Distance from Aurangabad
Area in Hectares
Remarks
1 Shendra MIDC Area,
15 Km 600 New developing area SEZ units
2. Railway Station MIDC
Within AMC area
20 Very small industrial area also having many sick units
3. Chikalthana MIDC Area
Within AMC area
400 Old industrial area having mostly sick units
4 Waluj MIDC Area 12 Km 1520 Major Ind. Area near A’bad city

Environmental status and action plan for prevention and control of pollution at Aurangabad
Maharashtra Pollution Control Board. 11
1.7.1 Highly Polluting industries (17 categories)
No. of Industries in MIDCSr. No
Type of Industries
She
ndra
Rly
. Stn
Chi
khal
th
ana
Wal
uj
Tota
l
1 Aluminium smelting 0 0 0 0 0 2 Basic drugs and pharmaceutical mfg. 1 1 3 14 19 3 Caustic soda 0 0 0 0 0 4 Cement (>=200 TPD) 0 0 0 0 0 5 Copper smelting 0 0 0 0 0 6 Dyes and dye intermediates 0 0 0 0 0 7 Distillery 1 0 1 0 2 8 Fertiliser 0 0 0 0 0 9 Integrated Iron & steel 0 0 0 0 0 10 Leather processing including tanneries 0 0 0 0 0 11 Oil refinery 0 0 0 0 0 12 Pesticide formulation and mfg. 0 0 0 2 2 13 Pulp and paper (>=30 TPD) 0 0 0 0 0 14 Petrochemical 0 0 0 0 0 15 Sugar 0 0 0 0 0 16 Thermal power 1 0 0 0 1 17 Zinc smelting 0 0 0 0 1 Total 2 1 4 16 23
1.7.2 Red category industries (54 categories)
Sr. No.
MIDC No. of industries in red category
1. Shendra 07 2. Chikalthana 24 3. Waluj 257 4. Rly. Stn. MIDC 5 Total 293
1.7.3 Orange and Green category industries
Sr. No.
MIDC Orange category
Green category
Total
1 Shendra 04 15 19 2 Chikalthana 11 181 192 3 Waluj 181 962 1143 4 Rly. Stn.
MIDC 05 14 19
Total 201 1162 1363
1.7.4 Grossly Polluting industries
Sr. No.
Type of Industries No. of industries
Nil

Environmental status and action plan for prevention and control of pollution at Aurangabad
Maharashtra Pollution Control Board. 12
2. WATER ENVIRONMENT 2.1 Present status of water environment supported with minimum one year
analytical data.
Total generation of sewage in Aurangabad city is 107 MLD. Aurangabad Municipal Corporation is treating only 6.5 MLD of sewage, the rest is disposed without treatment into water bodies. The said STP is located near Aurangabad Airport at Murtuzapur. The STP is approved and designed for CIDCO area in 1993 and commissioned in Feb 1998. The treated sewage is discharged in Kham and Sukhna river.
In Waluj MIDC area, there are 105 units which are water polluting. Out of 105 industries 45 industries generate industrial effluent more than 10 CMD. Total quantity of industrial effluent generated from Waluj MIDC area is 10.72 MLD and total domestic effluent generated is 3.928 MLD. The total BOD load in the area is 8.69 kg/d.
Major industrial effluent generated is from M/s. Bajaj Auto Ltd. is to the tune of 2680 CMD. All the large and medium scale industries generating industrial effluent have provided ETPs. A few of the industries have also provided Chrome recovery plants.
There is possibility of leakages, seepages, spillages from very old ETPs. To overcome such problems revamping of such ETPs shall be essential. Another major cause of ground water pollution is unscientific disposal of treated effluent on land. Advanced methods should be adopted by the Bulk Drug units for solvent recovery from high concentrated stream of effluent..
Also most of the small scale cottage type water polluting industries are unable to provide full-fledged treatment due to lack of finance, thereby causing ground water pollution by discharging substandard effluent on land. To overcome this problem CETP is necessary. The Waluj CETP is presently ready for commissioning.
2.1.1 Water bodies/effluent receiving drains in the area important for water quality monitoring
There are 05 effluent generating industries in Shendra MIDC. The total trade effluent generation in the area is 700 CMD. Industries have provided adequate effluent treatment for treatment of trade effluent. The treated effluent is applied on land for gardening / irrigation purposes. Most of the industries have provided septic tank/STP for treatment of domestic waste. The run-offs from the treated, domestic and trade effluent may find its way into the Sukhna river. Hence, upstream and downstream of this confluence point needs to be considered for water quality monitoring. This MIDC is categorized as 5-star MIDC. New units are coming up here and it is incumbent upon them to strictly adhere to the air, water and soil pollution norms that have been laid down, right from inception.
Chikhalthana MIDC houses 21 trade effluent generating industries. This is an old industrial estate and within the

Environmental status and action plan for prevention and control of pollution at Aurangabad
Maharashtra Pollution Control Board. 13
Aurangabad Municipal Corporation limits. Most of the units are closed down and a few sick units are operational. Owing to escalating cost of land within the municipal corporation limits, many industries are now monetizing their land assets by selling to commercial developers who want to construct malls and commercial complexes on erstwhile industrial land. The effluent, trade/domestic, to the tune of 200 CMD finds its way into the Sukhna river. Of this, only a very small percentage is completely treated waste.
The MIDC at Waluj has the maximum concentration of industries in Aurangabad District. Of these, many are newly developing industries. The number of industries is 105 and the effluent generated is about 10.72 MLD. Large and medium scale industries have provided primary / secondary effluent treatment plants and most of them have septic tanks or sewage treatment plants for domestic waste water. The run-offs/ seepages/percolates enter the river Kham. This river ultimately confluences with the Godavari upstream of Jaikwadi dam. A CETP is completed and is awaiting commissioning at Waluj. This CETP had proposed to discharge into the river Kham . Permission for discharge of effluent has not been granted by the authorities and alternative arrangements like HRTS and application over land for gardening/ irrigation is envisaged. Monitoring upstream and at various locations downstream of Kham river needs to be carried out on a priority basis as this industrial area generates maximum quantity of pollution load. Most of the units are bulk drugs and electroplating industries that generate carcinogenic wastes. Monitoring of these carcinogens present in waste water generated by these industries must be prioritized and emphasis given to follow up of relevant indices.
The Railway station MIDC shows a significant growth of new commercial complexes and other types of infrastructural development as is bound to take place following the dying out of sick units and defunct industries. The major effluent generated here is of domestic nature. A proper collection and sewage treatment plant is of utmost importance. Monitoring of water quality at Patoda village needs to be carried out.
The total sewage generated in Aurangabad city is 107 MLD of which Aurangabad Municipal Corporation is treating only 6.5 MLD of sewage. The remainder is disposed without treatment into local nullahs, which eventually lead to the major water bodies. Small colonies/villages adjacent to the corporation and industrial areas significantly add to the pollution load and monitoring of the nullahs need to be given preference.
Environmental status and action plan for prevention and control of pollution at Aurangabad
Maharashtra Pollution Control Board. 14
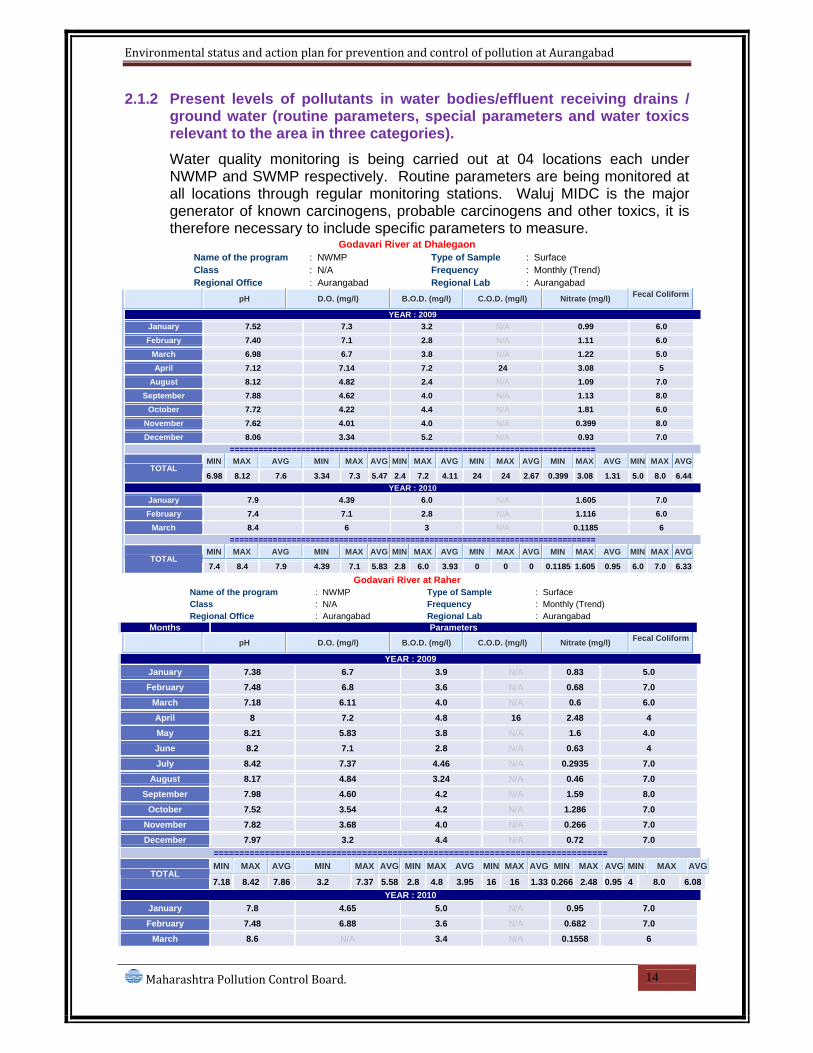
2.1.2 Present levels of pollutants in water bodies/effluent receiving drains / ground water (routine parameters, special parameters and water toxics relevant to the area in three categories).
Water quality monitoring is being carried out at 04 locations each under NWMP and SWMP respectively. Routine parameters are being monitored at all locations through regular monitoring stations. Waluj MIDC is the major generator of known carcinogens, probable carcinogens and other toxics, it is therefore necessary to include specific parameters to measure.
Godavari River at Dhalegaon Name of the program : NWMP Type of Sample : Surface Class : N/A Frequency : Monthly (Trend) Regional Office : Aurangabad Regional Lab : Aurangabad
pH D.O. (mg/l) B.O.D. (mg/l) C.O.D. (mg/l) Nitrate (mg/l) Fecal Coliform
YEAR : 2009 January 7.52 7.3 3.2 N/A 0.99 6.0 February 7.40 7.1 2.8 N/A 1.11 6.0
March 6.98 6.7 3.8 N/A 1.22 5.0 April 7.12 7.14 7.2 24 3.08 5
August 8.12 4.82 2.4 N/A 1.09 7.0 September 7.88 4.62 4.0 N/A 1.13 8.0
October 7.72 4.22 4.4 N/A 1.81 6.0 November 7.62 4.01 4.0 N/A 0.399 8.0 December 8.06 3.34 5.2 N/A 0.93 7.0
============================================================================= MIN MAX AVG MIN MAX AVG MIN MAX AVG MIN MAX AVG MIN MAX AVG MIN MAX AVG
TOTAL 6.98 8.12 7.6 3.34 7.3 5.47 2.4 7.2 4.11 24 24 2.67 0.399 3.08 1.31 5.0 8.0 6.44
YEAR : 2010 January 7.9 4.39 6.0 N/A 1.605 7.0 February 7.4 7.1 2.8 N/A 1.116 6.0
March 8.4 6 3 N/A 0.1185 6 =============================================================================
MIN MAX AVG MIN MAX AVG MIN MAX AVG MIN MAX AVG MIN MAX AVG MIN MAX AVG TOTAL
7.4 8.4 7.9 4.39 7.1 5.83 2.8 6.0 3.93 0 0 0 0.1185 1.605 0.95 6.0 7.0 6.33 Godavari River at Raher
Name of the program : NWMP Type of Sample : Surface Class : N/A Frequency : Monthly (Trend) Regional Office : Aurangabad Regional Lab : Aurangabad
Months Parameters pH D.O. (mg/l) B.O.D. (mg/l) C.O.D. (mg/l) Nitrate (mg/l) Fecal Coliform
YEAR : 2009
January 7.38 6.7 3.9 N/A 0.83 5.0
February 7.48 6.8 3.6 N/A 0.68 7.0
March 7.18 6.11 4.0 N/A 0.6 6.0
April 8 7.2 4.8 16 2.48 4
May 8.21 5.83 3.8 N/A 1.6 4.0
June 8.2 7.1 2.8 N/A 0.63 4
July 8.42 7.37 4.46 N/A 0.2935 7.0
August 8.17 4.84 3.24 N/A 0.46 7.0
September 7.98 4.60 4.2 N/A 1.59 8.0
October 7.52 3.54 4.2 N/A 1.286 7.0
November 7.82 3.68 4.0 N/A 0.266 7.0
December 7.97 3.2 4.4 N/A 0.72 7.0 ============================================================================= MIN MAX AVG MIN MAX AVG MIN MAX AVG MIN MAX AVG MIN MAX AVG MIN MAX AVG
TOTAL 7.18 8.42 7.86 3.2 7.37 5.58 2.8 4.8 3.95 16 16 1.33 0.266 2.48 0.95 4 8.0 6.08
YEAR : 2010 January 7.8 4.65 5.0 N/A 0.95 7.0
February 7.48 6.88 3.6 N/A 0.682 7.0
March 8.6 N/A 3.4 N/A 0.1558 6

Environmental status and action plan for prevention and control of pollution at Aurangabad
Maharashtra Pollution Control Board. 15
Godavari river at Jaikwadi Dam, Paithan. Name of the program : NWMP Type of Sample : Surface Class : N/A Frequency : Monthly (Baseline) Regional Office : Aurangabad Regional Lab : Aurangabad
Months Parameters
pH Dissolved Oxygen (mg/l)
B.O.D. (mg/l)
C.O.D. (mg/l)
Nitrate (mg/l)
Fecal Coliform (MPN/100 ml)
YEAR : 2009 January 7.48 7.1 3.4 N/A 1.3 4.0
February 7.32 6.92 3.2 N/A 1.3 6.0
March 7.26 7.0 3.4 N/A 1.0 5.0
April 7.71 7.2 4.8 16 1.53 5
May 7.47 7.08 4.8 N/A 0.824 4.0
June 7.62 6.65 3.8 N/A 0.54 5
July 8.27 6.31 2.0 N/A N/A 8.0
August 7.86 4.4 2.4 N/A 0.6 6.0
September 7.82 4.22 5..0 N/A 0.76 9.0
October 7.82 4.27 4.0 N/A 0.095 8.0
November 7.94 3.92 4.2 N/A 0.25 7.0
December 7.64 3.44 5.4 N/A 1.175 6.0 =============================================================================
MIN MAX AVG MIN MAX AVG MIN MAX AVG MIN MAX AVG MIN MAX AVG MIN MAX AVG TOTAL
7.26 8.27 7.68 3.44 7.2 5.71 2.0 5.4 3.87 16 16 1.33 0 1.53 0.78 4.0 9.0 6.08 YEAR : 2010
January 7.8 4.4 5.4 N/A 0.3644 4.0
February 7.32 6.92 3.2 N/A 1.364 6.0
March 8.2 N/A 3 N/A 0.0502 6
May 8.5 5.9 2.6 N/A 0.1483 N/A
June N/A N/A 2.8 N/A 0.1808 4 =============================================================================
MIN MAX AVG MIN MAX AVG MIN MAX AVG MIN MAX AVG MIN MAX AVG MIN MAX AVG TOTAL
7.32 8.5 7.96 4.4 6.92 4.31 2.6 5.4 4.25 0 0 0 0.0502 1.364 0.53 4.0 6.0 5
2.1.3 Predominant sources contributing to various pollutants
The effluent generated by the four MIDCs in Aurangabad district is about 13.42 MLD and it comprises mainly of trade effluent and domestic waste from industrial clusters. The other major source of pollutants is the unorganized sector, like auto service stations, hotel industry and very small illegal units in residential areas. The main source of carcinogenic pollutants, probable carcinogen and other toxins are bulk drugs and electroplating industries.
2.2 Sources of water pollution
2.2.1 Industrial There are 133 trade effluent generating industries in 4 major clusters in Aurangabad district and the total effluent generated is to the tune of 13.42 MLD. The break up is as below: Cluster name No. effluent gene-
rating industries Quantity of effluent in MLD
Shendra MIDC 05 0.7 Chikhalthana MIDC 21 2.0 Waluj MIDC 105 10.72 Rly.Stn. MIDC 02 negligible Total 133 13.42

Environmental status and action plan for prevention and control of pollution at Aurangabad
Maharashtra Pollution Control Board. 16
The major source of high BOD and COD generating units are bulk drugs, breweries, distilleries and some types of chemical industries. The major source of carcinogens, probable carcinogens and other toxins are bulk drugs and electroplating industries.
2.2.2 Domestic Of the 107 MLD of domestic waste generated by Aurangabad Municipal Corporation, only 6.5 MLD of sewage is treated and the remainder is disposed without treatment into adjacent water bodies. Further, residential areas/villages along the periphery of the industrial area and Corporation area also contribute substantially to the pollution load. Indiscriminate discharge/ application of treated/ partially treated sewage water to land for gardening or irrigation poses the risk of contaminating major water bodies.
2.2.3 Others (Agricultural runoff, leachate from MSW dump, illegal dump site
etc.)
With overuse of fertilizers and pesticides being a significant issue, percolates/ seepages/runoffs cause pollution hazards in areas adjoining all 4 MIDCs. The Aurangabad Municipal Corporation does not have a scientific, secured solid waste dump and wastes are illegally dumped at various locations, The runoffs, leachates and percolates from these site pose a real and urgent threat. A site for disposal of MSW is identified at village Oalshi Pokhari, S.No. 5 & 6, Tal. and dist. Aurangabad.
2.2.4 Impact on surrounding area (outside the CEPI Area) on the water courses/drainage system of the area under consideration
The cumulative effect of pollutants on the major drinking water sources is felt by the people using the river water further downstream as they are completely dependent on the this water for domestic as well as agricultural use. The major part of untreated domestic waste of Aurangabad city is discharged through Kham river into Reservoir of Paithan Dam on Godavari river. The water from this reservoir is pumped for industrial as well as domestic purpose for Aurangabad city.
2.3 Details of Water Polluting Industries in the area/cluster
In the Shendra MIDC area, there are 10 water polluting industries. Total quantity of industrial effluent generated from Shendra MIDC area is 0.8 MLD and total domestic effluent generated is 0.1 MLD. In the Chikalthana MIDC area, there are 21 water polluting industries. Total quantity of

Environmental status and action plan for prevention and control of pollution at Aurangabad
Maharashtra Pollution Control Board. 17
industrial effluent generated from Chikalthana MIDC area is 1.5 MLD and total domestic effluent generated is 0.5 MLD. All the effluent generating industries have provided ETPs.
In Waluj MIDC area, there are 105 units which are water polluting. Out of 105 industries 45 industries generate industrial effluent more than 10 CMD. Total quantity of industrial effluent generated from Waluj MIDC area is 10.72 MLD and total domestic effluent generated is 3.928 MLD. The total BOD load in the area is 8.69 kg/d. Major industrial effluent generated is from M/s. Bajaj Auto Ltd. is to the tune of 2680 CMD. All the large and medium scale industries generating industrial effluent have provided ETPs. A few of the industries have also provided Chrome recovery plants.
There is possibility of leakages, seepages, spillages from very old ETPs. To overcome such problems revamping of such ETPs shall be essential. Another major cause of ground water pollution is unscientific disposal of treated effluent on land. The advanced method should be adopted by the Bulk Drug units for solvent recovery from high concentrated stream.
Also most of the small scale cottage type water polluting industries are unable to provide full-fledged treatment due to lack of finance, thereby causing ground water pollution by discharging substandard effluent on land. To overcome this problem CETP is necessary. The Waluj CETP is presently ready for commissioning.
2.4 Effluent Disposal Method- Recipient water bodies etc.
Discharge of treated trade effluent is not permitted into the water bodies. All the industries are directed to apply treated trade effluent with specific standards to land for agriculture/ gardening purpose. Stringent standards of 30 BOD for the treated effluent applied for gardening is imposed in the consent granted by the Board. After commissioning of the CETP, no individual industry will be permitted to discharge effluent over land.
2.5 Quantification of wastewater pollution load and relative contribution by
different sources viz. industrial/domestic
The major source of wastewater pollution is untreated sewage disposed from Aurangabad municipal corporation area and adjacent pockets of habitation. 107 MLD of sewage is generated and only 6.5 MLD is treated. The industrial pollution generated from the industrial sector is as follows.
Cluster name No. effluent generating industries
Quantity of effluent in MLD
Shendra MIDC 05 0.7 Chikhalthana MIDC 21 2.0 Waluj MIDC 105 10.72 Rly.Stn. MIDC 02 Aurangabad City - 107 Total 133 120.72

Environmental status and action plan for prevention and control of pollution at Aurangabad
Maharashtra Pollution Control Board. 18
2.6 Action Plan for compliance and control of pollution
2.6.1 Existing infrastructure facilities – water quality monitoring network, ETPs, CETP, Sewage Treatment Plant of industry (STPs), surface drainage system, effluent conveyance channels/outfalls, etc.
The MIDC Area, Waluj is established in the year 1982-83 and located on Aurangabad-Pune State Highway at a distance of about 20 km. from Aurangabad City. The total area of MIDC is about 1520 Hectares. There are about 1400 No’s of industries which cover all small, medium and large scale industries. Most of the large and medium scale units are polluting in nature and the major water consumers as well as major effluent generating units. In MIDC, mainly engineering (electroplating and surface treatment), chemical and bulk drugs, breweries, pharmaceuticals, etc. are also established. The total quantity of effluent generation from units located in MIDC Waluj Area is 10.0 MLD which includes 7.0 MLD industrial and 3 MLD domestic effluents.
Large and medium scale industries are having own treatment facility consists of primary, secondary and tertiary treatment. Most of these industries have adequate land for the disposal of their treated effluent, but the disposal of treated effluent is not in a scientific manner in many cases. Small scale industries have provided primary treatment facility and are inadequate to treat the effluent to prescribed standards. The substandard effluent generated from such industries is being disposed in the environment.
A common effluent treatment plant is established to overcome this scenario in Waluj MIDC. The plant is ready for commissioning. Work of collection pipelines from all the industries for collection of effluent from individual industry is in progress.
Details of CETP:
Plan Capacity : 10 MLD Total Plot Area : 133650 Sq. M Total built up area : 7767.81 Sq. M Project Cost : Rs. 1700 Lacs Treatment Scheme : Primary Secondary and followed by
Tertiary treatment Total No of CETP Members : 399
Unit Operation of CETP:
Collection Tank Oil & Grease Trap Neutralization Tank Primary Clarifier Aeration Tank (Diffused) Secondary Clarifier
Filter Press Polishing Tank Activated Carbon & Sand Filter Treated Effluent Collection Tank

Environmental status and action plan for prevention and control of pollution at Aurangabad
Maharashtra Pollution Control Board. 19
Equalization Tank (Capacity 3847 CU.M.)
Primary Clarifier (Capacity 9360 CMD)
P.S.F. and A.C.F.

Environmental status and action plan for prevention and control of pollution at Aurangabad
Maharashtra Pollution Control Board. 20
Disposal: Approximately 3 Km pipeline is to be installed for the disposal of treated effluent into the Kham River. The order has been placed by MIDC Aurangabad. MIDC has appointed NEERI for carrying out detailed study of Kham River & give suggestion to locate the exact disposal point. Recently State Government environment clearance committee has refused the permission for disposal of the treated effluent from the CETP into Kham river. They have directed to use the treated effluent for gardening and irrigation purpose
CETP
MID C , W al u j
A’bad –Pune N.H.
Godavari
Inta k e Well of MID C
Ja ik w adi D am
3 km
30 Km
Kham R iver
N
Schematic proposed diagram of disposal point & pipeline for CETP, Waluj
Present Status of CETP:
The construction of CETP (10 MLD) is awaiting environmental clearance from State Govt. and is ready for commissioning
2.6.2 Pollution control measures installed by Industries
All the large scale and medium scale industries have provided primary and secondary treatment facility for treatment of the trade effluent generated. Board has persuaded large industries to adopt cleaner technologies. Following are the industries who have adopted cleaner technologies:
Chrome recovery plant has been installed and operated by M/s. Metalman Industries. Metal recover plant has been provided by M/s. Endurance group of Companies and M/s. Durvoalve industry.
RO system is being installed and operated by M/s. Orchid Chemicals, and M/s. Radico distillery. Multi effect evaporators are being used by M/s. Radico distillery and M/s. Pranav Agrotech distillery. Raamri, M/s Skol brewery and M/s. Foster (I) Ltd. have also provided RO system and are generating bio-gas from there UASB plant. M/s. Canpac industries have provided central fume extraction system and these fumes are treated by thermal oxidation system.

Environmental status and action plan for prevention and control of pollution at Aurangabad
Maharashtra Pollution Control Board. 21
2.6.3 Technological Intervention 2.6.3.1 Inventorisation of prominent industries with technological gaps
Bulk drug industries 19 numbers are mainly responsible for emissions and discharge of carcinogenic compounds in the form of VOC’s are identified. Further emissions from breweries are also identified for emissions of VOC’s. Electroplating industries are also major source of heavy metal pollution in the area.
2.6.3.2 Identification of low cost and advanced cleaner technology for pollution control
Using de-mineralized water (DM water) for electroplating industries and solvent recovery system from effluent is recommended to these industries by the Board, to reduce water pollution. Board has already stipulated conditions of metal bearing waste segregation for small electroplating industries and in case of more than 10 m3/d effluent generating electroplating industries condition of metal recovery has been stipulated.
The solvent recovery potential of bulk drug industries will be assessed and they will be asked to improve the solvent recovery process as a short term measure.
2.6.4 Infrastructure Renewal
2.6.4.1 Details of existing infrastructural facilities
In Waluj MIDC the work of laying collection pipeline for collection of treated effluent from individual industries is in progress. About 35 Km. of pipeline has been laid in phase 1 of MIDC. The work of laying of pipeline is more than 90% complete in Phase 2. Chikalthana and Railway Stn. MIDC’s do not have proper effluent collection and disposal system.
Six water quality monitoring stations are fixed under NWMP and SWMP. The Aurangabad office has a full-fledged laboratory for analysis of water samples collected. Large industries have provided laboratories for self analysis of their samples.
2.6.4.2 Need of up gradation of existing facilities
Of the 107 MLD of trade effluent generated in Aurangabad city, only 6.5 MLD is treated and the rest is discharged without treatment into adjacent water sources. There is a need to lay underground sewerage lines and provision of STP at the earliest. An additional 5 stations for water quality monitoring need to be set up at following locations near confluence points of sewerage and industrial waste stream.
Environmental status and action plan for prevention and control of pollution at Aurangabad
Maharashtra Pollution Control Board. 22
Since Railway station MIDC and the one at Chikhalthana are dying out, the effluents generated there should be transported through tankers to Waluj CETP for treatment.
Shendra MIDC is rapidly growing and therefore a CETP with consideration for further expansion should be set up along with a collection pipeline network.
High route transmission system for disposal of treated effluent needs to be set up in Waluj MIDC.
2.6.4.3 De-silting of water tanks, drains, rivulets, etc.
Desilting of Sukna and Kham rivers can be carried out after the sewage treatment plants are in place and operational.
2.6.4.4 Construction of lined drains/connections
Old sewerage system of corporation to be replaced and to provide sewerage system for collection of entire sewage generated from the area.
2.6.4.5 Treatment and management of contaminated surface water bodies
Sewage treatment plant needs to be provided near Kham river for treatment of sewage effluent. The treated water may be used for industrial purpose. This will drastically reduce the pollution load into Kham river.
2.6.4.6 Rejuvenation/Management Plan for important eco-geological
features.
Presently no plan for rejuvenation, management plan for eco-geological features is envisaged.
2.6.4.7 Carrying of effluent from industrial units located in non-industrial
locations to CETP facilities by lined drains/pipelines only and prevention of their disposal into city sewage/surface drains
Work of laying pipelines for collection of effluent in Waluj MIDC is almost complete in Waluj MIDC. After the commissioning of CETP the effluent generated from Chikalthana MIDC and Railway station MIDC needs to be transported by tankers to this CETP as there is no new industrial development in these regions.
2.6.4.8 Installation of Gen sets at CETPs
A diesel generator set of 250 KVA capacity has been installed at the Common Effluent Treatment Plant at Waluj MIDC with a capacity that is sufficient to operate the entire plant in event of failure of regular power supply.

Environmental status and action plan for prevention and control of pollution at Aurangabad
Maharashtra Pollution Control Board. 23
2.6.5 Managerial and Financial aspects.
2.6.5.1 Cost and time estimates
Short Term and Long Term Action Plan & Cost Estimates.
Sr. No
Description of Action Point Implementing Agency
Cost in Lac Rs.
Proposed Time Frame
Water Pollution measures on available information
1 Completion of conveyance system for carrying the effluent from individual industry to CETP in MIDC Area Waluj Phase-I
MIDC - Phase-I is Completed
2 Completion of conveyance system for carrying the effluent from individual industry to CETP in MIDC Area Waluj Phase-II
MIDC 1100 Work under progress will complete by Dec 2011
3 Completion of conveyance system for carrying the effluent from individual industry to CETP in MIDC Area Shendra.
MIDC 1000 The deadline of Dec 2011 is not possible.
4 Commissioning of the CETP in MIDC area Waluj
MIDC and CETP Operator
1700 Ready for trials
5 Construction of common effluent treatment plant in MIDC Shendra.
MIDC,Industries Govt.Assistance
1500 Proposed deadline of Dec 2011 not possible
6 Construction of separate CETP for electroplating industries in Waluj MIDC.
MIDC,Industries 1700 Arrangements for treatment of electroplating industries waste separately in the CETP is ready
7 Laying of disposal line from CETP to Kham River
MIDC 171 Discussion with SERC in progress
8 Revamping of old ETPs in prominent industries for stoppage of leakages and seepages in MIDC Chikalthana and Waluj wherever required.
Individual industry & MPCB
# Dec 2011.
9 Up gradation of effluent treatment plant which are not meeting prescribed standards.
Individual industry & MPCB
# March 2011
10 Solvent recovery in major bulk drug and chemical units located in MIDC area Waluj and Chikalthana
Individual industry & MPCB
# March 2011
11 Identification and separation of high concentrated streams in prominent industry of MIDC area Waluj and Chikalthana and treating them separately.
Individual industry
# Dec 2010
12 Scientific collection treatment and disposal of sewage generated from human habitation
Local Body 60000 March 2011
13 Scientific collection and treatment of sewage generated from MIDC Area Waluj and Chikalthana.
MIDC 150 Dec 2010
14 Scrapping of Percolation Tanks & artificial waterbodies in and around MIDC Area Waluj.
Irrigation Dept., MPCB & MIDC
150 Dec. 2011

Environmental status and action plan for prevention and control of pollution at Aurangabad
Maharashtra Pollution Control Board. 24
15 Treatment of Kham river water with the help of Bio-remediation technology which is flowing through Aurangabad city.
Local body 500 Dec. 2011
16 Treatment of Sukana river water with the help of Bio-remediation technology which is flowing through Aurangabad city.
Local body 500 Dec. 2011
17 Proper collection of Strom water in MIDC area Waluj and Chikalthana.
MIDC 100 Dec. 2011
18 Installation of treatment facility for waste waters generated from major hotels, laundries, vehicle service center, commercial complex, major residential project, major marriage halls etc.
MPCB, Local body & Concerned Establishment
# Dec. 2011
# To be borne by individual industries / commercial centres. 2.6.5.2 Identified Private/Public sector potential investors & their
contribution/obligation
Provision of tertiary treatment for industrial waste water at MIDC Waluj and provision of STP near Kham river for sale of treated water to the industries is envisaged as a project through Private Public Participation.
2.6.5.3 Government Budgetary support requirement
Budgetary support will be required from the government for following ventures like providing sewage treatment plants, sewage collection network. The treated water could be reused and the whole project may be considered under PPP.
2.6.5.4 Hierachical and structured managerial system for efficient
implementation
Vision 2020 is being formulated for Aurangabad city. Major concerns like sewage collection and treatment facility , municipal waste collection and treatment facility will be stressed upon. MPC Board along with the industrial associations and CETP association along with MIDC will work in co-ordination for efficient implementation of the action plan.
2.6.6 Self monitoring system in industries (ETPs etc.)
Large and medium scale industries do carry out analysis of the effluent on regular basis. Most of these industries have own labarotaries and qualified staff for the same. Online monitoring system to be provided at CETP Waluj for pH along with TOC analyser.
2.6.7 Data linkages to SPCB/CPCB (of monitoring devices)
Online monitoring system provided at CETP Waluj for pH and TOC It is planned to link it to MPCB and CPCB websites.
Environmental status and action plan for prevention and control of pollution at Aurangabad
Maharashtra Pollution Control Board. 25
3. AIR ENVIRONMENT
3.1 Present status of Air environment supported with minimum one year analytical data
3.1.1 Critical locations for air quality monitoring
Critical locations for air quality monitoring for special parameters and air toxics are identified at:
A. Common Effluent Treatment Plant at Waluj as densely populated Pandharpur village is adjacent.
B. Sector K of MIDC Waluj, as maximum number of bulk drug industries are situated in this area.
C. Ranjangaon village at the centre of Waluj MIDC which is thickly populated.
D. Wockhardt Ltd., plot no.L-1, Chkalthana MIDC, as it is near residential area.
E. Kranti chowk – Densely populated, heavy traffic junction and commercial center.
Air quality is regularly monitored at four stations in Aurangabad. One station at Bibi- Ka Maqbara is operated by archaeological department and the remaining three are funded under Natinal Ambeint Air Quality Monitoring Program. Air quality monitoring is being carried out from 1st Dec. 2005 at 3 stations of Aurangabad.
Site Location:
1) Bibi-ka-Maqbara: This is a historical monument. An office of Archaeological Survey of India is located just adjacent to Maqbara. All Government Vehicles and tourist vehicles in large number are parked near the site. The residential area surrounds the monitoring point.
2) CADA Office: This is a Government office surrounded by residential area.A heavy volume of all kind of vehicles are plying on this road. There is a big ground near by. On this ground various festive activities and exhibitions etc are continuously going on which add to fluctuations in pollution levels.
3) S.B COLLEGE: Residential office apartsment, Government office, schools,college etc surround the site.Z.P ground located opposite to this site is parking for city buses,besides other seasonal activities.
4) Collector office: As Archeological survey of India office at (Bibi-ka-Maqbara) has installed its own Air Quality Monitoring Station. Bibi-ka-Maqbara station has been shifted to the terrace of collector office w.e.f 18th Aug. 2008
Environmental status and action plan for prevention and control of pollution at Aurangabad
Maharashtra Pollution Control Board. 26
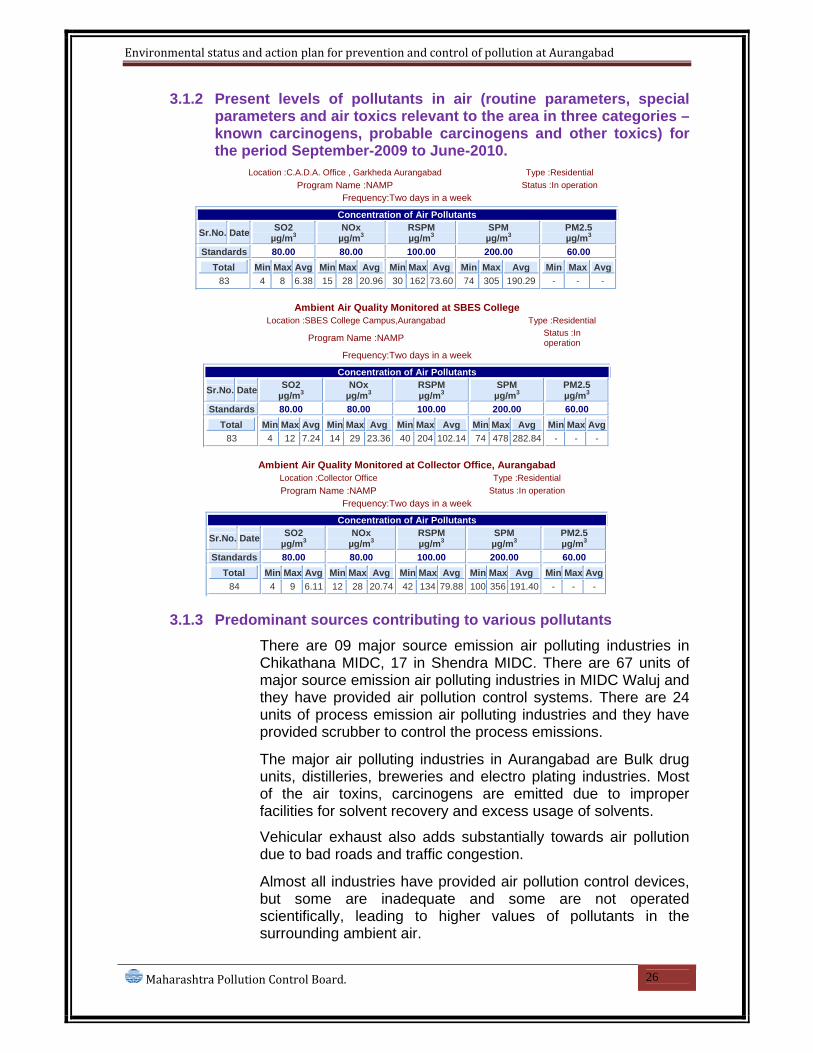
3.1.2 Present levels of pollutants in air (routine parameters, special parameters and air toxics relevant to the area in three categories – known carcinogens, probable carcinogens and other toxics) for the period September-2009 to June-2010.
Location :C.A.D.A. Office , Garkheda Aurangabad Type :Residential Program Name :NAMP Status :In operation
Frequency:Two days in a week
Concentration of Air Pollutants
Sr.No. Date SO2 µg/m3
NOx µg/m3
RSPM µg/m3
SPM µg/m3
PM2.5 µg/m3
Standards 80.00 80.00 100.00 200.00 60.00 Total
83
Min Max Avg 4 8 6.38
Min Max Avg15 28 20.96
Min Max Avg30 162 73.60
Min Max Avg 74 305 190.29
Min Max Avg - - -
Ambient Air Quality Monitored at SBES College
Location :SBES College Campus,Aurangabad Type :Residential
Program Name :NAMP Status :In operation
Frequency:Two days in a week
Concentration of Air Pollutants
Sr.No. Date SO2 µg/m3
NOx µg/m3
RSPM µg/m3
SPM µg/m3
PM2.5 µg/m3
Standards 80.00 80.00 100.00 200.00 60.00 Total
83
Min Max Avg 4 12 7.24
Min Max Avg14 29 23.36
Min Max Avg 40 204 102.14
Min Max Avg 74 478 282.84
Min Max Avg - - -
Ambient Air Quality Monitored at Collector Office, Aurangabad
Location :Collector Office Type :Residential Program Name :NAMP Status :In operation
Frequency:Two days in a week
Concentration of Air Pollutants
Sr.No. Date SO2 µg/m3
NOx µg/m3
RSPM µg/m3
SPM µg/m3
PM2.5 µg/m3
Standards 80.00 80.00 100.00 200.00 60.00 Total
84
Min Max Avg 4 9 6.11
Min Max Avg12 28 20.74
Min Max Avg42 134 79.88
Min Max Avg 100 356 191.40
Min Max Avg - - -
3.1.3 Predominant sources contributing to various pollutants
There are 09 major source emission air polluting industries in Chikathana MIDC, 17 in Shendra MIDC. There are 67 units of major source emission air polluting industries in MIDC Waluj and they have provided air pollution control systems. There are 24 units of process emission air polluting industries and they have provided scrubber to control the process emissions.
The major air polluting industries in Aurangabad are Bulk drug units, distilleries, breweries and electro plating industries. Most of the air toxins, carcinogens are emitted due to improper facilities for solvent recovery and excess usage of solvents.
Vehicular exhaust also adds substantially towards air pollution due to bad roads and traffic congestion.
Almost all industries have provided air pollution control devices, but some are inadequate and some are not operated scientifically, leading to higher values of pollutants in the surrounding ambient air.

Environmental status and action plan for prevention and control of pollution at Aurangabad
Maharashtra Pollution Control Board. 27
3.2 Source of Air Pollution viz industrial, domestic (Coal & Biomass burning), natural and Transport & Heavy Earth Movers
There are a total of 117 air polluting industries in Aurangabad industrial clusters.Most of the villages around Aurangabad use bio-mass and coal as fuel. Agricultural burning is also practiced around Aurangabad city and amounts to large emissions.
Transportation of crushed stones and sand in open trucks leads to high levels of SPM and RSPM.
3.3 Air Polluting Industries in the area/cluster
Air polluting industries in Aurangabad are as below: MIDC Shendra : 17 nos. MIDC Chikalthana : 09 nos. MIDC Waluj : 91 nos.
The major types of air polluting industries are bulk drugs – 19 nos., distilleries – 2, thermal power – 1, pesticide manufacturing – 2, zinc smelter – 1 and electroplating industries. Breweries also contribute substantial quantity of VOCs.
3.4 Impact of activities of nearby area on the CEPI Area
Industrial clusters like railway station MIDC and Chikalthana MIDC are located in the Aurangabad Municipal Corporation limits. These clusters are surrounded by densely populated habitation along with commercial centre, schools and hospitals. This adversely impacts a very high number of receptors in this area.
Waluj MIDC is located at a distance of 12 km. from the municipal limits. This MIDC has been developed around the village Ranjangaon. The residential population along the industrial belt is rapidly increasing. The villages adjacent to the industrial clusters are exposed to the brunt of the air pollution generated.
3.5 Quantification of the air pollution load and relative contribution by
different sources
Quantity in MT/D Sr. No.
Type of Fuel
She
ndra
Rly
. Stn
Chi
khal
th
ana
Wal
uj
Tota
l
SO2 emission
in T/D
1 Furnace oil 2.54 0 05 115 122.54 11.0286 2 Coal 4.0 1.5 15 130 150.50 1.505 3 HSD 1.2 0 02 20 23.20 0.464 4 Baggase 125 0 08 20 153.00 0.612 5 Propane 3.5 0 0 0 3.50

Environmental status and action plan for prevention and control of pollution at Aurangabad
Maharashtra Pollution Control Board. 28
3.6 Action Plan for compliance and control of pollution
3.6.1 Existing infrastructure facilities – Ambient air quality monitoring network
Air quality is monitored at 4 locations in Aurangabad on a regular basis. Three stations are being funded through National Ambient Air Quality Monitoring Program and one station is operated by the Archaeological Department. The parameters monitored at these stations are SO2, NOX, SPM and RSPM. Ambient air quality monitoring is also carried out randomly by the Board’s officers in the industrial clusters. Large and medium scale industries are directed to carry out ambient air quality monitoring and submit the report to the Board regularly. Stack monitoring of process stack and boiler stacks is regularly carried out by the Board. It is mandatory for the industries to monitor stack emissions and submit report to the Board.
Parameters such as VOCs, benzene, PAH, metals etc. are not monitored in ambient air quality.
3.6.2 Pollution control measures installed by the individual sources of
pollution The Board has laid down specific conditions to all industries like:
a. To provide specific height to their boilers on the basis of fuel consumption.
b. To provide dust collection system like dust collectors, cyclone dust collectors, bag house filters, electrostatic precipitators etc on a case to case basis.
c. To provide adequate scrubbing system for process emissions on case to case basis.
All the industries in the industrial clusters have provided stacks of adequate height as per the conditions laid down in the consent. Scrubbers for the process emissions have been provided by large and medium and some small scale industries.
Due to improper maintenance and operation of air pollution control systems, high concentration of pollutants is observed.
M/s. Canpac industry in Waluj MIDC has provided central fume extraction system. These fumes are then treated by thermal oxidation. Major industries like M/s. Orchid Chemicals and other large bulk drug industries have provided solvent recovery systems. This has lead to substantial reduction in the VOC emissions. The Board has made it mandatory for industries using coal / bagasse / biomass / briquettes as fuel to provide dust collectors and wet scrubbers to limit emissions.
Environmental status and action plan for prevention and control of pollution at Aurangabad
Maharashtra Pollution Control Board. 29
3.6.3 Technological Intervention
3.6.3.1 Inventorisation of prominent industries with technological gaps
Bulk drugs industries – 19 nos., pesticide industries – 2 nos., distilleries – 02 nos. and breweries are identified as prominent types of industries emitting VOCs and PAH. Most of these industries do not have proper air pollution control system to control emissions. A lot of fugitive emissions occur during improper storage and handling of the chemicals. Improper storage, handling and transportation of hazardous wastes generated by these industries is also a source of fugitive emissions.
Hazardous wastes generated by the industries are sent to Ranjangaon CHWTSDF which is more than 100 km. away from Aurangabad. This leads to delays in moving the wastes, which in turn results in more fugitive emissions.
3.6.3.2 Identification of low cost and advanced cleaner technology
for air pollution control
Providing dust collectors and water scrubbing system by the industries using coal / briquette/ bagasse / biomass as fuel.
Providing solvent recovery systems to reduce emissions of VOCs. Adopting cleaner technologies in breweries to limit emissions of VOCs.
3.6.3.3 Introduction and switch over to cleaner fuel
Provision of natural gas through pipelines is envisaged
3.6.4 Need of infrastructure Renovation
3.6.4.1 Development of roads
As Aurangabad is centrally located, several major highways pass through the city. Bypass arrangements for transit vehicles needs to be provided. Construction of flyovers and widening of roads needs to be carried out at major traffic junctions.
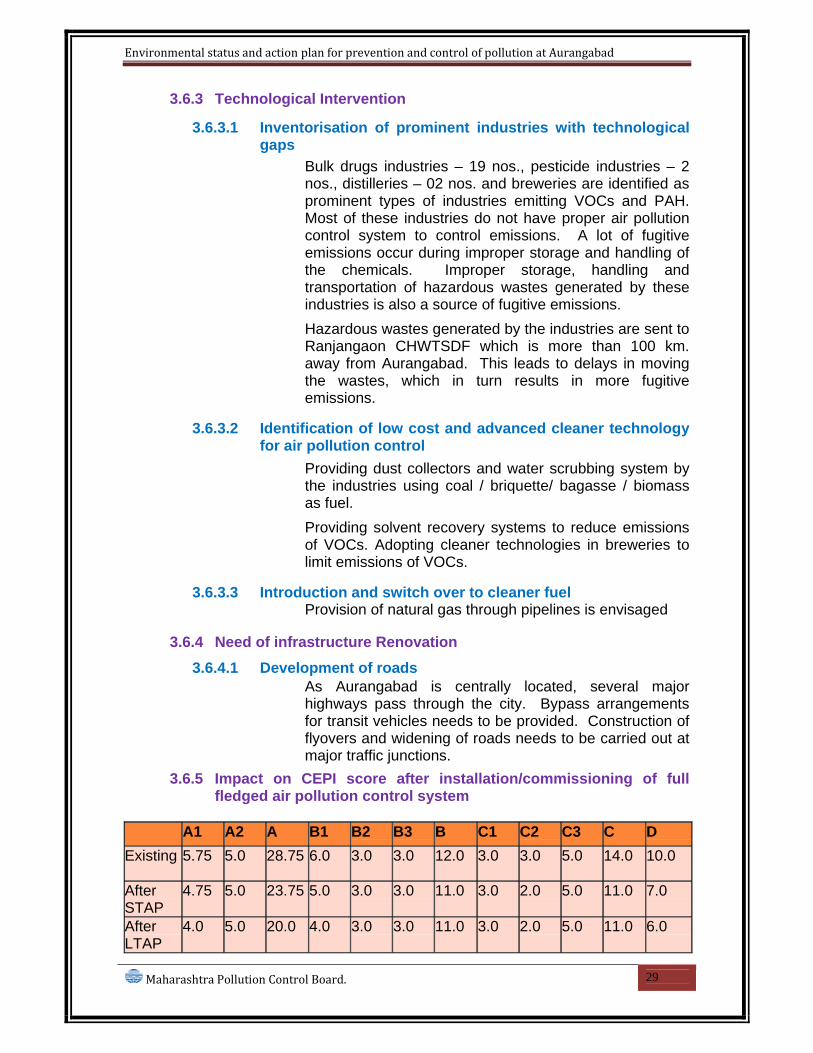
3.6.5 Impact on CEPI score after installation/commissioning of full fledged air pollution control system
A1 A2 A B1 B2 B3 B C1 C2 C3 C D Existing 5.75 5.0 28.75 6.0 3.0 3.0 12.0 3.0 3.0 5.0 14.0 10.0
After STAP
4.75 5.0 23.75 5.0 3.0 3.0 11.0 3.0 2.0 5.0 11.0 7.0
After LTAP
4.0 5.0 20.0 4.0 3.0 3.0 11.0 3.0 2.0 5.0 11.0 6.0

Environmental status and action plan for prevention and control of pollution at Aurangabad
Maharashtra Pollution Control Board. 30
3.6.6 Managerial and Financial aspects – Cost and time estimates
3.6.6.1 Cost and time estimates
Short Term and long term Action Plan & Cost Estimate
Sr. No.
Description of Action Point Implementing Agency
Cost Proposed Time Frame
1 Setting of Continuous 4 AAQM Stations in MIDC Waluj, Chikalthana and Aurangabad city.
MPCB, Industries and Govt.
March 2011
2 Up-gradation of existing air pollution control system provide to coal fired/Briquette fired/Bagasse fired burning equipments by wet scrubbers/ venture-scrubber/bag filters in the industries located in MIDC area Waluj and Chikalthana wherever required.
Individual Industry
# Dec 2010
3 Direction to the industry for improving the efficiency of air pollution control system and increase in vigilance.
MPCB -- Issued
4 Industries to provide solvent recovery system wherever applicable
MPCB # March 2011
5 Control of air pollution due to vehicle in the area by
Transport Dept.
# Dec. 2011
6 Stoppage of Biomass burning on open land in the area.
Local body -- Dec. 2011
7 Providing air pollution control measures during the activity of demolishing old building and new constructions
Local body # Dec. 2011
8 Traffic managements in the area Traffic Dept. and Corporation
-- Dec. 2011
9 Installation of continuous Stack monitoring facility by major air polluting industries.
Individual Industry
# Dec. 2011
10 Changing the fuel pattern of the industry to clean fuel.
Individual Industry
# Dec. 2011
11 Checking of adulteration of fuel District Adm.
-- Dec. 2011
12 Availability of clean fuel District Adm & Oil & Gas companies
-- Dec. 2011
13 Widening of the road and square for avoiding vehicle congestion.
Local body -- Dec. 2011
# To be borne by individual industry

Environmental status and action plan for prevention and control of pollution at Aurangabad
Maharashtra Pollution Control Board. 31
3.6.6.2 Identified private/Public sector potential investors & their contribution/obligation
Four industries have been identified for setting up continuous air monitoring stations.viz,
• M/s Orchid chemicals & Pharmaceutical Ltd. , • M/s Bajaj Auto Ltd, Waluj • M/s United Spirits, Chikalthana. • M/s Radico distillaries Ltd. Shendra
3.6.6.3 Government Budgetary support requirement
It is pre-condition in the environment clearance of one industry to set-up continuous air monitoring station. The cost of the other two continuous monitoring stations may be shared by Government.
3.6.6.4 Hierarchical and structured managerial system for efficient implementation
MPC Board, Road traffic department, along with industries and local body will follo-up for efficient implementation of the action plan.
3.6.7 Self monitoring system in industries (Stacks, APCDs)
It is mandatory for large and medium scale industries to monitor ambient air quality and stack monitoring on regular basis. The Board will follow-up actively to ensure compliance. Presently Bulk-drug industries have started monitoring VOC’s in ambient air.
3.6.8 Data linkages to SPCB/CPCB (of monitoring devices)
The continuous air quality monitoring stations that will be set up will be linked to the MPCB and CPCB websites.
Environmental status and action plan for prevention and control of pollution at Aurangabad
Maharashtra Pollution Control Board. 32
4. LAND ENVIRONMENT (Soil and Ground Water)
4.1 Soil Contamination
4.1.1 Present status of land environment supported with minimum one year analytical data
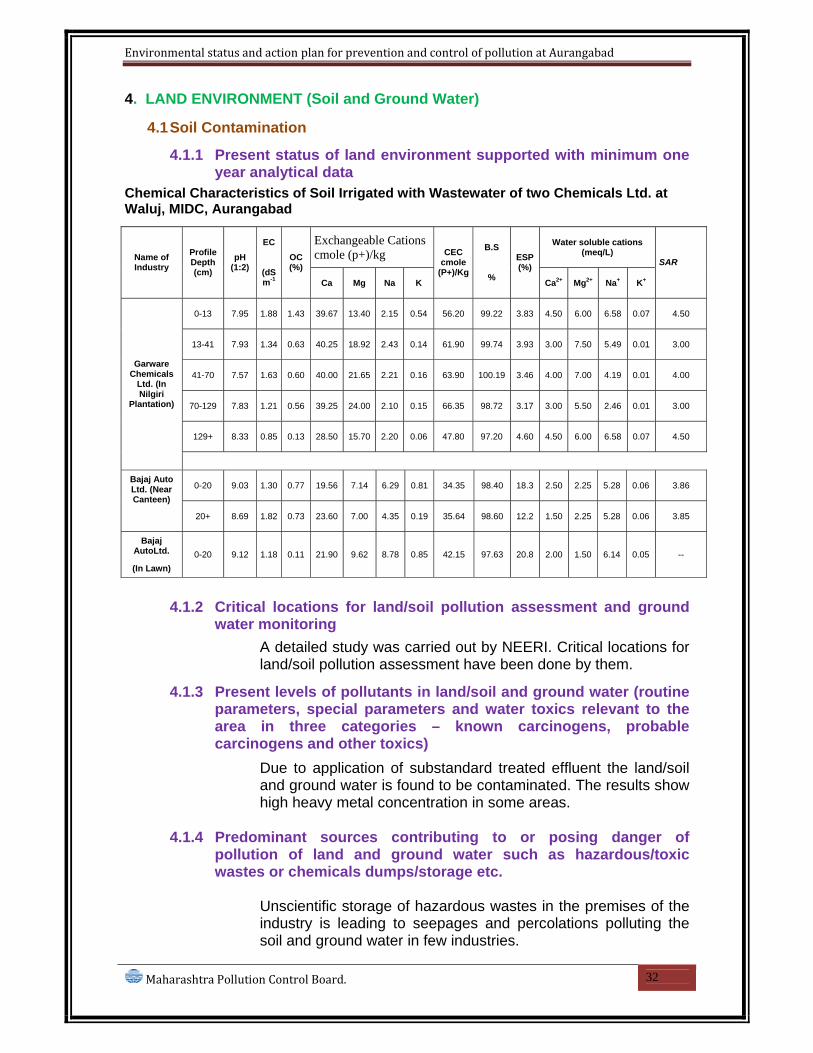
Chemical Characteristics of Soil Irrigated with Wastewater of two Chemicals Ltd. at Waluj, MIDC, Aurangabad
Exchangeable Cations cmole (p+)/kg
Water soluble cations (meq/L) Name of
Industry Profile Depth (cm)
pH (1:2)
EC
(dSm-1
OC (%)
Ca Mg Na K
CEC cmole
(P+)/Kg
B.S
%
ESP (%)
Ca2+ Mg2+ Na+ K+
SAR
0-13 7.95 1.88 1.43 39.67 13.40 2.15 0.54 56.20 99.22 3.83 4.50 6.00 6.58 0.07 4.50
13-41 7.93 1.34 0.63 40.25 18.92 2.43 0.14 61.90 99.74 3.93 3.00 7.50 5.49 0.01 3.00
41-70 7.57 1.63 0.60 40.00 21.65 2.21 0.16 63.90 100.19 3.46 4.00 7.00 4.19 0.01 4.00
70-129 7.83 1.21 0.56 39.25 24.00 2.10 0.15 66.35 98.72 3.17 3.00 5.50 2.46 0.01 3.00
129+ 8.33 0.85 0.13 28.50 15.70 2.20 0.06 47.80 97.20 4.60 4.50 6.00 6.58 0.07 4.50
Garware Chemicals
Ltd. (In Nilgiri
Plantation)
0-20 9.03 1.30 0.77 19.56 7.14 6.29 0.81 34.35 98.40 18.3 2.50 2.25 5.28 0.06 3.86 Bajaj Auto Ltd. (Near Canteen)
20+ 8.69 1.82 0.73 23.60 7.00 4.35 0.19 35.64 98.60 12.2 1.50 2.25 5.28 0.06 3.85
Bajaj AutoLtd.
(In Lawn) 0-20 9.12 1.18 0.11 21.90 9.62 8.78 0.85 42.15 97.63 20.8 2.00 1.50 6.14 0.05 --
4.1.2 Critical locations for land/soil pollution assessment and ground water monitoring
A detailed study was carried out by NEERI. Critical locations for land/soil pollution assessment have been done by them.
4.1.3 Present levels of pollutants in land/soil and ground water (routine parameters, special parameters and water toxics relevant to the area in three categories – known carcinogens, probable carcinogens and other toxics)
Due to application of substandard treated effluent the land/soil and ground water is found to be contaminated. The results show high heavy metal concentration in some areas.
4.1.4 Predominant sources contributing to or posing danger of
pollution of land and ground water such as hazardous/toxic wastes or chemicals dumps/storage etc.
Unscientific storage of hazardous wastes in the premises of the industry is leading to seepages and percolations polluting the soil and ground water in few industries.

Environmental status and action plan for prevention and control of pollution at Aurangabad
Maharashtra Pollution Control Board. 33
4.1.5 Sources of Soil Contamination
Major source of soil contamination is application of treated substandard effluent for gardening and irrigation purpose. Also unscientific disposal of municipal solid waste leading to seepages and percolation is also major source for soil contamination.
4.1.6 Types of existing pollution Major types of existing pollution
1.Agricultural soil pollution • Pollution of surface soil • Pollution of underground soil
2.Soil pollution by Industrial effluent & solid waste • Pollution of surface oil • Disturbances of soil profile
3.Pollution due to urban activities • Pollution of surface soil • Pollution of underground soil.
NEERI has observed that the soil mostly in the premises of electroplating industries is found to be contaminated with heavy metals.
4.1.7 Remedies for abatement, treatment and restoration of normal soil quality
At present, as observed during visits to different industrial sites, indiscriminate disposal of wastewater on land is practiced. This has lead in deterioration of soil quality, groundwater pollution, damage to crops in nearby area and health problems to the local people who uses the groundwater. Therefore, the following recommendations are made:
1. Site-specific land application of wastewater needs to be adopted. Soil characteristics determine the amount of wastewater to be applied to the land. Hence, it is recommended before applying the wastewater, soil characteristics must be known.
2. The modeling studies indicate that the application rate of wastewater should be less than the average vertical hydraulic conductivity of soil to avoid ground water contamination due to leaching.
3. For land application, the characteristics of the wastewater
determine the quality of wastewater and amount to be used on land. Each type of wastewater contains one or more constituents that limit its application. Treated wastewaters from industries like Innotech Pharma Ltd., Paschim Chemicals Pvt. Ltd., Ariane Orgachem Pvt. Ltd. and Endurance Systems Pvt. Ltd are not meeting the land disposal criteria with respect to EC, TDS, sodium, COD and BOD as prescribed by State and Central boards for pollution control. They must follow the regulations strictly.

Environmental status and action plan for prevention and control of pollution at Aurangabad
Maharashtra Pollution Control Board. 34
Therefore, it is recommended to establish a CETP with appropriate unit operations and process which can produce effluent suitable in all respects for land disposal.
4. Industries like Paschim Chemicals Pvt. Ltd. and Ariane Orgachem Pvt. Ltd., are disposing their treated wastewater in an unregulated manner on barren land without any plantation. To avoid further deterioration of soil and groundwater qualities, effective utilization of treated wastewater for plantation should be done at wastewater disposal sites after meeting the land disposal criteria.
5. Some of the industries are not meeting the criteria of wastewater disposal on land and also companies are disposing their effluent unscientifically and undiscriminately, the current land disposal practices should be stopped immediately. Hence, to avoid further contamination, CETP at Waluj MIDC, Aurangabad should be made operational at the earliest.
6. The soil's capacity to use, retain, or reduce the undesirable effects of wastewater varies significantly according to the physical, chemical, and biological properties of the soil and the characteristics of the wastewater. Thus, the development of a land treatment system must be tailored to the characteristics of the specific site and the specific wastewater. Industries like Garware Polyester Ltd., Wockhardt Biotech Park Ltd., Innotech Pharma Ltd., Paschim Chemical Pvt. Ltd., Ariane Orgachem Ltd., Fosters India Ltd., and Aurangabad Breweries Ltd. possess different types of soil and hence have different soil characteristics. Recommended hydraulic loading (quantity and schedule) of wastewater should be carefully implemented by these industries to avoid further deterioration of soils.
7. Based on lysimeter studies, it is recommended that the treated wastewater having BOD load of 30 and 60 mg/L can be disposed on land with suitable plantation at optimum hydraulic loading of 150 m3/ha/day during pre monsoon and 125 m3/ha/day during post monsoon respectively.
8. It is also recommended that the plant growth was the best among all treatments with the composite treated wastewater having BOD load of 30 mg/L. Hence, this is more suitable for land application.
9. Groundwater studies at Vittawa and Ranjangaon areas, which are in the vicinity of MIDC, Waluj and percolation tank showed that dug wells, bore wells and hand pumps in and around were severely polluted. The percolation tank (stagnant water reservoir) is nearer to the cluster of industries such as Lilason Industries Ltd., Innotech Pharma Ltd., Aurangabad Breweries Ltd., Paschim Chemicals Pvt. Ltd., Ariane Orgachem Pvt. Ltd. and Endurance system India Pvt. Ltd.. The wastewaters from these industries move to percolation
Environmental status and action plan for prevention and control of pollution at Aurangabad
Maharashtra Pollution Control Board. 35
tank through seepage and contaminate the water in percolation tank which acts as a groundwater recharge source. This might be the cause of groundwater pollution of nearby areas. To avoid further groundwater pollution, the percolation tank (stagnant water reservoir) should be filled.
10. Wastewater disposal sites of industries like, Garware Polyester Ltd.,
Wockhardt Biotech Park Ltd., Innotech Pharma Ltd., Paschim Chemical Pvt. Ltd., Ariane Orgachem Ltd., Fosters India Ltd., and Aurangabad Breweries Ltd. are severely polluted due to continuous wastewater application and are need to remediation/reclaimation.
11. The lysimeter investigations for assessing the feasibility of the
wastewater application on land need to be performed to assess the amount of wastewater to be applied at a specific site.
12. Land disposal sites should be monitored regularly to assess the soil and groundwater quality in the area.
13. Each of the alternatives discussed above can go wrong if a site-specific waste management and monitoring programme is not implemented. The results of monitoring must be reviewed periodically and the management plan may be modified, if necessary.
4.2 Ground water contamination
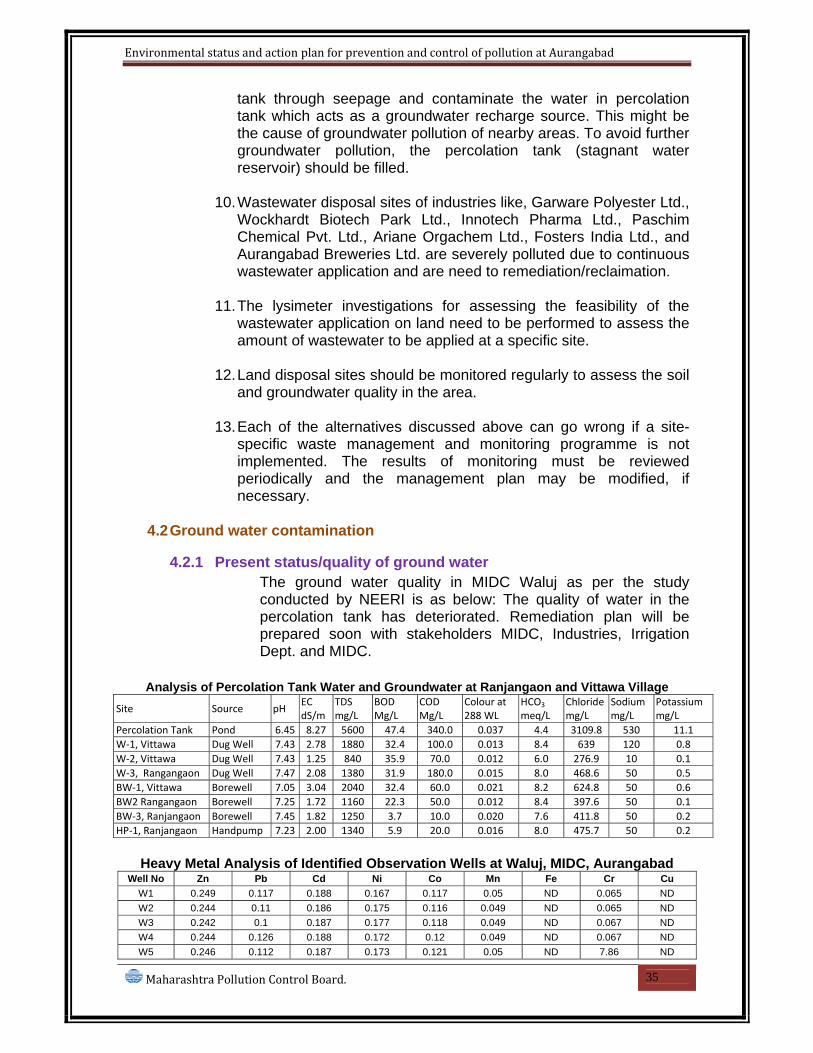
4.2.1 Present status/quality of ground water
The ground water quality in MIDC Waluj as per the study conducted by NEERI is as below: The quality of water in the percolation tank has deteriorated. Remediation plan will be prepared soon with stakeholders MIDC, Industries, Irrigation Dept. and MIDC.
Analysis of Percolation Tank Water and Groundwater at Ranjangaon and Vittawa Village Site Source pH
EC dS/m
TDS mg/L
BOD Mg/L
COD Mg/L
Colour at 288 WL
HCO3
meq/L Chloride mg/L
Sodium mg/L
Potassium mg/L
Percolation Tank Pond 6.45 8.27 5600 47.4 340.0 0.037 4.4 3109.8 530 11.1 W‐1, Vittawa Dug Well 7.43 2.78 1880 32.4 100.0 0.013 8.4 639 120 0.8 W‐2, Vittawa Dug Well 7.43 1.25 840 35.9 70.0 0.012 6.0 276.9 10 0.1 W‐3, Rangangaon Dug Well 7.47 2.08 1380 31.9 180.0 0.015 8.0 468.6 50 0.5 BW‐1, Vittawa Borewell 7.05 3.04 2040 32.4 60.0 0.021 8.2 624.8 50 0.6 BW2 Rangangaon Borewell 7.25 1.72 1160 22.3 50.0 0.012 8.4 397.6 50 0.1 BW‐3, Ranjangaon Borewell 7.45 1.82 1250 3.7 10.0 0.020 7.6 411.8 50 0.2 HP‐1, Ranjangaon Handpump 7.23 2.00 1340 5.9 20.0 0.016 8.0 475.7 50 0.2
Heavy Metal Analysis of Identified Observation Wells at Waluj, MIDC, Aurangabad
Well No Zn Pb Cd Ni Co Mn Fe Cr Cu W1 0.249 0.117 0.188 0.167 0.117 0.05 ND 0.065 ND W2 0.244 0.11 0.186 0.175 0.116 0.049 ND 0.065 ND W3 0.242 0.1 0.187 0.177 0.118 0.049 ND 0.067 ND W4 0.244 0.126 0.188 0.172 0.12 0.049 ND 0.067 ND W5 0.246 0.112 0.187 0.173 0.121 0.05 ND 7.86 ND

Environmental status and action plan for prevention and control of pollution at Aurangabad
Maharashtra Pollution Control Board. 36
W6 0.261 0.123 0.189 0.173 0.128 0.093 0.171 0.073 0.006 W7 0.247 0.115 0.190 0.178 0.121 0.05 ND 0.064 ND W8 0.257 0.139 0.189 0.195 0.133 0.148 ND 0.244 0.022 W9 0.244 0.112 0.188 0.204 0.127 0.05 ND 0.105 0.003
W10 0.237 0.1 0.189 0.176 0.125 0.05 ND 0.993 ND W11 0.243 0.125 0.188 0.181 0.124 0.05 ND 0.918 0.00 W12 0.26 0.143 0.188 0.19 0.126 0.057 0.033 2.16 0.003 W13 0.248 0.119 0.19 0.177 0.125 0.051 ND 0.076 0.001 W14 0.243 0.149 0.19 0.181 0.129 0.05 ND 0.075 0.007 W15 0.243 0.138 0.19 0.179 0.127 0.049 ND 0.077 0.003 W16 0.240 0.107 0.187 0.177 0.126 0.05 ND 0.078 0.002 W17 0.243 0.139 0.191 0.185 0.127 0.05 ND 0.075 0.006 W18 0.243 0.149 0.189 0.179 0.126 0.05 ND 0.077 ND W19 0.271 0.227 0.193 0.212 0.128 0.071 ND 0.078 0.005 W20 0.274 0.152 0.188 0.178 0.127 0061 0.197 0.076 0.009 W21 0.245 0.14 0.189 0.172 0.125 0.05 ND 0.073 0.00 W22 0.241 0.161 0.192 0.182 0.131 0.05 ND 0.075 0.005 W23 0.256 0.172 0.191 0.184 0.125 0.05 ND 0.075 0.004 W24 0.255 0.161 0.191 0.181 0.124 0.05 ND 0.075 0.00 W25 0.249 0.207 0.191 0.208 0.129 0.051 ND 0.077 ND W26 0.294 0.213 0.192 0.189 0.127 0.056 0.011 0.082 0.01 W27 0.248 0.177 0.193 0.191 0.129 0.06 ND 1.3 0.049 W28 0.287 0.238 0.193 0.185 0.133 0.168 0.323 0.102 0.008 W29 0.254 0.204 0.193 0.188 0.128 0.053 ND 0.099 0.003 W30 0.256 3.26 0.193 0.195 0.132 0.169 ND 0.08 0.013 W31 0.266 0.243 0.192 0.186 0.135 0.069 0.608 0.085 0.011 W32 0.243 0.146 0.189 0.179 0.13 0.05 ND 0.078 0.002
4.2.2 Source Identification (Existing sources of Ground water Pollution)
The sources identified by NEERI during the study for ground water pollution are as below:
Innotech Pharma Ltd., Paschim Chemicals Pvt. Ltd., Ariane Orgachem Pvt. Ltd. and Endurance Systems Pvt. Ltd are not meeting the land disposal criteria with respect to EC, TDS, sodium, COD and BOD as prescribed by State and Central boards for pollution control. Industries like Paschim Chemicals Pvt. Ltd. and Ariane Orgachem Pvt. Ltd., are disposing their treated wastewater in an unregulated manner on barren land without any plantation. The wells downstream of Endurance system India Pvt. Ltd. namely W5 and W27 also showed high concentration of Cr i.e. 7.86 mg L-1 and 1.30 mg L-1 respectively. The concentration of Cr. Zn and Ni in the treated wastewater of Aurangabad Electricals Pvt. Ltd. were 1.72, 69.0 and 99.65 mgL-1 respectively. The high concentration of Cr (2.16 mg L-
1) in W12 was observed which is in close proximity of Aurangabad Electricals Pvt. Ltd. The metals concentrations in the wells can be linked to the wastewater which is being disposed on land by these industries.

Environmental status and action plan for prevention and control of pollution at Aurangabad
Maharashtra Pollution Control Board. 37
4.2.3 Ground water quality monitoring program
Six locations for monitoring of ground water are identified and are depicted on Waluj MIDC map below:
Location of Representatives Industries, Sampling Wells, Villages and the Disposal
Sites at MIDC, Waluj, Aurangabad
4.2.4 Action Plan for control of pollution including cost/time aspects Short Term and long term Action Plan & Cost
Sr. No.
Description of Action Point Implementing Agency
Cost in Lac Rs.
Proposed Time Frame
1 Providing the scientific collection and isolated temporary storage facility for HW in the industries.
Individual Industry
# Completed
2 Restriction on disposal of treated effluent on land in MIDC area Waluj
MPCB -- After commissioning of CETP
3 Scientific collection segregation and storage of MSW in residential areas.
Local Body Dec 2011

Environmental status and action plan for prevention and control of pollution at Aurangabad
Maharashtra Pollution Control Board. 38
4 Restriction on use of thin plastic carry bags.
Local Body -- March 2011
5 Scientific collection, storage and disposal of BMW generated in the area.
Local Body & CBMWTSDF
3 Months
6 Providing full-fledged collection, treatment and disposal of non-hazardous solid waste generated from MIDC Area
MIDC 3 Years
7 Providing full-fledged collection, treatment and disposal of MSW generated from Human habitation
Local body 3 Years
8 Soil reclamation in & around MIDC area as per guideline of NEERI
MIDC & Individual Industry
3 Years
9 Availability of CHWTSDF at Aurangabad
MPCB 3 Years
4.2.5 Treatment and management of contaminated ground water bodies, etc.
Wastewater disposal sites of industries like, Garware Polyester Ltd., Wockhardt Biotech Park Ltd., Innotech Pharma Ltd., Paschim Chemical Pvt. Ltd., Ariane Orgachem Ltd., Fosters India Ltd., and Aurangabad Breweries Ltd. are severely polluted due to continuous wastewater application and there is need for remediation/reclamation
Groundwater studies at Vittawa and Ranjangaon areas, which are in the vicinity of MIDC, Waluj and percolation tank showed that dug wells, bore wells and hand pumps in and around were severely polluted. The percolation tank (stagnant water reservoir) is nearer to the cluster of industries such as Lilason Industries Ltd., Innotech Pharma Ltd., Aurangabad Breweries Ltd., Paschim Chemicals Pvt. Ltd., Ariane Orgachem Pvt. Ltd. and Endurance system India Pvt. Ltd. The wastewaters from these industries move to percolation tank through seepage and contaminate the water in percolation tank which acts as a groundwater recharge source. This might be the cause of groundwater pollution of nearby areas. To avoid further groundwater pollution, the percolation tank (stagnant water reservoir) should be filled. Industries will be directed to segregate high TDS streams and treat it separately.

Environmental status and action plan for prevention and control of pollution at Aurangabad
Maharashtra Pollution Control Board. 39
4.2.6 Impact on CEPI score after abatement of pollution
For Land Environment after short term action plan:
A1 A2 A B1 B2 B3 B C1 C2 C3 C D Existing 5.5 5.0 27.5 7.0 3.0 3.0 13.0 3.0 3.0 5.0 14.0 5.0 After STAP 4.5 5.0 22.5 6.0 3.0 3.0 12.0 3.0 2.0 5.0 11.0 4.0
Land index after short term Action plan will be 49.5 For Land Environment after long term action plan:
A1 A2 A B1 B2 B3 B C1 C2 C3 C D Existing 5.5 5.0 27.5 7.0 3.0 3.0 13.0 3.0 3.0 5.0 14.0 5.0 After LTAP 3.0 5.0 15.0 5.0 3.0 3.0 11.0 3.0 1.0 5.0 8.0 3.0
Land index after short term Action plan will be 37.0
4.3 Solid Waste Generation and Management
4.3.1 Waste Classification and Quantification
4.3.1.1 Hazardous waste Total no. of HW generating units - 242. Authorizations issued - 242. Quantity of HW generation - 571.5 MT/M HW disposed through CHWTSDF - 313.16 MT/M Units join to CHWTSDF - 169.
4.3.1.2 Bio-medical waste • Total bedded HCEs -549 and
• Non- bedded HCEs -355.
• Join to CBMWTSDF: Bedded-370 non-bedded -355
• HCEs having Own Facility - 65 ( Govt. Hospitals)
• Quantity of BMW generation:
Bedded - 1146.75 kg/day
Non-bedded - 130.00 kg/day
Total - 1276.75 kg/day
• Disposal through CBMWSDF:
Bedded - 1036.75 kg/d
Non-bedded - 130.00 kg/d
• Disposal through Own facility: 110.00 kg/d. • Total BMW treatment & disposal : 1276.75 kg/d.
There is one CBMWTSDF at A’bad M/s. Water Grace Products Ltd and is located outside Aurangabad city limit. This facility provider has specially designed packed body vehicles for collection and transportation, It comprises auto clave chamber capacity- 50 Kg/hr, Shredder- capacity- 75 Kg/hr and incinerator of 300 Kg/hr,& efficiency is 99.99%.

Environmental status and action plan for prevention and control of pollution at Aurangabad
Maharashtra Pollution Control Board. 40
4.3.1.3 Electronic waste
Quantification of electronic waste generated is not done for e-waste in Aurangabad.
4.3.1.4 Municipal Solid Waste/Domestic Waste/Sludges from ETPs/CETPs/STPs and other industrial sources
The total quantity of municipal solid waste generated in Aurangabad is to the tune of 320 MT/Day which is collected through private operator under the control of Aurangabad Municipal Corporation. The existing site located at Naregaon is within two Kilometers from Chikalthana airport, Honorable High Court has directed Corporation to close the existing site. Presently Aurangabad Municipal Corporation is not having proper municipal solid waste treatment and disposal facility. The alternate site for the dumping ground has already been identified at Village Palshi Pokhari, S. No. 5 & 6, Tal & Dist Aurangabad
Photograph of Solid Waste Dumping Site at Naregoan
4.3.1.5 Plastic waste
Board has carried out survey of plastic carry bag manufacturing units for effective implementation of Maharashtra Plastic Carry Bag (Manufacture & Usage) Rules, 2007. There is no plastic carry bag manufacturing units less than 50 microns thickness. Municipal Corporation, Aurangabad has set up a squad for regulating Maharashtra Plastic Carry Bag Rules. One field officer from SRO, Aurangabad – I region has been deputed as a squad member
4.3.1.6 Quantification of wastes and relative contribution from
different sources
The total generation of municipal solid waste in the region is 320 MT/day. The quantity of bio-medical waste generated is 1276.75 Kg/day. The quantity of plastic and e-waste is not quantified.

Environmental status and action plan for prevention and control of pollution at Aurangabad
Maharashtra Pollution Control Board. 41
4.3.2 Identification of waste minimization and waste exchange options
Solvent recovery from solvent using industries and metal recovery from electroplating industries is envisaged. Further proper segregation of municipal solid waste will assist in recycling of waste like paper, metal, plastic. Organic waste can be used for composting and can be used for manure.
4.3.3 Reduction /Reuse /Recovery / Recycle options in the co-processing of wastes
Proper segregation of municipal solid waste will assist in recycling of waste like paper, metal, plastic. Organic waste can be used for composting and can be used for manure.
4.3.4 Infrastructure facilities
There is no facility provided for treatment and proposal disposal od solid waste.
4.3.4.1 Existing TSDF/Incineration facilities including capacities
Not provided in Aurangabad district. Facility at Ranjangaon, Pune is used by the industries for Hazardous wastes disposal.
4.3.4.2 Present status/performance and need of up gradation of existing facilities including enhancement of capacities
Presently there is no proper facility for disposal of solid waste in Aurangabad district.
4.3.4.3 Treatment and management of contaminated waste
disposal sites, etc.
Present illegal disposal site of Naregaon will need treatment as it is contaminated due to disposal of solid waste in un-scientific manner.
4.3.4.4 Impact on CEPI score after proper management of Solid
Wastes
A1 A2 A B1 B2 B3 B C1 C2 C3 C D Existing 5.5 5.0 27.5 7.0 3.0 3.0 13.0 3.0 3.0 5.0 14.0 5.0 After STAP 4.5 5.0 22.5 6.0 3.0 3.0 12.0 3.0 2.0 5.0 11.0 4.0
Land index after short term Action plan will be 49.5
A1 A2 A B1 B2 B3 B C1 C2 C3 C D Existing 5.5 5.0 27.5 7.0 3.0 3.0 13.0 3.0 3.0 5.0 14.0 5.0 After LTAP 3.0 5.0 15.0 5.0 3.0 3.0 11.0 3.0 1.0 5.0 8.0 3.0
Land index after short term Action plan will be 37.0

Environmental status and action plan for prevention and control of pollution at Aurangabad
Maharashtra Pollution Control Board. 42
5. PPP Model
5.1 Identification of project proposals (for both the options i.e. technology intervention and infrastructure renewal) for implementation under the PPP model under the Action Plan.
Following projects are identified for technical intervention and infrastructure renewal for implementation of action plan: a. Setting up of sewage treatment plants in Aurangabad city with
emphasis on recycling / reuse of treated waste water. b. Setting up of composting facility for segregated municipal waste. c. Setting up of e-waste recycling plant for proper disposal of e-waste. d. Setting up of Common hazardous waste treatment disposal facility for
hazardous wastes.
5.2 Identification of stakeholders / agencies to be involved and to evolve financial and managerial mechanisms for implementation of PPP projects.
A joint venture of MoEF, CPCB, MPCB, MIDC and Aurangabad Municipal Corporation are identified as key agencies to be involved to evolve financial and managerial mechanisms for implementation of PPP projects. A task force committee for implementation of action plan with various Dept. along with Department of Environment is proposed.
6. Other infrastructural Renewal measures
6.1 Green Belts
Green belt development is proposed in Waluj MIDC around the villages shown in the diagram below to reduce the impact on inhabitants
Environmental status and action plan for prevention and control of pollution at Aurangabad
Maharashtra Pollution Control Board. 43
6.2 Development of Industrial Estate(s)
There is no proposal presently for development of industrial estates in Aurangabad.
6.3 Development of shifting of industries located in the non-industrial areas to the existing/new industrial estates.
Many of the sick industries from Chikalthana and Railway station MIDC have shifted their units to Waluj or Shendra MIDC’s.
7. Specific Schemes
7.1 GIS-GPS system for pollution sources monitoring.
GPS system is being implemented for vehicles carrying hazardous and bio-medical wastes.
7.2 Hydro-geological fracturing for water bodies rejuvenation.
No such proposal is yet made for Aurangabad district.
7.3 In-situ remediation of sewage.
Most of large industries and some commercial complexes have provided sewage treatment plant before disposal into municipal sewers / drains.
7.4 Utilization of MSW inert by gas based brick kilns.
No such proposal is yet made for Aurangabad district.
7.5 Co-processing of wastes in cement industries. No such proposal is yet made for Aurangabad district.
8. Public awareness and training Program
MPCB at head office level is carrying out regular awareness program through media like newspapers, television etc. The Regional office also conduct social program for mass awareness in Aurangabad region. Training is imparted to the Board’s staff as well as the industries representatives. Seminars with Doctors for proper implementation of BMW Rules have been conducted by MPCB. Training to Police personnel have impartedby MPCB for noise level monitoring.
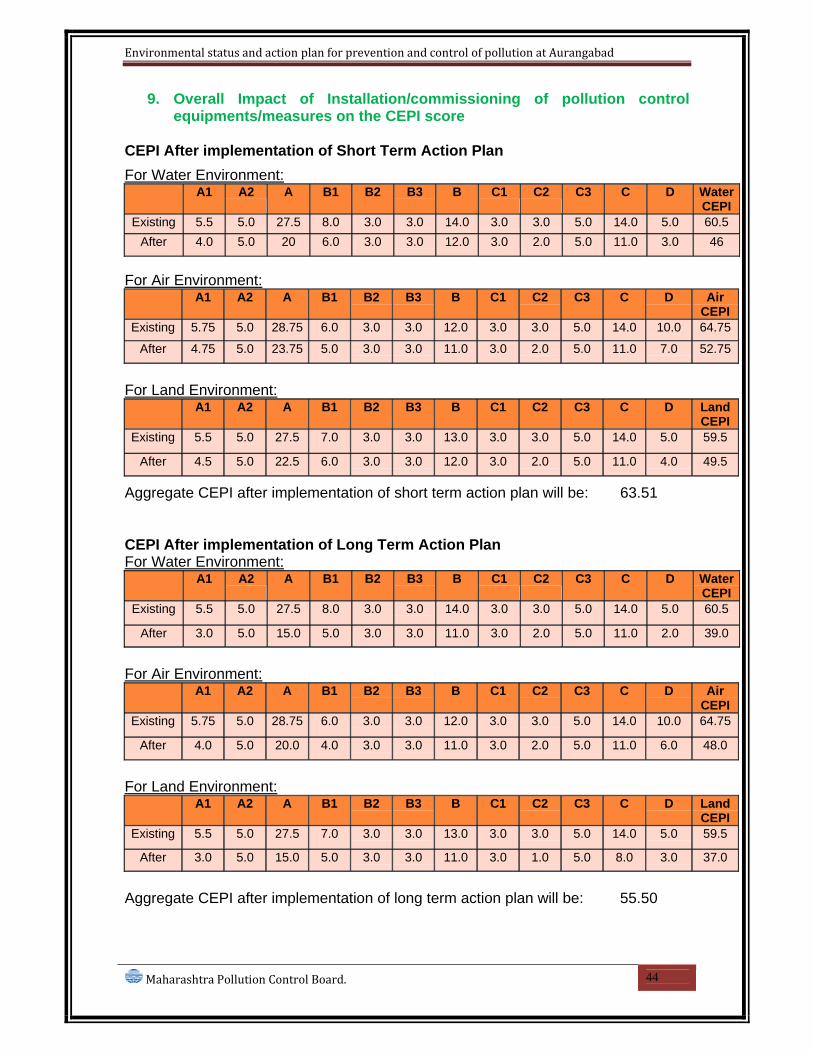
Environmental status and action plan for prevention and control of pollution at Aurangabad
Maharashtra Pollution Control Board. 44
9. Overall Impact of Installation/commissioning of pollution control equipments/measures on the CEPI score
CEPI After implementation of Short Term Action Plan
For Water Environment: A1 A2 A B1 B2 B3 B C1 C2 C3 C D Water
CEPI Existing 5.5 5.0 27.5 8.0 3.0 3.0 14.0 3.0 3.0 5.0 14.0 5.0 60.5
After 4.0 5.0 20 6.0 3.0 3.0 12.0 3.0 2.0 5.0 11.0 3.0 46
For Air Environment:
A1 A2 A B1 B2 B3 B C1 C2 C3 C D Air CEPI
Existing 5.75 5.0 28.75 6.0 3.0 3.0 12.0 3.0 3.0 5.0 14.0 10.0 64.75
After 4.75 5.0 23.75 5.0 3.0 3.0 11.0 3.0 2.0 5.0 11.0 7.0 52.75
For Land Environment:
A1 A2 A B1 B2 B3 B C1 C2 C3 C D Land CEPI
Existing 5.5 5.0 27.5 7.0 3.0 3.0 13.0 3.0 3.0 5.0 14.0 5.0 59.5
After 4.5 5.0 22.5 6.0 3.0 3.0 12.0 3.0 2.0 5.0 11.0 4.0 49.5
Aggregate CEPI after implementation of short term action plan will be: 63.51 CEPI After implementation of Long Term Action Plan For Water Environment:
A1 A2 A B1 B2 B3 B C1 C2 C3 C D WaterCEPI
Existing 5.5 5.0 27.5 8.0 3.0 3.0 14.0 3.0 3.0 5.0 14.0 5.0 60.5
After 3.0 5.0 15.0 5.0 3.0 3.0 11.0 3.0 2.0 5.0 11.0 2.0 39.0
For Air Environment:
A1 A2 A B1 B2 B3 B C1 C2 C3 C D Air CEPI
Existing 5.75 5.0 28.75 6.0 3.0 3.0 12.0 3.0 3.0 5.0 14.0 10.0 64.75
After 4.0 5.0 20.0 4.0 3.0 3.0 11.0 3.0 2.0 5.0 11.0 6.0 48.0
For Land Environment:
A1 A2 A B1 B2 B3 B C1 C2 C3 C D Land CEPI
Existing 5.5 5.0 27.5 7.0 3.0 3.0 13.0 3.0 3.0 5.0 14.0 5.0 59.5
After 3.0 5.0 15.0 5.0 3.0 3.0 11.0 3.0 1.0 5.0 8.0 3.0 37.0
Aggregate CEPI after implementation of long term action plan will be: 55.50
Environmental status and action plan for prevention and control of pollution at Aurangabad
Maharashtra Pollution Control Board. 45
10. Assessment of Techno-economical feasibility of pollution control systems in clusters of small/medium scale industries
Provision of separate common effluent treatment plant for treatment of electroplating industries in Waluj MIDC will be techno-economically feasible.
11. Efforts shall be made to encourage use of Bio-compost and Bio-fertilizer alongwith the chemical fertilizer in the state to minimize the unutilized chemical fertilizer run-off into the natural water resources from agriculture fields (through Govt. Policy)
Policy in this regards need to be framed at Government level.
12. Summary of proposed action points
WORK METHODOLOGY FOR ACTION PLAN In order to achieve the objective, the methodology to be implemented is as follows
Step I: SURVEY
A reconnaissance survey of all the industrial clusters has been started. Four teams of officers of the Board are carrying out survey of all the industries
The aim of this survey is as follows:
a. To identify the units who have inadequate water air and hazardous waste treatment facility.
b. To identify the units who have provided adequate pollution control systems but the system is in dilapidated condition causing leakages, spillages and fugitive emissions.
c. To find out the size of land available for irrigation / gardening with treated effluent.
d. To find out the industries using, storing solvents and emitting VOC’s and other critical pollutants
e. To find out the compliance of Hazardous Waste (M&H) Rules.
Directions under appropriate sections to be issued to industries for observed non-compliance during survey to take remedial actions. A time bound program will be procured from the industry for the remediation action. Short term and long term action plan will be set for industry on case to case basis.
STEP 2: MEETING AND DISCUSSION WITH INDUSTRIES OF SAME SECTOR
Industries in Aurangabad have been categorized into four major sectors, viz.
a. Bulk drugs and pharmaceuticals, b. Breweries, c. Electroplating industries and d. Sugar and distilleries.

Environmental status and action plan for prevention and control of pollution at Aurangabad
Maharashtra Pollution Control Board. 46
The meeting will focus on issues like:
a. Reduction in consumption of water. b. Reduction in generation of effluent by way of adopting the best
available technology and the three R’s – reduce, reuse and recycle.
c. To optimally use solvents in the process so as to arrest any excess solvents entering into effluent streams.
d. To provide solvent recovery plant and trace organic recovery plants.
e. To provide chrome recovery plant.
In these meetings the industries will be persuaded to carry out the mitigation measures discussed and to submit time bound long term and short term plans. STEP 3: Strengthening and augmentation of monitoring network.
a. Three continuous air monitoring stations with the help of MPCB and industrial sector to be set up in Aurangabad.
b. To carry out ambient air monitoring for critical pollutants on monthly basis.
c. Additional monitoring sites for air, surface water and ground water are identified and monitoring frequency increased.
12.1 Short term action plan.
Sr. No
Description of Action Point Implementing Agency
Cost in Lac Rs.
Proposed Time Frame
Water Pollution measures on available information
1 Completion of conveyance system for carrying the effluent from individual industry to CETP in MIDC Area Waluj Phase-I
MIDC - Phase-I is Completed
2 Completion of conveyance system for carrying the effluent from individual industry to CETP in MIDC Area Waluj Phase-II
MIDC 1100 Work under progress will complete by Dec 2011
3 Completion of conveyance system for carrying the effluent from individual industry to CETP in MIDC Area Shendra.
MIDC 1000 The deadline of Dec 2011 is not possible.
4 Commissioning of the CETP in MIDC area Waluj
MIDC and CETP Operator
1700 Ready for trails
5 Construction of common effluent treatment plant in MIDC Shendra.
MIDC,Industries Govt.Assistance
1500 Proposed deadline of Dec 2011 not possible
6 Construction of separate CETP for electroplating industries in Waluj MIDC.
MIDC,Industries Govt.Assistance
1700 Arrangements for treatment of electroplating industries

Environmental status and action plan for prevention and control of pollution at Aurangabad
Maharashtra Pollution Control Board. 47
waste separately in the CETP is ready
7 Laying of disposal line from CETP to Kham River
MIDC 171 Discussion with SERC in progress
8 Revamping of old ETPs in prominent industries for stoppage of leakages and seepages in MIDC Chikalthana and Waluj wherever required.
Individual industry & MPCB
# Dec 2011.
9 Up gradation of effluent treatment plant which are not meeting prescribed standards.
Individual industry & MPCB
# March 2011
10 Solvent recovery in major bulk drug and chemical units located in MIDC area Waluj and Chikalthana
Individual industry & MPCB
# March 2011
11 Identification and separation of high concentrated streams in prominent industry of MIDC area Waluj and Chikalthana and treating them separately.
Individual industry
# Dec 2010
12 Setting of Continuous 4 AAQM Stations in MIDC Waluj, Chikalthana and Aurangabad city.
MPCB, Industries and Govt.
March 2011
13 Up-gradation of existing air pollution control system provide to coal fired/Briquette fired/Bagasse fired burning equipments by wet scrubbers/ venture-scrubber/bag filters in the industries located in MIDC area Waluj and Chikalthana wherever required.
Individual Industry
# Dec 2010
14 Direction to the industry for improving the efficiency of air pollution control system and increase in vigilance.
MPCB -- Issued
15 Industries to provide solvent recovery system wherever applicable
MPCB # March 2011
16 Control of air pollution due to vehicle in the area by
Transport Dept. # Dec 2011
17 Stoppage of Biomass burning on open land in the area.
Local body -- Dec 2011
18 Providing air pollution control measures during the activity of demolishing old building and new constructions
Local body # Dec 2011
19 Traffic managements in the area Traffic Dept. and Corporation
-- 1 Dec 2011
20 Providing the scientific collection and isolated temporary storage facility for HW in the industries.
Individual Industry
# Completed
21 Restriction on disposal of treated effluent on land in MIDC area Waluj
MPCB -- After commissioning of CETP
22 Scientific collection segregation and storage of MSW in residential areas.
Local Body Dec 2011
23 Restriction on use of thin plastic carry bags. Local Body -- March 2011

Environmental status and action plan for prevention and control of pollution at Aurangabad
Maharashtra Pollution Control Board. 48
12.2 Long term action plan.
Sr. No
Description of Action Point Implementing Agency
Cost in Lac Rs.
Proposed Time Frame
1 Scientific collection treatment and disposal of sewage generated from human habitation
Local Body 60000 March 2012
2 Scientific collection and treatment of sewage generated from MIDC Area Waluj and Chikalthana.
MIDC & MPCB 150 March 2012
3 Scrapping of Percolation Tanks & artificial waterbodies in and around MIDC Area Waluj.
Irrigation Dept. & MIDC & MPCB
150 March 2012
4 Treatment of Kham river water with the help of Bio-remediation technology which is flowing through Aurangabad city.
Local body & MPCB
500 March 2012
5 Treatment of Sukana river water with the help of Bio-remediation technology which is flowing through Aurangabad city.
Local body 500 March 2012
6 Proper collection of Strom water in MIDC area Waluj and Chikalthana.
MIDC 100 Dec 2011
7 Installation of treatment facility for waste waters generated from major hotels, laundries, vehicle service center, commercial complex, major residential project, major marriage halls etc.
MPCB, Local body & Concerned Establishment
# Dec 2011
8 Installation of continuous Stack monitoring facility by major air polluting industries.
Individual Industry
# Dec 2011
9 Changing the fuel pattern of the industry to clean fuel.
Individual Industry
# Dec 2011
10 Checking of adulteration of fuel District Adm. -- Dec 2011
11 Availability of clean fuel District Adm & Oil & Gas companies
-- March 2012
12 Widening of the road and square for avoiding vehicle congestion.
Local body -- March 2012
13 Scientific collection, storage and disposal of BMW generated in the area.
Local Body & CBMWTSDF
March 2012
14 Providing full-fledged collection, treatment and disposal of non-hazardous solid waste generated from MIDC Area
MIDC March 2012
15 Providing full-fledged collection, treatment and disposal of MSW generated from Human habitation
Local body March 2012
16 Soil reclamation in & around MIDC area as per guideline of NEERI
MIDC & Individual Industry
# March 2012
17 Provision of CHWTSDF at Aurangabad MPCB March 2012
-o0o-