proposal commission chair’s updated preliminary map
TRANSCRIPT

Commission Chair’s Updated Preliminary MapProposalLink to map:https://portal.sandiego-mapping.org/submission/p6030
Haystaq Draft Map 1 page 1

Methodology
The differences between the placeholder map and this map includes, but is not limitedto:
District 1 lost Torrey Highlands, a small piece of Pacific Beach and the northeasterncorner of ClairemontDistrict 1 gained the western and northern part of University City (University City is splitbetween Districts 1 and 6 along Genesee Ave and Eastgate Mall)District 2 regained a small section of Pacific BeachDistrict 2 lost Linda Vista.District 2 gained the western part of Clairmont defined by Genesee AveDistrict 3 gained some of the Little Italy section of Midway-Pacific HighwayDistrict 3 gained the Airport and some sections of Military HousingDistrict 4 gained Ridgeview/WebsterDistrict 5 lost Torrey HighlandsDistrict 5 gained Rancho Encantada and Military FacilitiesDistrict 6 lost part of University City (west of Genesee Ave)District 6 extended further south into ClairemontDistrict 6 gained the Convoy area of Kearny MesaDistrict 6 gained Torrey Highlands and Park VillageDistrict 7 lost Rancho Encantada, Military Facilities and a southeastern part ofClairemontDistrict 7 gained all of Linda VistaDistrict 7 lost a section of Mission Valley East that was south of Friar's Road and East ofthe 15 FwyDistrict 8 is unchangedDistrict 9 lost Ridgeway/WebsterDistrict 9 gained a section of Mission Valley East that was south of Friar's Road andEast of the 15 Fwy
The total deviation of this map is 5.62%The Asian VAP of District 6 on this map is 38.3%
Haystaq Draft Map 1 Page 2

Population and Deviation
District
Total
Population Raw Deviation % Deviation
1 149,589 -4,844 -3.14%
2 154,769 336 0.22%
3 158,255 3,822 2.47%
4 157,198 2,765 1.79%
5 150,221 -4,212 -2.73%
6 155,103 670 0.43%
7 157,740 3,307 2.14%
8 155,311 878 0.57%
9 151,713 -2,720 -1.76%
Ideal 154433.2222 Total Deviation: 5.61%
Population
District
Total
Population %Latino %Asian %Black
CVAP
%Latino
CVAP
%Asian
CVAP
%Black
1 149,589 10.87% 25.73% 1.38% 9.26% 17.67% 1.38%
2 154,769 17.01% 4.84% 2.12% 13.60% 4.87% 2.47%
3 158,255 23.66% 7.02% 5.83% 19.80% 5.69% 6.58%
4 157,198 48.77% 21.30% 15.28% 37.84% 21.81% 21.64%
5 150,221 11.21% 27.63% 2.17% 9.71% 21.08% 2.57%
6 155,103 16.16% 37.68% 3.40% 13.66% 32.06% 4.41%
7 157,740 21.98% 13.44% 5.69% 17.08% 12.28% 5.53%
8 155,311 75.88% 7.31% 4.60% 67.32% 9.61% 6.32%
9 151,713 40.25% 13.50% 10.22% 28.63% 13.36% 11.55%
Totals 1389899
CompactnessUnderstanding Compactness
District Perimeter Area_Sq_Mi
Polsby
Popper Schwartzberg Convex_Hull Reock
1 42.7 42 0.2871 0.5358 0.6854 0.3156
2 58.9 63 0.2287 0.4783 0.6573 0.3052
3 38.5 25 0.2104 0.4587 0.6897 0.3621
4 26.7 18 0.3236 0.5689 0.7879 0.6452
Haystaq Draft Map 1 Page 3
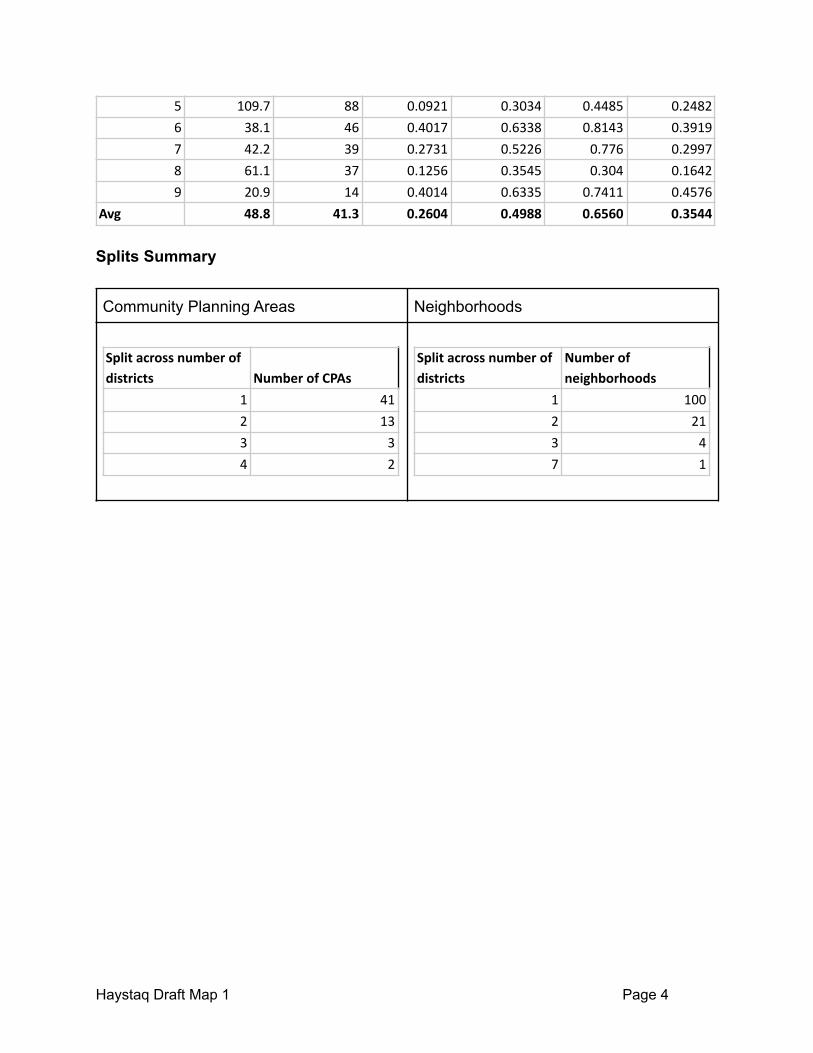
5 109.7 88 0.0921 0.3034 0.4485 0.2482
6 38.1 46 0.4017 0.6338 0.8143 0.3919
7 42.2 39 0.2731 0.5226 0.776 0.2997
8 61.1 37 0.1256 0.3545 0.304 0.1642
9 20.9 14 0.4014 0.6335 0.7411 0.4576
Avg 48.8 41.3 0.2604 0.4988 0.6560 0.3544
Splits Summary
Community Planning Areas Neighborhoods
Split across number of
districts Number of CPAs
1 41
2 13
3 3
4 2
Split across number of
districts
Number of
neighborhoods
1 100
2 21
3 4
7 1
Haystaq Draft Map 1 Page 4

How to Read Map Reports
Full reports from the Haystaq-created draft maps, as well as community-submitted district plans(through 10/12) can be found on the city website as Excel files. These reports were created byproprietary python code written by HaystaqDNA. Here is a basic primer on the components/tabsof these reports:
Maps:These are just images from the city’s Districtr hosted website of each map.
Populations:When we create a plan or export a plan from Districtr, we export it as a ‘block equivalency file’.Basically the U.S. Census divided all of the geography of the City of San Diego up into ‘blocks’.At its most basic, a block can correspond to a city block, but the census will also use permanentgeographic features (a waterway, a canyon, a ridge, a highway) to define a block. The censusthen published population and demographic data associated with each block (a P.L 94-171 file).Then the Statewide Database on behalf of the state of California takes that PL file and doesprisoner reallocation and reassigns in-state prisoners back to their original blocks. To create the‘Populations’ report we match up the blocks of each district with the blocks in this file andsummarize all of the population within this district.
Defining some of the abbreviations: NL = non-Latino, AIAN=American Indian and AlaskanNative, VAP = Voting Age Population (age 18+), CVAP19 = 2019 Citizen Voting Age Population(an estimate of eligible voters).
Deviations are calculated against an ideal population of each district. To find the idealpopulation we simply divide the population of San Diego (1,389,899) by the number ofdistricts(9) to find 154,433. The raw deviation is how far off this number a district population is.The final deviation number is found by adding the absolute value of the lowest negativedeviation to the highest absolute value of the highest positive deviation. Example: District 9has the lowest negative deviation of -3.06%. District 5 has the highest positive deviation of2.80%. So the final deviation is 3.06%+ 2.80% = 5.86%
Components:
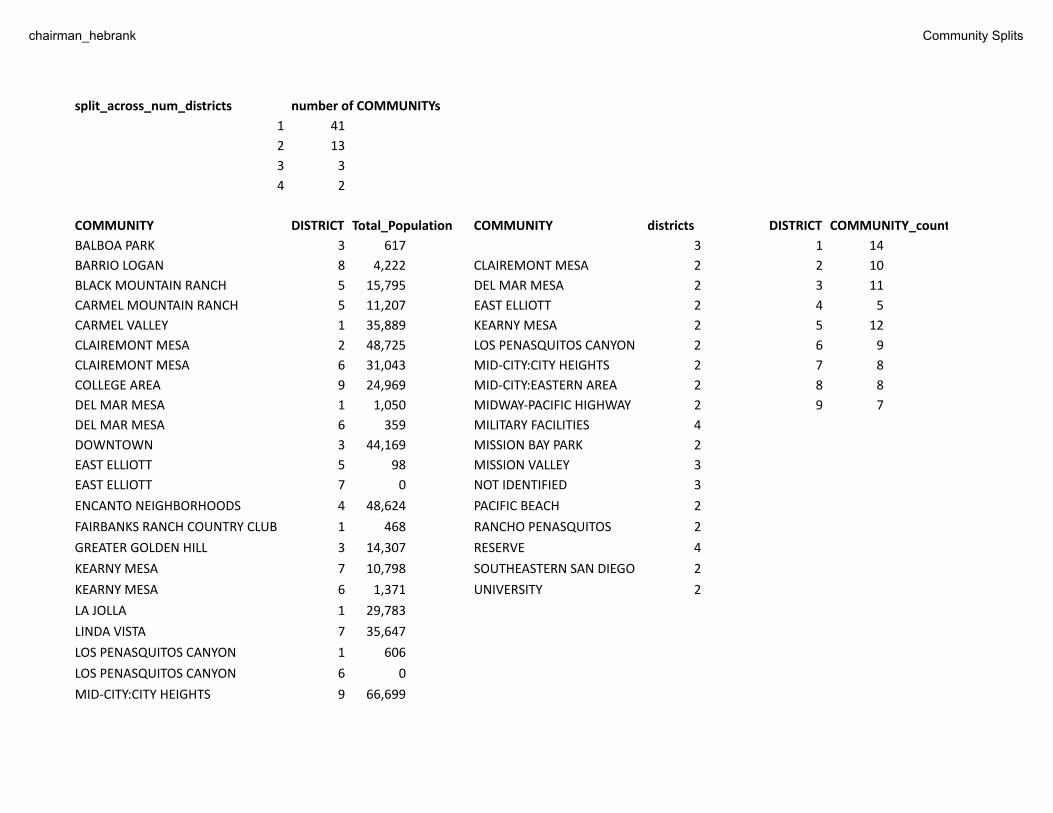
The Component report is a list of all of the Community Planning Areas and Neighborhoods andtheir populations that make up a district.
OldDistrict:
This report lists what existing city council districts and their populations make up the newproposed districts.
Haystaq Draft Map 1 Page 5

Compactness:
For more information on the math behind compactness measures, here is a good resource:https://fisherzachary.github.io/public/r-output.html. For these tests, the closer the score is to 1,the more compact the district, and the closer to 0, the less compact the district is.
SplitsThere are two versions of the splits report. One that looks at how many districts eachCommunity Planning Association is in and one that looks at how many districts eachNeighborhood is in.
Community Splits:‘Military Facilities’, ‘Reserve’ and ‘Not Identified’ show up as splits, mostly because thereare multiple areas with those names. They will show up as splits on almost every map.
Keep in mind physical geography when looking at neighborhood and CPA splits. Forexample, Los Penasquitos Canyon will show a 0 population split on some maps. This isbecause there is a very long and very narrow canyon that extends eastward from thecommunity. It falls between Park Village and Mira Mesa and has 0 population. In manyof the maps for reasons of compactness we will place this canyon in a different districtthan the area with residents.
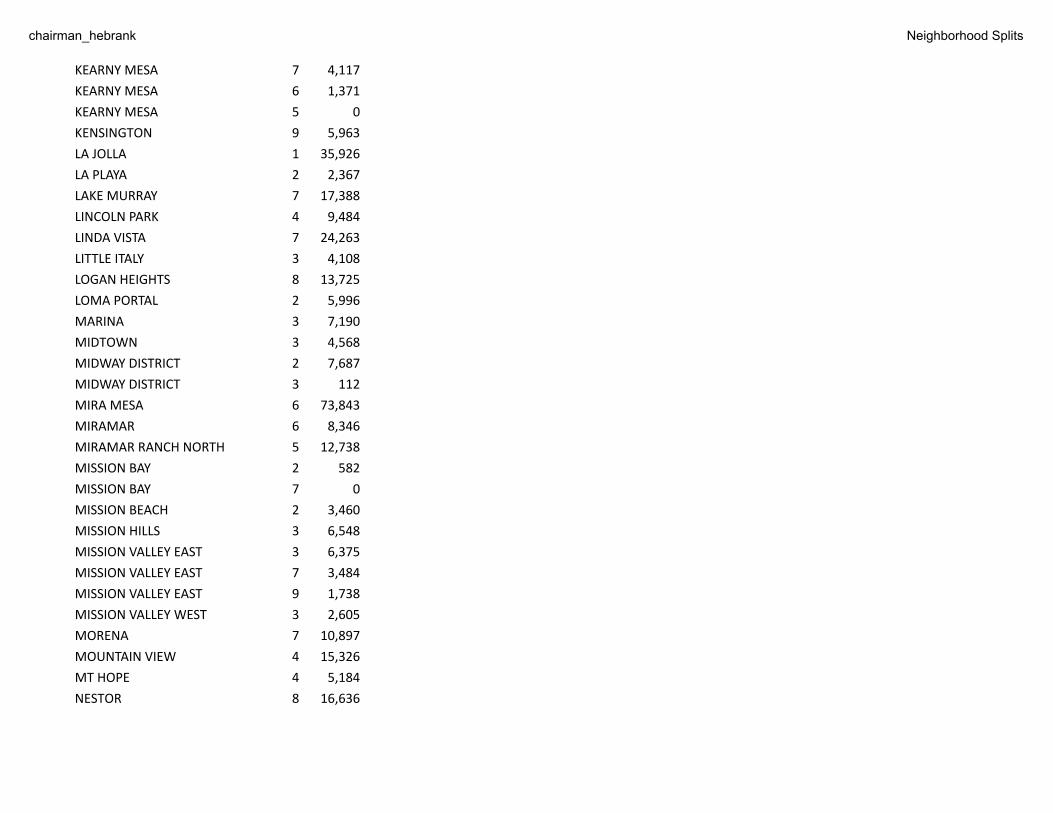
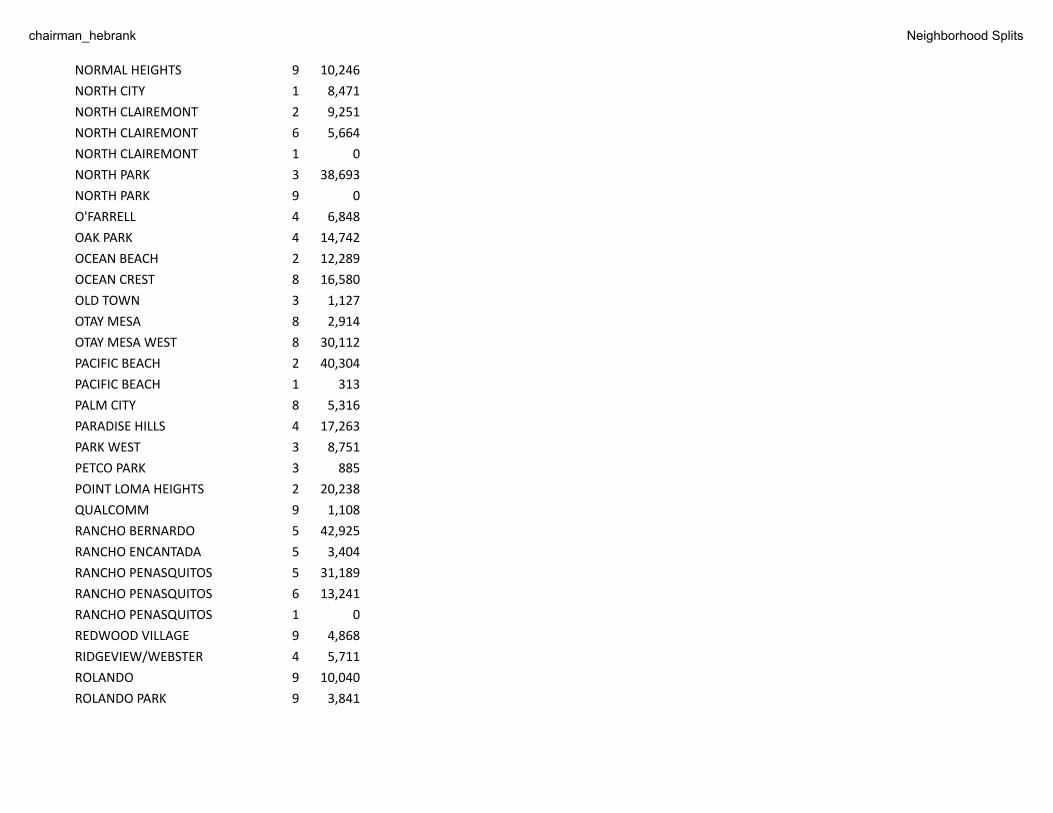
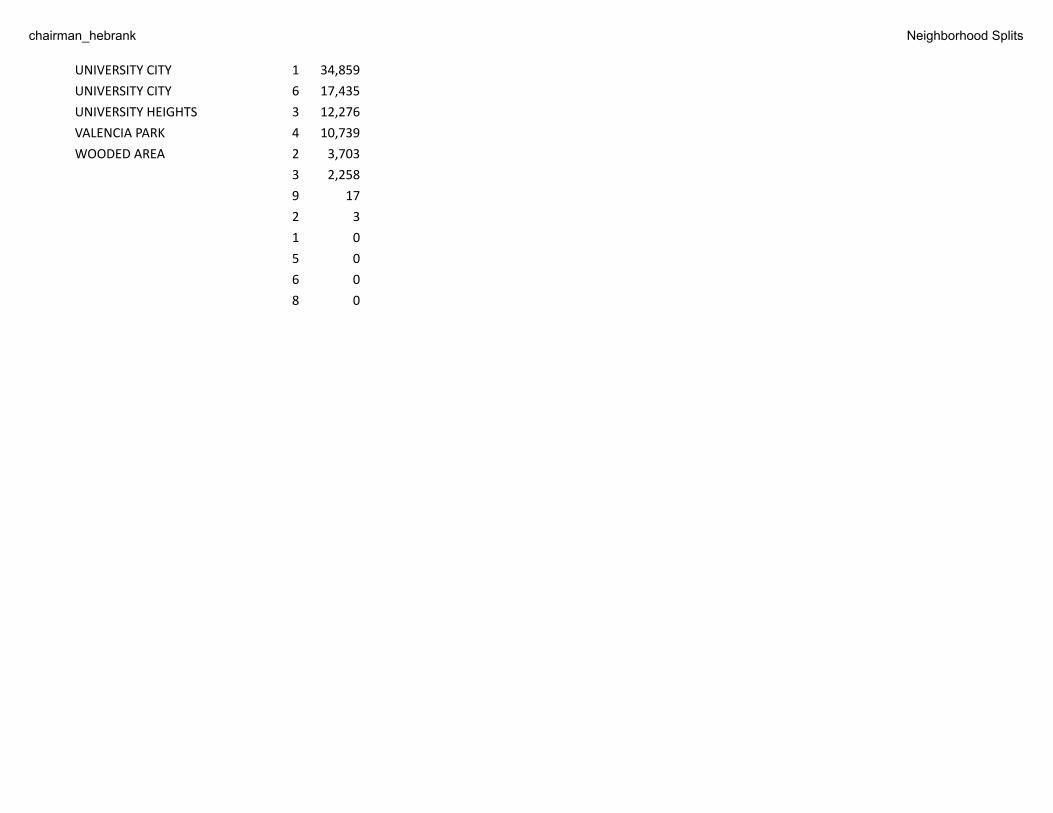
Neighborhood Splits:
Specifically regarding neighborhood splits: when we reduced the number of splits on themap we optimized for CPAs. Many times CPAs and Neighborhoods follow similar butnot identical boundaries. Often the CPA will have its line on one side of a highway andthe neighborhood the other. So there are 'many' neighborhoods that will show 0population splits. We hold that in general you should ignore the 0 population splits.
Haystaq Draft Map 1 Page 6
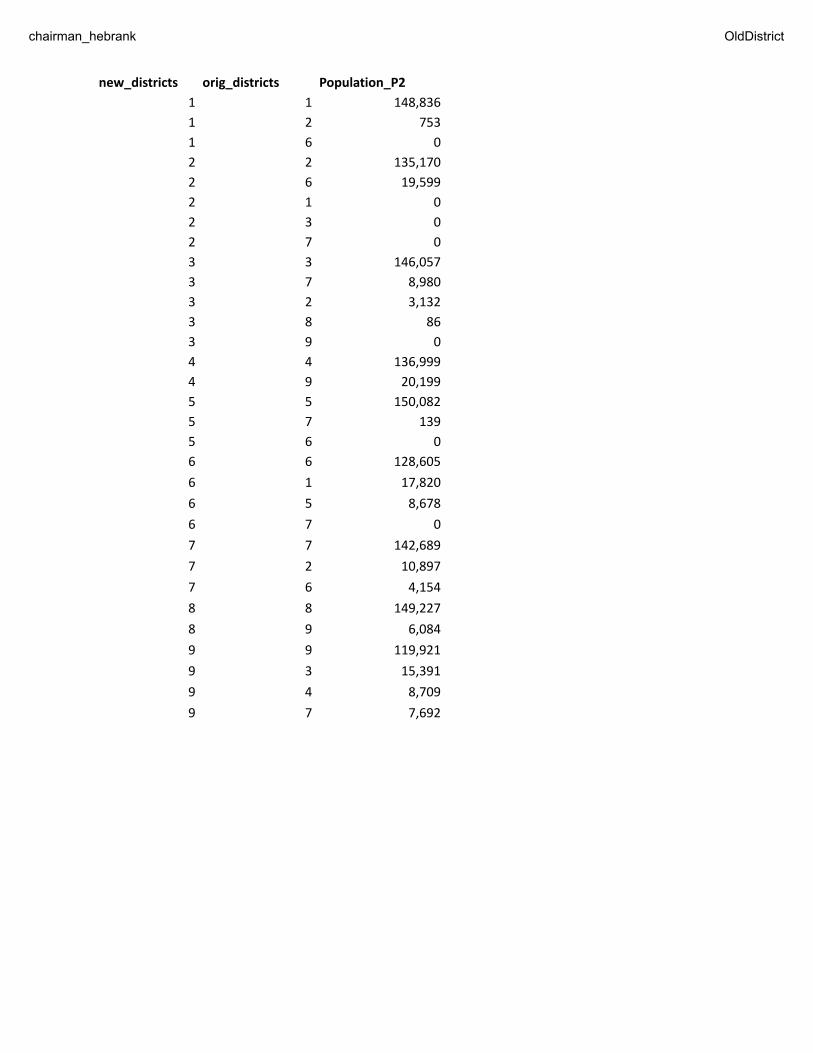
chairman_hebrank OldDistrict
new_districts orig_districts Population_P2
1 1 148,836
1 2 753
1 6 0
2 2 135,170
2 6 19,599
2 1 0
2 3 0
2 7 0
3 3 146,057
3 7 8,980
3 2 3,132
3 8 86
3 9 0
4 4 136,999
4 9 20,199
5 5 150,082
5 7 139
5 6 0
6 6 128,605
6 1 17,820
6 5 8,678
6 7 0
7 7 142,689
7 2 10,897
7 6 4,154
8 8 149,227
8 9 6,084
9 9 119,921
9 3 15,391
9 4 8,709
9 7 7,692
chairman_hebrank Community Splits
split_across_num_districts number of COMMUNITYs
1 41
2 13
3 3
4 2
COMMUNITY DISTRICT Total_Population COMMUNITY districts DISTRICT COMMUNITY_count
BALBOA PARK 3 617 3 1 14
BARRIO LOGAN 8 4,222 CLAIREMONT MESA 2 2 10
BLACK MOUNTAIN RANCH 5 15,795 DEL MAR MESA 2 3 11
CARMEL MOUNTAIN RANCH 5 11,207 EAST ELLIOTT 2 4 5
CARMEL VALLEY 1 35,889 KEARNY MESA 2 5 12
CLAIREMONT MESA 2 48,725 LOS PENASQUITOS CANYON 2 6 9
CLAIREMONT MESA 6 31,043 MID-CITY:CITY HEIGHTS 2 7 8
COLLEGE AREA 9 24,969 MID-CITY:EASTERN AREA 2 8 8
DEL MAR MESA 1 1,050 MIDWAY-PACIFIC HIGHWAY 2 9 7
DEL MAR MESA 6 359 MILITARY FACILITIES 4
DOWNTOWN 3 44,169 MISSION BAY PARK 2
EAST ELLIOTT 5 98 MISSION VALLEY 3
EAST ELLIOTT 7 0 NOT IDENTIFIED 3
ENCANTO NEIGHBORHOODS 4 48,624 PACIFIC BEACH 2
FAIRBANKS RANCH COUNTRY CLUB 1 468 RANCHO PENASQUITOS 2
GREATER GOLDEN HILL 3 14,307 RESERVE 4
KEARNY MESA 7 10,798 SOUTHEASTERN SAN DIEGO 2
KEARNY MESA 6 1,371 UNIVERSITY 2
LA JOLLA 1 29,783
LINDA VISTA 7 35,647
LOS PENASQUITOS CANYON 1 606
LOS PENASQUITOS CANYON 6 0
MID-CITY:CITY HEIGHTS 9 66,699

chairman_hebrank Community Splits
MID-CITY:CITY HEIGHTS 4 2,284
MID-CITY:EASTERN AREA 9 22,461
MID-CITY:EASTERN AREA 4 18,169
MID-CITY:KENSINGTON-TALMADGE 9 14,484
MID-CITY:NORMAL HEIGHTS 9 15,361
MIDWAY-PACIFIC HIGHWAY 2 6,807
MIDWAY-PACIFIC HIGHWAY 3 762
MILITARY FACILITIES 6 8,008
MILITARY FACILITIES 8 7,020
MILITARY FACILITIES 5 149
MILITARY FACILITIES 1 0
MIRA MESA 6 77,935
MIRAMAR RANCH NORTH 5 11,880
MISSION BAY PARK 2 1,688
MISSION BAY PARK 7 0
MISSION BEACH 2 3,292
MISSION VALLEY 3 9,055
MISSION VALLEY 7 8,804
MISSION VALLEY 9 7,722
NAVAJO 7 53,486
NCFUA SUBAREA II 1 766
NORTH PARK 3 46,715
NOT IDENTIFIED 3 2,261
NOT IDENTIFIED 2 3
NOT IDENTIFIED 8 0
OCEAN BEACH 2 12,922
OLD TOWN SAN DIEGO 3 1,234
OTAY MESA 8 19,494
OTAY MESA-NESTOR 8 61,284

chairman_hebrank Community Splits
PACIFIC BEACH 2 40,056
PACIFIC BEACH 1 602
PACIFIC HIGHLANDS RANCH 1 14,379
PENINSULA 2 41,276
RANCHO BERNARDO 5 42,902
RANCHO ENCANTADA 5 3,404
RANCHO PENASQUITOS 5 32,786
RANCHO PENASQUITOS 6 10,232
RESERVE 3 109
RESERVE 1 43
RESERVE 2 0
RESERVE 5 0
SABRE SPRINGS 5 10,786
SAN PASQUAL 5 212
SAN YSIDRO 8 28,444
SCRIPPS MIRAMAR RANCH 5 21,002
SERRA MESA 7 18,376
SKYLINE-PARADISE HILLS 4 67,611
SOUTHEASTERN SAN DIEGO 8 33,770
SOUTHEASTERN SAN DIEGO 4 20,510
TIERRASANTA 7 30,629
TIJUANA RIVER VALLEY 8 1,077
TORREY HIGHLANDS 6 8,678
TORREY HILLS 1 6,916
TORREY PINES 1 6,819
UNIVERSITY 1 51,809
UNIVERSITY 6 17,477
UPTOWN 3 39,026
VIA DE LA VALLE 1 459
chairman_hebrank Community Splits
9 17
2 0
3 0

chairman_hebrank Neighborhood Splits
split_across_num_districts number of NEIGHBORHOODs
1 100
2 21
3 4
7 1
NEIGHBORHOOD DISTRICT Total_Population NEIGHBORHOOD districts DISTRICT NEIGHBORHOOD_count
ADAMS NORTH 9 5,115 7 1 14
ALLIED GARDENS 7 12,020 AZALEA/HOLLYWOOD PARK 2 2 16
ALTA VISTA 4 2,519 BARRIO LOGAN 2 3 31
AZALEA/HOLLYWOOD PARK 9 3,682 BAY HO 2 4 16
AZALEA/HOLLYWOOD PARK 3 0 CARMEL VALLEY 2 5 12
BALBOA PARK 3 617 CASTLE 2 6 13
BARRIO LOGAN 8 11,242 CHEROKEE POINT 2 7 14
BARRIO LOGAN 3 86 CLAIREMONT MESA EAST 2 8 17
BAY HO 2 12,244 GRANT HILL 2 9 28
BAY HO 1 0 GRANTVILLE 2
BAY PARK 2 16,957 KEARNY MESA 3
BAY TERRACES 4 31,386 MIDWAY DISTRICT 2
BIRDLAND 7 4,737 MISSION BAY 2
BLACK MOUNTAIN RANCH 5 17,392 MISSION VALLEY EAST 3
BORDER 8 154 NORTH CLAIREMONT 3
BROADWAY HEIGHTS 4 596 NORTH PARK 2
BURLINGAME 3 705 PACIFIC BEACH 2
CARMEL MOUNTAIN 5 11,207 RANCHO PENASQUITOS 3
CARMEL VALLEY 1 52,114 SCRIPPS RANCH 2
CARMEL VALLEY 6 0 SERRA MESA 2
CASTLE 9 9,370 SHERMAN HEIGHTS 2
CASTLE 3 0 SORRENTO VALLEY 2
CHEROKEE POINT 9 4,672 STOCKTON 2
CHEROKEE POINT 3 0 TIERRASANTA 2
CHOLLAS CREEK 9 4,233 TORREY HIGHLANDS 2

chairman_hebrank Neighborhood Splits
CHOLLAS VIEW 4 4,523 UNIVERSITY CITY 2
CLAIREMONT MESA EAST 6 25,379
CLAIREMONT MESA EAST 7 487
CLAIREMONT MESA WEST 2 10,273
COLINA DEL SOL 9 10,321
COLLEGE EAST 9 9,945
COLLEGE WEST 9 11,830
CORE-COLUMBIA 3 9,035
CORRIDOR 9 7,607
CORTEZ 3 3,943
DEL CERRO 7 7,576
DEL MAR HEIGHTS 1 6,736
EAST VILLAGE 3 16,088
EGGER HIGHLANDS 8 9,564
EL CERRITO 9 5,984
EMERALD HILLS 4 4,395
ENCANTO 4 9,520
FAIRMOUNT PARK 9 2,855
FAIRMOUNT VILLAGE 9 5,361
FOX CANYON 9 2,165
GASLAMP 3 863
GOLDEN HILL 3 9,081
GRANT HILL 8 3,939
GRANT HILL 3 0
GRANTVILLE 7 5,806
GRANTVILLE 9 4,876
HARBORVIEW 3 1,348
HILLCREST 3 14,961
HORTON PLAZA 3 641
ISLENAIR 9 1,074
JAMACHA LOMITA 4 10,198
chairman_hebrank Neighborhood Splits
KEARNY MESA 7 4,117
KEARNY MESA 6 1,371
KEARNY MESA 5 0
KENSINGTON 9 5,963
LA JOLLA 1 35,926
LA PLAYA 2 2,367
LAKE MURRAY 7 17,388
LINCOLN PARK 4 9,484
LINDA VISTA 7 24,263
LITTLE ITALY 3 4,108
LOGAN HEIGHTS 8 13,725
LOMA PORTAL 2 5,996
MARINA 3 7,190
MIDTOWN 3 4,568
MIDWAY DISTRICT 2 7,687
MIDWAY DISTRICT 3 112
MIRA MESA 6 73,843
MIRAMAR 6 8,346
MIRAMAR RANCH NORTH 5 12,738
MISSION BAY 2 582
MISSION BAY 7 0
MISSION BEACH 2 3,460
MISSION HILLS 3 6,548
MISSION VALLEY EAST 3 6,375
MISSION VALLEY EAST 7 3,484
MISSION VALLEY EAST 9 1,738
MISSION VALLEY WEST 3 2,605
MORENA 7 10,897
MOUNTAIN VIEW 4 15,326
MT HOPE 4 5,184
NESTOR 8 16,636
chairman_hebrank Neighborhood Splits
NORMAL HEIGHTS 9 10,246
NORTH CITY 1 8,471
NORTH CLAIREMONT 2 9,251
NORTH CLAIREMONT 6 5,664
NORTH CLAIREMONT 1 0
NORTH PARK 3 38,693
NORTH PARK 9 0
O'FARRELL 4 6,848
OAK PARK 4 14,742
OCEAN BEACH 2 12,289
OCEAN CREST 8 16,580
OLD TOWN 3 1,127
OTAY MESA 8 2,914
OTAY MESA WEST 8 30,112
PACIFIC BEACH 2 40,304
PACIFIC BEACH 1 313
PALM CITY 8 5,316
PARADISE HILLS 4 17,263
PARK WEST 3 8,751
PETCO PARK 3 885
POINT LOMA HEIGHTS 2 20,238
QUALCOMM 9 1,108
RANCHO BERNARDO 5 42,925
RANCHO ENCANTADA 5 3,404
RANCHO PENASQUITOS 5 31,189
RANCHO PENASQUITOS 6 13,241
RANCHO PENASQUITOS 1 0
REDWOOD VILLAGE 9 4,868
RIDGEVIEW/WEBSTER 4 5,711
ROLANDO 9 10,040
ROLANDO PARK 9 3,841

chairman_hebrank Neighborhood Splits
ROSEVILLE / FLEET RIDGE 2 5,884
SABRE SPRINGS 5 10,786
SAN CARLOS 7 13,494
SAN PASQUAL 5 189
SAN YSIDRO 8 28,290
SCRIPPS RANCH 5 20,293
SCRIPPS RANCH 6 0
SERRA MESA 7 25,640
SERRA MESA 6 0
SHELLTOWN 8 3,913
SHERMAN HEIGHTS 8 2,787
SHERMAN HEIGHTS 3 0
SKYLINE 4 8,764
SORRENTO VALLEY 6 3,796
SORRENTO VALLEY 1 74
SOUTH PARK 3 5,391
SOUTHCREST 8 6,084
STOCKTON 8 3,322
STOCKTON 3 0
SUNSET CLIFFS 2 3,531
SWAN CANYON 9 4,143
TALMADGE 9 9,443
TERALTA EAST 9 6,259
TERALTA WEST 9 4,957
TIERRASANTA 7 27,831
TIERRASANTA 5 98
TIJUANA RIVER VALLEY 8 733
TORREY HIGHLANDS 6 6,028
TORREY HIGHLANDS 1 0
TORREY PINES 1 11,084
TORREY PRESERVE 1 12
chairman_hebrank Neighborhood Splits
UNIVERSITY CITY 1 34,859
UNIVERSITY CITY 6 17,435
UNIVERSITY HEIGHTS 3 12,276
VALENCIA PARK 4 10,739
WOODED AREA 2 3,703
3 2,258
9 17
2 3
1 0
5 0
6 0
8 0