property sectors finish the year on a strong note - jll · property sectors finish the year on a...
TRANSCRIPT

Property Sectors Finish the Year on a Strong Note
Philippine Property DigestQ4 2016

Resi
dent
ial
10Office
07
Economy
04
13Reta
il
16Hotel
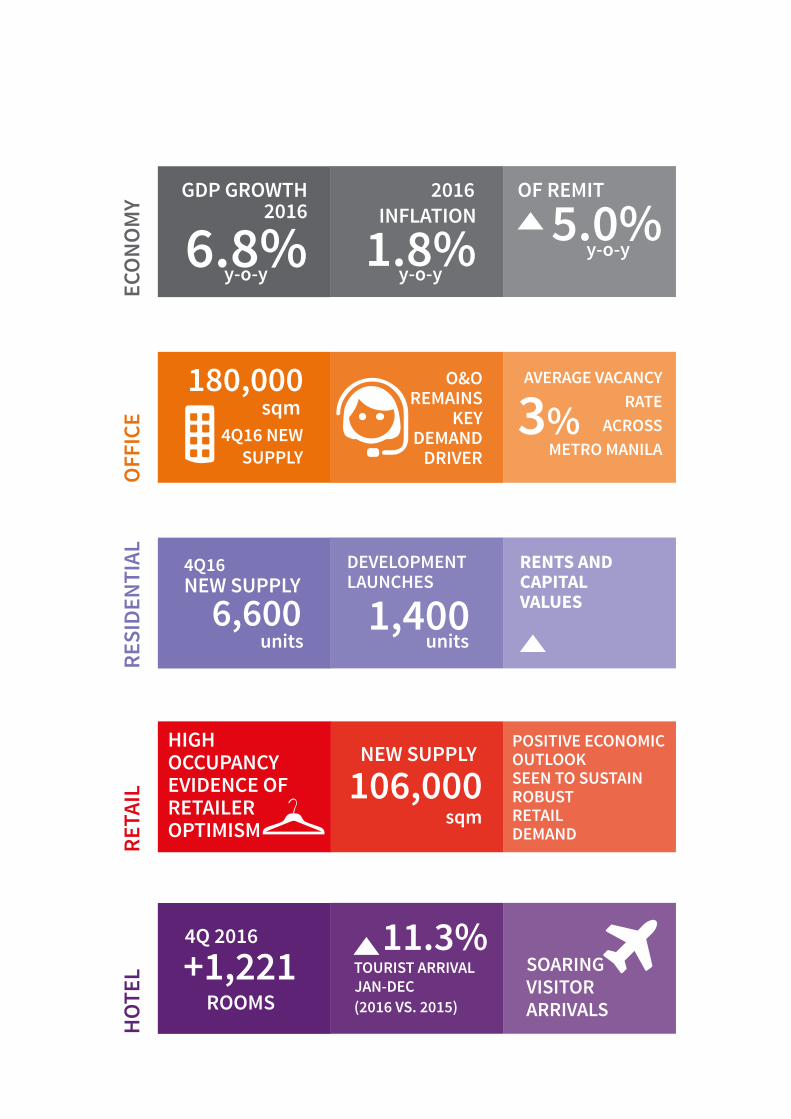
The average GDP growth for 2016 is 6.8% and GDP growth in 4Q16 is 6.6%.Average inflation reaches 1.8% at end-2016, slightly below the Bangko Sentral ng Pilipinas (BSP) inflation target for 2016.Overseas Filipino (OF) remittances increase to 5.0% y-o-y by end-2016.
The offshoring and outsourcing (O&O) industry continues to drive demand for office space, as O&O companies implement expansion plans.Six office developments complete in 4Q16, adding approximately 180,000 sqm of office space to the existing stock in Metro Manila.The average vacancy rate in Metro Manila in 4Q16 is 3% due to robust demand.
Two retail developments complete in 4Q16, adding 106,000 sqm to total existing retail stock.High occupancy among key shopping centres is evidence of retailer optimism in the Philippine market.
In 4Q16, 6,600 units are added to the existing stock from completed residential condominiums in Metro Manila.An estimated 1,400 units from three developments were launched in 4Q16.Rents and capital values maintain positive growth.
Newly completed hotel developments add more than 1,200 hotel rooms in 4Q16.Provincial cities with a flourishing O&O industry might gain a number of hotel developments.
POSITIVE ECONOMIC OUTLOOK SEEN TO SUSTAIN ROBUST RETAIL DEMAND
HIGH OCCUPANCY EVIDENCE OFRETAILEROPTIMISM
O&O REMAINS
KEY DEMAND
DRIVER
NEW SUPPLY
106,000
GDP GROWTH 2016
6.8%
3%
y-o-y
sqm
INFLATION2016
1.8%
180,000
y-o-y
sqm
OF REMIT
y-o-y5.0%
TOURIST ARRIVALJAN-DEC(2016 VS. 2015)
11.3%4Q 2016
ROOMS+1,221 SOARING
VISITORARRIVALS
ECO
NOM
YRE
SIDE
NTIA
LO
FFIC
ERE
TAIL
HOT
EL
NEW SUPPLY 6,600 1,400
units units
4Q16
4Q16 NEW SUPPLY
AVERAGE VACANCY RATE
ACROSSMETRO MANILA
DEVELOPMENT LAUNCHES
RENTS AND CAPITAL VALUES

Economy

5 –
ECO
NO
MY
Economy

6 –
ECO
NO
MY
GDP Growth (2012–2021E)
Source: Philippine Statistics Authority; Oxford Economics for forecast figures
Inflation Rate (2012–2021E)
Source: BSP; Oxford Economics for forecast figures
GDP growth in the Philippines remained among the fastest in Asia, closing at 6.8% in 2016. The strong performance of the economy remained supported by the robust development of the industry and services sectors. The industry sector exhibited a growth of 8.0% in 2016, driven mainly by the construction industry. Meanwhile, the services sector grew by 7.5% in 2016, sustained by real estate, renting & business activity. The services sector contributed most to GDP growth in 2016 with a share of 47.9% to total GDP.
Average inflation was 1.8% in 2016, slightly below the BSP target inflation of 2.0-4.0%. Moreover, inflation during 4Q16 reached an average of 2.6%, the fastest rise seen during the year. Inflation in 4Q16 was mainly driven by the higher cost of transportation commodities as international oil prices rose because of the decrease in oil production among oil-producing countries. In addition, the increase in average inflation during 4Q16 may be attributed to price increases brought about by the holiday season as well as the limited supply of some food items.
0.0%
1.0%
2.0%
3.0%
4.0%
GDP
Grow
th
8.0%
5.0%
6.0%
7.0%
20122021E
20132014
20152016
2017E2018E
2019E2020E
0.0%
1.0%
2.0%
3.0%
4.0%
GDP
Grow
th
5.0%
20122021E
20132014
20152016
2017E2018E
2019E2020E
PHILIPPINES

7 –
ECO
NO
MY
Foreign Exchange Rate PHP/USD (2012–2021E)
Source: BSP; Oxford Economics for forecast figures
Source: BSP; Oxford Economics for forecast figures
OF Cash Remittances (2011–2020E)
The average exchange rate in 2016 was PHP 47.5 per USD 1.0, weaker than the average exchange rate of PHP 45.5 per USD 1.0 in 2015. The depreciation of the Philippine peso can be attributed to recent interest rate hikes of the US Federal Reserve as well as anticipation of further US interest rate hikes in 2017.
In 2016, total OF cash remittances amounted to approximately USD 26.9 billion, a 5.0% y-o-y growth. OF cash remittances for December 2016 alone reached USD 2.56 billion, an increase of 3.6% y-o-y. According to the BSP, the overall growth of OF remittances was mainly driven by the improving global economic condition, specifically in the United States.
40.0
41.0
42.0
43.0
44.0
45.0
46.0
Exch
ange
Rat
e (P
HP:
USD
)
50.0
49.0
48.0
47.0
20122021E
20132014
20152016
2017E2018E
2019E2020E
0.0
20.0
15.0
10.0
5.0
25.0
30.0
OF
Cash
Rem
ittan
ces (
in b
illio
n U
SD)
35.0
20112020E
20122013
20142015
20162017E
2018E2019E
PHILIPPINES

Office
9 –
OFF
ICE
Office

10 –
OFF
ICE
Estimated Vacancy Rates in Metro Manila by Sub-market
Sub-marketEstimated Vacancy Rates
4Q 2016 3Q 2016Makati CBD 3% 3%
BGC 3% 3%
McKinley Hill 4% 4%
Ortigas CBD 1% 1%
Quezon City 8% 10%
Alabang 2% 5%
Bay City 1% 2%
Note: Vacancy rates refer to the available office space in existing Prime and Grade A developments.Source: JLL Research & Consulting
Grade A Office Stock in Metro Manila by Sub-market (2012–2021E)
Source: JLL Research & Consulting
SupplyExisting Prime and Grade A office supply in Metro Manila reached approximately 6.0 million sqm in 4Q16. Most of the existing stock is located in major CBDs such as Makati CBD, Ortigas CBD and Bonifacio Global City (BGC), with a combined total stock of around 4.0 million sqm. Other notable urban districts in Metro Manila are Quezon City, which includes Eastwood City, Araneta Center, Eton Centris, UP-Ayala Technohub, Alabang, Bay City and McKinley Hill, with existing office stock estimated at 2.0 million sqm during the quarter.
Office development completions for the quarter include Filinvest Cyberzone Pasay Tower Two and Three by Filinvest Land Inc in Pasay City; Five West Campus by Megaworld Corporation in McKinley West; Uptown Bonifacio Tower 3 by Megaworld Corporation; Vista Hub by Vista Land & Lifescapes Inc; and W City Center by W Group, Inc in BGC. The completions for the quarter added approximately 180,000 sqm of office space to total stock.
Around 3.2 million sqm of office space will likely be added to existing office stock from 1Q17 to 2021. Notable office developments expected to complete during the period include Cyber Sigma by Robinsons Land, High Street South Corporate Plaza Tower 1 and 2 by Ayala Land, Inc., and The Finance Centre by Daiichi Properties in BGC; SM Three E-com Center by SM Investments Corporation in Bay City; Jollibee Tower by DoubleDragon Properties in Ortigas CBD; Eastwood Global Plaza by Megaworld in Eastwood City; and Ayala Triangle North by Ayala Land Inc in Makati CBD.
DemandOffice space demand in 4Q16 was still driven mainly by O&O firms, followed by firms from the marketing, advertising, media, finance, banking and online gaming sectors.
The average vacancy rate in Metro Manila remained low at 3% in 4Q16. Among the sub-markets, Bay City and Ortigas CBD recorded the lowest vacancy rates of 1%. Average vacancies in Alabang and Quezon City decreased to reach 2% and 8%, respectively. McKinley Hill posted a 4% vacancy rate in 4Q16. Meanwhile, central business districts were observed to have maintained average vacancy rates: Makati CBD and BGC both recorded a 3% vacancy rate, while Ortigas CBD registered a 1% vacancy rate for the quarter.
0
500
400
300
200
600
Annu
al G
rade
A O
ffice
Sup
ply
(in th
ousa
nd sq
m)
1,200
700
800
100
20122013
20142015
20162021E
2020E2019E
2018E2017E
900
Makati CBD Bonifacio Global City McKinley Hill
Ortigas CBDQuezon City Alabang Bay City
1,100
1,000
PHILIPPINES

11 –
OFF
ICE
Estimated Monthly Rents in Metro Manila by Sub-market
Sub-marketRent Range
(PHP/sqm/month)4Q 2016 3Q 2016
Makati CBD 650–1,375 600–1,375
BGC 650–1,150 640–1,100
McKinley Hill 720–840 720–840
Ortigas CBD 450–910 450–910
Quezon City 520–900 520–850
Alabang 500–725 500–725
Bay City 700–850 700–800
Notes: Rent ranges were quoted as minimum and maximum asking rents, excluding air-conditioning charges and common use service area charges, of existing Prime and Grade A office developments.Source: JLL Research & Consulting
Estimated Capital Values in Metro Manila by Sub-market
Sub-market
Capital Value Range (PHP/sqm)
4Q 2016 3Q 2016Makati CBD 105,000–198,000 105,000–194,000
BGC 112,000–155,000 110,000–150,000
Ortigas CBD 60,000–125,000 60,000–122,000
Notes: Capital valueranges were quoted as minimum and maximum asking price per square metre, excluding VAT, of existing Prime and Grade A office developments.Source: JLL Research & Consulting
Asset PerformanceTrend in office rents in Metro Manila maintained an upward trajectory as demand for office space remained robust. The office sector will likely continue to grow due to expansion plans by O&O firms and other industries on the back of the improving economy.
The rental rates in Makati CBD were still the highest, ranging from PHP 650 to PHP 1,375 per sqm per month. This was followed by BGC, ranging from PHP 650 to PHP 1,150 per sqm per month. McKinley Hill, Ortigas CBD and Bay City recorded similar rent ranges from last quarter. Bay City had a range of PHP 700 to PHP 850 per sqm per month. Quezon City rent range marginally increased to PHP 520 to PHP 900 in 4Q16.
Metro Manila average capital values grew marginally in 4Q16 as the economic sentiment of the country remained positive. Capital values of Grade A office space in Makati CBD ranged from PHP 105,000 to PHP 198,000 per sqm while BGC had a range of PHP 112,000 to PHP 155,000 per sqm. Ortigas CBD recorded capital value range of PHP 60,000 to PHP 125,000 per sqm.
OutlookDue to delays in the completion of some office developments in 2016, the expected incoming Grade A supply for 2017 grew, with an estimated 1.2 million sqm across Metro Manila. The vacancy rate might rise as a result, particularly in BGC, where most office developments will complete. The volume of expected supply in 2017 may put downward pressure on rental growth. Nevertheless, the office market will likely remain robust as companies expand on the back of the bullish economy. The O&O industry will still lead demand.
The impact of U.S. President Donald Trump’s ‘America First’ policy stance will likely not affect the demand for office space from O&O firms, as the Philippines remains an attractive O&O destination due to its cost-efficient labour and low attrition rate.
PHILIPPINES

Residential
13 –
RES
IDEN
TIAL
Residential

14 –
RES
IDEN
TIAL
SupplyBy end-2016, there were 259,800 completed residential condominium units from the mid-range to high-end segments, of which around 6,600 completed in 4Q16. Notable developments completed in 4Q16 include Signa Designer Residences Tower 2 and Eton Tower Makati in Makati CBD, The Sapphire Bloc North Tower in Ortigas CBD, and Four Season Riviera – Lotus Tower in Manila.
Residential condominium developments slated to complete in 1Q17 include Valero Grand Suites, Greenbelt Hamilton Tower 1 and Park Terraces Tower 2 in Makati CBD; Central Park West and Horizon Homes – Shang at the Fort in BGC; Viridian and Zitan Residences in Ortigas; and Avida Towers Vita and One Eastwood Avenue Tower 1 in Quezon City.
Several residential condominium projects were launched in 4Q16, including St. Moritz Private Estates Tower 2 and Ridgewood Towers Premier in McKinley Hill and One Katipunan Residences in Quezon City.
The number of licences-to-sell (LTS) issued for residential developments in 2016, increased by 19% y-o-y. It was observed that the LTS issued for mid- to high-end increased by 46% y-o-y, while LTS issued for socialised housing grew by 27% y-o-y. On the other hand, LTS issued for other residential segments decreased with economic housing and open market housing down by 5% and 24% y-o-y, respectively. More than 700 projects were issued with LTS in 2016, totalling approximately to 235,000 residential units.
Annual Residential Condominium Stock in Metro Manila By Sub-market (2012–2021E)
Development Completions in Metro Manila By Sub-market (4Q16)
Note: Residential stock refers to the mid-range to high-end residential condominium supply in Metro Manila.Source: JLL Research & Consulting
Note: Completion refers to the total number of units of mid-range to high-end residential condominium developments completed in 4Q16.Source: JLL Research & Consulting
0
50,000
40,000
30,000
20,000
Num
ber o
f Con
dom
iniu
m U
nits
60,000
10,000
Makati CBD BGC / Taguig
Ortigas/ Pasig/ Mandaluyong Bay City Parañaque / MuntinlupaMcKinley Hill Quezon City Alabang
Newport City
Manila/Pasay
20122013
20142015
20162021E
2020E2019E
2018E2017E
29%
5%
12%
22%
2%
30%
Makati CBD Bonifacio Global CityParañaque / Muntinlupa
Quezon CityManilaOrtigas
PHILIPPINES
15 –
RES
IDEN
TIAL
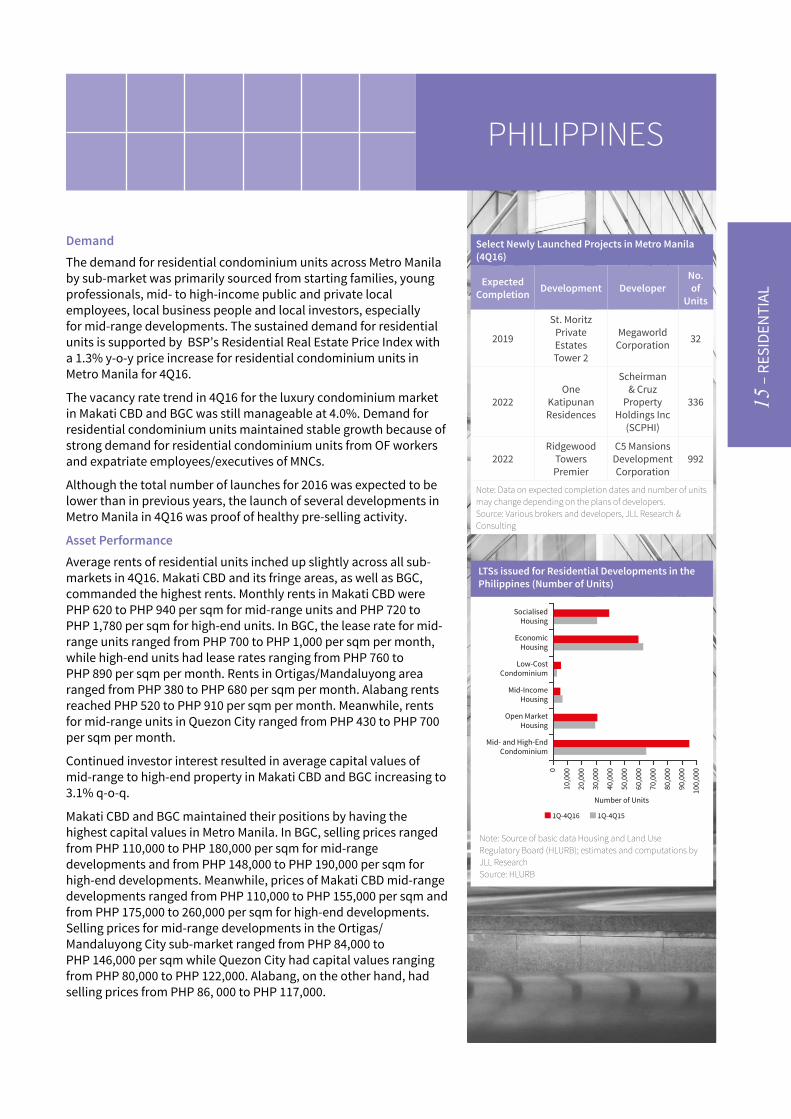
DemandThe demand for residential condominium units across Metro Manila by sub-market was primarily sourced from starting families, young professionals, mid- to high-income public and private local employees, local business people and local investors, especially for mid-range developments. The sustained demand for residential units is supported by BSP’s Residential Real Estate Price Index with a 1.3% y-o-y price increase for residential condominium units in Metro Manila for 4Q16.
The vacancy rate trend in 4Q16 for the luxury condominium market in Makati CBD and BGC was still manageable at 4.0%. Demand for residential condominium units maintained stable growth because of strong demand for residential condominium units from OF workers and expatriate employees/executives of MNCs.
Although the total number of launches for 2016 was expected to be lower than in previous years, the launch of several developments in Metro Manila in 4Q16 was proof of healthy pre-selling activity.
Asset PerformanceAverage rents of residential units inched up slightly across all sub-markets in 4Q16. Makati CBD and its fringe areas, as well as BGC, commanded the highest rents. Monthly rents in Makati CBD were PHP 620 to PHP 940 per sqm for mid-range units and PHP 720 to PHP 1,780 per sqm for high-end units. In BGC, the lease rate for mid-range units ranged from PHP 700 to PHP 1,000 per sqm per month, while high-end units had lease rates ranging from PHP 760 to PHP 890 per sqm per month. Rents in Ortigas/Mandaluyong area ranged from PHP 380 to PHP 680 per sqm per month. Alabang rents reached PHP 520 to PHP 910 per sqm per month. Meanwhile, rents for mid-range units in Quezon City ranged from PHP 430 to PHP 700 per sqm per month.
Continued investor interest resulted in average capital values of mid-range to high-end property in Makati CBD and BGC increasing to 3.1% q-o-q.
Makati CBD and BGC maintained their positions by having the highest capital values in Metro Manila. In BGC, selling prices ranged from PHP 110,000 to PHP 180,000 per sqm for mid-range developments and from PHP 148,000 to PHP 190,000 per sqm for high-end developments. Meanwhile, prices of Makati CBD mid-range developments ranged from PHP 110,000 to PHP 155,000 per sqm and from PHP 175,000 to 260,000 per sqm for high-end developments. Selling prices for mid-range developments in the Ortigas/Mandaluyong City sub-market ranged from PHP 84,000 to PHP 146,000 per sqm while Quezon City had capital values ranging from PHP 80,000 to PHP 122,000. Alabang, on the other hand, had selling prices from PHP 86, 000 to PHP 117,000.
LTSs issued for Residential Developments in the Philippines (Number of Units)
Note: Source of basic data Housing and Land Use Regulatory Board (HLURB); estimates and computations by JLL ResearchSource: HLURB
Select Newly Launched Projects in Metro Manila (4Q16)
Expected Completion Development Developer
No. of
Units
2019
St. Moritz Private Estates Tower 2
Megaworld Corporation 32
2022One
Katipunan Residences
Scheirman & Cruz
Property Holdings Inc
(SCPHI)
336
2022Ridgewood
Towers Premier
C5 Mansions Development Corporation
992
Note: Data on expected completion dates and number of units may change depending on the plans of developers.Source: Various brokers and developers, JLL Research & Consulting
1Q-4Q16 1Q-4Q15
SocialisedHousing
EconomicHousing
Mid-IncomeHousing
Open MarketHousing
Low-CostCondominium
Mid- and High-EndCondominium
Number of Units
0
10,0
00
20,0
00
30,0
00
40,0
00
50,0
00
60,0
00
70,0
00
100,
000
90,0
00
80,0
00
PHILIPPINES

16 –
RES
IDEN
TIAL
OutlookDue to increasing local demand and the regional integration, the Philippine residential sector will likely continue to grow; however, funding remains a challenge for further expansion. According to BSP Deputy Governor Diwa C. Guinigundo, some developers are experiencing tightness in financing for real estate projects. Despite strong demand for housing, alternative ways for funding real estate projects was suggested by the BSP in order to support the long-term needs for real estate.
On another note, the Philippine peso depreciation in 4Q16 is likely to continue in 2017. This scenario increases the spending power of OF families for residential units, which would support demand for residential units. Further, by end-2017, the BSP forecasts stable growth of OF remittances.
From 1Q17 to 2021, approximately 118,000 residential condominium units are expected to be added to the total stock of the Metro Manila residential market. These future developments are mostly located in Makati CBD, Ortigas CBD and BGC.
Estimated Monthly Rents in Metro Manila by Sub-market
Sub-marketRent Range
(PHP/sqm/month)4Q 2016 3Q 2016
Mid-Range
Makati CBD 620–940 600–930
BGC 700–1,000 700–1,000
Ortigas/Mandaluyong 380–680 360–680
Quezon City 430–700 420–690
Alabang 520–910 520–910
High-End
Makati CBD 720–1,780 710–1,760
BGC 760–890 750–880
Note: Capital value ranges were quoted as minimum and maximum asking price per square metre in select completed developments per sub-market. Prices are exclusive of VAT and association dues.Source: JLL Research & Consulting
Estimated Capital Values in Metro Manila by Sub-market
Sub-marketCapital Value Range (PHP/sqm/month)
4Q 2016 3Q 2016Mid-range
Makati CBD 110,000–155,000 105,000–154,000
BGC 110,000–180,000 105,000–180,000
Ortigas/ Mandaluyong 84,000–146,000 82,000–145,000
Quezon City 80,000–122,000 78,000–120,000
Alabang 86,000–117,000 86,000–115,000
High-End
Makati CBD 175,000–260,000 170,000–260,000
BGC 148,000–190,000 145,000–188,000
Note: Capital value ranges were quoted as minimum and maximum asking price per square metre in select completed developments per sub-market. Prices are exclusive of VAT and association dues.Source: JLL Research & Consulting
RetailPHILIPPINES

17 –
RET
AIL
Retail

18 –
RET
AIL
Note: Indicated supply is measured in terms of the GFA of the retail developments.Source: JLL Research & Consulting
Cumulative Existing Retail Shopping Mall Supply in Metro Manila (2011–2020E)
Retail Developments Scheduled for Completion in 1Q17Development Developer LocationAyala Malls The 30th ALI Pasig City
Tiendesitas – Building B (redevelopment and expansion)
Ortigas & Co Limited Partnership
Pasig City
Vertis North Commercial Block Mall
ALI Quezon City
Powerplant Mall (expansion)
Rockwell Land Makati City
Various developers; JLL Research & Consulting
SupplyApproximately 106,000 sqm was added to total existing retail stock in Metro Manila as two retail developments – Ayala Malls South Park in Muntinlupa City by ALI and SM East Ortigas in Pasig City by SMPH – opened in 4Q16.
In addition, retail developments scheduled to complete by end-1Q17 are expected to add approximately 122,700 sqm to total existing retail stock.
DemandRetailers remain optimistic about the Philippine retail market, manifested by high occupancy levels in key retail developments in Metro Manila. Notable international retailers that opened their first stores in the Philippines during 4Q16 included US clothing brand Vera Wang in 8 Rockwell, Makati City; US food and beverage (F&B) brand Fatburger in Glorietta, Makati City; US F&B brand Sugar Factory in Shangri-La at the Fort, BGC as well as Czech footwear brand Bata and Japanese F&B brand Tokyo Milk Cheese Factory, both located in SM Megamall, Mandaluyong City.
Other key retailers that opened additional stores in Metro Manila included F&B brands Coco Ichibanya and Pablo in Robinsons Place Manila, Sunnies Café in SM Megamall and Pezzo and Morganfield’s in SM North EDSA. Meanwhile, notable non-food retailers such as Estee Lauder, Florsheim, Bench, Von Dutch and Bose opened additional stores in Metro Manila during 4Q16.
0.0
4.0
3.0
2.0
1.0
5.0
6.0
7.0
8.0
9.0
Cum
ulat
ive
Reta
il Su
pply
(in
mill
ion
sqm
)
10.0
20112012
20132014
2020E2016
20152017E
2018E2019E
PHILIPPINES

19 –
RET
AIL
New Retailers Entering the Philippine Market in 1Q17
Retailer Brand Country of Origin
Retailer Type
Vera Wang USA Clothing
Fatburger USA F&B
Sugar Factory USA F&B
Bata Czech Republic Footwear
Tokyo Milk Cheese Factory Japan F&B
Source: JLL Research & Consulting
OutlookThe performance of the retail market will likely remain robust, supported by the positive outlook on the Philippine economy. Factors such as rising consumer confidence, the steady growth of OF remittances, strong private spending as well as the growth of the O&O sector are expected to continue to buoy retail demand.
Correspondingly, notable international retailers such as Canadian F&B brand Tim Hortons and French sporting goods retailer Decathlon have expressed their interest in opening their first stores in the Philippines.
On the other hand, rents among key retail establishments are expected to continue moderate growth as retail demand remains robust. However, vacancy rates will likely increase due to the large upcoming supply anticipated to complete in the next few years.
PHILIPPINES

Hotel

21 –
HO
TEL
Hotel

22 –
HO
TEL
SupplyIn 4Q16, Marriott West Wing in Newport City and Phase I of Okada Manila Resort in Bay City opened their doors to guests, adding 1,221 rooms to existing supply. Metro Manila’s hotel and tourism industry is forecast to expand in line with total tourist arrivals in the country.
From 1Q17 to 2021, around 10,400 hotel rooms will be added to existing stock, with most of the upcoming hotel developments situated in Makati CBD, BGC, Ortigas CBD and Bay City. Two hotel developments are expected to complete in 1Q17, namely I’M Hotel and Residences by H2O Ventures in Makati CBD and serviced apartment Valero Grand Suites by Swiss-Belhotel, also in Makati CBD. These two developments will likely add around 550 hotel rooms.
DemandThe six million tourist arrivals targeted for 2016 by the Department of Tourism (DOT) was almost reached with the recorded 5.97 million tourist arrivals by end-2016. Growth rate of tourist arrivals in 2016 is estimated at 11.3% y-o-y. Over the same period, the top three countries sending visitors to the Philippines were South Korea with 1.4 million arrivals and a share of 25%, the United States with 869,463 arrivals (15%) and China with 675,663 arrivals (11%). Japan placed fourth with 535,238 arrivals (9%). Australia took fifth place with 251,098 (4%). The highest growth of tourist arrivals to the country was from China and Taiwan, with growth of 38% and 29%, respectively.
Recently Opened Hotels in Metro Manila (4Q16)
Development Location No. of Rooms
Marriott West WingNewport
City, Pasay City
228
Okada Manila Phase I
Bay City, Pasay City 993
Source: JLL Research & Consulting
Select Upcoming Hotel Developments (2017E–2021E)Completion
Date Development No. of Rooms
2017 I'M Hotel and Residences 434
2017 Grand Hyatt Manila 461
2017 Citadines Millennium Ortigas 210
2017 Valero Grand Suites 136
2017 Tryp by Wyndham Manila 189
2018The Manila Bay Resorts (Okada
Resort) – Phase II1,057
2020 Admiral Suite MCollection 333
2020
The Westin Manila Bayshore – Westside City (former Resorts
World Bayshore City)
600
2020
Hotel Okura Manila – Westside City
(former Resorts World Bayshore City)
380
2018
Westside City (former Resorts
World Bayshore City (Crockfords Tower
Manila and Genting Grand Manila))
1,500
2018 Seda Hotel BGC Expansion 341
2018 Seda Circuit Makati 255
2018 Seda Arca South 265
2019 The Westin Manila Sonata Place 289
2019Seda Gateway Makati
(former Gateway Makati)
293
PHILIPPINES
23 –
HO
TEL
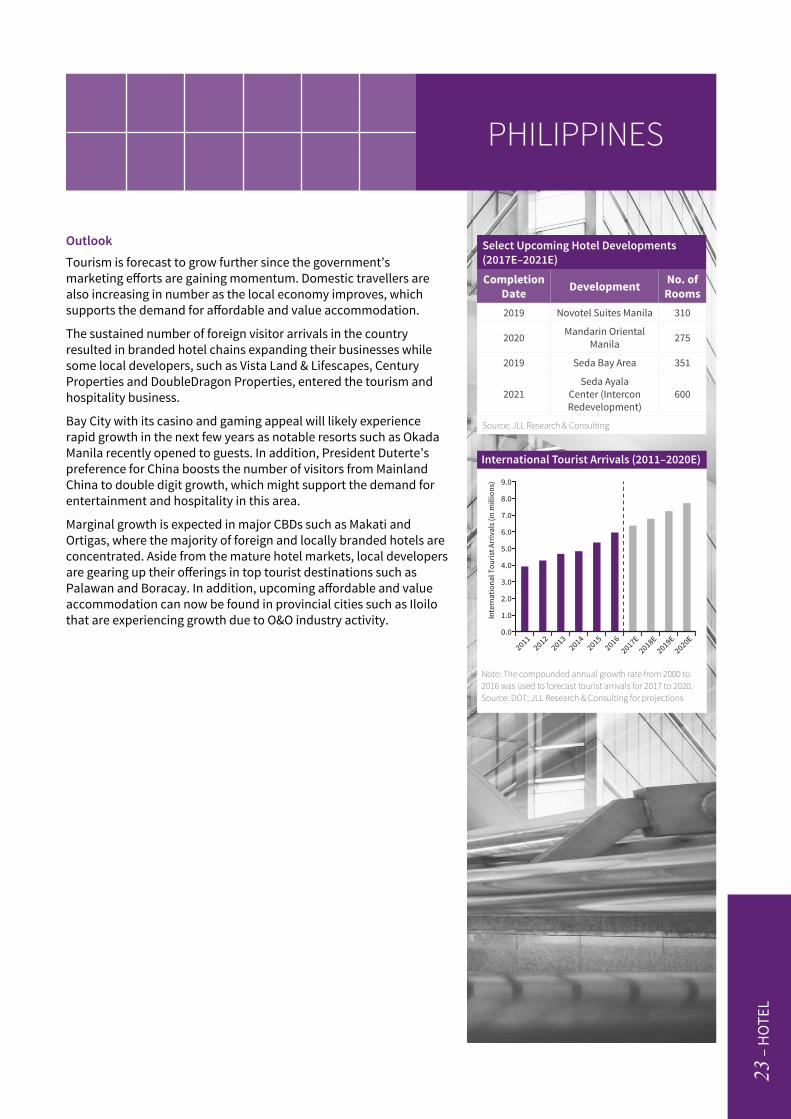
OutlookTourism is forecast to grow further since the government’s marketing efforts are gaining momentum. Domestic travellers are also increasing in number as the local economy improves, which supports the demand for affordable and value accommodation.
The sustained number of foreign visitor arrivals in the country resulted in branded hotel chains expanding their businesses while some local developers, such as Vista Land & Lifescapes, Century Properties and DoubleDragon Properties, entered the tourism and hospitality business.
Bay City with its casino and gaming appeal will likely experience rapid growth in the next few years as notable resorts such as Okada Manila recently opened to guests. In addition, President Duterte’s preference for China boosts the number of visitors from Mainland China to double digit growth, which might support the demand for entertainment and hospitality in this area.
Marginal growth is expected in major CBDs such as Makati and Ortigas, where the majority of foreign and locally branded hotels are concentrated. Aside from the mature hotel markets, local developers are gearing up their offerings in top tourist destinations such as Palawan and Boracay. In addition, upcoming affordable and value accommodation can now be found in provincial cities such as Iloilo that are experiencing growth due to O&O industry activity.
International Tourist Arrivals (2011–2020E)
Note: The compounded annual growth rate from 2000 to 2016 was used to forecast tourist arrivals for 2017 to 2020.Source: DOT; JLL Research & Consulting for projections
Select Upcoming Hotel Developments (2017E–2021E)Completion
Date Development No. of Rooms
2019 Novotel Suites Manila 310
2020 Mandarin Oriental Manila 275
2019 Seda Bay Area 351
2021Seda Ayala
Center (Intercon Redevelopment)
600
Source: JLL Research & Consulting
0.0
4.0
3.0
2.0
1.0
5.0
6.0
Inte
rnat
iona
l Tou
rist A
rriv
als (
in m
illio
ns) 9.0
8.0
7.0
20112012
20132014
2020E2016
20152017E
2018E2019E
PHILIPPINES

COPYRIGHT © JONES LANG LASALLE IP, INC. 2017. All rights reserved. No part of this publication may be reproduced or transmitted in any form or by any means without prior written consent of Jones Lang LaSalle. The items in this publication have been compiled from the various sources acknowledged. The information is from sources we deem reliable; however no representative or warranty is made to the accuracy thereof.
For more information, please contact:
Note: The Philippine Property Digest covers the Prime and Grade A office, mid-range to high-end residential condominium, retail shopping mall and hotel markets in Metro Manila.
Claro dG. Cordero, Jr. Local Director Head of Research, Consulting & Valuation JLL Philippines tel +63 2 902 0888 mobile +63 918 9143309 [email protected]
JLL Philippines +63 2 902 0888 www.jll.com.ph