properties of manure - manitoba · properties of manure ... moisture and dry matter content ... the...
TRANSCRIPT
Properties of Manure
November 2015


Properties of Manure | Page iii
ContentsLearning Objectives ........................................................................................................................... 1
Overview ........................................................................................................................................ 1
Introduction ...................................................................................................................................... 1
Factors That Affect Manure Composition .............................................................................................. 2Feeding and Nutrient Excretion ..................................................................................................... 2Water Consumption ..................................................................................................................... 3In-Barn Water Use ....................................................................................................................... 3Livestock Bedding ....................................................................................................................... 3In-Barn Drying Systems ................................................................................................................ 3Weather ..................................................................................................................................... 4Manure Storage Design ............................................................................................................... 4Microbial Decomposition and other Nutrient and Moisture Transformations ........................................ 4Settling of Solids – Liquid Pig Manure ............................................................................................ 5
Manure Sampling and Analysis .......................................................................................................... 8General Guidelines for Sampling Manure ..................................................................................... 8Sampling Well Agitated Liquid Manure ........................................................................................ 10Sampling Partially Agitated Liquid Manure ................................................................................... 11Sampling Manure from Multi-Celled Systems ................................................................................. 12Sampling Solid Manure .............................................................................................................. 12Laboratory Analyses for Manure ................................................................................................. 13Rapid In-Field Testing of Liquid Manure ........................................................................................ 14
Composition of Typical Manures in Manitoba ..................................................................................... 15Book Values .............................................................................................................................. 15Moisture and Dry Matter Content ................................................................................................ 19Nitrogen .................................................................................................................................. 19
Carbon to Nitrogen Ratios and Nitrogen Availability from Manure ............................................ 20Phosphorus Forms in Manure ...................................................................................................... 21Estimated Available N:P2O5 ratios ............................................................................................... 22Potassium ................................................................................................................................. 23Sulphur ................................................................................................................................... 23Micronutrients and Other Trace Elements in Manure ...................................................................... 24Salts in Manure ......................................................................................................................... 24

Page iv | Properties of Manure
By-Products of Manure Treatment ....................................................................................................... 26Composting ............................................................................................................................. 26Solid – Liquid Separation ........................................................................................................... 27
Centrifuge .......................................................................................................................... 27Rotary Press ....................................................................................................................... 30VP Systems Air Floatation and Belt Filter Press ......................................................................... 32Gravity Separation .............................................................................................................. 34Anaerobic Digestion ............................................................................................................ 35
References ..................................................................................................................................... 36
Appendices .................................................................................................................................... 37
Properties of Manure | Page 1
Learning ObjectivesAfter completing this review, you should be able to explain and/or describe:
1. The factors that affect manure composition2. How to properly sample and ship manure for analysis 3. The dry matter, nutrient, trace element and salt content of typical Manitoba livestock and poultry manures4. The properties of various by-products of manure treated in Manitoba
Overview This chapter on “Properties of Manure” focuses on the characteristics of livestock and poultry manure that are important for managing manure in an agronomically and environmentally responsible manner. The factors that influence manure composition are discussed and typical concentrations are provided for nutrients, trace elements and salts from pig, dairy, beef and layer manures. The characteristics of manure by-products following treatment are also briefly discussed for a few treatment systems that have been tested in Manitoba. For information about the behavior of nutrients in soil, see the Manitoba Agriculture, Food and Rural Development (MAFRD) publication “Effects of Manure and Fertilizer on Soil Fertility and Quality.”
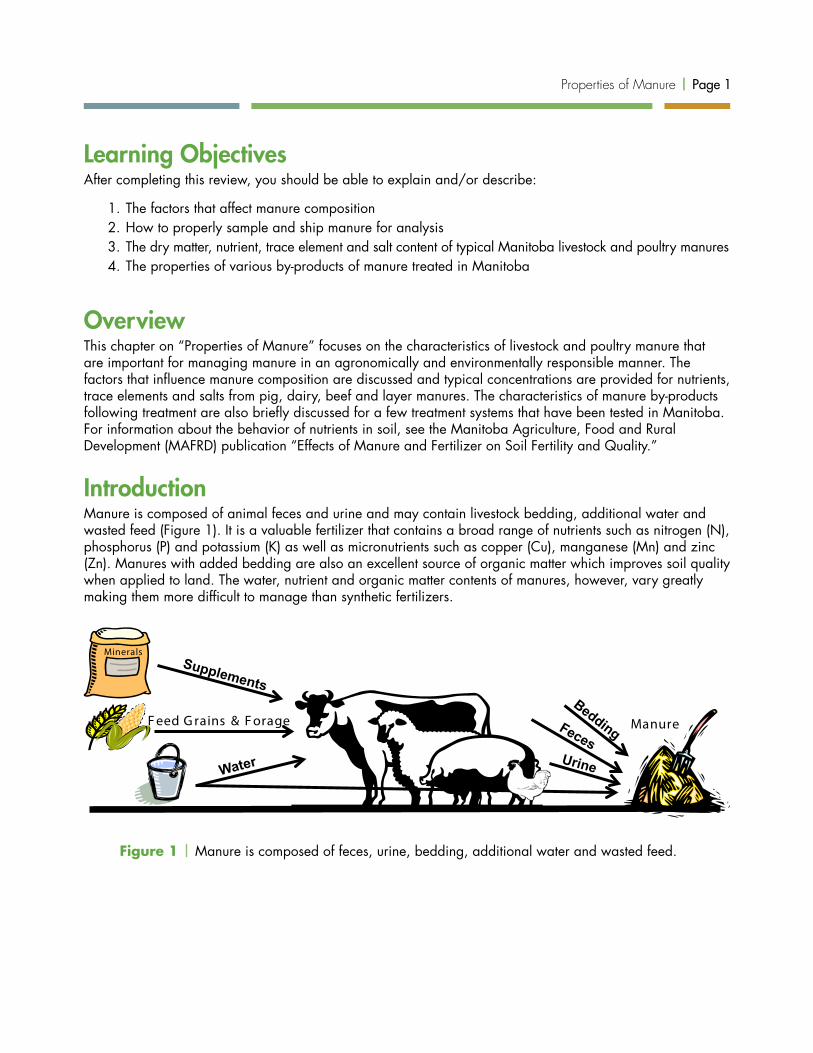
IntroductionManure is composed of animal feces and urine and may contain livestock bedding, additional water and wasted feed (Figure 1). It is a valuable fertilizer that contains a broad range of nutrients such as nitrogen (N), phosphorus (P) and potassium (K) as well as micronutrients such as copper (Cu), manganese (Mn) and zinc (Zn). Manures with added bedding are also an excellent source of organic matter which improves soil quality when applied to land. The water, nutrient and organic matter contents of manures, however, vary greatly making them more difficult to manage than synthetic fertilizers.
Minerals
F eed G rains & F orage Manure
Figure 1 | Manure is composed of feces, urine, bedding, additional water and wasted feed.
Page 2 | Properties of Manure
Factors That Affect Manure CompositionThe primary factors that affect nutrient composition of manure are livestock type, stage of growth and feeding practices (all of which determine nutrient excretion rates) as well as the amount of bedding or water added to the manure, type of manure storage, time that the manure spends in storage and weather conditions.
Feeding and Nutrient ExcretionLivestock retain some of the nutrients they are fed as they gain weight. Nutrients are also retained in milk and eggs. Nutrients that are not retained by the animal or exported in livestock products are excreted and end up in the manure. Livestock typically excrete 50 to 90 % of the nutrients they are fed, depending on the animal species, stage of growth and the ration provided (feed source and supplements). Fully-grown animals that are not gaining weight, gestating or producing milk or eggs, however, excrete almost all of the nutrients they are fed.
Feeding nutrients in excess of what the animal requires increases the amounts that are excreted in the feces and urine. The nutrient requirements of livestock are affected by animal species, age, gender and stage of production. For example, animals that are actively growing will require different quantities of nutrients than mature animals. Similarly animals that are lactating require more nutrients than animals that are gestating. Adjusting the feed ration to more accurately provide the nutrients required by the animal – such as adjusting for different growth stages, lactation, gestation or gender – provides opportunities to reduce the quantity of nutrients excreted in the manure by reducing the number of periods in which nutrients are overfed.
The quality and availability of nutrients in feed affect how much must be fed to meet nutritional requirements and how much will be excreted in the manure. Feeding high quality protein sources and balancing amino acids allows producers to reduce the amount of N that must be fed and also decreases N excretion. Nitrogen is excreted in both the feces and the urine. Soluble N is excreted in the urine as urea or uric acid; whereas, organically bound N is excreted in the feces.
Improving digestibility of the nutrients can also reduce excretion, particularly for P. Most of the plant P in feed grains is in the form of phytate, a very stable molecule. Monogastric animals (such as pigs and chickens) cannot absorb phytate P; therefore, this form of P passes through the gut and is excreted in the feces. The inclusion of microbial phytase in the diets of monogastric animals allows them to absorb phytate P which, in turn, allows for a reduction in supplemental inorganic P in the diet and a reduction of P excreted in the manure. If more dietary available P is absorbed than is required by the animal, however, the excess P will be extracted by the kidneys and excreted in the urine. Although the quantity of P excreted is much higher in the feces than the urine, urine P is water soluble and therefore suspected to be much more mobile in the environment. Therefore, one of the reasons why diets containing phytase must be accompanied by a reduction in di-calcium phosphate (and therefore total P) is to ensure that more of the environmentally sensitive urine P is not excreted.
Rumen bacteria allow ruminants (such as cattle, sheep and goats) to digest phytate P. For this reason, less of the P fed to ruminants is excreted in the manure. Almost all of the P that is excreted (95-98%) by ruminants, is excreted in the feces (Flaten et al. 2003). Very little is excreted in the urine. Feeding practices, however, can influence the amount of P excreted in the urine. Overfeeding P, high calcium diets and high grain, low roughage diets can result in a greater proportion of the P being excreted in the urine by cattle.
Feed efficiencies may be further improved through genetic advancements, improved environmental conditions and better processing of the feed.

Properties of Manure | Page 3
Water ConsumptionMost of the water used in the barn is for animal drinking. The amount of water the livestock consume is influenced by animal species, stage of growth and feed intake. Intake is also affected by barn temperature. For example, a mature, lactating dairy cow consumes in the range of 80 litres of water per day in the winter, but consumption increases to as much as 140 litres per day in the summer.
In-Barn Water UseThe choice of feeding equipment (such as wet-dry feeders in pig barns), the use of plate coolers (in dairy barns) as well as the methods used to cool animals, wash barns and clean equipment can all affect the amount of water that enters the manure.
Livestock Bedding The type and quantity of bedding materials will determine if the manure will be managed as a liquid, solid or semi-solid. Bedding can include wood chips, sawdust, wheat straw, flax straw or even peanut hulls, rice hulls and recycled paper products. Typically in Manitoba, cereal straw bedding is used.
In-Barn Drying Systems In-barn, manure drying systems, such as those being used in layer barns, greatly reduce the manure’s moisture content so that the manure can be stored and land applied as a solid.
Adjusting feed rations to provide the nutrients required by the animals reduces the quantity of nutrients excreted in the manure.

Page 4 | Properties of Manure
WeatherEven individual operations that have not changed their livestock production or manure management practices can get year to year variations in their manure composition simply as result of differences in weather (e.g. warm or cool, wet or dry).
Manure Storage DesignThe design of the manure storage structure determines the surface area that is exposed to the atmosphere, volatilization of ammonium-N as ammonia gas, evaporation losses and the amount of rainwater that enters the storage.
Liquid manure handling systems that rapidly transfer the manure from the barn floor to the storage reduce ammonia loss. Liquid manure storage structures that have smaller surface areas exposed to the atmosphere are also effective in reducing N losses.
Covering manure storage structures keeps water from entering the manure and increasing its moisture content. Synthetic covers, such as those used on liquid manure storage structures, greatly reduce volatilization and evaporation losses. Diverting precipitation from manure piles or packs (such as in dry lot situations) also reduces the amount of water entering the manure.
Microbial Decomposition and other Nutrient and Moisture TransformationsAll manures decompose during storage. Decomposition results in nutrient transformations and losses and, for solid manures, reductions in moisture content and volume.
Solid manures tend to lose volume during storage, primarily due to losses of water and carbon (C, as carbon dioxide, CO2). Moisture losses are not always apparent because manure that is stored outdoors is exposed to precipitation. Larney et al. (2006) compared the chemical characteristics of fresh beef cattle manure to manure that had been stockpiled for 100 to 155 days in Lethbridge, Alberta and Brandon, Manitoba. Manure was stockpiled at each location annually for three years. The average concentrations of manure constituents over the three year study are shown in Table 1 for fresh and stockpiled manure at each site. The stockpiled manure at Lethbridge was drier than the fresh manure but these differences were not significant at Brandon, partly due to the much higher summer precipitation at the Brandon site. Although there was little change in the concentration of C, the stockpiles were smaller and, therefore, the total amount of C was less than in the fresh manure (data not shown). The authors attributed this to the decomposition and loss of labile C as CO2 during stockpiling. Stockpiling also resulted in a lower C:N ratio at the Brandon site but not at Lethbridge.
Table 1 | Effect of stockpiling on the concentrations of total C, total N, inorganic N and total P and C:N ratios (wet weight basis) of beef cattle manure (adapted from Larney et al. 2006).
Location Age of ManureWater
%Total C
%Total Nlb/ton
Inorganic Nlb/ton
Total Plb/ton
C:NRatio
Lethbridge Fresh 57.1 12.6 14.2 2.4 3.8 17.6Stockpiled 45.9 13.2 16.0 4.2 5.0 16.3
Brandon Fresh 73.1 8.9 8.4 2.6 2.6 21.8Stockpiled 68.4 8.0 10.4 3.4 4.0 15.4
Properties of Manure | Page 5
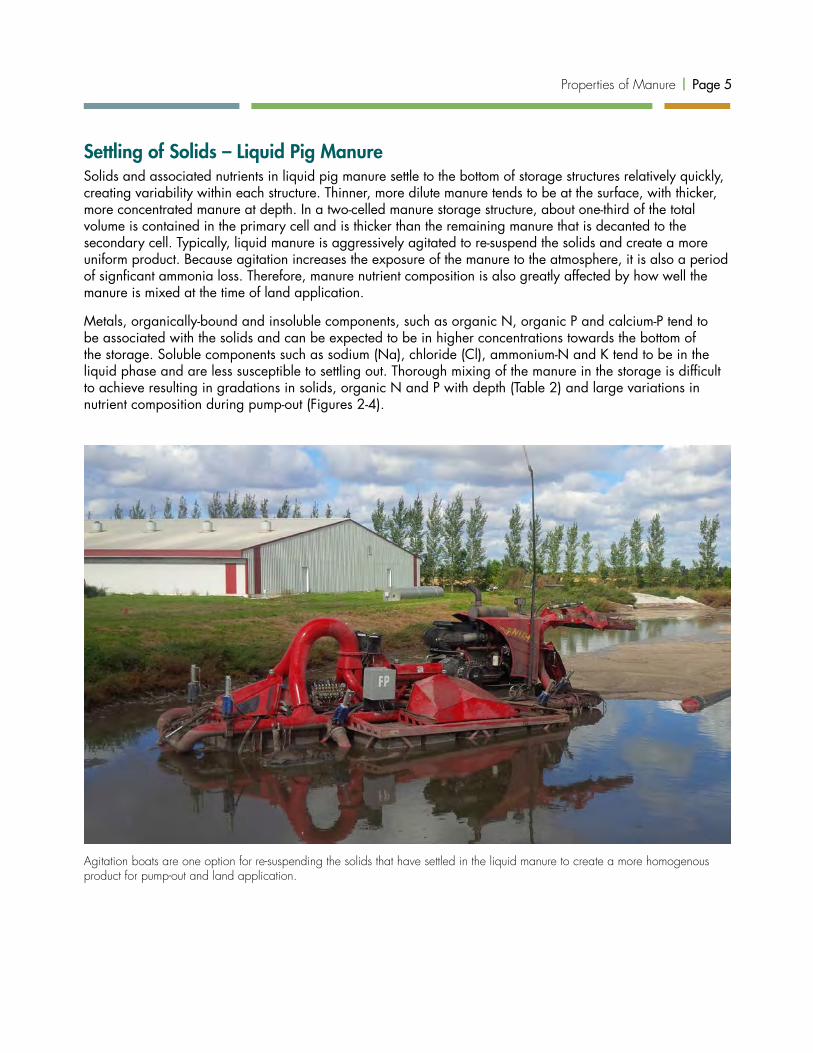
Settling of Solids – Liquid Pig ManureSolids and associated nutrients in liquid pig manure settle to the bottom of storage structures relatively quickly, creating variability within each structure. Thinner, more dilute manure tends to be at the surface, with thicker, more concentrated manure at depth. In a two-celled manure storage structure, about one-third of the total volume is contained in the primary cell and is thicker than the remaining manure that is decanted to the secondary cell. Typically, liquid manure is aggressively agitated to re-suspend the solids and create a more uniform product. Because agitation increases the exposure of the manure to the atmosphere, it is also a period of signficant ammonia loss. Therefore, manure nutrient composition is also greatly affected by how well the manure is mixed at the time of land application.
Metals, organically-bound and insoluble components, such as organic N, organic P and calcium-P tend to be associated with the solids and can be expected to be in higher concentrations towards the bottom of the storage. Soluble components such as sodium (Na), chloride (Cl), ammonium-N and K tend to be in the liquid phase and are less susceptible to settling out. Thorough mixing of the manure in the storage is difficult to achieve resulting in gradations in solids, organic N and P with depth (Table 2) and large variations in nutrient composition during pump-out (Figures 2-4).
Agitation boats are one option for re-suspending the solids that have settled in the liquid manure to create a more homogenous product for pump-out and land application.
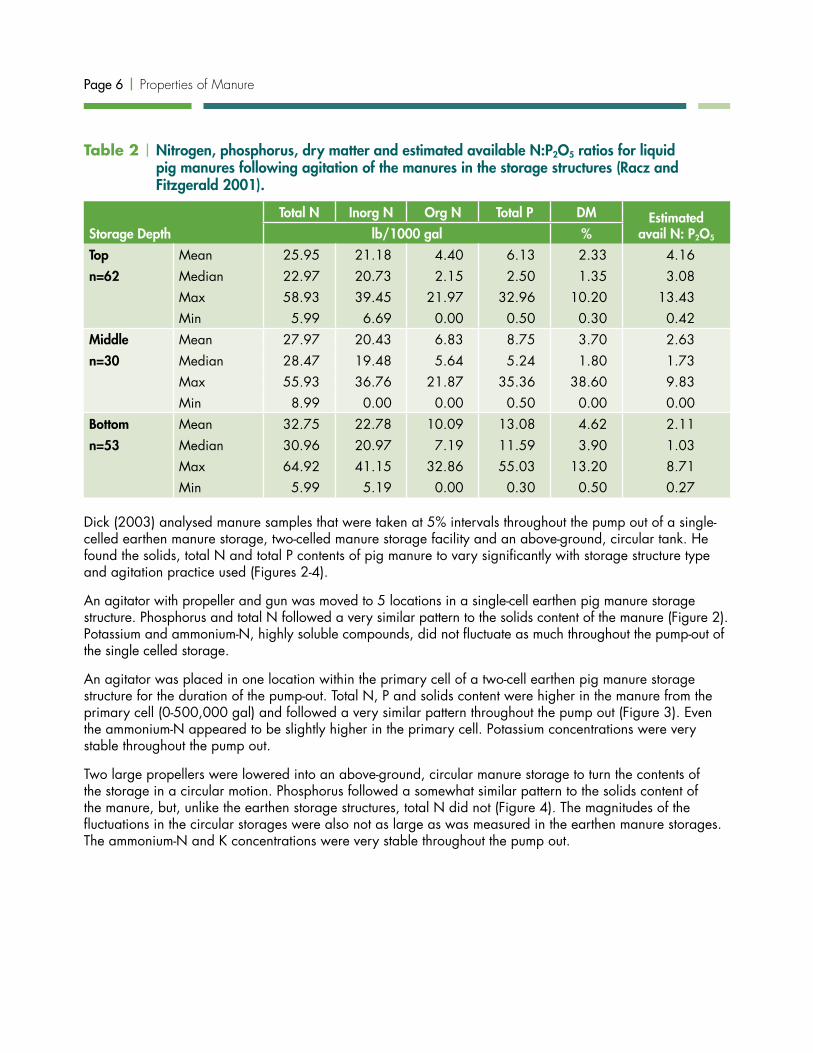
Page 6 | Properties of Manure
Table 2 | Nitrogen, phosphorus, dry matter and estimated available N:P2O5 ratios for liquid pig manures following agitation of the manures in the storage structures (Racz and Fitzgerald 2001).
Storage DepthTotal N Inorg N Org N Total P DM Estimated
avail N: P2O5lb/1000 gal %Top Mean 25.95 21.18 4.40 6.13 2.33 4.16n=62 Median 22.97 20.73 2.15 2.50 1.35 3.08
Max 58.93 39.45 21.97 32.96 10.20 13.43Min 5.99 6.69 0.00 0.50 0.30 0.42
Middle Mean 27.97 20.43 6.83 8.75 3.70 2.63n=30 Median 28.47 19.48 5.64 5.24 1.80 1.73
Max 55.93 36.76 21.87 35.36 38.60 9.83Min 8.99 0.00 0.00 0.50 0.00 0.00
Bottom Mean 32.75 22.78 10.09 13.08 4.62 2.11n=53 Median 30.96 20.97 7.19 11.59 3.90 1.03
Max 64.92 41.15 32.86 55.03 13.20 8.71Min 5.99 5.19 0.00 0.30 0.50 0.27
Dick (2003) analysed manure samples that were taken at 5% intervals throughout the pump out of a single-celled earthen manure storage, two-celled manure storage facility and an above-ground, circular tank. He found the solids, total N and total P contents of pig manure to vary significantly with storage structure type and agitation practice used (Figures 2-4).
An agitator with propeller and gun was moved to 5 locations in a single-cell earthen pig manure storage structure. Phosphorus and total N followed a very similar pattern to the solids content of the manure (Figure 2). Potassium and ammonium-N, highly soluble compounds, did not fluctuate as much throughout the pump-out of the single celled storage.
An agitator was placed in one location within the primary cell of a two-cell earthen pig manure storage structure for the duration of the pump-out. Total N, P and solids content were higher in the manure from the primary cell (0-500,000 gal) and followed a very similar pattern throughout the pump out (Figure 3). Even the ammonium-N appeared to be slightly higher in the primary cell. Potassium concentrations were very stable throughout the pump out.
Two large propellers were lowered into an above-ground, circular manure storage to turn the contents of the storage in a circular motion. Phosphorus followed a somewhat similar pattern to the solids content of the manure, but, unlike the earthen storage structures, total N did not (Figure 4). The magnitudes of the fluctuations in the circular storages were also not as large as was measured in the earthen manure storages. The ammonium-N and K concentrations were very stable throughout the pump out.

Properties of Manure | Page 7
0
5
10
15
20
25
30
35
40
45
50
55
60
65
Nut
rient
s (lb
/100
0 ga
l)
1665 126566 255631 376369 509596 626171 751072 875973
Imperial Gallons
Total Nitrogen Ammonium – N PhosphorusPotassium Dry Matter
Dry
Mat
ter (
%)
Single Cell Earthen Storage
-1
1
3
5
7
9
11
13
15
0
5
10
15
20
25
30
35
40
45
50
55
60
65
Nut
rient
s (lb
/100
0 ga
l)
0 245639 499933 747741 1002773 1249693 1498896
Imperial Gallons
Total Nitrogen Ammonium – N PhosphorusPotassium Dry Matter
Dry
Mat
ter (
%)
Two Cell Earthen Manure Storage
-1
1
3
5
7
9
11
13
15
Figure 2 | Variation in nutrient concentrations in liquid pig manure during pumpout from a single cell earthen manure storage (Dick 2003).
Figure 3 | Variation in nutrient concentrations in liquid pig manure during pumpout from a two cell earthen manure storage (Dick 2003).

Page 8 | Properties of Manure
0
5
10
15
20
25
30
35
40
45
50
55
60
65
-1
1
3
5
7
9
11
13
15
Nut
rient
s (lb
/100
0 ga
l)
0 250328 507098 752737 999117 1248553 1499523
Imperial Gallons
Total Nitrogen Ammonium – N PhosphorusPotassium Dry Matter
Dry
Mat
ter (
%)
Circular Above GroundTank
Figure 4 | Variation in nutrient concentrations in liquid pig manure during pumpout from a circular, above-ground manure storage (Dick 2003).
Manure Sampling and AnalysisA reliable, operation-specific database developed from a sound, long-term sampling program is the preferred source of manure nutrient estimates. Due to the inherent variability of manure, a single manure sample is unlikely to provide an accurate estimate of the nutrients throughout the pump out of a liquid manure storage structure or from a large stockpile of solid manure. A number of samples, properly collected over a number of years will provide a picture of the typical nutrient concentrations in manure. The data collected over several years can be used to generate reasonably accurate, on-farm estimates of the nutrient content to calculate application rates. Any changes in feed, barn management, manure handling or weather should be taken into account when using farm-specific data to generate manure nutrient content estimates.
Manure samples are often taken just prior to or during manure application and the nutrient analyses are not available for use in calculating application rates. In these situations, the operation-specific database can be used to estimate the nutrient content and determine the manure application rate. The actual rate of nutrients applied can be back-calculated once the results are received from the lab. The quality of the results relies on a representative sample being taken of the manure that was land applied.
General Guidelines for Sampling Manure Sampling supplies and shipping instructions are available upon request from accredited laboratories providing manure analysis services. Supplies can consist of jars, bags and submission forms.
1. Clearly label all sample jars with the farm name, date, time, pump-out stage and any other necessary information. If also using an in-field test kit, the results of the test kit can be put on the sampling jar for

Properties of Manure | Page 9
comparison with the laboratory results later.
2. Do not completely fill sample containers with manure. Particularly with liquid manure, leave a few inches of unfilled volume to allow for accumulation of manure gases.
3. Use secondary containment to reduce the risk of leakage. Use at least one tight-sealing bag to hold the primary sample container, be it a jar or bag.
4. Prepare a submission form for each sample indicating the desired analytical package or a quote/job number.
5. Keep samples cool until they are sent for analysis. Coolers and ice packs are particularly important when sampling during warm weather in order to maintain sample integrity.
6. Send samples with accompanying submission forms for analysis as soon as possible following their collection. Avoid shipping near the end of a week so that samples do not sit in a warm storage area over a weekend. Samples should not be allowed to spend more than forty-eight hours in transit. Freeze samples in advance of shipping if any delays are expected.
7. As deemed appropriate, record notes about each sample. At a minimum, identify the operation, source of the manure, date and time of sampling and stage of pump-out (early/mid/late or volume pumped) for liquid manure. Also record the circumstances of sampling, particularly any deviations from the sampling protocol. These notes can confirm that the sampling was done properly and aid in the interpretation of results. Additional questions to address in the notes as appropriate include:• Was the manure agitated? Was agitation partial/thorough/complete?• Is the storage system single or multi-celled? • Was the storage partially or fully emptied? • Was the storage partially or fully emptied historically? • Where were the samples taken? • Has the pile been mixed? How well?• How much bedding is in the pile?• Which field was the manure applied to?
The number of samples necessary to properly characterize the manure will depend on a variety of factors and will increase as variability increases. Manure is inherently so variable that very precise characterization throughout the pump-out of a manure storage structure or for a large stockpile of solid manure would necessitate a very large number of samples and is not required in most cases. The actual number of samples taken is a compromise between precision, accuracy, logistics, end-use and cost.
Ensure that space is left in a liquid manure sample jar to allow for build up of manure gases and take steps to maintain sample integrity, such as cool storage, until samples are shipped to the lab.
Page 10 | Properties of Manure
Biosecurity – Individuals that enter livestock farms to take manure samples should first receive training in biosecurity including awareness of the national biosecurity standards. Biosecurity protocols that meet or exceed national standards must be followed while on the farm.
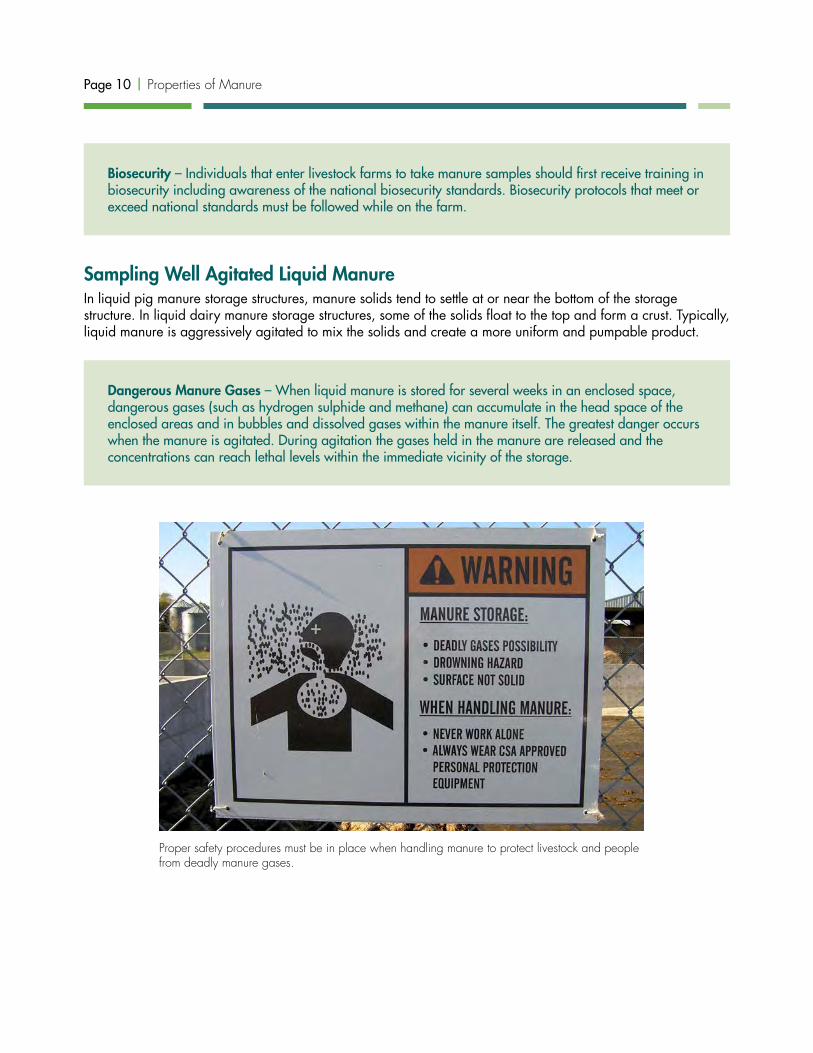
Sampling Well Agitated Liquid ManureIn liquid pig manure storage structures, manure solids tend to settle at or near the bottom of the storage structure. In liquid dairy manure storage structures, some of the solids float to the top and form a crust. Typically, liquid manure is aggressively agitated to mix the solids and create a more uniform and pumpable product.
Dangerous Manure Gases – When liquid manure is stored for several weeks in an enclosed space, dangerous gases (such as hydrogen sulphide and methane) can accumulate in the head space of the enclosed areas and in bubbles and dissolved gases within the manure itself. The greatest danger occurs when the manure is agitated. During agitation the gases held in the manure are released and the concentrations can reach lethal levels within the immediate vicinity of the storage.
Proper safety procedures must be in place when handling manure to protect livestock and people from deadly manure gases.

Properties of Manure | Page 11
Even aggressive agitation, however, is unlikely to completely homogenize all of the manure in most liquid manure storage structures. Complete mixing is particularly challenging with earthen storage structures due to the shape of the storage, the need to maintain the integrity of the liner and berms, the very large volumes of manure and the difficulty in accessing all parts of the storage with agitation equipment.
Some variability in manure composition can be expected as the liquid manure storage structure is emptied, even with very well agitated manure. It is important to recognize and account for this variability when establishing the sampling protocol and interpreting the analytical results.
Agitation typically occurs just before and during manure pumping and land application operations. Therefore, a tap located at the main pump-out station may be the best place to collect samples. At a minimum, 3 to 5 manure samples should be taken at various intervals during the pump-out such as the beginning, middle and end. More intervals may be desired if dramatic changes in thickness (i.e. solids content) are observed.
If changes in the solids content are observed for each sampling interval, it is recommended that a separate composite sample for each interval (beginning, middle and end) be analysed. The results from the various intervals allow the agronomist or producer to back-calculate the actual nutrient application rates for different fields or areas of the field. This is particularly helpful in the management of soils with varying levels of phosphorus.
If the manure is very well agitated and very little variability in solids is observed between the sampling intervals, a composite sample can be created for the entire manure storage.
A composite sample of liquid manure is formed by
i) collecting three or more individual samples at a given stage of the pump-out (e.g. early, mid and late in the process)
ii) combining the individual samples in one container (e.g. five-gallon pail)
iii) mixing the contents, and then
iv) filling one sample container for shipment to the lab.
Sampling Partially Agitated Liquid ManureMany of the principles that apply to sampling well agitated manure also apply to partially agitated manure. However, without aggressive agitation, the variability of the manure as it is pumped out will be much higher. Therefore, in order to estimate the quantity of nutrients being land applied, a larger number of composite samples will likely have to be analysed than when the manure is well agitated.
The natural settling of solids in manure storage structures, particularly liquid pig manure storage structures, could be exploited to maximize the separation of phosphorus in order to minimize the amount of P that is applied to fields that are elevated in soil test P. Agitation and pumping could be modified so that dilute manures, that are lower in P, are targeted at lands that are higher in soil test P. Thicker manures, that are higher in P, can then be transported more economically to lands that are lower in soil test P and often further away.
The nutrient variability and content of partially or unagitated manure could be captured by establishing a regular sampling frequency throughout the pump-out. Samples could be collected at particular intervals measured in time (minutes) or depth (feet or metres) as pumping progresses. The analytical results for each interval should reflect the nutrient concentrations of the manure being applied at that time/depth.
Page 12 | Properties of Manure
Alternatively, sampling could be triggered by a change in application field or changes in the manure as it is being pumped and when agitation equipment is introduced or moved. This requires someone to monitor the manure throughout the pumpout in order to decide when best to take the samples.
The sampling protocol used and conditions encountered should be recorded as they will be necessary in order to properly interpret the results.
Sampling Manure from Multi-Celled SystemsManure in the primary cell of a multi-celled storage will have higher solids content than that contained in the secondary cell. Typically, the manure is agitated in and pumped from the primary cell. As pumping progresses, dilute manure from the secondary cell is back-flushed into the primary cell to dilute and homogenize the manure in the primary cell.
As with single-celled manure storage structures, sampling should occur at numerous intervals throughout the pumpout. A composite sample of the manure should be taken at the beginning with additional composite samples taken when manure from the second cell is introduced and towards the end of the pump-out when it is primarily manure from the second cell.
As with unagitated or partially agitated manure, the natural settling of solids in the primary cell could be managed to concentrate phosphorus for more economical transport to fields that are lower in soil test P. At some point, however, the sludge at the bottom of the primary cell will be too thick to pump and manure from the second cell will have to be introduced and agitated to create a pumpable product. Once the manure originally from the primary cell has been removed, the very dilute manure in the second cell could be reserved for land that is elevated in soil test P.
Sampling Solid ManureSolid manure can be sampled directly from manure piles, packs or housing areas. Manure should be taken from several depths and locations throughout the pile or pack using a fork or spade. If only a portion of the stockpile is to be spread, only that portion of the pile need be sampled.
As with liquid manure, the composite solid manure sample should reflect the manure to be land applied. The variability of the solid manure pile will be influenced by how the animals are managed, the type and quantity of bedding used, the age of the pile and whether or not the pile has been mixed. Visual differences in the manure pile or pack can be accounted for when compositing the samples and determining the total number of samples to analyze. Areas that are dominated by bedding can be sampled separately or avoided entirely.
It may also be possible to capture significant changes in livestock management, such as changes in feed, in the manure sampling strategy. For instance, on layer farms the manure is increasingly being managed as a solid and stored in enclosed structures. As the birds grow, the ration changes. It may be possible to capture this change by sampling different parts of the manure pile separately, provided that the manure is going to be land applied separately and not mixed prior to application.
An alternative to sampling the solid manure pile is to collect the sample directly from the manure spreader just prior to application in the field. Single samples can be taken from each of several spreader loads using a fork or spade. The number of spreader loads that must be sampled in order to obtain a representative composite sample will depend on the total amount of manure that is to be spread and the variability between loads. Separate composite samples could be made when there appears to be large differences between the loads, when the application field changes or simply at the beginning, middle and end of the application process.

Properties of Manure | Page 13
The laboratory only requires a small amount of manure for analysis. Creating a composite sample that represents the entire supply of manure is very challenging. Properly mixing the sub-samples to create the composite samples can be difficult compared to mixing liquid manure. One technique used to composite solid manure is the cone and quarter method, as follows:
1. Combine all of the solid manure samples removed from the pile or pack on a plastic sheet or cement pad and mix thoroughly, chopping large chunks with a fork or spade.
2. Divide the well-mixed manure into four portions.
3. Discard two of the four portions.4. Combine the remaining two portions and mix.5. Repeat steps 2, 3 and 4 until the remaining sample is small enough to subsample and send for analysis.
Laboratory Analyses for ManureNutrient analyses must be expressed on a wet weight or as is basis in order to calculate manure application rates. If manure analyses are expressed on a dry weight basis, they must be converted into a wet weight basis prior to calculating appropriate rates of manure application.
The following laboratory analyses are considered the most important in a basic manure analysis:
• Moisture or dry matter content• Total N• Ammonium N• Total P• Total K
Other analyses may be offered by a lab, either individually or as part of a package. Beyond unusual circumstances, they are often not necessary for nutrient management planning in Manitoba. These include:
• Total soluble salts measured as electrical conductivity (EC)• pH• sulphur (S), calcium (Ca), magnesium (Mg), and Na• micronutrients such as Cl, Cu, Mn, Zn and iron (Fe)• C
It can be very difficult to get a representative sample of solid manure.

Page 14 | Properties of Manure
Carbon may be of interest when analysing solid manure in order to determine the C:N ratio. Carbon is typically included in compost analytical packages but not manure testing. If C is desired, it can often be added by special request.
Rapid In-Field Testing of Liquid ManureIn-field test kits for ammonium-N are often used to adjust liquid manure application rates at the time of application. Using these kits, in-field estimates can be obtained relatively quickly and inexpensively before the laboratory analyses are available and right when manure is being land applied.
When using an in-field test kit, it is very important that the kit instructions be followed and that the equipment be properly calibrated and maintained. It should be noted that many in-field tests for available N only work well on manures with low solids contents. The results of the in-field test should always be confirmed with a laboratory manure analysis. An in-field test result can be recorded on the sample jar for comparison to the laboratory result later.
The following devices have been marketed to measure ammonium N in liquid manure: the Novameter, ammonia electrode, conductivity meter, conductivity pen, quantofix-N-volumeter and reflectometer. The conductivity meter and pen can also perform indirect measurements of the K ion; however, interference by other ions can reduce accuracy.
The hydrometer method indirectly estimates organic N and total P by measuring the specific gravity of the manure. The premise is based on the tendency for the organic N and most of the P in liquid manure to be associated with the solid fraction. As it is the ammonium form of N that is typically of most interest in managing liquid manure, the specific gravity field test is of little value to N management.
The strong association between P and the solids content of manure indicates greater potential for use of the hydrometer method for P management. Manitoba Agriculture, Food and Rural Development (MAFRD) found reasonably strong relationships between hydrometer readings and P content in liquid sow manure and finisher manure (unpublished data). By contrast, hydrometer readings did not correlate well with P levels in manure from nursery operations.
Accurate, in-field determination of the P content in manure would improve nutrient management. While the literature and MAFRD work indicate some potential for determining P in liquid pig manure using the field hydrometer, site-specific relationships must be established for greater confidence in the method.
The Agros Nova N meter rapidly estimates the available N content of liquid manure in the field. A chemical reaction is created to evolve ammonia gas which is measured by an attached gauge.

Properties of Manure | Page 15
Composition of Typical Manures in ManitobaBook ValuesWhen a reliable, on-farm database of manure analyses does not exist, the book values for manure nutrients provided below can be used to calculate manure application rates. Tables 3a to 3d represent 2,703 liquid pig manure samples collected from 2010 to 2014 as part of annual manure management planning by Agra-Gold Consulting in Manitoba. These data have been organized by pig operation type (sow, nursery, feeder and farrow to finish) as well as by dry matter (DM) intervals (less than two per cent, two to four per cent and greater than four per cent). The DM intervals were established to group the manures according to increasing thickness. Table 4 is a summary of nutrient analyses for dairy manures taken from the Manitoba Manure Application Rate Calculator (MARC 2008). Table 5 contains manure analyses for 93 solid beef manures collected in Manitoba (Loro 2005) and Table 6 reflects 49 Manitoba layer manures (MAFRD unpublished data).
Tables 3 to 6 show the mean, median, maximum and minimum nutrient concentrations, dry matter contents and N to P2O5 ratios. Mean and median values are used to estimate typical nutrient concentrations in manure. The mean is the mathematical average of the data set, whereas the median is the middle value in the data set. If there are a few very high values in the dataset, the mean may overestimate the average and the median may be more indicative of a typical value. The range of the dataset is represented by the maximum and minimum values.
The nutrient analyses provided in Tables 3 to 6 are expressed on a “wet weight” or “as is” basis.
Table 3a | Means, medians, maximums and minimums for total N, ammonium, organic N P, K, S, DM and available N:P2O5 ratios for liquid pig manure from sow operations.
Sow OperationsTKN NH4-N Org N P K S DM avail N:
P2O5lb/1000 gal %All Mean 20.9 14.6 6.4 5.6 8.9 1.4 1.9 1.7n=772 Median 19.0 14.0 5.0 3.6 8.3 1.0 1.3 0.8
Max 58.0 34.0 32.0 43.7 68.3 7.5 12.0 55.6Min 2.5 0.5 0.0 0.0 0.8 0.04 0.3 0.1
<2% DM Mean 16.5 12.6 3.9 2.4 8.5 0.8 1.0 2.3n=526 Median 16.0 12.0 4.0 1.8 8.3 0.7 0.9 1.5
Max 35.0 30.0 18.0 8.3 18.3 2.0 1.9 55.6Min 2.5 0.5 0.0 0.0 0.8 0.0 0.3 0.2
2-4% DM Mean 25.9 17.2 8.6 9.0 9.0 2.1 2.8 0.5n=162 Median 26.0 17.0 9.0 8.7 9.2 2.1 2.7 0.4
Max 41.0 28.0 22.0 15.3 22.5 3.8 4.0 1.3Min 12.0 8.8 0.0 4.0 3.8 1.1 2.0 0.2
>4% DM Mean 38.8 21.4 17.3 19.5 11.3 4.1 6.0 0.3n=84 Median 39.0 21.0 17.0 18.3 10.4 3.8 5.7 0.3
Max 58.0 34.0 32.0 43.7 68.3 7.5 12.0 0.8Min 17.0 10.0 5.0 6.6 5.8 2.1 4.1 0.1
Page 16 | Properties of Manure
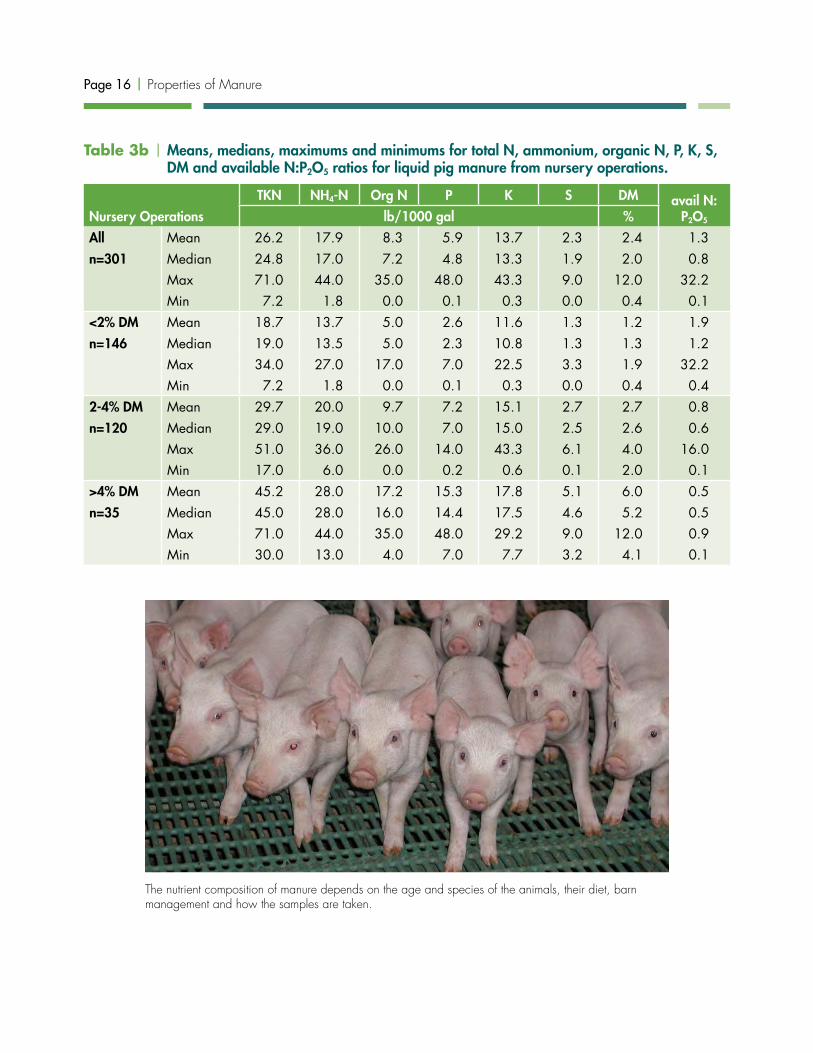
Table 3b | Means, medians, maximums and minimums for total N, ammonium, organic N, P, K, S, DM and available N:P2O5 ratios for liquid pig manure from nursery operations.
Nursery OperationsTKN NH4-N Org N P K S DM avail N:
P2O5lb/1000 gal %All Mean 26.2 17.9 8.3 5.9 13.7 2.3 2.4 1.3n=301 Median 24.8 17.0 7.2 4.8 13.3 1.9 2.0 0.8
Max 71.0 44.0 35.0 48.0 43.3 9.0 12.0 32.2Min 7.2 1.8 0.0 0.1 0.3 0.0 0.4 0.1
<2% DM Mean 18.7 13.7 5.0 2.6 11.6 1.3 1.2 1.9n=146 Median 19.0 13.5 5.0 2.3 10.8 1.3 1.3 1.2
Max 34.0 27.0 17.0 7.0 22.5 3.3 1.9 32.2Min 7.2 1.8 0.0 0.1 0.3 0.0 0.4 0.4
2-4% DM Mean 29.7 20.0 9.7 7.2 15.1 2.7 2.7 0.8n=120 Median 29.0 19.0 10.0 7.0 15.0 2.5 2.6 0.6
Max 51.0 36.0 26.0 14.0 43.3 6.1 4.0 16.0Min 17.0 6.0 0.0 0.2 0.6 0.1 2.0 0.1
>4% DM Mean 45.2 28.0 17.2 15.3 17.8 5.1 6.0 0.5n=35 Median 45.0 28.0 16.0 14.4 17.5 4.6 5.2 0.5
Max 71.0 44.0 35.0 48.0 29.2 9.0 12.0 0.9Min 30.0 13.0 4.0 7.0 7.7 3.2 4.1 0.1
The nutrient composition of manure depends on the age and species of the animals, their diet, barn management and how the samples are taken.

Properties of Manure | Page 17
Table 3c | Means, medians, maximums and minimums for total N, ammonium, organic N, P, K, S, DM and available N:P2O5 ratios for liquid pig manure from feeder operations.
Feeder OperationsTKN NH4-N Org N P K S DM avail N:
P2O5lb/1000 gal %All Mean 35.0 25.9 9.1 7.4 14.1 2.9 3.7 1.6n=973 Median 34.0 25.0 7.5 6.1 13.3 2.4 2.9 0.8
Max 83.0 51.0 41.0 52.4 125.0 14.0 14.0 48.2Min 5.0 0.2 0.0 0.1 1.0 0.0 0.1 0.1
<2% DM Mean 22.5 18.9 3.7 1.8 11.9 1.2 1.3 3.4n=309 Median 22.4 19.0 3.5 1.6 11.7 1.0 1.2 2.4
Max 50.0 32.0 27.0 7.0 23.3 5.0 1.9 48.2Min 5.0 4.2 0.0 0.1 1.1 0.0 0.1 0.5
2-4% DM Mean 32.8 25.0 7.7 6.4 14.1 2.5 2.9 0.9n=323 Median 33.0 25.0 7.0 6.1 13.3 2.2 2.8 0.8
Max 51.0 41.0 34.8 52.4 125.0 14.0 4.0 7.3Min 16.0 0.2 0.0 0.5 1.0 0.2 2.0 0.1
>4% DM Mean 48.3 33.1 15.2 13.3 16.2 4.9 6.6 0.6n=341 Median 47.6 32.0 15.0 12.7 15.8 4.5 6.1 0.6
Max 83.0 51.0 41.0 34.9 35.0 11.0 14.0 1.5Min 27.0 13.0 1.0 3.6 8.1 1.9 4.1 0.2
Table 3d | Means, medians, maximums and minimums for total N, ammonium, organic N, P, K, S, DM and available N:P2O5 ratios for liquid pig manure from farrow to finish operations.
Farrow to Finish Operations
TKN NH4-N Org N P K S DM avail N: P2O5lb/1000 gal %
All Mean 26.9 18.7 8.2 6.2 11.4 1.8 2.2 1.9n=118 Median 26.0 18.0 7.0 5.0 11.7 1.5 1.7 0.8
Max 67.0 35.0 37.0 43.7 17.5 9.1 10.0 12.5Min 7.0 3.9 0.0 0.1 1.4 0.3 0.5 0.2
<2% DM Mean 20.6 15.0 5.5 2.6 10.9 1.0 1.1 2.7n=68 Median 19.0 14.5 5.5 1.9 10.8 0.9 1.0 1.4
Max 32.0 27.0 15.2 7.0 15.8 2.0 1.9 12.5Min 7.0 3.9 0.0 0.1 3.7 0.3 0.5 0.4
2-4% DM Mean 31.9 22.8 9.1 8.6 12.3 2.3 2.8 0.6n=37 Median 32.0 22.0 9.0 8.3 13.3 2.3 2.8 0.6
Max 43.5 35.0 16.0 14.0 17.5 4.2 4.0 1.0Min 18.0 8.9 0.0 4.80 5.8 1.3 2.0 0.2
>4% DM Mean 45.5 26.4 19.1 17.7 11.5 4.5 6.3 1.0n=13 Median 45.0 30.0 17.0 18.8 12.5 4.6 5.7 0.3
Max 67.0 34.0 37.0 43.7 16.7 9.1 10.0 5.4Min 31.0 16.0 8.6 1.2 1.4 0.5 4.2 0.2

Page 18 | Properties of Manure
Table 4 | Means, medians, maximums and minimums for total N, ammonium, organic N, P, K and estimated1 available N:P2O5 ratios for liquid, semi-solid and solid dairy manures.
Liquid Dairy ManureTKN NH4-N Org N P K DM avail N:
P2O5lb/1000 gal %1 to <5% DM Mean 20.6 11.9 8.8 5.2 20.2 3.0 1.6n=41 Median 20.0 9.6 8.3 4.0 18.0 3.0 1.3
Max 47.0 38.7 20.5 50.0 59.0 4.9 4.6Min 7.0 3.4 3.3 1.0 3.0 1.0 0.2
5 to <12% DM Mean 31.8 15.1 16.7 7.4 29.1 7.5 1.3n=150 Median 31.0 15.0 15.8 7.0 28.0 7.3 1.2
Max 72.0 37.5 56.2 63.0 76.0 11.4 8.9Min 13.0 0.7 0.5 1.0 4.0 5.0 0.1
Semi-solid Dairy ManureTKN NH4-N Org N P K DM avail N:
P2O5lb/ton %12 to < 22% DM Mean 10.4 3.0 7.3 3.3 9.8 17.1 0.9n=71 Median 10.4 2.8 7.6 2.6 9.0 16.8 0.8
Max 15.6 14.3 12.0 17.0 23.8 21.7 2.6Min 4.2 0.0 0.9 1.0 0.4 12.0 0.1
Solid Dairy ManureTKN NH4-N Org N P K DM avail N:
P2O5lb/ton %>=22% Mean 11.5 2.3 9.2 3.2 9.0 26.3 0.8n=20 Median 11.4 2.0 8.8 2.8 8.6 24.9 0.8
Max 16.4 6.0 15.1 11.8 17.8 37.6 2.3Min 6.6 0.0 3.3 1.0 2.6 22.0 0.2
1 Available N is estimated to be all of the ammonium-N plus 25 per cent of the organic N. Recent research has shown that the available N in solid pig, dairy and beef manures with straw bedding is often much less and may be zero in the first years following manure application.
Table 5 | Means, medians, maximums and minimums for total N, ammonium, organic N, P, K, S and estimated1 available N:P2O5 ratios for solid beef manures.
Solid Beef ManureTKN NH4-N Org N P K S DM avail N:
P2O5lb/ton %n=93 Mean 10.6 1.5 9.0 2.0 10.5 1.8 26.1 1.0
Median 10.3 1.2 8.8 1.9 9.10 1.5 24.7 0.8Max 16.9 8.5 15.3 7.0 37.2 8.9 50.2 3.5Min 5.4 0.0 2.9 0.6 3.3 0.1 14.3 0.2
1 Available N is estimated to be all of the ammonium-N plus 25 per cent of the organic N. Recent research has shown that the available N in solid pig, dairy and beef manures with straw bedding is often much less and may be zero in the first years following manure application.

Properties of Manure | Page 19
Table 6 | Means, medians, maximums and minimums for total N, ammonium, organic N, P, K, S and available N:P2O5 ratios for liquid and solid layer manures.
Liquid Layer ManureTKN NH4-N Org N P K S DM avail N:
P2O5lb/1000 gal %n=39 Mean 81.9 59.9 22.0 24.9 28.0 7.1 8.9 1.3
Median 84.0 59.0 20.0 25.0 29.0 7.0 8.5 1.1Max 115.0 88.0 42.0 45.0 43.0 11.0 17.7 2.6Min 47.0 29.0 10.0 8.0 11.0 3.0 3.2 0.6
Solid Layer ManureTKN NH4-N Org N P K S DM avail N:
P2O5lb/ton %n=10 Mean 46.4 27.1 19.3 17.1 14.6 3.7 35.1 0.9
Median 46.9 26.4 16.4 15.0 12.6 3.5 34.0 0.9Max 55.7 36.9 42.0 25.4 26.6 5.2 51.3 1.3Min 36.5 13.4 10.1 12.4 8.0 2.0 23.4 0.4
Moisture and Dry Matter ContentThe moisture or dry matter (DM) content of manure determines whether the manure will be managed as a solid or a liquid. Moisture content is routinely measured in the lab. As can be seen for the liquid pig manure analyses (Tables 3a-3d), nutrient content often increases with increasing dry matter content, particularly for phosphorus.
NitrogenNitrogen is an essential building block of proteins and nucleic acids. It is contained in many inorganic and organic compounds and comprises approximately 80% of the earth’s atmosphere. Nitrogen is required by crops in large amounts and is often deficient in agricultural soils, limiting yield.
Although all manures contain N, some manures are better N fertilizers than others depending on the quantity and form of the N in the manure. The N found in manure is primarily made up of two forms: ammonium N and organic N. Liquid manures generally contain very little or no nitrate N. Some stockpiled solid manures and composts may contain appreciable amounts of nitrate N.
• Total N is a measure of all of the N in the manure. In general, it includes ammonium N, organic N and any nitrate N that may be present. The concentrations of total N in manures are highly variable and not all of the N in manure is available for use by crops when they need it. Tables 3 to 6 illustrate the broad range of total N contents of manure.
• Ammonium N (NH4+-N)/Ammonia N (NH3-N) is a measure of the main inorganic form of N in manure.
It is derived from the conversion of urea or uric acid in the urine and the breakdown of organic N in the feces. The quantity of ammonium N in manure is of particular importance because it can be immediately available to plants, especially in liquid manures. Although there are exceptions (such as solid layer manure), in general, liquid manures tend to have much more of the total N as ammonium N than solid manures. For example, liquid pig and layer manures often have more than half of the total N in the plant-available ammonium form. Solid beef manure, on the other hand, usually contains most of the N in the organic form, often with less than 15% of the total N in the ammonium form.
Page 20 | Properties of Manure
• Nitrate N (NO3--N) is another inorganic, plant available form of N. Although soil can contain significant
quantities of nitrate N, most liquid manures contain little or no nitrate N. Stockpiled solid manures may contain significant amounts of nitrate N; however, nitrate is not routinely measured in the lab.
• Organic N is not measured directly in the lab but is estimated by the difference between the total N and ammonium N concentrations, as follows:Organic N = Total N – ammonium NOrganic N is chemically bonded to C and must be converted to inorganic N by microorganisms before it is available to plants.
Carbon to Nitrogen Ratios and Nitrogen Availability from ManureCombinations of C with hydrogen and oxygen make up a vast array of organic compounds. All manures contain C; however, the quantity and type of C in the manure is greatly influenced by the type and amount of bedding that has been added. Carbon content is also influenced by animal species, time in storage and manure processing.
Carbon content is important because it impacts the N availability of the manure significantly; however, the absolute amount of C in manure is not as meaningful as the manure’s C:N ratio. Both total N and C concentrations vary greatly among manures resulting in large variations in C:N ratios.
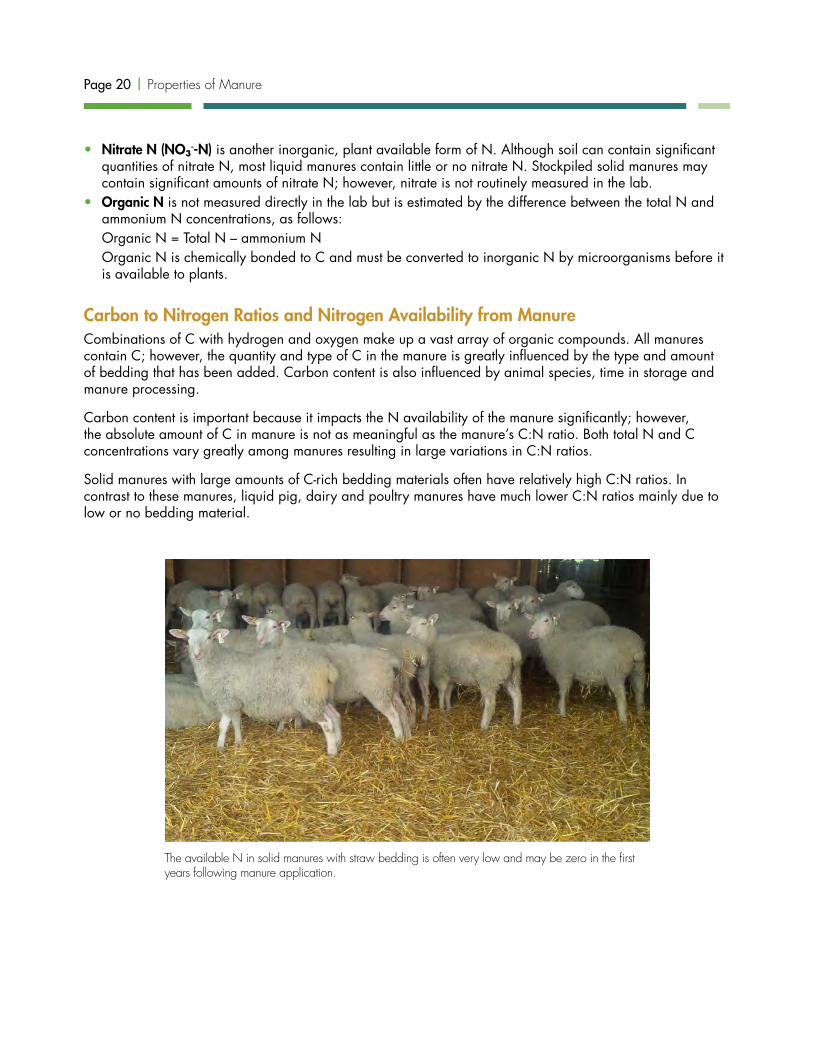
Solid manures with large amounts of C-rich bedding materials often have relatively high C:N ratios. In contrast to these manures, liquid pig, dairy and poultry manures have much lower C:N ratios mainly due to low or no bedding material.
The available N in solid manures with straw bedding is often very low and may be zero in the first years following manure application.

Properties of Manure | Page 21
Table 7 illustrates the range of C:N ratios in beef (Loro 2005) and layer manures (MAFRD unpublished data) collected in Manitoba. The C:N ratios for the layer manures are low and the range is narrow, due to the lack of C-rich bedding materials and the high N content of the manures. The C:N ratios for the beef manures were higher and the range was broader due to the addition of varying amounts of bedding for the cattle as well as the amounts of bedding in the samples sent for analyses. The distribution of C:N ratios for the beef manure samples is illustrated in Figure 5.
Table 7 | C:N Ratios for Solid and Liquid Layer Manures and Solid Beef Manure in Manitoba.
LayerSolid Beef
n=93Solid n=10
Liquidn=39
Average 4.36 3.57 14.59 Min 2.75 2.38 7.08 Max 6.41 4.44 27.62
Num
ber o
f Sam
ples
6-8
C:N Ratio
C:N Ratio of Solid Beef Manure
0
5
10
15
20
25
30
8-10 10-12 12-14 14-16 16-18 18-20 20-22 22-24 24-26 26-28
Figure 5 | Distribution of C:N ratios for 93 manure samples collected from beef cattle farms in Manitoba.
Phosphorus Forms in ManureInorganic P in the form of phosphate (PO4) is required for all known forms of life. It is required by crops in large amounts and is naturally deficient in agricultural soils, limiting yield. Manure is an excellent source of P for crops. The P found in manure is made up of two forms: organic and inorganic P. The form of P in manure influences its availability.
Page 22 | Properties of Manure
• Total P is a measure of all of the P forms contained in the manure. Commercial manure analysis packages typically include only total P. As with N, the total P content of manure is highly variable for all livestock types. Tables 3 to 6 illustrate the range in total P contents for various manure types.
• Inorganic P is a measure of the inorganic P in solution as well as P precipitates with calcium and/or magnesium. Research in Manitoba found that from about 50 to 70% of the total P in manure could be present as inorganic P (Table 8). Only the water soluble inorganic phosphate is considered to be immediately available to plants. Inorganic P is not routinely offered in commercial manure analysis packages.
• Organic P is a measure of the P that is chemically bonded to C. Organic forms of manure P include phytic acid (phytate), phospholipids and orthophosphate of mono- and di-esters. Organic P must be converted to inorganic P before it is available to plants. Organic P is not routinely offered in commercial manure analysis packages.
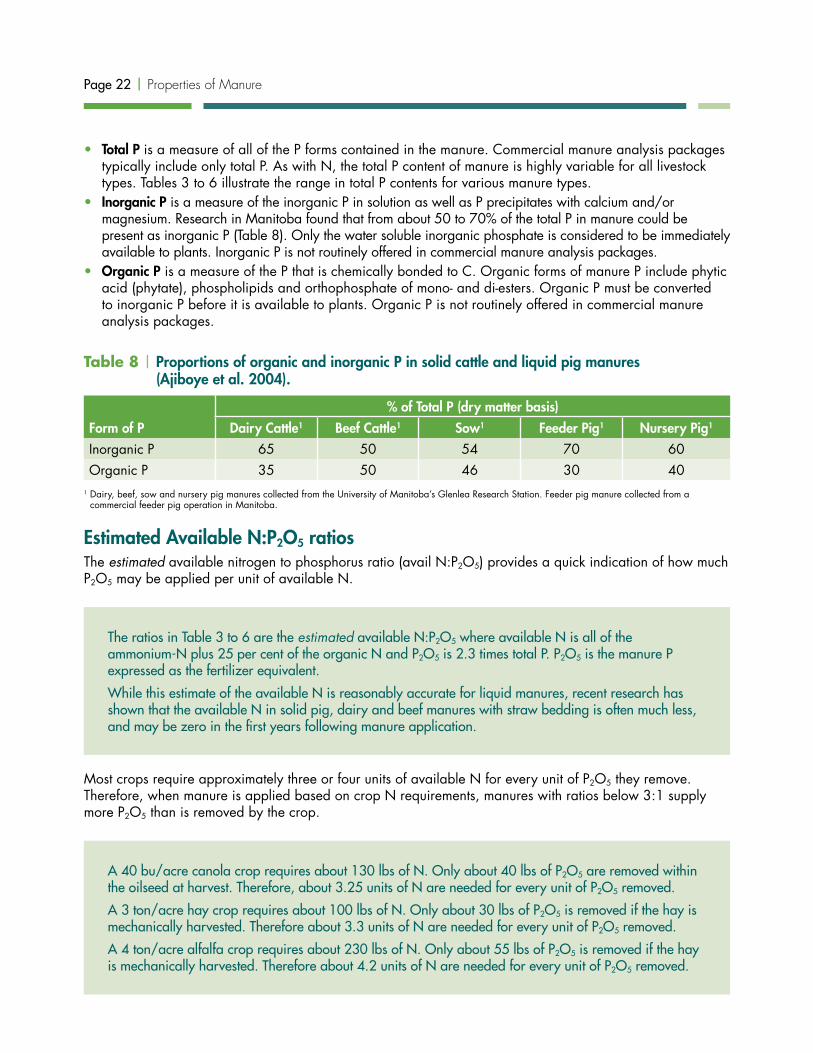
Table 8 | Proportions of organic and inorganic P in solid cattle and liquid pig manures (Ajiboye et al. 2004).
Form of P% of Total P (dry matter basis)
Dairy Cattle1 Beef Cattle1 Sow1 Feeder Pig1 Nursery Pig1
Inorganic P 65 50 54 70 60Organic P 35 50 46 30 40
1 Dairy, beef, sow and nursery pig manures collected from the University of Manitoba’s Glenlea Research Station. Feeder pig manure collected from a commercial feeder pig operation in Manitoba.
Estimated Available N:P2O5 ratiosThe estimated available nitrogen to phosphorus ratio (avail N:P2O5) provides a quick indication of how much P2O5 may be applied per unit of available N.
The ratios in Table 3 to 6 are the estimated available N:P2O5 where available N is all of the ammonium-N plus 25 per cent of the organic N and P2O5 is 2.3 times total P. P2O5 is the manure P expressed as the fertilizer equivalent.
While this estimate of the available N is reasonably accurate for liquid manures, recent research has shown that the available N in solid pig, dairy and beef manures with straw bedding is often much less, and may be zero in the first years following manure application.
Most crops require approximately three or four units of available N for every unit of P2O5 they remove. Therefore, when manure is applied based on crop N requirements, manures with ratios below 3:1 supply more P2O5 than is removed by the crop.
A 40 bu/acre canola crop requires about 130 lbs of N. Only about 40 lbs of P2O5 are removed within the oilseed at harvest. Therefore, about 3.25 units of N are needed for every unit of P2O5 removed.
A 3 ton/acre hay crop requires about 100 lbs of N. Only about 30 lbs of P2O5 is removed if the hay is mechanically harvested. Therefore about 3.3 units of N are needed for every unit of P2O5 removed.
A 4 ton/acre alfalfa crop requires about 230 lbs of N. Only about 55 lbs of P2O5 is removed if the hay is mechanically harvested. Therefore about 4.2 units of N are needed for every unit of P2O5 removed.

Properties of Manure | Page 23
Crop P2O5 removal is the amount of phosphorus removed from the field in the harvested portion of the crop.
PotassiumPotassium is necessary for the function of all living cells and is an essential component of plant nutrition. Manure is a good source of K for plant growth because it is abundant in many manures relative to crop requirements. As with the other macronutrients, there is a broad range of K contents in manure (Tables 3 to 6). The K in manure is inorganic and water soluble. Unlike some of the other manure nutrients, there are no transformations required by soil microorganisms to make K readily available for plant uptake.
Sulphur All plants require S; however, manure is not generally a good source for crop production. Although manure contains S (Tables 3a-d for pig manure), most of it is in a form that cannot be used by crops.
Manure contains S in both organic and inorganic forms. It is generally in reduced forms (e.g. sulphide-S), rather than the oxidized forms (e.g. sulphate-S) that can be used by plants. Any organic S in the manure must be converted to sulphate-S by soil microorganisms before it can be used by plants. Therefore, as much as 95 per cent of the total S in manure is not readily available to plants (Eriksen 2009). As a result, some animal manures, such as liquid pig manure, can be low in plant available S relative to N and application of synthetic S fertilizer may be necessary when manure is applied to crops grown on S deficient soils.

Page 24 | Properties of Manure
Micronutrients and Other Trace Elements in ManureA trace element is a chemical element that is present in minute quantities in the environment. Micronutrients such as copper (Cu), manganese (Mn), zinc (Zn), cobalt (Co), molybdenum (Mo) and boron (B) are trace elements that are required by plants or animals in small amounts (generally less than 1 lb per acre in the case of crops). Each micronutrient has a range of safe and sufficient intake. Intake in excess of this range may be toxic and intake below this range may cause deficiency problems. The range of optimal intake for each micronutrient is specific to each plant or animal. Application of micronutrients to soil can have beneficial effects on crop yield and/or quality when added in small amounts to deficient soils.
In contrast, trace elements such as cadmium (Cd), lead (Pb) and mercury (Hg) have no biological function in plants and animals and application of these metals to soil has no beneficial effects on crops and can have deleterious effects when added in excess.
Sheppard and Sanipelli (2012) measured about 60 elements in 124 manure or fecal samples from broiler, layer, turkey, pig, dairy and beef operations in Manitoba (Appendix 1). In general, these authors found that the manure from juvenile and growing stock often had higher trace element concentrations than the manure from mature animals. The fecal pats from beef cattle had lower concentrations of trace elements than were measured in the dry matter of swine or poultry manure. For the pig operations, manures from nursery barns were found to have higher dry matter concentrations of Cu and Zn than the manures from feeder or sow barns. This was because the weanling pigs were fed Cu and Zn to support intestinal function.
Concentrations of micronutrients and other trace elements in manures are a function of the concentrations in the diet. Livestock generally absorb very little of the trace elements in their feed but they use a relatively large proportion of the energy and protein. This concentrates the trace elements in the manure and is reflected in the manure to feed ratios (concentration of element in manure/concentration of element in the feed). Sheppard and Sanipelli (2012) also measured the trace element concentrations in the feed corresponding to the manure they analysed. They found that the manure often had trace element concentrations of about 3 to 5 times that of the feed ingested by the animal (Appendix 1). Higher ratios were observed for a limited number of trace elements and may have occurred due to other significant sources of trace elements, such as pharmaceuticals, that found their way into the manure.
Racz and Fitzgerald (2001) found that concentrations of some undesirable metals such as Cd, Ni and Pb were closely correlated with elements added as nutritional supplements or for disease suppression, suggesting the Cd, Ni and Pb were most likely contaminants in the mineral supplements. The presence of many of these unwanted elements in manure can be altered by changing the source of mineral supplements.
Salts in ManureManure contains salts, some of which are sodium salts. Plants are detrimentally affected by excess salts in soil (salinity) and soil quality is adversely affected by excess sodium (sodicity). Soil sodicity causes soil structure problems such as crusting.
A large portion of the salts in manure consist of soluble nutrients that can be taken up and removed by crops. In general, the risk of soil salinity or sodicity problems due to manure application in Manitoba is low, except in borderline saline soils. Monitoring of these soils for trends in salinity or sodicity may be a more practical way to deal with these risks than via manure analyses.
Properties of Manure | Page 25
Electrical Conductivity (EC) is an indicator of the total soluble salt concentration. Although EC is not routinely offered in many commercial manure analysis packages, it can be easily and directly measured in the lab on manure slurries. A 2:1 manure:water ratio is recommended for solid and semi-solid manures to create a manure slurry. The manure:water ratio should always be stated with the results which are typically reported in decisiemens per metre (dS/m).
The electrical conductivity of manures can be high mainly because of the presence of water soluble nutrients (e.g. ammonium-N), the use of dietary salts (such as NaCl) and in some instances the use of water containing high concentrations of salts. The dominant ions that contribute to electrical conductivity of manures are NH4, Na, Ca, Mg, K, Cl, sulphate and bicarbonate.
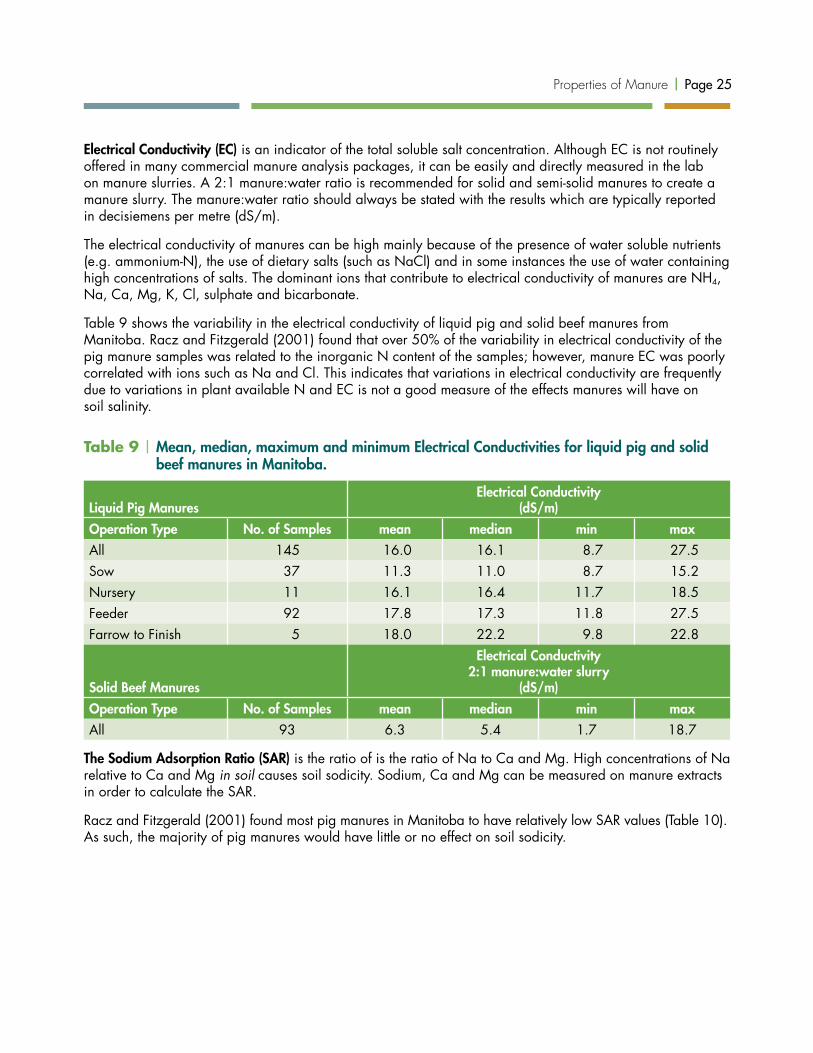
Table 9 shows the variability in the electrical conductivity of liquid pig and solid beef manures from Manitoba. Racz and Fitzgerald (2001) found that over 50% of the variability in electrical conductivity of the pig manure samples was related to the inorganic N content of the samples; however, manure EC was poorly correlated with ions such as Na and Cl. This indicates that variations in electrical conductivity are frequently due to variations in plant available N and EC is not a good measure of the effects manures will have on soil salinity.
Table 9 | Mean, median, maximum and minimum Electrical Conductivities for liquid pig and solid beef manures in Manitoba.
Liquid Pig ManuresElectrical Conductivity
(dS/m)Operation Type No. of Samples mean median min maxAll 145 16.0 16.1 8.7 27.5Sow 37 11.3 11.0 8.7 15.2Nursery 11 16.1 16.4 11.7 18.5Feeder 92 17.8 17.3 11.8 27.5Farrow to Finish 5 18.0 22.2 9.8 22.8
Solid Beef Manures
Electrical Conductivity2:1 manure:water slurry
(dS/m)Operation Type No. of Samples mean median min maxAll 93 6.3 5.4 1.7 18.7
The Sodium Adsorption Ratio (SAR) is the ratio of is the ratio of Na to Ca and Mg. High concentrations of Na relative to Ca and Mg in soil causes soil sodicity. Sodium, Ca and Mg can be measured on manure extracts in order to calculate the SAR.
Racz and Fitzgerald (2001) found most pig manures in Manitoba to have relatively low SAR values (Table 10). As such, the majority of pig manures would have little or no effect on soil sodicity.

Page 26 | Properties of Manure
Table 10 | Mean, median, maximum and minimum Sodium Adsorption Ratios for liquid pig manures in Manitoba.
Liquid Pig Manures SAROperation Type No. of Samples mean median min max
All 145 5.1 4.2 0.6 17.8Sow 37 5.9 4.9 0.6 17.8Nursery 11 4.8 3.3 1.6 10.6Feeder 92 4.5 4.0 1.1 17.3Farrow to Finish 5 8.9 5.8 4.0 16.5
By-Products of Manure TreatmentComposting Solid manure is often composted to create a value added product for sale or to reduce the mass of the initial manure pile to decrease hauling costs compared to fresh manure. The elemental composition of composted manure is highly variable depending on factors such as manure type, bedding material, bulking material, time composting and exposure to precipitation.
Larney et al. (2006) studied nutrient and water content changes during composting of solid beef manure in Lethbridge, Alberta and Brandon, Manitoba (Table 11). Composting resulted in dramatic losses of dry matter (39.8%, on average) and water (79.9%, on average) with the average total mass loss being 65.6% which could represent substantial savings in hauling costs. Carbon losses were attributed to microbial decomposition of organic matter and release of C as CO2. Although the very significant mass loss resulted in higher concentrations of total N in the mature compost, some of the plant-available NH4 was lost to the atmosphere as NH3 gas and more of the total N that remained was in the organic form. The changes in C and N resulted in lower C:N ratios in compost than fresh manure. Almost all of the initial P was still present in the compost but in increased concentrations. With the loss of N and no loss of P, the available N:P ratios were also lower in compost than fresh manure.
Manure is often composted in long windrows. Composting must be managed properly to maintain optimal air, water and temperatures so that the microorganisms can decompose the organic material to produce a stable, humus-like product.

Properties of Manure | Page 27
Table 11 | Effect of composting on the concentrations of total C, total N, inorganic N and total P and C:N ratios (wet weight basis) of beef cattle manure (adapted from Larney et al. 2006).
Location Age of manureWater
%Total C
%Total Nlb/ton
Inorganic Nlb/ton
Total Plb/ton
C:NRatio
Lethbridge Fresh 57.1 12.6 14.2 2.4 3.8 17.6Compost 33.6 12.6 21.0 1.2 7.4 11.7
Brandon Fresh 73.1 8.9 8.4 2.6 2.6 21.8Compost 38.4 8.2 15.2 0.6 6.0 10.9
Solid – Liquid SeparationSolid-liquid separation of manure is the physical process of separating liquid manures into two fractions – liquid and solid. Soluble components such as Na, Cl, ammonium-N and K are less susceptible to separation and tend to be in the liquid phase. Metals, organically-bound and insoluble components, such as organic N, organic P and calcium-P tend to be associated with the solids.
To date, the main purpose of solid-liquid separation has been to concentrate the P in the solid fraction in order to transport it farther from the barn more economically. The treated liquid fraction should be an ammonium-rich, low P fertilizer that can be used as a N fertilizer on fields with high soil test P that are often in close proximity to the barn.
The effectiveness of the solid-liquid separation system at concentrating P is often dictated by the particle sizes of the solids containing the P. Table 12 shows the distribution of total P in liquid pig manure in various particle size fractions (adapted from Masse et al. 2005). Seventy-one % of the P was in the smallest size categories which were 10 um and less. Some treatment systems rely on chemical additives called flocculants to bind together small particles into larger particles that can be more effectively removed from the liquid.
Centrifuge A centrifuge is a machine with a high-speed rotating drum that uses centrifugal force to separate the solids from the liquids. The raw manure enters one end of the centrifuge through a feeder pipe. The solids are forced out of the rotating drum through centrifugal force where they are removed with an auger. The liquids are left in the drum and flow out the opposite end from the feeder pipe. This creates two manure streams, effluent and solids, from the influent or raw manure.
Egilson and Grieger (2014) evaluated the effectiveness of the Alfa Laval Centrifuge with and without flocculent at a commercial feeder pig operation in south-eastern Manitoba. The centrifuge successfully created two manure streams (liquid manure effluent and solid manure); however, the efficiency of the centrifuge at removing P from the liquid manure was strongly influenced by the characteristics of the influent manure. The use of flocculent only improved the efficiency of P removal when the influent manure contained greater than 3% dry matter.
Table 12 | Distribution of total P in liquid pig manure by particle size
% of TP in Raw Pig Manure Particle Size (µm)4 >1000
10 50-25015 10-5048 0.45-1023 <0.45

Page 28 | Properties of Manure
The Alfa Laval centrifuge has a high speed rotating drum that can spin at 4,500 rpm to remove the solids from liquid pig manure.
As expected, the liquid effluent contained most of the soluble nutrients such as ammonium-N and K and the solid fraction concentrated the P, leaving the liquid effluent’s available N:P2O5 ratio better matched to what crops require (Table 13). In areas where soil test P levels are high and low soil test P land is far away, centrifugation could be used to better manage P application rates. The liquid effluent could be used on high soil test P lands nearby while the solid stream, which is very high in total P, could be hauled more economically to lands that are further away which need additional P to improve crop yields.
Although it is technically possible to use centrifugation to separate solids from liquids in manure, the adoption of this technology by the livestock industry will largely depend on the capital and operating costs associated with this system compared with the cost of transporting raw manure. The routine use of flocculent to improve P removal efficiency would also depend on the cost of the flocculent as well as the improved efficiency of separation for that operation.

Properties of Manure | Page 29
Table 13 | Means, medians, maximums and minimums for total N, ammonium, organic N, P, K, EC, DM and estimated available N:P2O5 ratios for influent, effluent and solids from feeder pig manure treated with an Alfa Laval centrifuge on wet weight basis (adapted from Egilson and Grieger, 2014).
InfluentTKN NH4-N Org N P K EC DM Avail
N:P2O5lb/1000 gal mS/cm %To be treated without Flocculent
Mean 26.76 16.16 10.60 5.66 10.20 4.92 3.49 1.83Median 26.21 15.87 9.42 4.77 10.05 4.96 3.13 1.52Max 38.80 21.72 20.55 12.53 11.80 5.35 7.70 3.54Min 21.20 13.13 5.69 2.09 9.25 3.95 1.52 0.82
To be treated with Flocculent
Mean 29.01 20.66 8.57 6.89 11.44 5.36 4.53 1.54Median 29.04 20.69 9.21 7.13 11.35 5.35 4.43 1.39Max 34.04 22.41 13.25 9.09 12.39 5.87 5.89 2.44Min 19.74 19.26 0.00 4.14 10.80 5.00 3.20 1.16
EffluentTKN NH4-N Org N P K EC DM Avail
N:P2O5lb/1000 gal mS/cm %Without Flocculent Mean 24.10 15.04 9.07 3.15 10.23 4.95 1.64 2.35
Median 24.40 15.15 8.89 3.35 9.99 4.98 1.54 2.18Max 28.50 16.35 13.30 4.13 12.06 5.29 2.50 3.78Min 21.01 12.85 6.05 1.80 9.30 4.49 1.19 1.93
With Flocculent Mean 22.15 16.65 5.50 3.13 10.27 4.95 1.19 2.43Median 21.91 16.57 5.62 3.07 10.37 4.95 1.21 2.43Max 23.48 17.56 6.55 4.10 11.35 5.52 1.49 2.69Min 20.33 14.66 4.49 2.41 9.04 4.40 0.98 1.99
SolidsTKN NH4-N Org N P K EC DM Avail
N:P2O5lb/ton mS/cm %Without Flocculent Mean 21.55 4.76 16.79 14.78 2.32 2.27 29.67 0.27
Median 21.74 4.62 17.03 14.49 2.31 2.21 28.80 0.26Max 23.56 6.28 18.89 18.34 2.66 3.62 34.90 0.32Min 19.06 3.96 13.54 11.99 2.17 1.32 25.43 0.22
With Flocculent Mean 20.83 4.07 16.76 11.73 2.56 2.31 26.75 0.30Median 20.12 4.31 16.50 11.26 2.26 2.12 26.65 0.30Max 25.02 4.98 20.68 13.84 5.80 3.93 31.33 0.49Min 18.38 2.68 14.80 8.55 2.02 1.22 22.06 0.22
Kumaragamage et al. (2012) further characterized the raw and treated manures from Egilson and Grieger (2014). In addition to macronutrients, trace element concentrations were determined (Table 14). Since most of the trace elements are associated with solids they tended to be concentrated in the solid streams. This was not true for Na which is highly soluble.

Page 30 | Properties of Manure
Table 14 | Concentrations (ppm) on wet weight basis for total Al, As, Ba, B, Cd, Cr, Cu, Fe, Mn, Mo, Na, Pb, Sb, Se, Ti, V, and Zn in centrifuge separated feeder pig manure (Kumaragamage et al., 2012).
CentrifugeDM Al As Ba B Cd Cr Cu Fe Mn% ppm1
Without Flocculent
Influent 2.6 18.5 BDL 0.677 1.92 0.061 0.048 23.0 44.1 11.7Effluent 1.2 6.9 BDL 0.383 1.05 0.038 0.022 15.9 24.6 4.9Solid 25.7 166 0.321 7.04 8.04 0.2 1.54 136 447 116
With Flocculent
Influent 4.2 22 BDL 0.865 1.19 0.056 0.023 23.8 50.9 13.4Effluent 1.2 5.1 BDL 0.335 BDL 0.028 0.01 10.5 17.1 4.09Solid 26.4 140 BDL 6.32 6.2 0.177 0.787 133 320 97.2
Centrifuge
DM Mo Na Ni Pb Sb Se Ti V Zn% ppm1
Without Flocculent
Influent 2.6 0.339 598 0.302 0.161 0.204 BDL 0.9 0.81 73.4Effluent 1.2 0.255 636 0.22 0.101 0.174 BDL 0.417 0.371 37.3Solid 25.7 1.44 486 1.78 0.862 0.22 BDL 6.79 7.52 505
With Flocculent
Influent 4.2 0.337 572 0.281 0.271 0.245 BDL 0.9 0.821 66.7Effluent 1.2 0.215 602 0.155 0.117 0.169 BDL 0.311 0.299 24.8Solid 26.4 1.56 484 1.65 1 0.295 0.098 5.26 5.81 459
1 ppm ÷ 100 = lb/1000 gal; ppm ÷ 500 = lb/ton
Rotary Press The Fournier Rotary Press is a machine that uses flocculent, low speed rotation and screens to separate the solids from the liquid manure. The raw manure is mixed with flocculent and then enters a rectangular channel and is rotated between two parallel revolving screens. Liquid passes through the screens and the solids travel through the channel between the screens to the outlet.
At the same feeder pig barn in south-eastern Manitoba where the centrifuge was tested, Egilson and Grieger (2014) also investigated the effectiveness of the Fournier Press. Table 15 shows that the Fournier press successfully created two manure streams from raw manure: liquid manure effluent and solid manure. As was observed for the centrifuge, the liquid effluent contained most of the soluble nutrients such as ammonium-N and K. Phosphorus was concentrated in the solid fraction which resulted in a higher available-N:P2O5 ratio in the effluent closer to what crops require. The main difference in results between the rotary press and the centrifuge was that the rotary press required the use of flocculent to achieve separation, significantly adding to operating costs.

Properties of Manure | Page 31
Table 15 | Means, medians, maximums and minimums for total N, ammonium, organic N, P, K, EC, DM and estimated available N:P2O5 ratios for influent, effluent and solids from feeder pig manure treated with a Fournier Press using flocculent (wet weight basis; adapted from Egilson and Grieger, 2014).
InfluentTKN NH4-N Org N P K EC DM Avail
N:P2O5lb/1000 gal mS/cm %Mean 27.97 18.55 9.70 6.20 12.51 5.12 3.73 1.51Median 27.65 18.45 9.42 5.75 12.54 5.12 3.42 1.54Max 35.77 25.83 17.22 9.93 13.71 6.28 6.29 2.20Min 22.59 15.82 4.93 3.83 11.21 4.28 1.54 1.09
EffluentTKN NH4-N Org N P K EC DM Avail
N:P2O5lb/1000 gal mS/cm %Mean 18.80 15.34 3.46 3.18 11.17 4.84 1.00 2.35Median 18.84 15.59 3.16 3.07 11.19 4.70 0.94 2.32Max 22.22 17.40 6.59 5.43 11.90 5.98 1.70 3.30Min 16.18 13.53 1.48 2.04 10.36 4.23 0.71 1.54
SolidsTKN NH4-N Org N P K EC DM Avail
N:P2O5lb/ton mS/cm %Mean 25.08 3.98 21.10 8.40 2.51 2.09 31.77 0.49Median 24.87 4.07 21.30 8.42 2.50 1.97 31.77 0.48Max 32.32 4.99 28.96 11.74 2.76 4.00 40.40 0.64Min 18.85 2.66 14.84 5.91 2.33 1.33 20.16 0.35
The Fournier Press rotates at low speeds and requires flocculent to remove solids from liquid pig manure.

Page 32 | Properties of Manure
Kumaragamage et al. (2012) also further characterized the raw and treated manures in the Fournier Press study. The trace element concentrations in Table 16 show the same trends as observed in the centrifuge results.
Table 16 | Concentrations (ppm) on a wet weight basis for total Al, As, Ba, B, Cd, Cr, Cu, Fe, Mn, Mo, Na, Pb, Sb, Se, Ti, V, and Zn in rotary press separated feeder pig manure (Kumaragamage et al., 2012).
FournierDM Al As Ba B Cd Cr Cu Fe Mn% ppm
Sample 1 Influent 5.5 21.9 BDL 1.11 0.73 0.062 0.035 33.6 55.4 14Effluent 1.1 3.3 BDL 0.235 BDL 0.024 0.011 5.04 9 3.4Solid 37.6 125 0.546 8.65 8.4 0.25 1.98 251 426 85.7
Sample 2 Influent 2.7 10.9 BDL 0.721 0.75 0.06 0.07 18.5 35.1 8.9Effluent 0.7 2.4 BDL 0.146 BDL 0.019 0.026 1.5 2.9 1.4Solid 31.4 125 0.612 7.76 6.96 0.245 1.82 259 469 102
Fournier
DM Mo Na Ni Pb Sb Se Ti V Zn% ppm
Sample 1 Influent 5.5 0.572 572 0.385 0.348 0.184 BDL 1.2 0.795 78.3Effluent 1.1 0.179 589 0.134 0.107 0.092 BDL 0.246 0.28 12.3Solid 37.6 2.57 535 2.23 1.16 0.25 0.182 5.39 4.6 551
Sample 2 Influent 2.7 0.3 564 0.25 0.28 0.221 BDL 0.6 0.51 58.4Effluent 0.7 0.158 588 0.097 0.091 0.101 BDL 0.097 0.267 4.6Solid 31.4 2.61 512 2.29 1.12 0.245 BDL 5.49 5.27 742
VP Systems Air Floatation and Belt Filter PressThe VP Systems manure treatment technology is a multi-phased solid-liquid separation system that uses an air flotation tank to capture the solids which are dewatered using a belt filter press. This system requires a polymer flocculent to be added to the manure stream prior to the manure entering the floatation tank. The flocculent makes the manure particles larger and more buoyant. Air is injected into the manure in the flotation tank which brings the particles to the top of the tank. Slow moving plastic paddles skim the solids off the top to a chute that allows them to sluice into the belt filter press. The belt filter has a series of slow moving rolling drums of decreasing size that force as much water as possible from the solids. At the end of the belt filter the solids have a DM content of approximately 30% (Table 17). A conveyor then carries the solids to a covered manure storage until they are removed for sale or land application. This system can treat 19.2 million imp. gal. (87.3 million L) per year but can be expanded to treat larger volumes.
Mak and Grieger (2015) tested a VP Systems air flotation and belt filter press treatment system in operation on a commercial pig farm in south eastern Manitoba. They found that with relatively thick feeder pig manure (Table17), the VP system effectively and consistently separated the solids and phosphorus from the liquid manure. On average, 66% of the solids and 83% of the phosphorus were separated into the solid fraction. Mak and Grieger (2015) estimated the cost of running this system at 80% capacity and land-applying the effluent to be 3.35¢ per imperial gallon.

Properties of Manure | Page 33
Table 17 provides the nutrient composition of the raw manure, liquid effluent and the solid by-product from the VP system treatment process. The liquid effluent had an average N:P2O5 ratio of 8.3:1 which was much higher than the influent manure (1.7:1), making it a good option for fields with elevated soil test P and crops that require only starter levels of additional P2O5. On average, the solids from the VP systems treatment process contained 32 lb P2O5 per ton, making them more suited to building soil test P. The low moisture content of the solids also makes them more economical to transport to low soil test P lands that are further away.
The VP Systems concrete floatation tank is shown in the background with green plastic paddles directing the solids toward the stainless steel chute and onto the belt filter press for further dewatering. A conveyor sends the solids to a separate building for storage.

Page 34 | Properties of Manure
Table 17 | Means, medians, maxes and minimums for total N, ammonium, organic N, P, K, EC, DM and available N:P2O5 ratios for influent, effluent and solids from feeder pig manure treated with the VP System air floatation tank and belt filter press on wet weight basis (adapted from Mak and Grieger, 2015).
InfluentTKN NH4-N Org N P K EC DM Avail
N:P2O5lb/1000 gal mS/cm %To be treated with Flocculent
Mean 74.0 48.6 25.4 14.6 22.1 23.8 6.5 1.7Median 71.9 47.0 25.6 14.2 22.1 23.5 6.3 1.7Max 94.6 88.7 34.4 17.2 24.9 27.6 9.0 1.9Min 91.0 64.1 19.1 12.1 19.3 21.9 5.4 1.4
EffluentTKN NH4-N Org N P K EC DM Avail
N:P2O5lb/1000 gal mS/cm %With Flocculent Mean 55.0 45.0 10.0 2.5 21.1 26.3 2.2 8.6
Median 52.8 43.8 10.3 2.7 21.0 25.4 2.1 8.3Max 68.8 57.3 12.9 3.4 23.7 30.7 3.2 12.8Min 37.6 37.6 6.2 1.4 19.5 23.6 1.7 6.5
SolidsTKN NH4-N Org N P K EC DM Avail
N:P2O5lb/ton mS/cm %With Flocculent Mean 32.5 9.7 22.7 13.8 5.0 7.1 30.2 0.5
Median 32.4 10.2 23.0 13.9 5.0 7.2 30.3 0.5Max 35.0 12.5 26.3 16.3 5.6 8.4 33.9 0.6Min 29.5 6.0 19.8 11.0 4.6 5.4 24.3 0.4
Gravity SeparationSlevinsky et al. (2009) used a settling tank to study gravity, or passive, separation of finishing pig manure. These authors found that separation of the solids and P depended on the initial dry matter content of the manure. After 14 days of settling, the supernatant from manure with a typical dry matter content (3.5 %) had much lower organic N and P concentrations compared to the raw manure (Table 18). This resulted in a significant increase in the available N to P2O5 ratio. In contrast, separation of the solids and P from manure with high solids (6.6% dry matter) at day 14 was much less effective resulting in less of an improvement in the available N to P2O5 ratio.
Although gravity separation concentrates the solids and P in the sludge, a dry matter concentration of approximately 15% is not high enough for the sludge to be managed as a solid but is too high for pumping. DGH Engineering (2013) reported that manure up to about 10% total solids may be pumped with conventional liquid manure handling equipment.
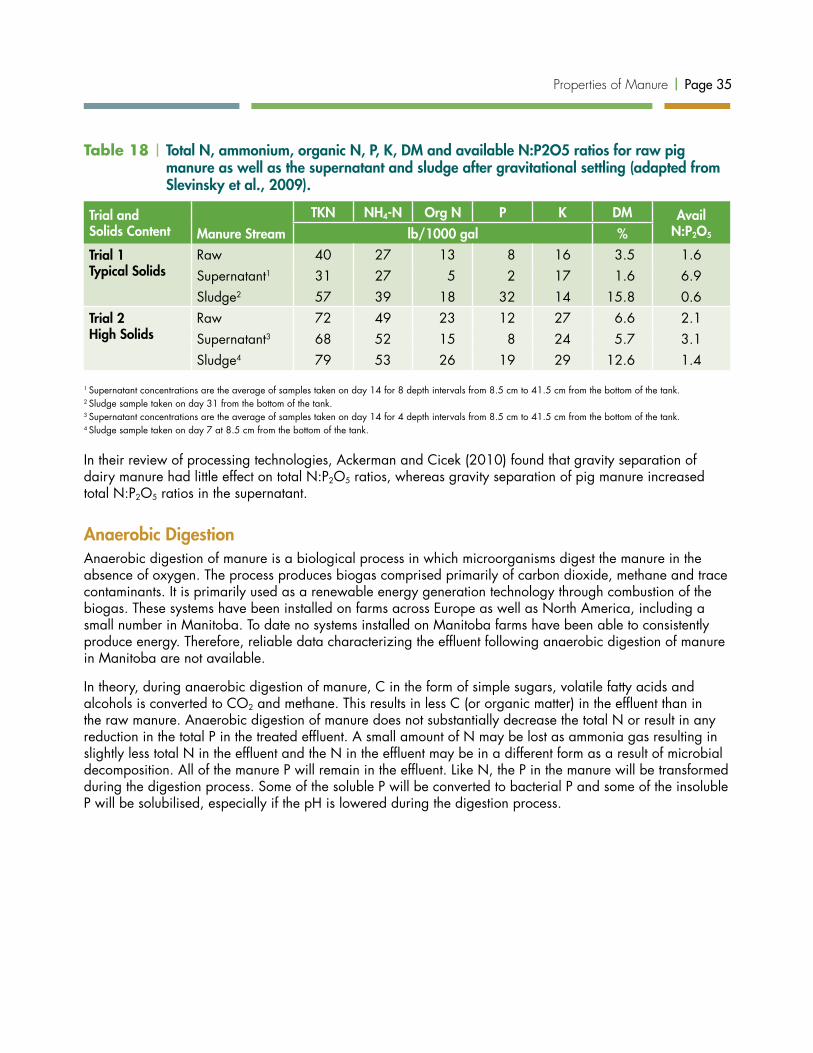
Properties of Manure | Page 35
Table 18 | Total N, ammonium, organic N, P, K, DM and available N:P2O5 ratios for raw pig manure as well as the supernatant and sludge after gravitational settling (adapted from Slevinsky et al., 2009).
Trial andSolids Content Manure Stream
TKN NH4-N Org N P K DM Avail N:P2O5lb/1000 gal %
Trial 1Typical Solids
Raw 40 27 13 8 16 3.5 1.6Supernatant1 31 27 5 2 17 1.6 6.9Sludge2 57 39 18 32 14 15.8 0.6
Trial 2High Solids
Raw 72 49 23 12 27 6.6 2.1Supernatant3 68 52 15 8 24 5.7 3.1Sludge4 79 53 26 19 29 12.6 1.4
1 Supernatant concentrations are the average of samples taken on day 14 for 8 depth intervals from 8.5 cm to 41.5 cm from the bottom of the tank. 2 Sludge sample taken on day 31 from the bottom of the tank. 3 Supernatant concentrations are the average of samples taken on day 14 for 4 depth intervals from 8.5 cm to 41.5 cm from the bottom of the tank.4 Sludge sample taken on day 7 at 8.5 cm from the bottom of the tank.
In their review of processing technologies, Ackerman and Cicek (2010) found that gravity separation of dairy manure had little effect on total N:P2O5 ratios, whereas gravity separation of pig manure increased total N:P2O5 ratios in the supernatant.
Anaerobic DigestionAnaerobic digestion of manure is a biological process in which microorganisms digest the manure in the absence of oxygen. The process produces biogas comprised primarily of carbon dioxide, methane and trace contaminants. It is primarily used as a renewable energy generation technology through combustion of the biogas. These systems have been installed on farms across Europe as well as North America, including a small number in Manitoba. To date no systems installed on Manitoba farms have been able to consistently produce energy. Therefore, reliable data characterizing the effluent following anaerobic digestion of manure in Manitoba are not available.
In theory, during anaerobic digestion of manure, C in the form of simple sugars, volatile fatty acids and alcohols is converted to CO2 and methane. This results in less C (or organic matter) in the effluent than in the raw manure. Anaerobic digestion of manure does not substantially decrease the total N or result in any reduction in the total P in the treated effluent. A small amount of N may be lost as ammonia gas resulting in slightly less total N in the effluent and the N in the effluent may be in a different form as a result of microbial decomposition. All of the manure P will remain in the effluent. Like N, the P in the manure will be transformed during the digestion process. Some of the soluble P will be converted to bacterial P and some of the insoluble P will be solubilised, especially if the pH is lowered during the digestion process.
Page 36 | Properties of Manure
ReferencesAckerman, J. and N. Cicek. 2010. Evaluation of the opportunity for manure treatment/ processing
technologies to achieve manure phosphorus balance. Final Report for the Manitoba Livestock Manure Management Initiative. MLMMI Report 2010-03-L.
Ajiboye, B., O.O. Akinremi and G.J. Racz. 2004. Laboratory characterization of phosphorus in fresh and oven-dried organic amendments. J. Environ. Qual. 33: 1062 – 1069.
Dick, S. 2003. Fluctuations in manure nutrient concentration during swine storage pump-outs. Final Report for the Manitoba Livestock Manure Management Initiative. MLMMI 03-01-06.
DGH Engineering. 2013. Optimized gravitational settling of hog manure solids: Engineering study and design. MLMMI Report 2012-09.
Egilson, K and L. Grieger. 2014. Manure Treatment Technology Evaluation. Final Report for the Manitoba Livestock Manure Management Initiative. MLMMI 2010-21.
Eriksen, J. 2009. Soil sulfur cycling in temperate agricultural systems. Adv. Agron. 102: 55-89.
Fitzgerald, M. M. and G.J. Racz. 2001. Long term effects of hog manure on soil quality and productivity. Report to the Agri-Food Research and Development Initiative (ARDI).
Flaten, D., K. Snelgrove, I. Halket, K. Buckley, G. Penn, W. Akinremi, B. Wiebe and E. Tyrchniewicz. 2003. Acceptable Phosphorus Concentrations in Soils and Impact on the Risk of Phosphorus Transfer from Manure Amended Soils to Surface Waters. A Literature Review for the Manitoba Livestock Manure Management Initiative. Phase 1 of MLMMI 02-HERS-01.
Larney, F.J., K.E. Buckley, X. Hao and W.P McCaughey. 2006 Fresh, Stockpiled, and Composted Beef Cattle Feedlot Manure: Nutrient Levels and Mass Balance Estimates in Alberta and Manitoba. Technical Reports: Waste Management. J. Environ. Qual. 35:1844-1854
Loro, P. 2005. Characterization of Solid Beef Manure. Final report to the Manitoba Cattle Producers Association and Manitoba Agriculture, Food and Rural Initiatives.
Mak, J. and L. Grieger. 2015. Evaluation of air floatation and belt filter press manure separation System. MLMMI Report 2015-02 October.
Masse, L., D.I. Massé, V. Beaudette, and M. Muir. 2005. Size distribution and composition of particles in raw and anaerobically digested swine manure. Trans ASAE. 48:1943-1949.
Kumaragamage, D., W. Akinremi, L. Grieger and L. Olatuyi. 2012. Characterization of solid and liquid separates of swine manure using different processing technologies for phosphorus and metals. Final Report for the Manitoba Livestock Manure Management Initiative. MLMMI 2011-01.
Sheppard, S.C. and B. Sanipelli. 2012. Trace elements in feed, manure and manured soils. J. Environ. Qual. 41:1846-1856.
Slevinsky, L., G. Plohman, and G. Racz. 2009. Solid/Liquid separation of hog manure utilizing a settling tank. Report to the Manitoba Rural Adaptation Council (MRAC).

Properties of Manure | Page 37
AppendicesThe tables below contain concentrations of trace elements in various livestock and poultry fecal and manure samples expressed as mg/kg dry weight. In order to calculate the quantity of each trace element that will be land applied at a given manure application rate, the concentrations of each element in this table must be converted to a wet weight basis using the dry matter or moisture contents of the manures.
A. B eef fecal s amples B . Dairy fecal s amples15 � � � � �� � �� � � � � 21 �� � � �� � � � 22 �� � � �� � � � � 30 � � � � �� �
� �� � � � � � � � �
� ��
�1� ��
� � � �� �
�50�� �
� � �
�100�� �
� � � �� �
� � � � � � ��� � �
� � ��� � � � � � �� �1� ��
� � � �� �
�50�� �
� � �
�100�� �
� � � �� �
� � � � � � ��� � �
� � ���
� � 0�35 0�05 0�19 1�53 3�6 0�39 0�10 0�33 1�12 2�8
� 21 3 18 49 1�3 26 12 23 75 1�4
� � 0�10 0�04 0�09 0�26 2�7 0�19 0�08 0�17 0�52 3�2
� � 0�93 0�08 0�77 3�22 3�9 1�90 0�61 1�52 9�92 3�1
� � 4�1 0�6 2�1 26�7 1�1 3�43 1�43 3�41 7�58 1�4
� � 20 6 14 47 2�0 86 18 74 294 3�6
� � 1000 200 700 6600 7�5 950 380 920 2400 2�9
� � 139 68 135 261 3�0 332 70 312 598 3�4
� � 4�7 1�4 3�6 15�3 1�8 4�78 2�24 4�49 8�92 2�5
� � 2�9 0�6 1�9 10�8 2�3 5�23 1�60 4�50 17�80 2�3
� � 0�73 0�12 0�53 3�41 9�3 1�33 0�40 0�91 3�73 4�7
� � 0�82 0�20 0�50 4�80 1�3 1�31 0�40 1�15 3�10 1�9
� � 93 36 77 253 2�2 390 79 399 820 2�8
C . S ow manure D. Nurs ery pig manure E . Feeder pig manure6 � � � � �� � 4 � � � � �� � 25 � � � � �� �
� �� � � � � � � � �
� ��
�1� ��
� � � �� �
�50�� �
� � �
�100�� �
� � � �� �
� � � � � � ��� � �
� � ��� � � � � � �� �1� ��
� � � �� �
�50�� �
� � �
�100�� �
� � � �� �
� � � � � � ��� � �
� � ��� � � � �
� ��
�1� ��
� � � �� �
�50�� �
� � �
�100�� �
� � � �� �
� � � � � � ��� � �
� � ���
� � 1�8 0�6 0�9 4�0 4�0 1�5 1�0 1�5 2�1 4�9 1�4 0�0 0�6 6�8 6�5
� 92 51 59 210 3�8 107 84 107 129 4�8 44 5 47 129 6�5
� � 0�41 0�21 0�42 0�56 2�0 0�64 0�44 0�66 0�78 2�4 0�37 0�13 0�37 0�82 4�4
� � 1�6 0�8 0�8 3�2 3�8 1�9 1�2 1�9 2�6 4�6 1�8 0�2 1�6 6�9 4�7
� � 7�7 2�9 7�4 12�4 2�7 11�6 9�8 10�7 15�1 3�6 7�0 0�9 5�0 36�9 3�9
� � 174 127 160 259 3�6 880 694 838 1150 3�5 243 35 187 682 5�0
� � 2700 1300 2600 4600 3�7 2600 2100 2600 2800 4�7 2600 800 1800 15400 5�6
� � 495 372 484 623 3�9 611 529 579 759 4�2 532 293 467 1090 5�4
� � 10�3 5�8 10�7 12�9 3�7 21�1 19�2 21�2 22�6 5�0 7�7 1�9 7�6 16�2 5�0
� � 9�1 3�9 9�7 11�8 3�0 17�2 15�4 16�3 20�6 3�4 6�6 2�5 6�3 22�1 5�0
� � 2�8 0�6 0�9 10�9 3�7 2�3 1�9 2�2 2�8 8�2 1�5 0�3 1�2 6�1 6�0
� � 2�9 2�2 3�0 3�7 2�4 3�8 3�1 3�8 4�6 3�1 2�9 1�0 3�2 4�7 1�9
� � 1220 1040 1210 1420 3�6 5848 4170 5360 8500 8�4 1084 463 1030 1690 5�3
F. L ayer manure G . B roiler manure H. Turkey manure18 � � � � �� � 12 � � � � �� � 7 � � � � �� �
� �� � � � � � � � �
� ��
�1� ��
� � � �� �
�50�� �
� � �
�100�� �
� � � �� �
� � � � � � ��� � �
� � ��� � � � � � �� �1� ��
� � � �� �
�50�� �
� � �
�100�� �
� � � �� �
� � � � � � ��� � �
� � ��� � � � � � �� �1� ��
� � � �� �
�50�� �
� � �
�100�� �
� � � �� �
� � � � � � ��� � �
� � ���
� � 0�9 0�3 0�8 1�6 4�4 1�1 0�2 0�4 9�3 6�2 1�7 0�2 0�5 8�6 2�5
� 41 8 42 75 3�5 36 19 36 58 4�2 35 27 29 55 2�6
� � 0�36 0�12 0�35 0�67 2�9 0�20 0�11 0�20 0�36 2�9 0�25 0�17 0�24 0�29 3�0
� � 1�76 0�56 1�44 5�59 3�7 0�90 0�41 0�73 2�52 4�1 0�82 0�37 0�84 1�37 2�6
� � 6�8 1�5 6�5 20�2 3�0 3�5 1�7 3�1 5�9 4�3 5�3 1�5 5�7 9�1 2�6
� � 82 37 67 198 4�0 325 38 348 783 4�1 255 72 347 396 2�0
� � 1300 500 1200 2900 2�5 700 400 500 1300 2�1 600 400 600 1100 1�6
� � 724 293 545 1610 3�4 506 315 529 637 4�5 517 258 504 993 2�9
� � 8�6 3�3 8�0 15�2 3�3 5�8 3�1 5�5 8�2 4�2 8�3 3�1 6�7 17�0 4�1
� � 7�3 2�9 7�0 11�3 2�9 6�4 2�8 5�7 11�9 3�7 5�1 3�2 5�5 7�6 1�7
� � 5�54 0�47 1�17 34�60 4�3 0�61 0�35 0�62 0�94 3�7 0�81 0�54 0�70 1�63 3�8
� � 3�3 1�0 3�6 8�0 3�0 2�3 0�9 2�2 4�0 3�0 1�8 0�9 1�9 2�3 2�1
� � 533 370 496 836 4�1 559 375 565 696 3�4 582 252 579 1060 2�9
Source: Sheppard, pers. Communication.
