properties of fired clay bricks mixed with waste glass · materials. the advantages are on one...
TRANSCRIPT

Properties of Fired Clay Bricks Mixed with
Waste Glass
الزجاج مخلفاتبعد خلطه مع الطيني الحراري خصائص الطوب
Hisham Hussein Abdeen
Supervised by
Prof. Samir M. Shihada
Professor of Structural Engineering
A thesis submitted in partial fulfillment
of the requirements for the degree of
Master of Science in Civil Engineering - Design and Rehabilitation of Structures
July/2016
زةــغ – ةــالميــــــة اإلســـــــــامعـالج
شئون البحث العلمي والدراسات العليا
ة الهندســـــــــــــــــــةــــــــــــــــــــليـك
ماجستيـــــــر الهندســــة المدنيـــــــــة
تصميــــــــــم وتأهيــــــل المنشــــــــآت
The Islamic University–Gaza
Research and Postgraduate Affairs
Faculty of Engineering
Master of Civil Engineering
Design and Rehabilitation of Structures


III
Abstract
The concrete hollow blocks have traditionally been used as construction materials in
Gaza Strip, giving people the wherewithal to construct buildings and keep
themselves safe. Nowadays, with the Israeli siege that stopped cement from entering
into Gaza Strip, fired clay bricks may be used as an alternative to concrete blocks.
The production of fired clay bricks with the incorporation of wastes constitutes a
positive way for the brick industry to contribute to a more sustainable construction
materials. The advantages are on one hand, a reduction of the clay extraction and, on
the other minimization of wastes in landfills.
The main idea of this research is to focus on the ability of making fired clay bricks as
alternative masonry units to concrete hollow blocks and enhancing their properties
by adding waste glass.
The physical and mechanical properties of fired clay bricks. Also, the effect of waste
glass particle size on the properties of the fired clay brick was studied.
The results showed that the firing shrinkage, bulk density, and compressive strength
of the bricks increased as the amount of waste glass content increased and firing
temperature increased. The apparent porosity and water absorption had the same
pattern and they decreased with the increase of the amount of waste glass content
and firing temperature.
The results also showed that the particle size of waste glass powder was very
important and had a significant effect on the properties of fired clay brick; the finest
the particle size, the highest the compressive strength.
The optimal properties of fired brick were found at 30% content of waste glass and
firing temperature at 1100°C. The results also implied that it is possible to make
bricks with compressive strength of 96.37 MPa and water absorption of 5.93%.
Finally, based on the results of this study, use of waste glass as a brick additive is
recommended.
Keywords: fired clay bricks, waste glass, recycling, firing temperature, physical and
mechanical properties.

IV
ملخصال
قليدية في قطاع غزة، حيث يستخدم في تشييد المباني و إيواء الناس يعتبر البلوك الخرساني وحدة البناء التمن بشكل آمن. لكن في الوقت الحاضر وبسبب الحصار االسرائيلي الذي يمنع دخول االسمنت الى قطاع غزة،
بديل عن البلوك الخرساني. الطوب الطيني الحراري أن يكون الممكن
بعد دمجه مع النفايات يعتبر طريقة ايجابية لصناعة الطوب والمساهمة في جعل الطيني الحراري انتاج الطوب مواد البناء اكثر استمرارية، حيث يتم تقليص كمية الطين المستخدم، و من جانب اخر تقليل رمي النفايات في
المكبات.
ي قطاع غزة، وتحسين الفكرة الرئيسية في هذا البحث هي التحقق من امكانية عمل الطوب الطيني الحراري ف خصائصه عن طريق اضافة مخلفات الزجاج.
. كما تم دراسة تأثير حجم حبيبات مخلفات الزجاج للطوب المنتج الفيزيائية والميكانيكية خصائصالتم دراسة على خصائص الطوب.
سابقة الذكر مع زيادة محتوى بودرة الزجاج وزيادة الطوب الطيني الحراري أظهرت النتائج تحسن جميع خصائص درجة حرارة الحرق. كما أن حجم حبيبات مخلفات الزجاج كان له تأثير مهم على خصائص الطوب، حيث
اظهرت النتائج أن استخدام حجم حبيبات اصغر هو االفضل بالنسبة لمقاومة الطوب للكسر.
%، وعند حرق 30رت عند اضافة بودرة الزجاج الى الطين بنسبة ظه الطيني الحراري الخصائص المثالية للطوب درجة مئوية، حيث اظهرت النتائج أنه يمكن صناعة طوب يتحمل ضغط مقداره 1100العينة عند درجة حرارة
.% 5.93ميجا باسكال ونسبة امتصاص للماء مقدارها 96.37
الطوب الطيني الحراري للطين عند صناعة كمضاف مخلفات الزجاجمن خالل النتائج استخدام في الختام ينصح .لتحسين خواصه
الطوب الطيني الحراري، مخلفات الزجاج، إعادة تدوير، درجة حرارة الحرق، الخصائص الفيزيائية كلمات مفتاحية: والميكانيكية.

V
Dedication
I would like to dedicate this work to my family particularly my mother and father
who loved and raised me and to my loving wife, daughter, sons and to my brothers
and sisters, for their sacrifice and endless support.
VI
Acknowledgment
I would like to express my sincere appreciation to prof. Samir Shihada from the
Department of Civil Engineering at The Islamic University of Gaza for his help,
guidance and assistance in all stages of this research. The constant encouragement,
support and inspiration he offered me were fundamental to the completion of this
research.
I would like to thank all the lecturers in the Islamic University of Gaza from whom I
learned much and developed my skills.
Special thanks go to the administration of the University College of Science and
Technology-Khanyounis, for the logistic facilitations and continuous support.
Finally, I would like to thank all those who gave me advice or assistance that
contributed to complete this research.

VII
Table of Contents
Declaration……… ........................................................................................................... I
Abstract ..........................................................................................................................III
IV ............................................................................................................................ الملخص
Dedication ....................................................................................................................... V
Acknowledgment .......................................................................................................... VI
Table of Contents ......................................................................................................... VII
List of Tables ................................................................................................................ IX
List of Figures ................................................................................................................. X
List of Abbreviations ................................................................................................... XII
Chapter (1): Introduction…. ........................................................................................1
1.1 Overview.. ............................................................................................................2
1.2 Problem Statement….. .........................................................................................3
1.3 Research Objectives .............................................................................................4
1.4 Methodology.. ......................................................................................................5
1.5 Thesis Layout .......................................................................................................5
Chapter (2): Literature Review ....................................................................................7
2.1 Background. .........................................................................................................8
2.2 Fired Clay Brick ...................................................................................................9
2.2.1 Past and present…….. .................................................................................10
2.2.2 Types of fired clay bricks… .......................................................................10
2.2.3 Brick manufacturing… ...............................................................................12
2.2.4 Properties of fired clay bricks… .................................................................19
2.2.5 Specification for building brick… ..............................................................21
2.3 Glass…. ..............................................................................................................22
2.3.1 History……………… .................................................................................22
2.3.2 Raw materials and manufacture… ..............................................................23
2.3.3 Types of glass………. ................................................................................24
2.3.4 Glass recycling……… ................................................................................28
2.4 Previous Studies. ................................................................................................29
2.5 Concluding Remarks ..........................................................................................34

VIII
Chapter (3): Experimental Program… ......................................................................35
3.1 Introduction... .....................................................................................................36
3.2 Preparing of Raw Materials ..............................................................................38
3.3 Experimental Procedures ...................................................................................39
3.4 Testing Program. ................................................................................................43
3.5 Testing Method for the Physical and Mechanical Properties ............................43
3.5.1 Physical properties…. .................................................................................43
3.5.2 Mechanical properties .................................................................................45
Chapter (4):Test Results and Discussion ...................................................................49
4.1 Introduction.. ......................................................................................................50
4.2 Test Results.. ......................................................................................................50
4.2.1 Firing shrinkage……. .................................................................................50
4.2.2 Bulk density………… ................................................................................52
4.2.3 Water absorption and apparent porosity… .................................................54
4.2.4 Compressive strength. .................................................................................57
4.2.5 The effect of the glass particle size… .........................................................59
Chapter (5): Conclusions and Recommendations.....................................................61
5.1 Conclusions. .......................................................................................................62
5.2 Recommendations For Further Research ...........................................................63
References…… .............................................................................................................64
Appendices…… ............................................................................................................70
Appendix (A) .............................................................................................................71

IX
List of Tables
Table (2.1): Range of chemical component present in clay. .......................................... 12
Table (2.2): Physical requirements for various grades of building bricks. .................... 21
Table (2.3): Approximate compositions of Soda-Lime-Silica glass. ............................. 25
Table (2.4): Approximate compositions of lead glass. ................................................. 25
Table (2.5): Approximate compositions of Boro-Silicate glass. .................................... 26
Table (2.6): Approximate compositions of Alumino-Silicate glass. ............................. 27
Table (3.1): The brick mixtures prepared from the raw materials used. ........................ 40
Table (4.1): Average values of the firing shrinkage of the samples. ............................. 51
Table (4.2): Average values of the bulk density of the samples. ................................... 53
Table (4.3): Average values of the water absorption of the samples. ............................ 55
Table (4.4): Average values of the apparent porosity of the samples. ........................... 56
Table (4.5): Average values of the compressive strength of the samples. ..................... 58
Table (4.6): Compressive strength for bricks at different glass particle size .................. 59

X
List of Figures
Figure (2.1): (a) US common size brick, (b) UK standard size brick .............................. 9
Figure (2.2): Diagrammatic Representation of Manufacturing Process. ....................... 13
Figure (2.3): Clay or Shale being crushed and transported to storage area. .................. 13
Figure (2.4): Clay is extruded through a die and trimmed to specified dimension ....... 15
Figure (2.5): Wire cutter cuts the wet clay column into several bricks. ........................ 15
Figure (2.6): Drying curve for brick. ............................................................................. 16
Figure (2.7): A typical tunnel kiln. ................................................................................ 17
Figure (2.8): A typical storage yard at a brick manufacturing plant. ............................ 18
Figure ( 2.9): Brick textures are applied by passing under a roller after extrusion ....... 20
Figure (2.10): Flow chart of glass processing. .............................................................. 24
Figure (2.11): Soda-Lime-Silica glass ........................................................................... 25
Figure (2.12): Lead (Crystal) glass ................................................................................ 26
Figure (2.13): Boro-Silicate glass .................................................................................. 26
Figure (2.14): Alumino-Silicate glass ............................................................................ 27
Figure (2.15): Fused silica glass. ................................................................................... 28
Figure (3.1): Methodology for manufacturing clay bricks. ........................................... 37
Figure (3.2): Flow chart for testing program ................................................................. 37
Figure (3.3): Clay raw materials as collected from three areas. .................................... 38
Figure (3.4): A) Clay, B) Waste glass, C) Clay and Waste glass powdered, D) Fired
clay brick. ........................................................................................................................ 39
Figure (3.5): Different waste glass particle size (150 µm and 600 µm) ........................ 39
Figure (3.6): Particle size distribution curve of the clay and waste glass powder ......... 39
Figure (3.7): Laboratory containers filled by milled clay .............................................. 41
Figure (3.8): Electrical mixer ........................................................................................ 41
Figure (3.9): Brick making Mould ................................................................................. 41
Figure (3.10): Drying brick samples under laboratory conditions ................................ 42
Figure (3.11): Drying brick samples in an oven ............................................................ 42
Figure (3.12): Firing brick sample in electrical furnace ................................................ 42
Figure (3.13): Fired clay bricks ..................................................................................... 42
Figure (3.14): Compressive Strength Specimens. ......................................................... 46

XI
Figure (3.15): Saw machine ........................................................................................... 47
Figure (3.16): Compressive test loading rate ................................................................. 48
Figure (4.1): Average values of the firing shrinkage of the samples. ............................ 52
Figure (4.2): Negative firing shrinkage fired clay brick with 40% waste glass and
firing at 1100°C .......................................................................................52_Toc454984413
Figure (4.3): Average values of the bulk density of the samples. ................................. 54
Figure (4.4): Bulk density device .................................................................................. 54
Figure (4.5): Average values of the water absorption of the samples. .......................... 56
Figure (4.6): Average values of the apparent porosity of the samples. ......................... 56
Figure (4.7): Water absorption test ................................................................................ 57
Figure (4.8): Average values of the compressive strength of the samples. ................... 58
Figure (4.9): Fired clay brick after failure in compression ............................................ 59
Figure (4.10): Compressive strength for bricks at different glass particle size .............. 60
Figure (A.1): Dried clay ................................................................................................ 71
Figure (A.2): Waste glass .............................................................................................. 71
Figure (A.3): Milled clay with water content 8% ......................................................... 72
Figure (A.4): Milled Clay and milled waste glass ......................................................... 72
Figure (A.5): Liquid limit test ....................................................................................... 72
Figure (A.6): Standard sieves ........................................................................................ 73
Figure (A.7): Sieve analysis test .................................................................................... 73
Figure (A.8): Hydrometer test ....................................................................................... 74
Figure (A.9): Drying clay bricks in the air conditions ................................................... 74
Figure (A.10): Drying clay bricks in the laboratory conditions .................................... 75
Figure (A.11): Fired clay bricks .................................................................................... 76
Figure (A.12): Clay bricks fired at 1000C: a) 0% glass, b) 10% glass, c) 20% glass,
d) 30% glass .................................................................................................................... 76
Figure (A.13): Fired clay Brick with 20% waste glass content ..................................... 77
Figure (A.14): Full and half fired clay brick ................................................................. 77
Figure (A.15): Fired clay bricks for different types of clay .......................................... 77
Figure (A.16): Compression machine ............................................................................ 78
Figure (A.17): Milling waste glass by Loss Anglos machine ....................................... 79
Figure (A.18): Water absorption test ............................................................................. 79

XII
List of Abbreviations
FCB Fired Clay Brick
WG Waste Glass
C Clay
G Glass
IOF Israeli Occupation Forces
FS Firing Shrinkage
BD Bulk Density
AP Apparent Porosity
WA Water Absorption
CS Compressive Strength
FA Fluxing Agent
ASTM American Society for Testing and Material
µm Micrometer
MPa Mega Pascal
TFT-LCD Thin Film Transistor-Liquid Crystal Display
SW Severe Weathering
FT Firing Temperature
TV Television
PC Personal Computer
CB Concrete Block
US United States of America
UK United Kingdom
BC Before Christ
AD Anno Domini
CNS Chinese National Standard
SEM Scanning Electron Microscope
(F/T) Freeze-Thaw Testing
C/B Absorption Coefficient
USEPA United States Environmental Protection Agency
ILO The International Labor Office
UNIDO The United Nations Industrial Development Organization
SIDA Swedish International Development Authority

1
1 Chapter (1)
Introduction

2
Chapter (1)
Introduction
1.1 Overview
Masonry unit is a significant basic material of construction required in all spheres of
constructional activities and constitute about 13 percent of the total cost of building
material required for construction (Alam, 2015). Masonry units are bonded together
with mortar to yield a composite building component generally a wall. Concrete
block and brick are the most common types of masonry units. These construction
materials are extensively employed worldwide both in developed and developing
countries. In Gaza Strip, concrete blocks which are made from a mixture of Portland
cement and aggregates is a main construction element used to make masonry walls,
may be due to long time tradition or even the good performance of masonries such as
strength properties.
However the production of concrete block became difficult in Gaza Strip. This is due
to the Israeli siege that restricts the importation of construction materials such as
Portland cement which used to make these masonry units. And also, because of high
Portland cement consumption in the concrete. For these reasons, fired clay brick may
be used as an alternative masonry unit to concrete blocks in Gaza Strip. It is expected
that in the future, this material will gain a higher market share in Gaza Strip.
Worldwide, bricks are a major building material and perhaps one of the oldest. The
worldwide annual production of bricks is currently about 1391 billion units and the
demand for bricks is predicted to be continuously increasing (Zhang, 2013). In this
respect, for the development of bricks with waste materials, further research and
development is necessary. Besides, not only on the technical, economic and
environmental features but also public education related to waste reusing and
sustainable development is required for wide production and application of these
bricks.
Clay materials are mostly used for the manufacture of bricks. waste can be added in
order to enhance its properties. Solid waste is a great concern among governmental

3
agencies, and environmentalist regarding the increasing amount of waste throughout
the world.
One waste material which has potential as a brick additive is waste glass. It is not
biodegradable and therefore creates a problem for solid waste disposal. The disposal
into landfills also does not provide an environment-friendly solution. Hence, the use
of waste glass in construction materials can be a worthy solution to the
environmental problem caused by this solid waste.
United Nations estimates the volume of solid waste disposed of annually over the
world to be 200 million tons, 7% of which is made up of glass (Topcu & Canbaz,
2004). For Palestine, this amount approaches 1.2 million tons (PCBS, 2011), 4% of
which is made up of glass with no recycling activities exist (ARIJ, 2009).
1.2 Problem Statement
For a long time and still nowadays, concrete blocks which are made from Portland
cement, sand and gravel, are main construction elements that are used to make
masonry walls in Gaza Strip. Since 2007, Israeli Occupation Forces (IOF) has
imposed siege on Gaza Strip and restricted entry of many goods and construction
materials such as cement and aggregate. Because of this Israeli ban, this research is
to focus on the using of the fired clay bricks as an alternative to concrete blocks.
The second problem in Gaza Strip is the accumulation of solid waste in landfills
without any treatment processes. Also, the landfills in Gaza Strip are very limited in
both their current and future count number and their individual capacity and
efficiency of usage (Work Team Ocha, 2009). This problem was considerably
increased and extremely highlighted especially after the repeated Israeli aggression
on Gaza Strip in 2008, 2012, and 2014; these resulted in huge amounts of industrial
and constructional wastes.
The target for engineers must be developing new ways to recover solid waste into
new products by the so called 3R system, reuse, reduce and recycling.
The main idea of this research is to focus on the ability of making fired clay bricks as
alternative masonry units to concrete blocks. And enhancing their properties by
adding waste glass. Also, the effect of waste glass particle size on the properties of

4
the fired body is studied. Generally, these wastes create disposal problems as well as
environmental pollution on a large scale throughout the world.
1.3 Research Objectives
The main objective of this research is to focus on the ability of making fired clay
bricks as alternative masonry units to concrete blocks and to investigate the effect of
the addition of waste glass on the properties of the fired clay bricks. These include
firing shrinkage, bulk density, apparent porosity, water absorption and compressive
strength. Also, the effect of waste glass particle size on the properties of the fired
body is studied.
Different amounts of waste glass (0, 10, 20, 30 and 40%) were added to the original
brick clay and fired at temperatures of 900, 1000 and 1100°C.
The successful use of waste glass will aid in reducing the environmental and health
problems related to the disposal of waste glass and the scarcity of land area needed
for disposal.
Reducing waste is not the only reason to investigate the addition of certain residues
into a clay matrix, although traditionally it has been the main purpose of research on
this topic. Other reasons may be considered. Wastes may save energy required in the
manufacturing process and reduce the manufacturing cost. The main aim was
achieved through the following objectives:
1. Identify the properties of clay raw materials such as sieve analysis, plastic
limit, liquid limit and Plasticity Index.
2. Identify the effects of adding waste glass material on the properties of fired
clay bricks mixes such as, firing shrinkage, bulk density, water absorption,
apparent porosity, and compressive strength.
3. Determine the optimal waste glass content to be added as a partial
replacement of clay.
4. Determine the optimal firing temperatures.
5. Comparison between the properties of bricks when using different waste
glass particle size.
5
1.4 Methodology
The following tasks were done to achieve the research objective:
1. Collecting the required information and documents related to the waste
materials such as clay and waste glass.
2. Undertake a comprehensive literature review on relevant subjects focused on
the using of waste glass in construction field.
3. Visiting the Gaza city glass shops to obtain related information and collect
samples.
4. Develop a suitable experimental program to study the use of waste glass in
fired clay bricks.
5. Analyzing the experimental test results to draw conclusions.
6. Conclusions and recommendations.
1.5 Thesis Layout
The present work contains five chapters organized as follows:
Chapter-1 (Introduction)
Introduces the use of the fired clay brick as a masonry building unit. Also, it includes
a description of research importance, scope, objectives, methodology, and the report
organization.
Chapter-2 (Literature Review)
Presents a general literature review for studying the use of additives such as waste
glass to fired clay brick in engineering practice. Also, an overview, history,
manufacturing, and types of the fired clay brick and glass was also provided.
Chapter-3 (Experimental Program)
Presents the experimentation program and the used materials. Furthermore, the
variables, preparation of raw material, producing and testing of specimens and
materials are also illustrated. This chapter ends with details of the testing methods.

6
Chapter-4 (Test Results and discussion)
Aims to find the properties of fired clay brick such as compressive strength, firing
shrinkage, water absorption, apparent porosity, bulk densities and the methodology
followed to highlight the usefulness of adding of recycled waste glass material as an
additive to fired clay bricks to improve their properties.
Chapter-5 (Conclusions and Recommendations)
A comprehensive summary of this research study, its major conclusions, and
recommendations for future research are presented.
References.
It includes the listing of references used in preparing the study.
Appendices.
It includes Tables from the ASTM Standard and divided into "A" .

7
2 Chapter (2)
Literature Review

8
Chapter (2)
Literature Review
2.1 Background
Bricks have been widely used as construction and building material all around the
world for a long time. Conventional clay based brick production generally uses the
mixtures of clays as raw materials, and requires the processes of shaping, drying and
firing at a high temperature. Fired clay bricks are the best known type of brick
construction materials as a masonry wall, both in loadbearing and non-load-bearing
walls. The use of fired clay bricks masonry walls is mostly used in the construction
of non-load-bearing walls (partitions and enclosures). There are many advantages of
using fired clay brick as the fire protection, the reduction of coating thickness, the
solution for thermal and acoustic insulation, the reducing of thermal conductivity,
which results in lower heat losses through the masonry walls. Thus, leading to
increased energy efficiency of buildings and save energy.
The quality of the brick depends on the composition of raw materials, production
method, firing method and firing temperature. The firing process sinters the particles
of clay together to form a bond which gives the bricks its characteristic strength and
durability. The sintering process is achieved by heating silicon dioxide or quartz
(SiO2) which occurs naturally in clay and shale to high temperatures, causing it to
melt. Upon cooling, the quartz forms a bond between adjacent clay or shale particles
at the points of contact.
One of the most common issues for Gaza Strip and other regions is accumulation of
unmanaged wastes and the used raw materials in the production of construction
materials such as clay brick. Especially, accumulation of unmanaged wastes has
great importance in Gaza Strip which can be considered as self-sufficient in regards
of brick-making raw material sources. Hence, solid wastes are candidates for
incorporation into building materials to improve their performance such as be more
durable and more energy efficient, and sustainable building materials. One technique

9
used to reduce such wastes is by recycling, which is not only benefits the
environment but also to the economy.
Different kinds of wastes have already been recycled in ceramic industry. Example
includes wasted glass, which are readily incorporated as an alternative ceramic raw
material or as a fluxing agent in stoneware, tiles, bricks and concrete.
In general, bottles including juice, soft drink and sauce bottles, glass jars and other
containers are among the sources of waste glass materials in many areas all over the
world. In Gaza Strip, the resources of waste glass are glass originating from
reconstruction and rehabilitation processes, glass bottles, glass jars, glass containers,
glass plates and cups, Mirrors, residual glass from windows industry, light globes,
medical or laboratory glass, televisions (TV), personal computers (PC) and ceramic
products.
2.2 Fired Clay Brick
Fired clay bricks are made from clay by burning it at high temperature. With their
attractive appearances and superior properties such as high compressive strength and
durability, excellent fire and weather resistance, good thermal and sound insulation.
Fired clay brick can be conveniently held in one hand and it is slightly longer than
twice its width. Bricks are available in various sizes. In the United State (US) the
most commonly used brick is the (extruded) modular brick, which measures
75
8 × 3
5
8 × 2
1
4 inch. Its nominal dimensions are 8 × 4 × 2
2
3 inch. In the United
Kingdom (UK) the standard brick size is 215×102.5×65 mm, shown in Figure (2.1).
Figure (2.1): (a) US common size brick, (b) UK standard size brick (Emmitt &
Gorse, 2014; Mehta et al., 2013).

10
2.2.1 Past and present
The first masonry units were based on dried mud and were used for the first time
around 8000 BC in Mesopotamia, an area bordered by the Tigris and Euphrates
rivers stretching from Southeast Turkey, Northern Syria, and Iraq reaching the
Arabic Gulf (Pacheco-Torgal, & Jalali, 2011).
Since 3000 BC, as humans started to settle, bricks appeared as an interesting product,
resistant, easily workable and usable, meaning that people could effectively protect
themselves against the elements such as rain or wind and predators. For many years,
bricks were hand-molded and sun-dried giving them rather fragile properties, but
around 2500 BC the first fired bricks are produced (Chabat, 1881). Specially, when
the Roman civilization has constructed several buildings with fired clay bricks.
The compressive strength and durability to weathering of fired clay bricks have made
them a widely used construction material for thousands of years. Common clay-fired
bricks still serve as the base of recent and amazing buildings.
With the appearance of Portland cement in the twenty-first century, masonry
concrete blocks emerged as an alternative to fired clay bricks, although the latter are
still predominant to a large extent. For instance in the UK, concrete blocks represent
only around 5% of the total masonry units production (Bingel & Bown, 2009). Still,
masonry fired clay bricks are and will continue to be widely used construction
materials around the world, even in highly developed countries. US demand for fired
clay brick and concrete block products is projected to increase nearly 12% annually
from a weak 2009 base to 12.4 billion units in 2014 (66% clay bricks and 37%
concrete blocks) (Freedonia Group, 2010). This represents just a small proportion of
the annual worldwide production.
2.2.2 Types of fired clay bricks
There are thousands of types of bricks that are named for their use, size, forming
method, origin, quality, texture, and materials.
2.2.2.1 Categorized by manufacture method:
1. Extruded – made by being forced through an opening in a steel die, with a
very consistent size and shape.

11
Wire cut – cut to size after extrusion with a tensioned wire which may
leave drag marks.
2. Moulded – shaped in moulds rather than being extruded .
Machine – moulded – clay is forced into moulds using pressure.
Handmade – clay is forced into moulds by a person.
3. Dry-pressed – similar to soft mud method, but starts with a much thicker
clay mix and is compressed with great force.
2.2.2.2 Categorized by use:
1. Facing brick – Facing bricks are intended for use in both structural and
nonstructural masonry, including veneer, where appearance is a requirement.
2. Hollow brick – Hollow bricks are used as either building or facing brick but
have a greater void area. Most hollow brick are used as facing brick in
anchored veneer. Hollow brick with very large cores are used in reinforced
brickwork and contain steel reinforcement and grout.
3. Common or Building brick – Building bricks are intended for use in both
structural and nonstructural brickwork where appearance is not a
requirement. Building bricks are typically used as a backing material.
4. Thin brick – Thin veneer bricks have normal face dimensions but a reduced
thickness. They are used in adhered veneer applications.
5. Paving brick – Paving bricks are intended for use as the wearing surface on
clay paving systems. As such they are subject to pedestrian and light or heavy
vehicular traffic.
Specialized use bricks:
6. Chemically resistant – bricks made with resistance to chemicals.
Acid brick – acid resistant bricks.
7. Engineering – a type of hard, dense, brick used where strength, low water
porosity or acid (flue gas) resistance are needed. Further classified as type A
and type B based on their compressive strength.
8. Fire or refractory – Refractory Bricks can withstand high and do not fuse as
these are chemically and physically stable even at a very high temperature
(highly heat-resistant bricks). These bricks are Fired at (1250-1400 ºC).

12
Clinker – a vitrified brick.
Ceramic glazed – fire bricks with a decorative glazing.
2.2.3 Brick manufacturing
2.2.3.1 Raw materials
The raw materials used in the manufacturing process of fired clay masonry units are
a mixture of natural clay, silt, and sand. The surface clays (recent sedimentary
formations), Shales (clays that have been subjected to high pressures) and fire clay
(mined at deeper levels) are commonly used in the production of fired clay units.
Surface and fire clays have a different physical structure from shales but are similar
in chemical composition. The two main constituents of all of these clays are the silica
and alumina. Some minor components are iron and other metal oxides, which are
particularly responsible for giving brick its red-brown color. White and light-colored
bricks are made by using clay that is naturally deficient in metal oxides and
removing whatever metal oxides are present in it. White bricks are generally more
expensive than the normal (red-brown) bricks. The range of chemical component and
mineralogical phases present in clay shown in Table (2.1).
Table (2.1): Range of chemical component present in clay (Walter Lee Sheppard, 1986).
Property
Chemical composition, wt.% Fireclay Brick
SiO2 56.8 – 68.6
Al2O3 22.9 – 38.7
Fe2O3 0.8 – 3.0
K2O 1 – 3.2
TiO2 1 – 2.8
MgO 0.1 – 1.2
Na2O 0.2 – 0.5
CaO 0.01 – 0.8
Phases identified
Quartz Trace – major
Mullite Minor – major
Cristobalite None – major
Hematite None – trace
Rutile None – trace
Amorphous Minor – major

13
2.2.3.2 Manufacturing process
Although modern technology has substantially changed the details of brick
manufacturing, it is conceptually simple and consists of the following six operations,
shown in Figure (2.2).
Figure (2.2): Diagrammatic Representation of Manufacturing Process (Brick
Industry Association TN9, 2006).
2.2.3.2.1 Mining clay from the ground and storage of raw materials
Clays are mined in open pits with power equipment. Then the clay mixtures are
transported to plant storage areas (Figure 2.3). Continuous brick production
regardless of weather conditions is ensured by storing sufficient quantities of raw
materials required for many days of plant operation.
Figure (2.3): Clay or Shale being crushed and transported to storage area (Brick
Industry Association TNT9, 2006).

14
2.2.3.2.2 Preparing raw materials
To break up large clay lumps and stones, the material is processed through size-
reduction machines before mixing the raw material (clay, sand, other additive
materials).
2.2.3.2.3 Forming wet clay into the desired brick shape (green bricks)
Mixing, the first step in the forming process, produces a homogeneous, plastic clay
mass. Usually, this is achieved by adding water to the clay in a pug mill, a mixing
chamber with one or more revolving shafts with blade extensions. After pugging, the
plastic clay mass is ready for forming. There are three principal processes for
forming brick: stiff-mud, soft-mud and dry-press.
Stiff-Mud Process - In the stiff-mud or extrusion process (Figure 2.4), water
in the range of 10 to 15 percent is mixed into the clay to produce plasticity.
After pugging, the mixed clay goes through a deairing chamber that
maintains a vacuum of 375 to 725 mm of mercury. Deairing removes air
holes and bubbles, giving the clay increased workability and plasticity,
resulting in greater strength. Next, the clay is extruded through a die to
produce a column of clay. As the clay column leaves the die, textures or
surface coatings may be applied. An automatic cutter then slices through the
clay column to create the individual brick (Figure 2.5). Cutter spacing's and
die sizes must be carefully calculated to compensate for normal shrinkage
that occurs during drying and firing.
Soft-Mud Process - The soft-mud or molded process is particularly suitable
for clays containing too much water to be extruded by the stiff-mud process.
Clays are mixed to contain 20 to 30 percent water and then formed into brick
in molds. To prevent clay from sticking, the molds are lubricated with either
sand or water to produce “sand-struck” or “water-struck” brick. Brick may be
produced in this manner by machine or by hand.
Dry-Press Process - This process is particularly suited to clays of very low
plasticity. Clay is mixed with a minimal amount of water (up to 10 percent),
then pressed into steel molds under pressures from 3.4 to 10.3 MPa by
hydraulic or compressed air rams.

15
Figure (2.4): Clay is extruded through a die and trimmed to specified dimension.
(Brick Industry Association TNT9, 2006).
Figure (2.5): Wire cutter cuts the wet clay column into several bricks (Mehta et al.,
2003).
2.2.3.2.4 Drying green bricks
Wet brick from molding or cutting machines contain 7 to 30 percent moisture,
depending upon the forming method. Before the firing process begins, most of this
water is evaporated in dryer chambers at temperatures ranging from about 38 ºC to
204 ºC. The extent of drying time, which varies with different clays, usually is
between 24 to 48 hours. Although heat may be generated specifically for dryer
chambers, it usually is supplied from the exhaust heat of kilns to maximize thermal
efficiency. In all cases, heat and humidity must be carefully regulated to avoid
cracking in the brick. Drying proses over time as in Figure (2.6).

16
Figure (2.6): Drying curve for brick. (ILO & UNIDO, n.d.)
2.2.3.2.5 Firing dried bricks in a kiln
2.2.3.2.5.1 Aims of firing
Firing is a key process in the manufacture of ceramic products, as it controls many
important properties of the finished ware. These include mechanical strength,
abrasion resistance, dimensional stability, resistance to water and chemicals, and fire
resistance.
2.2.3.2.5.2 Firing process
Bricks are fired between 6 and 36 hours, depending upon kiln type and other
variables, kiln is usually heated by natural gas or coal at a temperature higher than
900ºC. The kiln used in modern brick manufacturing plants is a long tunnel kiln
(Figure 2.7). The firing of the clay bricks intends to improve durability through
sintering, which can be seen as the bonding mechanism of clay particles.
Firing may be divided into five general stages: 1) final drying (evaporating free
water); 2) dehydration; 3) oxidation; 4) vitrification; and 5) flashing or reduction
firing. All except flashing are associated with rising temperatures in the kiln.
Although the actual temperatures will differ with clay or shale, final drying takes
place at temperatures up to about 204 ºC, dehydration from about 149 ºC to 982 ºC,
oxidation from 538 ºC to 982 ºC and vitrification from 871 ºC to 1316 ºC.

17
The clay is fired at a fusing temperature between 871ºC to 1482ºC, depending on the
type of clay. For building brick and face brick the temperature is controlled between
871ºC and 1200ºC, while the temperature ranges between 1315ºC and 1482ºC for
fire brick.
The key to the firing process is to control the temperature in the kiln so that incipient
fusion is complete, and partial vitrification occurs but viscous fusion is avoided.
The rate of temperature change must be carefully controlled and is dependent on the
raw materials, as well as the size and coring of the brick being produced. Kilns are
normally equipped with temperature sensors to control firing temperatures in the
various stages. Near the end, the brick may be “flashed” to produce color variations.
After the temperature has peaked and is maintained for a prescribed time, the cooling
process begins. Cooling time rarely exceeds 5 to 24 hours depending on kilns type.
Cooling is an important stage in brick manufacturing because the rate of cooling has
a direct effect on color.
Figure (2.7): A typical tunnel kiln (Mehta et al., 2003).
2.2.3.2.5.3 Physico-chemical changes during firing
Raw materials used in ceramic bodies are usually complex mixtures of clay minerals,
with other mineral matter such as quartz, feldspars, carbonates, gypsum, iron oxides
and sometimes organic matter. Refractory products are also made from a wide range
of non-clay minerals, together with specialized additives and binders (which may
include some clays). When clay-based ceramic products are fired in a kiln, any
residual moisture is driven off at temperatures of between 100 and 200 ºC. If organic

18
matter and iron pyrites are present, oxidation takes place at temperatures of between
about 300 and 500 ºC. Water combined within the structure of clay minerals (‘crystal
water’) is usually released at temperatures of between 500 and 650 ºC, whilst
carbonates such as calcite and dolomite dissociate with the release of carbon dioxide
in the temperature range 750 to 950 ºC.
The most important changes relating to the development of ceramic properties
involve the breakdown of the lattice structure of the original clay minerals, followed
by the formation of new crystalline compounds and glassy phases. The temperature
at which vitrification (glass formation) takes place, varies according to the
mineralogy of the clay. Vitrification usually commences at about 900°C and is
completed by about 1050°C (for many brick clays) or about 1100°C in the case of
more refractory fireclays. During the vitrification stage of ceramic firing, many non-
clay minerals such as quartz, oxides or iron, lime compounds and alkalis (oxides of
sodium and potassium) become incorporated in the fired body. Some sintering and
solid solution occurs, and eutectic reactions take place at the interface of mineral
grains and melt phases. Non-clay products such as some refractory products also
depend on sintering, vitrification or recrystallization stages, but in most cases much
higher temperatures are required to achieve the desired properties. (Mehta et al.,
2003; Brick Industry Association TNT9, 2006; Amrhein & Porter, 2009)
2.2.3.2.6 Storing finished products
After fired bricks are removed from the kiln, sorted, strapped in cubes, and stored in
the yard until delivery to the construction site, Figure (2.8) .
Figure (2.8): A typical storage yard at a brick manufacturing plant (Mehta et al., 2003).

19
2.2.4 Properties of fired clay bricks
All properties of brick are affected by raw material composition and the
manufacturing process. Most manufacturers blend different clays to achieve the
desired properties of the raw materials and of the fired brick. This improves the
overall quality of the finished product. The quality control during the manufacturing
process permits the manufacturer to limit variations due to processing and to produce
a more uniform product.
The most important properties of brick are 1) durability, 2) color, 3) texture, 4) size
variation, 5) compressive strength and 6) absorption.
2.2.4.1 Durability
The durability of brick depends upon achieving incipient fusion and partial
vitrification during firing. Because compressive strength and absorption values are
also related to the firing temperatures, these properties, together with saturation
coefficient, are currently taken as predictors of durability in brick specifications.
However, because of differences in raw materials and manufacturing methods, a
single set of values of compressive strength and absorption will not reliably indicate
the degree of firing.
2.2.4.2 Color
The color of fired clay depends upon its chemical and mineral content of the raw
materials, the firing temperatures, the method of firing control, and the atmosphere in
the kiln. Of all the oxides commonly found in clays, iron probably has the greatest
effect on color. Regardless of its natural color, clay containing iron in practically any
form will exhibit a shade of red when exposed to an oxidizing fire because of the
formation of ferrous oxide, white or yellow bricks have a higher lime content, as the
temperature is increased the colour moves through dark red, purple and then to
brown or grey at around 1300°C. When fired in a reducing atmosphere, the same
clay will assume a dark (or black) hue. Creating a reducing atmosphere in the kiln is
known as flashing or reduction firing.
Given the same raw material and manufacturing method, darker colors are associated
with higher firing temperatures, lower absorption values and higher compressive

20
strength values. However, for products made from different raw materials, there is no
direct relationship between strength and color or absorption and color.
2.2.4.3 Texture, coatings and glazes
Many brick have smooth or sand-finished textures produced by the dies or molds
used in forming. A smooth texture, commonly referred to as a die skin, results from
pressure exerted by the steel die as the clay passes through it in the extrusion process.
Most extruded brick have the die skin removed and the surface further treated to
produce other textures using devices that cut, scratch, roll, brush or otherwise
roughen the surface as the clay column leaves the die (Figure 2.9). Brick may be
tumbled before or after firing to achieve an antique appearance.
Although not produced by all manufacturers, glazed brick are made through a
carefully controlled ceramic glazing procedure.
Figure ( 2.9): Brick textures are applied by passing under a roller after extrusion
(Brick Industry Association TNT9, 2006).
2.2.4.4 Size variation
Clays shrink during both drying and firing; therefore, allowances must be made in
the size of the finished product. Both drying shrinkage and firing shrinkage vary for
different clays, usually falling within the following ranges:
Drying Shrinkage 2 to 8 percent
Firing Shrinkage 2.5 to 10 percent

21
Firing shrinkage increases with higher temperatures, which produce darker shades.
When a wide range of colors is desired, some variation between the sizes of the dark
and light units is inevitable.
To obtain products of uniform size, manufacturers control factors contributing to
shrinkage. Because of normal variations in raw materials and temperature variations
within kilns, absolute uniformity is impossible. Consequently, specifications for
brick allow size variations.
2.2.4.5 Compressive strength and absorption
Both compressive strength and absorption are affected by properties of the clay,
method of manufacture and degree of firing. For a given clay and method of
manufacture, higher compressive strength values and lower absorption values are
associated with higher firing temperatures. Although absorption and compressive
strength can be controlled by manufacturing and firing methods, these properties
depend largely upon the properties of the raw materials.
2.2.5 Specification for building brick
Current specification requirements for strength and absorption of building brick are
given from ASTM C62, C216, C652 and listed in Table (2.2). Strength and
absorption of brick from different producers vary widely.
Table (2.2): Physical requirements for various grades of building bricks (ASTM
C67-03, 2003).
Designation
Maximum Compressive Strength gross area, psi (MPa)
Maximum Water Absorption by 5-h Boiling, %
Maximum Saturation Coefficient
A
Average of 5 Brick
Individual Average of 5
Brick Individual
Average of 5 Brick
Individual
Grade SW 3000 (20.7) 2500 (17.2) 17.0 20.0 0.78 0.80
Grade MW 2500 (17.2) 2200 (15.2) 22.0 25.0 0.88 0.90
Grade NW 1500 (10.3) 1250 (8.6) No limit No limit No limit No limit
A
The saturation coefficient is the ratio of absorption by 24-h submersion in cold water to that after 5-h submersion in boiling water.

22
2.3 Glass
Glass has proven its importance in our lives through manufactured products such as
sheet glass, bottles, glassware, and vacuum tubing (Park et al., 2004).
2.3.1 History
The glass industry is very ancient with records dating back to the Egyptians more
than 3500 years ago. It is known that at least 6000 years ago-long before he had
learned to smelt iron - man knew how to make glass.
The first glass furnaces were volcanoes, and the first man to use glass took it from
the ground already fused and cooled. Natural glass formed by volcanic action is
called obsidian and can be found in many parts of the world. It is usually black and
translucent and was probably used to make arrow and spear heads, knives and razors.
The first man-made glass was in the form of a glaze - a mixture of sand and minerals
heated and fused onto the surface of stone or ceramic objects in an oven, thus
producing a hard, shiny outer layer.
By 1500 BC, man was forming glass beads and jewels and making small containers
by dipping a sand core into molten glass. Glass threads applied while the glass was
still hot gave the containers striking beauty.
Glass made before 100 BC was seldom transparent and it usually contained
impurities and imperfections.
Until the 17th century, the only real advance was in the selection and purification of
these ingredients. The pipe remained in use exclusively for producing all blown glass
up to the 19th century and is still used for many types of modern glass working
(Ward-Harvey, 2009).
After 1945, automated bottle production technology advanced continuously. The first
electronically controlled machines were introduced in 1970.
Present day, glass plays an important role in everyday life, in research and science, in
modern architecture and in future sectors. The glass industry is continuously
discovering new applications for glass based on state of the art technology and recent
scientific findings. One of the most recent applications for glass is its use as a
23
building material. Modern architectural designs feature expansive glass facades.
Glass is also used as an insulating material in the form of glass fiber, it is used to
make optical fibers for telephone calls or TV in communications technology and it
makes a contribution to regenerative energy technology in PV systems. Glass is also
a key component in displays and semi-conductors.
2.3.2 Raw materials and manufacture
The raw materials for glass manufacture are plentiful and fairly readily obtained by
surface mining operations. They consist generally of sand (SiO2), soda ash (Na2CO3),
Limestone (CaCO3), dolomite, feldspar, sodium sulphate. The major constituent -
sand - supplies the silica which is the actual glass former.
The other minerals calcium oxide (CaO), magnesium oxide (MgO) and alumina
(Al2O3) are added to provide for a better chemical durability and act as fluxes and
refiners in the melting process. The raw materials are heated to approximately
1500°C to melt them and obtain chemical reaction. The glass is then cooled in
controlled conditions, where it becomes viscous at 1000°C and hardens at about
500°C.
The viscous nature of hot glass allows it to be drawn, blown, spun, rolled or floated
before hardening. The cooling process imparts to the glass a brilliant, hard and
natural gloss. Reheating can change some characteristics.
Some other elements are introduced into glass to obtain special colorings and
physical performance as in the heat-absorbing and heat-reflecting glass. These glass
can be varied considerably in performance by very small quantities of metals, etc. as
is the case with metal alloys.
Glass factories for flat sheet materials are now well equipped and staffed, with
laboratories which maintain standards and quality controls of a very high level.
The older style factories now concentrate on the production of patterned glass for
building where the ribbon of molten glass passes between two rollers, producing one
smooth and one patterned surface.
The clear glass is almost exclusively produced by the modern `float glass’ factories.

24
Small artist/craftsman-type production units still exist for specialized artistic skills
and glass uses. Figure 2.10 summarize the glass processing in Flow chart.
Figure (2.10): Flow chart of glass processing (Mukherjee, 2013).
2.3.3 Types of glass
Nearly all commercial glass fall into one of six basic categories or types. These
categories are based on chemical composition. Within each type, except for fused
silica, there are numerous distinct compositions (Corning Museum of Glass, 2011).
2.3.3.1 Soda-lime glass
Soda-lime glass (Figure 2.11) is the most common (90% of glass made), and least
expensive form of glass. Resistance to high temperatures and sudden changes of
temperature are not good and resistance to corrosive chemicals is only fair. Soda-
lime glass is used to make windows, bottles, light bulbs and jars. Soda-lime glass is
light permeable and has a smooth, fine-pored surface, making it easy to clean. Soda-
lime glass expands very quickly under the influence of heat so care should always be
taken when putting hot water into a soda-lime glass container. Table (2.3) is a list of
some of approximate compositions of soda-lime-silica glass.

25
Table (2.3): Approximate compositions of Soda-Lime-Silica glass (Shelby, 2005).
Type of Glass Composition (by weight)
Soda-Lime-Silica 73% Silica – 14% Soda – 9% Lime – 4% Magnesia – 0.1% Alumina
Figure (2.11): Soda-Lime-Silica glass.
2.3.3.2 Lead (Crystal) glass
Lead glass (Figure 2.12) has a high percentage of lead oxide (at least 20% of the
batch). It is relatively soft, and its refractive index gives a brilliance that may be
exploited by cutting. It is somewhat more expensive than soda-lime glass and is
favored for electrical applications because of its excellent electrical insulating
properties. Thermometer tubing and art glass are also made from lead-alkali glass,
commonly called lead glass. This glass will not withstand high temperatures or
sudden changes in temperature. lead glass is used as Lead Crystal Tableware. Table
(2.4) is a list of some of approximate compositions of lead glass
Table (2.4): Approximate compositions of lead glass (Shelby, 2005).
Type of Glass Composition (by weight)
Lead (Crystal) 57% Silica – 31% Lead Oxide – 12% Potassium Oxide

26
Figure (2.12): Lead (Crystal) glass.
2.3.3.3 Boro-Silicate glass (Pyrex)
Glass with this composition is highly resistant to chemicals and temperature
fluctuation. That's why it is mainly used for chemical production applications, in
laboratories, for ampoules and bottles containing pharmaceuticals (Figure 2.13), to
package injectable, or as extremely durable lamp covers. Borosilicate glass is also
used in the household for baking and soufflé dishes and other "heatproof"
kitchenware. Table (2.5) is a list of some of approximate compositions of Boro-
Silicate glass.
Table (2.5): Approximate compositions of Boro-Silicate glass (Shelby, 2005).
Type of Glass Composition (by weight)
Boro-Silicate 81% Silica – 13% Boron Oxide – 4% Soda – 2% Alumina.
Figure (2.13): Boro-Silicate glass (Company of IndiaMART InterMESH Ltd, n.d.).

27
2.3.3.4 Aluminosilicate glass
Aluminosilicate glass has aluminum oxide in its composition. It is able to withstand
high temperatures and thermal shock and is typically used in combustion tubes,
gauge glass for high-pressure steam boilers, and in halogen-tungsten lamps (Figure
2.14) capable of operating at temperature as high as 750°C (British Glass
Manufacturers Confederation, 2013). Table (2.6) is a list of some of approximate
compositions of Alumino-Silicate glass.
Table (2.6): Approximate compositions of Alumino-Silicate glass (Shelby, 2005).
Type of Glass Composition (by weight)
Alumino-Silicate 64.5% Silica – 24.5% Alumina – 10.5% Magnesia – 0.5% Soda
Figure (2.14): Alumino-Silicate glass
2.3.3.5 Ninety-six percent silica glass
Ninety-six percent silica glass is a borosilicate glass, melted and formed by
conventional means, then processed to remove almost all the non-silicate elements
from the piece. By reheating to 1200°C the resulting pores are consolidated. This
glass is resistant to heat shock up to 900°C.
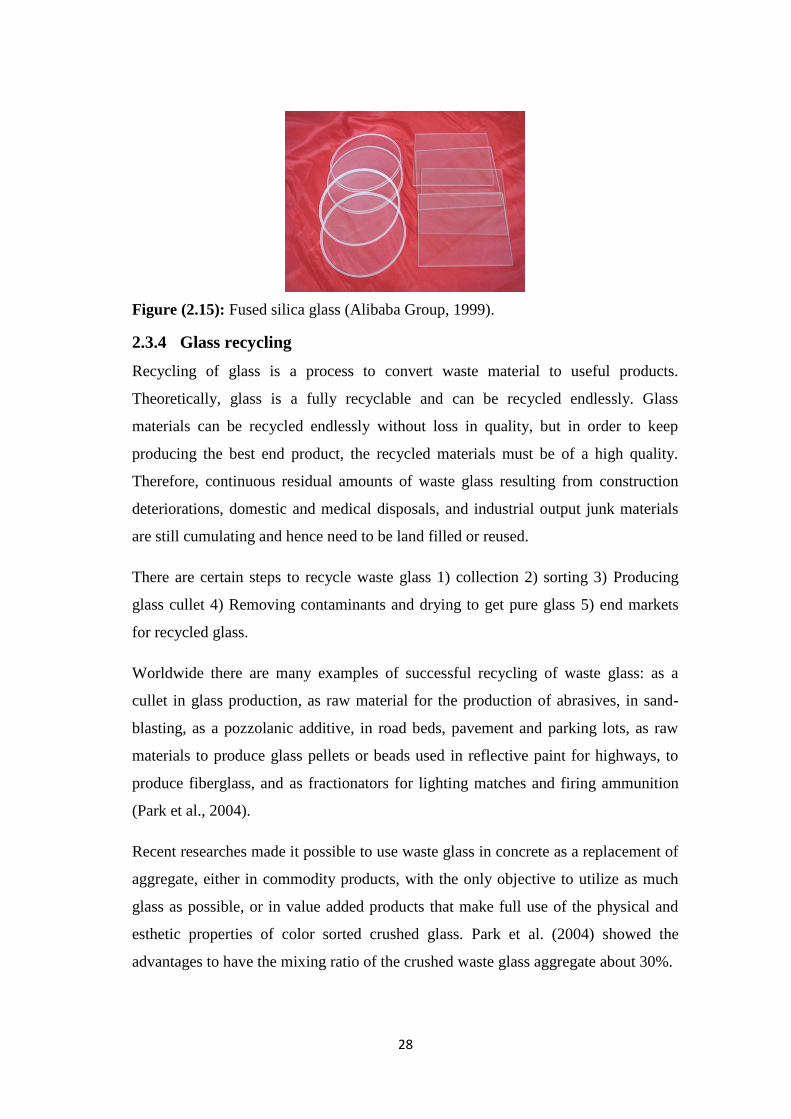
2.3.3.6 Fused silica glass
Fused silica glass is pure silicon dioxide in the non-crystalline state. It is very
difficult to fabricate, so it is the most expensive of all glass. It can sustain operating
temperatures up to 1200°C for short periods.
28
Figure (2.15): Fused silica glass (Alibaba Group, 1999).
2.3.4 Glass recycling
Recycling of glass is a process to convert waste material to useful products.
Theoretically, glass is a fully recyclable and can be recycled endlessly. Glass
materials can be recycled endlessly without loss in quality, but in order to keep
producing the best end product, the recycled materials must be of a high quality.
Therefore, continuous residual amounts of waste glass resulting from construction
deteriorations, domestic and medical disposals, and industrial output junk materials
are still cumulating and hence need to be land filled or reused.
There are certain steps to recycle waste glass 1) collection 2) sorting 3) Producing
glass cullet 4) Removing contaminants and drying to get pure glass 5) end markets
for recycled glass.
Worldwide there are many examples of successful recycling of waste glass: as a
cullet in glass production, as raw material for the production of abrasives, in sand-
blasting, as a pozzolanic additive, in road beds, pavement and parking lots, as raw
materials to produce glass pellets or beads used in reflective paint for highways, to
produce fiberglass, and as fractionators for lighting matches and firing ammunition
(Park et al., 2004).
Recent researches made it possible to use waste glass in concrete as a replacement of
aggregate, either in commodity products, with the only objective to utilize as much
glass as possible, or in value added products that make full use of the physical and
esthetic properties of color sorted crushed glass. Park et al. (2004) showed the
advantages to have the mixing ratio of the crushed waste glass aggregate about 30%.

29
Many countries have been taking much effort to recycle waste glass bottles. A bottle
recovery system has already been established, through which empty bottles
previously containing refreshing beverages, condiments, milk, etc. are collected,
washed, and reused. In addition, broken bottles and bottles previously containing
chemicals, cosmetics, etc. are melted to be reused or crushed and turned into paving
material, masonry unit material, glass marble, glass tile, glass fiber, lightweight
blowing agents, etc. (Park, 2000; Glass Bottle Recycling Council, 1994; Clean Japan
Center, 1997). In Korea, empty used bottles are similarly reutilized in that they are
collected, sorted, and crushed to be used mostly as a raw material for new bottles.
The UK currently recycles around 50% of container glass (like bottles and jars),
while both Switzerland and Finland recycle more than 90% of their glass
(Scrapnews, 2016). However, only negligible proportions of the total used bottles are
actually currently being recycled.
US consumes about 12 million tons of glass and recycles about 25 % only. For
Turkey, this amount approaches 120,000 ton, 67% recycles, and it has been reported
that in Germany 3 million ton of waste glass are being recycled (Topcu, & Canbaz,
2004). Generally, In 1998, an estimated 11 million t of glass entered the waste steam
but only 29% of this material was recycled (USEPA, 2000). In other words, 7.8
million tons went into landfills, seemingly defeating the purpose of curbside
collection and the investments of environmental agencies to improve recycling on the
collection end. Unluckily, there is no glass recycling so far in Gaza Strip. Therefore,
there is a potential to partially replace the waste glass powdered as a partial
replacement for clay to produced fired clay bricks.
2.4 Previous Studies
Previous works have been reported that waste glass can be used as a potential fluxing
agent to help lowering firing temperatures of clay bodies. The utilization of wasted
glass could then be an alternative way to save energy in the production process and
to reduce the manufacturing cost. In addition, waste glass, when incorporated into a
mixture, could induce the vitrification in clay bodies, resulting in higher density, less
water absorption, and lower drying shrinkage.

30
The idea of using glass as a brick flux (additive) has been researched and reported on
for many years. In a sense, one could say that the concept goes back hundreds of
years. In the competition to replicate Asian porcelain, early researchers added glass
frit to clay formulas to attain translucence and density. Some formulas for Irish
Belleek pottery claim that it was 50 percent glass frit (Peterson, 1996). The Italian
Medici porcelains of the 16th century also contained large amounts of glass (Rado,
1988).
On a more pragmatic level, after the energy crisis of the early 1970’s, the United
States Bureau of Mines sponsored research to see whether energy could be saved
using ground glass as a brick flux (Tyrell et al., 1972). In the 1990’s the Clean
Washington Center sponsored research on the viability of glass in clay bodies as a
strategy to improve recycled glass markets (CWC Report GL99-1, 1999). The
government of the United Kingdom sponsored studies and trials to investigate glass
as a brick flux, both to save energy and to improve markets for recycled glass (Waste
& Resources Action Programme Project, 2004). Recently, several researches around
the world have been carried out summarizing the use of waste glass as additives for
fired clay brick, tile and stoneware to enhance its properties. The waste glass can be
mixed with clay in different proportions to prepare high quality bricks. The addition
of waste glass to brick specimen range from 0.5 to 94% by mass, most studied tended
to concentrate on range between 5% and 20% of glass by mass, with the glass
particle size ranging from 45 to 600 µm. In all reported test results, shrinkage was
found to increase as percentage glass by mass increased, as well as with increased
firing temperature (Brown and Mackenzie, 1982; Sanders, 1998; Smith, 2004;
Matteucci et al., 2002; Tucci et al., 2004; Chidiac and Federico, 2007; Hwang et al.,
2006; Lin, 2007a; Lin, 2007; Luz and Ribeiro, 2007; Raimondo et al., 2007; Demir,
2009; Loryuenyong et al., 2009; Mustafi et al., 2011; Phonphuak et al., 2015).
Hwang et al. (2006) also indicated that the finer glass (5 µm) exhibited twice the
shrinkage of the coarse glass (150 µm) in compositions. While a glass particle size of
less than similar to those of a control brick, the addition of course glass, with particle
size range between 132 and 150 µm at 4% mass caused shrinkage to decrease
(Sanders, 1998). According to the National Brick Research Council (NBRA, 2003),

31
larger particle sizes lead to incomplete sintering, where glass particles act more as an
aggregate with sintered edges than a completely sintered medium.
In previous studies, the strength properties of specimens containing waste glass were
determined by both compressive strength and modulus of rupture testing. The range
of compressive strength values varied between specimens, which may be attributed
to slight variations in particle size, specimen size, and firing temperature for each
testing method. However, the trend for all results clearly indicates an increase in
compressive strength with increased addition of waste glass, especially between 10%
and 30% mass. (Shutt et al., 1972; Youssef et al., 1998; Leshina and Pavnev, 2002;
Smith, 2004; Kim et al., 2005; Tucci et al., 2004; Chidiac and Federico, 2007; Lin
2007a; Demir, 2009; Loryuenyong et al., 2009; Phonphuak et al., 2015). Demir
(2009) also observed that the amorphous nature of waste glass particles enhances the
sintering action, which leads to achieving a better strength in bricks. Fired clay bricks
with suitable mechanical properties can be obtained at a proper firing temperature by
using waste glass with a content in the range of 15 to 30% by weight of clay
(Loryuenyong et al., 2009). Moreover, (Phonphuak et al., 2015) stated that the use of
10 wt.% waste glass and firing at 900ºC yielded bricks with similar strength
compared to that of normal clay brick fired at 1000°C. In other research, Chidiac and
Federico (2007) indicated that the strength and transport properties of clay bricks
were found to improve as a result of the improvement of pore structure when 15%
(by weight of clay) of both fine and coarse waste glass was added, the compressive
strengths achieved in this research were much higher than those discussed in the
literature (Shutt et al., 1972; Smith, 2004; Lin, 2007b). The general trends reported
by both Shutt et al. (1972) and Lin (2007b) at 20% to 30% waste glass addition were
recreated in this study with only 15% waste glass addition. This is most likely due to
the use of smaller waste glass particle sized specimens than those tested in the
literature. Leshina and Pavnev (2002) concluded that the optimum content of glass in
a ceramic mixture is 15–20%, which makes it possible to produce ceramic wall
materials meeting the requirements of the state standards regarding water absorption
with improved mechanical properties. Also they observed A jump-like increase in
compression strength in samples containing glass power with particle size of 140 –
315 µm. Moreover, when the clay tiles mixed with 70% of glass and fired at 1050°C,

32
the compressive strength in the tiles is about 210 MPa (Kim et al., 2005). Values
reported for modulus of rupture demonstrate a similar trend, i.e., an increase in
modulus of rupture with increased percentage of glass by mass (Shutt et al., 1972;
Brown and Mackenzie, 1982; Sander, 1998; Matteucci et al., 2002; Lin, 2007; Luz
and Ribeiro, 2007; Raimondo et al., 2007; Dondi, 2009; Mustafi et al., 2011). Brown
and Mackenzie 1982 also studied the influence of particle size, plasticity and
pressing pressure on the properties of a ceramic-like body containing 90% recycled
waste glass. The result shown that a progressive increase in the proportion of fines in
the sample results in a progressive increase in the degree of sintering, as reflected in
increased strength. The course particle sizes lead to a marked deterioration in
mechanical properties. Also the properties deteriorate progressively with increasing
water content in clay. The effect of varying the pressing pressure is not large.
On the other hand and Besides firing shrinkage and mechanical properties, water
absorption (WA) and apparent porosity (AP) properties of fired clay bricks
containing waste glass were determined in previous studies. In all reported test
results, both WA and AP were found to decrease as percentage glass by mass
increased, as well as with increased firing temperature (Brown and Mackenzie, 1982;
Youssef et al., 1998; Leshina and Pavnev, 2002; Matteucci et al., 2002; Kim et al.,
2005; Hwang et al., 2006; Lin, 2007a; Lin, 2007; Luz and Ribeiro, 2007; Raimondo
et al., 2007; Demir, 2009; Loryuenyong et al., 2009; Mustafi et al., 2011; Lin et al.,
2013; Phonphuak et al., 2015). Loryuenyong et al., (2009) also indicated that water
absorption as low as (2-3) % was achieved for bricks containing (15–30) % by
weight of glass content and fired at 1100°C. When the glass waste content was 45 %
by weight, apparent porosity and water absorption was rapidly increased. A
preliminary experiment from the same author showed that with smaller particle size
of glass, this problem can be avoided. Youssef et al. (1998) recommended to addition
of glass at a level of 33.3 % by weight and firing at 1100°C to get 5.6 % water
absorption for non-glazed floor tiles. Kim et al. (2005) indicated that the optimal
properties obtained in the tiles are the water absorption of about 0.9%, and the
apparent porosity of about 2.1%. when the composition containing the glass of 70%
is fired at 1050°C. But Luz and Ribeiro (2007) who used glass particles size below
40 µm, reached the water absorption values of the tiles approximately to 0.0% by

33
using 20% waste glass content and 1150°C firing temperature. The SEM
micrographs was used in the experimental tests, it showed that the increased glass
phase and reduced porosity with waste glass addition (Phonphuak et al., 2015).
Moreover, WA was compared with standards by many authors (Youssef et al., 1998;
Leshina and Pavnev, 2002; Lin et al., 2013). Lin et al. (2013) reported that the 24-h
absorption rate of the waste glass brick made from samples containing 30% waste
glass sintered at 1000°C all met the Chinese National Standard (CNS) building
requirements for first-class brick (water absorption of the bricks were was 10% of the
brick).
There is a lack of the comparable data available with respect to the durability testing
of brick with waste glass additives. When water infiltrates into the brick, it decreases
the durability (Demir, 2009). Results of the absorption coefficient testing, which is
often a means of estimating durability, suggested an increase in durability with
increasing waste glass addition (Shutt et al., 1972; Sander, 1998; Leshina and
Pavnev, 2002; Smith, 2004; Chidiac and Federico, 2007; Demir, 2009; Lin et al.,
2013). Leshina, and Pavnev (2002) who used sodium sulphate to simulate freeze-
thaw (F/T) testing, reported that specimens containing 5% waste glass were resistant
to at least 70 cycles of freezing and thawing. Lin et al. 2013 also indicated that the
salt crystallization test and wet–dry tests showed that the addition of waste glass had
highly beneficial effects in that it increased the durability of the bricks.
Different types of glass were incorporated in fired clay bricks and tiles in the
literature. The ground waste glass was incorporated to the clay body by Phonphuak
et al. (2015), Youssef et al. (1998), and Demir (2009). Loryuenyong et al. (2009)
investigated the reuse of waste glass from structural glass walls in fired clay bricks.
Leshina and Pavnev (2002) and Matteucci et al. (2002) used container glass cullet
and Mustafi et al. (2011) used waste broken bottles for their works. Another type of
waste glass was used by Lin et al. (2013), he studied the effect of solar panel waste
glass on fired clay bricks. Moreover, Chidiac and Federico (2007) investigated the
effect of non-recycled waste glass additives on fired clay brick. However, Hwang et
al. (2006) concluded that there was no major difference between window glass and
post-consumer glass being utilized in clay products. Other types of glass addition to

34
ceramics has also contributed to enhance their properties. The hazardous waste glass
is one of this, it was used with fired clay bricks and tiles in previous studies. Dondi et
al. (2009) investigated the utilization of funnel and panel glass of TV and PC glass
waste mixed with clay. These systems comprised of waste glass with high Pb
(funnel) or Ba–Sr concentrations (panel). It was demonstrated that adding of 2% of
glass waste to clay body doesn’t bring about significant changes in the technological
performance of fired bricks. But, adding more than 5% of the waste may have
deleterious on mechanical properties and efflorescence. The results in this research
for leaching test demonstrated no significant environmental pollutant emission. In
other research, the utilization of wastes glass from thin film transistor-liquid crystal
display (TFT-LCD) optical waste glass (TVs and computers) mixed with clay by Lin
(2007a) and Lin (2007b), these wastes are composed mostly of glass with some
heavy metals. TFT-LCD can be pulverized and ground and subsequently blended
with clay. The advantages of less water absorption, less weight loss on ignition, and a
gain in compressive strength in the clay-TFT-LCD waste glass bricks should
encourage the use of TFT-LCD waste glass as a brick additive (Lin, 2007a). In
another study, Raimondo et al. (2007) results showed that TV/PC cathodic tube and
screen glass, added to a typical porcelain stoneware body, are able to partially
replace the conventional industrial fluxes, without significant repercussions on the
technological process. Their presence allow to obtain good technological and
mechanical properties, complying with the latest requirements of the industrial
practice. Moreover, both glass are able to modify the body sintering pattern with a
different effectiveness degree.
2.5 Concluding Remarks
The previous studies showed that lots of efforts have been done for investigating the
effect of using waste glass materials as an additive in the fired clay brick, but all of
them are trying to conform to the relevant specifications in their local areas. This
research aims to implement a similar task but with applying the available local
materials.

35
3 Chapter (3)
Experimental Program

36
Chapter (3)
Experimental Program
3.1 Introduction
The experimental program for this research study is primarily concerned with
investigating the potential usefulness of using waste glass in making fired clay
bricks. Currently, the waste glass generated in Gaza Strip is thrown away into the
dump areas. Waste glass usually is produced from empty glass containers and
different construction and reconstruction remains and waste materials. The waste
glass is to be milled into powder. Then the powder glass is mixed with raw materials
to make fired clay brick and then observing the effect of recycled powdered glass on
the properties of fired clay brick.
The use of waste glass as a clay body additive is therefore attractive both
environmentally and economically. Adding waste glass to bricks not only reduces the
consumption of clay raw material, diverts waste from landfills, it also provides
potential profit in tipping fees for manufacturers. In additions to mining,
transportation, and storage costs, the firing process is an aspect of brick production
which is energy intensive. By reducing the firing temperature by even a few degrees,
while still maintaining brick strength and durability, the energy requirements of the
firing process could be reduced.
The experimental program of the current research was carried out to explore the
effects due to the use of waste glass and the firing behavior and physical mechanical
properties following the testing procedure specifications of ASTM.
All materials used in this study are locally available. Clay is to be used in this
investigation with (0%, 10%, 20%, 30%, and 40%) of waste glass powder as a
partial replacement for clay.
Figure (3.1) shows the methodology for manufacturing porous clay bricks and Figure
(3.2) summaries the testing program in the form of a flow chart.

37
Figure (3.1): Methodology for manufacturing clay bricks.
Figure (3.2): Flow chart for testing program.
5 Tests
285 Tests
3 bricks
19 Groups
6
bricks for each group
3
bricks
3
Firing shrenkage test
3
Bulk density test
3
Water absorption test
3
Apperant porosity test
3
bricks
3
Compressive strength test

38
3.2 Preparing of Raw Materials
Clay material used in this research was obtained by mixing three types of raw clay in
equal parts from three areas in Gaza Strip (east Gaza, east khan Younis, Al Qarara)
(Figure 3.3). The waste glass was obtained from a local shop glazing windows in
Khanyounis ( Figure 3.4 B). The raw materials were initially subjected to preparation
such as drying, milling and sieving; prepared by powdering in a laboratory to particle
size smaller than 600 μm for both clay and waste glass (Figure 3.4 C) for brick
production. Another particle size (150 μm) of waste glass was prepared to compare
with 600 μm (Figure 3.5). The liquid limit, plastic limit and plasticity index for the
clay used are 38, 20 and 18 .The particle size distribution test was carried out for
both clay and waste glass by using sieve size analysis and hydrometer method. The
results of the particle size analysis are shown in Figure (3.6).
Figure (3.3): Clay raw materials as collected from three areas.

39
Figure (3.4): a) Clay, b) Waste glass, c) Clay and Waste glass powdered, d) Fired
clay brick.
Figure (3.5): Different waste glass particle size (150 µm and 600 µm).
Figure (3.6): Particle size distribution curve of the clay and waste glass powder.
3.3 Experimental Procedures
In order to obtain comparable results, 19 different groups of samples were prepared
for the tests depending on the amount of waste glass added, heating temperature and
particles size of waste glass. The mix proportions were prepared based on the dry
weight of the materials. Mixture proportions were presented in Table (3.1).
0
20
40
60
80
100
120
1 10 100 1000
Pas
sin
g %
Diameter Micron
Clay
Course Glass
Fine Glass

40
Solid brick clay samples were produced using pilot laboratory procedures and
equipment (Figure 3.7). The raw materials were mechanically mixed for 5 min to get
a uniform consistency (Figure 3.8). After dry mixing, water about 8 wt.% of total
weight was sprayed to the powder mixtures for the production of semi-dry molded
brick samples. Test specimens with a dimension 215mm (L)×102.5mm (W)×65
mm(H) were produced in a laboratory type moulded (Figure 3.9). A hydraulic press
was used to make bricks by compressed it with a pressure of 15 MPa. The shaped
samples were dried under laboratory conditions (21°C) for 24 h (Figure 3.10) and
then dried in an oven (Figure 3.11). Samples were dried in an oven maintained at
45°C for 6 h and then at 110°C for 24 h. The dried samples were fired at 900, 1000
and 1100°C in an electrical furnace at a heating rate of 2.5°C/min until 600°C, and
then 5°C/min until 900°C, 1000°C and 1100°C (Figure 3.12). The time taken to
reach the required temperature was about 5 h to 6 h and the specimens were kept at
this temperature for 1 h to achieved strength. The samples were naturally cooled
down in the furnace. Thus, sufficient samples could be produced from each of the
series of samples to perform the experiments (Figure 3.13). A total of 114 brick
samples were prepared to testing purpose (Figure 3.4 D).
Table (3.1): The brick mixtures prepared from the raw materials used.
Temperature (°C) Group name Clay (wt.%) Waste Glass (wt.%)
900
A1 100 0
B1 90 10
C1 80 20
D1 70 30
E1 60 40
1000
A2 100 0
B2 90 10 (Coarse and fine glass)
C2 80 20 (Coarse and fine glass)
D2 70 30 (Coarse and fine glass)
E2 60 40 (Coarse and fine glass)
1100
A3 100 0
B3 90 10
C3 80 20
D3 70 30
E3 60 40

41
Figure (3.7): Laboratory containers filled by milled clay.
Figure (3.8): Electrical mixer.
Figure (3.9): Brick making Mould.

42
Figure (3.10): Drying brick samples under laboratory conditions.
Figure (3.11): Drying brick samples in an oven.
Figure (3.12): Firing brick sample in electrical furnace.
Figure (3.13): Fired clay bricks.

43
3.4 Testing Program
For the testing program, six brick samples are prepared for each group of the 19
groups that listed previously in Table (3.1). These sixes brick samples are divided
into two categories, one to test compressive strength and another to tests water
absorption, firing shrinkage, bulk density and apparent porosity. A total number of
285 testing data points were used after controlling the compiled testing cases from
data quality and completeness points of views.
The reference testing bricks for comparison purposes were the sample with no waste
glass content, sample A1, A2 and A3 according to firing temperature.
Tests were carried out on at least 3 bricks and the average value of the results was
reported.
3.5 Testing Method for the Physical and Mechanical Properties
The brick samples then underwent series of tests including water absorption, bulk
density, apparent porosity, firing shrinkage and compressive strength, to determine
their quality in comparison with the ASTM Standards methods.
3.5.1 Physical properties
Several physical properties of the fired clay bricks can be determined: linear
shrinkage, water absorption, apparent porosity, bulk density, apparent density, and
loss on ignition. In this research, only the first four properties were considered.
3.5.1.1 Linear shrinkage
Linear shrinkage was obtained by measuring the length of the sample before and
after drying or before and after firing, or even over the whole process using a caliper
with a precision of ±0.01 mm, according to the standard ASTM C326 (ASTM C326-
09, 2014). The firing linear shrinkage (before and after firing) expressed as a
percentage and calculated according to the following formula is presented, as these
results were more readily available.
Firing shrinkage(%) =Ldried − Lfired
Ldried× 100

44
Where Ldried is the length of the oven-dried sample (mm) and Lfired is the length of
the fired sample (mm).
Firing shrinkage was determined by measuring the physical dimensions of the
specimens before and after firing.
3.5.1.2 Bulk density, Water absorption and Apparent porosity
The bulk density, Water absorption, and apparent porosity were measured according
to Archimedes method described in standard ASTM C373 (ASTM C373-88, 2006),
which involves drying the test specimens to constant mass (D), boiling them in
distilled water for 5 h and soaking them for an additional 24 h, at ambient
temperature. Following impregnation, the mass (S) of each specimen while it was
suspended in water, and its saturated mass (M), were determined.
3.5.1.2.1 Apparent porosity
During drying and firing, the added particles burn leaving voids due to their
breakdown, but also to gas emissions by decomposition of the matter (water, carbon
dioxide). Noteworthy, there is no fixed maximal porosity for fired clay bricks.
Apparent porosity expresses, as a percent, the relationship of the volume of open
pores of the specimen to its exterior volume. Calculate the apparent porosity as
follows:
P (%) =M − D
V× 100
where V (cm3) is the exterior volume ( V = M – S ).
D: dried mass
M: saturated mass
S: suspended mass in water
3.5.1.2.2 Water absorption
The creation of porosity leads to an increase in water absorption. The voids in the
structure while immersed, are filled with water and, depending on the arrangement of
the pores and the way they are linked together, this can penetrate the material more
or less easily, with a preferential pathway. For water absorption, no standardized

45
maximum value exists. However, a very large absorption capacity could be
detrimental for the final brick as it may affect the durability of the product and its
resistance to natural conditions.
Water absorption expresses as a percent, the relationship of the mass of water
absorbed to the mass of the dry specimen. Calculate the water absorption as follows:
A =M − D
D× 100
D: dried mass
M: saturated mass
3.5.1.2.3 Bulk density
The bulk density and the apparent density change (not including porous).
bulk density, in grams per cubic centimeter, of a specimen is the quotient of its dry
mass divided by the exterior volume, including pores. Calculate the bulk density as
follows:
B =D
V× 100
where V (cm3) is the exterior volume ( V = M – S ).
D: dried mass
M: saturated mass
S: suspended mass in water
3.5.2 Mechanical properties
To ensure the engineering quality of a material, especially for building construction
use, mechanical testing is the essential criteria. the compression or bending strength
are represent for mechanical properties.
3.5.2.1 Compressive strength
The compressive strength was measured for brick samples according to ASTM C67
(ASTM C67-03, 2003).

46
3.5.2.1.1 Specimen Size.
ASTM C67 requires that the specimen be full height and width, and approximately
one-half of a brick in length, plus or minus 1 inch (25 mm). However, if the testing
machine being used is not capable of providing sufficient force to crush the
approximate half-brick, a piece of brick having a length of one-quarter of the original
full brick length may be used, so long as the total cross-sectional area is not less than
14 inch2 (90 cm
2), (Figure 3.14). The specimen size that used in this research is
102.5×100×65 mm.
Figure (3.14): Compressive Strength Specimens. (Brick Industry Association
TNT39, 2001).
Although ASTM C67 does not specifically state the method in which the samples are
to be obtained, it has been common practice to use pieces of brick which are left over
from sawing the units to the desired size is acceptable (Figure 3.15). A minimum of
five specimens is required.

47
Figure (3.15): Saw machine.
The compressive strength test specimens should be oven-dried. The amount of
moisture in the brick can affect its compressive strength; the higher the moisture
content, the lower the apparent strength. Therefore, by drying the specimens before
testing, one variable that can affect the results is eliminated.
3.5.2.1.2 Speed of Testing
The speed of testing specified in ASTM C67 should be adhered to, primarily for the
purpose of obtaining consistent results. Past experience on the effect of the rate of
loading on the compressive strength of specimens has shown that, as the rate
increases, there can be significant increases in the apparent compressive strengths of
the specimens. The requirements of ASTM C67, while not particularly specific, do
provide a moderate rate of loading which, if followed, will produce consistent results
that will represent more accurately the true compressive strengths of the specimens.
ASTM C67 specifies that the specimen should be loaded to one-half of the expected
maximum load, and then the rate should be adjusted such that the test is completed in
not less than one minute and not more than two minutes. For this reason, it is a good
idea to do one or two preliminary tests to get an estimate of the maximum strength.
Figure 3.16 illustrates the time vs. loading criteria of ASTM C67. The speed that
used in this research is 2 KN/Sec.

48
Figure (3.16): Compressive test loading rate (Brick Industry Association TNT39, 2001).
3.5.2.1.3 Calculation and Reporting
The compressive strength is determined by dividing the maximum compressive load
by the gross cross-sectional area of the specimen. Since five specimens are used, the
arithmetic average should be determined. Calculate and compressive strength of each
specimen to the nearest 0.01 MPa as follows:
Compressive strength =W
A
C = compressive strength of the specimen MPa,
W = maximum load, N, indicated by the testing machine, and
A = average of the gross areas of the upper and lower bearing surfaces of the
specimen, mm2.

49
4 Chapter (4)
Test Results and Discussion

50
Chapter (4)
Test Results and Discussion
4.1 Introduction
The bricks in this research were made from clay and waste glass by controlling the
firing temperatures, waste glass ratio and particle size. At least 3 samples were used
for each test for all groups listed previously in Table (3.1) and the averages are
presented and discussed in this section. The investigated and reported physical and
mechanical properties are bulk density, apparent porosity, water absorption, firing
shrinkage and compressive strength are shown in the following.
4.2 Test Results
4.2.1 Firing shrinkage
Shrinkage is related to the loss of water among clay particles resulting in the closer
packing of clay particles and resulted shrinkage. During firing, especially during
sintering at high temperatures, ceramic particles fuse together leading to greater
proximity and thus enhancing linear shrinkage. It is considered that the reduction in
firing shrinkage of brick material had a positive impact. To minimize shrinkage,
firing temperature which is an important parameter affecting the degree of shrinkage
must be controlled during the firing process. Large shrinkage could create problems
as it may cause cracks and dimensional defects. As shown in Table (4.1) and Figure
(4.1), clay bricks were fired at temperatures between 900 and 1100°C. The firing
shrinkage increased with increasing firing temperature and also increased with
increasing the amount of waste glass. The addition of large amount of wasted glass
decreased firing shrinkages of the bricks. Shrinkage is, normally, an important factor
to determine the degree of densification during firing. From Figure (4.1), it can be
seen that large amount of waste glass additive induces negative shrinkage, i.e. an
expansion of the material. This evident in sample E3 which has 40 wt.% waste glass,
the value of shrinkage in this case was equal to -5.20 (Figure 4.2). This may be due
to appeared bubbles protruding from the exterior bricks and these bubbles have been
formed due to a chemical reaction. Some bubbles that had been trapped in the

51
specimens caused expansion. This phenomenon typically occurs during sintering of
materials containing small amounts of water. On the other hand, small amount of
waste glass additives gives positive shrinkage, representing water evaporating out of
the system. Bricks must have a firing linear shrinkage lower than 8% in order to
retain good mechanical performance (Weng et al., 2003). The results showed that
shrinkage occurred in the fired clay brick samples was in the range of 0.51 - 6.19%,
whereas, the control fired clay bricks without any waste glass addition had
comparable firing shrinkage between 0.51% - 1.03%. Shrinkage clearly depends on
the amount of waste glass additive and the firing shrinkage. The firing shrinkage for
all brick sample are within the safe limits for industrial production which indicated in
ASTM C326. However, it can be seen that for all the additives tested, linear
shrinkages are below 8%. In addition, the lower this result, the better the final
product's properties.
Table (4.1): Average values of the firing shrinkage of the samples.
Waste glass (%) Firing shrinkage (%)
900°C 1000°C 1100°C
0 0.51 0.64 1.03
10 0.69 0.84 2.88
20 0.71 1.01 4.55
30 0.78 1.32 6.19
40 0.81 1.67 -5.20
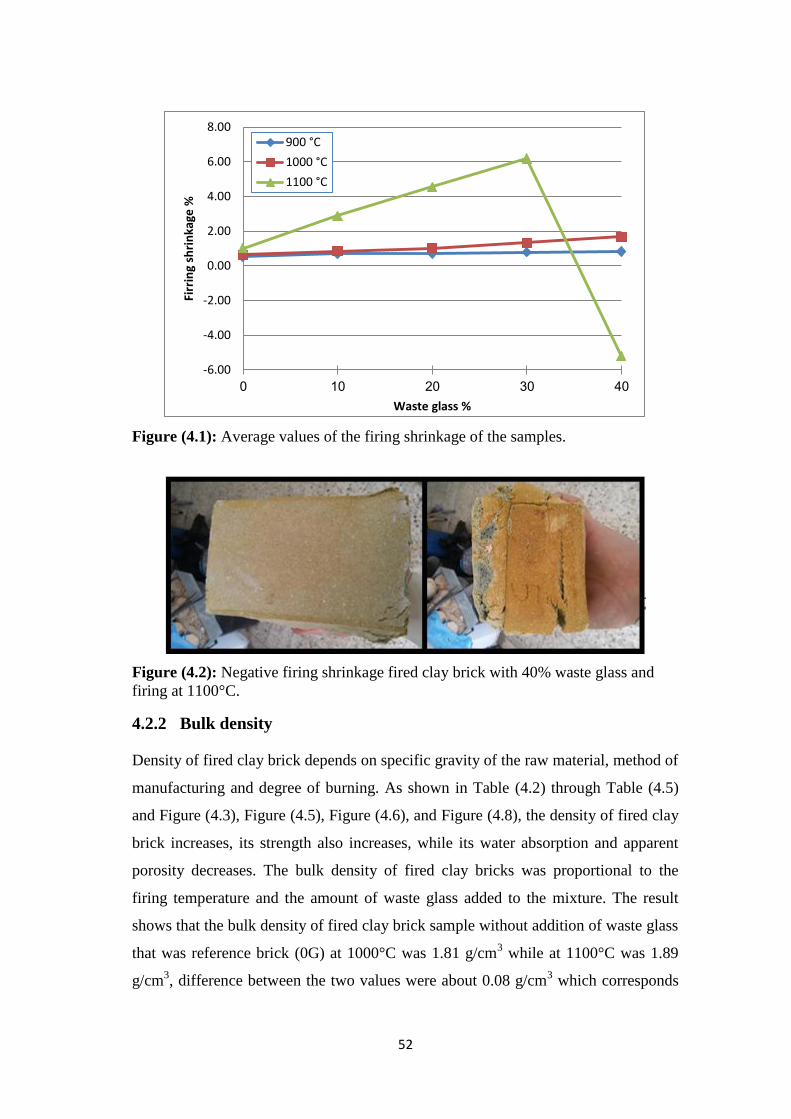
52
Figure (4.1): Average values of the firing shrinkage of the samples.
Figure (4.2): Negative firing shrinkage fired clay brick with 40% waste glass and
firing at 1100°C.
4.2.2 Bulk density
Density of fired clay brick depends on specific gravity of the raw material, method of
manufacturing and degree of burning. As shown in Table (4.2) through Table (4.5)
and Figure (4.3), Figure (4.5), Figure (4.6), and Figure (4.8), the density of fired clay
brick increases, its strength also increases, while its water absorption and apparent
porosity decreases. The bulk density of fired clay bricks was proportional to the
firing temperature and the amount of waste glass added to the mixture. The result
shows that the bulk density of fired clay brick sample without addition of waste glass
that was reference brick (0G) at 1000°C was 1.81 g/cm3 while at 1100°C was 1.89
g/cm3, difference between the two values were about 0.08 g/cm
3 which corresponds
-6.00
-4.00
-2.00
0.00
2.00
4.00
6.00
8.00
0 10 20 30 40
Firr
ing
shri
nka
ge %
Waste glass %
900 °C
1000 °C
1100 °C

53
to 4.1%. As the firing temperature increased, the bulk density increased. This is
possible due to increased consolidation or vitrification between particles in the body
with increasing of temperature. The bulk density of fired clay bricks also increased
with an increase in the amount of waste glass. The bulk density of fired clay bricks
fired at 900°C varied from 1.80 g/cm3 to 1.82 g/cm
3 , there is no marked effect. The
effect is more pronounced for clay bricks fired at 1000°C, which were varied from
1.81 g/cm3 to 1.87 g/cm
3, all show an improvement in bulk density that increases
with an increase in the amount of waste glass. For firing temperature of 1100°C, the
bulk density of fired clay bricks varied from 1.89 g/cm3
to 1.97 g/cm3, a slight
increase is observed, then the bulk density tends to decrease to 1.64 g/cm3 for more
than 30% wt. waste glass addition. As a result, it could be deduced that the addition
of waste glass at relatively low temperatures densifies the mixture. At higher
temperatures, bloating presumably occurs having for effect to decrease the bulk
density as the amount of waste glass grows larger. The bulk density is related to
durability and water absorption of clay bricks. Figure (4.4) shows bulk density
device.
Table (4.2): Average values of the bulk density of the samples.
Waste glass % Bulk density (g/cm
3)
900°C 1000°C 1100°C
0 1.80 1.81 1.89
10 1.81 1.84 1.94
20 1.81 1.85 1.96
30 1.82 1.86 1.97
40 1.82 1.87 1.64

54
Figure (4.3): Average values of the bulk density of the samples.
Figure (4.4): Bulk density device.
4.2.3 Water absorption and apparent porosity
Water absorption is an important factor for the durability of clay bricks. When water
infiltrates brick, it decreases the durability of brick. Thus, the internal structure of
1.5
1.55
1.6
1.65
1.7
1.75
1.8
1.85
1.9
1.95
2
0 10 20 30 40
Bu
lk d
en
sity
g/c
m3
Waste glass %
900 °C
1000 °C
1100 °C

55
brick must be sufficiently dense to void the leaking of water. To increase density and
decrease water absorption of clay bricks, the firing temperature must be raised. Table
(4.3), Table (4.4), Figure (4.5) and Figure (4.6), showed that the lowest water
absorption value was obtained for fired clay bricks (E3) which has the lowest
porosity. The highest water absorption value was seen in (A1) which has the highest
porosity. As understood here, there is a close relationship between water absorption
and apparent porosity of bricks. For clay brick samples fired at 900°C, the decreases
in water absorption and apparent porosity are reasonable for small percentages
additions, but nearly stops for waste glass in excess of 30%. For the other two
temperatures 1000°C and 1100°C, the relation has almost a constant slope with a
clear trend of much lower water absorption and apparent porosity with increasing
percentages of waste glass. The reduction in both water absorption and apparent
porosity after firing suggested the increase in the local liquid phase at high firing
temperature, and thus contributed to a decrease in the pore volume. Generally, The
water absorption values decreased with increasing firing temperature, and decreased
with increasing amounts of waste glass in the mixtures. The water absorptions of
clay bricks fired at the temperatures between 900 and 1100°C were in the range of
16.24% to 4.83%. Thus, The samples were found to be within ASTM C62
specifications (17% for Grade SW) (ASTM C62-04, 2004). The waste glass particles
fused with the clay bodies and this contributed to the densification of the clay brick.
Figure (4.7) shows water absorption test.
Table (4.3): Average values of the water absorption of the samples.
Waste glass % Water absorption (%)
900°C 1000°C 1100°C
0 16.24 15.63 13.45
10 15.38 13.53 10.29
20 14.77 12.75 8.31
30 13.94 11.44 5.93
40 13.73 10.86 4.83

56
Figure (4.5): Average values of the water absorption of the samples.
Table (4.4): Average values of the apparent porosity of the samples.
Waste glass % Apparent porosity (%)
900°C 1000°C 1100°C
0 33.67 31.26 25.23
10 30.76 27.39 19.96
20 29.41 25.53 16.29
30 27.6 22.86 11.53
40 27.83 21.70 7.90
Figure (4.6): Average values of the apparent porosity of the samples.
0
2
4
6
8
10
12
14
16
18
0 10 20 30 40
Wat
er
abso
rbti
on
%
Waste glass %
900 °C
1000 °C
1100 °C
0
5
10
15
20
25
30
35
0 10 20 30 40
Ap
par
en
t p
oro
sity
%
Waste glass %
900 °C
1000 °C
1100 °C

57
Figure (4.7): Water absorption test.
4.2.4 Compressive strength
The compressive strength is the most important index for assuring the engineering
quality of a building material because with a higher compressive strength, other
properties also improved. The results in Table (4.5) and Figure (4.8) indicated that
the compressive strength of fired clay bricks depended greatly on the amount of
waste glass addition and firing temperature. The addition of waste glass considerably
contributed to vitrification and enhanced the strength development by closing the
internal pores with glassy phase. There are three curves fitted for the data of
compressive strength in MPa. For the samples fired at 900°C, the curve shows an
initial increase in strength as waste glass is added. The value rises from 18.61 MPa to
about 22.91 MPa as 10% waste glass is added. This is in accordance with Figure
(4.5) where the value of apparent porosity drops to an almost constant value over
20% waste glass addition. This means that the increase in compressive strength at
that low firing temperature is mainly due to reduction in porosity. At 1000°C there is
a gradual increase in strength from 21.33 MPa (0% waste glass) to 43.17 MPa (40%
waste glass addition) in harmony with the decrease in apparent porosity observed in
Figure (4.6), although, as the amount of waste glass addition reaches 40%, there is a
tendency for the compressive strength to reach a nearly fixed value. This may be due
to the effect of the low strength of the glassy phase formed as its amount increases.
This effect is more pronounced for the sample fired at 1100°C which reaches a peak
in compressive strength at 30% waste glass addition followed by expanding the brick

58
samples and a serious decrease (Figure 4.2). In view of porosity results of Figure
(4.6), it is clear that as the percentage glassy phase largely increases (at 1100°C), the
reduction in apparent porosity does not play a marked role in sustaining high values
of strength. The optimum compressive strength was 96.37 MPa, it obtained for the
bricks containing 30 wt.% glass and fired at 1100ºC . Figure (4.9) shows the fired
clay brick after compression failure.
Table (4.5): Average values of the compressive strength of the samples.
Waste glass % Compressive strength (MPa)
900°C 1000°C 1100°C
0 18.61 21.33 28.82
10 22.91 30.67 47.45
20 20.41 32.34 77.75
30 21.91 42.75 96.37
40 17.88 43.17 55.98
Figure (4.8): Average values of the compressive strength of the samples.
0
20
40
60
80
100
120
0 10 20 30 40
Co
mp
ress
ive
str
en
gth
MP
a
Waste glass %
900 °C
1000 °C
1100 °C

59
Figure (4.9): Fired clay brick after failure in compression.
4.2.5 The effect of the glass particle size
Table (4.6) & Figure (4.10) show that a progressive increase in the proportion of
fines in the sample results in a progressive increase in the degree of sintering, as
reflected in increased strength, elasticity, density and shrinkage, and decreased
apparent porosity. The result shows that the compressive strength of fired clay brick
sample with addition of waste glass particle size smaller than 150 µm that was
special reference brick (D2) at 1000°C was 65.81 MPa while reference brick (D2)
was 43.17 MPa, difference between two values were about 22.64 MPa which
corresponds to 52.4 %.
Table (4.6): Compressive strength for bricks at different glass particle size.
Waste glass %
Compressive Strength (MPa) @ 1000 °C
Coarse glass (600 µm glass) Fine glass (150 µm glass)
10 30.67 38.11
20 32.34 44.84
30 42.75 53.25
40 43.17 65.81

60
Figure (4.10): Compressive strength for bricks at different glass particle size.
0
10
20
30
40
50
60
70
10 20 30 40 Co
mp
ress
ive
Str
en
gth
MP
a
Waste Glass %
Coarse glass (600 µm glass)
Fine glass (150 µm glass)

61
5 Chapter (5)
Conclusions and
Recommendations

62
Chapter (5)
Conclusions and Recommendations
5.1 Conclusions
Brick samples were heated to temperatures which varied between 900 and 1100°C
for 6 h, with a heating rate of 2.5°C/min until 650°C, and then 5°C/min until 900°C,
1000°C and 1100°C. The conclusions derived from the aforementioned experiments
are as follows.
1. The compressive strength of the fired clay bricks increased with increases in
the amount of waste glass content and firing temperature.
2. The bulk density of the fired clay bricks increased with increases in the
amount of waste glass content and firing temperature.
3. The firing shrinkage of the fired clay bricks increased with increases in the
amount of waste glass content and firing temperature.
4. The apparent porosity of the fired clay bricks decreased with increases in the
amount of waste glass content and firing temperature.
5. The water absorption of the fired clay bricks decreased with increases in the
amount of waste glass content and firing temperature.
6. The strength of fired clay bricks is greatly dependent on the amount of waste
glass and on the firing temperature.
7. The fired clay bricks are very porous if a significant amount of wasted glass
is added (larger than 30 wt.% glass).
8. In this research the optimal heating temperature for maximum compressive
strength and other properties is 1100°C.
9. The optimal amount of waste glass that can be mixed with clay to produce
good quality bricks is 30% by weight.
10. The used ratio of waste glass in the brick body should not be more than 30%
by weight.
11. There is a similar trend between compressive strength and bulk density.
12. The advantages of lower apparent porosity, lead to less water absorption and
gain in compressive strength.

63
13. The particle size of waste glass powder is very important and has a significant
effect on the properties of fired clay brick; the finest the particle size, the
highest is the compressive strength.
14. Because fired clay bricks are indeed an economical product with cheap,
abundant raw materials, locally available, produced by a simple
manufacturing process (drying, firing) and their interesting physical and
mechanical, especially their strength and durability. It can be used as an
alternative to concrete blocks.
15. The advantages of using bricks as a masonry building units should stimulate
the use of waste glass as a brick additive in the near future.
16. When the amount of waste glass reaches 40% by weight, the brick samples
are expanded and lead to a marked deterioration in mechanical properties.
17. There is a close relationship between water absorption and apparent porosity
of fired clay bricks.
5.2 Recommendations For Further Research
The following recommendations are purposed for further research:
1. Study the performance of fired clay bricks under freezing and thawing
conditions.
2. Study the effect of waste glass additive on the thermal conductivity of fired
clay bricks.
3. Study the effect of firing time on the on the properties of fired clay bricks.
4. Field study is needed to show the social acceptance of using fired clay bricks as
alternative to concrete blocks.
5. The Ministry of Public Works and Housing, and The Engineers Syndicate are
to encourage using these bricks for constructing buildings, and to start with
the government buildings as pilot projects.

64
6 References

65
References
Alam, A. (2015). Pre-Feasibility report for proposed brick earth excavation project.
Samastipur, Bihar: Niranjan bricks.
Alibaba Group. (1999). Retrieved June 16, 2016, from Alibaba Group for marketing
web site: http://www.alibaba.com/product-detail/fused-silica-wafer-opaque-
quartz-glass_1851769203.html.
Amrhein, J.E., & Porter, M.L. (2009). Reinforced Masonry Engineering Handbook:
Clay And Concrete Masonry.(6th ed.). Washington: Masonry Institute Of
America MIA.
ASTM C326-09. (2014). Standard Test Method for Drying and Firing Shrinkages of
Ceramic Whiteware Clays. ASTM Book of Standards, USA.
ASTM C373-88. (2006). Standard Test Method for Water Absorption, Bulk Density,
Apparent Porosity, and Apparent Specific Gravity of Fired Whiteware Products,
Ceramic Tiles, and Glass Tiles. ASTM Book of Standards, USA.
ASTM C62-04. (2004). Standard Specification for Building Brick (Solid Masonry
Units Made From Clay or Shale). ASTM Book of Standards, USA.
ASTM C67-03. (2003). Standard Test Methods for Sampling and Testing Brick and
Structural Clay Tile. ASTM Book of Standards, USA.
Bingel, P., & Bown, A., (2009). Sustainability of masonry in construction. In J.
Khatib (Ed.), Sustainability of construction materials. Cambridge: Woodhead
Publishing Limited.
Brick Industry Association. (2009). Technical Notes on Brick Construction,
Manufacturing of Brick TN9. Virginia: Brick Industry Association.
Brick Industry Association. (2001). Technical Notes on Brick Construction, Testing
for Engineered Brick Masonry- Brick and Mortar TN39. Virginia: Brick
Industry Association.
British Glass Manufacturers Confederation. (2013). Types of glass. Retrieved June 16,
2016, from: British Glass web site (http://www.britglass.org.uk/aluminosilicate -
glass).
Brown, I.W.M., Mackenzie, K.J.D. (1982). Process design for the production of a
ceramic-like body from recycled waste glass: Part 2 The effect of fabrication
variables on the physical properties of the fired body. Journal of Materials
science, 17, 2171-2183.
Chabat, P. (1881). The brick and terracotta: historical study of the use of these
materials, manufacturing and use. Construction patterns and chosen decoration
in the architecture of different peoples. Paris: Pierre Chabat.

66
Chidiac, S.E., & Federico, L.M. (2007). Effects of waste glass additions on the
properties and durability of fired clay brick. Canadian Journal of Civil
Engineering , 34(11), 1458-1466.
Clean Japan Center. (1997). Research on the Status of the Recycling Technology
Development: Reuse of the Glass Bottle Cullet for Other Purposes. Tokyo:
Clean Japan Center report CJC.
Corning Museum of Glass. (2011, December 8). Types of glass. Retrieved June 16,
2016, from: The Corning Museum of Glass (http://www.cmog.org/article/types-
glass).
CWC Report. (1999). Glass Clay body Flux. Project code: GL99-1. USA: CWC TV.
Demir, I. (2009). Reuse of waste glass in building brick production. Waste Manage
and Res, 27, 572-577.
Dondi, M.G., Guarini, M., Raimondo, C., Zanelli. (2009). Recycling PC and TV
waste glass in clay bricks and roof tiles. Journal of Waste Management, 29,
1945-1951.
Emmitt, S. & Gorse, C.A. (2014). Barry's Introduction to Construction of Buildings.
(3th ed.). UK: Wiley Blackwell.
Freedonia Group. (2010). Brick & block to 2014-industry market research, market
share, market size, sales, demand forecast, market leaders, company profiles,
industry trends. Cleveland: http://www.freedoniagroup.com/Brick-And-
Block.html.
Glass Bottle Recycling Council. (1994). Glass Bottle Recycling, Pamphlet of Glass
Bottle Recycling Council. Seoul: GBRC of ROK.
Hwang, J.Y., Huang, X., Garkida, A., & Hein, A. (2006). Waste colored glasses as
sintering aid in ceramic tile production. Journal of Miner Mater Character Eng.,
5, 119-129.
Kim, Y.K., Jung, Y.G., Song, J.B., Shin, M.C., & Lee, H. S (2005). Fabrication and
physical properties of tiles recycled waste glass. Journal of the Korean Ceramic
Society, 42(3), 193-197 .
Leshina, V.A., & Pivnev, A.L. (2002). Ceramic wall material using glass waste.
Glass and Ceramics, 59(9-10), 356-358.
Lin, K.L. (2007a). The effect of heating temperature of thin film transistor-liquid
crystal display (TFT-LCD) optical waste glass as a partial substitute partial for
clay in eco-brick. Journal of Cleaner Production, 15, 1755-1759.
Lin, K.L. (2007b). Use of thin film transistor liquid crystal display (TFT-LCD) waste
glass in the production of ceramic tiles. Journal of Hazardous Materials, 148,
91–97.

67
Lin, K.L., Huang, L.S., Shie, J.L., Cheng, C.J., Lee, C.H., & Chang, T.C. (2103).
Elucidating the effects of solar panel waste glass substitution on the physical and
mechanical characteristics of clay brick. Environ Techno, 34(1), 15-24.
Loryuenyong, V., Panyachai, T., Kaewsimork, K., & Siritai, C. (2009). Effects of
recycled glass substitution on the physical and mechanical properties of clay
bricks. Waste Management, 29(10), 2717-2721.
Luz, A.P., Ribeiro, S. (2007). Use of glass waste as a raw material in porcelain
stoneware tile mixtures. Ceramics International, 33, 761–765
Matteucci, F., Dondi, M., and Guarini, G. (2002). Effect of soda-lime glass on
sintering and technological properties of porcelain stoneware tiles. Ceramics
International, 28(8), 873-880.
Mehta, M., Scarborough, W., & Armpriest, D. (2013). Building Construction;
Principles, Materials, and Systems. (2nd ed.). USA: Pearson.
Mukherjee, S. (2013). The Science of Clays Applications in Industry; Engineering
and Environment. (1st ed.). Kolkata, India: Springer.
Mustafi, S., Ahsan, M., Diwan, A.H., Ahmed, S., Khatun, N., Absar, N. (2011).
Effect of Waste Glass Power on Physic-Mechanical Properties of Ceramic Tiles.
Bangladesh Journal of Scientific Research, 24(2), 169–180.
National Brick Research Centre NBRC. (2003). Reducing Fuel Consumption in
Brick Manufacturing; Section 10. Clemson: Clemson University.
Pacheco-Torgal, F., & Jalali, S. (2011). Eco-efficient construction and building
materials. (1st ed.). London: Springer.
Palestinian Central Bureau of Statistics PCBS. (2011). Solid waste in Palestine.
Palestine: Qalqilia.
Park, S.B. (2000). Development of recycling and treatment technologies for
construction waste, Construction and transportation technology research report.
Ministry of the Environment of ROK, Seoul,153 – 156.
Park, S.B., Lee, B.C., & Kim, J.H. (2004). Studies on Mechanical Properties of
Concrete Containing Waste Glass Aggregate. Cement and Concrete Research,
34, 2181-2189.
Peterson, S. (1996). The Craft and Art of Clay. Overlook Press, p. 149.
Phonphuak, N., Kanyakam, S., & Chindraprasirt, P. (2015). Utilization of waste
glass to enhance physical-mechanical properties of fired clay brick. Journal of
Cleaner Production (2015), doi:10.1016/j.jclepro.2015.10.084.
Rado, P. (1988). An Introduction to the Technology of Pottery. Pergamon Press, p.
181.

68
Rambaldi, E., Tucci, A., Esposito, L. (2004). Use of recycled materials in the
traditional ceramic industry. Ceramics International, 1(2), 13–23.
Raimondo, M., Zanelli, C., Matteucci, F., Guarini, G., Dondi, M., Labrincha, J.
(2007). Effect of waste glass (TV/PC cathodic tube and screen) on technological
properties and sintering behavior of porcelain stoneware tiles. Ceramics
International, 33(4), 615–623.
Recycleinme Website. (2006, November 25). Retrieved May 5, 2016, from:
Recycleinme (http://scrapnews.recycleinme.com/newsdetails-285.aspx).
Sander, J. (1998). Glass addition to brick. Brickyard Road, 2, 14-18.
Shelby, J.E. (2005). Introduction to Glass Science and Technology. (2nd ed.). British
Library: The Royal Society of Chemistry (RSC).
Shutt, T.C., Campbell, H., & Abrams, J.H., (1972). New building materials
containing waste glass. Ceramic Bulletin, 51, 670-671.
Smith, A.S. (2004). To demonstrate commercial viability of incorporating ground
glass in bricks with reduced emissions and energy savings. Project code: GLA2-
018. The Waste and Resource Action Programme, Banbury, Oxon, UK.
The Applied Research Institute- Jerusalem ARIJ. (2009). Sloid waste management in
Palestine. Palestine.
The International Labor Office ILO, & the United Nations Industrial Development
Organization UNIDO. (n.d.). technical memorandum on small-scale
brickmaking. Sweden: Swedish International Development Authority SIDA.
Topcu, I.B., Canbaz, M. (2004). Properties of Concrete Containing Waste Glass.
CemConcrRes, 34, 267–274.
Tyrell, M. E., Goode, & Alan, H. (1972). Waste Glass as a Flux for Bricks Clays.
U.S. Dept. of the Interior Report of Investigations 7701.
United States Environmental Protection Agency USEPA. (2000). Municipal solid
waste generation-recycling and disposal in the United States: Facts and figures
for 1998. Rep. No. EPA530-F-00-024, Washington, D.C.
http://www.epa.gov/epaoswer/non-hw/muncpl/ pubs/99charac.pdf& (March 10,
2003).
Walter Lee Sheppard. (1986). Corrosion and Chemical Resistant Masonry Materials
Handbook. (1st ed.). Pennsylvania: Noyes Publications.
Ward-Harvey, K. (2009). Fundamental Building Materials. (4th ed.). Florida:
Universal-Publishers Boca Raton.
Waste & Resources Action Program Project. (2004). To demonstrate the commercial
viability of incorporating ground glass in bricks with reduced emissions and
energy savings. Project code GLA2-018. The Waste and Resource Action
Program, Banbury, Oxon, UK.

69
Weng, C.-H., Lin, D.-F., & Chiang, P.-C. (2003). Utilization of sludge as brick
materials. Adv. Environ. Res., 7, 679-685.
Work Team. (2009). Pollution caused by solid waste, rubble, and construction debris
is a serious threat to the sea and the shore of the Gaza Strip. Palestine: Ocha.
Youssef, N.F., Abadir, M.F, & Shater, M.A.O. (1998). Utilization of Soda Glass
(Cullet) in the Manufacture of Wall and Floor Tiles. Journal of the European
Ceramic Society, 18, 1721-1727.
Zhang, L. (2013). Production of bricks from waste materials – a review.
Construction Building Material, 47, 643–55.

70
7 Appendices

71
Appendix (A)
Research Photos
Figure (A.1): Dried clay.
Figure (A.2): Waste glass.

72
Figure (A.3): Milled clay with water content 8%.
Figure (A.4): Milled Clay and milled waste glass.
Figure (A.5): Liquid limit test.

73
Figure (A.6): Standard sieves.
Figure (A.7): Sieve analysis test.

74
Figure (A.8): Hydrometer test.
Figure (A.9): Drying clay bricks in the air conditions.

75
Figure (A.10): Drying clay bricks in the laboratory conditions.
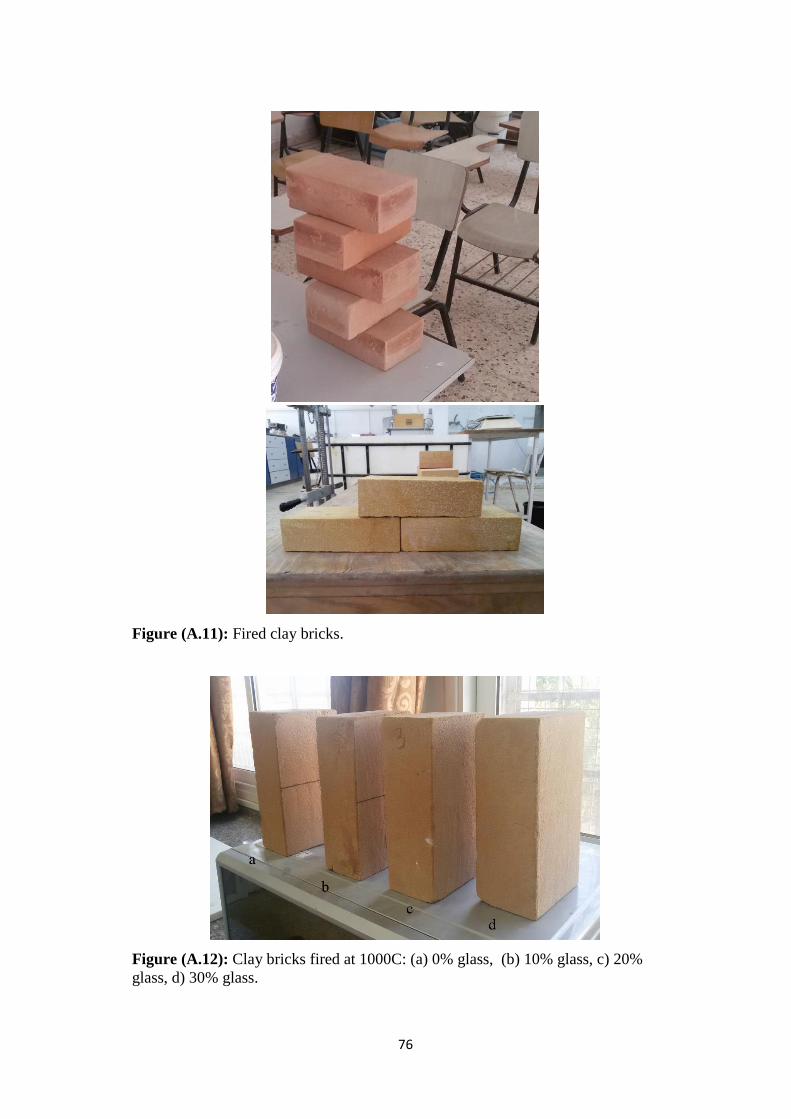
76
Figure (A.11): Fired clay bricks.
Figure (A.12): Clay bricks fired at 1000C: (a) 0% glass, (b) 10% glass, c) 20%
glass, d) 30% glass.

77
Figure (A.13): Fired clay Brick with 20% waste glass content.
Figure (A.14): Full and half fired clay brick.
Figure (A.15): Fired clay bricks for different types of clay.

78
Figure (A.16): Compression machine.

79
Figure (A.17): Milling waste glass by Loss Anglos machine.
Figure (A.18): Water absorption test.