propensity scores in medical research - american … scores in medical research robert h. habib...
TRANSCRIPT

Propensity Scores in Medical Research
Robert H. Habib
November 11, 2013

Objectives Briefly review time-line of using propensity scores in
medical research
Learn what is a propensity score and How it can be used to analyze and interpret comparative data (Treatments; Risk Groups)
Focus on use of Propensity Matching to simulate Randomized comparisons
Discuss Propensity Matching Examples in Cardiovascular Medicine

Where it All Started (1983)

Timeline: Use of Propensity Scores
Year of Pubmed Citation
1985 1990 1995 2000 2005 2010
Pu
bm
ed
Pro
p. S
co
re A
rtic
les
0
200
400
600
800
1000
1200
14001312
5 1159
26
270
836
437-fold increase1984 - 2012
Search Term: (propensity score OR (propensit* AND (score* OR scoring* OR match* OR adjust*)))

3.36-fold increase1984 - 2012
Year of Pubmed Citation
1985 1990 1995 2000 2005 2010
Pu
bm
ed
Pro
p. S
co
re A
rtic
les
0
200
400
600
800
1000
1200
14001312
5 1159
26
270
836
Year of Pubmed Citation
1985 1990 1995 2000 2005 2010
Pu
bm
ed
Art
icle
s (
Th
ou
sa
nd
s)
0
200
400
600
800
1000
1200
437-fold increase1984 - 2012
3.36-fold increase1984 - 2012
The rate of using propensity scores in Pubmed articles has increased at about 130 times the rate of increased in articles overall.

Why the Fast Rising Popularity of Propensity Scores?

Levels of Evidence
Entirely Dependent on below
Great, But expensive, time consuming, often impractical (or not doable)

Attractive features of RCTs
Randomization in RCTs
Treatment and Control study arms are similar in terms of observed and unobserved characteristics.
Any average difference in outcomes between the groups can only be attributed to the Treatment effect.
And, hence, quantifying the Treatment effect is simple, rarely requires risk adjustment or regression modeling.


Levels of Evidence
Entirely Dependent on below
Great, But expensive, time consuming, often impractical (or not doable)
Observational, convenient but little control …


Observational Cohort Studies
Observational Cohort Studies
Treatment and Control study arms are invariably different in terms of their observed characteristics.
Interpretation of Results is not straightforward.
Therefore, quantifying the Treatment effect is complex and requires risk adjustment or application of regression modeling.


Levels of Evidence
Entirely Dependent on below
Great, But expensive, time consuming, often impractical (or not doable)
Observational, convenient but little control …
Is there a Magic Bullet
Do Propensity Scores provide this “Magic Bullet” ?


Observational Cohort Studies
Observational Cohort Studies
Treatment and Control study arms are invariably different In terms of their observed characteristics.
Interpretation of Results is not straight forward.
Therefore, quantifying the Treatment effect is complex and requires risk adjustment or application of regression modeling.
Propensity scores were developed to overcome this difficulty.
The idea is to estimate the likelihood (the propensity score) that a person would have received treatment given certain characteristics (observed covariates).
More formally, the propensity score is the conditional probability of assignment to a particular treatment given a vector of observed covariates (D’Agostino 1998).

Ways Propensity Scores are Used
1) Propensity Score Stratification: stratify based on PS and compare 2) Propensity Score Adjustment: regression modeling with Treatment and PS 3) Propensity Score Matching: a) 1-to-1; 1-to-many; b) with or without replacement 4) Combinations of 1, 2 and 3: outside today’s scope 5) Inverse Probability Weighting: outside today’s scope

It all comes down to the same “fundamental problem of Causal Inference”
What we want to know is “The Treatment Effect on the Treated”.
But, this is the counterfactual, and we cannot measure outcomes in the same individual, for both treatments, and at the same time.
We need an alternative way to get a credible estimate of the
counterfactual outcomes. It can be shown that one may use the outcomes from the Control
arm; provided we have means to handle selection bias.
RCTs are a near perfect way to do that, yet they come at a price.

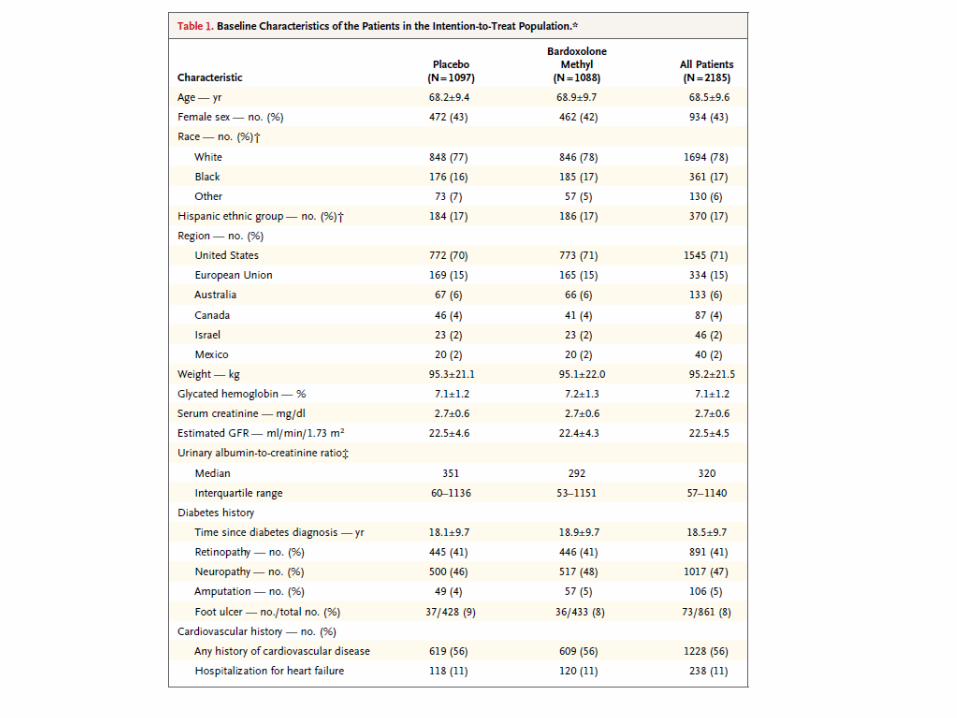
Examples

Example #1 Right Heart Catheterization (RHC) in ICU
Setting: ICU
Patients: RHC (Treatment) vs. No-RHC (Control)
Outcomes: Death and health care utilization
Groups differed on a large number of risk factors for the outcomes
Expectation: Crude (unadjusted) analysis would be confounded.

Casual Diagram
RHC
Resource Utilization
Mortality
Length of Stay
Treatment: RHC (Yes) Control: RHC (No)

Age
RHC
Severity
Mortality
.
.
.
Diagnosis
Confounders

Example #2 Effect of Blood Pressure MEDs on Mortality
Cohort: Framingham Heart Study
Subjects: all patients with history of hypertension
Exposure (Treatment): BPMEDS
Outcome: Death
Potential Confounders: AGE, SEX, SBP, DBP, TOTCHOL, BMICAT, CURSMOKE, DIABETES, PREVSTRK, PREVCHD

Age
Hypertension Medication
SBP
Death Treatment Decision
Sex
Diabetes
Other

Confounding by Indication
- Refers to studies assessing a clinical treatment decision (intervention)
- Characterized by a large number of factors that are a) predictors of the outcome and, at the same time,
b) influence the treatment decision
“Selection Bias and Need for Risk Adjustment”

Analytic Methods for Risk Adjustment
Stratification
– Simple and Intuitive
– Difficult if too many confounders

Analytic Methods for Risk Adjustment
Regression Modeling
– Outcome Model with terms for exposure and individual confounders.
– Unstable if many confounders
• 10:1 Rule

Design Methods for Avoiding Confounding
Randomization
– Avoids confounding by known and unknown risk factors.
Matching
– Avoids confounding by matching factors in Cohort Studies
– Difficult to implement for many confounders

Solution
Summarize confounders into a summary score (eg.
Propensity Score), then use this score to stratify, adjust or
match.

Propensity Score Analysis
Is it a Magic Bullet?
Does it control for all confounders?
– Known and Unknown?
Does it control for confounding better than traditional methods?
If so, why isn’t it used more often?

Timeline: Use of Propensity Scores
Year of Pubmed Citation
1985 1990 1995 2000 2005 2010
Pu
bm
ed
Pro
p. S
co
re A
rtic
les
0
200
400
600
800
1000
1200
14001312
5 1159
26
270
836
437-fold increase1984 - 2012
Search Term: (propensity score OR (propensit* AND (score* OR scoring* OR match* OR adjust*)))
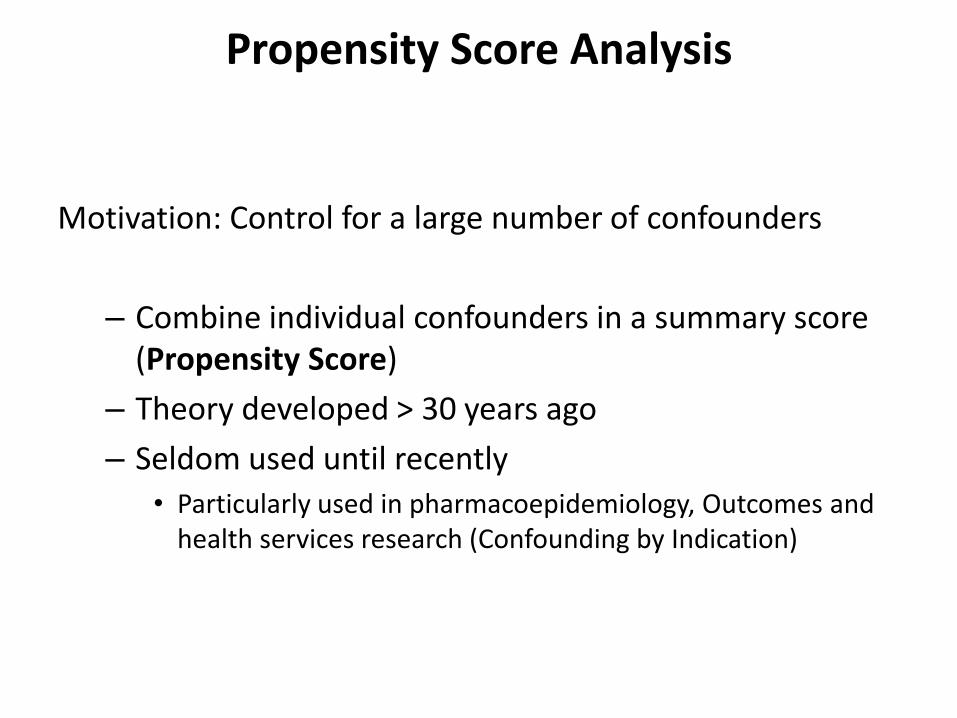
Propensity Score Analysis
Motivation: Control for a large number of confounders
– Combine individual confounders in a summary score (Propensity Score)
– Theory developed > 30 years ago
– Seldom used until recently
• Particularly used in pharmacoepidemiology, Outcomes and health services research (Confounding by Indication)

Propensity Score Analysis
Propensity Score = Probability of receiving the treatment as a function of the confounders.
– PS Reflects arrows in causal diagrams connecting individual confounders to the treatment.

Going Back to our Examples #1 and #2

Age
RHC
Severity
Mortality
.
.
.
Diagnosis
Treatment Decision
Confounders
Example #1

Age
RHC
Severity
Mortality
.
.
.
Diagnosis
Propensity Score
Confounders
Example #1

Age
Hypertension Medication
SBP
Death Treatment Decision
Sex
Diabetes
Example #2

Age
Hypertension Medication
SBP
Death Propensity
Score
Sex
Diabetes
Example #2
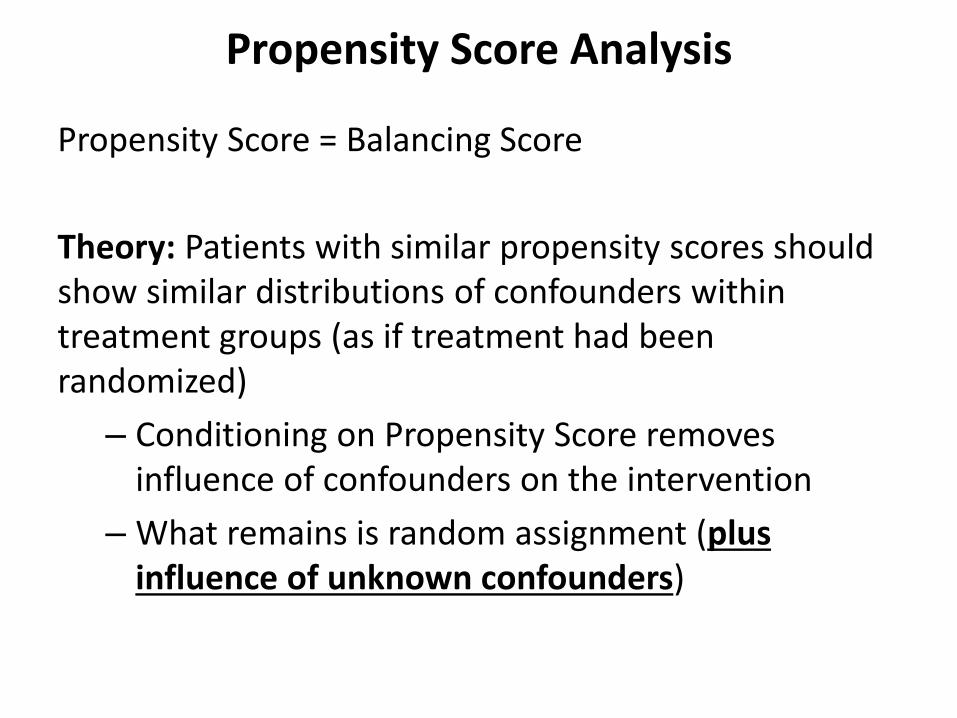
Propensity Score Analysis
Propensity Score = Balancing Score
Theory: Patients with similar propensity scores should show similar distributions of confounders within treatment groups (as if treatment had been randomized)
– Conditioning on Propensity Score removes influence of confounders on the intervention
– What remains is random assignment (plus influence of unknown confounders)

How To Do IT? Propensity Score Adjusted Analysis
1. Logistic regression model prediction of:
a) the Probability of RHC (Example #1) or
b) the Probability of hypertension Meds (Example #2)
as a function of the respective observed confounders
PS Model does not contain a term for the outcome
2. Regression Model for the Outcome with two factors: i) Treatment and ii) PS (or summary score)

Standard Outcome Model vs. PS Adjusted Analysis
In general, both methods often lead to similar conclusions but not necessarily same values for the adjusted odds ratios or hazard ratios
Neither adjust for unmeasured confounders
- Unless correlated with measured confounders
Propensity score analysis may be less sensitive to modeling assumptions
Propensity score analysis may be better on cases of many confounders and few outcomes

Propensity Score Stratification
Discrimination but some overlap of propensity scores in two comparison groups
Analytic plan:
– Create 20 strata defined by sub-ranges of propensity score.
– (0.00 – 0.05), (0.06 – 0.10), …, (0.96 – 1.00)
– Check for balance of confounders within strata.
– If balanced, perform stratified analysis.

What to Include in Propensity Score
All confounders
– Leaving a confounder out of PS has same effect as leaving it out of Outcome Model
Many recommend including non-confounders that are risk factors for the outcome
– May improve efficiency.
Don’t include non-confounders that are correlates of the exposure (Treatment)
– May lessen efficiency of analysis.

What about Propensity Matching to simulate RCTs


Aim

Study Population: Single Institution; N=3161 consecutive Patients (1996-2002) Primary Coronary Artery Bypass Grafting (CABG) surgery Groups: Standard 1-artery CABG (Control) vs. 2-artery CABG (Treatment) Outcome: 6 year Kaplan-Meier Survival – all-cause mortality Design: Propensity Matched Analysis – 1 to 1 Greedy Treatment: LITA graft + Radial Artery Graft Control: LITA graft + Saphenous Vein

Unadjusted Kaplan – Meier Analysis
2 arteries are Better than 1 ! Confounded?

Etc …

Calculate PS (Treatment)

PS Distributions (Treatment vs. Control)

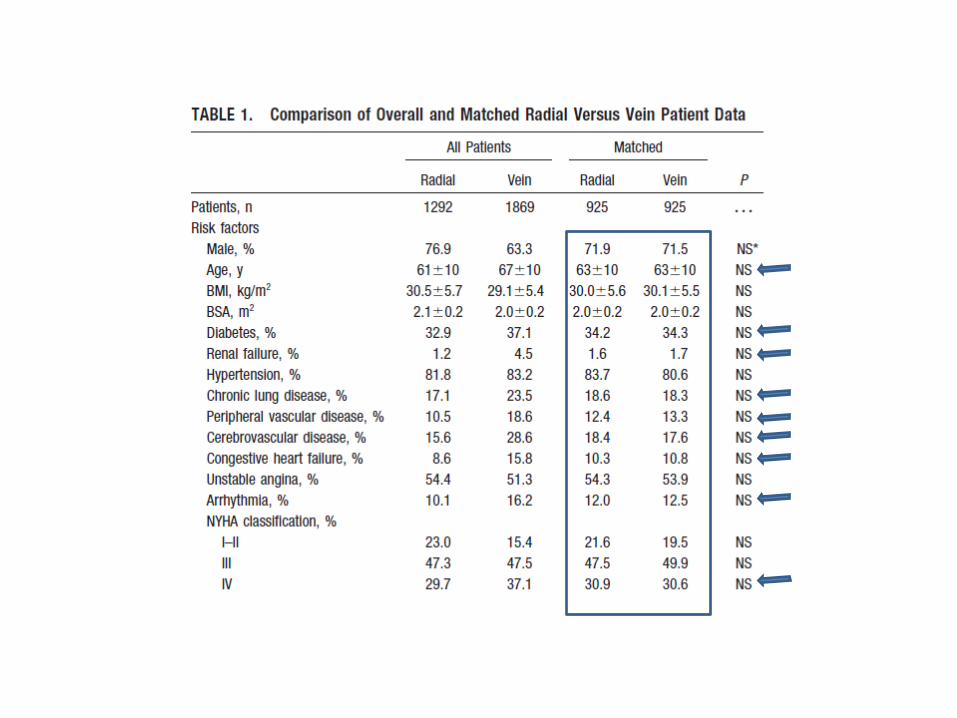
Propensity Matching Continued
925 pairs Were matched
1 to 1 Greedy PS matching w/out replacement

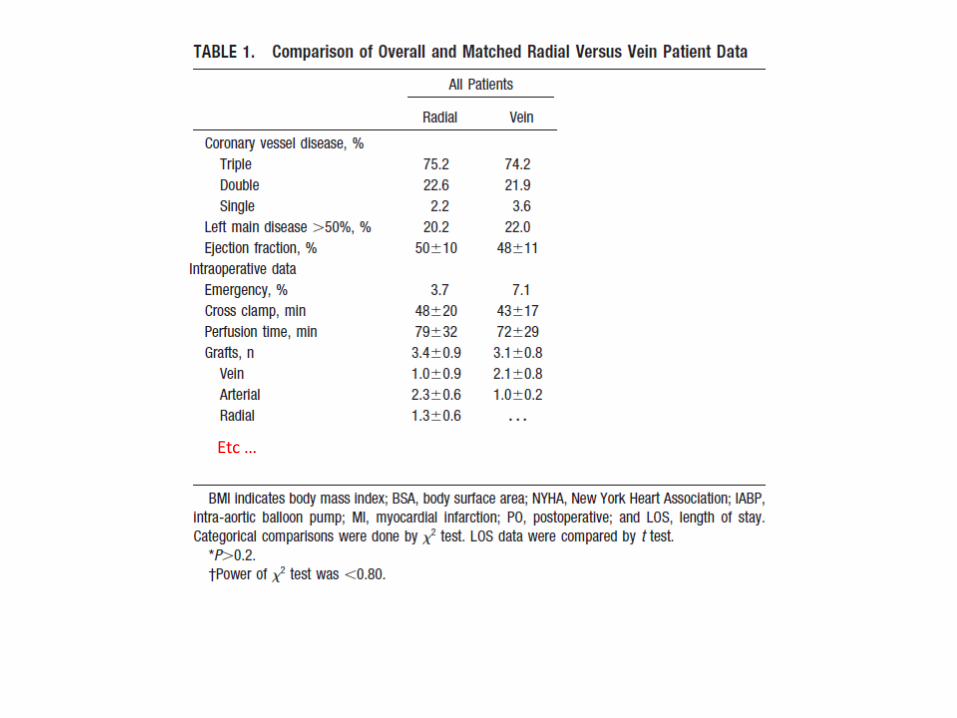
Does Propensity Matching Work?

Etc …

Matched Comparison
2 arteries are Better than 1 ! Not Confounded?
1000 times Bootstrapping
Note, The primary analysis of the data was simply a Kaplan-Meier comparison Restricted to the matched cohorts.

Thank you
SHARPIES “Maroun and Karim” will next describe a project they are working on
where they are applying what we discussed to great effect.