propellant feed system leak detection the linear … · propellant feed system leak detection_...
TRANSCRIPT

NASA/TM- 1999-206590
Propellant Feed System Leak Detection_
Lessons Learned From the Linear Aerospike
SR-71 Experiment (LASRE)
Neal Hass, Masashi Mizukami, Bradford A. Neal, Clinton St. John
NASA Dryden Flight Research Center
Edwards, California
Robert J. Beil
NASA Kennedy Space Center
Kennedy Space Center, Florida
Timothy P. Griffin
Dynacs Engineering Co., Inc.
Kennedy Space Center, Florida
November 1999
https://ntrs.nasa.gov/search.jsp?R=19990106559 2018-08-25T09:05:56+00:00Z
The NASA STI Program Office...in Profile
Since its founding, NASA has been dedicated
to the advancement of aeronautics and spacescience. The NASA Scientific and Technical
Information (STI) Program Office plays a key
part in helping NASA maintain this
important role.
The NASA STI Program Office is operated by
Langley Research Center, the lead center forNASA's scientific and technical information.
The NASA STI Program Office provides access
to the NASA STI Database, the largest collection
of aeronautical and space science STI in the
world. The Program Office is also NASA's
institutional mechanism for disseminating the
results of its research and development activities.
These results are published by NASA in the
NASA STI Report Series, which includes the
following report types:
TECHNICAL PUBLICATION. Reports of
completed research or a major significant
phase of research that present the results of
NASA programs and include extensive data
or theoretical analysis. Includes compilations
of significant scientific and technical data
and information deemed to be of continuing
reference value. NASA's counterpart of
peer-reviewed formal professional papers but
has less stringent limitations on manuscript
length and extent of graphic presentations.
TECHNICAL MEMORANDUM. Scientific
and technical findings that are preliminary or
of specialized interest, e.g., quick release
reports, working papers, and bibliographiesthat contain minimal annotation. Does not
contain extensive analysis.
CONTRACTOR REPORT. Scientific and
technical findings by NASA-sponsored
contractors and grantees.
CONFERENCE PUBLICATION.
Collected papers from scientific and
technical conferences, symposia, seminars,
or other meetings sponsored or cosponsored
by NASA.
SPECIAL PUBLICATION. Scientific,
technical, or historical information from
NASA programs, projects, and mission,
often concerned with subjects having
substantial public interest.
TECHNICAL TRANSLATION. English-
language translations of foreign scientific
and technical material pertinent toNASA's mission.
Specialized services that complement the STI
Program Office's diverse offerings include
creating custom thesauri, building customized
databases, organizing and publishing research
results...even providing videos.
For more information about the NASA STI
Program Office, see the following:
• Access the NASA STI Program Home Pageat http://www.sti.nasa.gov
• E-mail your question via the Internet to
• Fax your question to the NASA Access Help
Desk at (301) 621-0134
• Telephone the NASA Access Help Desk at
(301) 621-0390
Write to:
NASA Access Help Desk
NASA Center for AeroSpace Information7121 Standard Drive
Hanover, MD 21076-1320

NASA/TM- 1999-206590
Propellant Feed System Leak Detection_
Lessons Learned From the Linear Aerospike
SR-71 Experiment (LASRE)
Neal Hass, Masashi Mizukami, Bradford A. Neal, Clinton St. John
NASA Dryden Flight Research CenterEdwards, California
Robert J. Beil
NASA Kennedy Space Center
Kennedy Space Center, Florida
Timothy P. Griffin
Dynacs Engineering Co., Inc.
Kennedy Space Center, Florida
National Aeronautics and
Space Administration
Dryden Flight Research CenterEdwards, California 93523-0273
November 1999

NOTICEUse of trade names or names of manufacturers in this document does not constitute an official endorsement
of such products or manufacturers, either expressed or implied, by the National Aeronautics and
Space Administration.
Available from the following:
NASA Center for AeroSpace Information (CASI)7121 Standard Drive
Hanover, MD 21076-1320
(301) 621-0390
National Technical Information Service (NTIS)
5285 Port Royal Road
Springfield, VA 22161-2171
(703) 487-4650

PROPELLANT FEED SYSTEM LEAK DETECTIONmLESSONS
LEARNED FROM THE LINEAR AEROSPIKE SR-71 EXPERIMENT
(LASRE)
Neal Hass,* Masashi Mizukami, _ Bradford A. Neal, _ Clinton St. John §
NASA Dryden Flight Research Center
Edwards, California
Robert J. Beil ¶
NASA Kennedy Space Center
Kennedy Space Center, Florida
Timothy P. Griffin #
Dynacs Engineering Co., Inc.
Kennedy Space Center, Florida
Abstract
This paper presents pertinent results and assessment of
propellant feed system leak detection as applied to the
Linear Aerospike SR-71 Experiment (LASRE) program
flown at the NASA Dryden Flight Research Center,
Edwards, California. The LASRE was a flight test of an
aerospike rocket engine using liquid oxygen and high-
pressure gaseous hydrogen as propellants. The flight
safety of the crew and the experiment demanded proven
technologies and techniques that could detect leaks and
assess the integrity of hazardous propellant feed
systems. Point source detection and systematic detection
were used. Point source detection was adequate for
catching gross leakage from components of the
propellant feed systems, but insufficient for clearing
LASRE to levels of acceptability. Systematic detection,
which used high-resolntion instrumentation to evaluate
the health of the system within a closed volume,
provided a better means for assessing leak hazards.
Oxygen sensors detected a leak rate of approximately
0.04 cubic inches per second of liquid oxygen. Pressure
sensor data revealed speculated cryogenic boiloff
*Aerospace Propulsion Engineer, Member AIAA
"_Aerospace Propulsion Engineer, Member AIAA
$Operations Engineer
§NASA Co op Student, Pro'due University, Student member AIAA
¶Senior Engineer
#Space Shuttle Main Propulsion System Lead Engineer
Copyright © 1999 by the American Institute of Aeronautics and
Astronautics, Inc. No copyright is asserted in the United States _mder
Title 17, U.S. Code. The U.S. Govel_nent has a royalty free license to
exercise all rights under the copyright clahned heroin for Govemmen
tal proposes. All other rights are mselwed by the copyright owner.
through the fittings of the oxygen system, but location of
the source(s) was indeterminable. Ultimately, LASRE
was canceled because leak detection techniques were
tenable to verify that oxygen levels could be maintained
below flammability limits.
Nomenclature
Cda theoretical orifice size
GH 2 gaseous hydrogen
GHe gaseous helium
GN 2 gaseous nitrogen
GO 2 gaseous oxygen
HST Helium Signature Test
kPa kiloPascals
KSC NASA Kennedy Space Center, Florida
LASRE Linear Aerospike SR-71 Experiment
lbm pounds mass
LN 2 liquid nitrogen
LO 2 liquid oxygen
LOXMAIN electrical signal name for valve command
MPS Space Shuttle main propulsion system
mdot mass flow
N 2 nitrogen
0 2 oxygen
P pressure
1American Institute of Aeronautics and Astronautics

Pamb
PODPRES
ppm
PRECHILL
psi
psia
Q
R
°R
Re
scim
slpm
T
WSTF
0 (zero)
AmH 2
p (rho)
ambient pressure
electrical signal name for pod pressure
parts per million
electrical signal name for valve command
pounds per square inch
pounds per square inch, absolute
volumetric flow rate
specific gas constant
degrees Rankine
Reynolds number
standard cubic inches per minute
standard liters per minute
temperature, °R
NASA White Sands Test Facility, NewMexico
as a subscript denotes initial conditions
change in mass of hydrogen
density
Introduction
The Linear Aerospike SR-71 Experiment (LASRE) was
a semi-span 20-percent scale model of the Lockheed
Martin X-33 vehicle with an integrated linear aerospike
rocket engine fed by liquid oxygen and gaseous
hydrogen. The model was mounted to the upper
fuselage of the SR-71 aircraft and flight tested with the
intention of obtaining data on the pressure
compensation performance of the aerospike engine. The
program evolved as a partner flight test experiment that
directly supported the Lockheed Martin X-33
technology demonstrator, a NASA "Access to Space"
program. It was the task of NASA Dryden Flight
Research Center to perform the flight tests of the
LASRE, and do so in the safest manner possible.
Coupling the hazards of this propellant feed system with
a piloted flight test vehicle posed a challenging and
interesting safety problem. Important issues included
early detection of and quantification of the leak rate
from high-pressure gaseous hydrogen and liquid oxygen
feed lines in a closed, nitrogen purged environment.
This hazardous combination required significant
validation for confidence in the integrity of the design
and operation of the systems. It was not without some
risks, and those risks had to be clearly defined by
applying practical techniques and tools that would
gather data and assess the leak rate of each system.
Unfortunately for LASRE, the systematic leak detection
systems indicated an unacceptable leak rate of liquid
oxygen into the pod environment. The leak source(s)
could not be found using what little instrumentation was
available and techniques available for detection. These
results had a major influence on the decision to
discontinue the project. A discussion follows of those
leak detection techniques and tools, some of the data,
and an analysis of results.
A great deal of experimental research has already been
conducted upon the flammability of hydrogen and
oxygen mixture ratios. This research demonstrated that
the limits for non-flammability of an oxygen and
hydrogen mixture is an oxygen volume fraction
_<4percent and a hydrogen volume fraction
_<4percent 1' 2 These limits are suggested as the rule of
thumb for mission safety for any operations using a
combination of these gas components.
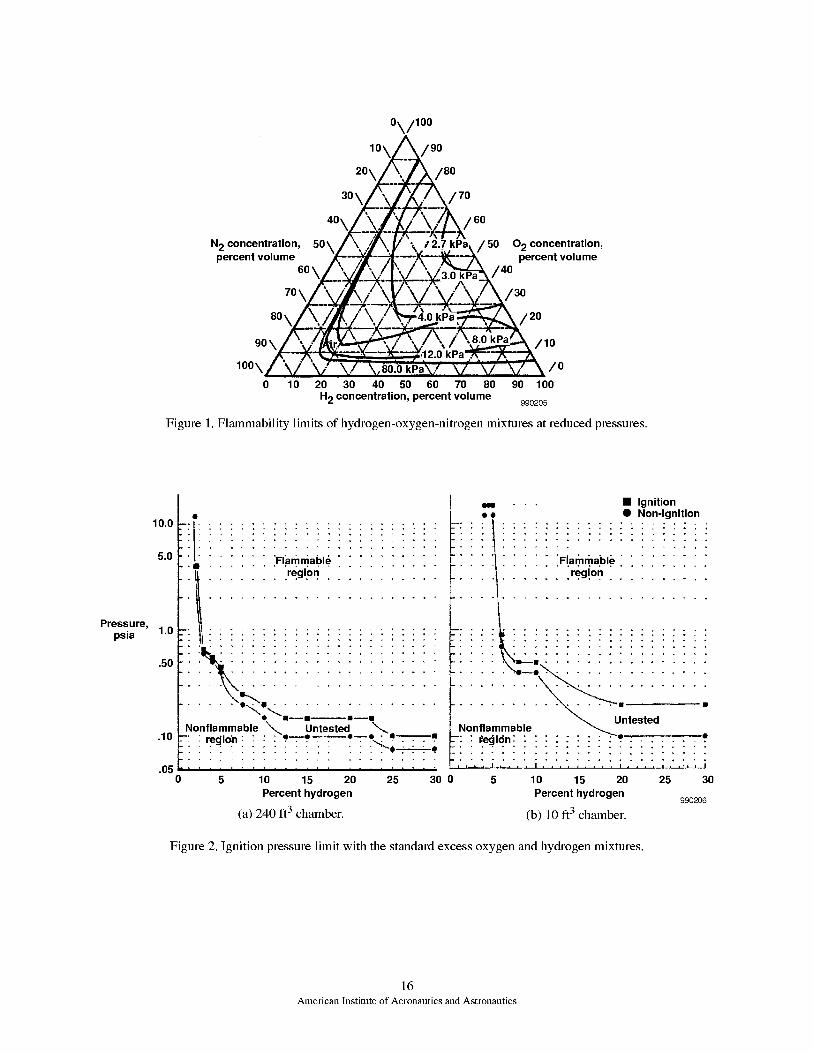
Investigations into reduced-pressures flammability-
limit testing with oxygen and hydrogen mixtures havebeen conducted as well. Figure 13 shows results
compiled by NASA White Sands Test Facility (WSTF)
on the flammability of reduced-pressure hydrogen-
oxygen-nitrogen mixtures. Regions to the left and below
the isobars are non-flammable at that pressure.Figure 24 shows similar results of Benz's work on
volume sensitivity and reduced pressures to
flammability limits. The results from both of theseresearch efforts indicate that increases in altitude cause
little, if any, favorable relief in the flammability limits of
hydrogen and oxygen mixtures until altitudes in excess
of 80,000 feet (0.4 psia/2.8 kPa pressure altitude) are
achieved. Even then, low leak rates from the propellant
feed systems might provide enough volume fraction and
pressure, if contained, to create a hazardous mixture.
Mixed concentrations above these flammability limits
are clearly defined as hazardous and require extremely
low ignition energy to initiate combustion. In someinstances these conditions have led to detonation. The
LASRE operational limits of oxygen and fuel
concentrations follow the purge discussion in the
Experiment System Description section.
Ballistic profiles flown by most launch vehicles shorten
the exposure to hazards of flammability with hydrogen
and oxygen concentrations by getting very quickly
above the pressure altitude where flammability issues
exist. Aerospace vehicles designed to operate over flight
profile requirements similar to those of conventional
commercial aircraft and using hydrogen and oxygen
mixtures for fuel, must address flammability as a safety-
2American Institute of Aeronautics and Astronautics
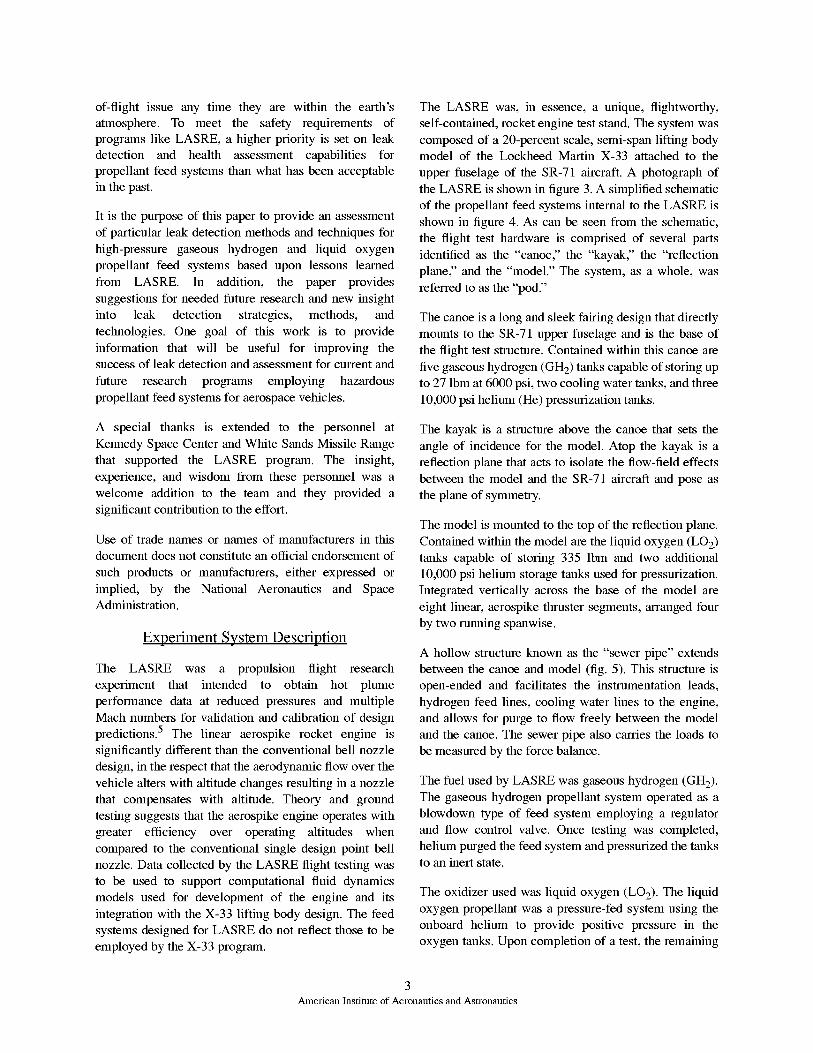
of-flightissueanytimetheyarewithintheearth'satmosphere.To meetthe safetyrequirementsofprogramslikeLASRE,ahigherpriorityis setonleakdetectionand healthassessmentcapabilitiesforpropellantfeedsystemsthanwhathasbeenacceptableinthepast.
It isthepurposeofthispapertoprovideanassessmentofparticularleakdetectionmethodsandtechniquesforhigh-pressuregaseoushydrogenandliquid oxygenpropellantfeedsystemsbaseduponlessonslearnedfrom LASRE.In addition,the paperprovidessuggestionsforneededfutureresearchandnewinsightinto leak detectionstrategies,methods,andtechnologies.Onegoalof this work is to provideinformationthat will be usefulfor improvingthesuccessofleakdetectionandassessmentforcurrentandfuture researchprogramsemployinghazardouspropellantfeedsystemsforaerospacevehicles.
A specialthanksis extendedto the personnelatKennedySpaceCenterandWhiteSandsMissileRangethat supportedthe LASREprogram.The insight,experience,andwisdomfromthesepersonnelwasawelcomeadditionto theteamandtheyprovidedasignificantcontributiontotheeffort.
Useoftradenamesornamesof manufacturersin thisdocumentdoesnotconstituteanofficialendorsementofsuchproductsor manufacturers,eitherexpressedorimplied,by the NationalAeronauticsand SpaceAdministration.
Experiment System Description
The LASRE was a propulsion flight research
experiment that intended to obtain hot plume
performance data at reduced pressures and multiple
Mach numbers for validation and calibration of design
predictions. 5 The linear aerospike rocket engine is
significantly different than the conventional bell nozzle
design, in the respect that the aerodynamic flow over the
vehicle alters with altitude changes resulting in a nozzle
that compensates with altitude. Theory and ground
testing suggests that the aerospike engine operates with
greater efficiency over operating altitudes when
compared to the conventional single design point bell
nozzle. Data collected by the LASRE flight testing was
to be used to support computational fluid dynamics
models used for development of the engine and its
integration with the X-33 lifting body design. The feed
systems designed for LASRE do not reflect those to be
employed by the X-33 program.
The LASRE was, in essence, a unique, flightworthy,
self-contained, rocket engine test stand. The system was
composed of a 20-percent scale, semi-span lifting bodymodel of the Lockheed Martin X-33 attached to the
upper fuselage of the SR-71 aircraft. A photograph of
the LASRE is shown in figure 3. A simplified schematic
of the propellant feed systems internal to the LASRE is
shown in figure 4. As can be seen from the schematic,
the flight test hardware is comprised of several parts
identified as the "canoe," the "kayak," the "reflection
plane," and the "model." The system, as a whole, was
referred to as the "pod."
The canoe is a long and sleek fairing design that directly
mounts to the SR-71 upper fuselage and is the base of
the flight test structure. Contained within this canoe are
five gaseous hydrogen (GH2) tanks capable of storing up
to 27 Ibm at 6000 psi, two cooling water tanks, and three
10,000 psi helium (He) pressurization tanks.
The kayak is a structure above the canoe that sets the
angle of incidence for the model. Atop the kayak is a
reflection plane that acts to isolate the flow-field effects
between the model and the SR-71 aircraft and pose as
the plane of symmetry.
The model is mounted to the top of the reflection plane.
Contained within the model are the liquid oxygen (LO2)
tanks capable of storing 335 lbm and two additional
10,000 psi helium storage tanks used for pressurization.
Integrated vertically across the base of the model are
eight linear, aerospike thruster segments, arranged four
by two running spanwise.
A hollow structure known as the "sewer pipe" extends
between the canoe and model (fig. 5). This structure is
open-ended and facilitates the instrumentation leads,
hydrogen feed lines, cooling water lines to the engine,
and allows for purge to flow freely between the model
and the canoe. The sewer pipe also carries the loads to
be measured by the force balance.
The fuel used by LASRE was gaseous hydrogen (GH2).
The gaseous hydrogen propellant system operated as a
blowdown type of feed system employing a regulator
and flow control valve. Once testing was completed,
helium purged the feed system and pressurized the tanksto an inert state.
The oxidizer used was liquid oxygen (LO2). The liquid
oxygen propellant was a pressure-fed system using the
onboard helium to provide positive pressure in the
oxygen tanks. Upon completion of a test, the remaining
3American Institute of Aeronautics and Astronautics

liquid oxygenwasforcedoverboardandthe linespurgedbytheonboardheliumsupply.
Tomitigatesomeof thehazardsassociatedwiththesetypesofpropellantfeedsystems,thevolumeswithinthecanoeandmodelwerepurgedwith nitrogen.ThenitrogenwassuppliedfromtwoliquidnitrogenDewarflasksthatwerestoredwithintheSR-71aircraft.EachDewarflaskhasacapacityof 1.76ft3.
All of thesystemsemployedwithinthe podwereheavilyinstrumentedto obtainstatusinformation.Alltanksandsignificantstagesin the feedlineswereinstrumentedwith pressureand temperatureinstruments.Flightsafetyinstrumentationincludedfire-detectionthermocouplesandoxygen-detectionsensors.
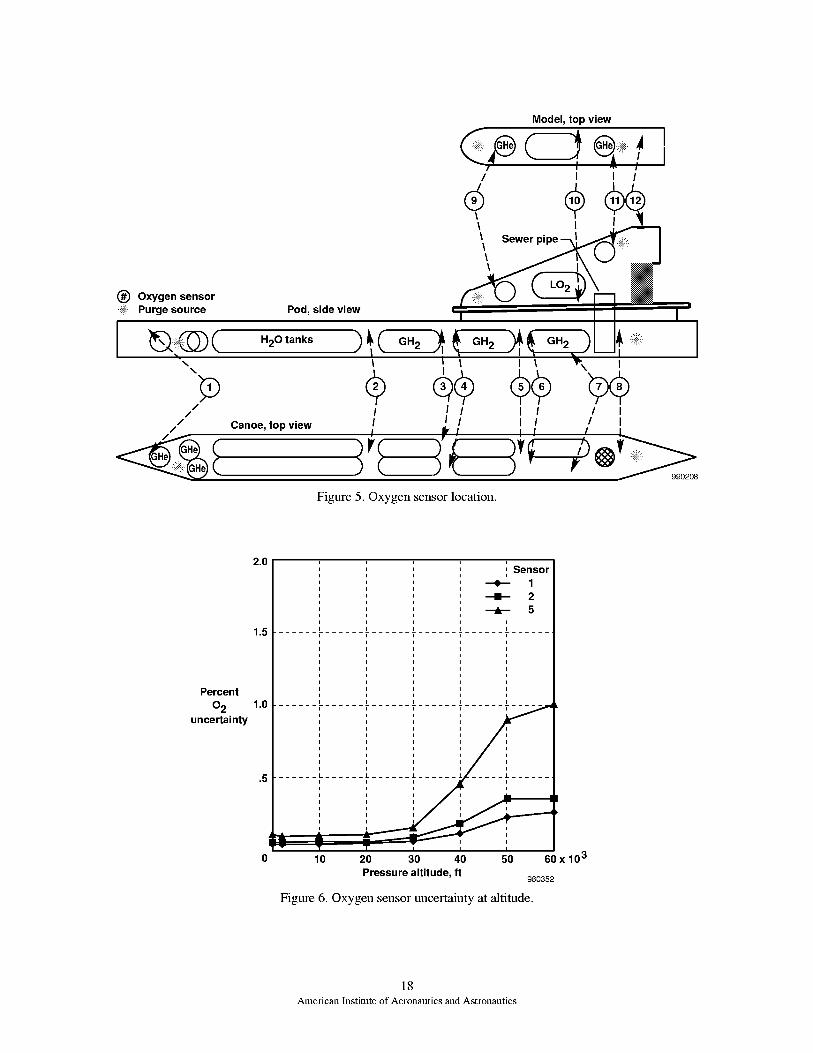
A simplifiedschematicshowingthe approximatelocationofeachofthetwelveoxygensensorsisshownin figure5. Theoxygeninstrumentswereelectrolytic-type sensorsoriginallyintendedfor automotiveapplications.Thesensorsweretemperaturecontrolledto115°Fwithaheaterwraptoreduceanydriftingthatwouldhaveresultedfromthe extremetemperaturechangesovertheflightprofile.Theinstrumentshadanaccuracyspecificationof_+1percentvolumefractionofoxygenmeasured.After thoroughcalibrationtheoxygensensorsdemonstratedanuncertaintythatwasmuchbetterthantheadvertisedaccuracy,evenoveranaltituderangefromsealevelup to 60,000ft (seefigure6).6
Therewerepressuretransducersattwolocationswithinthepod.Theseinstrumentsmonitoredtheinside-to-outsidepressuredifferential.Thismonitoringwastoensurethatthesurfacepanelstresslimits werenotexceededasaresultof thepressuredifferentialcreatedbythepurge.Theseambientpressuretransducerswerealsousedasamonitorforover-pressurizationresultingfromplumbingburstsor leaks,anddeflagrationordetonationof combustibles.Forthepurposesof thisdiscussion,thefocusisontheunitmonitoringthemodelvolume.
Leak Detection Techniques and Results
A considerable amount of effort has been put forth to
develop techniques, tools, and strategies for identifying
leaks in propellant feed systems. The fundamental
principles and techniques behind leak detection of
propellant feed systems that were developed in the dawn
of the space age are still in use today. Improvements in
instrumentation resolution provide better accuracy in
assessing hazards and increased bandwidth capabilities
allow more information to be attained nearly
instantaneously for clarification of the hazard.
The methods and techniques for detection were broken
down into two classifications for this paper. The first
classification is the point source leak detection which
encompasses detection and evaluation of leakage at
individual sources. The second classification, systematic
leak detection, detects and evaluates the overall leakage
from the system.
Point Source Detection Tools and Techniques
Point source methods for leak detection of gaseous and
cryogenic systems include: visual inspection, bubble
solution, ultrasonic leak detectors, thermal conductivity
sensor, joint bagging, and mass spectrometers. In
addition to these tools, inspection of cryogenic lines and
fittings with the naked eye is always a useful tool. When
cryogenics are flowing drips and vapor trails can often
be seen. All of these techniques and tools require direct
access to each of the fittings and components of the
propellant feed system in order to evaluate the integrity
at each junction.
For LASRE, the leak-rate specification for each fitting
was to be no greater than the equivalent of bubble tight
(a bubble formation within one minute of time). As a
result of the way the LASRE system was designed, a
large portion of the fluid system fittings and tubing weretmable to be leak-checked under static conditions. In
addition, the length of time for which the propellant
feed systems operated (3 to 5 sec) made it difficult to
leak check the total system while flowing. A flowing
leak test, where cryogenic fluids were used in the liquid
systems and gases were used in the gaseous systems,
was performed. A flow test using the actual propellants
when checking for leak detection is a dangerous
exercise and is not recommended. The safety of the
personnel performing the inspection is at risk. A
substitution of inert cryogenics and gases (liquid
nitrogen and helium) were used to check the system in
order to remove the hazards of flammability. This
allowed all of the systems to be inspected in conditions
as near as possible to the actual operating conditions of
pressure and temperature. To yield a more stringent test
condition, these tests also took into account the
transients associated with the operation of the system.
During these tests personnel were located strategically
around the system to perform visual and point source
inspections.
4Alnelican Institute of Aeronautics and Astronautics
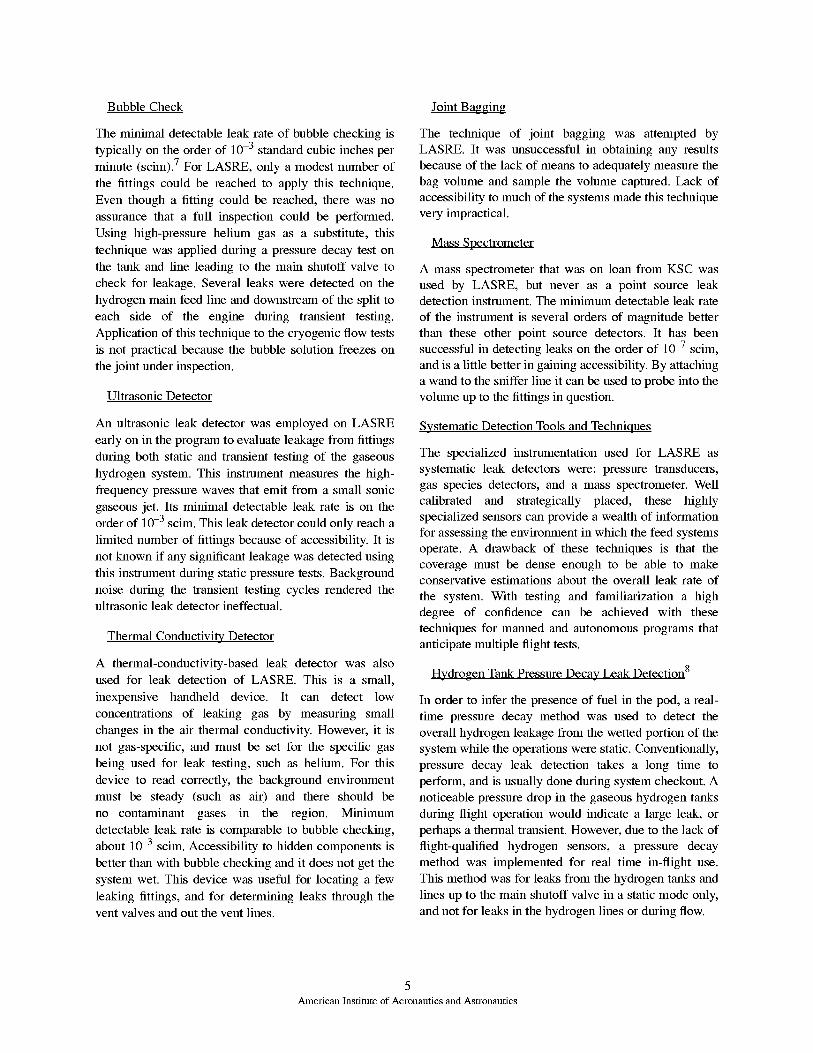
Bubble Check
The minimal detectable leak rate of bubble checking is
typically on the order of 10 3 standard cubic inches per
minute (scim). 7 For LASRE, only a modest number of
the fittings could be reached to apply this technique.
Even though a fitting could be reached, there was no
assurance that a full inspection could be performed.
Using high-pressure helium gas as a substitute, this
technique was applied during a pressure decay test on
the tank and line leading to the main shutoff valve to
check for leakage. Several leaks were detected on the
hydrogen main feed line and downstream of the split to
each side of the engine during transient testing.
Application of this technique to the cryogenic flow tests
is not practical because the bubble solution freezes on
the joint under inspection.
Ultrasonic Detector
An ultrasonic leak detector was employed on LASRE
early on in the program to evaluate leakage from fittings
during both static and transient testing of the gaseous
hydrogen system. This instrument measures the high-
frequency pressure waves that emit from a small sonic
gaseous jet. Its minimal detectable leak rate is on theorder of 10 3 scim. This leak detector could only reach a
limited number of fittings because of accessibility. It is
not known if any significant leakage was detected using
this instrument during static pressure tests. Background
noise during the transient testing cycles rendered theultrasonic leak detector ineffectual.
Thermal Conductivity Detector
A thermal-conductivity-based leak detector was also
used for leak detection of LASRE. This is a small,
inexpensive handheld device. It can detect low
concentrations of leaking gas by measuring small
changes in the air thermal conductivity. However, it is
not gas-specific, and must be set for the specific gas
being used for leak testing, such as helium. For this
device to read correctly, the background environment
must be steady (such as air) and there should be
no contaminant gases in the region. Minimum
detectable leak rate is comparable to bubble checking,
about 10 3 scim. Accessibility to hidden components is
better than with bubble checking and it does not get the
system wet. This device was useful for locating a few
leaking fittings, and for determining leaks through thevent valves and out the vent lines.
Joint Bagging
The technique of joint bagging was attempted by
LASRE. It was unsuccessful in obtaining any results
because of the lack of means to adequately measure the
bag volume and sample the volume captured. Lack of
accessibility to much of the systems made this technique
very impractical.
Mass Spectrometer
A mass spectrometer that was on loan from KSC was
used by LASRE, but never as a point source leakdetection instrument. The minimum detectable leak rate
of the instrument is several orders of magnitude better
than these other point source detectors. It has beensuccessful in detecting leaks on the order of 10 7 scim,
and is a little better in gaining accessibility. By attaching
a wand to the sniffer line it can be used to probe into the
volume up to the fittings in question.
Systematic Detection Tools and Techniques
The specialized instrumentation used for LASRE as
systematic leak detectors were: pressure transducers,
gas species detectors, and a mass spectrometer. Well
calibrated and strategically placed, these highly
specialized sensors can provide a wealth of information
for assessing the environment in which the feed systems
operate. A drawback of these techniques is that the
coverage must be dense enough to be able to makeconservative estimations about the overall leak rate of
the system. With testing and familiarization a high
degree of confidence can be achieved with these
techniques for manned and autonomous programs that
anticipate multiple flight tests.
Hydrogen Tank Pressure Decay Leak Detection 8
In order to infer the presence of fuel in the pod, a real-
time pressure decay method was used to detect the
overall hydrogen leakage from the wetted portion of the
system while the operations were static. Conventionally,
pressure decay leak detection takes a long time to
perform, and is usually done during system checkout. A
noticeable pressure drop in the gaseous hydrogen tanks
during flight operation would indicate a large leak, or
perhaps a thermal transient. However, due to the lack of
flight-qualified hydrogen sensors, a pressure decay
method was implemented for real time in-flight use.
This method was for leaks from the hydrogen tanks and
lines up to the main shutoff valve in a static mode only,
and not for leaks in the hydrogen lines or during flow.
5American Institute of Aeronautics and Astronautics
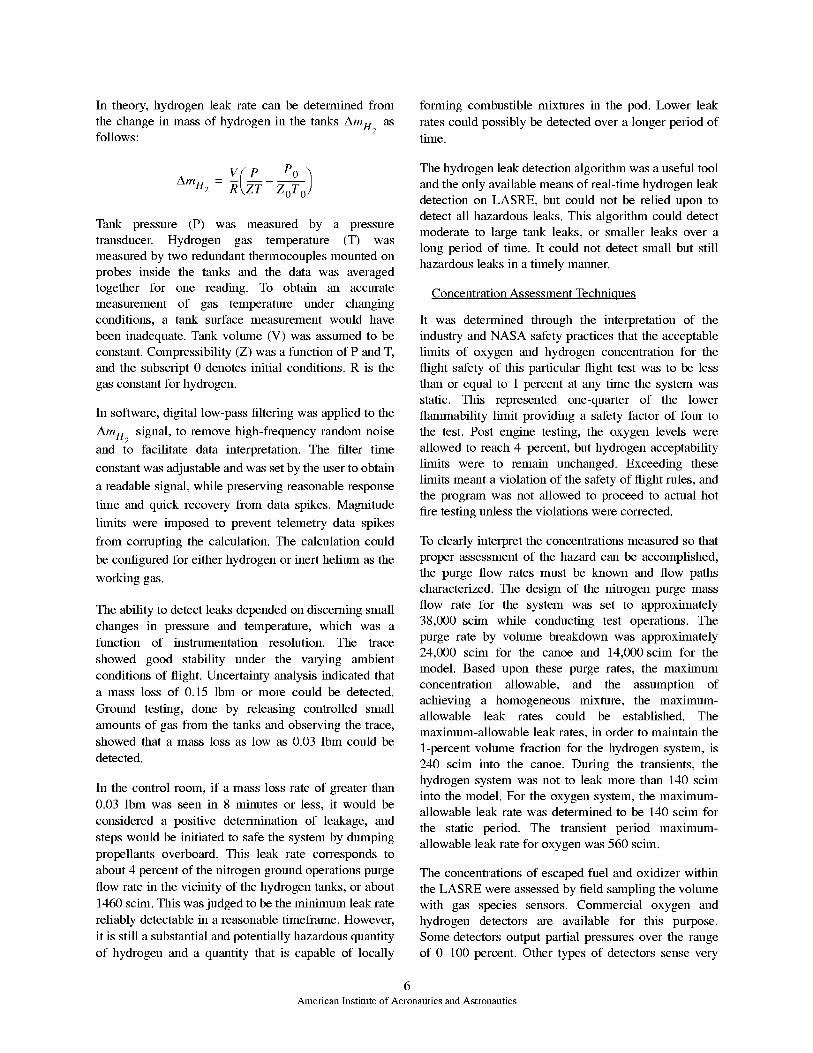
In theory,hydrogenleakratecanbedeterminedfromthechangeinmassofhydrogenin thetanksAmH2asfollows:
formingcombustiblemixturesin thepod.Lowerleakratescouldpossiblybedetectedoveralongerperiodoftime.
V P
Tank pressure (P) was measured by a pressure
transducer. Hydrogen gas temperature (T) was
measured by two redundant thermocouples mounted on
probes inside the tanks and the data was averaged
together for one reading. To obtain an accurate
measurement of gas temperature under changing
conditions, a tank surface measurement would have
been inadequate. Tank volume (V) was assumed to be
constant. Compressibility (Z) was a function of P and T,
and the subscript 0 denotes initial conditions. R is the
gas constant for hydrogen.
In software, digital low-pass filtering was applied to the
AmH2 signal, to remove high-frequency random noiseand to facilitate data interpretation. The filter time
constant was adjustable and was set by the user to obtain
a readable signal, while preserving reasonable response
time and quick recovery from data spikes. Magnitude
limits were imposed to prevent telemetry data spikes
from corrupting the calculation. The calculation could
be configured for either hydrogen or inert helium as the
working gas.
The ability to detect leaks depended on discerning small
changes in pressure and temperature, which was a
function of instrumentation resolution. The trace
showed good stability trader the varying ambient
conditions of flight. Uncertainty analysis indicated thata mass loss of 0.15 Ibm or more could be detected.
Ground testing, done by releasing controlled small
amounts of gas from the tanks and observing the trace,showed that a mass loss as low as 0.03 Ibm could be
detected.
In the control room, if a mass loss rate of greater than
0.03 Ibm was seen in 8 minutes or less, it would be
considered a positive determination of leakage, and
steps would be initiated to safe the system by dumping
propellants overboard. This leak rate corresponds to
about 4 percent of the nitrogen ground operations purge
flow rate in the vicinity of the hydrogen tanks, or about
1460 scim. This was judged to be the minimum leak rate
reliably detectable in a reasonable timeframe. However,
it is still a substantial and potentially hazardous quantity
of hydrogen and a quantity that is capable of locally
The hydrogen leak detection algorithm was a useful tool
and the only available means of real-time hydrogen leak
detection on LASRE, but could not be relied upon to
detect all hazardous leaks. This algorithm could detect
moderate to large tank leaks, or smaller leaks over a
long period of time. It could not detect small but still
hazardous leaks in a timely manner.
Concentration Assessment Techniques
It was determined through the interpretation of the
industry and NASA safety practices that the acceptable
limits of oxygen and hydrogen concentration for the
flight safety of this particular flight test was to be less
than or equal to 1 percent at any time the system was
static. This represented one-quarter of the lower
flammability limit providing a safety factor of four to
the test. Post engine testing, the oxygen levels were
allowed to reach 4 percent, but hydrogen acceptability
limits were to remain unchanged. Exceeding these
limits meant a violation of the safety of flight rules, and
the program was not allowed to proceed to actual hot
fire testing unless the violations were corrected.
To clearly interpret the concentrations measured so that
proper assessment of the hazard can be accomplished,
the purge flow rates must be known and flow paths
characterized. The design of the nitrogen purge mass
flow rate for the system was set to approximately
38,000 scim while conducting test operations. The
purge rate by volume breakdown was approximately
24,000 scim for the canoe and 14,000 scim for the
model. Based upon these purge rates, the maximum
concentration allowable, and the assumption of
achieving a homogeneous mixture, the maximum-allowable leak rates could be established. The
maximum-allowable leak rates, in order to maintain the
1-percent volume fraction for the hydrogen system, is
240 scim into the canoe. During the transients, the
hydrogen system was not to leak more than 140 scim
into the model. For the oxygen system, the maximum-allowable leak rate was determined to be 140 scim for
the static period. The transient period maximum-
allowable leak rate for oxygen was 560 scim.
The concentrations of escaped fuel and oxidizer within
the LASRE were assessed by field sampling the volume
with gas species sensors. Commercial oxygen and
hydrogen detectors are available for this purpose.
Some detectors output partial pressures over the range
of 0-100 percent. Other types of detectors sense very
6American Institute of Aeronautics and Astronautics
lowlevels,typically10-2000partspermillion(ppm),andthatmayor maynot bewithin therangeofsensitivityfor adequatelyassessingleak rateacceptability.Thesedetectorsmay also requireaminimumoxygenconcentrationin thebackgroundforproperoperationofthesensorelement.Theoxygenatedbackgroundrequirementmayconflictwiththeuseofflammablepropellantsfortestingthesystemintegrity.
Mostdetectorsavailablearedesignedwiththeintentionof beingusedin industrialapplicationsoperatingatstandardatmosphericconditions.Employmentin aflightenvironmentrequiresa significantqualificationeffort and calibrationat reducedpressuresandconcentrationsto determinerangeof detectionandaccuracy.Thisinformationis usefulin understandingand determiningmissionflight safetyrules.Tocompensatefor altitudeeffects,someof thesesensorpackagesmayrequireanambientpressuremeasurementunlessa pressurecompensationhasalreadybeenintegratedinto the detector.Upon satisfactorycompletionofathoroughqualificationtest,sensorsmaybeplacedstrategicallywithinavehiclein thehopesofprovidingadequatecoverageto confidentlyassessthevehicleenvironmentand overallleakagefrom thesystems.
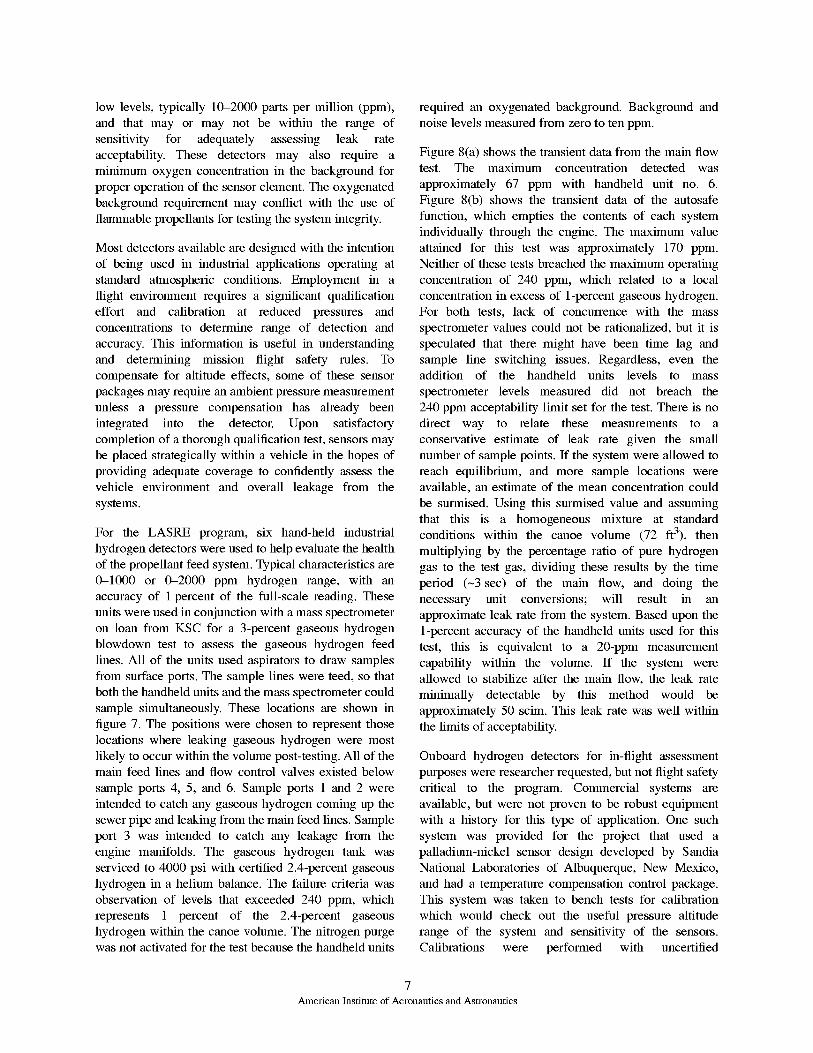
For the LASREprogram,six hand-heldindustrialhydrogendetectorswereusedtohelpevaluatethehealthofthepropellantfeedsystem.Typicalcharacteristicsare0-1000or 0-2000ppmhydrogenrange,with anaccuracyof 1percentof thefull-scalereading.TheseunitswereusedinconjunctionwithamassspectrometeronloanfromKSCfor a 3-percentgaseoushydrogenblowdowntestto assessthegaseoushydrogenfeedlines.All of theunitsusedaspiratorsto drawsamplesfromsurfaceports.Thesamplelineswereteed,sothatboththehandheldunitsandthemassspectrometercouldsamplesimultaneously.Theselocationsareshowninfigure7.Thepositionswerechosentorepresentthoselocationswhereleakinggaseoushydrogenweremostlikelytooccurwithinthevolumepost-testing.All ofthemainfeedlinesandflowcontrolvalvesexistedbelowsampleports4, 5,and6. Sampleports1and2 wereintendedtocatchanygaseoushydrogencomingupthesewerpipeandleakingfromthemainfeedlines.Sampleport3 wasintendedto catchanyleakagefromtheenginemanifolds.Thegaseoushydrogentankwasservicedto4000psiwithcertified2.4-percentgaseoushydrogeninaheliumbalance.Thefailurecriteriawasobservationof levelsthatexceeded240ppm,whichrepresents1 percentof the 2.4-percentgaseoushydrogenwithinthecanoevolume.Thenitrogenpurgewasnotactivatedforthetestbecausethehandheldunits
requiredanoxygenatedbackground.Backgroundandnoiselevelsmeasuredfromzerototenppm.
Figure8(a)showsthetransientdatafromthemainflowtest. The maximumconcentrationdetectedwasapproximately67 ppmwith handheldunit no. 6.Figure8(b)showsthetransientdataof the autosafe
function, which empties the contents of each system
individually through the engine. The maximum value
attained for this test was approximately 170 ppm.
Neither of these tests breached the maximum operating
concentration of 240 ppm, which related to a local
concentration in excess of 1-percent gaseous hydrogen.
For both tests, lack of concurrence with the mass
spectrometer values could not be rationalized, but it is
speculated that there might have been time lag and
sample line switching issues. Regardless, even theaddition of the handheld units levels to mass
spectrometer levels measured did not breach the
240 ppm acceptability limit set for the test. There is no
direct way to relate these measurements to a
conservative estimate of leak rate given the small
number of sample points. If the system were allowed to
reach equilibrium, and more sample locations were
available, an estimate of the mean concentration could
be surmised. Using this surmised value and assuming
that this is a homogeneous mixture at standardconditions within the canoe volume (72 ft3), then
multiplying by the percentage ratio of pure hydrogen
gas to the test gas, dividing these results by the time
period (N3 sec) of the main flow, and doing the
necessary unit conversions; will result in an
approximate leak rate from the system. Based upon the
1-percent accuracy of the handheld units used for this
test, this is equivalent to a 20-ppm measurement
capability within the volume. If the system were
allowed to stabilize after the main flow, the leak rate
minimally detectable by this method would be
approximately 50 scim. This leak rate was well within
the limits of acceptability.
Onboard hydrogen detectors for in-flight assessment
purposes were researcher requested, but not flight safety
critical to the program. Commercial systems are
available, but were not proven to be robust equipment
with a history for this type of application. One such
system was provided for the project that used a
palladium-nickel sensor design developed by Sandia
National Laboratories of Albuquerque, New Mexico,
and had a temperature compensation control package.
This system was taken to bench tests for calibration
which would check out the useful pressure altitude
range of the system and sensitivity of the sensors.
Calibrations were performed with uncertified
7American Institute of Aeronautics and Astronautics

customizednitrogenand hydrogenmixtures.Thepreliminaryresultsof thesetestswereencouraging,butasaresultofscheduleissues,it onlywasacceptedtousetheseinstrumentsasadiscreteindicatorof ahydrogenleak.Oncethesystemwasintegratedintothepod,thedifferencein instrumentationsetupfromwhatwasusedonthecalibrationbenchin somewaycorruptedthesignals.The problemswere elusiveand wentunresolved.The systemwas disregardedas anindicationofin-flighthydrogendetection,whichaddedahigherlevelofrisktotheprogram.
As statedpreviously,theoxygensensorschosenforimplementationwereputthroughrigorousqualificationtestingbeforetheycouldbeemployed.Thestrategybehindtheiremplacement(seefigure5)wasasfollows.Sensors1and2,beingforwardofthegaseoushydrogentanks,wereintendedto verifypurgeandcanoehullintegrity.Sensors3 through8 monitoredoxygenmigratingwiththepurgedownthelengthofthecanoeandflowingoverthegaseoushydrogentanksandmainfeedlines.Sensor9wastoverifythatthemodelpurgewasactiveandthattherewasno oxygenintrusionthroughthemodelhull.Sensor10wastheliquidoxygenspill monitor.Sensors11 and 12 monitoredtheatmospherearoundthe manifoldswhereboth thegaseoushydrogenandliquidoxygenmainfeedlinessplitintotheengineblock.
Thedetectorsperformancewassurprisingandprovedbetterthanexpected.As a confidence check of the
instruments before activation of the nitrogen purge, the
oxygen sensors were compared to standard atmospheric
conditions for nominal operation checks. After
acceptance checks, an inert environment was
established. Figure 9 shows a time history response of
the oxygen sensors (with the canoe and model volumes
inert) to the flight dynamics of takeoff, through
establishment of an altitude at 31,000 ft.
Figures 10(a)-(d) show the correlation of liquid oxygen
prechill and main valve flow startup with oxygen
detection sensor data. Parameter PRECHILL represents
the prechill valve command and parameter LOXMAIN
is the main valve command. Figure 10(a) is of oxygen
leakage that was detected during a first main flow
through the system from a ground test. Figure 10(b)
shows oxygen leakage detected during the second main
flow through the system from the same ground test.
After the first, and sometimes second, main flow was
executed, the autosafing function was executed to empty
the tanks of their contents. Figure 10(c) demonstrates
the detection of oxygen leakage that occurred during the
oxygen autosafing process from a ground run. Based
upon these results, the purge rate was increased. This
increase was expected to improve the purge
effectiveness and flight testing resumed. Figures lO(d)
and lO(e) are the oxygen leakage detection data from
that flight, in which a single main flow and then the
autosafing function were executed, respectively.
As previously stated, the oxygen sensors had an
uncertainty of approximately 0.1 percent at mean sea
level (see figure 6). Using this uncertainty as the
minimum detectable oxygen concentration by the
sensor, knowing the volume of the model (51 ft3), and
assuming that a 0.1-percent concentration that was
measured represented a homogeneous mixture
throughout the model volume; an estimate of the
minimal detectable leak rate from the system could be
made. The minimum detectable leak rate of liquid
oxygen is estimated to be approximately0.04in.3persec. From the data in figure 10(a), a
conservative approximation of the homogeneous
concentration peak is 1.6 percent within the model
volume after a first main flow of liquid oxygen lasting
3 seconds. The leak rate of liquid oxygen from thesystem for this test is estimated to be 0.63 in.3 per sec of
liquid oxygen. From the data in figure 10(e), a
conservative approximation of the homogeneous
concentration peak is 3.5 percent within the model
volume after a liquid oxygen autosafe blowdown test
lasting approximately 30 seconds. The leak rate fromthis test is approximately 0.14 in.3 per second of liquid
oxygen. Each of these test runs show leak rate data
representing a composite leak rate from a transient
system. This is what made the identification of the leaksource such a difficult task. It is believed that the
quantity of liquid leakage that has been estimated, when
split up by the number of possible leak paths from the
system, was not detectable by visual inspection
techniques. This data reinforces the position that
sensitive instrumentation, when strategically positioned,
can provide a wealth of information on the health of the
systems.
Helium Signature Test
NASA KSC has performed a significant amount of
research on the use of a mass spectrometer for leak
detection of the Orbiter main engines and propellant
feed lines. Of notable interest is the technique that was
developed for leak detection of the main engines and
feed lines, known as the "Helium Signature Test
(HST)." The minimal leak detection capability achieved
with this technique, as applied to the Orbiter propellant
feed systems and the Space Shuttle main engines purgerate, has been measured to be on the order of 6.0 scim. 7
8American Institute of Aeronautics and Astronautics

HSTis a two-stepprocessthatcharacterizesleakagefromthesystem,andthenusingactualleakagedata,allowsone to extrapolatewhat the operationalequivalentleakagemaybe.Applyingthepurgerateofthemodelto theresultsof thesignaturetest,onecanascertaintheflammabilityhazard.
Thefirst stepof characterizingleakageis to insertgaseousheliumat knownflow ratesintoa purgedcontrolvolume,using a wand at predeterminedlocationswhereleakageis mostlikely to occur,i.e.joints,instrumentation,sectionfittings,andvalves(seefigurell(a)). Themassspectrometerthenpullssamplesofthepurgedenvironmentfromafixedeffluentlocationforeachinsertionpoint,andcharacterizesthemassspectrometerresponseforaknownleakrateatthatpoint.Thisdataisusedtodevelopcalibrationcurvesfortheknowninjectedleakrate.
Thesecondstepinvolvesapplyingback-pressurewithgaseousheliumto thefeedsystemandsamplingthepurgeeffluentfromthesamefixedeffluentlocationthatwasusedduringthecharacterizationtestpoints(seefigure1l(b)).Oncethereadingshavestabilizedandarerecorded,severalmoreback-pressuresettingsareusedtoaddmorespreadtothedatapoints.Theback-pressuredatais thenusedwith thecharacterizationdatatogeneratea responsecurveof leakagefor givenoperationalpressures.In theory,it is thenpossibletoextrapolatewhatthe overallleakagewill beat theoperatingpressuresofthesystem(seeAppendix).
Themassspectrometerinstrumentwasusedonlyforthe3-percentgaseoushydrogenblowdowntestdiscussedpreviouslyand the HST.Figure 12 showstheapproximatelocationswithinthepodvolumewheregaseousheliumwasinsertedtosimulateleakagefortheHST.A panelneartheaft left-handsidewascrackedopen(N6in.verticalslit)toactasasinkforthepurge.Theprobeforthemassspectrometerwasinsertedintothisslit.
ThedatafromtheHSTwasseparatedintothecanoeandthemodel.Onlythemodeldataisfullyanalyzedin thispaperbecausethemodelvolumeis wherethemostsignificantpotentialfor a hazardexistsbyhavingtheliquid oxygen and gaseoushydrogensystemscoexisting.Themodelgaseousheliuminsertiondataforthecharacterizationportionof thetestis plottedinfigure13(a).Theaverageofthedatawascomputedandplottedaswell.Alinearcurvefit oftheaveragedatawasgeneratedandoverlaystherealdata.Theworst-caselinearcurvefit wasgeneratedfromdeterminingtheequationof the line throughthe y-intercept(the
baseline)andtheworst-casedatapoint.Thedifferencebetweentheaverageandtheworstcaseisusedastheuncertaintyof the dataset.The dataplottedinfigure13(a)showsatightgroupingthatlendscredibilityto thestatementthata leakatanylocationalongthesystemwithin the modelvolumewill be readilydetectablebythemassspectrometerduringtheback-pressureportionofthetest.
Gaseousheliumwasthenappliedthroughtheengine,usingspecialthroatplugfittings.Samplesweretakenatseveralback-pressuresettingsinanattempttoprovidesomedataspread.Usingtheconcentrationsmeasuredduringthegaseousheliumback-pressuretest,theleakrateateachback-pressurepointcanbecorrelatedtothegaseousheliuminsertionratesaverageleak rateequationtoestimatethewholesystemleakratefromtheback-pressuresetting.Thisdataisshowninfigure13(b)withtheuncertaintyshownbytheverticalbars.It isimportanttorememberfortheLASREtestcasethattheleakagemeasuredduringthegaseousheliumback-pressuretestincludesanypossibleleakagefromtheliquidoxygensystem.Thisisaresultoftheinabilitytoisolatethe liquidoxygensystemfrom thegaseoushydrogensystemforthegaseousheliumback-pressuretest.It meansthattheresultsfromtheback-pressuretest,asrelatedtotheresultinggaseoushydrogenleakrate computations,are a conservativeestimation,becausethey includeanyleakagefrom the liquidoxygensystem,but theextentof the liquidoxygencontributionwasnotquantifiable.
Oncethe gaseoushelium leak rateshavebeencalculated,it is possibleto relatethegaseousheliumleakratestogaseoushydrogenleakrates.Thiscanonlybeachievedif a fixed-geometrychokedorificeflowisassumed.Thismethodisdetailedwithapplicationoftheactualdataintheappendix,giventheknownmassflowrateof gaseousheliumandits sourcepressureandproperties,it is possibleto calculatetheapproximatesizeof theleakorificebasedupontheseassumptions.Then,knowingtheleakorificesize,andthegaseoushydrogensystemoperatingpressureandproperties,onecancalculatewhattheequivalentgaseoushydrogenmassflowrateisforthissamegaseousheliumleakrate.Theresultsofthisconversionareshowninfigure13(c).
Nowhavinganestimationof theleakratesfromthegaseoushydrogensystemandknowingthepurgeflowrate,thehazardcanbescaled.Thisisaccomplishedbytakingthegaseoushydrogenleakrateanddividingit bythepurgemassflowthroughthemodel.This,ofcourse,assumesahomogeneousmixturethroughoutthemodelvolume.
9AmericanInstituteofAeronauticsandAstronautics

FortheLASREexperiment,themainflowcyclewasscheduledto runforonlythreeto fiveseconds.Teamconsensuswasthatthevolumewouldhaveremainedinertandbeguntonearlycompletelypurgetheleakagewhichoccurred during the test within a short amount of
time thereafter. So, a better estimation of the true hazard
is to take the leak rate estimated and integrate it over the
three seconds of main flow. This quantity, in proportion
to the model volume, is a better assessment of the
gaseous hydrogen concentration hazard. The results of
this calculation are shown in figure 13(d).
Pressure Transducers
It is speculated that the ambient pressure sensor that
monitored the pressure of the volume inside the model
detected cryogenics leaking during the prechill and
main flow. Figure 14(a) shows ground run data,
beginning with the command of the prechill valve
PRECHILL, that reveals a very low-amplitude, high-
frequency noise signal present on the pressure
transducer signal that samples the pod internal pressure.
Once the main flow valve (LOXMAIN) was
commanded closed, the noise component on the signal
trace (PODPRES) disappears. This event was observed
routinely when cryogenics flowed through the oxygen
system and only when the volume was closed up.
Figure 14(b) shows the in-flight data of the same
phenomenon with the amplitudes a bit less than the
ground data. The low-frequency high-amplitude signal
that this noise is superimposed upon, is a result of the
purge performance (i.e. - liquid nitrogen flowing
through a heater exchanger to vaporize it before
injection into the volumes). No other correlation to any
other system events could be made with this data.
In summary, table 1 displays leak detection techniques,
brief descriptions, notes on limitations and
considerations, and some leak rate detection
quantification broken into the two classifications
discussed previously. It also shows conservatively
calculated quantification of the leak rates detectable by
the techniques employed on LASRE as compared to
past experiences and test results. Quantification of the
leak rates is very difficult to achieve with the point
source measurement techniques and there was very little
historical precedence available on the leak rate
quantification of the systematic techniques. Note thatthe HST LASRE results are not indicative of the
minimal detectable leak rates for the system and
instrumentation configuration because there was no
characterization done for this technique. Only the
Pressure Decay Monitor Algorithm had characterization
testing done in order to determine its minimal detectableleak rate based on the instrumentation resolution and
uncertainty. The minimum detectable leak rates from
the oxygen system is based on oxygen sensor resolution,
uncertainty, and the assumption of a homogenous
mixture that is based upon concentration fieldmeasurements within the model volume.
10American Institute of Aeronautics and Astronautics

o
_%
<
0
c_"O
.o
0
0"1 0"1 0"1 _ [_
0 0 0 _ 0
z
_ _ ._ o_ ._ .o
... _._ o_._ _
._o_ .__ _ _ _ o_ _ ._o_._ _ _ ._
.o _ _ _ _
.o
o
z
0
.._ el)
¢q
c_
"0
0
0
z
0
N_
0
o
o
o
0
0 "0
¢q
©L_
C_
c_
"0
0
0
z
e_
el)
el)
©
.._
0
"6Z
0
z
el)
o
11
American Institute of Aeronautics and Astronautics
Concluding Remarks
This document describes the results of propellant feed
systems leak detection tools and techniques applied as
part of the validation testing of the Linear Aerospike
SR-71 Experiment (LASRE) program flown at NASA
Dryden Flight Research Center, Edwards, California.
This testing was conducted in order to meet the safety
requirements associated with the use of combustible and
detonable gases aboard a piloted aircraft. The goal of
this paper is to provide an assessment of leak detection
techniques for hazard mitigation of hydrogen-oxygen
propellant feed systems, based upon the experiences of
the LASRE program team. This document also provides
some insight into strategies that may improve leak
detection for the success and increased safety of other
programs, and provides suggestions for future research.
The conclusions and suggestions based upon the
LASRE experience are as follows:
Propellant Feed Line Design Considerations
• Build in provisions to leak check the majority of a
fluid system lines and fittings trader static
conditions. There was no provision built into the
LASRE design for blocking valves close to the end
of the feed lines, leaving the system open to
ambient pressure from the source once the main
blocking valve and flow-control valves were
opened. This feature would have made it possible to
do systematic static leak tests on the system. In
particular, the design lacked the means to
determine whether the liquid oxygen leakage was
coming from the main feed lines upstream of the
main and prechill junction, the prechill line, or
downstream of the main and prechill junction. It
also left no means to isolate the liquid oxygen
system from the gaseous hydrogen system when
the Helium Signature Test was being conducted.
• Successfully isolating the feed systems would
reduce the instrumentation requirements necessary
to assess the health of the systems and further
reduce the hazards. Design the individual systems
such that the oxidizer, fuel sources, and feed lines
are separated by as much purged space as is
reasonably allowable. If possible, isolate these
systems with sealed boundaries and create separate
purge paths. LASRE did take advantage of this
isolation in the sense of the gaseous hydrogen
being stored in a compartment separate from the
liquid hydrogen and the intention of the design was
to have the purge operate as two separate flowpaths.
A physical boundary existed between the canoe and
model, with the exception of the sewer pipe, which
did not preclude liquid oxygen from dripping from
its feed lines down into the compartment where the
gaseous hydrogen was housed. A plate over the end
of the sewer pipe with feed-throughs would have
been an easy isolation solution early on in the
buildup phase that would have added confidence to
the system.
Pu__ur_
• An acceptable leak rate must be clearly defined and
is based predominantly upon the mass flow rate of
the purge system. As a rule of thumb, size the purge
for the volume accordingly, so that a high-enough
Reynolds number is generated to ensure turbulent
flow for all phases of operation. This procedure (or
high Reynolds number) enhances the rate of
dilution to bring the mixture to an inert state and
transports it from the volume quickly. This would
also maximize the acceptable leak rate, which
would make the validation of the systems that much
easier to achieve. The negative impact is that it
might require more stores to be carried than
initially planned. For LASRE, the volume change-
out rate was 1.5 volumes per minute for ground
operations. At test altitude (N50,000 ft), this
changed favorably to nearly 10 volumes of change-
out per minute which was encouraging.
• It is desirable to characterize the purge and validate
leak detection techniques by introducing quantified
leaks. This is accomplished by activating the purge
with the system in the configuration intended for
nominal operation and inserting known leak ratesinto the volume, one at a time until stable data is
generated. Enough source locations should be
attempted to convince one that any leakage from
the propellant systems will be indicated by the
detection system and identify flowpath patterns and
characteristics. None of this was conducted by
LASRE until the Helium Signature Test was
conducted, and as a result it indicated a purge
flowpath from the model into the canoe when the
canoe's manual vent was opened. This was not the
intention of the original design and increased the
danger of the system operation by bringing together
purge laced with oxygen and hydrogen. It was then
the intention not to operate the vent unless an
overpressure was eminent to the pod.
• Be sure to re-characterize the limits of the system
when changing the purge settings because the new
settings may not have achieved the desired
response. In the case of LASRE, it was assumed
12American Institute of Aeronautics and Astronautics

that increasing the purge mass flow rate between
the last successful ground test and the following
flight test would improve the performance and
safety of the system operation. Unfortunately, these
good intentions might have contributed to
unfavorable results. It is speculated that the LO 2
leak indication from the flight data was caused
either by the resulting change in the purge flow
path, where indications from oxygen sensors of
previous ground run data were not seeing the
oxygen leak at its full potential, or that the liquid
oxygen system had in some way degraded from the
last ground test. The purge mass flow rate change,
without characterizing the results with a ground
test, added a variable that could not be accounted
for in the flight test results.
Techniques and Tools
• Visual inspections methods are valid for gross leak
checks of cryogenic systems only. Extremely low
flow rate leakage from multiple cryogenic fittings,
which vaporize nearly instantaneously, can
contribute significantly to an overall violation. This
was where LASRE repeatedly made its mistakes.
The inspection team was looking for some kind of
visual indication during flow tests. Most likely, they
could not detect these with the naked eye.
• Bubble checking, joint bagging, and ultrasonicdetectors were not sufficient leak detection
techniques to meet acceptability requirements forLASRE.
• The pressure decay algorithm must be applied withcaution. The resolution of the instrumentation
limits this technique to detecting only gross
leakage. The greater the tank volume in question,
the greater the leakage before detection by the
algorithm.
• Commercially available hydrogen detector systems
show promise, but in this application they remain to
be proven. Considerable research in qualification
and validation testing still needs to be done to
improve this technology before achieving
integration. The full range of altitude as a
requirement needs to be met as well.
• Commercially available oxygen sensors
demonstrated good leak detection performance, but
a thorough calibration and qualification of these
sensors are a prerequisite.
• Using high-precision pressure transducers that
measure ambient environmental conditions, it may
be possible to detect what might be cryogenics
leaking through fittings and boiling off. The use of
multiple sensors might allow approximation of thelocation of the leak source. More research is needed
to validate this technique. This method may be
limited to single-source leak detection. To improve
accuracy in determining locations, the purge might
need to be non-operational once the environment isinert.
• The location and the quantity of sensors is critical
for gathering the optimum amount of information
and assessing the health of the system. The
philosophy generated from the LASRE experience
was to: (1) place a higher number of oxygen
sensors along the fuel lines and fewer in the
surrounding regions of the oxidizer lines and
(2) place a higher number of hydrogen detectors
along the oxygen lines and fewer in the proximity
of the hydrogen systems. The danger to either
system exists when one component is above the
flammability limits and in close proximity to its
complement system. It is unlikely that a high
concentration of fuel or oxidizer will persist at any
location remote from the leak source as long as a
validated purge is doing its job. Therefore, any
leakage from one system may never reach the other
or do so at levels below flammability. This does not
preclude the need to validate leak detection
capability if you have a leak of oxygen, hydrogen,
or both. This may or may not be acceptable
depending upon the philosophy of the design andtest team and the risk levels associated with the
program.
• Because transient cryogenic systems are so difficult
to leak check, a total mass capture technique might
be employed to quantify the leak rate of the system.
This could be achieved by capturing purge gas
vented from the volume, beginning from the event
start until a portion of time after the event. One
suggestion would be to perform this capture for the
time necessary to complete at least one volume
exchange. Then knowing the timespan of the event,
it would be possible to estimate the total mass loss
during the event from a mass spectrometer sample
of the mass captured.
• Although the fundamental theory behind the HST
technique makes sense, further research is needed
to validate the assumptions made and quantify the
accuracy. It was noted that during the LASRE HST,
the effluent from the cracked panel was stratified.
For improved accuracy on the effluent
measurements, a total mass capture of steady state
conditioned effluent might be done and then a mass
13American Institute of Aeronautics and Astronautics

spectrometerreadingperformedon this totalsample.A suggestion for mass capture would be a
large vacated bottle or simply a bag to be filled and
then samples withdrawn.
• The HST data, supported by 3-percent blowdowndata, lent confidence that the LASRE gaseous
hydrogen feed lines met acceptability criteria. The
design of the feed systems do not allow for
separation of the gaseous hydrogen system fromthe liquid oxygen systems during the back-pressure
portion of the Helium Signature Testing. As a result
of this design shortcoming, it is speculated that the
results are composed of leakage from both feedsystems. The analysis of the data is presented as
leakage from the gaseous hydrogen system onlyand believed to be a conservative estimation based
upon this information.
• The HST was effective for characterizing leakage
from the liquid oxygen system because it does not
have the ability to replicate the transient effects ofoperating the liquid oxygen system. It is believed
that thermal shock and loading issues inherent to
the use of cryogenics cannot be adequately
addressed by the results of the back-pressureportion of the test.
• The detected leak rates by the HST at lower source
pressures may not actually linearly extrapolate to a
higher source pressure. The extrapolation may or
may not be an appropriate assumption, dependingon the flow regime, dominant physics of the leak,
and whether the leakage is linear as a result of
loading.
References
l"Safety Standard for Hydrogen and Hydrogen
Systems," NASA NSS 1740.16, Office of Safety and
Mission Assurance, Washington, D.C., 1995.
2"Safety Standard for Oxygen and Oxygen Systems,"
NASA NSS 1740.16, Office of Safety and Mission
Assurance, Washington, D.C., 1995.
3"Ignition and Thermal Hazards of Selected
Aerospace Fluids," NASA JSC White Sands Test
Facility, RD-WSTF-0001, 1988.
4,,ignitability of Hydrogen/Oxygen/Nitrogen
Mixtures at Reduced Pressures," NASA JSC White
Sands Test Facility, TR-243-001, 1980.
5Corda, Stephen, Richard C. Monaghan, Leonard S.
Voelker, Griffin E Corpening, Richard R. Larson, and
Bruce G. Powers, Flight Testing the Linear Aerospike
SR-71 Experiment (LASRE), NASA]TM-1998-206567,
September 1998.
6Ennix, Kimberly A., Griffin Corpening, Michele
Jarvis, Harry Chiles, "Evaluation of the Linear
Aerospike SR-71 Experiment (LASRE) Oxygen
Sensor," AIAA-99-4815, 9th International Space Planes
and Hypersonics Systems and Technologies
Conference, Norfolk, Virginia, November 1999.
7Bilardo, Vincent J., Jr., and Francisco Izquierdo,
"Development of the Helium Signature Test for Orbiter
Main Propulsion System Revalidation Between
Flights," AIAA-87-0293, AIAA 25th Aerospace
Sciences Meeting, Reno, Nevada, January 12-15, 1987.
8Mizukami, Masashi, Griffen E Corpening, Ronald J.
Ray, Neal Hass, Kimberly Ennix, and Scott M.
Lazaroff, Linear Aerospike SR-71 Experiment (LASRE):
Aerospace Propulsion Hazard Mitigation Systems,
NASA TM-1998-206561, July 1998.
14Amelican Institute of Aeronautics and Astronautics

Appendix - Helium Signature
Test Leak Rate Computation
The following calculates the worst-case leak rate from
the gaseous hydrogen system at operating pressures
based upon the leakage measured from the gaseous
helium back-pressure test and the calibration curves
generated by the characterization test. The zero point is
forced through zero, again providing a worst-case
condition (background noise is not subtracted).
Using the line equation, y =mx + b and the 0 slpm
and 3.635 slpm points (worst-case slope from
figure 13(a)) for the 60 psia gaseous helium back-
pressure results:
m = (y2-Yl)/(x2-xl)
= (6530-335)/(3.635-0)
= 1704.26
b=O
y = 780 (maximum leakage seen during GHe back-
pressure test @ 60 psia)
x = (y-b)/m = (780/1704.26) = 0.4577 slpm or27.923 scim.
This leak rate is then correlated to a gaseous hydrogen
leak at operating pressure using the information
provided by Tibor Lak of Boeing, Downey, California.
This equation is an approximation that assumes the leak
path(s) to be small and choked flow occurs at the exit
plane(s). The simplified coefficient for helium is 0.21
and for hydrogen is 0.14.
GHe @ 70 °F + 14.7 psia,
PGHe = P/RT
= (14.7 psia x 144 in2/ft2) / (386.18 lbfx ft/lbm x °R x
530 °R) = 0.01034 lbm/ft 3
GH 2 @ 70 °F + 14.7 psia,
OGH2 = 0.00515 lbm/ft 3
Using the standard mass flow rate obtained above,
mdotGH e = oGHe × mdotGHe@st d
-- 0.01034 lbm/ft 3 × (27.923 scim)/
(1728 in.3/ft 3 × 60 sec/min)
= 2.785 × 10 6 lbm/sec
The theoretical orifice size is calculated next, based
upon the mass flow rate.
For the gaseous helium,
Cda = (mdot × T 1/2) / (0.21 × P)
= (2.785 × 10 6 lbm/sec) × (530 °R1/2)/((0.21) ×
(60 lbf/in.2))
= 5.089 × 10 6 in.2
This is then correlated to a gaseous hydrogen leak at
operating conditions (600 psia),
= (5.089 × 10 6 in × 0.14 × 600 psia) /mdotGH 2
(530 °R-)
= 1.857 × 10 5 lbm/sec
the equivalent flow rate at standard conditions is,
mdotaH2@st d = (1.857 × 10 5 lbm/sec × 1728 in3/ft 3
× 60 sec/min) / (0.00515 lbm/ft 3)
= 373.83 scim
This can then be correlated with the purge rate to
estimate the hydrogen volume fraction of,
percent H2 ---- QGH2/Qpm.g e
=374/14,000
= 2.67percent (assuming homogenous
mixture)
15American Institute of Aeronautics and Astronautics
0\/100
10_/90
00Np2C:ennCtntorlati°2' 50\_.f_,_I_X_ _.2_/_Pa..._/50 O2rCc°enntento;atic2'
,o\1\,
90 _ I _" "_"\/\,/I_ _! X/"_,_y.._°a_X_/lOIU',"-')r,-_--_'_,12.OkPa ,'7_---7_"."--A
100\/ \/ "_/ _=/ \,80.0 .........kPa'_/"" '" "" / ..... \/ _/0
0 10 20 30 40 50 60 70 80 90 100
H2 concentration, percent volume 990205
Figure 1. Flammability limits of hydrogen-oxygen-nitrogen mixtures at reduced pressures•
Pressure,psia
_... .,gni,ion• • Non-ignition
10.0 ! i i ! i i ! ! ! i i ! ! ! ! i i i ! ! i ! --': : ! ! ! ! ! ! ! ! ! ! i i ! ! ! ! ! ! ! !
5.0 ....... Fladzn_abl_ ................... Flamdzabl_ .........° ,!
........ regmn ....................... reg!on ..........
1.0 : : : : : : : : : : : : : : : : : : : : : : -" : " .............. " ....- . . , . ) • . . . ....... . ) • •
. . , .......... , . . • * • • . , ............. . . . . . • , . . .
Nonflammable _. Untested "_.= Nonflammable -'_,.._.10 --' ' rbgio;n .... ew,,_e--e • ,,_,, 7": : ¢egidn: ; : : : : : : : _.e_.e
:!i:::!{i!i!!!! !!!_.*_ ::::::::::::::::::::::::.05 ............... ' ........ ",., ,,'. • • ;, ,','., .','." i.'.',',, .'.:,'. i
0 5 10 15 20 25 30 0 5 10 15 20 25 30
Percent hydrogen Percent hydrogen 990206
(a) 240 ft 3 chamber. (b) 10 ft 3 chamber.
Figure 2. Ignition pressure limit with the standard excess oxygen and hydrogen mixtures•
16
American Institute of Aeronautics and Astronautics
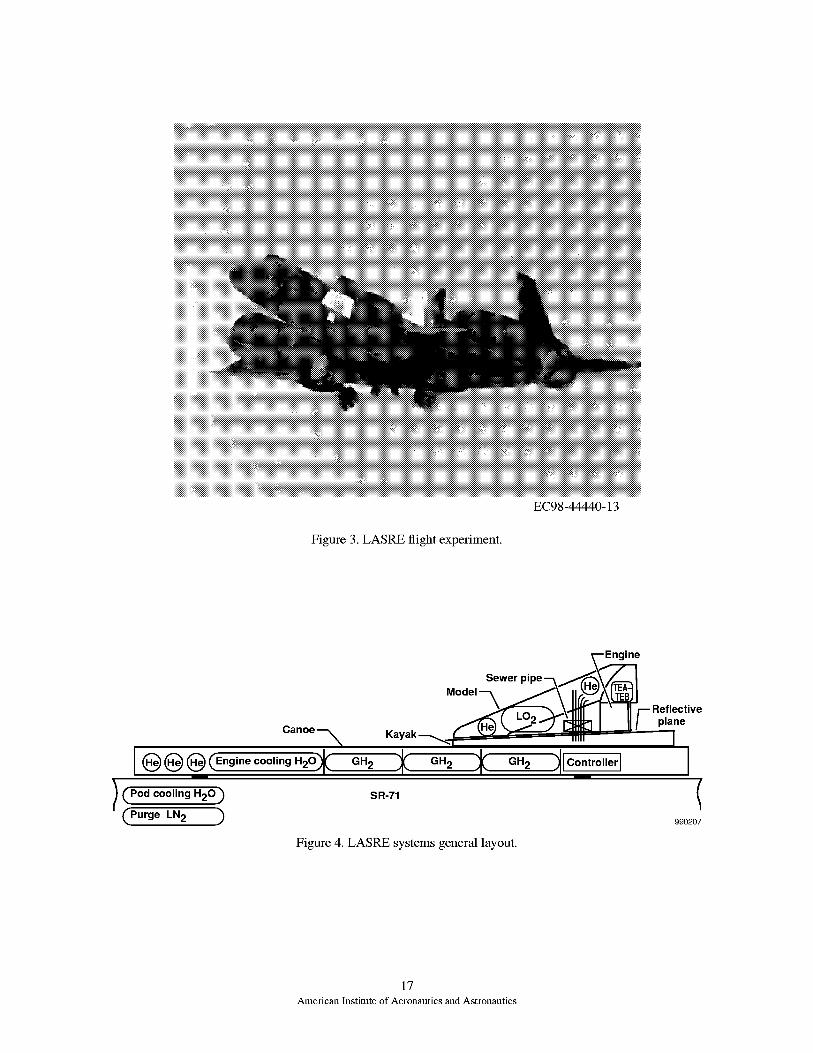
Figure3.LASREflightexperiment.
EC98-44440-13
Canoe
I (_) (_ (_ (Engine coo'ingH20)_E
C Pod cooling H20)
(Purge LN2 )
GH 2
EngineSewer pipe --_'_"_
Kaak ve"_ GH2 _ GH2 IC_r°llerl ]
SR-71 1
990207
Figure 4. LASRE systems general layout.
17
American Institute of Aeronautics and Astronautics
(_) Oxygen sensor_+ Purge source
\
//
//
Pod, side view
Model, top view
I/ I I /'
I
I
H20 tanks
Canoe, top view
III
!
'f
GH 2
I II I
I I / II I / I
Figure 5. Oxygen sensor location.
Percent
0 2
uncertainty
2.0
1.5
1.0
.5
i, Sensori
1--B- 2
5
iiiiiiiiiiii10 20 30 40 50 60 x 103
Pressure altitude, ft980352
Figure 6. Oxygen sensor uncertainty at altitude.
18
Amelican Institute of Aeronautics and Astronautics

Model, top view
(oCZ) ©,/ /
!
(Pod, side view q
I
0©( H2Otanks ) ( GH2 ) ( GH2 ) _
Canoe, top view
I I
I II II I
f tf ti_Figure 7. Three-percent gaseous hydrogen sample port locations.
/
II
19
American Institute of Aeronautics and Astronautics

H2 ,
ppm
Transient data after main flow250240
...... i--o- Handheld 1 Maximum allowed H2 level,
--D- Handheld 2i 1 percent equivalent I
200 ........--o- Handheld 3i ..........i.........
-&- Handheld 5 i-B- Handheld 6i
Mass. s _ec.i 9
150
100
5O
0 1 2 3 4 5 6 7 8 9 10 11 12 13 14 15 16 17 18 19 20
Time, min990210
(a) After main flow.
H2 ,ppm
250 I _ i :: i _ :: _1240"1........._".................. ,......... +....... _"........ i........."" :. _:! ::i m,-,, ..... :... _:... : . .
I Trans ent data :: :: : : : _ : :: ::I after H autosafe _ _ Maximum allowed H2 level, _ -o- Handhel
I i 2 i 1 percent equivalent i -D- Handheld 2 I200 t.............i...........................i.............i.............i..............i.............i............._...............i..............i............._.....-o- Handheld 3- t
_ i -_- Handheld 5 II _ i -B- Handheld 6 "
_ i _ Mass. spec. 4
150 i i -A- Mass. spec. 5
100
5O
1 2 3 4 5 6 7 8 9 10 11 12
Time, min
(b) After hydrogen autosafe.
Figure 8. Three-percent gaseous hydrogen blowdown data
13 14 15
990211
20
Amelican Institute of Aeronautics and Astronautics

.6Percent
0 2 , .5model
.4
1.0 Oxygensensor
.9 ......................................................................................................................................................................................................i....................................... 9
.7 ......................................._.......................................i.......................................i.......................................i.....................Crr_i ....................................... 11:'_ ._i; ji .... 12
............................................................................. _............................................................... +'+J++++++:+:++_+++_.......... "I ........ "............. I ........ t++++....................4 I ' I +X" ".:i.._ ""
i _:P:.i" i " I ";_+',i i_!, _.............................................................................................................................. _ sX: .................................... I ............................. _11+ ........... ' 1 _1111111 '_ 1 _
.3!" '_++._+++'+++++.,,_.+.x!..(.t +.j+X+............................../+/.,._.x_j,_;.........++++++..+.ft.+++'t!i[i++_:+_+++++.+.. _++ ..................... +..............,_i_ti_.]"++'J"++_
• 2 1 11; ........... _ .............. + 1 + 111+11 1+ 1 ++;+:_1 + ..................................................2 ' + % i , + i
0
Altitude,ft
35 x 103
30
25
20
15
10
5
-- Altitude
100 200 300 400 500 600
Time, sec gg0212
Figure 9. Purge effectiveness with altitude change.
21
American Institute of Aeronautics and Astronautics

2.4
2.2
2.0
1.8
1.6
1.4Model,
percent u2' 1.2sensors
9-121.0
.8
.6
.4
.2
0
1.2
/-11
LO2valve
commands
1,1 ...................................... * ....................................... ' ....................................... ' ........................................ ' ....................................... ' .......................................
PRECHILL1.0 _ ,--_-...........:............................................................................................................................................................................................................
I_ LOXMAIN.9 ....................t..........i......................................................................................................................................................................................................
II
.8 .....................I...................................................................................................................................................................................................................I
.7 ....................1.......................................................................................................................................................................................................................II
.6 ....................t .................................................................................................................................................................................................................II
.5 .....................I.........................................................................................................................................................................................................................I
.4 ....................1.......................................................................................................................................................................................................................II
.3 ....................1.................................................................................................................................................................................................................II
.2 .....................I .......................................................................................................................................................................................................................I
.1 .....................1.................................................................................................................................................................................................................II
0 20 40 60 80 100 120
Time, sec 990213
(a) Ground run 63 first main flow.
Figure 10. Oxygen sensor response.
22
American Institute of Aeronautics and Astronautics

1.0
Model,percent 02,
sensors9-12
.4
.9 ............................................................................. _ ...................................... _ ...................................... _ ...............................................................................
.8 i
.7
.6
.5
.3
.2
.1
9--7O
1.2
LO 2valve
commands
1.1
1.0
.9
.8
.7
.6
.5
.4
.3
.2
.1
........._PRECHIILL ...................................................................................................................................................................................................
......................I11/111111i................................................................................................................................................................i.......................................II
I......................| ..........,:.................................................................................................................................................................:,......................................
II
......................I..........._........................................1.......................................1.......................................1...............................................................................
II
I.......................| ..........,:.................................................................................................................................................................:,......................................
II
........................I..........._........................................1.......................................1.......................................1...............................................................................
II
.......................| ..........,:.................................................................................................................................................................:,......................................
I........................I......................................................................................................................................................................................................................
IIL_ L i ................................ _ ............
20 40 60 80 1OO 120
Time, sec 990214
(b) Ground run 63 second main flow.
Figure 10. Continued.
23
AmeJican Institute of Aeronautics and Astronautics

5.0
4.5
4.0
3.5
3.0
Model,
percent 02, 2.5sensors
9-12
2.0
1.5
1.0
.5
O
1.2
Pr
/ ............I1
12-
,I
...........................................]...../........................................................................................................................................................................................
I [ 1°i_ . LJ
LO 2valve
commands
1.1
1.0
.9
.8
.7
.6
.5
.4
.3
.2
.1
........FPRECHIEE ........................_-LoxM.AiN ....................................................................................................................................
I i I
I i 'l ; ;I i i i i i
...............1.....................i....................................I...............................................................................................................................................................I i I; ;I i j; ; i i
...............I.....................i......................................;.......................................;........................................................................................................................I
i ....
II
II
I
20 40 60 80 100 120
Time, sec 990215
(c) Ground run 63 autosafe blowdown.
Figure 10. Continued.
24
American Institute of Aeronautics and Astronautics

6.0
5.5
5.0
4.5
4.0
3.5Model,
percent 02, 3.0sensors
9-122.5
2.0
1.5
1.0
.5
O
1.2
LO 2valve
commands
1.1
1.0
.9
.8
.7
.6
.5
.4
.3
.2
.1
25
American Institute of Aeronautics and Astronautics

10
Model,percent 02,
sensors9-12
4
3
2
1
O
1.2
1.1
1.0
.9
.8
.7
LO 2valve ,6
commands,5
,4
,3
,2
,1
/- P.Eo..../-.ox...._i _I i i I i i i
................!..............i........................................ii........I..............................ii.......................................ii.......................................ii......................................II
I
II
............................................................................. • ........ | ............................. •....................................... • ....................................... • ......................................
II
I
II
............................................................................. • ........ | ............................. •....................................... • ....................................... • ......................................
II
I............................................................................. • ........ | ............................. •....................................... • ....................................... • ......................................
II
20 40 60 80 lOO 120
Time, see 990217
(e) Flight 51 autosafe blowdown.
Figure 10. Concluded.
26
American Institute of Aeronautics and Astronautics

I Propellant feed tankP = Pamb
J
GN 2
_7 Transducer
Valve
Venturi
Regulator
__ GN 2 and GHeGHe I Mass spectrometer I
990218
Figure 1 l(a). Gaseous helium characterization insertion point examples.
I GHeP >> Pamb
Transducer
M Valve
Venturi
Regulator
GN 2 and GHe
I Mass spectrometer I
Figure 1 l(b). Gaseous helium back-pressure testing.
990219
27
American Institute of Aeronautics and Astronautics

Model, top view
©
\\ ///GHe
!
Pod, side view
II
GHeI
II
H2Otanks ) ( GH2 ) ( GH 2
Canoe, top view
-k 7"\ | / \
\ - // / \\ I / \\ / Sample \
GHe port GHe/I \ \ /
/ I \ \ /// I \-- \_//
/ 990220
Figure 12. Gaseous helium insertion and mass spectrometer sample locations.
28American Institute of Aeronautics and Astronautics

18,000ii
Average trendy = 2170x +50
Concentration,ppm
16,000
14,000
12,000
10,000
8,000
6,000
4,000
2,000
Insert point 10
[] Insert point 11Z_ Insert point 13
O AverageLinear q
Model HST characterization
0 1 2
casey = 1637x +50
3 4 6 7 8
GHe flow rate, slpm 990221
Figure 13(a). Gaseous helium insertion response.
.500
.450
.400
.350
.300
GHe
leak rate, .250slpm
.200
•150
•100
.050
040 45 50 55 60
GHe back-pressure, psia
Figure 13(b). Gaseous helium leak rate due to back-pressure.
Calculated GHe leak rate based
....................................... on back-pressure data
"_6aicuiaieaGHe ......................................................................................................................................................leak rate i
:1 i i i
65
990222
29
American Institute of Aeronautics and Astronautics

.450
GH 2leak rate,
slpm
.400
.350
.300
.250
.200
•150
•100
.050
0
Estimation of 600 psi H2 ieak ratebased upon back-pressure
........................................i..................................................................................................................................................................Estimatedi600 psi
H2 leak r_te, slpm
4O 45 50 55 60
GHe back-pressure, psia
Figure 13(c). Estimated 600 psi gaseous hydrogen leak rate.
65
990223
.016
.014
.012
.010
GH 2 inmodel volume, .008
percent
.006
,004
.OO2
Estimated model volume fraction of
GH 2 in 3-second main flow test
Estimated percent H2of model volume in 3 sec
040 45 50 55 60
GHe back-pressure, psia
65
990224
Figure 13(d). Estimated gaseous hydrogen concentration post-test.
30
American Institute of Aeronautics and Astronautics

14.220
Modelvolume
pressure,psia
14.215
14.210
14.205
14.200
14.195
14.190
14.185
14.180
14.175
14.170
14.165
14.160
1.2
PODPRES
LO 2valve
commands
/ /1.0
.9 1 t
.8 ..................................................................................................................I.i..................................................t ...................................................................
I; I.7 .........................................................i.......................................................| ...................................................I ...................................................................
li I.6 .........................................................i.......................................................I....................................................1...................................................................
li Ii I I
.5 ................................................................................................................t...i...................................................t ...........................................................:: I I
.4 ........................................................ ...................................................... li ................................................... ] ...........................................................
i I I.3 .............................................................................................................l__i...................................................1--- ...........................................................
.2 ........................................................_....................................................t--i ....................................................t--- ...........................................................
t 'i lili I:.1 ...........................................................................................................i------+....................................................i-------+...........................................................
0 5 10 15 20
Time, sec 990225
Figure 14(a). Model pressure sensor excitation during prechill and main flow.
31American Institute of Aeronautics and Astronautics

5.150
5.145
5.140
5.135
5.130
5.125Model
volume 5.120pressure,
psia5.115
5.110
5.105
5.100
5.095
5.090
PODPRES
1,2
LO 2valve
commands
1,1 ............................................... '................................................. ' ................................................ ' ...............................................................................................
i i I i I
.9 .............................................i................................................i...............................i.............i..........................I....................i...............................................i i i i I
,8 ...........................................................................................................................I........................................I....................i..............................................i i I i I
I I i.7 .............................................i...............................................i..............................I .............i...........................t..................................................................
I I ii i ! i I
.6 .............................................i................................................i..............................I ..............i...........................I...................................................................
.5 .............................................i...............................................i.............................i..............i...........................t.................................................................I I i
_ I _ I•4 .........................................................................................................................i ...........................................I...................i..............................................
_ I _ t1 !
.3 ...........................................i i t i i
.2 .......................................................................................................................t............................................l..................i..............................................i i i i I
I I i•1 ............................................i................................................i..........................I..................i............................t .................................................................
I i
0 5 10 15 20 25
Time, sec 990226
Figure 14(b). Model pressure sensor excitation during prechill and main flow in flight.
32
American Institute of Aeronautics and Astronautics

REPORT DOCUMENTATION PAGE I FormApprovedOMB No. 0704-0188
Public reporting burden for this collection of information is estimated to average 1 hour per response, including the time for reviewing instructions, searching existing data sources, gathering and
maintaining the data needed, and completing and reviewing the collection of information. Send comments regarding this burden estimate or any other aspect of this collection of information,
including suggestions for reducing this burden, to Washington Headquarters Services, Directorate for Information Operations and Reports, 1215 Jefferson Davis Highway, Suite 1204, Arlington,
VA 22202-4302, and to the Office of Management and Budget, Paperwork Reduction Project (0704-0188), Washington, DC 20503.
1. AGENCY USE ONLY (Leave blank) 2. REPORT DATE 3. REPORTTYPE AND DATES COVERED
November 1999 Technical Memorandum
4.TITLE AND SUBTITLE
Propellant Feed System Leak Detection--Lessons Learned From the
Linear Aerospike SR-71 Experiment (LASRE)
6. AUTHOR(S)
Neal Hass, Masashi Mizukami, Bradford A.
Robert J. Beil, and Timothy R Griffin
Neal, Clinton St. John,
7. PERFORMING ORGANIZATION NAME(S) AND ADDRESS(ES)
NASA Dryden Flight Research CenterRO. Box 273
Edwards, California 93523-0273
9. SPONSORING/MONITORING AGENCY NAME(S) AND ADDRESS(ES)
National Aeronautics and Space Administration
Washington, DC 20546-0001
5. FUNDING NUMBERS
WU 242 33 02 00 23 00 T15
8. PERFORMING ORGANIZATION
REPORTNUMBER
H-2378
10. SPONSORING/MONITORING
AGENCY REPORT NUMBER
NASA/TM-1999-206590
11. SUPPLEMENTARY NOTES
Presented at the AIAA 9th International Space Planes and Hypersonic Systems Conference, Norfolk, Virginia,
November 1-5, 1999.
12a. DISTRIBUTION/AVAILABILITY STATEMENT
Unclassified--Unlimited
Subject Category 20
12b. DISTRIBUTION CODE
13. ABSTRACT (Maximum 200 words)
This paper presents pertinent results and assessment of propellant feed system leak detection as applied to the LinearAerospike SR-71 Experiment (LASRE) program flown at the NASA Dryden Flight Research Center, Edwards, California.
The LASRE was a flight test of an aerospike rocket engine using liquid oxygen and high-pressure gaseous hydrogen aspropellants. The flight safety of the crew and the experiment demanded proven technologies and techniques that coulddetect leaks and assess the integrity of hazardous propellant feed systems. Point source detection and systematic detection
were used. Point source detection was adequate for catching gross leakage from components of the propellant feedsystems, but insufficient for clearing LASRE to levels of acceptability. Systematic detection, which used high-resolutioninstrumentation to evaluate the health of the system within a closed volume, provided a better means for assessing leak
hazards. Oxygen sensors detected a leak rate of approximately 0.04 cubic inches per second of liquid oxygen. Pressuresensor data revealed speculated cryogenic boiloff through the fittings of the oxygen system, but location of the source(s)was indeterminable. Ultimately, LASRE was canceled because leak detection techniques were unable to verify thatoxygen levels could be maintained below flammability limits.
14. SUBJECTTERMS
Fire safety,
engines
Hypersonic vehicles, Leak assessment,
17. SECURITY CLASSIFICATION
OF REPORT
Unclassified
NSN 7540-01-280-5500
18. SECURITY CLASSIFICATION
OFTHIS PAGE
Unclassified
Leak detection, Rocket
19. SECURITY CLASSIFICATION
OF ABSTRACT
Unclassified
15. NUMBER OF PAGES
38
16. PRICE CODE
A03
20. LIMITATION OF ABSTRACT
Unlimited
Standard Form 298 (Rev. 2-89)Prescribed by ANSI Std. Z39-18
298-102