promoting israel’s trade globally israel economic mission
TRANSCRIPT
Promoting Israel’s Trade Globally
Israel Economic Mission
Ran Yehezkel, Consul for Economic Affairs
Philippe Paquin, Directeur du développement commercial
June 14th , 2012
Overview of presentation
• Role of the Economic Mission
• Supporting companies on micro/macro levels
• Economic Indicators
• Features of the Israeli Economy
• Israel’s Competitive Edge
• Ingredients for Innovation
• Cultural differences

Government of Israel
Economic Mission to Canada
• Division of the Ministry of Industry, Trade and Labor
• Offices in Toronto and Montreal
• Promote bilateral trade, focusing on Israeli exports
• Provide individualized services to Israeli exporters
• Promote joint Research & Development projects – CIIRDF, Maimop-NRC
• Attract Foreign Direct Investment to Israel
• Manage Israeli national pavilions at major trade events
• Part of a global network

Economic Missions around the World
supporting the Israeli exporter

How we support Israeli companies:
Micro Level
• Support the lone exporter
• Organize delegations to Canada & Israel
• Promote events, shows and exhibitions
Macro level: Israel’s Free Trade Agreements
• Free Trade Agreements
• Avoidance of Double Taxation
• Cooperation in Industrial R&D
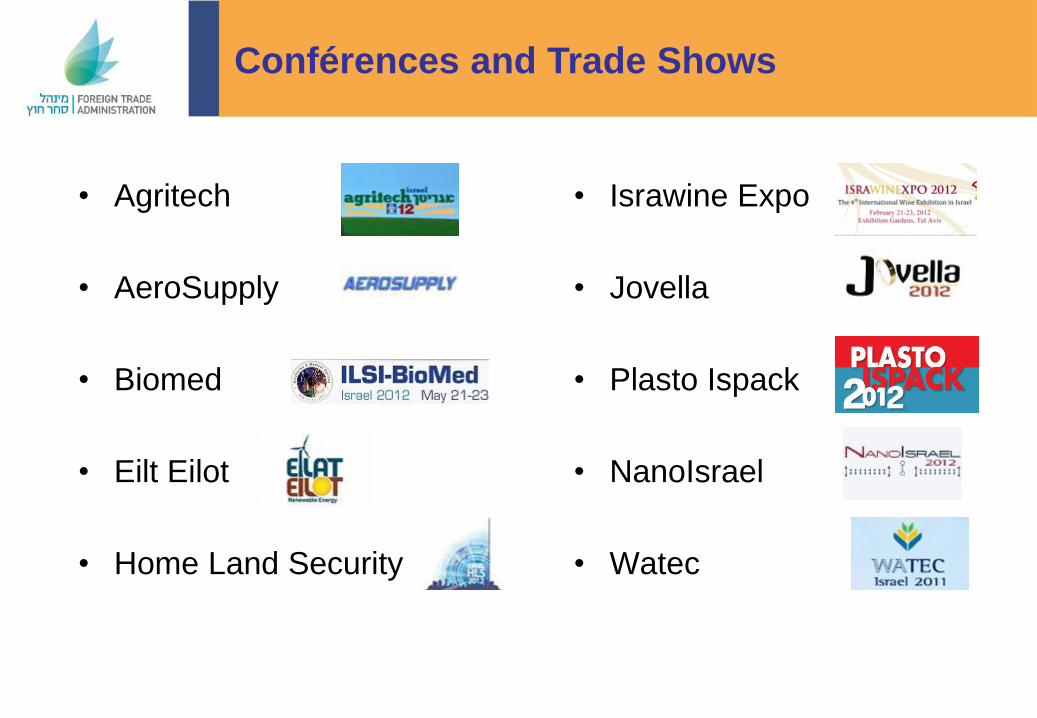
Conférences and Trade Shows
• Israwine Expo
• Jovella
• Plasto Ispack
• NanoIsrael
• Watec
• Agritech
• AeroSupply
• Biomed
• Eilt Eilot
• Home Land Security

Israel’s Free Trade Agreements
Existing:
EU
USA
EFTA
Turkey
Mexico
Canada
MERCOSUR
63% of Israel’s
Trade in 2009
Under
Examination:
India
South Korea
Chile
Ukraine
6% of Israel’s
Trade in 2009

2011 2010 2009 2008 2007 Criteria
214.2B$ 204.6B$ 193.1B$ 191.8B$ 164.1B$ GDP (current prices in $B)*
4.7%
4.8% 0.7% 4.0% 5.4% GDP Real Growth Rate (%)
31,005$ 29,602$ 27,054$ 27,355$ 26,226$ GDP per Capita (PPP)**
2.8% 2.9% -1.1% 2.1% 3.5% GDP per Capita Growth Rate
(%, Current prices)
91.9B$
(42.9%)
87.7B$
(42.9%)
67.9B$ (30%)
80.4B$
(40.3%)
71.2B$
(43.4%)
Exports
(Goods & Services)(As %of GDP)
91.05B$ (42.5%)
82.3B$ (40.2%)
63.1B$ (29%)
84.3B$
(42.2%)
73.5B$
(45.1%)
Imports
(Goods & Services)(As %of GDP)
5.7% 6.6% 7.4% 6.1% 7.3% Unemployment Rate
Main Economic Indicators
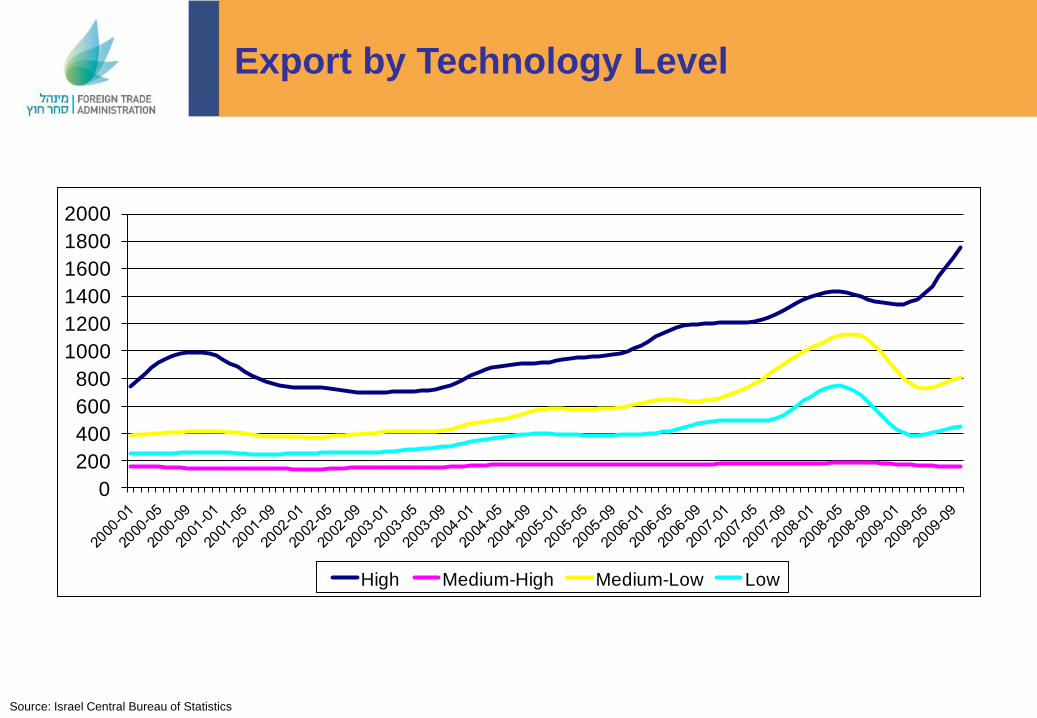
Export by Technology Level
Source: Israel Central Bureau of Statistics
0
200
400
600
800
1000
1200
1400
1600
1800
2000
High Medium-High Medium-Low Low

Export by Technology Level
Industry 2010 2011
Total, excl. diamonds 40,678 45,752 %
High - technology industries 20,128 21,517 47%
Medium - high technology industries 11,710 14,183 31%
Medium - low technology industries 6,739 7,780 17%
Low - technology industries 2,101 2,272 5%
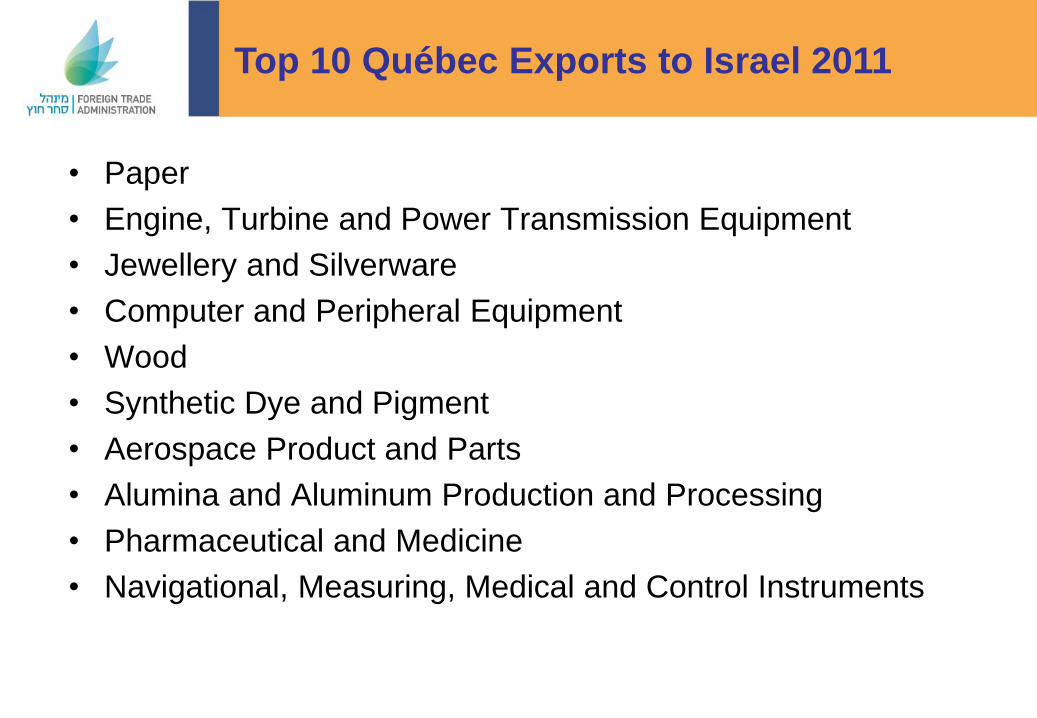
Top 10 Québec Exports to Israel 2011
• Paper
• Engine, Turbine and Power Transmission Equipment
• Jewellery and Silverware
• Computer and Peripheral Equipment
• Wood
• Synthetic Dye and Pigment
• Aerospace Product and Parts
• Alumina and Aluminum Production and Processing
• Pharmaceutical and Medicine
• Navigational, Measuring, Medical and Control Instruments

Top 10 Québec Imports from Israel 2011
• Aerospace Product and Parts
• Jewellery and Silverware
• Nonwoven Fabric
• Communications Apparatus
• Cosmetics and Toiletries
• Plastic Product
• Basic Organic Chemical
• Plastic Film, Sheet and Bag
• Metalworking Machinery
• Artificial and Synthetic Fibres and Filaments

Features of the Israeli Economy
• A small country, lacking natural resources & a significant local
market
• Human capital is the main resource
• Export oriented and dependent on the global economy
• Markets for Israeli products are several time zones away
The Objective:
Developing innovative industry that can overcome
geographic & geo-political challenges while leveraging the
advantages of its population

Israel’s Competitive Edge
1st in the world for flexibility and adaptability
1st in the world for scientific research
1st in the world for entrepreneurship
1st in the world for information technology skills
1st in the world for expenditure on R&D (as % of GDP)
2nd in the world for innovative capacity
2nd in the world for venture capital
4th in the world in utility patents per million population
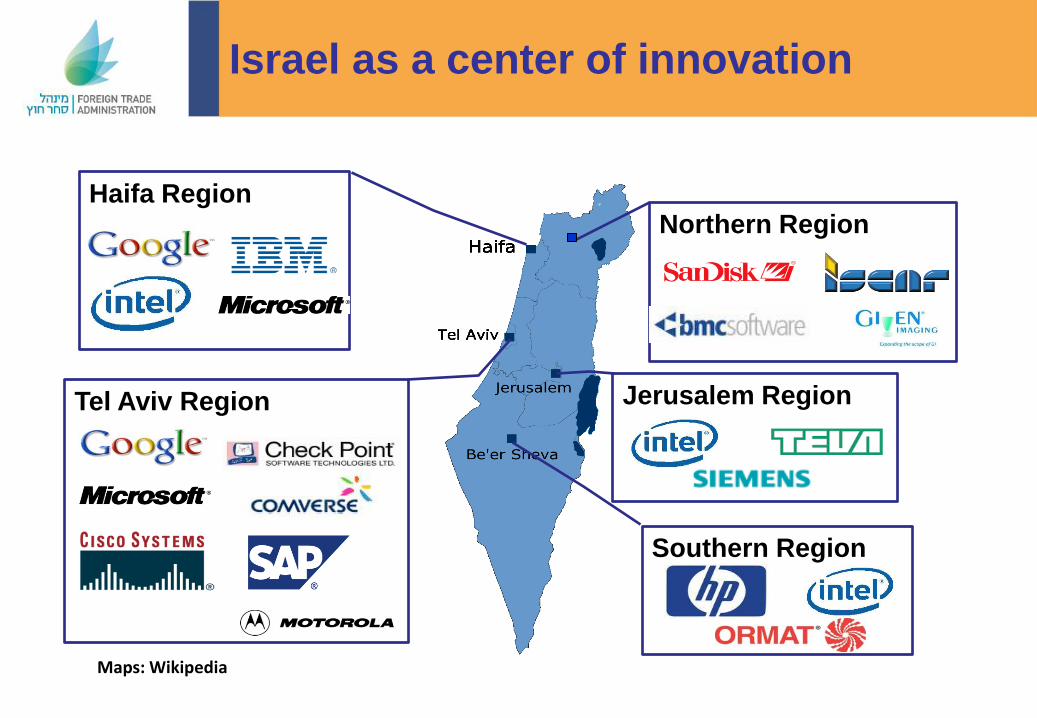
Maps: Wikipedia
Haifa Region
Tel Aviv Region Jerusalem Region
Southern Region
Northern Region
Israel as a center of innovation
Ingredients for Innovation
• Necessity
• Scarcity of natural resources
• Government support:
Encouragement of R&D Law
Incubators
R&D Funds
CIIRDF
• Entrepreneurial spirit

Israeli Breakthroughs –
Selected Examples
• Given Imaging – First ingestible video camera used to view
the small intestine and diagnose disorders
• Intel’s Core 2 Duo, Centrino and Pentium 4 microprocessors
• M System’s Disk on Key (USB stick) and Disk on Chip flash memory
• GE Healthcare’s portable cardiac ultrasound system
• The Phillips Brilliance CT Scanner
• IP Telephony invented by founders of Vocal Tec
• AOL Instant Messenger ICQ
• Zip compression technology
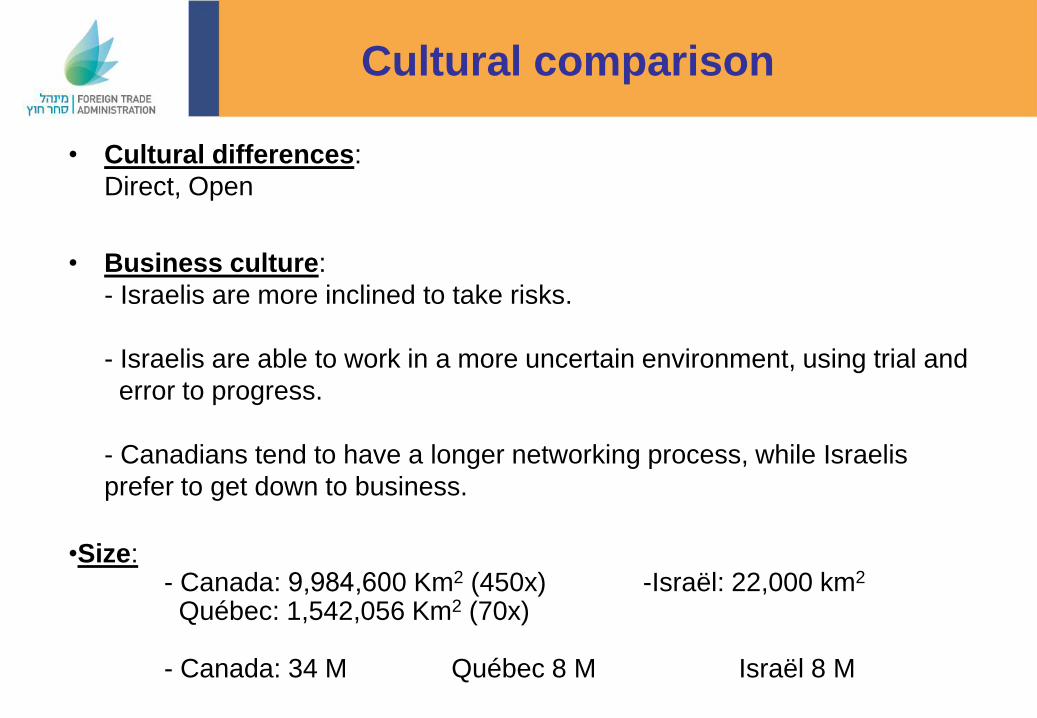
Cultural comparison
• Cultural differences:
Direct, Open
• Business culture:
- Israelis are more inclined to take risks.
- Israelis are able to work in a more uncertain environment, using trial and
error to progress.
- Canadians tend to have a longer networking process, while Israelis
prefer to get down to business.
•Size: - Canada: 9,984,600 Km2 (450x) -Israël: 22,000 km2 Québec: 1,542,056 Km2 (70x) - Canada: 34 M Québec 8 M Israël 8 M
Merci
Toda Raba