promoting bio -fertilizers in indian...
TRANSCRIPT

1
Promoting Bio-fertilizers in Indian Agriculture
Nilabja Ghosh1 Institute of Economic Growth
University Enclave Delhi 110007
India e-mail: [email protected]
Abstract The green revolution brought impressive gains in food production but with insufficient concern for sustainability. In India the availability and affordability of fossil fuel based chemical fertilizers at the farm level have been ensured only through imports and subsidies. Dependence on chemical fertilizers for future agricultural growth would mean further loss in soil quality, possibilities of water contamination and unsustainable burden on the fiscal system. The Government of India has been trying to promote an improved practice involving use of bio-fertilizers along with fertilizers. These inputs have multiple beneficial impacts on the soil and can be relatively cheap and convenient for use. Consistent with current outlook, the government aims not only to encourage their use in agriculture but also to promote private initiative and commercial viability of production. This paper analyses available industry side data to find only a limited extent of success till date. There has been no accelerated growth in distribution with time, inadequate spatial diffusion and despite entry of small private units into the industry there is no clear indication of the success of privatization. The paper however argues that considering the social benefits promised the government has ample grounds to intervene to set up an effective market for the new product while encouraging private players. But the policy and the instruments of intervention need to be designed with care.
Promoting Bio-fertilizers in Indian Agriculture
1 The paper is based on a research project conducted at the Institute of Economic Growth for the Ministry of Agriculture, Government of India. The author thanks Professor Kanchan Chopra of IEG for her comments and suggestions. The Fertiliser Association of India is acknowledged gratefully for data support and insightful discussions.

2
Failure of a market to build up calls for public intervention when the expected social gains from a
relatively new product outweigh the costs whereas the private gains do not. Uncertainty about the
product performance coupled with long periods of learning involved can lead to poor demand
from end users who are farmers. Even in the context of market liberalization, the government has
some role to play to induce a socially optimal investment level and set up an effective market so
long as market information is imperfect. However the exact nature of the role and the policy
instruments to be used must be decided with a clear understanding of the strengths and weakness
of agents involved (Stiglitz, 1989). Biofertilizers make nutrients that are naturally abundant in
soil or atmosphere usable for plants. Field studies have demonstrated them to be effective and
cheap inputs, free from the environmentally adverse implications that chemicals have.
Biofertilizers offer a new technology to Indian agriculture holding a promise to balance many of
the shortcomings of the conventional chemical based technology. It is a product that is likely to
be commercially promising in the long run once information becomes available adequately to
producers and farmers through experience and communication.
There is an ongoing attempt to promote biofertilizer in Indian agriculture through public
intervention, and in keeping with the spirit of the times, the policy motivates private sector and
profit motive to propel the new technology. The question raised in this paper is how successful
has the intervention policy been in Indian agriculture. The Government of India and the various
State Governments have been promoting the nascent biofertilizer market both at the level of the
user-farmer and the producer-investor through the following measures: (i) farm level extension
and promotion programmes, (ii) financial assistance to investors in setting up units, (iii) subsidies
on sales and (iv) direct production in public sector and cooperative organizations and in
universities and research institutions. Over time as the industry emerges from infancy with public
guidance, the following observations will be expected: (a) increasing sales volumes and diffusion
across the country, (b) greater role of profit motivated private enterprise. Since information on
farm level usage of biofertilizers or profitability of units are not reported till date, one way to get
about is by following the secondary indicators as incorporated in (a) and (b).
5.2 What are Biofertilizers?
Biofertilizers, more commonly known as microbial inoculants, are artificially multiplied cultures
of certain soil organisms that can improve soil fertility and crop productivity. Although the

3
beneficial effects of legumes in improving soil fertility was known since ancient times and their
role in biological nitrogen fixation was discovered more than a century ago, commercial
exploitation of such biological processes is of recent interest and practice.
The commercial history of biofertilizers began with the launch of ‘Nitragin’ by Nobbe and
Hiltner, a laboratory culture of Rhizobia in 1895, followed by the discovery of Azotobacter and
then the blue green algae and a host of other micro-organisms. Azospirillum and Vesicular-
Arbuscular Micorrhizae (VAM) are fairly recent discoveries. In India the first study on legume
Rhizobium symbiosis was conducted by N.V.Joshi and the first commercial production started as
early as 1956. However the Ministry of Agriculture under the Ninth Plan initiated the real effort
to popularize and promote the input with the setting up of the National Project on Development
and Use of Biofertilizers (NPDB). Commonly explored biofertilizers in India are mentioned
below along with some salient features.
Rhyzobium (RHZ): These inoculants are known for their ability to fix atmospheric nitrogen in
symbiotic association with plants forming nodules in roots (stem nodules in sesabaniamrostrata).
RHZ are however limited by their specificity and only certain legumes are benefited from this
symbiosis.
Azotobacter (AZT): This has been found beneficial to a wide array of crops covering cereals,
millets, vegetables, cotton and sugarcane. It is free living and non-symbiotic nitrogen fixing
organism that also produces certain substances good for the growth of plants and antibodies that
suppress many root pathogens.
Azospirillum (AZS): This is also a nitrogen-fixing micro organism beneficial for non-leguminous
plants. Like AZT, the benefits transcend nitrogen enrichment through production of growth
promoting substances.
Blue green Algae (BGA) and Azolla: BGA are photosynthetic nitrogen fixers and are free living.
They are found in abundance in India i. They too add growth-promoting substances including
vitamin B12, improve the soil’s aeration and water holding capacity and add to bio mass when
decomposed after life cycle. Azolla is an aquatic fern found in small and shallow water bodies
and in rice fields. It has symbiotic relation with BGA and can help rice or other crops through
dual cropping or green manuring of soil.

4
Phosphate solubilizing (PSB)/Mobilizing biofertilizer: Phosphorus, both native in soil and applied
in inorganic fertilizers becomes mostly unavailable to crops because of its low levels of mobility
and solubility and its tendency to become fixed in soil. The PSB are life forms that can help in
improving phosphate uptake of plants in different ways. The PSB also has the potential to make
utilization of India’s abundant deposits of rock phosphates possible, much of which is not
enriched.
Responses, and Limitations
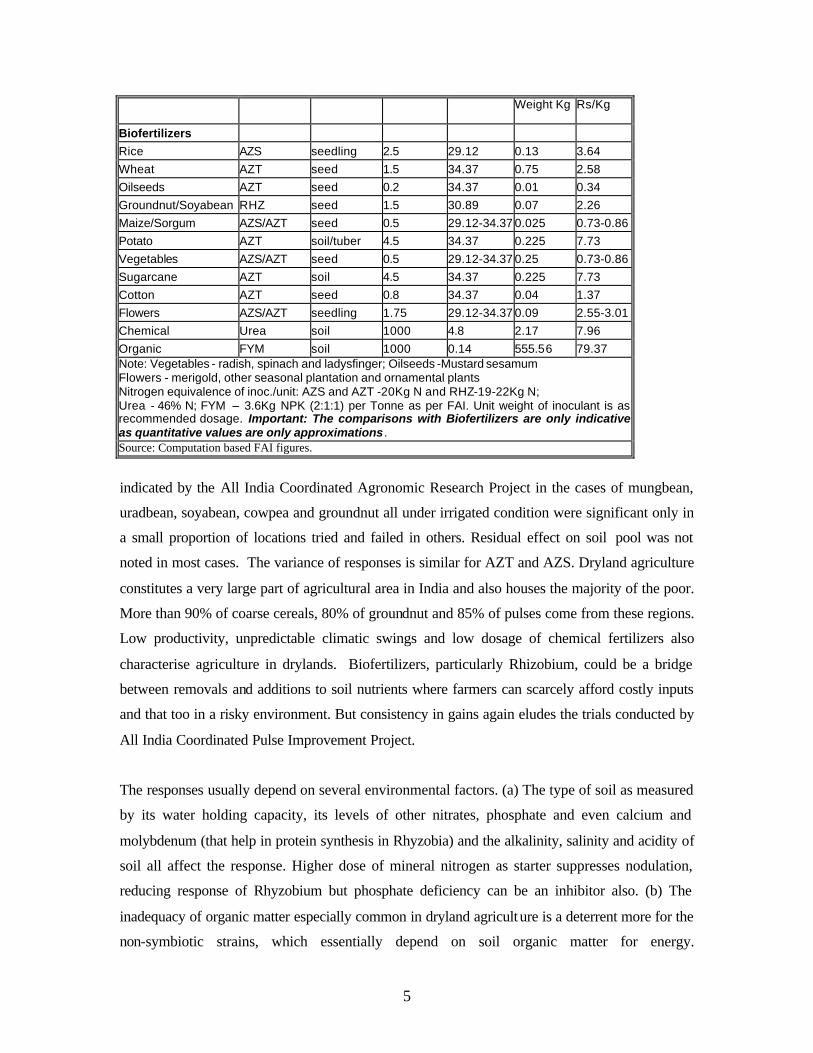
Crude calculations of bulk and cost in terms of N presented in Table 1 on the basis of reported
nitrogen equivalence indicates that biofertilizers are cheap and convenient relative to chemical
and farm organic fertilizers (FYM) and therefore have considerable promise for crops like
cereals, oilseeds, vegetables and cotton. However, it is safer to note that the nitrogen equivalences
reported for biofertilizers are only indirectly approximated through controlled experiments since
the way of accessing nutrients itself in indirect unlike nutrient containing chemical fertilizers and
manures, and the comparative values of bulk and cost may not be realistic. Nevertheless, a crude
estimation is attempted for indication of the potential without attaching significance to the
magnitudes as such.
Biofertilizers have various benefits. Besides accessing nutrients, for current intake as well as
residual, different biofertilizers also provide growth-promoting factors to plants and some have
been successfully facilitating composting and effective recycling of solid wastes. By controlling
soil borne diseases and improving the soil health and soil properties these organisms help not
only in saving, but also in effectively utilising chemical fertilizers and result in higher yield rates.
However while positive responses have been observed in a wide range of field trials, there is
remarkable inconsistency in responses across crops, regions and other conditions. Even for a
given crop the range of response is quite high. For example in a sample of 411 field trials carried
out across districts, plant responses to inoculation with Azotobacter in irrigated wheat was
observed to be significant in 342 cases and ranged from 34 to 247 Kg./Ha. (Hegde and Dwivedi,
1994). Legume inoculation by Rhizobium is the most long established practice but the responses
Table1: Relative Cost of Access to Plant Nutrient (N) For 1 Kg Nitrogen Crop Fertilizer
Type Treatment Incoculant/
unit weight Kg
Price Rs/Kg Bulk Cost
5
Weight Kg Rs/Kg
Biofertilizers Rice AZS seedling 2.5 29.12 0.13 3.64 Wheat AZT seed 1.5 34.37 0.75 2.58 Oilseeds AZT seed 0.2 34.37 0.01 0.34 Groundnut/Soyabean RHZ seed 1.5 30.89 0.07 2.26 Maize/Sorgum AZS/AZT seed 0.5 29.12-34.37 0.025 0.73-0.86 Potato AZT soil/tuber 4.5 34.37 0.225 7.73 Vegetables AZS/AZT seed 0.5 29.12-34.37 0.25 0.73-0.86 Sugarcane AZT soil 4.5 34.37 0.225 7.73 Cotton AZT seed 0.8 34.37 0.04 1.37 Flowers AZS/AZT seedling 1.75 29.12-34.37 0.09 2.55-3.01 Chemical Urea soil 1000 4.8 2.17 7.96 Organic FYM soil 1000 0.14 555.56 79.37 Note: Vegetables - radish, spinach and ladysfinger; Oilseeds -Mustard sesamum Flowers - merigold, other seasonal plantation and ornamental plants Nitrogen equivalence of inoc./unit: AZS and AZT -20Kg N and RHZ-19-22Kg N; Urea - 46% N; FYM – 3.6Kg NPK (2:1:1) per Tonne as per FAI. Unit weight of inoculant is as recommended dosage. Important: The comparisons with Biofertilizers are only indicative as quantitative values are only approximations. Source: Computation based FAI figures.
indicated by the All India Coordinated Agronomic Research Project in the cases of mungbean,
uradbean, soyabean, cowpea and groundnut all under irrigated condition were significant only in
a small proportion of locations tried and failed in others. Residual effect on soil pool was not
noted in most cases. The variance of responses is similar for AZT and AZS. Dryland agriculture
constitutes a very large part of agricultural area in India and also houses the majority of the poor.
More than 90% of coarse cereals, 80% of groundnut and 85% of pulses come from these regions.
Low productivity, unpredictable climatic swings and low dosage of chemical fertilizers also
characterise agriculture in drylands. Biofertilizers, particularly Rhizobium, could be a bridge
between removals and additions to soil nutrients where farmers can scarcely afford costly inputs
and that too in a risky environment. But consistency in gains again eludes the trials conducted by
All India Coordinated Pulse Improvement Project.
The responses usually depend on several environmental factors. (a) The type of soil as measured
by its water holding capacity, its levels of other nitrates, phosphate and even calcium and
molybdenum (that help in protein synthesis in Rhyzobia) and the alkalinity, salinity and acidity of
soil all affect the response. Higher dose of mineral nitrogen as starter suppresses nodulation,
reducing response of Rhyzobium but phosphate deficiency can be an inhibitor also. (b) The
inadequacy of organic matter especially common in dryland agriculture is a deterrent more for the
non-symbiotic strains, which essentially depend on soil organic matter for energy.

6
Phosphobactrin response was found to be positive only in soils with high organic content and low
available phosphorous. (c) Soil water deficit and high temperature (hyper-thermia) are prominent
abiotic factors that affect nitrogen fixation in dryland agriculture. (c) Native microbial population
opposes the inoculants. In general predatory organisms, often already present in the soil are more
adapted to the environment and out compete the inoculated population.
Apart from environmental factors, deficiencies in handling procedure are a major cause of under
performance in real life application. The high sensitivity to temperature and other external
conditions of these ‘living’ inputs, calls for enormous caution at the stage of manufacture/culture,
transportation/distribution and application. This involves investment and time in research (for
more tolerant strains), packaging, storage and use of suitable carrier materials.
5.3 Government Intervention in Biofertilizer Market
To attain production targets, the Government of India implemented a central sector scheme called
National Project on Development and use of Biofertilizers (NPDB) during the Ninth Plan for the
production, distribution and promotion of biofertilizers. A National Biofertilizer Development
Centre was established at Ghaziabad as a subordinate office of the Department of Agriculture and
Cooperation with six regional centers. The purpose of the scheme covered organization of
training courses for extension workers and field demonstrations and providing quality control
services. Production and distribution of different biofertilizers were also undertaken but
subsequently discontinued as the centers redefined their role towards R&D and HRD related
activities. Capacity creation and production was however encouraged through one time grant for
new units.
The financial assistance, given as grant-in-aid to the tune of Rs 13 lakh and now increased to Rs
20 lakh per unit and thrown open for all, was routed through the State governments but owing to
delays in release of grants the onus is transferred to NABARD/NCDC. The public sector
organizations form a bulk of the units in the industry, while similar units in the private sector are
also coming forward. Different State governments also provide subsidies sometimes up to 50% of
the sales realization but the manner of subsidization is rather unsystematic. In many cases the
discrimination and manipulation in subsidizing lead to a lot of intra industry variation in prices.
The government also plays a dominant part in marketing biofertilizers in three possible channels:
(a) State government via District level Officers and Village level workers to faremrs, (b) State
Marketing federation via cooperative bodies to farmers and (c) State Agro-industries

7
Corporations via Agro service Center to farmers. The producers are however free to sell through
their own sales network or through market, (i.e., wholesalers and private dealers).
5.4 Data
The Fertilizer Association of India (FAI) periodically presents information compiled on capacity
and distribution of biofertilizers by various units. In the absence of reported information on farm
level use of the inputs, this can help in understanding the progress of the technology and its
adoption in India. The period covered by the data is 1992-93 to 1998-99.
The FAI report gives the distributions of different strains for recent years by states that can proxy
for usage by farmers. For a better understanding of the demand for use, firm level information on
capacity, distribution and prices would be more useful. However the FAI could not report for all
existing producing units due to their non-responses and this irregularity is more for distribution
and prices. So the inferences drawn in the present study are only based on the samples that report
the required information. The FAI reports (1996, 1998, 2001) give information of annual
distribution levels of various inoculants and their sale prices for consecutive years by firms. In
addition the annual capacity as of March is provided for the three years 1995, 1997 and 1999.
5.5 Success of Biofertilizer Technology
Government of India and the different State Governments have been promoting use of
biofertilizers through grants, extension and subsidies on sales with varying degrees of emphasis.
With time farmers too learn about the technology forming their perception on the basis of
agronomic realities of their regions, the knowledge gained from experiences of farmers around
them and including themselves and the information provided by different disseminating agents
and form their own decisions of adoption. Above all the enterprise of the firms working through
their marketing, research and development efforts would lead to the widespread use of the inputs
once the prospect of profit is sensed. commercial appeal with the passage of time and government
support.
Progress of the Industry
Based on the data for 1995, 1997 and 1999 it appears that the industry witnessed a steady increase
in the number of units producing the input (Table A4). Over the period of four years the number
of units went up by 53% from 62 to 95 and further to 122 in 2002 (Ministry of Agriculture, GOI).
The total capacity expanded by 102% going by the information on units reporting their capacities.

8
New private units joined the industry improving their numeric share while the public sector, after
the initial burst slowed its pace. However, a deeper look would be more illuminative.
The total distribution as reported by the units ii on an annual basis increased over time at an
impressive rate of over 50% (Table A4). However it is clear that the bulk of the growth took
place by 1992-95 of the sample period and stagnated thereafter. There are also changes in shares
by types with moderate success in AZT and by far the best performance by PSB (Table A1). The
decline in RHZ indicates success in groundnut and pulses was below expectation. Table 2 gives
the distribution and annual capacity of units deflated by the number of units. A measure of
capacity utilized is obtained relating actual distribution (as opposed to production) to capacity.
The industry has been going through an adjustment of size as average capacity of a unit came
down from 261.8 tonnes to 205.6. The capacity addition in the industry was less relative the
addition of new units due to entry of lower sized new units. The average distribution also
declined in the first two years possibly signaling the need for a down size and picked up
subsequently. The average capacity utilization has been poor but the down sizing may have
arrested the declining trend.
Diffusion
The chemical based fertilizer technology incorporated in the green revolution was successful by
its rapid adoption rate but the unbalanced spread across the country, especially in the eastern
region marks a crucial failure. The central government’s role in the new biofertilizer technology
would be justified by greater spatial dimension of the success.
Table 2 : Average Capacity, Distribution and Capacity utilization of Units
Year Capacity (Tonnes)
Distribution (Tonnes)
Capacity Utilisation
1994-95 261.8 111.3 0.43
1996-97 225.8 87.91 0.39
1998-99 205.6 94.37 0.46
Note: Calculated for only Units reporting Capacity, DistributionNBFDC and RBDCs are treated as single unit Capacity utilization is measured as distribution divided by capacity Capacity of 1994-95 is as of March 1995 and so on.
Table 3: Regional distribution of Bio-fertilizer Plants (%)
1995 1997 1999
Region
East 17.74 13.89 12.63

9
North 29.03 27.78 17.89
West 22.58 26.39 38.95
South 30.65 31.94 30.53
Source:FAI
Since biofertilizers are perishable and sensitive to quality of handling, the distribution of plants
would to some extent reflect the regional distribution pattern. However this is only partially valid
as units with large distribution networks do distribute over larger areas. As an example
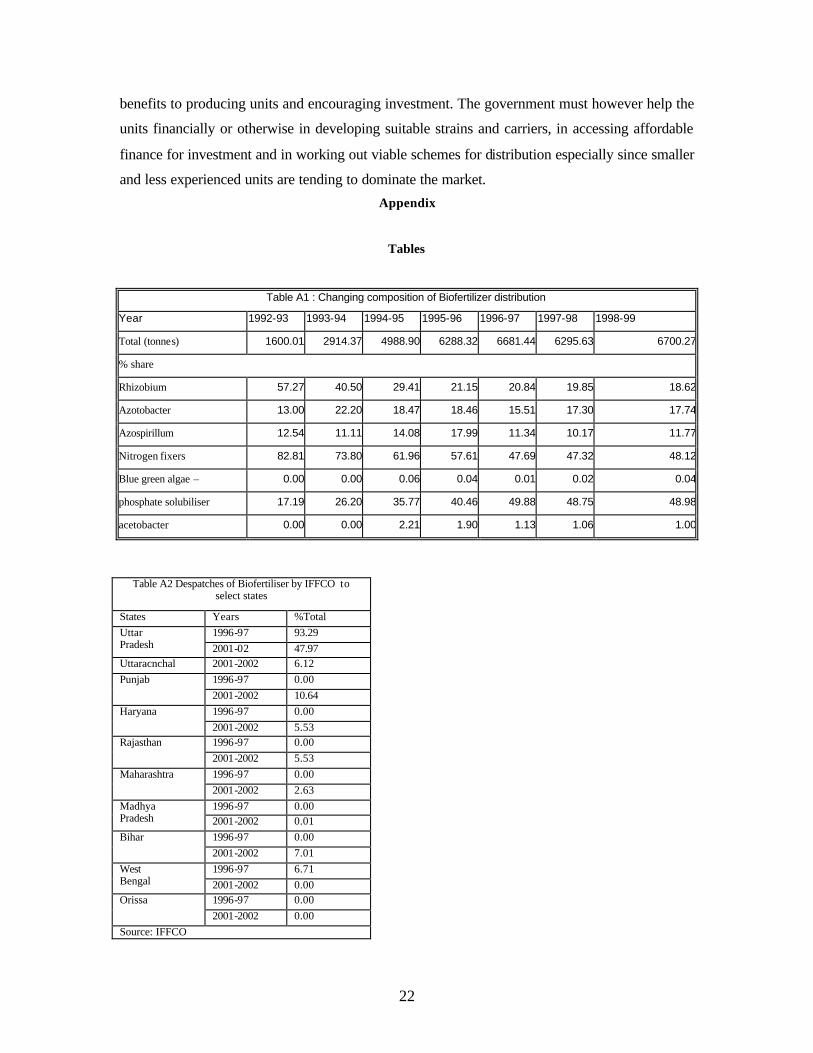
distribution levels of public sector fertilizer giant IFFCO (a late starter) are given in Table A2.
Located in Phulpur in Uttar Pradesh, IFFCO’s MLN Farmers’ Training Institute produces all
strains of biofertilizers and have distributed in states other than the home state. Eastern states like
Bihar and Orissa are also served though the share has gone down notably for West Bengal where
distributions came down to nil in 2000-02. Table 3 shows how the industry started with a fairly
even dispersion of units gave way to a concentrated locational pattern. While both east and north
lost their shares, there was continuous and significant expansion in the western region. The share
of south remained stable. This tendency is further reinforced by the state wise distribution of
plants presented in Table A3. Some of the states saw closure of units and in fact over the period
the number of units in north actually came down.
The region wise distribution of biofertilizers is more dispersed relative to chemical fertilizers as
apparent in Figure 1 with highest share going to west followed by south while north and east
claimed lower shares. The distribution does not follow that of chemical fertilizers they
supplement, where north is the largest claimant. However the eastern region comes last in share
in both chemical and biofertilizers though the share in the latter case is even more diminutive.
The comparison however is not complete without bringing in the cropped area in the regions. The
use intensities in Table 4 also suggest relatively poor adoption in east and north.

10
Biofertilizers distributed in Regions
25%
7%
65%
3%
South
NorthWestEast
Chemical (NP) Fertilizer distributed in Regions
24%
34%
28%
14%
SouthNorthWestEast
Figure 1
Private enterprise
In the nineties India stepped a market oriented regime and the desired role of the government
became one of facilitator. In the past public sector units including state owned cooperative
organizations played a crucial role in implementing government’s social objectives on a
continuing basis, compromising commercial interests in the process. In a more competitive
environment failure to attain commercial viability does not augur well for the sustenance of the
organizations as also for the public budget. In the case of biofertilizers too the initiative taken by
the public sector along with numerous universities and research units that are also state funded
must with time lead to commercial success once the technology is transmitted to the field and this

11
in turn is expected to draw private enterprise since the market is open for entry. The government
is also encouraging private entry by extending financial grant to all and
Table 4 : Use intensity of Biofertilizers (BF) and Chemical fertilizers in Indian Agriculture
Region Chemical (NPK) (Kg/hect.)
Cropped area (%)
Chemical (NP) (Kg/hect.)
Biofertilizers (Kg/hect.)
South 125.21 18.46 107.06 0.05 North 130.43 22.32 127.65 0.01 West 60.82 40.91 57.07 0.06 East 70.63 18.32 61.73 0.01 Total 90.04 100.00 82.90 0.04 Source: Computed from FAI data. Biofertilizers distribution data reported by units are used.
sundry. Table A4 suggested that slow down in private commercial sector distributions is more
pronounced than total.
Although many of the new entries between 1995 and 1999 are private commercial enterprises,
their share in total capacity came down steadily as revealed by the reports (Table 5). This is
because of scaling down of size from a relatively high level of 504 tonnes to 300 tonnes as
already noted. The coexistence of smaller new units with the larger ones of higher vintage has
increased the variety in industry as measured by the coefficient of variation. The share in
distribution however has been relatively more stable despite showing a slight declining trend in
the last five years reported (Table A5). Over the years the industry as a whole distributed about
35.6 thousand tones of which a little less than half is accounted by the commercial private firms.
The latter also charged higher prices on the average and there is slight rise in prices between
1995 and 1998.
Table 5: Capacity of Privately owned Units
1995 1997 1999
Average Capacity (tonnes) 504 437 308
Coefficient variation (%) 120 143 162
Share in total capacity (%) 74 69 67 Note: Calculated for Units that reported Capacity

12
Structure of Industry and Econometric Analysis to explain Distribution
Based on the 50 units that reported capacity (details given in Appendix A-II), distribution and
prices in 1998-99, accounting for nearly 85% of distribution Table A5 presents the structure of
the industry. An econometric analysis will attempt to use this information to explain the
distribution performance by the structural components of the industry. The capacity of a unit is
defined by the various facilities of production including equipment for various operations,
infrastructure and space. Labour and raw materials are essential variable inputs for actual
production as summarized in Appendix A-I for a given capacity and using this general norm and
the actual production levels, annual man-days of employment generated by a unit can be
estimated. Due to the complex nature of the process involving laboratory culture of life forms,
that requires definite combinations of space, equipment and time, there is little substitutability
among the inputs.
Numerous studies on technological evolution emphasized the developmental role of a firm
(Chandler, 1993) and the strength of its sales network, creating market and drawing market
feedback, for its success. In general, firms with larger production facilities are expected to invest
more on networks to understand and access the market but it is not uncommon for firms with
larger distribution networks to act as marketing agents for smaller units who are lacking and in
few rare cases like that of NAFED the distribution even exceeds capacityiii. The sales networking
would be stronger also for concerns that are in some way already in the business of selling
agricultural inputs. Since the exact scope and nature of the units or possibly their parent
companies is not clear from the data, past experience in selling biofertilizers may be considered
as an indicator of their marketing capabilities. Judging by the sample information, units that
record a cumulative distribution of more than 100 tonnes over the previous 3 years are deemed to
be enjoying greater selling experience and broad based net-workings. While the cumulative
distribution performance takes care of ‘le arning by doing’ opportunity of the firm a possible
additional characteristic could be the age or vintage of the unit, which also allows for ‘learning by
looking’ opportunity. Since data on vintage is not readily available, those that existed and
reported for March 1995 are classified as older units (VINT). Units that produce both nitrogen
fixers and phosophate solubilisers are categorized as joint producers (JOINT).
Production of biofertilizer started in India with significant government involvement with active
participation of the public sector that is directed more by public policy and social objectives than

13
profit. The extent of commercial success would be indicated by the participation of private
commercial units so long as market is free for entry. The private firms that reported can be
categorized as private (PVT) and others that include universities, research institutes, cooperative,
agro-marketing and other public sector organizations. Finally, the regional distribution of the
firms is of interest in view of the tendency of concentration observed.
Going by a size categorization of units based on sample average capacity of the units as the cut
off size, less than 30% of units are classed as large, with majority being relatively small units.
The share of private sector is much larger (64%) for the smaller units than the larger ones (36%).
More than 70% of the large units are of longer vintage reiterating that new entry has been mostly
in small units. About 70% of the small units came into being after March 1995. The small units
show some tendency to specialize in either nitrogen fixers or phosphate solubilisers while all the
large units produce both kinds. Both size categories show regional bias for west, followed by
south, though smaller units have relatively greater presence in south as also in east where there is
no presence of large units. The average capacity differs widely between the two categories, as
does employment generation but large units record higher capacity utilization. Average price
charged is marginally in large units.
The following equation is estimated to explain distribution:
Dj = á0 + á1 Pj + á2 CAPACITYj + Óá3k äk
Where D is distribution in tonnes in the completed year, P is sale price in Rupees per kilogram,
CAPA is capacity in tonnes at the year end and ä are k dummy variables corresponding to unit j.
Price, calculated as weighted average price of different biofertilizers (PBIO) with distribution
shares as weights, varies moderately among the units. As a deflator the price (PCHEM)2 of
chemical fertilizers, N and P, are taken for the year and weighted by consumption shares in the
state concerned. The deflated price variable P-DEF is expected to show a negative effect so long
as there is some competition between chemical and biofertilizers. A specification including both
prices separately is also estimated. CAPACITY of the unit accounts for scale of the unit and the 2 The weighted average price of biofertilizer is over the different material products while that of chemical fertilizer is over nutrient contents. The two averages are not entirely comparable, but at this early stage of the technology, the absence of information of available and stable conversion rate of biofertilizer into nutrients offers no better specification opportunity. The deflated price variable P-DF may be taken as a multiple of the true relative price, which can be estimated only when the true conversion rate is known. Nitrogen equivalences given in Table 1 are not used, as their meaningfulness is still debatable.

14
dummy variables place the units in different categories that could have a bearing on distribution.
Variable DUM-EXP is used to capture units with selling network as indicated by past experience
as discussed. Another variable for experience is VINT. Dummies WEST, EAST and SOUTH
delineate the units by three major regions to see if any one region makes a difference over all
others including north. Variable PVT is used to examine the performance of units in private
commercial sector. Similarly, variable JOINT helps find out if varied production pattern is an
added advantage. Heteroscedasticity consistent estimates of parameters are provided in Table 6.
Table 6: Estimated Regression equations for distribution
Dependent variable is DISTRIBUTION
Specification 1 Specification 2
Variables coefficient t-statistics Variables coefficient t-statistics
CONSTANT 34.648 0.539 CONSTANT -463.44 -0.642
P-DEF -2.919 -0.145 PBIO -0.123 -0.074
CAPACITY 0.328 9.409 PCHEM 49.369 0.648
DUM-EXP 73.349 2.495 CAPACITY 0.326 9.406
DUM-PVT -46.714 -2.203 DUM-EXP 76.609 2.387
DUM-PVT -50.572 -2.048
R 0.75 0.76
DW 1.6 1.50
The equations coming with reasonably good fit show expected signs of price and scale variables
though there is no significant effect of price. The scale variable CAPACITY has a positive and
significant coefficient. Firms with greater selling experience (DUM-EXP) also distribute
significantly higher amounts given other conditions unchanged. Variable PVT comes with a
negative coefficient suggesting that private commercial units distribute less than others after
controlling for price capacity and experience. The estimates presented in Table A6 also suggest
this implication even with varied specifications and with an altered sample where the largest and
smallest distributing units are excluded. The region dummies too peculiarly indicate the near
absence of regional dimension in the distribution after controlling for relevant factors. Even units
located in the western region, which claimed the maximum expansion of the industry, shows no
remarkable advantage over others and the variable comes with an insignificant and even a
negative coefficient. Joint production of different biofertilizers gives no added advantage over
specialized units and older units shown by variable VINT do distribute more, possibly gaining
from being in the field for long.

15
Empirical findings: Summary
The analysis conducted with the limited data available throw some light on the progress of the
technology through the indirect indicators from industry. The empirical findings can be
summarized as follows:
First, the distribution of biofertilizers, proxying for its adoption rate has not consistenty grown
over time and has slowed down in the late nineties. Starting from a small base one would have
expected a faster and possibly accelerating growth performance as the input finds greater
acceptance. Second, although there have been more and more new entries in the market, the
average capacity came down characterizing the industry by a large number of small units. While
size adjustment in infant industry is normal, it must be borne in mind that distribution of an agro
input also calls for substantial sales networking and a deep understanding of the field reality in
agriculture. Whether the smaller units will have the necessary expertise and incentive for meeting
farm demands or synergical associations with bigger producers or simply distribution agents or
local bodies would be the desired institution is matter of review. Third, there has practically been
no diffusion of the technology despite the central government’s interventions and the distribution
among units has tended towards greater concentration especially in Maharashtra and other states
of the west and south. As with chemicals, the impact on the east has been poor. Possibly the
interventions and the policy of the State governments proved more decisive and in some cases,
the recommendations of the agricultural universities or lack of them (as in Punjab) had a role in
the farmers’ lack of interest in the technology. Fourth, despite entry of private players, the share
of the private commercial sector in distribution remains below 50% and over time the private
firms have neither improved their share in capacity or distribution nor their growth rate of
distribution. This casts doubt on whether the business is as of now viewed as a commercially
gainful prospect. Fifth the regression analysis further brings out some aspects of concern. There
seems to be little intrinsic justification for the regional preferences shown by units since the
distribution performance does not appear better in any region, even the west, than others after
controlling for unit size and price. Further, given the capacity of the unit, private ownership has
an adverse effect on distribution performance and this once again raises questions on commercial
viability of the industry.
5.6 Why the government needs to intervene
The result of the analysis is not positive with respect to government intervention in the market is
concerned. Till date the central government has spent several crores of rupees as grants to invite

16
investment and state governments have also spent large sums for subsidizing and promoting use.
The questions that now arise are (a) Does the government need to intervene and support the
market to build up? (b) If so what should be nature of intervention?
Despite the lack of expected response there still is a strong case for government to intervene and
possibly subsidize in the market. The reasons can be broadly classified in two groups:
Social gains or ‘First best’ reasons
If biofertilizers impart certain social and long-term gains for which private individuals may not be
willing to pay at least until the gains become ‘visible’, there is a rationale for spreading the cost
over a larger group of beneficiaries or the society at large (Yokell, 1979). The government can act
on behalf of the society through appropriate policy even if the market is otherwise competitive.
1. Biofertilizers have important environmental and long-term implications, negating the
adverse effects of chemicals. At the farm level, the gains from increased use of the
technology can spill over to other farms and sectors through lesser water pollution than
chemical fertilizers and even to an extent organic manures can create.
2. The gains from the new technology coming through the arrest of soil damage may not be
perceived over a short span of time unlike for chemical fertilizers, which yield quick
returns. At the same time the farmer has to incur considerable initial cost in terms of skill
acquisition, trial and failure and risk. In agrarian situations where agents often operate
with bounded rationality, adoption may be slow and influenced greatly by neighbours’
experiences over time. Empirical evidences in agriculture around the world show that
adoption of new practices take time to pick up and the earlie st adopters are often
conservative about the percent of acreage (Griliches, 1957) devoted to the new
technology. The state has a role to play in inducing farmers to adopt improved practices.
3. The producer firms have serious uncertainty about the demand or saleability of the
product, which deters investment, particularly if it is irreversible (Guiso and Parigi,
1999). The success or failures of early entrants who take the initiative or those who
indulge in research for an improved product convey important information to others
(Stiglitz, 1989) and thereby to society. The market however does not always reward the
initiative. The capital market is also not always ready to provide the risk capital at
reasonable rates.
17
Non-competitive Market or ‘Second best’ Reasons
In many cases the market itself is not competitive and although the first best solution would
be to promote competition, there are other ways of dealing with the situation.
1. Although biofertilizers have been promoted as supplement or complement of chemical
fertilizers, in reality they are two alternative means of accessing plant nutrients. The
strength of complementarity as against substitution between the two inputs is open to
empirical verification, but there is no denying that farmers and producers do perceive the
subsititutability relation to an extent. The pricing of chemical fertilizers is far from
marginal cost based. In particular urea is under administrative pricing and there are
serious economic and political compulsions to continue the protection although the
movement in spirit has been towards openness. In such circumstance the price of
biofertilizers along with the risk and responses will be weighed with those of chemical
fertilizers, and promotion of the technology for environmental reasons would call for
some degree of protection to minimize the inter-fertilizer price distortion.
2. The external or environmental cost of using chemical fertilizers, though not measurable
may also be taken into account when comparing with biofertilizers if the latter is to be
promoted.
The next question that arises is what should be the nature of intervention. With the results at
hand, the central government needs to improve its strategy towards a more broad-based and
integrative role in order to provide the correct environment for the adoption of the technology.
One of the main barriers faced by the producers and investors is inadequate demand and the
inconsistent and seasonal nature of the existing demand. It may be recalled that the technology is
as yet nascent and evolving. The rice dominated eastern region remains a non-starter and the
wheat-rice growing north has not shown much interest either. Research on developing efficient,
temperature tolerant and hardy strains is a vital step to the actual success of the technology. In
particular, there can be some focus on the potentials of the technology in rice and cereals in
general although its significance for crop diversification is of equal concern. Similarly
development of suitable carriers, better packaging and longer shelf life are also important for
commercial acceptance of these living inputs. The government has a dominant role to play in
encouraging and funding research either by universities or private firms to make up for shortfall
in private commercial research initiative. As is well recognized now, in a market-oriented system,
18
information is often scarce and costly and hinders many business activities. For biofertilizers, the
government has a dominant role of disseminating the technology through demonstration, training
and other activities. A proposal to make it mandatory for biofertilizer units to contribute in the
process through their own demonstration is a welcome step. Research and extension/promotion
both must be to the extent possible specific to local conditions and constraints.
It is a good practice to promote biofertilizers as an input conjunctive to other forms of fertilizers,
but keeping in view the protection given to chemicals, there is some ground for subsidizing the
former to encourage the ir use. However, there is a need to work out a systematic and uniform
way to give out subsidies so that they do not distort inter unit prices and help some units at the
cost of others. The States should be strongly guided on this norm. The main purpose of the
subsidies would however be to induce farmers to try out the input at affordable and acceptable
prices rather than to support certain producers directly. As far as producers are concerned, a
healthy competition would only help develop a market in the long run and benefit the farmers.
Open sales in the market may be encouraged to improve the capability of the units in marketing
products. Any attempt to fix a minimum price for the sake of quality or other consideration will
only go against the spirit of competition and harm the interests of the industry and the farmers.
The present study finds some but not conclusive role of the price factor but scientific studies may
be conducted on the farmers’ ‘willingness to pay’ for the new input to determine the need and
extent of subsidies.
The subsidy, if it is considered desirable, could be routed through the Ministry of Environment
since the main aim of the policy is to encourage environmentally improved practices.
Quality is an essential element in this market and the entry of new units also heightens the threat
of poor strains appearing in the market and ruining the farmers’ confidence in the technology and
their incentive to adopt the same. There is a strong case of quality control and legal safety nets,
which could possibly draw the involvement of local bodies backed by the expertise of specialized
agencies. Since the microorganisms are extremely perishable and sensitive to local conditions and
handling the farmer always encounters some risk in opting for the input. To the extent the
farmers’ risk perception is responsible for inadequate adoption there is a case for spreading the
risk over a larger society. An insurance or a buy back scheme could work with the cost shared by
the government and the producers but this would call for some monitoring of farmers’ behaviour.
Such a scheme would also reduce the need for subsidies.

19
The grant in aid given for new units and possibly in future for upgrading older units is not really a
desirable method. To the extent that inadequate demand is the main hindrance to producers, the
financial aid would not help at all. In fact the method embodies an incentive for moral hazard
where the firm receives the grant but does make enough ‘effort’ to sell. The transfer of the
responsibility to NABARD would only impose undue burden on the bank in monitoring sales
attempts. The regression analysis says that even with the same capacity build up (with the help of
grant), a private commercial unit sells less than others. In actuality, business organizations have
their own dynamism and sales effort would definitely follow from commercial prospects, which
can come from greater acceptability on the users’ front. Concessional finance could be arranged
for investment to encourage investment as well as efficiency in follow up business.
The scaling down of average size of unit must be associated with a review of sales and
development capability of units. It is noted that smaller units do not necessarily enjoy higher
capacity utilisation in terms of distribution. The broader networks, deeper understanding of
market and greater sales experience of older and larger units, specifically the cooperative sector
units involved in marketing other agro inputs may be commercially exploited for the marketing of
products produced by smaller and less experienced units and the development of a synergic
system in this regard may be useful.
Policy Options: Summary
There are two layers of challenges with regard to incentive and risk that the government has to
encounter in the process of launching the biofertilizer based technology in agriculture, one at the
level of farmers or users and the other at the level of the producing units or investors. This paper
suggests that the government emphasizes the former since the fie ld level acceptance of the
technology will gradually bring commercial viability of producers. For greater farm level
acceptance the government can do the following:
Research: Promote and fund research for improved strains suitable for the different
condit ions, especially for the east and for crops like rice. Greater crop diversification will also
stimulate diffusion.

20
Risk insurance: Explore the possibility of insurance or buy-back of products to reduce
farmers’ risk, with the cost of the scheme being shared by the government and the
distributing/producing firm.
Subsidies: (i)Assess the need for subsidizing sales through scientific studies on ‘willingness
to pay’ and provide for affordable inputs to encourage acceptance at this stage.
Discriminatory and non-uniform subsidies must be removed at once for effective and
undistorted incentive to firms.
(ii) Involve the Ministry of Environment in subsidization and the local bodies for
effective monitoring and regulation.
Information: Organise promotional campaigns and demonstrations drawing the cooperation
of producers and gather market feedback for effective utilization in further research and in
improving the operations and management of producers.
On the producers side the recommendations are few as the above measures, if effectively
implemented could go a long way in benefiting the producers too. The study however
suggests:
Research grants: Funding of possible research for improvement of strains.
Sales networking: Work out suitable sales and development networks among distributors and
producers.
Market support: Provide some market protection through government purchases for specific
time period subject to stringent quality control. This is to be phased out and open market sales
encouraged.
Finance: Concessional finance for investment may be made available. Financial outright
grants are not advisable.

21
5.7 Conclusion
Critics have argued that Green Revolution simply borrowed production from future generations
as it impoverished soils and destroyed ecological balances. Environmentalists have further
pointed out that the emerging free trade regime would raise the scale of activity, especially with
respect to products with comparative advantage, leading to greater environmental damage. While
all this may be an extreme view and a debatable one, the need for undoing to the extent possible
of ecological problems of the past and introducing more sustainable patterns in future cannot be
overemphasised.
The Government of India has been promoting the use of biofertilizers in agriculture through the
NPDB and the state governments also added to the process via subsidization and extension.
Based on living micro-organisms these inputs can make nutrients abundantly available in
atmosphere and soil accessible for plant use without the adverse impact that chemical fertilizers
have on soil, water and air. The national scheme sought to spread the new biofertilizer based
technology through field demonstration, research and financial assistance to investors.
Based on the data provided by the Fertilizer Association of India this study finds that despite
efforts the use of the input as indicated by the distribution has not grown steadily over time, has
been way below projected levels and the there has been practically no diffusion across states, with
about 90% of use accounted by western and southern regions. There has been entry of new units
and significant capacity built up but average capacity has come down with a marginal
improvement in capacity utilization. Private commercial units though open to entry have not
improved their share in distribution. A regression analysis suggests that given the same capacity
and other relevant conditions a private unit distributes less than others casting doubt on the
commercial success of the industry. The analysis also indicates there is no intrinsic advantage that
accounts for the evident concentration of the industry in specific regions. The State governments’
own initiative possibly had greater role in guiding the spread of the technology than the central
government’s schemes.
Public intervention through monetary or other means is justified for building up a market for an
input promising social and longer term gains. The emphasis of any government policy would be
in populariz ing the use at the farmer level through varietal improvement, information
dissemination, risk coverage and also sales subsidies if justified by scientifically conducted
studies. The acceptance at the farmers’ end would go a long way in providing commercial
22
benefits to producing units and encouraging investment. The government must however help the
units financially or otherwise in developing suitable strains and carriers, in accessing affordable
finance for investment and in working out viable schemes for distribution especially since smaller
and less experienced units are tending to dominate the market.
Appendix
Tables
Table A1 : Changing composition of Biofertilizer distribution
Year 1992-93 1993-94 1994-95 1995-96 1996-97 1997-98 1998-99
Total (tonnes) 1600.01 2914.37 4988.90 6288.32 6681.44 6295.63 6700.27
% share
Rhizobium 57.27 40.50 29.41 21.15 20.84 19.85 18.62
Azotobacter 13.00 22.20 18.47 18.46 15.51 17.30 17.74
Azospirillum 12.54 11.11 14.08 17.99 11.34 10.17 11.77
Nitrogen fixers 82.81 73.80 61.96 57.61 47.69 47.32 48.12
Blue green algae – 0.00 0.00 0.06 0.04 0.01 0.02 0.04
phosphate solubiliser 17.19 26.20 35.77 40.46 49.88 48.75 48.98
acetobacter 0.00 0.00 2.21 1.90 1.13 1.06 1.00
Table A2 Despatches of Biofertiliser by IFFCO to select states
States Years %Total 1996-97 93.29 Uttar
Pradesh 2001-02 47.97 Uttaracnchal 2001-2002 6.12
1996-97 0.00 Punjab 2001-2002 10.64
1996-97 0.00 Haryana 2001-2002 5.53
1996-97 0.00 Rajasthan 2001-2002 5.53
1996-97 0.00 Maharashtra 2001-2002 2.63
1996-97 0.00 Madhya Pradesh 2001-2002 0.01
1996-97 0.00 Bihar 2001-2002 7.01
1996-97 6.71 West Bengal 2001-2002 0.00
1996-97 0.00 Orissa 2001-2002 0.00 Source: IFFCO

23
Table A3: State-wise distribution of Bio-fertilizer Plants (nos.)
Number Number Number Net Addition
State 31.3.95 31.3.97 31.3.99 1995-97 1997-99
Assam 2 1 2 -1 1
Bihar 2 2 3 0 1
Orissa 2 2 1 0 -1
West Bengal 4 3 5 -1 2
Manipur 1 1 1 0 0
Tripura 0 1 0 1 -1
East 11 10 12 -1 2
Haryana 2 2 2 0 0
Himachal Pradesh 1 1 1 0 0
Punjab 1 1 1 0 0
Uttar pradesh 13 15 12 2 -3
Delhi 1 1 1 0 0
North 18 20 17 2 -3
Andhra pradesh 4 3 3 -1 0
Karnataka 6 5 11 -1 6
Kerala 0 1 1 1 0
Tamil Nadu 9 13 13 4 0
Pondicherry 0 1 1 1 0
South 19 23 29 4 6
Gujarat 3 3 3 0 0
Madhya Pradesh 4 4 7 0 3
Maharashtra 5 8 24 3 16
Rajasthan 2 4 3 2 -1
West 14 19 37 5 18
India 62 72 95 10 23
A4: Table : Structural composition of the Industry
Regional distribution of units % -----------------------------------------------
Average Capacity
Average Distributio/
Average Price
Employment Mandays/
Category
Total units number
Private Units %
Old units %
Producing both NF and PS % West South North East Tonnes Capapcity% Rs/Kg year
Large 14 36 71 100 50 36 14 0 613 50 29 4360
Others 36 64 31 86 50 36 3 11 100 36 30 447
Note: Only units reporting capacity, distribution and prices in 1998-99. NBFDC considered in North region. Price is simple average of firms. Large unit is defined as having capacity above sample average (243.53 tonnes). Older units are units that reported for 1995 March

24
Table A5: Distribution and Price of Biofertilizers by Privately owned Units
Distribution(Tonnes) Price of NF (Rs/Kg) Private/ Price of PS (Rs/Kg) Private/
year Total Private Private(%) Total Private Total% Total Private Total%
1992 1599.90 738.70 46.17 27.47 31.12 113.29 30.55 39.20 128.31
1993 2914.30 1763.80 60.52 29.27 33.50 114.45 31.30 39.70 126.84
1994 5008.60 2449.90 48.91 27.10 30.89 113.99 27.39 30.61 111.76
1995 6363.28 3341.35 52.51 27.80 31.52 113.38 28.28 32.16 113.72
1996 6681.50 2823.22 42.25 23.79 28.87 121.35 25.39 30.46 119.97
1997 6295.60 2714.22 43.11 24.99 29.78 119.17 26.93 32.55 120.87
1998 6699.90 2769.92 41.34 27.90 32.13 115.16 29.38 32.27 109.84
1992-98 35563.08 16601.11 46.68 26.90 31.12 115.66 28.46 33.85 118.94
Annual average Growth rate%
1992-95 99.24 117.44 4.58 0.40 0.43 0.03 -2.48 -5.99 -3.79
1995-98 1.76 -5.70 -7.09 0.12 0.65 0.52 1.30 0.11 -1.14
1992-98 53.13 45.83 -1.74 0.26 0.54 0.28 -0.64 -2.95 -2.40Note: Units that report capacity and distribution only considered. Prices are simple averages across units. For period 1992-98 total distributions and simple average prices are reported. Growth rate is based on point to point comparison.
Table A6 : Estimated regression equations including different dummy variables
Dependent variable is DISTRIBUTION
Specified with Regions Estimated for smaller sample Specified with
VAR=VINT Specified with VAR=JOINT VAR =WEST VAR=EAST VAR=SOUTH SAMPLE SIZE=48
Variables coefficient t-statistics coefficient t-statistics coefficient t-statistics coefficient t-statistics coefficient t-statistics coefficient
CONSTANT 26.113 0.413 28.948 0.494 36.82 0.634 34.681 0.535 32.371 0.416
P-DEF -2.079 -0.104 -3.276 -0.158 -2.696 -0.126 -2.675 -0.127 -2.337 -0.099
CAPACITY 0.325 9.209 0.328 90.334 0.330 9.499 0.328 9.281 0.330 9.482
DUM-EXP 60.674 2.088 71.986 2.473 72.504 2.289 72.597 2.348 71.894 2.058
DUM-PVT -44.111 -2.149 -46.780 -2.174 -47.607 -2.300 -46.678 -2.173 -48.241 -2.391 -
VAR 26.315 1.066 8.272 0.504 -4.738 -0.175 -5.275 -0.202 4.610 0.140
R 0.75 0.75 0.75 0.75 0.75
DW 1.53 1.5 1.5 1.5 1.6

25
Appendix A-I
Requirement of Some Inputs for Production of Biofertilizers
Production capacity 75 tonnes/year equivalent to 375000 packets (each packet 200 grams)
Labour use
Number of working days 240 days
Number of shifts 1 = 8hours
Number of daily wage labour
Unskilled 3
Skilled 1
Total man hours per year
7680
Carrier for 1000 packets 120Kg (Peat, Lignite, Charcoal) Equipment (Autoclave, Refrigerator, Hot air oven, microscope etc .)Packaging material (LDPE, HDPE, Polypropylene).
Rooms for Inoculum, Carrier, Office.
Source: BioFertilizer Statistics 1999-2000
Appendix A-II
Units considered for Regression Analysis accounting for 85% of Distribution 1998-99 Names of Units
<0.2% total distribution State Micro Biological laboratory ,Pattambi Kerala Pyrites, Phospahates and Chemicals, Amjhore Bihar College of Agriculture, Marathwada Agricultural University, Parbhani Maharashtra University of Agricultural Sciences, Dharwar Karnataka Bharat Laboratory &Biological House for Agriculture, Dhule Maharashtra Godavari Fertilizers &Chemicals Ltd., Secundrabad Andhra Pradesh Lakshmi Bio-techs, Cuddalore Tamil Nadu Regional Soil Testing Laboratory. Rajendranagar Andhra Pradesh Ecosense Labs (I) Pvt. Ltd., Goregaon Maharashtra Nodule Research Laboratory, BCKV , Mohanpur West Bengal Bio Science Laboratories, Salem Tamil Nadu Micro Bac India, Shyamnagar West Bengal A.V.S. Agro Products, Ahmednagar Maharashtra Institute of Nationla Organic Agriculture (INORA), Pune Maharashtra Nav Maharashtra Chakan oil Mills Ltd., Pune Maharashtra
0.2% to 1% of total distribution Biological Nitrogen fixation Scheme, College of Agriculture, Pune Maharashtra Kisan Agro Chem, Dhanegaon Maharashtra Magnum Associates, Chennai Tamil Nadu Monarch Biofertilizers and Research Centre, Chennai Tamil Nadu Samarth Bio Tech Ltd., Hubli Karnataka K-Ferts Lab, Nanded Maharashtra Samruddhi Agrotech, Pune Maharashtra Rhizobium Scheme Deptt. Of Agriculture, Durgapura Rajasthan Maharashtra Bio-tech Industries, Pune Maharashtra Maharashtra Bio-tech Industries, Pune Maharashtra Vasantdada Sugar Institute, Pune Maharashtra

26
Nitrofix Laboratories, Calcutta West Bengal The Sima Cotton Dev. &Research Association, Coimbatore Tamil Nadu M.A.I.D.C. , Pune Maharashtra Niku Bio-research Lab, Pune Maharashtra
1% to 5% of total distribution T.N.Agricultural University, Coimbatore Tamil Nadu Tejasvi Biofert, Pune Maharashtra Gujarat State Cooperative Marketing Federation Ltd., Kankaria Gujarat HMG Biotech Pvt. Ltd., Shimoga Karnataka MLN Farmers Training Institute (IFFCO), Phulpur Uttar Pradesh SPIC Bioproducts, Chennai Tamil Nadu Main Bio Control Research laboratory (TN Cooperative Sugar Fedn.) Changalpattu Tamil Nadu
Deptt. of Agriculture, various Uttar Pradesh M.P.State Cooperative Oil seed Growers' Federation, Dhar Madhya Pradesh Rashtrya Chemicals & fertilizers Ltd., Mumbai Maharashtra Bio Agro Fertilizers, Pune Maharashtra terra Firma Biotechnoilogies Ltd., Hubli Karnataka Kribhco, Hazira Gujarat Bio-fertilizer Production unit, Deptt. Of Agriculture, Pudukottai Tamil Nadu G.S.F.C., Vadodora Gujarat Bio-fertilizer Production unit, Deptt. Of Agriculture, Salem Tamil Nadu National Biofertilizer Development Centre, Ghaziabad etc. Uttar Pradesh etc. Madras Fertilizers, Manali Tamil Nadu
>5% of total distribution Nafed Bifertilizer, Indore Madhya Pradesh Ajay Bio-tech India, Pune Maharashtra Kumar Krashi Mitra Bio Products (I) , Pune Maharashtra
i BGA’s role in maintaining natural fertility of water logged rice fields by scientists back in 1939, when there was no use of chemical fertilizers to speak of. ii Since all units have not reported their performance these distributions relate only to those that reported them, chances being that non-reporters are non-significant distributors. iii The scope of selling from carried over stocks is limited as shelf life is short, around six months.