promising occupations achievable through short-term
TRANSCRIPT

OPRE REPORT #2015-111 • DECEMBER 2015
Promising Occupations Achievable through Short-term Education or Training for Low-Income Families
Appendix E: ACF Region 5 (Chicago)
GOOD JOBS
TANF RECIPIENTS
TRAINING
LOW-INCOMEFAMILIES
EDUCATION
TOOLS
RESOURCES
Data
Sectors

Promising Occupations Achievable through Short-term Education or Training for Low-Income Families Appendix E: ACF Region 5 (Chicago)
December 2015
OPRE Report 2015-111
By Annalisa Mastri
Submitted to: U.S. Department of Health and Human Services Administration for Children and Families Office of Planning, Research and Evaluation 370 L’Enfant Plaza Promenade, SW Washington, DC 20447 Project Officers: Nicole Constance and Emily Schmitt
Submitted by: Mathematica Policy Research 1100 1st Street, NE 12th Floor Washington, DC 20002-4221 Project Director: Michelle Derr Reference Number: 40153.232
This brief was prepared under Contract # HHSP23320095642WC/HHSP23337043T with the Office of Planning, Research and Evaluation, Administration for Children and Families, U.S. Department of Health and Human Services. The views express in this publication do not necessarily reflect the official views or polices of the Office of Planning, Research and Evaluation, the Administration for Children and Families, or the U.S. Department of Health and Human Services. This guide and other reports sponsored by the Office of Planning, Research and Evaluation are available at http://www.acf.hhs.gov/programs/opre.
Suggested citation: Mastri, A. “Promising Occupations Achievable through Short-term Education or Training for Low-Income Families Appendix E: ACF Region 5 (Chicago).” OPRE Report #2015-111. Washington, DC: U.S. Department of Health and Human Services, Administration for Children and Families, Office of Planning, Research and Evaluation, 2015.
Disclaimer: The views expressed in this publication do not necessarily reflect the views or policies of the Office of Planning, Research and Evaluation, the Administration for Children and Families, or the U.S. Department of Health and Human Services.

iii
CONTENTS
Illinois............................................................................................................................E1
Indiana..........................................................................................................................E3
Michigan.......................................................................................................................E4
Minnesota.....................................................................................................................E6
Ohio..............................................................................................................................E8
Wisconsin ...................................................................................................................E10

= some college, no degree = post-secondary non-degree award = associate’s degree
PROMISING OCCUPATIONS IN
Illinois EDUCATION/
TRAINING REQUIRED
AVERAGE ANNUAL
OPENINGS GROWTH
RATE
2014 ANNUAL WAGE
25th Percentile Median 75th Percentile
Registered nurses 3,380 10.5% $54,060 $66,080 $80,610
Nursing assistants 2,110 15.3% $20,780 $23,710 $28,590
Heavy and tractor-trailer truck drivers + OJT 1,990 13.4% $34,070 $42,380 $56,750
Teacher assistants 1,020 1.9% $19,530 $24,920 $32,400
Licensed practical and licensed vocational nurses 1,020 19.9% $37,480 $44,580 $52,600
Hairdressers, hairstylists, and cosmetologists 870 10.9% $18,780 $22,240 $31,270
Medical assistants 710 19.4% $25,830 $30,320 $36,090
Computer user support specialists + OJT 650 18.7% $37,910 $49,270 $65,480
Preschool teachers, except special education 520 3.7% $21,810 $27,380 $35,630
Emergency medical technicians and paramedics 500 10.2% $26,050 $40,400 $64,150
Firefighters + OJT 490 0.2% $22,310 $44,710 $74,320
First-line supervisors of production and operating workers
420 1.6% $42,570 $56,730 $72,790
Paralegals and legal assistants 400 17.5% $36,650 $47,100 $58,720
Library technicians 330 2.0% $24,520 $31,250 $39,850
Dental assistants 310 1.9% $28,590 $35,650 $43,040
Medical records and health information technicians 300 11.8% $27,590 $35,310 $46,150
Heating, air conditioning, and refrigeration mechanics and installers
+ OJT 290 13.7% $38,530 $52,490 $68,360
Dental hygienists 280 8.9% $57,090 $69,330 $81,250
Medical and clinical laboratory technicians 250 15.8% $31,390 $41,020 $54,160
Radiologic technologists 170 7.8% $48,700 $59,040 $71,920
OJT = on-the-job training
1.usa.gov/1RHyJQ1 E1
EDUCATION/ TRAINING REQUIRED
AVERAGE ANNUAL
OPENINGS
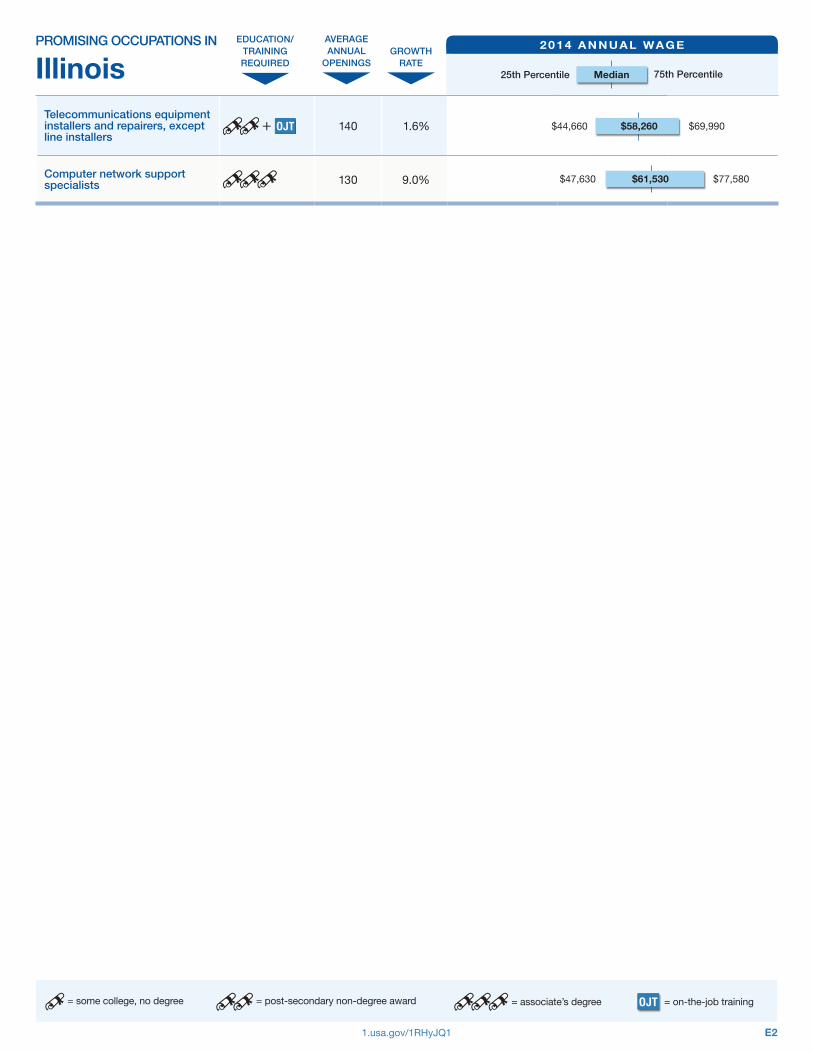
PROMISING OCCUPATIONS IN
Illinois 2014 ANNUAL WAGE
25th Percentile 75th Percentile
GROWTH RATE
Telecommunications equipment installers and repairers, except line installers
+ OJT 140 1.6%
Computer network support specialists 130 9.0%
$44,660 $58,260 $69,990
$47,630 $61,530 $77,580
= some college, no degree = post-secondary non-degree award = associate’s degree OJT = on-the-job training
1.usa.gov/1RHyJQ1 E2
Median

= some college, no degree = post-secondary non-degree award = associate’s degree
PROMISING OCCUPATIONS IN
Indiana EDUCATION/
TRAINING REQUIRED
AVERAGE ANNUAL
OPENINGS GROWTH
RATE
2014 ANNUAL WAGE
25th Percentile Median 75th Percentile
Registered nurses 2,200 17.7% $47,660 $57,770 $69,660
Nursing assistants 1,190 18.8% $20,480 $23,040 $26,940
Heavy and tractor-trailer truck drivers + OJT 1,190 10.3% $32,520 $39,380 $50,590
Licensed practical and licensed vocational nurses 890 22.1% $35,310 $40,420 $45,700
Teacher assistants 830 11.2% $18,450 $21,750 $25,900
Medical assistants 610 28.8% $25,080 $28,460 $33,190
First-line supervisors of production and operating workers
450 6.4% $41,560 $53,070 $67,130
Dental assistants 320 34.0% $31,240 $35,390 $40,710
Emergency medical technicians and paramedics 290 21.0% $22,840 $29,180 $37,260
Dental hygienists 290 34.7% $57,040 $67,130 $74,410
Firefighters + OJT 270 7.1% $38,450 $46,860 $54,640
Preschool teachers, except special education 220 22.5% $20,470 $24,030 $30,150
Medical records and health information technicians 220 22.6% $26,650 $32,920 $41,590
Hairdressers, hairstylists, and cosmetologists 200 5.1% $18,040 $22,430 $31,130
Heating, air conditioning, and refrigeration mechanics and installers
+ OJT 200 16.8% $33,610 $42,560 $55,650
Computer user support specialists + OJT 190 11.3% $33,490 $42,230 $55,710
Medical and clinical laboratory technicians 170 23.6% $28,180 $34,300 $42,920
Radiologic technologists 140 19.0% $44,020 $52,400 $62,390
Paralegals and legal assistants 130 15.9% $31,980 $39,390 $50,330
Respiratory therapists 100 15.3% $45,530 $53,040 $60,150
OJT = on-the-job training
1.usa.gov/1RHyJQ1 E3
= some college, no degree = post-secondary non-degree award = associate’s degree
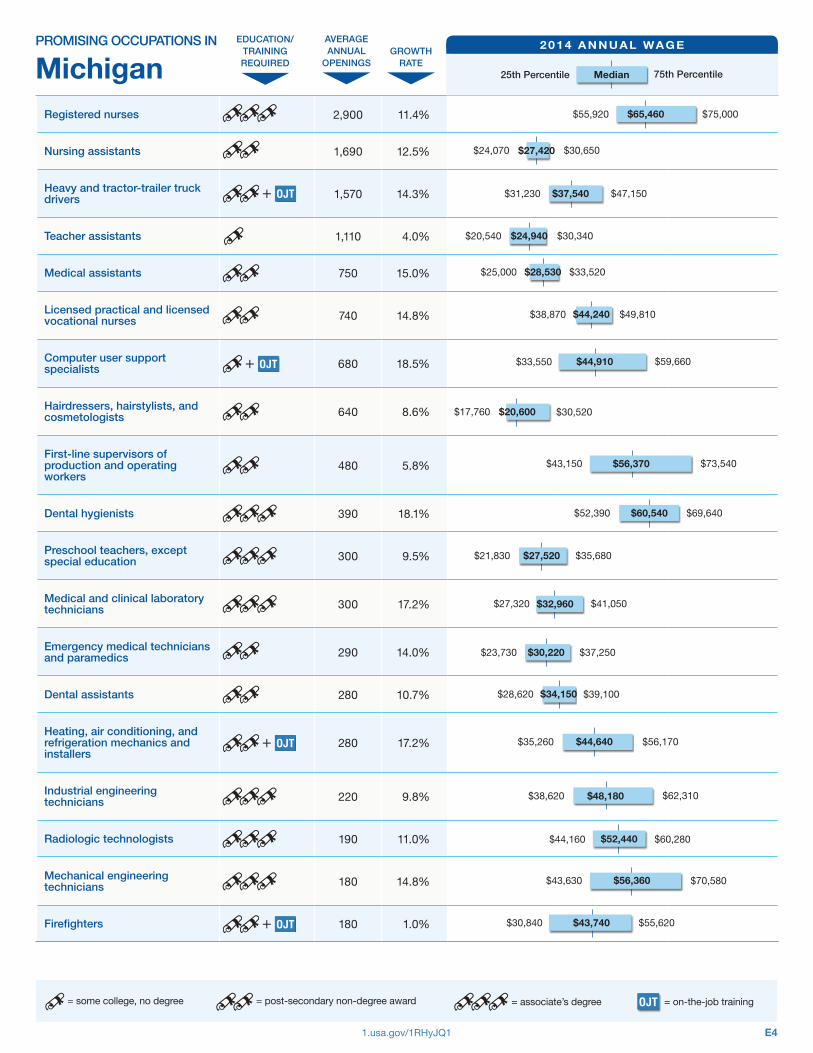
PROMISING OCCUPATIONS IN
Michigan EDUCATION/
TRAINING REQUIRED
AVERAGE ANNUAL
OPENINGS GROWTH
RATE
2014 ANNUAL WAGE
25th Percentile Median 75th Percentile
Registered nurses 2,900 11.4% $55,920 $65,460 $75,000
Nursing assistants 1,690 12.5% $24,070 $27,420 $30,650
Heavy and tractor-trailer truck drivers + OJT 1,570 14.3% $31,230 $37,540 $47,150
Teacher assistants 1,110 4.0% $20,540 $24,940 $30,340
Medical assistants 750 15.0% $25,000 $28,530 $33,520
Licensed practical and licensed vocational nurses 740 14.8% $38,870 $44,240 $49,810
Computer user support specialists + OJT 680 18.5% $33,550 $44,910 $59,660
Hairdressers, hairstylists, and cosmetologists 640 8.6% $17,760 $20,600 $30,520
First-line supervisors of production and operating workers
480 5.8% $43,150 $56,370 $73,540
Dental hygienists 390 18.1% $52,390 $60,540 $69,640
Preschool teachers, except special education 300 9.5% $21,830 $27,520 $35,680
Medical and clinical laboratory technicians 300 17.2% $27,320 $32,960 $41,050
Emergency medical technicians and paramedics 290 14.0% $23,730 $30,220 $37,250
Dental assistants 280 10.7% $28,620 $34,150 $39,100
Heating, air conditioning, and refrigeration mechanics and installers
+ OJT 280 17.2% $35,260 $44,640 $56,170
Industrial engineering technicians 220 9.8% $38,620 $48,180 $62,310
Radiologic technologists 190 11.0% $44,160 $52,440 $60,280
Mechanical engineering technicians 180 14.8% $43,630 $56,360 $70,580
Firefighters + OJT 180 1.0% $30,840 $43,740 $55,620
OJT = on-the-job training
1.usa.gov/1RHyJQ1 E4

EDUCATION/ TRAINING REQUIRED
AVERAGE ANNUAL
OPENINGS
PROMISING OCCUPATIONS IN
Michigan 2014 ANNUAL WAGE
25th Percentile 75th Percentile
GROWTH RATE
Paralegals and legal assistants 160 15.0%
Life, physical, and social science technicians, all other 150 10.0%
Electrical and electronics engineering technicians 130 6.3%
Computer network support specialists 100 9.3%
Telecommunications equipment installers and repairers, except line installers
+ OJT 80 5.5%
$21,720 $29,900 $40,050
$39,800 $56,000 $67,770
$41,560 $54,920 $74,270
$38,310 $48,600 $64,830
$35,490 $45,830 $57,910
= some college, no degree = post-secondary non-degree award = associate’s degree OJT = on-the-job training
1.usa.gov/1RHyJQ1 E5
Median
= some college, no degree = post-secondary non-degree award = associate’s degree
PROMISING OCCUPATIONS IN
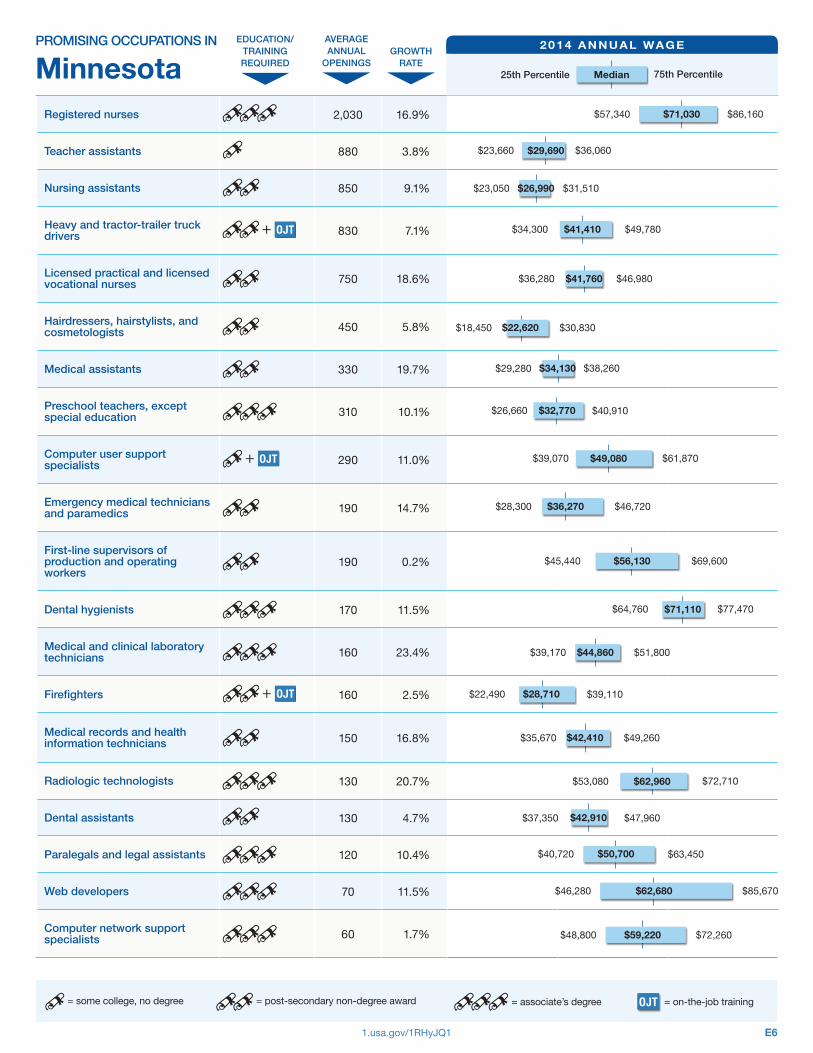
Minnesota
Registered nurses
Teacher assistants
Nursing assistants
Heavy and tractor-trailer truck drivers
Licensed practical and licensed vocational nurses
Hairdressers, hairstylists, and cosmetologists
Medical assistants
Preschool teachers, except special education
Computer user support specialists
Emergency medical technicians and paramedics
First-line supervisors of production and operating workers
Dental hygienists
Medical and clinical laboratory technicians
Firefighters
Medical records and health information technicians
Radiologic technologists
Dental assistants
Paralegals and legal assistants
Web developers
Computer network support specialists
EDUCATION/ TRAINING REQUIRED
+ OJT
+ OJT
+ OJT
AVERAGE ANNUAL
OPENINGS
2,030
880
850
830
750
450
330
310
290
190
190
170
160
160
150
130
130
120
70
60
GROWTH RATE
16.9%
3.8%
9.1%
7.1%
18.6%
5.8%
19.7%
10.1%
11.0%
14.7%
0.2%
11.5%
23.4%
2.5%
16.8%
20.7%
4.7%
10.4%
11.5%
1.7%
2014 ANNUAL WAGE
25th Percentile Median 75th Percentile
$57,340 $71,030 $86,160
$23,660 $29,690 $36,060
$23,050 $26,990 $31,510
$34,300 $41,410 $49,780
$36,280 $41,760 $46,980
$18,450 $22,620 $30,830
$29,280 $34,130 $38,260
$26,660 $32,770 $40,910
$39,070 $49,080 $61,870
$28,300 $36,270 $46,720
$45,440 $56,130 $69,600
$64,760 $71,110 $77,470
$39,170 $44,860 $51,800
$22,490 $28,710 $39,110
$35,670 $42,410 $49,260
$53,080 $62,960 $72,710
$37,350 $42,910 $47,960
$40,720 $50,700 $63,450
$46,280 $62,680 $85,670
$48,800 $59,220 $72,260
OJT = on-the-job training
1.usa.gov/1RHyJQ1 E6

EDUCATION/ TRAINING REQUIRED
AVERAGE ANNUAL
OPENINGS
PROMISING OCCUPATIONS IN
Minnesota 2014 ANNUAL WAGE
25th Percentile 75th Percentile
GROWTH RATE
Industrial engineering technicians 60 0.5%
Telecommunications equipment installers and repairers, except line installers
60 2.8%
Computer, automated teller, andoffice machine repairers
50 1.1%
$41,540 $50,510 $59,690
$37,400 $58,480 $69,900
$28,820 $38,630 $48,640
= some college, no degree = post-secondary non-degree award = associate’s degree OJT = on-the-job training
1.usa.gov/1RHyJQ1 E7
Median

= some college, no degree = post-secondary non-degree award = associate’s degree
PROMISING OCCUPATIONS IN
Ohio EDUCATION/
TRAINING REQUIRED
AVERAGE ANNUAL
OPENINGS GROWTH
RATE
2014 ANNUAL WAGE
25th Percentile Median 75th Percentile
Registered nurses 4,270 15.4% $53,360 $61,000 $71,720
Nursing assistants 2,370 14.3% $20,930 $23,680 $28,170
Licensed practical and licensed vocational nurses 1,890 21.6% $35,100 $40,380 $46,150
Heavy and tractor-trailer truck drivers + OJT 1,680 8.1% $32,860 $39,860 $49,830
Teacher assistants 1,210 9.5% $19,550 $24,910 $30,630
Hairdressers, hairstylists, and cosmetologists 1,100 9.5% $18,230 $20,950 $28,550
Preschool teachers, except special education 910 17.6% $19,910 $23,420 $29,090
Medical assistants 890 20.6% $24,610 $28,020 $32,210
Computer user support specialists + OJT 630 17.8% $34,740 $43,570 $56,230
Firefighters + OJT 590 4.4% $27,360 $41,060 $57,970
Emergency medical technicians and paramedics 450 19.7% $23,330 $28,310 $35,520
Heating, air conditioning, and refrigeration mechanics and installers
+ OJT 410 20.0% $34,610 $43,320 $53,660
Dental hygienists 370 20.0% $58,090 $66,770 $73,910
Medical records and health information technicians 340 16.4% $29,200 $35,680 $45,110
Medical and clinical laboratory technicians 320 23.4% $33,280 $40,460 $48,680
Dental assistants 320 12.6% $29,370 $34,980 $41,660
Radiologic technologists 260 15.9% $45,010 $52,870 $59,670
Paralegals and legal assistants 240 17.4% $33,120 $42,910 $55,680
Respiratory therapists 170 15.5% $46,520 $53,330 $59,340
OJT = on-the-job training
1.usa.gov/1RHyJQ1 E8

EDUCATION/ TRAINING REQUIRED
AVERAGE ANNUAL
OPENINGS
PROMISING OCCUPATIONS IN
Ohio 2014 ANNUAL WAGE
25th Percentile 75th Percentile
GROWTH RATE
Telecommunications equipment installers and repairers, except line installers
+ OJT 150 6.4%
Computer network support specialists 130 3.2% $38,940 $49,740 $66,810
$37,680 $51,440 $60,400
= some college, no degree = post-secondary non-degree award = associate’s degree OJT = on-the-job training
1.usa.gov/1RHyJQ1 E9
Median

= some college, no degree = post-secondary non-degree award = associate’s degree
PROMISING OCCUPATIONS IN
Wisconsin EDUCATION/
TRAINING REQUIRED
AVERAGE ANNUAL
OPENINGS GROWTH
RATE
2014 ANNUAL WAGE
25th Percentile Median 75th Percentile
Registered nurses 1,920 13.7% $55,240 $64,090 $74,920
Heavy and tractor-trailer truck drivers + OJT 1,140 8.1% $32,710 $39,040 $48,870
Nursing assistants 1,020 7.6% $22,850 $26,480 $29,940
Teacher assistants 560 2.0% $21,110 $26,610 $30,970
Hairdressers, hairstylists, and cosmetologists 540 8.3% $18,390 $22,790 $31,010
Medical assistants 450 22.3% $27,410 $31,940 $36,550
Licensed practical and licensed vocational nurses 370 12.2% $37,330 $42,650 $47,660
First-line supervisors of production and operating workers
330 2.8% $42,680 $53,980 $68,160
Firefighters + OJT 260 5.1% $19,280 $26,120 $44,500
Computer user support specialists + OJT 230 12.2% $35,210 $44,390 $56,470
Emergency medical technicians and paramedics 220 10.5% $19,290 $27,080 $35,690
Dental hygienists 220 22.9% $54,820 $63,210 $71,340
Dental assistants 210 15.6% $30,670 $35,730 $41,840
Medical records and health information technicians 170 18.8% $29,420 $36,180 $44,860
Heating, air conditioning, and refrigeration mechanics and installers
+ OJT 150 8.5% $36,890 $45,280 $55,770
Paralegals and legal assistants 140 21.7% $34,660 $44,100 $55,720
Radiologic technologists 140 18.5% $45,900 $54,040 $61,700
Medical and clinical laboratory technicians 130 24.8% $35,220 $43,020 $53,510
Telecommunications equipment installers and repairers, except line installers
+ OJT 50 3.4% $36,230 $50,230 $63,850
OJT = on-the-job training
1.usa.gov/1RHyJQ1 E10
