prolexic quarterly global ddos attack report - q2 2013
TRANSCRIPT

Prolexic Quarterly Global DDoS Attack Report
Q2 2013
Q2 2013 saw significant increases in average DDoS attack bandwidth
and packet-per-second rates

2Prolexic Quarterly Global DDoS Attack Report - Q2 2013
Analysis and Emerging Trends
In the second quarter of 2013, Distributed Denial of Service (DDoS) attacks against Prolexic’s global client base continued their upward trajectory across almost all tracked metrics. Once again, financial services firms were heavily targeted, but a wide variety of industries were also victimized by attacks, including leading brands in retail, healthcare, high tech, media and telecom, travel and other sectors.
As in previous quarters, attackers predominantly used infrastructure-directed attacks (Layer 3 and Layer 4), which accounted for 74.71 percent of all attacks, with application layer attacks making up the remainder. SYN floods were the attack type of choice, accounting for nearly one-third of all attacks mitigated by Prolexic’s Security Operations Center (SOC). This level of SYN floods is the highest volume for any single attack type since Prolexic began publishing its Quarterly Global DDoS Attack Report. GET, ICMP and UDP floods were also frequently directed against Prolexic clients during the three-month period.
This quarter, average attack duration continued to rise and reached 38 hours. This reverses the trend of declining attack durations observed early in 2012. Since Q2 2012, when attack duration measured just 17 hours, average duration has more than doubled, illustrating that perpetrators are less concerned about botnet identification. With the widespread availability of compromised web servers, it has become quicker and easier for malicious actors to replenish and redeploy botnets taken down by authorities. Previously, building a botnet from clients, primarily home PCs infected with malware, took considerable time and effort. Therefore, attackers sought to avoid compromising their assets by using shorter attack times.
In Q2 2013, average attack bandwidth reached 49.24 Gbps and average packet-per-second (pps) volume totaled 47.4 million. These figures reflect that attacks in the quarter were extremely intense and perpetrators have considerable firepower at
their disposal. Absorbing attacks of this size is far beyond the capacity of all but the largest corporate networks and even many mitigation providers.
The current quarter also showed an increase in the total number of attacks against Prolexic’s global client base. April was the most active month of the quarter, accounting for 39.7 percent of all attacks, followed by May (31.62 percent) and June (28.72 percent). In this second quarter, two weeks tied for the most active week of the quarter: April 8-14 and April 15-21. This high level of activity can be attributed to attacks against financial services clients and the ongoing use of the itsoknoproblembro DDoS toolkit.
As is commonplace, the list of source countries responsible for launching the most DDoS attacks was fluid with the exception of China, which remained in first place. This quarter also showed the strong presence of Mexico, in second place, and also Russia, Korea and France. Iran, which appeared last quarter for the first time, remained in the top 10.
At a Glance
Compared to Q2 2012• 33percentincreaseintotalnumberofDDoSattacks
• 23percentincreaseintotalnumberofinfrastructure(Layer3&4)attacks
• 79percentincreaseintotalnumberofapplication(Layer7)attacks
• 123percentincreaseinattackduration:38hoursvs.17hours
• 925percentincreaseinaveragebandwidth• 1,655percentincreaseinaveragepacket-per-second(pps)rate
Compared to Q1 2013• 20percentincreaseintotalnumberofDDoSattacks
• 17percentincreaseintotalnumberofinfrastructure(Layer3&4)attacks
• 28percentincreaseintotalnumberofapplication(Layer7)attacks
• 10percentincreaseinattackduration:38hoursvs.34.50hours
• 2percentincreaseinaveragebandwidth:49.24Gbpsvs.48.25Gbps
• 46percentincreaseinaveragepacket-per-second(pps)rate
• ChinamaintainsitspositionasthemainsourcecountryforDDoSattacks

3Prolexic Quarterly Global DDoS Attack Report - Q2 2013
Compared to Q2 2012: Year-over-Year Trends
Compared to the same quarter one year ago, the total number of attacks increased 33.8 percent. In addition, the total number of infrastructure attacks increased 23.2 percent while the total number of application attacks (Layer 7) increased by 79.43 percent. While the split between the total number of infrastructure attacks and application layer attacks was similar between the two quarters, both attack types increased when the two quarters are compared. Average attack durations have increased significantly, rising from 17 hours in Q2 2012 to reach 38 hours this quarter, an increase of 123.7 percent.
Most noticeable is the quarter-on-quarter increase in average bandwidth and packet-per-second rates. Average bandwidth increased 925 percent, rising from 4.47 Gbps in Q2 2012 to 49.24 Gbps this quarter. Similarly, the average the packet-per-second rate increased 1,655 percent, rising from 2.7 Mpps in Q2 2012 to 47.4 Mpps this quarter. These metrics reflect how the attacking power of DDoS botnets has increased significantly during the last 12 months.
Compared to Q1 2013: Quarter-over-Quarter Trends
The total number of attacks increased by 20 percent compared to the previous quarter, reflecting a consistently high level of attack activity around the globe during the last six months. The total numbers of both infrastructure and application attacks increased over Q1 2013 (17.4 percent and 28.85 percent respectively). Average attack duration continued to tick upwards, rising from 34.5 hours last quarter to 38 hours in Q2 2013. This shows attackers have considerable botnet resources at hand and are prepared to risk detection by embarking on longer attack campaigns in an effort to bring down their targets. As noted earlier, average attack bandwidth increased from 48.25 Gbps to 49.24 Gbps, a 2.05 percent increase. Average packet-per-second volume again increased significantly. Last quarter’s average packet-per-second rate hit 32.4 Mpps, an impressive metric. This quarter, the average packet-per-second rate increased by a robust 46.29 percent to reach 47.4 Mpps. The size of this increase illustrates that distributed denial of service attack volumes show no sign of declining.

4Prolexic Quarterly Global DDoS Attack Report - Q2 2013
Q2 2013 Average Attack Bandwidth (Gbps)
Figure 1 shows average attack bandwidth in gigabits per second (Gbps) for all DDoS attacks mitigated by Prolexic in Q2 2013. The bandwidth consumed is shown on the horizontal axis, while the vertical axis displays the percentage of all mitigated attacks in that range of bandwidth.
In Q2, 2013, 55 percent of attacks had bandwidth greater than 5 Gbps and approximately 17 percent of the total attacks logged against Prolexic’s global client base exceeded 60 Gbps. The use of higher bandwidth suggests the involvement of more advanced malicious actors with access to greater resources. These malicious actors are becoming more organized and connected with veteran crime organizations and state-sponsored digital mercenary campaigns. The significant bandwidth use indicates that these advanced threat groups are able to harness the power of larger DDoS botnets.
Approximately 45 percent of the overall attacks in the quarter recorded bandwidths of less than 5 Gbps. Data shows 25 percent of the overall attacks used 1-5 Gbps, and roughly 20 percent of the overall attacks used less than 1 Gbps. These numerous smaller attacks were commonplace, because they do not require many resources to execute and can be launched by low-skilled actors using public tools such as PHP booters and a handful of virtual private servers (VPSs).
Figure1:Averageattackbandwidth(Gbps)inQ22013
5Prolexic Quarterly Global DDoS Attack Report - Q2 2013
Q2 2013 Average Attack Volume (Mpps)
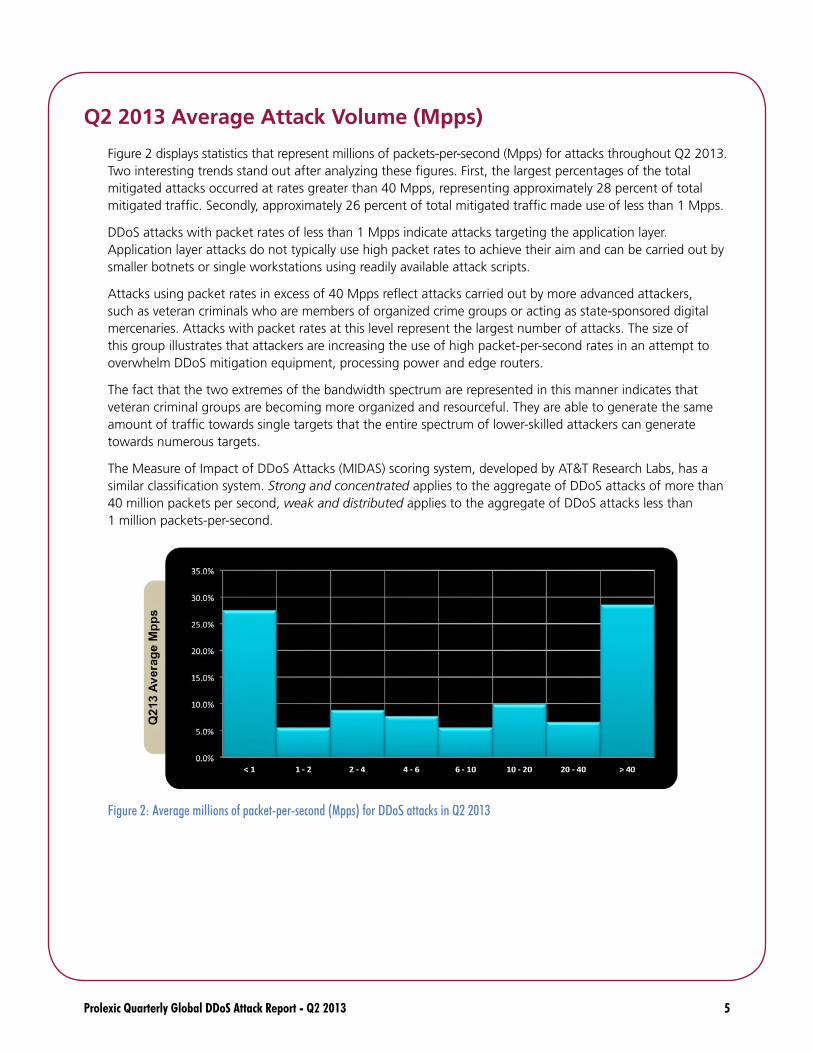
Figure 2 displays statistics that represent millions of packets-per-second (Mpps) for attacks throughout Q2 2013. Two interesting trends stand out after analyzing these figures. First, the largest percentages of the total mitigated attacks occurred at rates greater than 40 Mpps, representing approximately 28 percent of total mitigated traffic. Secondly, approximately 26 percent of total mitigated traffic made use of less than 1 Mpps.
DDoS attacks with packet rates of less than 1 Mpps indicate attacks targeting the application layer. Application layer attacks do not typically use high packet rates to achieve their aim and can be carried out by smaller botnets or single workstations using readily available attack scripts.
Attacks using packet rates in excess of 40 Mpps reflect attacks carried out by more advanced attackers, such as veteran criminals who are members of organized crime groups or acting as state-sponsored digital mercenaries. Attacks with packet rates at this level represent the largest number of attacks. The size of this group illustrates that attackers are increasing the use of high packet-per-second rates in an attempt to overwhelm DDoS mitigation equipment, processing power and edge routers.
The fact that the two extremes of the bandwidth spectrum are represented in this manner indicates that veteran criminal groups are becoming more organized and resourceful. They are able to generate the same amount of traffic towards single targets that the entire spectrum of lower-skilled attackers can generate towards numerous targets.
The Measure of Impact of DDoS Attacks (MIDAS) scoring system, developed by AT&T Research Labs, has a similar classification system. Strong and concentrated applies to the aggregate of DDoS attacks of more than 40 million packets per second, weak and distributed applies to the aggregate of DDoS attacks less than 1 million packets-per-second.
Figure2:Averagemillionsofpacket-per-second(Mpps)forDDoSattacksinQ22013

6Prolexic Quarterly Global DDoS Attack Report - Q2 2013
Q2 2013 Attack Vectors
Figure 3 represents all of the attack types that traversed the Prolexic DDoS mitigation network throughout Q2 2013. The majority of DDoS traffic arrived in the form of infrastructure (Layer 3 and 4) attacks, making up approximately 74.71 percent of attacks. The remaining 25.29 percent of DDoS traffic arrived in the form of application attacks (Layer 7).
Figure3:TypesofDDoSattacksandtheirrelativedistributioninQ22013
Infrastructure attacks (Layer 3 & 4)
The figure shows that the majority of the infrastructure attacks came in the form of SYN floods, which consisted of 31.22 percent of all infrastructure traffic. SYN floods continue to be a popular and effective attack type due to the simplicity of how the attack executes, the ability to spoof origin IP addresses, and the fact that many of DDoS botnets have SYN flooding capabilities as primary functionality. Furthermore, the use of Spoofed SYN (SSYN) floods is increasingly being used as a vector for Distributed Reflection Denial of Service (DrDoS) attacks. The SSYN reflection DDoS attack methodology is the topic of the latest white paper in the DrDoS series published by PLXsert entitled, An Analysis of SYN Reflection Attacks.
Figure 3 also indicates the second most popular type of infrastructure attack came in the form of UDP floods. The UDP packet is a stateless packet and is therefore subject to spoofing. UDP floods remain a favorite of malicious actors due to the ease of which attacks can be launched, especially as they relate to DrDoS attacks. An increasingly popular method of sending UDP attack traffic has been the use of booter shells with Command and Control (C&C) interfaces known as stressers, which are PHP scripts deployed on web servers. Booter scripts and related C&C infrastructure were subjects of a PLXsert Threat Advisory Issued in April 2012 entitled, Threat Advisory: Booter Shell Scripts.

7Prolexic Quarterly Global DDoS Attack Report - Q2 2013
Application attacks (Layer 7)
The majority of application attacks (Layer 7) came in the form of HTTP GET floods, making up approximately 21.48 percent of the total. This result can be partially attributed to the majority of commercial and public DDoS kits, such as Optima Darkness and Black Energy, that use of GET floods as their standard method of attack. GET floods are potent because they overwhelm the application running on the web server and the flood may initially appear to be legitimate traffic, requiring additional mitigation controls to be implemented.
Other popular types of application attacks came in the forms of HTTP POST floods and SSL GET floods. HTTP POST floods are also featured in many DDoS crime ware kits and enable attackers to utilize POST requests to send large amounts of data to the application. SSL GET floods add an additional strain to the target web servers as processing power is utilized to decrypt incoming traffic.
DDoS-as-a-Service websites will often specify the type of attack options available and Layer 7 attacks are among the choices. For example, a DDoS-as-a-Service or stresser will send commands to multiple web servers that have the Slowloris script installed, which will engage in a Layer 7 flood tool. Traditionally, Slowloris and other Layer 7 attacks that rely on thread exhaustion have been used as a standalone DoS tool; however malicious actors have bundled it as an option into their stresser suites and subsequently increased the potential impact of the technique.

8Prolexic Quarterly Global DDoS Attack Report - Q2 2013
Comparison of Attack Types (Q2 2012, Q1 2013, Q2 2013)
Increase in DNS attack traffic
When compared with Q2 2012 (1.76 percent), Q1 2013 (6.97 percent), and Q2 2013 (7.25 percent), statistics indicate that DNS attacks are on the rise, both in the form of standard floods and Distributed Reflected Denial of Service (DrDoS) attacks. From Q2 2012 to Q2 2013, DNS attacks increased 5.49 percent. DNS attacks are usually directed at organizations with large infrastructures where oversight or misconfiguration of DNS services can cause severe impact to selected targets.
The increasing deployment of high-speed bandwidth to remote global regions has enabled the exponential growth of Internet usage and the increased deployment of Internet services infrastructure. The recent proliferation of DNS servers, many poorly configured, was a natural step in the growth of the Internet. The result, however, has been the reuse of decade-old attack methods that have not lost their effectiveness and have actually gained strength. This trend is consistent with previous PLXsert observations that both infrastructure and application-based attacks are increasing because of the proliferation of compromised web servers with high bandwidth output.
Decrease in ICMP floods
The data indicates that ICMP floods are decreasing as a favored DDoS attack method when compared to Q2 2012 (17.28 percent), Q1 2013 (15.53 percent), and Q2 2013 (15.15 percent). ICMP attacks are focused on Layer 3 and are relatively easy to launch and mitigate. ICMP floods are often launched with tools such as hping, a free packet generator, or custom Perl scripts deployed on compromised machines. ICMP floods have also been observed being used in tandem with basic SYN floods. However, the ICMP flood method seems to be losing popularity as more effective and stealthy methods of DDoS attacks are available.
Amplification attacks favored
Amplification attacks present an added layer of obfuscation, because the attackers spoof the source IPs of requests within the attack vector. Attackers will spoof the IP address of the primary target while sending floods of traffic to misconfigured, intermediary victim servers, which respond with an amplified response to the spoofed IP address. The spoofed IP address is that of the primary target, who receives an unwanted flood of traffic from responding victim servers.
Figure 4 displays the percentages of SYN flood attacks as compared to other types of DDoS attack methods. The data reveals an increasing trend in the use of SYN floods. SYN flood trending data shows Q2 2012 at 26.63 percent, Q1 2013 at 25.83 percent and Q2 2013 at 31.22 percent. During the course of one year, from Q2 2012 to Q2 2013, SYN attacks have had a total net increase of 4.59 percent.
Comparison of the percentages of UDP flood attacks displayed in Figure 4 reveal a decreasing trend. UDP flood data shows Q2 2012 at 23.10 percent, Q1 2013 at 16.32 percent and Q2 2013 at 10.43 percent. Despite the increase in DrDoS attacks making use of Layer 3, overall UDP flood attack data shows a decreasing trend. During the course of one year, from Q2 2012 to Q2 2013, UDP flood attacks decreased 12.67 percent.

9Prolexic Quarterly Global DDoS Attack Report - Q2 2013
Figure4:Attacktypedistributionforthreetimeperiodsin2012and2013
Layer 7 attacks more common
Data shows GET floods have increased in popularity: Q2 2012 (14.81 percent), Q1 2013 (19.33 percent), and Q2 2013 (21.48 percent). During the course of one year, from Q2 2012 to Q2 2013, GET flood DDoS attacks increased 6.67 percent. This increase is consistent with past observations by PLXsert of the increased use of Layer 7 attacks due to ease of deployment of attack scripts onto compromised web servers.

10Prolexic Quarterly Global DDoS Attack Report - Q2 2013
Total Attacks per Week (Q2 2012 vs. Q2 2013)
Figure 5 displays DDoS attack data for the week of April 8, 2013 as compared to the same period in 2012. The figure reveals a 710 percent increase in DDoS activity during this week year-over-year. Additionally, the prior week – April 1, 2013 – reveals an increase of 216 percent compared to the same period in 2012.
These peaks of activity are skewed by DDoS campaigns against many U.S.-based financial services organizations. PLXsert has previously provided indicators that showed these campaigns were highly sophisticated with an unprecedented level of resources and coordination. Furthermore, PLXsert researchers believe there is a significant probability that these campaigns will move across industries, especially those related to U.S. national security and critical infrastructure.
A comprehensive analysis of the BroDoS/itsoknoproblembro campaign and toolkit can be found in the PLXsert white paper, Threat Advisory: itsoknoproblembro DDoS Toolkit.
Figure5:DDoSattacksperweekQ22012andQ22013

11Prolexic Quarterly Global DDoS Attack Report - Q2 2013
Top 10 Source Countries (Q2 2013)
Figure 6 displays the top 10 countries originating malicious DDoS traffic that was identified traversing the Prolexic network during the quarter. In Q2 2013, China was the leader of DDoS activity with 39.08 percent of sourced DDoS traffic. This number is slightly lower than last quarter when China originated 40.68 percent of all malicious DDoS traffic.
The second largest source of malicious DDoS traffic was Mexico at 27.32 percent, replacing the United States from Q1 2013. The third largest source of malicious traffic was Russia at 7.58 percent, followed by Korea at 7.29 percent, France at 6.50 percent, and the United States at 4.12 percent.
The appearance of Mexico as a source for malicious DDoS traffic is significant, as this country did not appear as a top source country in Q2 2012. Mexico has the largest Spanish-language Internet market with an approximate user base of 46 million people. PLXsert has identified a trend where countries with large network infrastructures, large populations and rapid technological growth will have more incidents of botnet infections. The appearance of Mexico is an indicator that other Latin American countries with similar Internet use rates and growing populations will also surface as sources for malicious DDoS traffic.
Countries that have extensive network infrastructures are typically more susceptible to being selected as targets by malicious groups who seek the unauthorized use and abuse of those network resources. Other factors are also involved when malicious actors are selecting targets by region, such as the proliferation of vulnerable web applications and the availability of large quantities of bandwidth. PLXsert researchers have also observed that malicious actors seek hosting providers that are slow to respond to malware-cleanup requests, as well as those perceived as out-of-reach of international law enforcement authorities.
These emerging factors present a fertile ground for malicious actors and organized crime to harvest botnets to be used for multiple criminal purposes, including their deployment to paying customers as part of an economic ecosystem that supplies DDoS-as-a-Service.
Figure6:DDoSattacksbycountryoforiginforQ22013

12Prolexic Quarterly Global DDoS Attack Report - Q2 2013
Comparison: Top 10 Source Countries (Q2 2012, Q1 2013, Q2 2013)
Figure 7 represents a vertical comparison of top 10 countries that originated DDoS attack activity within three different time periods. In the most recent quarter, China (39.08 percent) maintains its first place position. At 27.32 percent, Mexico has made a dramatic rise into second place, surpassing the United States (4.12 percent).
Within European countries, Italy, France, the United Kingdom, and Germany have all experienced various swings in malicious activity. This quarter, Germany has slipped out of the top 10, where it appeared last year (Q2 2012) and last quarter (Q1 2013). This quarter, Italy and the United Kingdom have entered the list of top 10 source countries of malicious activities for the first time. France has risen further in the origination of DDoS traffic since last quarter Q1 2013.
The Russian Federation (7.58 percent) has increased slightly as a source of DDoS attacks. Iran, at 2.14 percent, has shown a decline in malicious activity during Q2 2013 compared to last quarter. Taiwan (1.81 percent) and Korea (7.29 percent) have both experienced an increase in DDoS activity to break into the top 10 listing.
Proliferation of public, free and user-friendly DDoS attack tools and their subsequent use among malicious actors has become pervasive. The deployment of simple, powerful tools and the formation of new malicious actor groups and/or expansion of current malicious actor groups are expected in the upcoming quarters. This information is hypothesized based on the tracking of DDoS activity during the past 10 years.
Figure7:RelativevolumeofDDoSattacksoriginatingfromthetop10sourcecountriesforselectedtimeperiodsin2012and2013

13Prolexic Quarterly Global DDoS Attack Report - Q2 2013
Comparison: Attack Campaign Start Time per Day (Q2 2012, Q1 2013, Q2 2013)
Figure 8 indicates the average start time for DDoS attacks that were launched against the Prolexic infrastructure. Q2 2013 reveals a similar distribution as Q2 2012 in terms of time of the day that attacks were launched, with the exception of a slight decrease in attack starts at 12:00 GMT.
Malicious actors will choose a range of hours based on the attack’s opportunity to inflict the highest possible damage to the business operations of the target. The attack time distribution for Q2 2013 reveals targets being attacked mostly after 12:00 GMT, which is 7:00 a.m. EST. the attacks continue at a high rate until 17:00 GMT, which is 12:00 noon EST (09:00 a.m. PST). This attack timeframe focuses on the primary hours of business for both the East and West Coast of the United States. The greatest percentage of DDoS attack campaigns this quarter targeted enterprises whose infrastructure is located in the United States.
Figure8:ThedistributionofstarttimesforDDoSattackcampaignforthreequartersin2012and2013
14Prolexic Quarterly Global DDoS Attack Report - Q2 2013
DDoS Attack Campaign: Case Study
Overview
This case study will examine a 167-gigabit per second (Gbps) DrDoS attack campaign that targeted a Prolexic customer. DrDoS campaigns, including DNS attacks, are the subject of a Prolexic white paper series. The attack method was also the subject of US-CERT advisory TA13-088A – DNS Amplification Attacks. This decade-old attack methodology has once again risen to prominence within the last few years as a result of massive global deployments of misconfigured, recursive DNS servers.
This 167-Gbps attack was one of the largest attacks that Prolexic has observed traversing our DDoS mitigation network. This case study will provide insight into the technical details, motives and methods behind this particular DDoS campaign.
Attack details
On May 27, 2013, an incoming DNS reflection DDoS attack targeting a Prolexic client reached 167 Gbps. While Prolexic instantly and successfully mitigated this attack, and the impact of the attack was minimal, this incident was significant because it was the largest DNS reflection DDoS attack that Prolexic had observed traversing our network.
Components of the threat
Here are the attack observations made by the Prolexic Security Engineering and Response Team (PLXsert):
• Motivation: The motivation for the attack was profit.
• Timeline: On May 26 2013, the customer experienced a similar DDoS attack probe that did not reach any significant bandwidth proportions. The 167-Gbps attack arrived the next day.
• Resources: The attackers may have at least moderate financial resources, because they may have used one or more DDoS services to achieve a significant attack volume.
• Risk tolerance: The third-party DDoS services used by these attackers may be under surveillance by law enforcement, and it is unknown whether the malicious actors made use of effective anonymization techniques when launching these attacks. The attackers seem to have a moderate risk tolerance as evidenced by the use of third-party DDoS services and an attack technique that made use of spoofed IP addresses.
• Skills and methods: This attack likely used third-party DDoS services. The DDoS DNS reflection attack method is more than a decade old. It is the default attack setting on many third-party DDoS services.
• Attack Origination Points: Figure 9 displays a map that identifies the geo-location of confirmed non-spoofed DNS victims that became involved in the reflection attack against the target.

15Prolexic Quarterly Global DDoS Attack Report - Q2 2013
Figure9:Geo-locationofnon-spoofedattackingIPaddresses
• Botnets involved: The attackers made use of one or more DDoS botnets that used DNS reflection to achieve an attack bandwidth of 167 Gbps. This significant bandwidth rate indicates that the attackers either knew of a single DDoS service provider with a sufficiently powerful botnet or made use of multiple DDoS services at the same time.
• Knowledge source: Information about the DDoS attack comes from internal Prolexic mitigation logs.
• Victimology: This Prolexic client is frequently targeted with DDoS attacks due to its prominence within its industry sector.
Attack details
Figure 10 displays details about the DNS reflection DDoS attacks. The attack bandwidth reached 167 Gbps and used amplification tactics to reflect packets with a size of 3953 bytes.
Details about DrDoS and amplification attacks can be found in the PLXsert whitepaper series on DrDoS attacks located at http://www.prolexic.com/drdos and within the US-CERT Advisory TA13-088A – DNS Amplification Attacks.
Start May 27, 2013 09:50:00 UTC
Industry Finance
Bandwidth 167 Gbps
Duration Approximately 5 minutes
TXT | ANY RR t4.deparel.com.
Victim hosts from Netflow Data 784
Victims with Recursion Enabled 763
Size 3953
Figure10:AttackstatisticsforthisDrDoSattack

16Prolexic Quarterly Global DDoS Attack Report - Q2 2013
The next screenshot, Figure 11, shows an amplified reflected packet. The nature of amplification through reflection attacks allows attackers to send a small amount of data within a query to a victim DNS server while spoofing the IP address of the intended target. The DNS server will respond to the spoofed IP address with packet data that is exponentially larger than the original request.
Repeated request queries utilizing small amounts of data can result in significant bandwidth being directed toward the target of the DrDoS attack.
Figure11:AnamplifiedreflectedresponsetoaDNSrequest
Figure 12 displays the bandwidth graphs that show spikes indicating an incoming attack. The attack was immediately identified and stopped by Prolexic security engineers and mitigation equipment.
Figure12:AmplifiedreflectedresponsetoaDNSrequest
Figure 13 displays a numeric count of the top banners for identified DNS servers that were used in the attack campaign against the Prolexic customer. It is notable that the prevalent use of outdated and misconfigured DNS servers is a significant contributor to the ease in which attackers are able to launch this DDoS attack campaign.

17Prolexic Quarterly Global DDoS Attack Report - Q2 2013
Figure13:DNSserverversionsusedinattackcampaigns
Reflector graphs
Figure 14 displays details surrounding the use of misconfigured DNS servers for DrDoS attacks. The graphs and related values represent traffic passing through the misconfigured servers during a period of time. It is apparent that the majority of the traffic being pushed through the misconfigured DNS servers is being used for DrDoS attack campaigns.
Figure14:Time-lapsegraphsofmisconfiguredDNSserversbeingutilizedforDrDoSdenialofserviceattacks
Attack impact
The immediate and successful application of DDoS mitigation rules by the Prolexic security operations engineers resulted in the incoming 167-Gbps attack having no significant impact to the operations of the customer.
Mitigation strategies
Prolexic has global signatures and rules in place to identify and disrupt many types of DNS reflection attacks for its customers.

18Prolexic Quarterly Global DDoS Attack Report - Q2 2013
DDoS-as-a-Service
This DNS reflection attack indicates that the attackers were most likely making use of a DDoS-as-a-Service stresser or booter suite with root/system-level access. Root/system-level access is usually required to spoof source IP addresses. These types of services typically offer an array of attack types, with DNS reflection attacks being the most common default option.
DDoS-as-a-Service merchants are becoming more widely available since the technological barrier to entry has been significantly lowered. Premade crime ware kits that specialize in making use of compromised web servers for DDoS attacks are leaking into the public realm at a rapid pace, and numerous malicious actors are making use of this publicly circulating code to create their own attack kits and services.
Figure 15 is a screenshot of an advertisement on a forum for a DDoS-as-a-Service provider. These providers are known as stressers.
DDoS-as-a-Service stressers
The rise in availability of DDoS-as-a-Service stressers can be correlated to recent infighting among malicious actors in underground hacking communities. Malicious actors will often have inter-forum rivalries, resulting in the business services of forum members coming under attack by rival hackers. Oftentimes, the coding practices and server configurations of stresser websites are vulnerable to attack. A successful breach of a stresser website often leads to the public leak of the stresser PHP source code, related booter shells, and SQL database schema. The availability of multiple leaked stresser suites has lowered the barrier of entry for malicious actors seeking to create a business out of launching DDoS attacks. Often, stresser administrators will attempt to evade the ISP’s terms of service and law enforcement investigations by advertising themselves as legitimate stress-testing services to be used only with the permission of the target. The trend of leaked crime ware suites will continue to pose an ongoing threat to legitimate enterprises as the resources to launch powerful DDoS attacks become more readily available and easier to implement.
Figure15:ExampleofDDoS-as-a-Servicestresser

19Prolexic Quarterly Global DDoS Attack Report - Q2 2013
Resources
• PLXsert Distributed Reflection Denial of Service (DrDoS) Whitepaper http://www.prolexic.com/drdos
• US-CERT Advisory TA13-088A – DNS Amplification Attacks https://www.us-cert.gov/ncas/alerts/TA13-088A
Looking Forward
This quarter, a watershed 200-Gbps DDoS attack was not generated – though the 167-Gbps attack Prolexic mitigated was extremely large. It is no coincidence that this attack used the reflective attack method. Criminals seek to maximize their efforts and amplification will be a vector to be exploited in the coming months.
In Q2 2013, vulnerabilities that are more than 10 years old were combined with new tools and services to generate sizeable denial of service attacks. To break this cycle, software vendors should examine how they develop applications that might be employed by attackers, and the security community must try to determine which applications are responding with greater byte sizes than their incoming queries and are susceptible to spoofing. IT organizations and associated network operators also can do more to identify and patch known security holes that lead to comprised servers.
Public certificates for signing DNS requests were not used this quarter, but as DNSSEC becomes more popular, the continuing use of UDP is not going to be an acceptable method of transport in its current implementation. This is not the only issue that leads to DrDoS attacks though; NTP, CHARGEN and SNMP are also a continuing problem when security controls are not put in place.
Prolexic recommends that system administrator properly secure their machines when placing them on the Internet and the security community to alert potential victims of misconfigured servers to help protect others.

©2013ProlexicTechnologies,Inc.Allrightsreserved.v.071313
About Prolexic Security Engineering & Response Team (PLXsert)
PLXsert monitors malicious cyber threats globally and analyzes DDoS attacks using proprietary techniques and equipment. Through digital forensics and post-attack analysis, PLXsert is able to build a global view of DDoS attacks, which is shared with customers and the security community. By identifying the sources and associated attributes of individual attacks, the PLXsert team helps organizations adopt best practices and make more informed, proactive decisions about DDoS threats.
About Prolexic
Prolexic Technologies is the world’s largest, most trusted distributed denial of service (DDoS) protection and mitigation service provider. Able to absorb the largest and most complex DDoS attacks ever launched, Prolexic protects and restores within minutes mission-critical Internet-facing infrastructures for global enterprises and government agencies. Ten of the world’s largest banks and the leading companies in e-Commerce, SaaS, payment processing, travel, hospitality, gaming and other industries at risk for DDoS attacks rely on Prolexic for DDoS protection. Founded in 2003 as the world’s first in-the-cloud DDoS mitigation platform, Prolexic is headquartered in Hollywood, Florida, and has DDoS scrubbing centers located in the Americas, Europe and Asia. To learn more about how Prolexic can stop DDoS attacks and protect your business, please visit www.prolexic.com, call +1 (954) 620 6002 or follow @Prolexic on Twitter.