projections of education statistics to 2021, fortieth edition
TRANSCRIPT
Projections of Education Statistics to 2021Fortieth Edition
20172017 20192019 202120212020202020182018
NCES 2013-008 U.S . DEPARTMENT OF EDUCATION


Projections of Education Statistics to 2021Fortieth Edition
JANUARY 2013
William J. HussarNational Center for Education Statistics
Tabitha M. BaileyIHS Global Insight
NCES 2013-008
U.S. DEPARTMENT OF EDUCATION

U.S. Department of Education Arne Duncan Secretary
Institute of Education Sciences John Q. Easton Director
National Center for Education Statistics Jack Buckley Commissioner
The National Center for Education Statistics (NCES) is the primary federal entity for collecting, analyzing, and reporting data related to education in the United States and other nations. It fulfills a congressional mandate to collect, collate, analyze, and report full and complete statistics on the condition of education in the United States; conduct and publish reports and specialized analyses of the meaning and significance of such statistics; assist state and local education agencies in improving their statistical systems; and review and report on education activities in foreign countries.
NCES activities are designed to address high-priority education data needs; provide consistent, reliable, complete, and accurate indicators of education status and trends; and report timely, useful, and high-quality data to the U.S. Department of Education, the Congress, the states, other education policymakers, practitioners, data users, and the general public. Unless specifically noted, all information contained herein is in the public domain.
We strive to make our products available in a variety of formats and in language that is appropriate to a variety of audiences. You, as our customer, are the best judge of our success in communicating information effectively. If you have any comments or suggestions about this or any other NCES product or report, we would like to hear from you. Please direct your comments to
NCES, IES, U.S. Department of Education 1990 K Street NW Washington, DC 20006-5651
January 2013
The NCES Home Page address is http://nces.ed.gov. The NCES Publications and Products address is http://nces.ed.gov/pubsearch.
This report was prepared in part under Contract No. ED-08-DO-0087 with IHS Global Insight. Mention of trade names, commercial products, or organizations does not imply endorsement by the U.S. Government.
Suggested CitationHussar, W.J., and Bailey, T.M. (2013). Projections of Education Statistics to 2021 (NCES 2013-008). U.S. Department of Education, National Center for Education Statistics. Washington, DC: U.S. Government Printing Office.
For ordering information on this report, write to
ED Pubs, U.S. Department of Education P.O. Box 22207 Alexandria, VA 22304
or call toll free 1-877-4ED-PUBS or order online at http://www.edpubs.gov.
Content Contact William J. Hussar (202) 502-7359 [email protected]

Projections of Education Statistics to 2021 iii
Foreword
Appendix A of this report outlines the projection methodology and describes the models and assumptions used to develop the national and state projections. The enrollment models use enrollment data and population estimates and projections from NCES and the U.S. Census Bureau. The models are based on the mathematical projection of past data patterns into the future. The models also use projections of economic variables from IHS Global Insight, an economic forecasting service.
The projections presented in this report are based on the 2000 census and assumptions for the fertility rate, internal migration, net immigration, and mortality rate from the Census Bureau. For further information, see appendix A.
Chris Chapman, Acting Associate Commissioner Early Childhood, International, and Crosscutting Studies Division
Projections of Education Statistics to 2021 is the 40th report in a series begun in 1964. It includes statistics on elementary and secondary schools and postsecondary degree-granting institutions. This report provides revisions of projections shown in Projections of Education Statistics to 2020 and projections of enrollment, graduates, teachers, and expenditures to the year 2021.
In addition to projections at the national level, the report includes projections of public elementary and secondary school enrollment and public high school graduates to the year 2021 at the state level. The projections in this report were produced by the National Center for Education Statistics (NCES) to provide researchers, policy analysts, and others with state-level projections developed using a consistent methodology. They are not intended to supplant detailed projections prepared for individual states.
Assumptions regarding the population and the economy are the key factors underlying the projections of education statistics. NCES projections do not reflect changes in national, state, or local education policies that may affect education statistics.

This page intentionally left blank.

Projections of Education Statistics to 2021 v
Contents
Page
Foreword ............................................................................................................................................................................... iiiList of Tables ........................................................................................................................................................................ viiList of Figures ........................................................................................................................................................................ xi
About This Report .................................................................................................................................................................. 1Projections .................................................................................................................................................................... 1Limitations of Projections ............................................................................................................................................. 1
Section 1. Elementary and Secondary Enrollment .........................................................................................................3Introduction .................................................................................................................................................................. 3Accuracy of Projections .................................................................................................................................................. 3National ........................................................................................................................................................................ 4State and Regional (Public School Data) ........................................................................................................................ 6
Section 2. High School Graduates ...................................................................................................................................7Introduction .................................................................................................................................................................. 7Accuracy of Projections .................................................................................................................................................. 7National ........................................................................................................................................................................ 8State and Regional (Public School Data) ...................................................................................................................... 10
Section 3. Elementary and Secondary Teachers .............................................................................................................11Introduction ................................................................................................................................................................ 11Accuracy of Projections ................................................................................................................................................ 11Teachers in Elementary and Secondary Schools ........................................................................................................... 12
Section 4. Expenditures for Public Elementary and Secondary Education ....................................................................15Introduction ................................................................................................................................................................ 15Accuracy of Projections ................................................................................................................................................ 15Current Expenditures .................................................................................................................................................. 16
Section 5. Enrollment in Postsecondary Degree-Granting Institutions .........................................................................19Introduction ................................................................................................................................................................ 19Accuracy of Projections ................................................................................................................................................ 19Total Enrollment ......................................................................................................................................................... 20Enrollment by Selected Characteristics and Control
of Institution ......................................................................................................................................................... 21First-Time Freshmen Enrollment ................................................................................................................................ 24

vi Contents
Page
Section 6. Postsecondary Degrees Conferred ................................................................................................................25Introduction ................................................................................................................................................................ 25Accuracy of Projections ................................................................................................................................................ 25Degrees, by Level of Degree and Sex of Recipient ........................................................................................................ 26
Reference Tables ............................................................................................................................................................29
Technical Appendixes ....................................................................................................................................................79Appendix A. Introduction to Projection Methodology .................................................................................................80
A.0. Introduction to Projection Methodology .............................................................................................................. 80A.1. Elementary and Secondary Enrollment ................................................................................................................ 87A.2. High School Graduates ...................................................................................................................................... 100A.3. Elementary and Secondary Teachers ................................................................................................................... 106A.4. Expenditures for Public Elementary and Secondary Education ........................................................................... 114A.5. Enrollment in Postsecondary Degree-Granting Institutions ................................................................................ 118A.6. Postsecondary Degrees Conferred....................................................................................................................... 137
Appendix B. Supplementary Tables ............................................................................................................................141Appendix C. Data Sources ..........................................................................................................................................149Appendix D. References ..............................................................................................................................................157Appendix E. List of Abbreviations ..............................................................................................................................159Appendix F. Glossary ..................................................................................................................................................161
Projections of Education Statistics to 2021 vii
List of Tables
Table Page
1. Actual and projected numbers for enrollment in grades PK–12, PK–8, and 9–12 in elementary and secondary schools, by control of school: Fall 1996 through fall 2021 .................................................................... 31
2. Actual and projected numbers for enrollment in public elementary and secondary schools, by grade: Fall 1996 through fall 2021................................................................................................................................... 32
3. Actual and projected numbers for enrollment in public elementary and secondary schools, by race/ethnicity: Fall 1996 through fall 2021 ........................................................................................................... 34
4. Actual and projected numbers for enrollment in grades PK–8 in public schools, by race/ethnicity: Fall 1996 through fall 2021 ......................................................................................................................................... 35
5. Actual and projected numbers for enrollment in grades 9–12 in public schools, by race/ethnicity: Fall 1996 through fall 2021 ......................................................................................................................................... 36
6. Actual and projected numbers for enrollment in grades PK–12 in public elementary and secondary schools, by region and state: Fall 2003 through fall 2021 ................................................................................................... 38
7. Actual and projected percentage changes in grades PK–12 enrollment in public elementary and secondary schools, by region and state: Fall 2003 through fall 2021 ...................................................................................... 40
8. Actual and projected numbers for enrollment in grades PK–8 in public schools, by region and state: Fall 2003 through fall 2021 ......................................................................................................................................... 42
9. Actual and projected percentage changes in grades PK–8 enrollment in public schools, by region and state: Fall 2003 through fall 2021................................................................................................................................... 44
10. Actual and projected numbers for enrollment in grades 9–12 in public schools, by region and state: Fall 2003 through fall 2021 ......................................................................................................................................... 46
11. Actual and projected percentage changes in grades 9–12 enrollment in public schools, by region and state: Fall 2003 through fall 2021 .......................................................................................................................... 48
12. Actual and projected numbers for high school graduates, by control of school: School years 1996–97 through 2021–22 .................................................................................................................................................. 49
13. Actual and projected numbers for public high school graduates, by race/ethnicity: School years 1996–97 through 2021–22 .................................................................................................................................................. 50
14. Actual and projected numbers for public high school graduates, by region and state: School years 2003–04 through 2021–22 .................................................................................................................................................. 52
15. Actual and projected percentage changes in public high school graduates, by region and state: School years 2003–04 through 2021–22 ................................................................................................................................... 54
16. Actual and projected numbers for elementary and secondary teachers and elementary and secondary new teacher hires, by control of school: Fall 1996 through fall 2021............................................................................. 55
17. Actual and projected numbers for the pupil/teacher ratios in elementary and secondary schools, by control of school: Fall 1996 through fall 2021 ................................................................................................................... 56
18. Actual and projected numbers for current expenditures and current expenditures per pupil in fall enrollment for public elementary and secondary education: School years 1996–97 through 2021–22 .................. 57
19. Actual and projected numbers for current expenditures and current expenditures per pupil in average daily attendance (ADA) for public elementary and secondary education: School years 1996–97 through 2021–22 ....... 58
20. Actual and projected numbers for total enrollment in all postsecondary degree-granting institutions, by sex, attendance status, and control of institution: Fall 1996 through fall 2021 ............................................................. 59

viii List of Tables
Table Page
21. Actual and projected numbers for total enrollment in all postsecondary degree-granting institutions, by age group, sex, and attendance status: Fall 1996 through fall 2021 ........................................................................ 60
22. Actual and projected numbers for enrollment in all postsecondary degree-granting institutions, by sex and attendance status: Fall 1996 through fall 2021 ...................................................................................................... 64
23. Actual and projected numbers for enrollment in public 4-year postsecondary degree-granting institutions, by sex and attendance status: Fall 1996 through fall 2021 ..................................................................................... 65
24. Actual and projected numbers for enrollment in public 2-year postsecondary degree-granting institutions, by sex and attendance status: Fall 1996 through fall 2021 ..................................................................................... 66
25. Actual and projected numbers for enrollment in private 4-year postsecondary degree-granting institutions, by sex and attendance status: Fall 1996 through fall 2021 ..................................................................................... 67
26. Actual and projected numbers for enrollment in private 2-year postsecondary degree-granting institutions, by sex and attendance status: Fall 1996 through fall 2021 ..................................................................................... 68
27. Actual and projected numbers for undergraduate enrollment in all postsecondary degree-granting institutions, by sex, attendance status, and control of institution: Fall 1996 through fall 2021 .............................. 69
28. Actual and projected numbers for postbaccalaureate enrollment in all postsecondary degree-granting institutions, by sex, attendance status, and control of institution: Fall 1996 through fall 2021 .............................. 70
29. Actual and projected numbers for enrollment of U.S. residents in all postsecondary degree-granting institutions, by race/ethnicity: Fall 1996 through fall 2021 ................................................................................... 71
30. Actual and projected numbers for first-time freshmen fall enrollment in all postsecondary degree-granting institutions, by sex: Fall 1996 through fall 2021 .................................................................................................... 72
31. Actual and projected numbers for full-time-equivalent enrollment in all postsecondary degree-granting institutions, by control and level of institution: Fall 1996 through fall 2021 ......................................................... 73
32. Actual and projected numbers for associate’s degrees conferred by postsecondary degree-granting institutions, by sex of recipient: 1996–97 through 2021–22 ................................................................................. 74
33. Actual and projected numbers for bachelor’s degrees conferred by postsecondary degree-granting institutions, by sex of recipient: 1996–97 through 2021–22 ................................................................................. 75
34. Actual and projected numbers for master’s degrees conferred by postsecondary degree-granting institutions, by sex of recipient: 1996–97 through 2021–22 ................................................................................. 76
35. Actual and projected numbers for doctor’s degrees conferred by postsecondary degree-granting institutions, by sex of recipient: 1996–97 through 2021–22 ................................................................................. 77
Text TablesA. Mean absolute percentage errors (MAPEs) of enrollment projections, by lead time, control of school,
and grade in elementary and secondary schools: 2012 ........................................................................................... 90B. Mean absolute percentage errors (MAPEs) of projections of high school graduates, by lead time and
control of school: 2012 ....................................................................................................................................... 101C. Mean absolute percentage errors (MAPEs) of projections of number of public elementary and secondary
teachers, by lead time: 2012 ................................................................................................................................ 109D. Mean absolute percentage errors (MAPEs) of projections for total and per pupil current expenditures for
public elementary and secondary education, by lead time: 2012 ......................................................................... 116E. Mean absolute percentage errors (MAPEs) of projected enrollment in postsecondary degree-granting
institutions, by lead time, sex, and level of institution: 2012 ............................................................................... 121F. Mean absolute percentage errors (MAPEs) of projected enrollment in postsecondary degree-granting
insitutions, by lead time and race/ethnicity: 2012 ............................................................................................... 123
Projections of Education Statistics to 2021 ix
Table Page
Appendix A. Introduction to Projection MethodologyA-1. Summary of forecast assumptions to 2021 ............................................................................................................ 84A-2. Mean absolute percentage errors (MAPEs), by lead time for selected statistics in all elementary and
secondary schools and postsecondary degree-granting institutions: 2012 ............................................................... 85A-3. Example of constructing mean absolute percentage errors, part 1 .......................................................................... 86A-4. Example of constructing mean absolute percentage errors, part 2 .......................................................................... 86A-5. Actual and projected national public school grade progression rates: Fall 2010, and fall 2011 through
fall 2021................................................................................................................................................................ 93A-6. Actual and projected national enrollment rates in public schools, by grade level: Fall 2010, and fall 2011
through fall 2021 .................................................................................................................................................. 93A-7. Mean absolute percentage errors (MAPEs) for projected prekindergarten–12 enrollment in public
elementary and secondary schools, by lead time, region, and state: 2012 ............................................................... 94A-8. Mean absolute percentage errors (MAPEs) for projected prekindergarten–8 enrollment in public
elementary and secondary schools, by lead time, region, and state: 2012 ............................................................... 96A-9. Mean absolute percentage errors (MAPEs) for projected grades 9–12 enrollment in public schools, by
lead time, region, and state: 2012 .......................................................................................................................... 98A-10. Mean absolute percentage errors (MAPEs) for the projected number of high school graduates in public
schools, by lead time, region, and state: 2012 ...................................................................................................... 104A-11. Estimated equations and model statistics for public elementary and secondary teachers ...................................... 111 A-12. Percentage distribution of full-time and part-time school teachers, by age, control of school, and
teaching status: School year 2007–08 .................................................................................................................. 112 A-13. Percentage distribution of full-time and part-time newly hired teachers, by age and control of school:
Selected school years, 1987–88 through 2007–08 ............................................................................................... 112A-14. Actual and projected continuation rates of full-time and part-time school teachers, by age and control
of school: Selected school years, 1993–94 to 1994–95 through 2021–22 to 2022–23 ......................................... 113A-15. Estimated equations and model statistics for current expenditures per pupil in fall enrollment for
public elementary and secondary schools, and education revenue from state sources per capita ........................... 117A-16. Actual and projected numbers for enrollment rates of all students at postsecondary degree-granting
institutions, by sex, attendance status, and age: Fall 2010, fall 2016, and fall 2021 ............................................. 124A-17. Estimated equations and model statistics for full-time and part-time enrollment rates of men at
postsecondary degree-granting institutions .......................................................................................................... 125A-18. Estimated equations and model statistics for full-time and part-time enrollment rates of women at
postsecondary degree-granting institutions .......................................................................................................... 126A-19. Actual and projected percentages of full-time students at postsecondary degree-granting institutions,
by sex, age group, student level, and level of institution: Fall 2010, and fall 2011 through fall 2021 ................... 127A-20. Actual and projected percentages of part-time students at postsecondary degree-granting institutions,
by sex, age group, student level, and level of institution: Fall 2010, and fall 2011 through fall 2021 ................... 128A-21. Actual and projected enrollment in public postsecondary degree-granting institutions as a percent of total
postsecondary enrollment, by sex, attendance status, student level, and level of institution: Fall 2010, and fall 2011 through fall 2021 ................................................................................................................................. 128
A-22. Estimated equations and model statistics for full-time and part-time enrollment rates of White men at postsecondary degree-granting institutions .......................................................................................................... 129
A-23. Estimated equations and model statistics for full-time and part-time enrollment rates of White women at postsecondary degree-granting institutions .......................................................................................................... 130
A-24. Estimated equations and model statistics for full-time and part-time enrollment rates of Black men at postsecondary degree-granting institutions .......................................................................................................... 131
A-25. Estimated equations and model statistics for full-time and part-time enrollment rates of Black women at postsecondary degree-granting institutions .......................................................................................................... 132

x List of Tables
Table Page
A-26. Estimated equations and model statistics for full-time and part-time enrollment rates of Hispanic men at postsecondary degree-granting institutions .......................................................................................................... 133
A-27. Estimated equations and model statistics for full-time and part-time enrollment rates of Hispanic women at postsecondary degree-granting institutions .......................................................................................................... 134
A-28. Estimated equations and model statistics for full-time and part-time enrollment rates of Asian/Pacific Islander men at postsecondary degree-granting institutions .............................................................................................. 135
A-29. Estimated equations and model statistics for full-time and part-time enrollment rates of Asian/Pacific Islander women at postsecondary degree-granting institutions .......................................................................................... 136
A-30. Estimated equations and model statistics for degrees conferred, by degree level and sex ....................................... 139
Appendix B. Supplementary TablesB-1. Annual number of births: 1946 through 2010 .................................................................................................... 142B-2. Actual and projected prekindergarten- and kindergarten-age populations, by age: 1996 through 2021 ............... 143B-3. Actual and projected school-age populations, by selected ages: 1996 through 2021 ............................................ 144B-4. Actual and projected college-age populations, by selected ages: 1996 through 2021 ............................................ 145B-5. Actual and projected fall enrollment in public elementary and secondary schools, change in
fall enrollment from previous year, resident population, and fall enrollment as a ratio of the population: School years 1996–97 through 2021–22 ............................................................................................................ 146
B-6. Actual and projected macroeconomic measures of the economy: School years 1996–97 through 2021–22 ......... 147
Projections of Education Statistics to 2021 xi
List of Figures
Figure Page
1. Actual and projected numbers for enrollment in elementary and secondary schools, by grade level: Fall 1996 through fall 2021..................................................................................................................................... 4
2. Actual and projected numbers for enrollment in elementary and secondary schools, by control of school: Fall 1996 through fall 2021..................................................................................................................................... 5
3. Actual and projected numbers for enrollment in public elementary and secondary schools, by race/ethnicity: Fall 1996 through fall 2021..................................................................................................................................... 5
4. Projected percentage change in enrollment in public elementary and secondary schools, by state: Fall 2010 through fall 2021 .................................................................................................................................................... 6
5. Actual and projected numbers for enrollment in public elementary and secondary schools, by region: Fall 2003, fall 2010, and fall 2021 .......................................................................................................................... 6
6. Actual and projected numbers for high school graduates, by control of school: School years 1996–97 through 2021–22 .................................................................................................................................................... 8
7. Actual and projected numbers for public high school graduates, by race/ethnicity: School years 1996–97 through 2021–22 .................................................................................................................................................... 9
8. Projected percentage change in the number of public high school graduates, by state: School years 2008–09 through 2021–22 .................................................................................................................................................. 10
9. Actual and projected numbers for public high school graduates, by region: School years 2003–04, 2008–09, and 2021–22......................................................................................................................................................... 10
10. Actual and projected numbers for elementary and secondary teachers, by control of school: Fall 1996 through fall 2021 .................................................................................................................................................. 12
11. Actual and projected numbers for the pupil/teacher ratios in elementary and secondary schools, by control of school: Fall 1996 through fall 2021 ................................................................................................................... 13
12. Actual and projected numbers for elementary and secondary new teacher hires, by control of school: Fall 1999, fall 2010, and fall 2021 ............................................................................................................................... 13
13. Actual and projected current expenditures for public elementary and secondary schools (in constant 2010–11 dollars): School years 1996–97 through 2021–22 ................................................................................................... 16
14. Actual and projected current expenditures per pupil in fall enrollment in public elementary and secondary schools (in constant 2010–11 dollars): School years 1996–97 through 2021–22 ................................................... 17
15. Actual and projected population numbers for 18- to 24-year-olds and 25- to 29-year-olds: 1996 through 2021 ....... 1916. Actual and projected numbers for total enrollment in all postsecondary degree-granting institutions: Fall 1996
through fall 2021 ................................................................................................................................................... 2017. Actual and projected numbers for enrollment in all postsecondary degree-granting institutions, by age
group: Fall 1996, fall 2010, and fall 2021 ............................................................................................................. 2118. Actual and projected numbers for enrollment in all postsecondary degree-granting institutions, by sex: Fall
1996 through fall 2021 ......................................................................................................................................... 2119. Actual and projected numbers for enrollment in all postsecondary degree-granting institutions, by attendance
status: Fall 1996 through fall 2021 ........................................................................................................................ 2220. Actual and projected numbers for undergraduate and postbaccalaureate enrollment in all postsecondary
degree-granting institutions: Fall 1996 through fall 2021 ...................................................................................... 22

xii List of Figures
Figure Page
21. Actual and projected numbers for enrollment of U.S. residents in all postsecondary degree-granting institutions, by race/ethnicity: Fall 1996 through fall 2021 ................................................................................... 23
22. Actual and projected numbers for enrollment in all postsecondary degree-granting institutions, by control of institution: Fall 1996 through fall 2021 ............................................................................................................ 23
23. Actual and projected numbers for total first-time freshmen fall enrollment in all postsecondary degree- granting institutions, by sex: Fall 1996 through fall 2021 ...................................................................................... 24
24. Actual and projected numbers for associate’s degrees conferred by postsecondary degree-granting institutions, by sex of recipient: Academic years 1996–97 through 2021–22 ............................................................................ 26
25. Actual and projected numbers for bachelor’s degrees conferred by postsecondary degree-granting institutions, by sex of recipient: Academic years 1996–97 through 2021–22 ............................................................................ 26
26. Actual and projected numbers for master’s degrees conferred by postsecondary degree-granting institutions, by sex of recipient: Academic years 1996–97 through 2021–22 ............................................................................ 27
27. Actual and projected numbers for doctor’s degrees conferred by postsecondary degree-granting institutions, by sex of recipient: Academic years 1996–97 through 2021–22 ............................................................................ 27
Projections of Education Statistics to 2021 1
About This Report
PROJECTIONS This edition of Projections of Education Statistics provides projections for key education statistics, including enrollment, graduates, teachers, and expenditures in elementary and secondary public and private schools, as well as enrollment and degrees conferred at postsecondary degree-granting institutions. Included are national data on enrollment and graduates for the past 15 years and projections to the year 2021. Also included are state-level data on enrollment in public elementary and secondary schools and public high schools from 2003, with projections to 2021. This report is organized by the level of schooling with sections 1, 2, 3, and 4 covering aspects of elementary and secondary education and sections 5 and 6 covering aspects of postsecondary education.
There are a number of limitations in projecting some statistics. First, state-level data on enrollment and graduates in private elementary and secondary schools and on enrollment and degrees conferred in postsecondary degree-granting institutions are not included. Neither the actual numbers nor the projections of public and private elementary and secondary school enrollment include homeschooled students because more data are required to develop reliable projections.
Similar methodologies were used to obtain a uniform set of projections for each of the 50 states and the District of Columbia. These projections are further adjusted to agree with the national projections of public elementary and secondary school enrollment and public high school graduates contained in this report.
The summary of projections provides highlights of the national and state data, while the reference tables and figures present more detail. All calculations within Projections of Education Statistics are based on unrounded estimates. Therefore, the reader may find that a calculation, such as a difference or percentage change, cited in the text or figure may not be identical to the calculation obtained by using the rounded values shown in the accompanying tables.
Appendix A describes the methodology and assumptions used to develop the projections; appendix B presents supplementary tables; appendix C describes data sources; appendix D is a list of the references; appendix E presents a list of abbreviations; and appendix F is a glossary of terms.
LIMITATIONS OF PROJECTIONS Projections of a time series usually differ from the final reported data due to errors from many sources, such as the properties of the projection methodologies, which depend on the validity of many assumptions.
The mean absolute percentage error is one way to express the forecast accuracy of past projections. This measure expresses the average of the absolute values of errors in percentage terms, where errors are the differences between past projections and actual data. For example, based on past editions of Projections of Education Statistics, the mean absolute percentage errors of public school enrollment in grades prekindergarten–12 for lead times of 1, 2, 5, and 10 years were 0.3, 0.6, 1.3, and 2.6 percent, respectively. In contrast, mean absolute percentage errors of private school enrollment in grades prekindergarten through 8 for lead times of 1, 2, 5, and 10 years were 3.5, 4.9, 9.2, and 7.9 percent, respectively. For more information on mean absolute percentage errors, see table A-2 in appendix A.

This page intentionally left blank.

Projections of Education Statistics to 2021 3
Section 1Elementary and
Secondary Enrollment
INTRODUCTIONTotal public and private elementary and secondary school enrollment was 55 million in fall 2010, representing a 6 percent increase since fall 1996 (table 1). Between fall 2010, the last year of actual public school data, and fall 2021, a further increase of 7 percent is expected. Public school enrollment is projected to be higher in 2021 than in 2010 while private school enrollment is projected to be lower. Public school enrollments are projected to be higher in 2021 than in 2010 for Blacks, Hispanics, Asian/Pacific Islanders, American Indians/Alaska Natives, and students of two or more races, and enrollment is projected to be lower for Whites (table 3). Increases in public school enrollment are expected in the Northeast, Midwest, South, and West (table 6).
Factors affecting the projectionsThe grade progression rate method was used to project school enrollments. This method assumes that future trends in factors affecting enrollments will be consistent with past patterns. It implicitly includes the net effect of factors such as dropouts, deaths, nonpromotion, transfers to and from public schools, and, at the state level, migration. See appendixes A.0 and A.1 for more details.
Factors that were not consideredThe projections do not assume changes in policies or attitudes that may affect enrollment levels. For example, they do not account for changing state and local policies on prekindergarten (PK) and kindergarten programs. Continued expansion of these programs could lead to higher enrollments at the elementary school level. Projections also exclude the number of students who are homeschooled because more data are needed.
Students of two or more racesThis is the first edition of Projections of Education Statistics to include actual and projected numbers for enrollment in public elementary and secondary school for students of two or more races. Actual numbers for this racial/ethnic group begin in 2008. The 2008, 2009, and 2010 actual values and all the projected values for enrollments of the other racial/ethnic groups are lower than they would have been if this racial/ethnic category had not been added.
Accuracy of ProjectionsAn analysis of projection errors from the past 28 editions of Projections of Education Statistics indicates that the mean absolute percentage errors (MAPEs) for lead times of 1, 2, 5, and 10 years out for projections of public school enrollment in grades PK–12 were 0.3, 0.6, 1.3, and 2.6 percent, respectively. For the 1-year-out prediction, this means that the methodol-ogy used by the National Center for Education Statistics (NCES) has produced projections that have, on average, deviated from actual observed values by 0.3 percent. For projections of public school enrollment in grades PK–8, the MAPEs for lead times of 1, 2, 5, and 10 years out were 0.3, 0.6, 1.4, and 3.3 percent, respectively, while the MAPEs for projections of public school enrollment in grades 9–12 were 0.4, 0.7, 1.2, and 2.5 percent, respectively, for the same lead times. An analysis of pro-jection errors from the past ten editions of Projections of Education Statistics indicates that the mean absolute percentage errors (MAPEs) for lead times of 1, 2, 5, and 10 years out for projections of private school enrollment in grades PK–12 were 3.4, 4.6, 7.7, and 6.3 percent, respectively. For projections of private school enrollment in grades PK–8, the MAPEs for lead times of 1, 2, 5, and 10 years out were 3.5, 4.9, 9.2, and 7.9 percent, respectively, while the MAPEs for projections of private school enrollment in grades 9–12 were 3.0, 3.8, 2.8, and 1.3 percent, respectively, for the same lead times. For more information, see table A-2 in appendix A.

4 Section 1. Elementary and Secondary Enrollment
NATIONAL
Total elementary and secondary enrollment
S
S
increased 6 percent between 1996 and 2010; andis projected to increase 7 percent between 2010 and 2021.
Enrollment in prekindergarten through grade 8
S
S
increased 3 percent between 1996 and 2010; andis projected to increase 8 percent between 2010 and 2021.
Enrollment in grades 9–12
S
S
increased 15 percent between 1996 and 2010; andis projected to increase 3 percent between 2010 and 2021.
For more information: Tables 1 and 2
Figure 1. Actual and projected numbers for enrollment in elementary and secondary schools, by grade level: Fall 1996 through fall 2021
1996 2001 2006 2011 2016 20210
10
20
30
40
50
60
70
80Millions
Year
Grades PK–12
Projected
Grades PK–8
Grades 9–12
NOTE: PK = prekindergarten. Enrollment numbers for prekindergarten through 12th grade and prekindergarten through 8th grade include private nursery and prekindergarten enrollment in schools that offer kindergarten or higher grades. Since the biennial Private School Universe Survey (PSS) is collected in the fall of odd-numbered years, private school numbers for alternate years are estimated based on data from the PSS. Some data have been revised from previously published figures. Mean absolute percentage errors of selected education statistics can be found in table A-2, appendix A. SOURCE: U.S. Department of Education, National Center for Education Statistics, Common Core of Data (CCD), “State Nonfiscal Survey of Public Elementary/Secondary Education,” 1996–97 through 2010–11; Private School Universe Survey (PSS), selected years 1997–98 through 2009–10; and National Elementary and Secondary Enrollment Model, 1972–2010. (This figure was prepared February 2012.)

Projections of Education Statistics to 2021 5
Figure 2. Actual and projected numbers for enrollment in elementary and secondary schools, by control of school: Fall 1996 through fall 2021
Public
Projected
Private
1996 2001 2006 2011 2016 20210
10
20
30
40
50
60
70
80Millions
Year
NOTE: Private school numbers include private nursery and prekindergarten enrollment in schools that offer kindergarten or higher grades. Since the biennial Private School Universe Survey (PSS) is collected in the fall of odd-numbered years, private school numbers for alternate years are estimated based on data from the PSS. Some data have been revised from previously published figures. Mean absolute percentage errors of selected education statistics can be found in table A-2, appendix A. SOURCE: U.S. Department of Education, National Center for Education Statistics, Common Core of Data (CCD), “State Nonfiscal Survey of Public Elementary/Secondary Education,” 1997–98 through 2010–11; Private School Universe Survey (PSS), selected years 1997–98 through 2009–10; and National Elementary and Secondary Enrollment Model, 1972–2010. (This figure was prepared February 2012.)
Enrollment by control of schoolEnrollment in public elementary and secondary schools
S
S
increased 8 percent between 1996 and 2010; and is projected to increase 7 percent between 2010 and 2021.
Enrollment in private elementary and secondary schools
T
T
decreased 9 percent between 1996 and 2010; and is projected to be 1 percent lower in 2021 than in 2010.
T
S
S
S
S
S
For more information: Table 1
Figure 3. Actual and projected numbers for enrollment in public elementary and secondary schools, by race/ethnicity: Fall 1996 through fall 2021
1996 2001 2006 2011Year
2016 20210
10
20
30
40
50
60
70
80Millions
White
Projected
American Indian/Alaska NativeBlack
Hispanic Asian/Pacific Islander
NOTE: The historical racial/ethnic time-series were constructed using racial/ethnic enrollment data at the state level for individual grades. In some instances, enrollment data by race/ethnicity had to be imputed. Further, in some instances, the racial/ethnic enrollment data for individual grades had to be adjusted to the state total for that grade. For additional information see the Elementary and Secondary Enrollment section A.1 in appendix A. Race categories exclude persons of Hispanic ethnicity. Mean absolute percentage errors of selected education statistics can be found in table A-2, appendix A. Some data have been revised from previously published figures. SOURCE: U.S. Department of Education, National Center for Education Statistics, Common Core of Data (CCD), “State Nonfiscal Survey of Public Elementary/Secondary Education,” 1996–97 through 2010–11; and National Public Elementary and Secondary Enrollment by Race/Ethnicity Model, 1994–2010. (This figure was prepared February 2012.)
Enrollment by race/ethnicityBetween 2010 and 2021, enrollment in public elementary and secondary schools is projected to
decrease 2 percent for students who are White;increase 5 percent for students who are Black; increase 24 percent for students who are Hispanic;increase 26 percent for students who are Asian/Pacific Islander;increase 16 percent for students who are American Indian/Alaska Native; andincrease 34 percent for students who are two or more races. (This racial/ethnic group was not included in figure 3, due to its size in comparison to the other groups.)
For more information: Tables 3, 4, and 5
6 Section 1. Elementary and Secondary Enrollment
STATE AND REGIONAL (PUBLIC SCHOOL DATA)
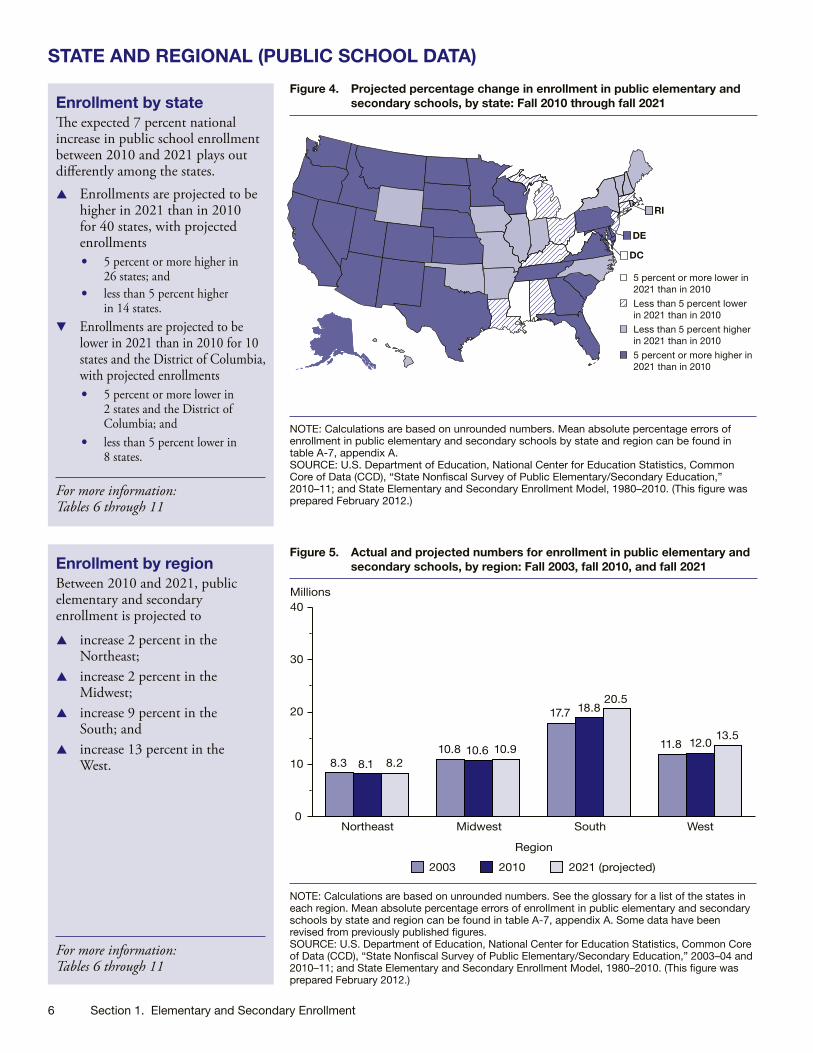
Enrollment by stateThe expected 7 percent national increase in public school enrollment between 2010 and 2021 plays out differently among the states.
S
T
Enrollments are projected to be higher in 2021 than in 2010 for 40 states, with projected enrollments•
•
5 percent or more higher in 26 states; and less than 5 percent higher in 14 states.
Enrollments are projected to be lower in 2021 than in 2010 for 10 states and the District of Columbia, with projected enrollments •
•
5 percent or more lower in 2 states and the District of Columbia; andless than 5 percent lower in 8 states.
Figure 4. Projected percentage change in enrollment in public elementary and secondary schools, by state: Fall 2010 through fall 2021
RI
DE
DC
Less than 5 percent higher in 2021 than in 2010
5 percent or more higher in 2021 than in 2010
5 percent or more lower in2021 than in 2010
Less than 5 percent lower in 2021 than in 2010
NOTE: Calculations are based on unrounded numbers. Mean absolute percentage errors of enrollment in public elementary and secondary schools by state and region can be found in table A-7, appendix A. SOURCE: U.S. Department of Education, National Center for Education Statistics, Common Core of Data (CCD), “State Nonfiscal Survey of Public Elementary/Secondary Education,” 2010–11; and State Elementary and Secondary Enrollment Model, 1980–2010. (This figure was prepared February 2012.)
Enrollment by regionBetween 2010 and 2021, public elementary and secondary enrollment is projected to
S
S
S
S
increase 2 percent in the Northeast;increase 2 percent in the Midwest; increase 9 percent in the South; andincrease 13 percent in the West.
For more information: Tables 6 through 11
For more information: Tables 6 through 11
Figure 5. Actual and projected numbers for enrollment in public elementary and secondary schools, by region: Fall 2003, fall 2010, and fall 2021
Northeast Midwest South
Region
West0
10
20
30
40Millions
2003 2010 2021 (projected)
8.3 8.1 8.210.8 10.6 10.9
17.7 18.820.5
11.8 12.013.5
NOTE: Calculations are based on unrounded numbers. See the glossary for a list of the states in each region. Mean absolute percentage errors of enrollment in public elementary and secondary schools by state and region can be found in table A-7, appendix A. Some data have been revised from previously published figures. SOURCE: U.S. Department of Education, National Center for Education Statistics, Common Core of Data (CCD), “State Nonfiscal Survey of Public Elementary/Secondary Education,” 2003–04 and 2010–11; and State Elementary and Secondary Enrollment Model, 1980–2010. (This figure was prepared February 2012.)
Projections of Education Statistics to 2021 7
Section 2 High School Graduates
INTRODUCTIONThe number of high school graduates increased nationally by 28 percent between 1996–97 and 2008–09, the last year of actual data (table 12). The number of high school graduates is projected to be 2 percent higher in 2021–22 than in 2008–09. Public schools are expected to have an increase in the number of high school graduates and private schools are expected to have a decrease. The numbers of high school graduates are projected to be higher in 2021–22 than in 2008–09 in the South and West and lower in the Northeast and Midwest (table 14).
Factors affecting the projectionsThe projections of high school graduates are related to projections of 12th-graders and the historical relationship between the number of 12th-graders and the number of high school graduates. The methodology implicitly includes the net effect of factors such as dropouts, transfers to and from public schools, and, at the state level, migration. For more details, see appendixes A.0 and A.2.
About high school graduatesA high school graduate is defined as an individual who has received formal recognition from school authorities, by the granting of a diploma, for completing a prescribed course of study. This definition does not include other high school completers or high school equivalency recipients. Projections of graduates could be affected by changes in policies influencing graduation requirements.
High school graduates of two or more racesIn the 2008–09 school year, five states reported high school graduate counts for graduates of two or more races. These high school graduate counts were proportioned across the other racial/ethnic categories. When more complete sets of data for high school graduates of two or more races are compiled, separate projections for that category will be presented.
Accuracy of ProjectionsFor National Center for Education Statistics (NCES) projections of public high school graduates produced over the last 21 years, the mean absolute percentage errors (MAPEs) for lead times of 1, 2, 5, and 10 years out were 1.0, 1.0, 1.5, and 4.3, respectively. For the 1-year-out prediction, this means that one would expect the projection to be within 1.0 percent of the actual value, on average. For NCES projections of private high school graduates produced over the last 10 years, the MAPEs for lead times of 1, 2, 5, and 10 years out were 0.9, 0.9, 5.0, and 1.6, respectively. For more information, see table A-2 in appendix A.

8 Section 2. High School Graduates
NATIONAL
The total number of high school graduates
S
S
increased 28 percent between 1996–97 and 2008–09, a period of 12 years; and is projected to be 2 percent higher in 2021–22 than in 2008–09.
The number of public high school graduates
S
S
increased 29 percent between 1996–97 and 2008–09; and is projected to increase 5 percent between 2008–09 and 2021–22.
The number of private high school graduates
S
T
increased 22 percent between 1996–97 and 2008–09; and is projected to decrease 25 percent between 2008–09 and 2021–22.
For more information: Table 12
Figure 6. Actual and projected numbers for high school graduates, by control of school: School years 1996–97 through 2021–22
Projected
1996–97 2001–02 2006–07 2011–12 2016–17 2021–22
1
2
3
4Millions
School year
Total
Public
Private
NOTE: Since the biennial Private School Universe Survey (PSS) is collected in the fall of odd-numbered years and the numbers collected for high school graduates are for the preceding year, private school numbers for odd years are estimated based on data from the PSS. Some data have been revised from previously published figures. Mean absolute percentage errors of selected education statistics can be found in table A-2, appendix A. SOURCE: U.S. Department of Education, National Center for Education Statistics, Common Core of Data (CCD), “State Nonfiscal Survey of Public Elementary/Secondary Education,” 1996–97 through 2009–10; Private School Universe Survey (PSS), selected years, 1997–98 through 2009–10; and National Elementary and Secondary High School Graduates Enrollment Model, 1972–73 through 2008–09. (This figure was prepared February 2012.)

Projections of Education Statistics to 2021 9
Figure 7. Actual and projected numbers for public high school graduates, by race/ethnicity: School years 1996–97 through 2021–22
Projected
School year
1
2
3
4Millions
Hispanic American Indian/Alaska Native
White
Black Asian/Pacific Islander
1996–97 2001–02 2006–07 2011–12 2016–17 2021–220
NOTE: The historical racial/ethnic time series were constructed using racial/ethnic high school graduate data at the state level. In some instances, high school graduate data by race/ethnicity had to be imputed. Further, in some instances, the racial/ethnic data had to be adjusted in order for them to sum to the state total for high school graduates. For additional information, see the High School Graduates section A.2 in appendix A. Race categories exclude persons of Hispanic ethnicity. Some data have been revised from previously published figures. Mean absolute percentage errors of selected education statistics can be found in table A-2, appendix A. SOURCE: U.S. Department of Education, National Center for Education Statistics, Common Core of Data (CCD), “State Nonfiscal Survey of Public Elementary/Secondary Education,” 1997–98 through 2009–10; and National Public Elementary and Secondary High School Graduates by Race/Ethnicity Model, 1995–96 through 2009–10. (This figure was prepared February 2012.)
High school graduates by race/ethnicityThe number of public high school graduates is projected to
T
T
S
S
T
decrease 9 percent between 2008–09 and 2020–21 for students who are White;decrease 6 percent between 2008–09 and 2020–21 for students who are Black; increase 63 percent between 2008–09 and 2020–21 for students who are Hispanic;increase 35 percent between 2008–09 and 2020–21 for students who are Asian/Pacific Islander; andbe 1 percent lower in 2021–22 than in 2008–09 for students who are American Indian/Alaska Native.
For more information: Table 13

10 Section 2. High School Graduates
STATE AND REGIONAL (PUBLIC SCHOOL DATA)
High school graduates by stateThe expected 5 percent national increase in public high school graduates between 2008–09 and 2021–22 plays out differently among the states.
S
T
High school graduates are projected to be higher in 2021–22 than in 2008–09 for 31 states, with projected high school graduates• 5 percent or more higher in 23
states; and• less than 5 percent higher in 8 states.High school graduates are projected to be lower in 2021–22 than in 2008–09 for 19 states and the District of Columbia, with projected high school graduates •
•
5 percent or more lower in 8 states and the District of Columbia; and less than 5 percent lower in 11 states.
For more information: Tables 14 and 15
Figure 8. Projected percentage change in the number of public high school graduates, by state: School years 2008–09 through 2021–22
RI
DE
DC
Less than 5 percent higher in 2021–22 than in 2008–09
5 percent or more higher in 2021–22 than in 2008–09
5 percent or more lower in2021–22 than in 2008–09
Less than 5 percent lower in 2021–22 than in 2008–09
NOTE: Calculations are based on unrounded numbers. Mean absolute percentage errors of public high school graduates by state and region can be found in table A-10, appendix A. SOURCE: U.S. Department of Education, National Center for Education Statistics, Common Core of Data (CCD), “State Nonfiscal Survey of Public Elementary/Secondary Education,” 2009–10; and State Public High School Graduates Model, 1980–81 through 2008–09. (This figure was prepared February 2012.)
High school graduates by regionThe number of public high school graduates is projected to
T be less than 1 percent lower in 2021–22 than in 2008–09 in the Northeast;
T decrease 4 percent in between 2008–09 and 2021–22 in the Midwest;
S increase 11 percent between 2008–09 and 2021–22 in the South; and
S increase 8 percent between 2008–09 and 2021–22 in the West.
For more information: Tables 14 and 15
Figure 9. Actual and projected numbers for public high school graduates, by region: School years 2003–04, 2008–09, and 2021–22
Northeast Midwest South
Region
West0
500
1,000
1,500
2,000Thousands
2003–04 2008–09 2021–22 (projected)
486553 553
680 718 686
9471,068
1,186
641 700 759
NOTE: See the glossary for a list of states in each region. Mean absolute percentage errors of public high school graduates by state and region can be found in table A-10, appendix A. Calculations are based on unrounded numbers. Some data have been revised from previously published figures. SOURCE: U.S. Department of Education, National Center for Education Statistics, Common Core of Data (CCD), “State Nonfiscal Survey of Public Elementary/Secondary Education,” 2004–05 and 2009–10; and State Public High School Graduates Model, 1980–81 through 2008–09. (This figure was prepared February 2012.)
Projections of Education Statistics to 2021 11
Section 3Elementary and
Secondary Teachers
INTRODUCTIONBetween fall 2010, the last year of actual public school data, and fall 2021, the number of teachers in elementary and secondary schools is projected to rise (table 16). The increase is projected to occur in both public and private schools. Public and private schools are projected to experience a decline in pupil/teacher ratios (table 17). The annual number of new teacher hires is projected to be higher in 2021 than in 2010 in both public and private schools.
Factors affecting the projectionsThe projections of the number of elementary and secondary teachers are related to projected levels of enrollments and education revenue receipts from state sources per capita. For more details, see appendixes A. 0 and A.3.
Factors that were not consideredThe projections do not take into account possible changes in the number of teachers due to the effects of government policies.
About pupil/teacher ratiosThe overall elementary and secondary pupil/teacher ratio and pupil/teacher ratios for public and private schools were computed based on elementary and secondary enrollment and the number of classroom teachers by control of school.
About new teacher hiresA teacher is considered to be a new teacher hire for a certain control of school (public or private) for a given year if the teacher teaches in that control that year but had not taught in that control in the previous year. A teacher who moves from teaching in one control of school to the other control is considered a new teacher hire, but a teacher who moves from one school to another school in the same control is not considered a new teacher hire.
Accuracy of ProjectionsAn analysis of projection errors from the past 21 editions of Projections of Education Statistics indicates that the mean absolute percentage errors (MAPEs) for projections of classroom teachers in public elementary and secondary schools were 0.8 percent for 1 years out, 1.4 percent for 2 years out, 2.8 percent for 5 years out, and 5.9 percent for 10 years out. For the 1-year-out prediction, this means that one would expect the projection to be within 0.8 percent of the actual value, on average. For more information on the MAPEs of different National Center for Education Statistics (NCES) projection series, see table A-2 in appendix A.

12 Section 3. Elementary and Secondary Teachers
TEACHERS IN ELEMENTARY AND SECONDARY SCHOOLS
Number of teachersThe total number of elementary and secondary teachers
S
S
S
S
S
S
increased 20 percent between 1996 and 2010, a period of 14 years; andis projected to increase 14 percent between 2010 and 2021, a period of 11 years.
The number of teachers in public elementary and secondary schools
increased 20 percent between 1996 and 2010; andis projected to increase 15 percent between 2010 and 2021.
The number of teachers in private elementary and secondary schools
increased 15 percent between 1996 and 2010; and is projected to increase 3 percent between 2010 and 2021.
For more information: Table 16
Figure 10. Actual and projected numbers for elementary and secondary teachers, by control of school: Fall 1996 through fall 2021
Year
0
1
2
3
4
5Millions
Total
Projected
Public
Private
1996 2001 2006 2011 2016 2021
NOTE: Since the biennial Private School Universe Survey (PSS) is collected in the fall of odd-numbered years, private school numbers for alternate years are estimated based on data from the PSS. The number of teachers reported in full-time equivalents. Some data have been revised from previously published figures. Mean absolute percentage errors of selected education statistics can be found in table A-2, appendix A. SOURCE: U.S. Department of Education, National Center for Education Statistics, Common Core of Data (CCD), “State Nonfiscal Survey of Public Elementary/Secondary Education,” 1996–97 through 2010–11; Private School Universe Survey (PSS), selected years, 1997–98 through 2009–10; Elementary and Secondary Teacher Model, 1973–2010. (This figure was prepared March 2012.)

Projections of Education Statistics to 2021 13
Figure 11. Actual and projected numbers for the pupil/teacher ratios in elementary and secondary schools, by control of school: Fall 1996 through fall 2021
Year
0
5
10
15
20Ratio
PublicProjected
TotalPrivate
1996 2001 2006 2011 2016 2021
NOTE: Since the biennial Private School Universe Survey (PSS) is collected in the fall of odd-numbered years, private school numbers for alternate years are estimated based on data from the PSS. The pupil/teacher ratios were derived from tables 1 and 16. Teachers are reported in full-time equivalents. Some data have been revised from previously published figures. Mean absolute percentage errors of selected education statistics can be found in table A-2, appendix A. SOURCE: U.S. Department of Education, National Center for Education Statistics, Common Core of Data (CCD), “State Nonfiscal Survey of Public Elementary/Secondary Education,” 1996–97 through 2010–11; Private School Universe Survey (PSS), selected years, 1997–98 through 2009–10; National Elementary and Secondary Enrollment Model, 1972–2010; and Elementary and Secondary Teacher Model, 1973–2010. (This figure was prepared March 2012.)
Pupil/teacher ratiosThe pupil/teacher ratio in elementary and secondary schools
T
T
T
T
T
T
S
S
S
S
decreased from 16.9 to 15.0 between 1996 and 2010; andis projected to decrease to 14.1 in 2021.
The pupil/teacher ratio in public elementary and secondary schools
decreased from 17.1 to 15.2 between 1996 and 2010; andis projected to decrease to 14.4 in 2021.
The pupil/teacher ratio in private elementary and secondary schools
decreased from 15.5 to 12.4 between 1996 and 2010; andis projected to decrease to 11.7 in 2021.
For more information: Table 17
Figure 12. Actual and projected numbers for elementary and secondary new teacher hires, by control of school: Fall 1999, fall 2010, and fall 2021
Total Public Private0
100
200
300
400
500Thousands
305
385
470
222
301
384
83 84 87
Control of school
1999 (actual) 2010 (estimated) 2021 (projected)
NOTE: Public and private new teacher hire numbers for 2010 are estimated using the New Teacher Hires Model. For more information about the New Teacher Hires Model, see appendix A.3. Calculations are based on unrounded numbers. Some data have been revised from previously published figures. SOURCE: U.S. Department of Education, National Center for Education Statistics, Common Core of Data (CCD), “State Nonfiscal Survey of Public Elementary/Secondary Education,” 1999–2000; Private School Universe Survey (PSS), 1999–2000; Schools and Staffing Survey (SASS), “Public School Teacher Questionnaire,” 1999-2000 and “Private School Teacher Questionnaire,” 1999-2000; Elementary and Secondary Teacher Model, 1973–2010; and New Teacher Hires Model, 1988–2007. (This figure was prepared March 2012.)
New teacher hiresThe number of new teacher hires in public schools
was 36 percent higher in 2010 than in 1999 (301,000 versus 222,000); andis projected to increase 28 percent between 2010 and 2021, to 384,000.
The number of new teacher hires in private schools
was 1 percent higher in 2010 than in 1999 (84,000 versus 83,000); andis projected to increase 4 percent between 2010 and 2021, to 87,000.
For more information: Table 16

This page intentionally left blank.

Projections of Education Statistics to 2021 15
Section 4Expenditures for Public Elementary
and Secondary Education
INTRODUCTIONCurrent expenditures for public elementary and secondary education are projected to increase 24 percent in constant dollars between school years 2008–09, the last year of actual data, and 2021–22 (table 18).
Factors affecting the projectionsThe projections of current expenditures are related to projections of economic growth as measured by disposable income per capita and assistance by state governments to local governments. For more details, see appendixes A.0 and A.4.
Factors that were not consideredMany factors that may affect future school expenditures were not considered in the production of these projections. Such factors include policy initiatives as well as potential changes in the age distribution of elementary and secondary teachers as older teachers retire and are replaced by younger teachers, or as older teachers put off retirement for various reasons.
About constant dollars and current dollarsThroughout this section, projections of current expenditures are presented in constant 2010–11 dollars. The reference tables, later in this report, present these data both in constant 2010–11 dollars and in current dollars. The projections were developed in constant dollars and then placed in current dollars using projections for the Consumer Price Index (CPI) (table B-6 in appendix B). Projections of current expenditures in current dollars are not shown after 2014–15 due to the uncertain behavior of inflation over time.
Accuracy of ProjectionsAn analysis of projection errors from similar models used in the past 21 editions of Projections of Education Statistics that contained expenditure projections indicates that mean absolute percentage errors (MAPEs) for total current expenditures in constant dollars were 1.3 percent for 1 year out, 2.1 percent for 2 years out, 2.6 percent for 5 years out, and 4.0 percent for 10 years out. For the 1-year-out prediction, this means that one would expect the projection to be within 1.3 percent of the actual value, on average. MAPEs for current expenditures per pupil in fall enrollment in constant dollars were 1.3 percent for 1 year out, 2.1 percent for 2 years out, 2.9 percent for 5 years out, and 5.2 percent for 10 years out. See appendix A for further discussion of the accuracy of recent projections of current expenditures, and see table A-2 in appendix A for the mean absolute percentage errors (MAPEs) of these projections.

16 Section 4. Expenditures for Public Elementary and Secondary Education
CURRENT EXPENDITURES
Current expendituresCurrent expenditures in constant 2010–11 dollars
S
S
increased 42 percent from 1996–97 to 2008–09, a period of 12 years; and are projected to increase 24 percent, to $665 billion, from 2008–09 to 2021–22, a period of 13 years.
For more information: Tables 18 and 19
Figure 13. Actual and projected current expenditures for public elementary and secondary schools (in constant 2010–11 dollars): School years 1996–97 through 2021–22
School year
0
100
200
300
400
500
600
$700Projected
Billions of dollars
1996–97 2001–02 2006–07 2011–12 2016–17 2021–22
NOTE: Numbers were placed in constant dollars using the Consumer Price Index (CPI) for all urban consumers, Bureau of Labor Statistics, U.S. Department of Labor. For more detail about CPI, see table B-6 in appendix B. Some data have been revised from previously published figures. Mean absolute percentage errors of selected education statistics can be found in table A-2, appendix A. SOURCE: U.S. Department of Education, National Center for Education Statistics, Common Core of Data (CCD), “National Public Education Financial Survey,” 1996–97 through 2008–09; Public Elementary and Secondary School Current Expenditures Model, 1969–70 through 2008–09. (This figure was prepared February 2012.)
Projections of Education Statistics to 2021 17
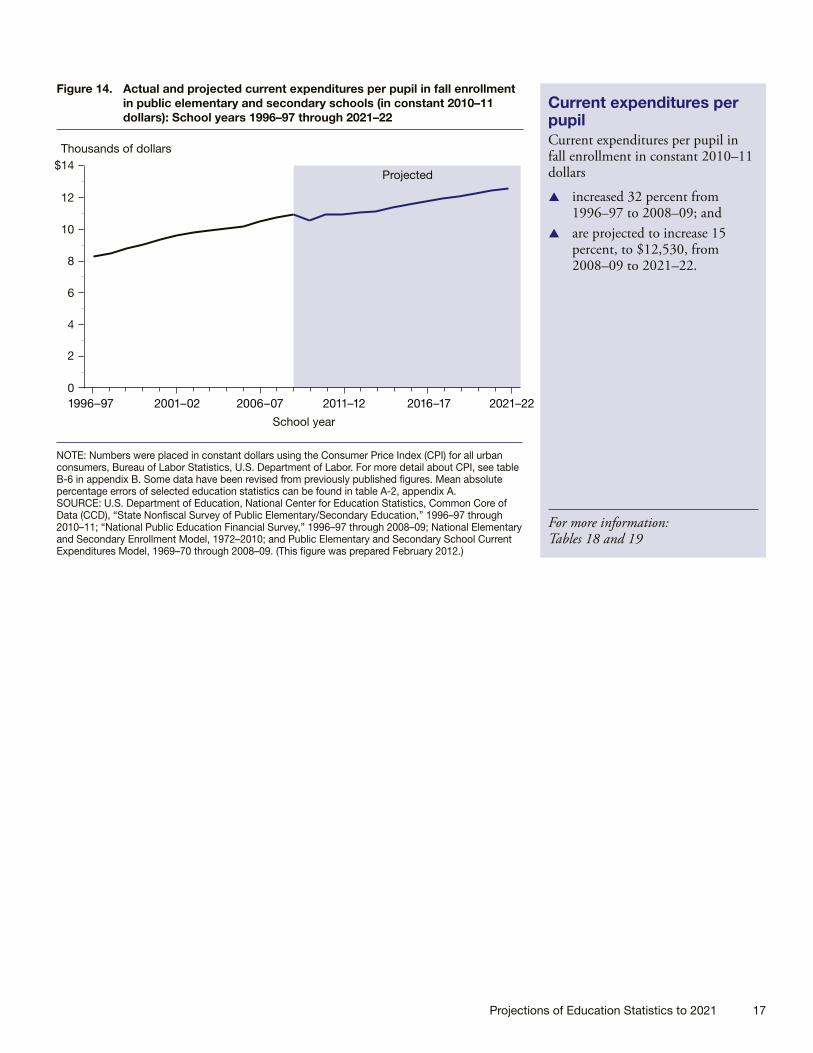
Figure 14. Actual and projected current expenditures per pupil in fall enrollment in public elementary and secondary schools (in constant 2010–11 dollars): School years 1996–97 through 2021–22
School year
0
2
4
6
8
10
12
$14Projected
Thousands of dollars
1996–97 2001–02 2006–07 2011–12 2016–17 2021–22
NOTE: Numbers were placed in constant dollars using the Consumer Price Index (CPI) for all urban consumers, Bureau of Labor Statistics, U.S. Department of Labor. For more detail about CPI, see table B-6 in appendix B. Some data have been revised from previously published figures. Mean absolute percentage errors of selected education statistics can be found in table A-2, appendix A. SOURCE: U.S. Department of Education, National Center for Education Statistics, Common Core of Data (CCD), “State Nonfiscal Survey of Public Elementary/Secondary Education,” 1996–97 through 2010–11; “National Public Education Financial Survey,” 1996–97 through 2008–09; National Elementary and Secondary Enrollment Model, 1972–2010; and Public Elementary and Secondary School Current Expenditures Model, 1969–70 through 2008–09. (This figure was prepared February 2012.)
Current expenditures per pupilCurrent expenditures per pupil in fall enrollment in constant 2010–11 dollars
S
S
increased 32 percent from 1996–97 to 2008–09; andare projected to increase 15 percent, to $12,530, from 2008–09 to 2021–22.
For more information: Tables 18 and 19

This page intentionally left blank.

Projections of Education Statistics to 2021 19
Section 5Enrollment in Postsecondary Degree-Granting Institutions
INTRODUCTIONTotal enrollment in postsecondary degree-granting institutions is expected to increase 15 percent between fall 2010, the last year of actual data, and fall 2021 (table 20). Degree-granting institutions are postsecondary institutions that provide study beyond secondary school and offer programs terminating in an associate’s, baccalaureate, or higher degree and participate in federal financial aid programs. Differential growth is expected by student characteristics such as age, sex, and attendance status (part-time or full-time). Enrollment is expected to increase in both public and private postsecondary degree-granting institutions.
Factors affecting the projectionsThe projections of enrollment levels are related to projec-tions of college-age populations, disposable income, and unemployment rates. For more details, see appendixes A.0 and A.5. An important factor in the enrollment projections is the expected increase in the population of 25- to 29-year-olds (table B-4 in appendix B).
Factors that were not consideredThe enrollment projections do not take into account such factors as the cost of a college education, the economic value of an education, and the impact of distance learning due to technological changes. These factors may produce changes in enrollment levels. The racial/ethnic backgrounds of nonresident aliens are not known.
Figure 15. Actual and projected population numbers for 18- to 24-year-olds and 25- to 29-year-olds: 1996 through 2021
Year (July 1)
0
10
20
30
40
50
60
18- to 24-year-old population
Projected
25- to 29-year-old population
70
80Millions
1996 2001 2006 2011 2016 2021
NOTE: Some data have been revised from previously published figures. Projections are from the U.S. Census Bureau’s 2008 National Population Projections, ratio-adjusted to line up with the most recent historical estimate. SOURCE: U.S. Department of Commerce, Census Bureau, Population Estimates, retrieved October 16, 2011, from http://www.census.gov/popest/data/index.html; and 2008 National Population Projections, retrieved November 2, 2008, from http://www.census.gov/population/www/projections/2008projections.html. (This figure was prepared March 2012.)
Accuracy of ProjectionsFor projections of total enrollment in postsecondary degree-granting institutions, an analysis of projection errors based on the past 14 editions of Projections of Education Statistics indicates that the mean absolute percentage errors (MAPEs) for lead times of 1, 2, 5, and 10 years out were 1.7, 2.6, 5.3, and 13.1 percent, respectively. For the 1-year-out prediction, this means that one would expect the projection to be within 1.7 percent of the actual value, on average. For more information, see table A-2 in appendix A.

20 Section 5. Enrollment in Postsecondary Degree-Granting Institutions
TOTAL ENROLLMENT
Total enrollment in postsecondary degree-granting institutions
S
S
increased 46 percent from 1996 to 2010, a period of 14 years; andis projected to increase 15 percent, to 24 million, from 2010 to 2021, a period of 11 years.
For more information: Table 20
Figure 16. Actual and projected numbers for total enrollment in all postsecondary degree-granting institutions: Fall 1996 through fall 2021
Year
0
5
10
15
20
25Projected
Millions
1996 2001 2006 2011 2016 2021
NOTE: Some data have been revised from previously published figures. Mean absolute percentage errors of selected education statistics can be found in table A-2, appendix A. SOURCE: U.S. Department of Education, National Center for Education Statistics, Integrated Postsecondary Education Data System (IPEDS) “Fall Enrollment Survey” (IPEDS-EF:96–99); IPEDS Spring 2001 through Spring 2011, Enrollment component; and Enrollment in Degree-Granting Institutions Model, 1980–2010. (This figure was prepared February 2012.)

Projections of Education Statistics to 2021 21
ENROLLMENT BY SELECTED CHARACTERISTICS AND CONTROL OF INSTITUTION
Figure 17. Actual and projected numbers for enrollment in all postsecondary degree-granting institutions, by age group: Fall 1996, fall 2010, and fall 2021
1996 2010 2021 (projected)
18–24 years old 25–34 years old
Age group
35 years old and over 0
5
10
15
20
25Millions
8.1
12.413.6
3.34.7
5.7
2.83.7
4.6
NOTE: Some data have been revised from previously published figures. Data by age are based on the distribution by age from the Census Bureau. Mean absolute percentage errors of selected education statistics can be found in table A-2, appendix A. Calculations are based on unrounded numbers. SOURCE: U.S. Department of Education, National Center for Education Statistics, Integrated Postsecondary Education Data System (IPEDS) “Fall Enrollment Survey” (IPEDS-EF:96); IPEDS Spring 2011, Enrollment component; Enrollment in Degree-Granting Institutions Model, 1980–2010; and U.S. Department of Commerce, Census Bureau, Current Population Reports, “Social and Economic Characteristics of Students,” various years. (This figure was prepared February 2012.)
Enrollment by age of studentEnrollment in postsecondary degree-granting institutions of students who are 18 to 24 years old
S
S
S
S
S
S
increased 52 percent between 1996 and 2010; and is projected to increase 10 percent between 2010 and 2021.
Enrollment in postsecondary degree-granting institutions of students who are 25 to 34 years old
increased 45 percent between 1996 and 2010; andis projected to increase 20 percent between 2010 and 2021.
Enrollment in postsecondary degree-granting institutions of students who are 35 years old and over
increased 32 percent between 1996 and 2010; andis projected to increase 25 percent between 2010 and 2021.
For more information: Table 21
Figure 18. Actual and projected numbers for enrollment in all postsecondary degree-granting institutions, by sex: Fall 1996 through fall 2021
Projected
Women
Men
1996 2001 2006 2011 2016 2021
5
0
10
15
20
25Millions
Year
NOTE: Some data have been revised from previously published figures. Mean absolute percentage errors of selected education statistics can be found in table A-2, appendix A. Some data have been revised from previously published figures. SOURCE: U.S. Department of Education, National Center for Education Statistics, Integrated Postsecondary Education Data System (IPEDS) “Fall Enrollment Survey” (IPEDS-EF:96–99); IPEDS Spring 2001 through Spring 2011, Enrollment component; and Enrollment in Degree-Granting Institutions Model, 1980–2010. (This figure was prepared February 2012.)
Enrollment by sex of studentEnrollment of men in postsecondary degree-granting institutions
S
S
S
S
increased 42 percent between 1996 and 2010; and is projected to increase 10 percent between 2010 and 2021.
Enrollment of women in postsecondary degree-granting institutions
increased 49 percent between 1996 and 2010; andis projected to increase 18 percent between 2010 and 2021.
For more information: Tables 20–22

22 Section 5. Enrollment in Postsecondary Degree-Granting Institutions
Enrollment by attendance status Enrollment in postsecondary degree-granting institutions of full-time students
S
S
S
S
increased 58 percent between 1996 and 2010; and is projected to increase 12 percent between 2010 and 2021.
Enrollment in postsecondary degree-granting institutions of part-time students
increased 31 percent between 1996 and 2010; and is projected to increase 18 percent between 2010 and 2021.
For more information: Tables 20–22
Figure 19. Actual and projected numbers for enrollment in all postsecondary degree-granting institutions, by attendance status: Fall 1996 through fall 2021
Year
0
5
10
15
20
25Millions
Projected
1996 2001 2006 2011 2016 2021
Full-time
Part-time
NOTE: Some data have been revised from previously published figures. Mean absolute percentage errors of selected education statistics can be found in table A-2, appendix A. SOURCE: U.S. Department of Education, National Center for Education Statistics, Integrated Postsecondary Education Data System (IPEDS) “Fall Enrollment Survey” (IPEDS-EF:96–99); IPEDS 2001 through Spring 2011, Enrollment component; and Enrollment in Degree-Granting Institutions Model, 1980–2010. (This figure was prepared February 2012.)
Enrollment by level of studentEnrollment in postsecondary degree-granting institutions of undergraduate students
S
S
S
S
increased 47 percent between 1996 and 2010; andis projected to increase 14 percent between 2010 and 2021.
Enrollment in postsecondary degree-granting institutions of postbaccalaureate students
increased 44 percent between 1996 and 2010; andis projected to increase 19 percent between 2010 and 2021.
For more information: Tables 27–28
Figure 20. Actual and projected numbers for undergraduate and postbaccalaureate enrollment in all postsecondary degree-granting institutions: Fall 1996 through fall 2021
Year
0
5
10
15
20
25Millions
Projected
1996 2001 2006 2011 2016 2021
Undergraduate
Postbaccalaureate
NOTE: Some data have been revised from previously published figures. Mean absolute percentage errors of selected education statistics can be found in table A-2, appendix A. SOURCE: U.S. Department of Education, National Center for Education Statistics, Integrated Postsecondary Education Data System (IPEDS) “Fall Enrollment Survey” (IPEDS-EF:96–99); IPEDS Spring 2001 through Spring 2011, Enrollment component; and Enrollment in Degree-Granting Institutions Model, 1980–2010. (This figure was prepared February 2012.)

Projections of Education Statistics to 2021 23
Figure 21. Actual and projected numbers for enrollment of U.S. residents in all postsecondary degree-granting institutions, by race/ethnicity: Fall 1996 through fall 2021
Projected
Year
0
5
10
15
20
25Millions
White
Black Asian/Pacific Islander
Hispanic American Indian/Alaska Native
1996 2001 2006 2011 2016 2021
NOTE: Race categories exclude persons of Hispanic ethnicity. Because of underreporting and nonreporting of racial/ethnic data and nonresident aliens, some estimates are slightly lower than corresponding data in other published tables. Enrollment data in the “race/ethnicity unknown” (all years) and “two or more races” (2008, 2009, and 2010 only) categories of the IPEDS “Enrollment component” have been prorated to the other racial/ethnic categories at the institutional level. Mean absolute percentage errors of selected education statistics can be found in table A-2, appendix A. SOURCE: U.S. Department of Education, National Center for Education Statistics, Integrated Postsecondary Education Data System (IPEDS) “Fall Enrollment Survey” (IPEDS-EF:96–99); IPEDS Spring 2001 through Spring 2011, Enrollment component; and Enrollment in Degree-Granting Institutions by Race/Ethnicity Model, 1980–2010. (This figure was prepared February 2012.)
Enrollment by race/ethnicity Enrollment of U.S. residents is projected to
S
S
S
S
S
increase 4 percent for students who are White between 2010 and 2021; increase 25 percent for students who are Black between 2010 and 2021;increase 42 percent for students who are Hispanic between 2010 and 2021;increase 20 percent for students who are Asian/Pacific Islander between 2010 and 2021; andbe 1 percent higher in 2021 than in 2010 for students who are American Indian/Alaska Native.
For more information: Table 29
Figure 22. Actual and projected numbers for enrollment in all postsecondary degree-granting institutions, by control of institution: Fall 1996 through fall 2021
Year
0
5
10
15
20
25
Public institutions
Projected
Private institutions
1996 2001 20112006 2016 2021
Millions
NOTE: Some data have been revised from previously published figures. Mean absolute percentage errors of selected education statistics can be found in table A-2, appendix A. SOURCE: U.S. Department of Education, National Center for Education Statistics, Integrated Postsecondary Education Data System (IPEDS) “Fall Enrollment Survey” (IPEDS-EF:96–99); IPEDS Spring 2001 through Spring 2011, Enrollment component; Enrollment in Degree-Granting Institutions Model, 1980–2010. (This figure was prepared February 2012.)
Enrollment in public and private institutions Enrollment in public postsecondary degree-granting institutions
S
S
S
S
increased 36 percent between 1996 and 2010; and is projected to increase 15 percent between 2010 and 2021.
Enrollment in private postsecondary degree-granting institutions
increased 81 percent between 1996 and 2010; and is projected to increase 15 percent between 2010 and 2021.
For more information: Table 20
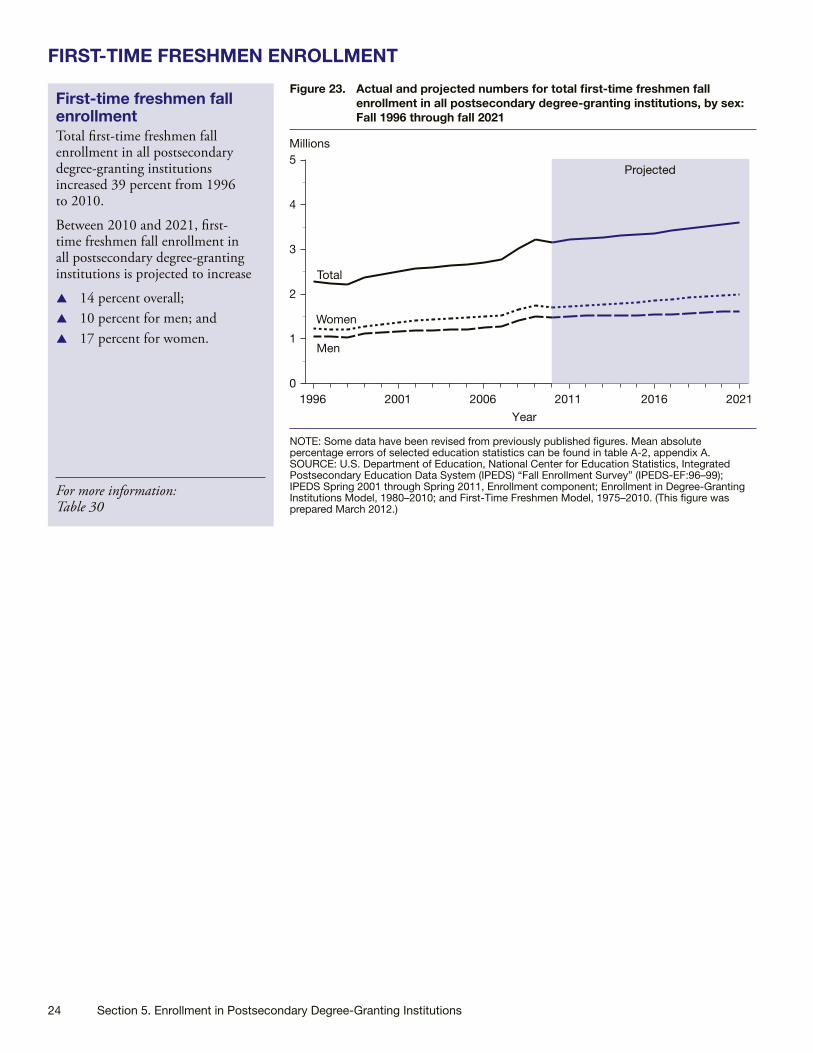
24 Section 5. Enrollment in Postsecondary Degree-Granting Institutions
FIRST-TIME FRESHMEN ENROLLMENT
First-time freshmen fall enrollmentTotal first-time freshmen fall enrollment in all postsecondary degree-granting institutions increased 39 percent from 1996 to 2010.
Between 2010 and 2021, first-time freshmen fall enrollment in all postsecondary degree-granting institutions is projected to increase
S
S
S
14 percent overall; 10 percent for men; and 17 percent for women.
For more information: Table 30
Figure 23. Actual and projected numbers for total first-time freshmen fall enrollment in all postsecondary degree-granting institutions, by sex: Fall 1996 through fall 2021
Year
0
1
2
3
4
5Millions
Projected
Women
Men
Total
1996 2001 2006 2011 2016 2021
NOTE: Some data have been revised from previously published figures. Mean absolute percentage errors of selected education statistics can be found in table A-2, appendix A. SOURCE: U.S. Department of Education, National Center for Education Statistics, Integrated Postsecondary Education Data System (IPEDS) “Fall Enrollment Survey” (IPEDS-EF:96–99); IPEDS Spring 2001 through Spring 2011, Enrollment component; Enrollment in Degree-Granting Institutions Model, 1980–2010; and First-Time Freshmen Model, 1975–2010. (This figure was prepared March 2012.)
Projections of Education Statistics to 2021 25
Section 6Postsecondary Degrees Conferred
INTRODUCTIONContinuing growth in enrollment in postsecondary degree-granting institutions has been reflected by increases in the numbers of associate’s, bachelor’s, master’s and doctor’s degrees conferred (tables 20, 32, 33, 34, and 35). Increases in the number of degrees conferred are expected to continue between academic year 2009–10, the last year of actual data, and academic year 2021–22.
Factors affecting the projectionsThe projections of the number of degrees conferred are related to projections of the college-age populations deve-loped by the Census Bureau and college enrollments from this report. For more details, see appendixes A.0 and A.6.
Factors that were not consideredSome factors that may affect future numbers of degrees, such as choice of degree and labor force requirements, were not included in the projection models.
Changes in degree classificationsThe National Center for Education Statistics (NCES) no longer uses the first-professional degree classification. Most degrees formerly classified as first-professional—such as M.D., D.D.S., and law degrees—are now classified as doctor’s degrees. However, master’s of divinity degrees are now classified as master’s degrees. With this change, the actual numbers of master’s and doctor’s and degrees conferred are higher than the actual numbers in Projections of Education Statistics to 2020 and earlier editions of this report. The change in the actual numbers affected the projections.
Accuracy of ProjectionsNo mean absolute percentage errors (MAPEs) were calculated for degrees conferred as the current model used for producing their projections has been used for only three other editions of Projections of Education Statistics. For more information on the MAPEs of different NCES projection series, see table A-2 in appendix A.

26 Section 6. Postsecondary Degrees Conferred
DEGREES, BY LEVEL OF DEGREE AND SEX OF RECIPIENT
Associate’s degrees The total number of associate’s degrees
S i
S i
S
S
S
S
S
S
S
S
S
S
ncreased 49 percent between 1996–97 and 2009–10; and s projected to increase 21
percent between 2009–10 and 2021–22.
The number of associate’s degrees awarded to men
increased 44 percent between 1996–97 and 2009–10; and is projected to increase 19 percent between 2009–10 and 2021–22.
The number of associate’s degrees awarded to women
increased 52 percent between 1996–97 and 2009–10; and is projected to increase 23 percent between 2009–10 and 2021–22.
Figure 24. Actual and projected numbers for associate’s degrees conferred by postsecondary degree-granting institutions, by sex of recipient: Academic years 1996–97 through 2021–22
Academic year
0
200
400
600
800
1,000
1,200
1,400
1,600
1,800
2,000Thousands
Total
Projected
Women
Men
1996–97 2001–02 2006–07 2011–12 2016–17 2021–22
NOTE: Some data have been revised from previously published figures. Mean absolute percentage errors of selected education statistics can be found in table A-2, appendix A. SOURCE: U.S. Department of Education, National Center for Education Statistics, Integrated Postsecondary Education Data System (IPEDS), “Completions Survey” (IPEDS-C:97–99); IPEDS Fall 2000 through Fall 2010 Completions component; and Degrees Conferred Model, 1980–81 through 2009–10. (This figure was prepared March 2012.)
Bachelor’s degrees The total number of bachelor’s degrees
increased 41 percent between 1996–97 and 2009–10; and is projected to increase 21 percent between 2009–10 and 2021–22.
The number of bachelor’s degrees awarded to men
increased 36 percent between 1996–97 and 2009–10; andis projected to increase 19 percent between 2009–10 and 2021–22.
The number of bachelor’s degrees awarded to women
increased 45 percent between 1996–97 and 2009–10; andis projected to increase 23 percent between 2009–10 and 2021–22.
For more information: Table 32
For more information: Table 33
Figure 25. Actual and projected numbers for bachelor’s degrees conferred by postsecondary degree-granting institutions, by sex of recipient: Academic years 1996–97 through 2021–22
0
200
400
600
800
1,000
1,200
1,400
1,600
1,800
2,000Thousands
Total
Projected
Women
Men
Academic year1996–97 2001–02 2006–07 2011–12 2016–17 2021–22
NOTE: Some data have been revised from previously published figures. Mean absolute percentage errors of selected education statistics can be found in table A-2, appendix A. SOURCE: U.S. Department of Education, National Center for Education Statistics, Integrated Postsecondary Education Data System (IPEDS), “Completions Survey” (IPEDS-C:97–99); IPEDS Fall 2000 through Fall 2010 Completions component; and Degrees Conferred Model, 1980–81 through 2009–10. (This figure was prepared March 2012.)

Projections of Education Statistics to 2021 27
Figure 26. Actual and projected numbers for master’s degrees conferred by postsecondary degree-granting institutions, by sex of recipient: Academic years 1996–97 through 2021–22
0
200
400
600
800
1,000
1,200
1,400
1,600
1,800
Total
Projected
Women
Men
2,000Thousands
Academic year
1996–97 2001–02 2006–07 2011–12 2016–17 2021–22
NOTE: Includes some degrees formerly classified as first professional such as divinity degrees (M.Div. and M.H.L./Rav). All data have been revised from previously published figures. SOURCE: U.S. Department of Education, National Center for Education Statistics, Integrated Postsecondary Education Data System (IPEDS), “Completions Survey” (IPEDS-C:97–99); IPEDS Fall 2000 through Fall 2010 Completions component; and Degrees Conferred Model, 1980–81 through 2009–10. (This figure was prepared March 2012.)
Master’s degrees The total number of master’s degrees
S
S
S
S
S
S
increased 63 percent between 1996–97 and 2009–10; andis projected to increase 34 percent between 2009–10 and 2021–22.
The number of master’s degrees awarded to men
increased 49 percent between 1996–97 and 2009–10; andis projected to increase 29 percent between 2009–10 and 2021–22.
The number of master’s degrees awarded to women
increased 74 percent between 1996–97 and 2009–10; andis projected to increase 38 percent between 2009–10 and 2021–22.
For more information: Table 34
Figure 27. Actual and projected numbers for doctor’s degrees conferred by postsecondary degree-granting institutions, by sex of recipient: Academic years 1996–97 through 2021–22
Thousands
Total
Projected
Men
Women
Academic year
1996–97 2001–02 2006–07 2011–12 2016–17 2021–220
20
40
60
80
100
120
140
160
180
200
NOTE: Doctor’s degrees include Ph.D., Ed.D., and comparable degrees at the doctoral level. Includes most degrees formerly classified as first-professional, such as M.D., D.D.S., and law degrees. Some data have been revised from previously published figures. Mean absolute percentage errors of selected education statistics can be found in table A-2, appendix A. SOURCE: U.S. Department of Education, National Center for Education Statistics, Integrated Postsecondary Education Data System (IPEDS), “Completions Survey” (IPEDS-C:97–99); IPEDS Fall 2000 through Fall 2010 Completions component; and Degrees Conferred Model, 1980–81 through 2009–10. (This figure was prepared March 2012.)
Doctor’s degrees The total number of doctor’s degrees
S
S
S
S
S
S
increased 34 percent between 1996–97 and 2009–10; andis projected to increase 24 percent between 2009–10 and 2021–22.
The number of doctor’s degrees awarded to men
increased 12 percent between 1996–97 and 2009–10; andis projected to increase 19 percent between 2009–10 and 2021–22.
The number of doctor’s degrees awarded to women
increased 63 percent between 1996–97 and 2009–10; andis projected to increase 29 percent between 2009–10 and 2021–22.
For more information: Table 35

This page intentionally left blank.

Projections of Education Statistics to 2021 29
Reference Tables

This page intentionally left blank.

Projections of Education Statistics to 2021 31
Table 1. Actual and projected numbers for enrollment in grades PK–12, PK–8, and 9–12 in elementary and secondary schools, by control of school: Fall 1996 through fall 2021
[In thousands]
Year
Total Public Private
PK–121 PK–81 9–12 PK–12 PK–8 9–12 PK–121 PK–81 9–12
Actual19962 51,544 37,481 14,062 45,611 32,762 12,849 5,933 4,719 1,2131997 52,071 37,797 14,275 46,127 33,071 13,056 5,944 4,726 1,21919982 52,526 38,091 14,435 46,539 33,344 13,195 5,988 4,747 1,2401999 52,875 38,251 14,625 46,857 33,486 13,371 6,018 4,764 1,25420002 53,373 38,564 14,809 47,204 33,686 13,517 6,169 4,877 1,2922001 53,992 38,929 15,063 47,672 33,936 13,736 6,320 4,993 1,32720022 54,403 39,000 15,404 48,183 34,114 14,069 6,220 4,886 1,3352003 54,639 38,962 15,678 48,540 34,201 14,339 6,099 4,761 1,33820042 54,882 38,908 15,974 48,795 34,178 14,618 6,087 4,731 1,3562005 55,187 38,903 16,283 49,113 34,204 14,909 6,073 4,699 1,37420062 55,307 38,838 16,469 49,316 34,235 15,081 5,991 4,604 1,3882007 55,203 38,722 16,481 49,293 34,205 15,087 5,910 4,517 1,39420082 54,973 38,620 16,353 49,266 34,286 14,980 5,707 4,335 1,3732009 54,862 38,569 16,293 49,373 34,418 14,955 5,488 4,151 1,33820102 54,876 38,716 16,160 49,484 34,625 14,860 5,391 4,091 1,300
Projected2011 54,956 38,909 16,047 49,636 34,849 14,787 5,320 4,060 1,2602012 55,091 39,115 15,976 49,828 35,076 14,752 5,263 4,039 1,2242013 55,288 39,334 15,954 50,067 35,301 14,766 5,221 4,033 1,1882014 55,599 39,539 16,060 50,407 35,502 14,905 5,192 4,037 1,1552015 55,957 39,788 16,169 50,773 35,735 15,038 5,183 4,053 1,1302016 56,330 40,114 16,217 51,146 36,029 15,116 5,185 4,085 1,1002017 56,722 40,451 16,271 51,524 36,329 15,195 5,198 4,122 1,0762018 57,098 40,797 16,301 51,880 36,639 15,241 5,218 4,158 1,0612019 57,507 41,149 16,358 52,260 36,956 15,304 5,247 4,193 1,0542020 57,975 41,506 16,469 52,688 37,278 15,410 5,287 4,228 1,0592021 58,444 41,861 16,583 53,113 37,598 15,515 5,331 4,263 1,068
1 Includes private nursery and prekindergarten enrollment in schools that offer kindergarten or higher grades.2 Since the biennial Private School Universe Survey (PSS) is collected in the fall of odd-numbered years, private school numbers for alternate years are estimated based on data from the PSS.NOTE: PK=prekindergarten. Some data have been revised from previously published figures. Detail may not sum to totals because of rounding. Mean absolute percentage errors of selected education statistics can be found in table A-2, appendix A. SOURCE: U.S. Department of Education, National Center for Education Statistics, Common Core of Data (CCD), “State Nonfiscal Survey of Public Elementary/Secondary Education,” 1996–97 through 2010–11; Private School Universe Survey (PSS), selected years 1997–98 through 2009–10; and National Elementary and Secondary Enrollment Model, 1972–2010. (This table was prepared January 2012.)

32 Reference Tables
Table 2. Actual and projected numbers for enrollment in public elementary and secondary schools, by grade: Fall 1996 through fall 2021
[In thousands]
Year Total
Grade
PK K 1 2 3 4 5 6
Actual1996 45,611 670 3,532 3,770 3,600 3,524 3,454 3,453 3,4941997 46,127 695 3,503 3,755 3,689 3,597 3,507 3,458 3,4921998 46,539 729 3,443 3,727 3,681 3,696 3,592 3,520 3,4971999 46,857 751 3,397 3,684 3,656 3,691 3,686 3,604 3,5642000 47,204 776 3,382 3,636 3,634 3,676 3,711 3,707 3,6632001 47,672 865 3,379 3,614 3,593 3,653 3,695 3,727 3,7692002 48,183 915 3,434 3,594 3,565 3,623 3,669 3,711 3,7882003 48,540 950 3,503 3,613 3,544 3,611 3,619 3,685 3,7722004 48,795 990 3,544 3,663 3,560 3,580 3,612 3,635 3,7352005 49,113 1,036 3,619 3,691 3,606 3,586 3,578 3,633 3,6702006 49,316 1,084 3,631 3,751 3,641 3,627 3,586 3,602 3,6602007 49,293 1,081 3,609 3,750 3,704 3,659 3,624 3,600 3,6282008 49,266 1,180 3,640 3,708 3,699 3,708 3,647 3,629 3,6142009 49,373 1,224 3,679 3,730 3,666 3,708 3,701 3,653 3,6452010 49,484 1,279 3,682 3,754 3,701 3,686 3,711 3,718 3,682
Projected2011 49,636 1,287 3,705 3,779 3,724 3,717 3,690 3,725 3,7442012 49,828 1,296 3,733 3,804 3,749 3,741 3,721 3,703 3,7522013 50,067 1,307 3,765 3,832 3,773 3,766 3,744 3,735 3,7302014 50,407 1,320 3,801 3,865 3,802 3,790 3,770 3,758 3,7612015 50,773 1,333 3,838 3,902 3,835 3,819 3,794 3,784 3,7852016 51,146 1,346 3,876 3,941 3,871 3,852 3,822 3,808 3,8112017 51,524 1,359 3,912 3,980 3,910 3,888 3,855 3,837 3,8352018 51,880 1,370 3,946 4,017 3,948 3,927 3,892 3,870 3,8642019 52,260 1,381 3,977 4,052 3,985 3,966 3,931 3,907 3,8972020 52,688 1,391 4,006 4,085 4,020 4,003 3,970 3,946 3,9352021 53,113 1,400 4,033 4,115 4,052 4,038 4,007 3,985 3,974
See notes at end of table.

Projections of Education Statistics to 2021 33
Table 2. Actual and projected numbers for enrollment in public elementary and secondary schools, by grade: Fall 1996 through fall 2021—Continued
[In thousands]
Year
Grade Elementaryungraded
Secondaryungraded7 8 9 10 11 12
Actual1996 3,464 3,403 3,801 3,323 2,930 2,586 399 2081997 3,520 3,415 3,819 3,376 2,972 2,673 440 2161998 3,530 3,480 3,856 3,382 3,021 2,722 449 2141999 3,541 3,497 3,935 3,415 3,034 2,782 415 2052000 3,629 3,538 3,963 3,491 3,083 2,803 334 1772001 3,720 3,616 4,012 3,528 3,174 2,863 304 1592002 3,821 3,709 4,105 3,584 3,229 2,990 285 1612003 3,841 3,809 4,190 3,675 3,277 3,046 255 1502004 3,818 3,825 4,281 3,750 3,369 3,094 215 1222005 3,777 3,802 4,287 3,866 3,454 3,180 205 1212006 3,716 3,766 4,260 3,882 3,551 3,277 170 1102007 3,701 3,709 4,200 3,863 3,558 3,375 139 922008 3,653 3,692 4,123 3,822 3,548 3,400 117 872009 3,642 3,652 4,081 3,810 3,542 3,433 119 902010 3,676 3,659 4,008 3,800 3,538 3,472 77 42
Projected2011 3,713 3,687 4,016 3,732 3,529 3,469 77 412012 3,775 3,724 4,046 3,740 3,466 3,459 78 412013 3,783 3,786 4,087 3,768 3,473 3,397 79 412014 3,761 3,794 4,155 3,805 3,499 3,404 80 412015 3,793 3,772 4,164 3,869 3,534 3,430 81 412016 3,817 3,804 4,139 3,877 3,593 3,464 81 422017 3,843 3,828 4,175 3,855 3,601 3,522 82 422018 3,868 3,854 4,201 3,887 3,580 3,530 83 432019 3,897 3,879 4,229 3,912 3,610 3,509 84 432020 3,930 3,908 4,257 3,938 3,633 3,539 84 442021 3,968 3,941 4,288 3,964 3,658 3,561 85 44
NOTE: PK=prekindergarten. K=kindergarten. Elementary ungraded includes students in grades prekindergarten through 8 who are in classes or programs to which students are assigned without standard grade designations. Secondary ungraded includes students in grades 9 through 12 who are in classes or programs to which students are assigned without standard grade designations. Some data have been revised from previously published figures. Detail may not sum to totals because of rounding. Mean absolute percentage errors of selected education statistics can be found in table A-2, appendix A.SOURCE: U.S. Department of Education, National Center for Education Statistics, Common Core of Data (CCD), “State Nonfiscal Survey of Public Elementary/Secondary Education,” 1996–97 through 2010–11; and National Elementary and Secondary Enrollment Model, 1972–2010. (This table was prepared January 2012.)
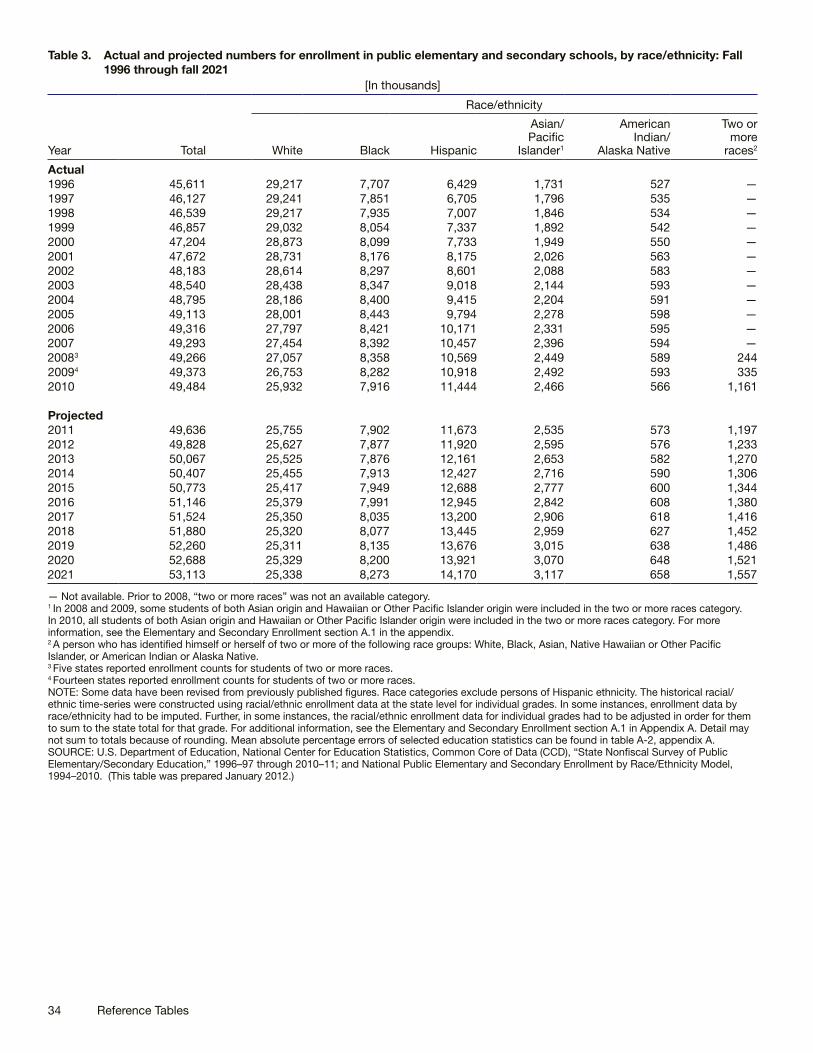
34 Reference Tables
Table 3. Actual and projected numbers for enrollment in public elementary and secondary schools, by race/ethnicity: Fall 1996 through fall 2021
[In thousands]
Year Total
Race/ethnicity
White Black Hispanic
Asian/ Pacific
Islander1
American Indian/
Alaska Native
Two or more
races2
Actual1996 45,611 29,217 7,707 6,429 1,731 527 —1997 46,127 29,241 7,851 6,705 1,796 535 —1998 46,539 29,217 7,935 7,007 1,846 534 —1999 46,857 29,032 8,054 7,337 1,892 542 —2000 47,204 28,873 8,099 7,733 1,949 550 —2001 47,672 28,731 8,176 8,175 2,026 563 —2002 48,183 28,614 8,297 8,601 2,088 583 —2003 48,540 28,438 8,347 9,018 2,144 593 —2004 48,795 28,186 8,400 9,415 2,204 591 —2005 49,113 28,001 8,443 9,794 2,278 598 —2006 49,316 27,797 8,421 10,171 2,331 595 —2007 49,293 27,454 8,392 10,457 2,396 594 —20083 49,266 27,057 8,358 10,569 2,449 589 24420094 49,373 26,753 8,282 10,918 2,492 593 3352010 49,484 25,932 7,916 11,444 2,466 566 1,161
Projected2011 49,636 25,755 7,902 11,673 2,535 573 1,1972012 49,828 25,627 7,877 11,920 2,595 576 1,2332013 50,067 25,525 7,876 12,161 2,653 582 1,2702014 50,407 25,455 7,913 12,427 2,716 590 1,3062015 50,773 25,417 7,949 12,688 2,777 600 1,3442016 51,146 25,379 7,991 12,945 2,842 608 1,3802017 51,524 25,350 8,035 13,200 2,906 618 1,4162018 51,880 25,320 8,077 13,445 2,959 627 1,4522019 52,260 25,311 8,135 13,676 3,015 638 1,4862020 52,688 25,329 8,200 13,921 3,070 648 1,5212021 53,113 25,338 8,273 14,170 3,117 658 1,557
— Not available. Prior to 2008, “two or more races” was not an available category.1 In 2008 and 2009, some students of both Asian origin and Hawaiian or Other Pacific Islander origin were included in the two or more races category. In 2010, all students of both Asian origin and Hawaiian or Other Pacific Islander origin were included in the two or more races category. For more information, see the Elementary and Secondary Enrollment section A.1 in the appendix.2 A person who has identified himself or herself of two or more of the following race groups: White, Black, Asian, Native Hawaiian or Other Pacific Islander, or American Indian or Alaska Native.3 Five states reported enrollment counts for students of two or more races. 4 Fourteen states reported enrollment counts for students of two or more races. NOTE: Some data have been revised from previously published figures. Race categories exclude persons of Hispanic ethnicity. The historical racial/ethnic time-series were constructed using racial/ethnic enrollment data at the state level for individual grades. In some instances, enrollment data by race/ethnicity had to be imputed. Further, in some instances, the racial/ethnic enrollment data for individual grades had to be adjusted in order for them to sum to the state total for that grade. For additional information, see the Elementary and Secondary Enrollment section A.1 in Appendix A. Detail may not sum to totals because of rounding. Mean absolute percentage errors of selected education statistics can be found in table A-2, appendix A.SOURCE: U.S. Department of Education, National Center for Education Statistics, Common Core of Data (CCD), “State Nonfiscal Survey of Public Elementary/Secondary Education,” 1996–97 through 2010–11; and National Public Elementary and Secondary Enrollment by Race/Ethnicity Model, 1994–2010. (This table was prepared January 2012.)

Projections of Education Statistics to 2021 35
Table 4. Actual and projected numbers for enrollment in grades PK–8 in public schools, by race/ethnicity: Fall 1996 through fall 2021
[In thousands]
Year Total
Race/ethnicity
White Black Hispanic
Asian/ Pacific
Islander1
American Indian/
Alaska Native
Two or more
races2
Actual1996 32,762 20,687 5,664 4,821 1,204 386 —1997 33,071 20,625 5,782 5,030 1,244 390 —1998 33,344 20,548 5,861 5,274 1,275 386 —1999 33,486 20,313 5,948 5,529 1,305 391 —2000 33,686 20,123 5,980 5,838 1,348 397 —2001 33,936 19,954 6,002 6,167 1,408 405 —2002 34,114 19,760 6,040 6,453 1,446 415 —2003 34,201 19,554 6,013 6,736 1,482 415 —2004 34,178 19,266 5,992 6,988 1,519 413 —2005 34,204 19,047 5,953 7,223 1,569 412 —2006 34,235 18,859 5,880 7,470 1,611 414 —2007 34,205 18,678 5,821 7,636 1,660 412 —20083 34,286 18,500 5,793 7,695 1,703 410 18520094 34,418 18,352 5,742 7,924 1,736 414 2512010 34,625 17,823 5,494 8,319 1,710 394 884
Projected2011 34,849 17,773 5,530 8,461 1,768 405 9112012 35,076 17,726 5,548 8,633 1,820 411 9382013 35,301 17,681 5,571 8,800 1,871 417 9632014 35,502 17,634 5,591 8,954 1,911 424 9882015 35,735 17,613 5,625 9,099 1,955 431 1,0122016 36,029 17,626 5,677 9,254 1,997 440 1,0372017 36,329 17,637 5,744 9,405 2,032 448 1,0622018 36,639 17,657 5,817 9,556 2,064 457 1,0882019 36,956 17,671 5,869 9,751 2,088 464 1,1142020 37,278 17,688 5,917 9,952 2,111 470 1,1402021 37,598 17,706 5,958 10,158 2,134 475 1,167
— Not available. Prior to 2008, “two or more races” was not an available category.1 In 2008 and 2009, some students of both Asian origin and Hawaiian or Other Pacific Islander origin were included in the two or more races category. In 2010, all students of both Asian origin and Hawaiian or Other Pacific Islander origin were included in the two or more races category. For more information, see the Elementary and Secondary Enrollment section A.1 in the appendix.2 A person who has identified himself or herself of two or more of the following race groups: White, Black, Asian, Native Hawaiian or Other Pacific Islander, or American Indian or Alaska Native.3 Five states reported enrollment counts for students of two or more races. 4 Fourteen states reported enrollment counts for students of two or more races. NOTE: PK=prekindergarten. Some data have been revised from previously published figures. Race categories exclude persons of Hispanic ethnicity. The historical racial/ethnic time-series were constructed using racial/ethnic enrollment data at the state level for individual grades. In some instances, enrollment data by race/ethnicity had to be imputed. Further, in some instances, the racial/ethnic enrollment data for individual grades had to be adjusted in order for them to sum to the state total for that grade. For additional information, see the Elementary and Secondary Enrollment section A.1 in Appendix A. Detail may not sum to totals because of rounding. Mean absolute percentage errors of selected education statistics can be found in table A-2, appendix A.SOURCE: U.S. Department of Education, National Center for Education Statistics, Common Core of Data (CCD), “State Nonfiscal Survey of Public Elementary/Secondary Education,” 1996–97 through 2010–11; and National Public Elementary and Secondary Enrollment by Race/Ethnicity Model, 1994–2010. (This table was prepared January 2012.)

36 Reference Tables
Table 5. Actual and projected numbers for enrollment in grades 9–12 in public schools, by race/ethnicity: Fall 1996 through fall 2021
[In thousands]
Year Total
Race/ethnicity
White Black Hispanic
Asian/ Pacific
Islander1
American Indian/
Alaska Native
Two or more
races2
Actual1996 12,849 8,530 2,043 1,608 526 141 —1997 13,056 8,616 2,068 1,675 552 145 —1998 13,195 8,670 2,073 1,732 572 148 —1999 13,371 8,719 2,106 1,808 587 151 —2000 13,517 8,750 2,119 1,894 601 153 —2001 13,736 8,777 2,173 2,008 619 158 —2002 14,069 8,854 2,257 2,148 642 168 —2003 14,339 8,884 2,334 2,282 663 177 —2004 14,618 8,920 2,408 2,427 686 178 —2005 14,909 8,954 2,490 2,570 709 186 —2006 15,081 8,938 2,540 2,701 720 181 —2007 15,087 8,776 2,571 2,821 736 183 —20083 14,980 8,556 2,565 2,874 746 179 5920094 14,955 8,401 2,540 2,994 757 179 842010 14,860 8,109 2,422 3,125 755 171 277
Projected2011 14,787 7,982 2,373 3,212 767 168 2862012 14,752 7,901 2,328 3,287 775 165 2962013 14,766 7,844 2,305 3,361 783 165 3072014 14,905 7,821 2,322 3,473 805 167 3182015 15,038 7,804 2,324 3,588 822 168 3322016 15,116 7,753 2,314 3,691 845 169 3442017 15,195 7,713 2,290 3,794 874 170 3532018 15,241 7,663 2,260 3,889 895 170 3642019 15,304 7,640 2,266 3,925 927 174 3722020 15,410 7,640 2,283 3,969 958 178 3812021 15,515 7,633 2,315 4,011 983 182 391
— Not available. Prior to 2008, “two or more races” was not an available category.1 In 2008 and 2009, some students of both Asian origin and Hawaiian or Other Pacific Islander origin were included in the two or more races category. In 2010, all students of both Asian origin and Hawaiian or Other Pacific Islander origin were included in the two or more races category. For more information, see the Elementary and Secondary Enrollment section A.1 in the appendix.2 A person who has identified himself or herself of two or more of the following race groups: White, Black, Asian, Native Hawaiian or Other Pacific Islander, or American Indian or Alaska Native.3 Five states reported enrollment counts for students of two or more races. 4 Fourteen states reported enrollment counts for students of two or more races. NOTE: Some data have been revised from previously published figures. Race categories exclude persons of Hispanic ethnicity. The historical racial/ethnic time-series were constructed using racial/ethnic enrollment data at the state level for individual grades. In some instances, enrollment data by race/ethnicity had to be imputed. Further, in some instances, the racial/ethnic enrollment data for individual grades had to be adjusted in order for them to sum to the state total for that grade. For additional information, see the Elementary and Secondary Enrollment section A.1 in Appendix A. Detail may not sum to totals because of rounding. Mean absolute percentage errors of selected education statistics can be found in table A-2, appendix A.SOURCE: U.S. Department of Education, National Center for Education Statistics, Common Core of Data (CCD), “State Nonfiscal Survey of Public Elementary/Secondary Education,” 1996–97 through 2010–11; and National Public Elementary and Secondary Enrollment by Race/Ethnicity Model, 1994–2010. (This table was prepared January 2012.)

This page intentionally left blank.

38 Reference Tables
Table 6. Actual and projected numbers for enrollment in grades PK–12 in public elementary and secondary schools, by region and state: Fall 2003 through fall 2021
[In thousands]
Region and state
Actual Projected
2003 2004 2005 2006 2007 2008 2009 2010 2011 2012
United States 48,540 48,795 49,113 49,316 49,293 49,266 49,373 49,484 49,636 49,828Northeast 8,292 8,271 8,240 8,258 8,122 8,053 8,093 8,071 8,110 8,104
Connecticut 577 577 575 575 571 567 564 561 554 549Maine 202 199 195 194 196 193 189 189 187 186Massachusetts 980 976 972 969 963 959 957 956 951 947New Hampshire 207 207 206 204 201 198 197 195 193 191New Jersey 1,381 1,393 1,396 1,389 1,382 1,381 1,396 1,403 1,384 1,380New York 2,865 2,836 2,816 2,810 2,765 2,741 2,766 2,735 2,817 2,824Pennsylvania 1,821 1,828 1,831 1,871 1,802 1,775 1,786 1,793 1,788 1,790Rhode Island 159 156 153 152 148 145 145 144 142 142Vermont 99 98 97 95 94 94 92 97 96 95
Midwest 10,809 10,775 10,819 10,819 10,770 10,743 10,672 10,610 10,581 10,575Illinois 2,101 2,098 2,112 2,118 2,113 2,120 2,104 2,092 2,089 2,084Indiana 1,011 1,021 1,035 1,046 1,047 1,046 1,047 1,047 1,047 1,049Iowa 481 478 483 483 485 488 492 496 495 495Kansas 470 469 468 470 468 471 474 484 484 487Michigan 1,758 1,751 1,742 1,723 1,693 1,660 1,649 1,587 1,569 1,557Minnesota 843 839 839 841 838 836 837 838 843 850Missouri 906 905 918 920 917 918 918 919 917 918Nebraska 286 286 287 288 291 293 295 299 301 304North Dakota 102 101 98 97 95 95 95 96 97 98Ohio 1,845 1,840 1,840 1,837 1,827 1,817 1,764 1,754 1,741 1,735South Dakota 126 123 122 121 122 126 124 126 126 127Wisconsin 880 865 875 877 875 874 872 872 871 873
South 17,673 17,892 18,103 18,294 18,425 18,491 18,652 18,805 18,896 19,028Alabama 731 730 742 744 745 746 749 756 755 754Arkansas 455 463 474 476 479 479 481 482 483 485Delaware 118 119 121 122 123 125 127 129 130 131District of Columbia 78 77 77 73 78 69 69 71 69 68Florida 2,588 2,639 2,675 2,672 2,667 2,631 2,635 2,643 2,648 2,664Georgia 1,523 1,553 1,598 1,629 1,650 1,656 1,668 1,677 1,684 1,697Kentucky 663 675 680 683 666 670 680 673 670 669Louisiana 728 724 655 676 681 685 691 697 697 699Maryland 869 866 860 852 846 844 848 852 855 860Mississippi 494 495 495 495 494 492 492 491 486 485North Carolina 1,360 1,386 1,416 1,444 1,489 1,489 1,483 1,491 1,490 1,492Oklahoma 626 629 635 639 642 645 655 660 662 667South Carolina 699 704 702 708 712 718 723 726 729 732Tennessee 937 941 954 978 964 972 973 987 986 988Texas 4,332 4,405 4,525 4,600 4,675 4,752 4,850 4,936 5,013 5,094Virginia 1,192 1,205 1,214 1,220 1,231 1,236 1,245 1,251 1,256 1,263West Virginia 281 280 281 282 283 283 283 283 281 280
West 11,766 11,857 11,951 11,945 11,976 11,979 11,956 11,998 12,049 12,121Alaska 134 133 133 133 131 131 132 132 133 134
Arizona 1,012 1,043 1,094 1,068 1,087 1,088 1,078 1,072 1,076 1,085California 6,414 6,442 6,437 6,407 6,343 6,323 6,263 6,301 6,320 6,347Colorado 758 766 780 794 802 818 832 843 852 861Hawaii 184 183 183 181 180 179 180 180 179 179Idaho 252 256 262 267 272 275 276 276 277 279Montana 148 147 145 144 143 142 142 142 142 142Nevada 385 400 412 425 429 433 429 437 440 444New Mexico 323 326 327 328 329 330 334 338 340 344Oregon 551 553 552 563 566 575 583 571 574 577Utah 496 504 508 523 576 560 583 574 576 580Washington 1,021 1,020 1,032 1,027 1,030 1,037 1,035 1,044 1,049 1,058Wyoming 87 85 84 85 86 87 88 89 90 91
See notes at end of table.

Projections of Education Statistics to 2021 39
Table 6. Actual and projected numbers for enrollment in grades PK–12 in public elementary and secondary schools, by region and state: Fall 2003 through fall 2021—Continued
[In thousands]
Region and state
Projected—Continued
2013 2014 2015 2016 2017 2018 2019 2020 2021
United States 50,067 50,407 50,773 51,146 51,524 51,880 52,260 52,688 53,113Northeast 8,106 8,114 8,127 8,140 8,158 8,175 8,197 8,224 8,248
Connecticut 546 544 543 542 542 543 545 548 551Maine 185 186 186 186 187 188 188 189 190Massachusetts 944 942 941 939 939 939 940 942 944New Hampshire 190 190 190 190 191 193 194 196 199New Jersey 1,377 1,376 1,377 1,378 1,380 1,382 1,385 1,390 1,394New York 2,829 2,830 2,828 2,826 2,825 2,821 2,819 2,817 2,815Pennsylvania 1,798 1,810 1,825 1,839 1,852 1,865 1,878 1,892 1,903Rhode Island 141 142 142 143 145 147 148 149 151Vermont 95 95 95 96 97 98 99 100 101
Midwest 10,580 10,613 10,652 10,688 10,728 10,759 10,789 10,830 10,868Illinois 2,080 2,083 2,088 2,092 2,098 2,100 2,102 2,106 2,109Indiana 1,050 1,052 1,056 1,060 1,063 1,066 1,067 1,072 1,077Iowa 497 498 499 500 501 501 501 501 500Kansas 490 494 499 502 505 507 509 511 512Michigan 1,545 1,543 1,540 1,539 1,539 1,539 1,541 1,545 1,551Minnesota 859 870 883 897 911 925 938 952 965Missouri 919 923 927 929 933 935 938 942 946Nebraska 306 309 312 315 318 319 321 322 323North Dakota 99 99 100 101 102 103 104 104 104Ohio 1,730 1,729 1,729 1,727 1,725 1,722 1,719 1,719 1,718South Dakota 127 128 129 130 131 132 133 134 134Wisconsin 877 883 890 896 903 909 915 922 929
South 19,165 19,333 19,505 19,669 19,828 19,972 20,124 20,297 20,481Alabama 754 756 756 756 755 753 751 751 751Arkansas 487 488 489 490 491 492 492 493 494Delaware 132 134 135 137 138 140 141 142 143District of Columbia 67 66 65 65 64 63 62 61 60Florida 2,678 2,700 2,723 2,751 2,780 2,812 2,847 2,889 2,936Georgia 1,710 1,723 1,739 1,751 1,764 1,777 1,791 1,808 1,828Kentucky 668 669 669 669 667 665 663 662 660Louisiana 700 700 701 701 699 695 692 688 685Maryland 866 875 886 898 913 927 943 957 972Mississippi 483 482 480 479 477 473 470 467 465North Carolina 1,496 1,503 1,511 1,517 1,523 1,527 1,532 1,542 1,555Oklahoma 671 677 681 684 687 689 690 692 692South Carolina 737 743 748 752 756 758 760 764 768Tennessee 993 999 1,006 1,012 1,018 1,023 1,030 1,037 1,046Texas 5,174 5,259 5,342 5,423 5,500 5,571 5,641 5,712 5,782Virginia 1,271 1,284 1,297 1,311 1,325 1,339 1,353 1,369 1,384West Virginia 278 277 275 273 271 268 266 262 259
West 12,216 12,347 12,489 12,648 12,809 12,974 13,150 13,337 13,516Alaska 136 139 142 145 148 151 154 158 161
Arizona 1,099 1,118 1,140 1,164 1,187 1,210 1,235 1,261 1,288California 6,385 6,443 6,505 6,584 6,665 6,748 6,838 6,929 7,013Colorado 871 883 895 906 917 927 936 946 954Hawaii 180 180 181 182 182 183 184 184 184Idaho 282 285 288 291 294 296 299 302 305Montana 143 144 145 146 147 148 149 149 150Nevada 449 456 464 472 481 491 502 514 528New Mexico 347 351 355 359 361 364 366 367 368Oregon 581 587 593 600 606 614 622 632 641Utah 583 587 590 593 595 599 603 609 616Washington 1,069 1,083 1,098 1,114 1,131 1,150 1,170 1,192 1,215Wyoming 92 92 93 94 94 94 94 94 93
NOTE: PK=prekindergarten. Some data have been revised from previously published figures. Detail may not sum to totals because of rounding. Mean absolute percentage errors of PK–12 enrollment in public elementary and secondary schools by state and region can be found in table A-7, appendix A.SOURCE: U.S. Department of Education, National Center for Education Statistics, Common Core of Data (CCD), “State Nonfiscal Survey of Public Elementary/Secondary Education,” 2003–04 through 2010–11; and State Public Elementary and Secondary Enrollment Model, 1980–2010. (This table was prepared January 2012.)

40 Reference Tables
Table 7. Actual and projected percentage changes in grades PK–12 enrollment in public elementary and secondary schools, by region and state: Fall 2003 through fall 2021
Region and state
Projected
Actual 2003–2010 2010–2016 2016–2021 2010–2021
United States 1.9 3.4 3.8 7.3Northeast -2.7 0.9 1.3 2.2
Connecticut -2.9 -3.3 1.7 -1.7Maine -6.4 -1.5 2.0 0.5Massachusetts -2.5 -1.7 0.5 -1.2New Hampshire -6.1 -2.2 4.4 2.0New Jersey 1.6 -1.7 1.2 -0.6New York -4.5 3.3 -0.4 2.9Pennsylvania -1.5 2.5 3.5 6.1Rhode Island -9.8 -0.4 5.3 4.9Vermont -2.3 -0.9 4.9 4.0
Midwest -1.8 0.7 1.7 2.4Illinois -0.4 # 0.8 0.8Indiana 3.6 1.2 1.7 2.9Iowa 3.0 0.9 # 0.9Kansas 2.8 3.8 2.0 5.8Michigan -9.7 -3.1 0.8 -2.2Minnesota -0.6 7.0 7.6 15.1Missouri 1.4 1.1 1.8 3.0Nebraska 4.5 5.5 2.4 8.1North Dakota -5.8 5.1 3.2 8.4Ohio -4.9 -1.6 -0.5 -2.1South Dakota 0.5 3.3 2.8 6.2Wisconsin -0.9 2.8 3.6 6.5
South 6.4 4.6 4.1 8.9Alabama 3.3 # -0.6 -0.6Arkansas 6.1 1.7 0.8 2.5Delaware 10.0 5.9 4.1 10.3District of Columbia -8.7 -9.5 -6.3 -15.2Florida 2.2 4.1 6.7 11.1Georgia 10.1 4.4 4.4 9.0Kentucky 1.5 -0.7 -1.2 -1.9Louisiana -4.3 0.6 -2.2 -1.6Maryland -1.9 5.4 8.2 14.0Mississippi -0.6 -2.4 -2.9 -5.2North Carolina 9.6 1.8 2.5 4.3Oklahoma 5.4 3.6 1.3 4.9South Carolina 3.8 3.7 2.0 5.8Tennessee 5.4 2.5 3.3 5.9Texas 13.9 9.9 6.6 17.2Virginia 5.0 4.8 5.6 10.6West Virginia 0.6 -3.4 -5.2 -8.3
West 2.0 5.4 6.9 12.7Alaska -1.4 9.7 11.1 21.9Arizona 5.9 8.6 10.7 20.1California -1.8 4.5 6.5 11.3Colorado 11.3 7.5 5.3 13.1Hawaii -2.2 1.1 1.4 2.6Idaho 9.4 5.5 4.7 10.4Montana -4.5 3.0 2.7 5.8Nevada 13.4 8.0 11.8 20.7New Mexico 4.7 6.1 2.7 8.9Oregon 3.5 5.1 6.9 12.4Utah 15.7 3.3 4.0 7.4Washington 2.2 6.7 9.1 16.4Wyoming 1.8 5.1 -0.6 4.4
# Rounds to zero.NOTE: PK=prekindergarten. Calculations are based on unrounded numbers. Mean absolute percentage errors of PK–12 enrollment in public elementary and secondary schools by state and region can be found in table A-7, appendix A.SOURCE: U.S. Department of Education, National Center for Education Statistics, Common Core of Data (CCD), “State Nonfiscal Survey of Public Elementary/Secondary Education,” selected years, 2003–04 through 2010–11; and State Public Elementary and Secondary Enrollment Model, 1980–2010. (This table was prepared January 2012.)

This page intentionally left blank.

42 Reference Tables
Table 8. Actual and projected numbers for enrollment in grades PK–8 in public schools, by region and state: Fall 2003 through fall 2021
[In thousands]
Region and state
Actual Projected
2003 2004 2005 2006 2007 2008 2009 2010 2011 2012
United States 34,201 34,178 34,204 34,235 34,205 34,286 34,418 34,625 34,849 35,076Northeast 5,752 5,689 5,623 5,574 5,504 5,476 5,495 5,540 5,560 5,559
Connecticut 408 404 400 398 394 392 390 387 385 383Maine 139 136 133 132 131 129 129 129 129 129Massachusetts 692 682 675 671 667 667 667 666 664 662New Hampshire 142 140 139 136 134 133 133 132 131 130New Jersey 978 976 971 963 954 957 968 981 973 972New York 1,978 1,943 1,909 1,887 1,856 1,843 1,847 1,869 1,895 1,890Pennsylvania 1,236 1,235 1,228 1,220 1,205 1,194 1,201 1,210 1,219 1,229Rhode Island 111 107 104 102 99 98 98 98 97 97Vermont 67 66 65 64 63 63 63 68 68 68
Midwest 7,502 7,439 7,425 7,405 7,359 7,373 7,362 7,349 7,368 7,388Illinois 1,493 1,484 1,480 1,478 1,473 1,479 1,464 1,455 1,457 1,459Indiana 717 720 724 730 730 730 731 729 731 733Iowa 327 324 326 326 330 336 341 348 349 350Kansas 322 321 321 326 327 331 333 343 344 347Michigan 1,229 1,212 1,191 1,171 1,137 1,119 1,115 1,076 1,070 1,066Minnesota 564 558 558 558 558 560 565 570 579 588Missouri 632 629 635 634 632 635 638 643 645 646Nebraska 195 195 195 196 200 203 207 210 213 216North Dakota 68 67 66 64 63 64 65 66 67 68Ohio 1,278 1,267 1,261 1,253 1,241 1,239 1,225 1,223 1,221 1,219South Dakota 86 84 84 83 83 87 86 88 88 89Wisconsin 590 578 584 585 585 590 593 598 602 607
South 12,675 12,780 12,882 12,990 13,086 13,167 13,301 13,435 13,539 13,649Alabama 525 522 529 529 527 528 529 534 534 535Arkansas 322 328 336 337 340 342 344 346 347 348Delaware 83 84 85 85 85 87 88 90 92 93District of Columbia 59 57 56 52 56 51 52 54 52 51Florida 1,832 1,858 1,873 1,867 1,856 1,849 1,851 1,858 1,866 1,880Georgia 1,103 1,118 1,145 1,167 1,179 1,186 1,195 1,202 1,212 1,219Kentucky 478 486 487 487 469 472 484 480 481 481Louisiana 536 534 482 492 500 504 510 512 516 517Maryland 606 597 589 579 576 576 582 588 593 601Mississippi 361 361 358 356 354 352 352 351 350 350North Carolina 974 986 1,003 1,027 1,072 1,059 1,054 1,058 1,058 1,058Oklahoma 450 453 457 460 463 468 477 483 487 490South Carolina 501 504 498 501 505 508 512 516 519 523Tennessee 675 671 677 692 682 685 687 702 705 709Texas 3,133 3,184 3,268 3,320 3,375 3,447 3,520 3,587 3,646 3,707Virginia 837 840 841 842 850 855 864 871 880 888West Virginia 199 198 197 198 199 199 200 201 201 200
West 8,272 8,270 8,274 8,267 8,256 8,269 8,261 8,300 8,382 8,480Alaska 94 92 91 90 89 89 91 92 93 95
Arizona 704 722 740 760 771 772 760 752 767 782California 4,540 4,507 4,466 4,410 4,329 4,306 4,264 4,300 4,328 4,374Colorado 536 541 550 559 566 580 591 601 610 619Hawaii 130 129 127 126 126 126 127 128 128 129Idaho 175 178 183 187 191 194 195 194 196 198Montana 100 99 98 97 96 97 98 98 99 100Nevada 281 289 296 303 308 308 306 307 312 316New Mexico 226 228 230 230 230 231 235 239 242 246Oregon 378 377 380 381 384 395 404 393 398 401Utah 349 355 358 371 410 404 421 419 423 426Washington 699 695 699 695 697 705 705 714 721 730Wyoming 60 57 57 58 59 61 62 63 64 64
See notes at end of table.

Projections of Education Statistics to 2021 43
Table 8. Actual and projected numbers for enrollment in grades PK–8 in public schools, by region and state: Fall 2003 through fall 2021—Continued
[In thousands]
Region and state
Projected—Continued
2013 2014 2015 2016 2017 2018 2019 2020 2021
United States 35,301 35,502 35,735 36,029 36,329 36,639 36,956 37,278 37,598Northeast 5,561 5,563 5,573 5,591 5,607 5,625 5,650 5,676 5,703
Connecticut 381 380 380 382 383 386 389 392 396Maine 129 129 130 131 132 133 134 134 134Massachusetts 660 658 657 657 657 657 659 662 666New Hampshire 130 130 131 132 134 136 138 139 141New Jersey 971 970 971 973 975 977 981 986 991New York 1,886 1,880 1,877 1,876 1,874 1,874 1,879 1,883 1,887Pennsylvania 1,238 1,246 1,255 1,268 1,278 1,285 1,292 1,299 1,306Rhode Island 99 100 101 102 103 104 105 106 107Vermont 68 69 70 71 71 73 74 74 75
Midwest 7,412 7,430 7,449 7,485 7,520 7,550 7,578 7,605 7,629Illinois 1,463 1,463 1,463 1,465 1,468 1,472 1,476 1,481 1,485Indiana 735 737 736 739 743 746 749 752 756Iowa 351 352 352 353 353 353 352 351 350Kansas 350 352 353 355 356 357 358 359 359Michigan 1,064 1,062 1,062 1,067 1,074 1,079 1,085 1,089 1,092Minnesota 597 606 616 626 636 645 654 663 672Missouri 648 650 652 655 659 661 663 665 667Nebraska 218 220 221 222 223 223 223 223 223North Dakota 68 70 70 71 71 71 71 71 71Ohio 1,216 1,213 1,210 1,210 1,211 1,211 1,211 1,211 1,210South Dakota 90 91 92 93 93 93 93 93 93Wisconsin 611 616 621 628 634 639 643 647 650
South 13,750 13,829 13,915 14,025 14,148 14,278 14,410 14,547 14,689Alabama 534 531 530 529 529 529 528 528 528Arkansas 348 348 348 348 348 348 349 350 351Delaware 94 95 96 97 98 98 99 100 100District of Columbia 51 50 50 49 49 48 48 47 46Florida 1,894 1,910 1,929 1,955 1,988 2,020 2,054 2,088 2,122Georgia 1,226 1,233 1,240 1,251 1,265 1,278 1,291 1,305 1,320Kentucky 480 478 475 474 473 471 470 469 469Louisiana 517 513 511 508 506 504 501 499 496Maryland 610 619 630 640 651 661 672 683 693Mississippi 349 346 344 342 341 338 336 333 331North Carolina 1,057 1,055 1,052 1,052 1,054 1,069 1,084 1,102 1,120Oklahoma 493 494 495 497 497 497 497 498 498South Carolina 526 527 528 530 533 535 538 540 543Tennessee 711 714 716 720 726 731 737 744 751Texas 3,764 3,814 3,863 3,915 3,966 4,016 4,065 4,113 4,162Virginia 897 905 914 924 935 946 957 968 980West Virginia 199 197 195 192 190 187 185 182 180
West 8,578 8,681 8,799 8,928 9,055 9,187 9,318 9,449 9,577Alaska 97 99 101 104 107 109 112 114 117Arizona 797 811 827 844 861 880 900 920 940California 4,422 4,473 4,534 4,599 4,661 4,724 4,788 4,850 4,909Colorado 627 633 639 645 650 656 663 670 677Hawaii 130 130 131 132 132 133 132 132 132Idaho 200 202 204 206 209 211 213 215 217Montana 101 102 103 104 105 105 105 105 105Nevada 320 325 330 337 346 355 365 376 387New Mexico 248 251 253 255 257 258 259 259 258Oregon 404 409 414 421 427 435 442 449 456Utah 429 431 434 438 443 446 450 454 459Washington 739 749 762 777 793 808 824 841 857Wyoming 65 65 66 66 65 65 64 64 63
NOTE: PK=prekindergarten. Some data have been revised from previously published figures. Detail may not sum to totals because of rounding. Mean absolute percentage errors of PK–8 enrollment in public elementary and secondary schools by state and region can be found in table A-8, appendix A.SOURCE: U.S. Department of Education, National Center for Education Statistics, Common Core of Data (CCD), “State Nonfiscal Survey of Public Elementary/Secondary Education,” 2003–04 through 2010–11; and State Public Elementary and Secondary Enrollment Model, 1980–2010. (This table was prepared January 2012.)

44 Reference Tables
Table 9. Actual and projected percentage changes in grades PK–8 enrollment in public schools, by region and state: Fall 2003 through fall 2021
Region and state
Projected
Actual 2003–2010 2010–2016 2016–2021 2010–2021
United States 1.2 4.1 4.4 8.6Northeast -3.7 0.9 2.0 2.9
Connecticut -5.0 -1.4 3.5 2.1Maine -7.5 1.7 2.6 4.3Massachusetts -3.7 -1.4 1.3 -0.1New Hampshire -7.4 0.4 7.1 7.5New Jersey 0.3 -0.9 1.9 1.0New York -5.5 0.4 0.6 1.0Pennsylvania -2.1 4.8 3.0 7.9Rhode Island -12.1 4.1 5.1 9.4Vermont 1.9 3.7 6.6 10.6
Midwest -2.0 1.8 1.9 3.8Illinois -2.5 0.7 1.4 2.1Indiana 1.8 1.4 2.2 3.6Iowa 6.5 1.4 -0.8 0.6Kansas 6.3 3.6 1.2 4.8Michigan -12.5 -0.8 2.4 1.6Minnesota 1.0 9.9 7.3 17.9Missouri 1.7 1.9 1.8 3.8Nebraska 7.6 5.6 0.3 5.9North Dakota -2.7 7.6 -0.7 6.9Ohio -4.3 -1.0 # -1.0South Dakota 2.2 5.3 0.7 6.1Wisconsin 1.5 4.9 3.6 8.6
South 6.0 4.4 4.7 9.3Alabama 1.6 -0.8 -0.3 -1.1Arkansas 7.6 0.6 1.0 1.5Delaware 8.9 7.4 3.5 11.1District of Columbia -10.0 -8.2 -5.4 -13.2Florida 1.4 5.2 8.5 14.2Georgia 9.0 4.0 5.5 9.8Kentucky 0.4 -1.3 -1.0 -2.3Louisiana -4.5 -0.8 -2.4 -3.2Maryland -2.9 8.9 8.2 17.8Mississippi -2.8 -2.5 -3.4 -5.8North Carolina 8.7 -0.6 6.4 5.8Oklahoma 7.4 2.7 0.4 3.1South Carolina 3.0 2.9 2.3 5.2Tennessee 3.9 2.7 4.2 7.0Texas 14.5 9.2 6.3 16.0Virginia 4.1 6.1 6.0 12.4West Virginia 1.3 -4.6 -6.4 -10.7
West 0.3 7.6 7.3 15.4Alaska -1.8 13.2 12.0 26.8Arizona 6.8 12.2 11.4 25.0California -5.3 7.0 6.7 14.2Colorado 12.1 7.4 4.9 12.6Hawaii -1.9 3.4 # 3.5Idaho 10.7 6.1 5.3 11.8Montana -1.7 5.4 1.5 7.0Nevada 9.5 9.7 14.8 26.0New Mexico 5.9 6.5 1.4 8.0Oregon 3.8 7.1 8.4 16.1Utah 20.0 4.7 4.7 9.6Washington 2.1 8.8 10.3 20.0Wyoming 5.1 4.7 -4.1 0.4
# Rounds to zero.NOTE: PK=prekindergarten. Calculations are based on unrounded numbers. Mean absolute percentage errors of PK–8 enrollment in public elementary and secondary schools by state and region can be found in table A-8, appendix A.SOURCE: U.S. Department of Education, National Center for Education Statistics, Common Core of Data (CCD), “State Nonfiscal Survey of Public Elementary/Secondary Education,” selected years, 2002–03 through 2010–11; and State Public Elementary and Secondary Enrollment Model, 1980–2010. (This table was prepared February 2012.)

This page intentionally left blank.

46 Reference Tables
Table 10. Actual and projected numbers for enrollment in grades 9–12 in public schools, by region and state: Fall 2003 through fall 2021
[In thousands]
Region and state
Actual Projected
2003 2004 2005 2006 2007 2008 2009 2010 2011 2012
United States 14,339 14,618 14,909 15,081 15,087 14,980 14,955 14,860 14,787 14,752Northeast 2,541 2,582 2,617 2,684 2,618 2,577 2,598 2,531 2,550 2,545
Connecticut 169 173 175 177 177 175 174 173 169 166Maine 63 63 62 62 66 64 61 60 58 57Massachusetts 288 293 297 298 296 292 291 289 286 285New Hampshire 65 67 67 67 66 65 64 63 62 61New Jersey 402 417 425 425 428 425 428 421 411 408New York 887 894 907 922 909 898 919 866 921 933Pennsylvania 586 593 603 651 597 581 586 584 569 562Rhode Island 48 49 50 50 48 47 47 46 45 44Vermont 32 32 32 32 31 31 30 29 28 27
Midwest 3,307 3,337 3,394 3,415 3,411 3,370 3,310 3,260 3,213 3,187Illinois 608 614 631 641 640 641 640 637 631 624Indiana 294 301 311 316 317 316 316 318 316 316Iowa 154 154 157 157 156 152 151 148 146 145Kansas 148 148 147 143 142 140 141 141 139 140Michigan 528 540 551 552 556 541 534 511 499 491Minnesota 279 280 281 282 279 276 272 268 264 262Missouri 274 277 283 286 285 282 280 276 272 272Nebraska 90 91 92 92 91 90 89 88 88 88North Dakota 34 33 33 32 32 31 30 30 30 30Ohio 567 573 578 584 586 578 539 531 520 516South Dakota 40 39 38 38 38 39 38 38 38 37Wisconsin 290 287 291 292 289 284 279 274 269 266
South 4,998 5,112 5,221 5,304 5,338 5,324 5,351 5,370 5,356 5,379Alabama 206 208 212 215 218 218 219 222 220 220Arkansas 133 135 138 140 139 137 136 136 137 137Delaware 35 35 36 37 38 39 39 39 38 38District of Columbia 19 20 21 20 23 18 18 18 17 17Florida 755 782 802 805 811 782 784 785 783 784Georgia 419 435 453 463 471 470 473 475 473 478Kentucky 185 189 192 196 197 198 196 193 189 187Louisiana 191 191 172 184 181 181 181 184 182 182Maryland 263 268 271 273 269 267 267 264 262 259Mississippi 133 134 137 139 141 140 141 140 136 134North Carolina 386 400 413 417 417 430 430 432 433 434Oklahoma 176 177 178 179 179 177 178 176 175 177South Carolina 198 199 204 207 208 211 211 210 209 209Tennessee 261 270 277 286 283 287 286 286 281 280Texas 1,199 1,221 1,257 1,280 1,300 1,306 1,330 1,349 1,366 1,387Virginia 355 365 372 379 380 381 381 380 377 375West Virginia 82 83 84 84 84 83 82 81 80 80
West 3,494 3,587 3,677 3,678 3,720 3,710 3,696 3,698 3,667 3,641Alaska 40 41 42 42 42 41 41 40 40 39
Arizona 308 321 355 309 316 316 317 320 310 303California 1,874 1,934 1,972 1,997 2,015 2,016 1,999 2,001 1,992 1,973Colorado 221 225 230 235 236 238 241 242 242 242Hawaii 54 54 55 55 54 54 53 52 51 50Idaho 77 78 79 80 81 81 82 82 81 81Montana 48 48 48 47 46 45 44 43 42 42Nevada 105 111 116 122 122 125 123 130 129 128New Mexico 97 98 97 98 99 99 99 99 98 98Oregon 173 176 173 182 182 180 178 178 176 176Utah 147 148 151 152 166 155 161 155 153 153Washington 322 325 333 332 333 332 330 330 328 329Wyoming 28 27 27 27 27 27 26 26 26 26
See notes at end of table.
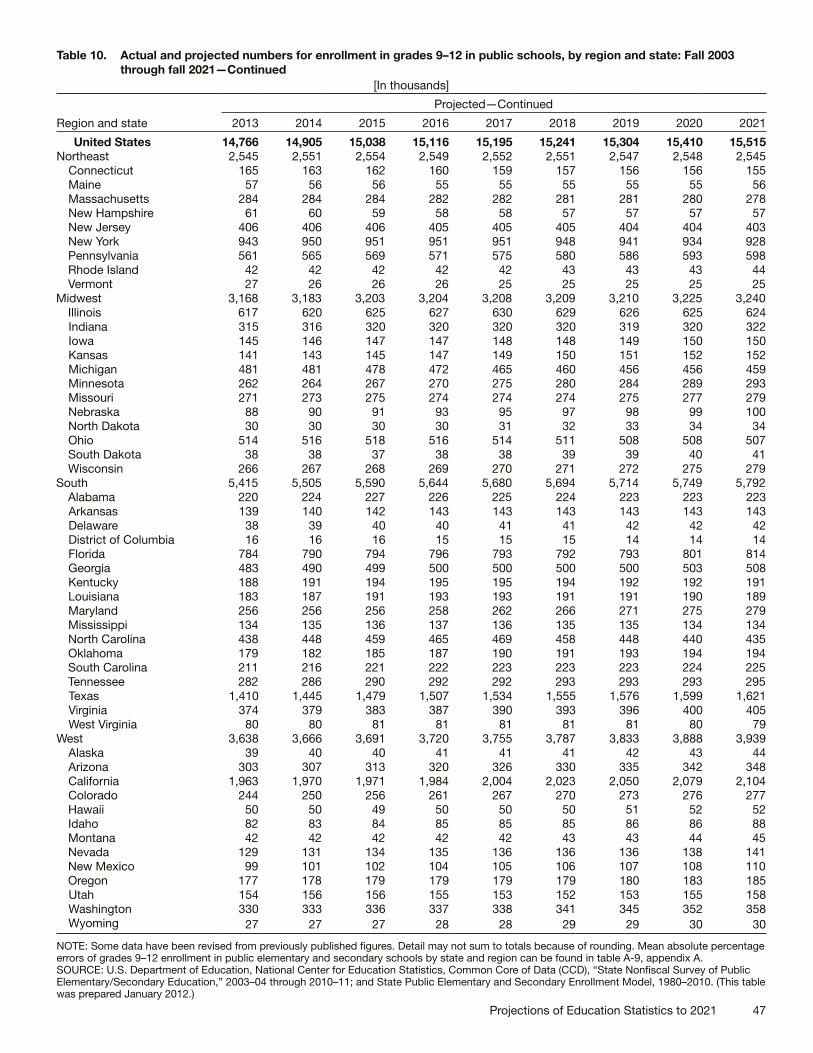
Projections of Education Statistics to 2021 47
Table 10. Actual and projected numbers for enrollment in grades 9–12 in public schools, by region and state: Fall 2003 through fall 2021—Continued
[In thousands]
Region and state
Projected—Continued
2013 2014 2015 2016 2017 2018 2019 2020 2021
United States 14,766 14,905 15,038 15,116 15,195 15,241 15,304 15,410 15,515Northeast 2,545 2,551 2,554 2,549 2,552 2,551 2,547 2,548 2,545
Connecticut 165 163 162 160 159 157 156 156 155Maine 57 56 56 55 55 55 55 55 56Massachusetts 284 284 284 282 282 281 281 280 278New Hampshire 61 60 59 58 58 57 57 57 57New Jersey 406 406 406 405 405 405 404 404 403New York 943 950 951 951 951 948 941 934 928Pennsylvania 561 565 569 571 575 580 586 593 598Rhode Island 42 42 42 42 42 43 43 43 44Vermont 27 26 26 26 25 25 25 25 25
Midwest 3,168 3,183 3,203 3,204 3,208 3,209 3,210 3,225 3,240Illinois 617 620 625 627 630 629 626 625 624Indiana 315 316 320 320 320 320 319 320 322Iowa 145 146 147 147 148 148 149 150 150Kansas 141 143 145 147 149 150 151 152 152Michigan 481 481 478 472 465 460 456 456 459Minnesota 262 264 267 270 275 280 284 289 293Missouri 271 273 275 274 274 274 275 277 279Nebraska 88 90 91 93 95 97 98 99 100North Dakota 30 30 30 30 31 32 33 34 34Ohio 514 516 518 516 514 511 508 508 507South Dakota 38 38 37 38 38 39 39 40 41Wisconsin 266 267 268 269 270 271 272 275 279
South 5,415 5,505 5,590 5,644 5,680 5,694 5,714 5,749 5,792Alabama 220 224 227 226 225 224 223 223 223Arkansas 139 140 142 143 143 143 143 143 143Delaware 38 39 40 40 41 41 42 42 42District of Columbia 16 16 16 15 15 15 14 14 14Florida 784 790 794 796 793 792 793 801 814Georgia 483 490 499 500 500 500 500 503 508Kentucky 188 191 194 195 195 194 192 192 191Louisiana 183 187 191 193 193 191 191 190 189Maryland 256 256 256 258 262 266 271 275 279Mississippi 134 135 136 137 136 135 135 134 134North Carolina 438 448 459 465 469 458 448 440 435Oklahoma 179 182 185 187 190 191 193 194 194South Carolina 211 216 221 222 223 223 223 224 225Tennessee 282 286 290 292 292 293 293 293 295Texas 1,410 1,445 1,479 1,507 1,534 1,555 1,576 1,599 1,621Virginia 374 379 383 387 390 393 396 400 405West Virginia 80 80 81 81 81 81 81 80 79
West 3,638 3,666 3,691 3,720 3,755 3,787 3,833 3,888 3,939Alaska 39 40 40 41 41 41 42 43 44Arizona 303 307 313 320 326 330 335 342 348California 1,963 1,970 1,971 1,984 2,004 2,023 2,050 2,079 2,104Colorado 244 250 256 261 267 270 273 276 277Hawaii 50 50 49 50 50 50 51 52 52Idaho 82 83 84 85 85 85 86 86 88Montana 42 42 42 42 42 43 43 44 45Nevada 129 131 134 135 136 136 136 138 141New Mexico 99 101 102 104 105 106 107 108 110Oregon 177 178 179 179 179 179 180 183 185Utah 154 156 156 155 153 152 153 155 158Washington 330 333 336 337 338 341 345 352 358Wyoming 27 27 27 28 28 29 29 30 30
NOTE: Some data have been revised from previously published figures. Detail may not sum to totals because of rounding. Mean absolute percentage errors of grades 9–12 enrollment in public elementary and secondary schools by state and region can be found in table A-9, appendix A.SOURCE: U.S. Department of Education, National Center for Education Statistics, Common Core of Data (CCD), “State Nonfiscal Survey of Public Elementary/Secondary Education,” 2003–04 through 2010–11; and State Public Elementary and Secondary Enrollment Model, 1980–2010. (This table was prepared January 2012.)

48 Reference Tables
Table 11. Actual and projected percentage changes in grades 9–12 enrollment in public schools, by region and state: Fall 2003 through fall 2021
Region and state
Projected
Actual 2003–2010 2010–2016 2016–2021 2010–2021
United States 3.6 1.7 2.6 4.4Northeast -0.4 0.7 -0.2 0.6
Connecticut 2.2 -7.7 -2.7 -10.2Maine -4.0 -8.2 0.8 -7.5Massachusetts 0.3 -2.5 -1.3 -3.8New Hampshire -3.4 -7.8 -1.8 -9.4New Jersey 4.7 -3.8 -0.5 -4.2New York -2.3 9.8 -2.3 7.2Pennsylvania # -2.1 4.6 2.4Rhode Island -4.4 -9.9 5.7 -4.7Vermont -10.8 -11.7 -0.1 -11.7
Midwest -1.4 -1.7 1.1 -0.6Illinois 4.7 -1.5 -0.5 -2.0Indiana 8.0 0.8 0.4 1.2Iowa -4.4 -0.1 1.7 1.6Kansas -4.9 4.3 3.9 8.3Michigan -3.2 -7.8 -2.7 -10.3Minnesota -3.8 0.9 8.3 9.3Missouri 0.7 -0.8 1.8 1.0Nebraska -2.1 5.4 7.3 13.2North Dakota -11.9 -0.6 12.5 11.9Ohio -6.3 -2.8 -1.7 -4.5South Dakota -3.4 -1.4 8.0 6.5Wisconsin -5.7 -1.8 3.6 1.7
South 7.5 5.1 2.6 7.8Alabama 7.8 2.0 -1.4 0.6Arkansas 2.5 4.6 0.3 5.0Delaware 12.5 2.6 5.6 8.4District of Columbia -4.5 -13.2 -9.2 -21.2Florida 3.9 1.4 2.2 3.7Georgia 13.2 5.4 1.6 7.1Kentucky 4.1 0.9 -1.7 -0.8Louisiana -3.7 4.5 -1.8 2.6Maryland 0.3 -2.3 8.0 5.6Mississippi 5.3 -2.1 -1.7 -3.8North Carolina 11.9 7.5 -6.5 0.6Oklahoma 0.3 6.1 3.6 10.0South Carolina 5.9 5.7 1.4 7.1Tennessee 9.3 2.1 1.0 3.1Texas 12.5 11.7 7.5 20.1Virginia 7.1 1.8 4.7 6.5West Virginia -1.2 -0.2 -2.3 -2.5
West 5.8 0.6 5.9 6.5Alaska -0.3 1.6 8.8 10.5Arizona 3.9 # 8.7 8.7California 6.8 -0.8 6.0 5.1Colorado 9.4 7.8 6.2 14.4Hawaii -2.8 -4.6 5.2 0.4Idaho 6.5 4.0 3.0 7.1Montana -10.4 -2.6 5.8 3.0Nevada 24.1 4.0 4.1 8.2New Mexico 1.8 5.1 5.8 11.2Oregon 2.8 0.5 3.5 4.1Utah 5.6 -0.4 1.9 1.5Washington 2.3 2.1 6.4 8.6Wyoming -5.3 5.9 7.8 14.1
# Rounds to zero. NOTE: Calculations are based on unrounded numbers. Mean absolute percentage errors of grades 9–12 enrollment in public elementary and secondary schools by state and region can be found in table A-9, appendix A. SOURCE: U.S. Department of Education, National Center for Education Statistics, Common Core of Data (CCD), “State Nonfiscal Survey of Public Elementary/Secondary Education,” selected years, 2003–04 through 2010–11; and State Public Elementary and Secondary Enrollment Model, 1980–2010. (This table was prepared January 2012.)

Projections of Education Statistics to 2021 49
Table 12. Actual and projected numbers for high school graduates, by control of school: School years 1996–97 through 2021–22
School year Total Public Private
Actual1996–97 2,611,988 2,358,403 253,5851997–981 2,704,133 2,439,050 265,0831998–99 2,758,655 2,485,630 273,0251999–20001 2,832,656 2,553,844 278,8122000–01 2,847,973 2,569,200 278,7732001–021 2,906,287 2,621,534 284,7532002–03 3,015,702 2,719,947 295,7552003–041 3,054,247 2,753,438 300,8092004–05 3,106,499 2,799,250 307,2492005–061 3,119,258 2,815,544 303,7142006–07 3,199,650 2,893,045 306,6052007–081 3,312,870 3,001,337 311,5332008–09 3,347,828 3,039,015 308,813
Projected2009–10 3,375,200 3,068,550 306,6502010–11 3,402,920 3,103,540 299,3802011–12 3,392,650 3,100,510 292,1402012–13 3,375,660 3,092,290 283,3702013–14 3,314,600 3,037,040 277,5602014–15 3,307,080 3,043,290 263,7902015–16 3,325,230 3,066,000 259,2302016–17 3,347,990 3,096,730 251,2602017–18 3,396,230 3,148,670 247,5602018–19 3,396,260 3,155,320 240,9402019–20 3,368,740 3,136,780 231,9602020–21 3,392,510 3,163,350 229,1602021–22 3,415,830 3,183,360 232,470
1 Since the biennial Private School Universe Survey (PSS) is collected in the fall of odd-numbered years and the numbers collected for high school graduates are for the preceding year, private school numbers for odd years are estimated based on data from the PSS. NOTE: Some data have been revised from previously published figures. Detail may not sum to totals because of rounding. Mean absolute percentage errors of selected education statistics can be found in table A-2, appendix A. SOURCE: U.S. Department of Education, National Center for Education Statistics, Common Core of Data (CCD), “State Nonfiscal Survey of Public Elementary/Secondary Education,” 1997–98 through 2009–10; Private School Universe Survey (PSS), selected years, 1997–98 through 2009–10; and National Elementary and Secondary High School Graduates Model, 1972–73 through 2008–09. (This table was prepared January 2012.)

50 Reference Tables
Table 13. Actual and projected numbers for public high school graduates, by race/ethnicity: School years 1996–97 through 2021–22
Race/ethnicity
School year Total White Black HispanicAsian/Pacific
IslanderAmerican Indian/
Alaska Native
Actual1996–97 2,358,403 1,687,683 309,626 234,043 104,764 22,2871997–98 2,439,050 1,733,478 317,846 252,023 112,089 23,6141998–99 2,485,630 1,754,617 322,532 268,539 115,930 24,0121999–2000 2,553,844 1,787,322 334,206 283,738 123,231 25,3472000–01 2,569,200 1,782,294 336,375 297,696 126,847 25,9882001–02 2,621,534 1,801,175 345,854 314,989 132,347 27,1692002–03 2,719,947 1,857,954 359,051 339,555 135,614 27,7732003–04 2,753,438 1,851,136 373,307 362,467 137,913 28,6152004–05 2,799,250 1,856,760 385,180 382,964 143,751 30,5952005–06 2,815,544 1,854,776 392,180 388,718 150,567 29,3032006–07 2,893,045 1,884,020 412,698 410,587 154,935 30,8052007–08 3,001,337 1,917,973 455,968 433,658 161,434 32,3042008–091 3,039,015 1,900,999 486,653 454,289 164,659 32,415
Projected2009–10 3,068,550 1,877,780 500,390 489,330 167,350 33,6902010–11 3,103,540 1,852,470 508,060 538,850 171,540 32,6202011–12 3,100,510 1,823,190 505,250 564,160 174,840 33,0802012–13 3,092,290 1,804,370 490,850 585,520 179,630 31,9202013–14 3,037,040 1,780,630 463,570 582,940 179,900 30,0102014–15 3,043,290 1,755,950 468,630 604,550 184,100 30,0602015–16 3,066,000 1,761,910 467,850 622,060 182,960 31,2202016–17 3,096,730 1,763,000 471,260 642,440 188,610 31,4202017–18 3,148,670 1,768,990 478,830 667,990 201,290 31,5702018–19 3,155,320 1,754,460 474,540 692,820 201,780 31,7302019–20 3,136,780 1,729,150 466,060 703,310 206,420 31,8402020–21 3,163,350 1,735,420 456,850 722,570 216,380 32,1402021–22 3,183,360 1,731,420 456,020 741,310 222,420 32,190
1 In the 2008–09 school year, five states reported high school graduate counts for graduates of two or more races. These high school graduate counts were proportioned across the other racial/ethnic categories. When more complete sets of data for high school graduates of two or more races are compiled, separate projections for that category will be presented. NOTE: Some data have been revised from previously published figures. Detail may not sum to totals because of rounding. The historical racial/ethnic time-series were constructed using racial/ethnic high school graduate data at the state level. In some instances, high school graduate data by race/ethnicity had to be imputed. Further, in some instances, the racial/ethnic data had to be adjusted in order for them to sum to the state total for high school graduates. Race categories exclude persons of Hispanic ethnicity. For additional information see the High School Graduates section A.2 in appendix A. Mean absolute percentage errors of selected education statistics can be found in table A-2, appendix A. SOURCE: U.S. Department of Education, National Center for Education Statistics, Common Core of Data (CCD), “State Nonfiscal Survey of Public Elementary/Secondary Education,” 1997–98 through 2009–10; and National Public Elementary and Secondary High School Graduates by Race/Ethnicity Model, 1972–73 through 2008–09. (This table was prepared January 2012.)

This page intentionally left blank.

52 Reference Tables
Table 14. Actual and projected numbers for public high school graduates, by region and state: School years 2003–04 through 2021–22
Region and state
Actual Projected
2003–04 2004–05 2005–06 2006–07 2007–08 2008–09 2009–10 2010–11 2011–12 2012–13
United States 2,753,438 2,799,250 2,815,544 2,893,045 3,001,337 3,039,015 3,068,550 3,103,540 3,100,510 3,092,290Northeast 485,670 503,528 521,015 536,697 552,289 552,973 558,750 560,500 554,690 549,890
Connecticut 34,573 35,515 36,222 37,541 38,419 34,968 38,120 38,450 37,100 36,460Maine 13,278 13,077 12,950 13,151 14,350 14,093 13,970 14,030 13,570 13,060Massachusetts 58,326 59,665 61,272 63,903 65,197 65,258 64,040 63,820 64,210 63,530New Hampshire 13,309 13,775 13,988 14,452 14,982 14,757 14,830 14,300 14,310 14,060New Jersey 83,826 86,502 90,049 93,013 94,994 95,085 96,510 95,200 94,280 93,880New York 142,526 153,203 161,817 168,333 176,310 180,917 182,880 185,930 185,910 187,890Pennsylvania 123,474 124,758 127,830 128,603 130,298 130,658 131,250 132,100 128,430 124,830Rhode Island 9,258 9,881 10,108 10,384 10,347 10,028 10,090 9,880 10,020 9,650Vermont 7,100 7,152 6,779 7,317 7,392 7,209 7,070 6,790 6,860 6,530
Midwest 680,178 676,786 684,049 702,987 721,220 717,536 707,880 702,540 698,810 692,640Illinois 124,763 123,615 126,817 130,220 135,143 131,670 132,200 132,670 136,650 135,750Indiana 56,008 55,444 57,920 59,887 61,901 63,663 63,830 65,460 65,490 65,990Iowa 34,339 33,547 33,693 34,127 34,573 33,926 34,580 33,710 33,500 32,580Kansas 30,155 30,355 29,818 30,139 30,737 30,368 31,630 31,320 31,600 31,380Michigan 98,823 101,582 102,582 111,838 115,183 112,742 113,820 110,300 107,020 107,150Minnesota 59,096 58,391 58,898 59,497 60,409 59,729 60,400 59,720 58,770 57,250Missouri 57,983 57,841 58,417 60,275 61,717 62,969 63,640 62,470 62,310 61,860Nebraska 20,309 19,940 19,764 19,873 20,035 19,501 19,640 19,620 19,750 19,660North Dakota 7,888 7,555 7,192 7,159 6,999 7,232 7,160 7,110 7,000 6,980Ohio 119,029 116,702 117,356 117,658 120,758 122,203 107,900 108,010 105,130 104,260South Dakota 9,001 8,585 8,589 8,346 8,582 8,123 8,240 8,550 8,400 8,280Wisconsin 62,784 63,229 63,003 63,968 65,183 65,410 64,840 63,600 63,190 61,500
South 946,808 953,206 962,327 986,801 1,031,773 1,068,270 1,087,000 1,108,150 1,111,310 1,120,870Alabama 36,464 37,453 37,918 38,912 41,346 42,082 43,110 44,520 44,570 44,400Arkansas 27,181 26,621 28,790 27,166 28,725 28,057 28,650 28,440 28,520 28,170Delaware 6,951 6,934 7,275 7,205 7,388 7,839 8,050 8,190 8,520 8,320District of Columbia 3,031 2,781 3,150 2,944 3,352 3,517 3,150 3,260 3,250 3,200Florida 131,418 133,318 134,686 142,284 149,046 153,461 158,070 163,620 159,450 164,040Georgia 68,550 70,834 73,498 77,829 83,505 88,003 89,730 92,160 90,130 91,980Kentucky 37,787 38,399 38,449 39,099 39,339 41,851 41,310 41,930 40,950 40,310Louisiana 37,019 36,009 33,275 34,274 34,401 35,622 34,790 34,450 34,700 35,210Maryland 52,870 54,170 55,536 57,564 59,171 58,304 58,560 57,900 58,760 58,560Mississippi 23,735 23,523 23,848 24,186 24,795 24,505 26,260 26,930 26,610 26,710North Carolina 72,126 75,010 76,710 76,031 83,307 86,712 84,900 87,370 90,280 89,820Oklahoma 36,799 36,227 36,497 37,100 37,630 37,219 38,510 38,120 38,170 37,800South Carolina 33,235 33,439 34,970 35,108 35,303 39,114 39,560 39,880 40,480 39,960Tennessee 46,096 47,967 50,880 54,502 57,486 60,368 61,500 62,520 61,470 60,180Texas 244,165 239,717 240,485 241,193 252,121 264,275 273,050 279,970 285,530 292,940Virginia 72,042 73,667 69,597 73,997 77,369 79,651 80,270 81,600 82,770 81,870West Virginia 17,339 17,137 16,763 17,407 17,489 17,690 17,540 17,300 17,150 17,410
West 640,782 665,730 648,153 666,560 696,055 700,236 714,920 732,350 735,710 728,890Alaska 7,236 6,909 7,361 7,666 7,855 8,008 7,820 7,720 7,750 7,450Arizona 45,508 59,498 54,091 55,954 61,667 62,374 64,800 66,490 64,670 61,830California 343,480 355,217 343,515 356,641 374,561 372,310 375,070 386,220 390,270 387,300Colorado 44,777 44,532 44,424 45,628 46,082 47,459 49,780 51,820 52,580 52,830Hawaii 10,324 10,813 10,922 11,063 11,613 11,508 10,860 11,070 11,150 10,670Idaho 15,547 15,768 16,096 16,242 16,567 16,807 17,280 17,390 17,150 16,840Montana 10,500 10,335 10,283 10,122 10,396 10,077 9,910 9,690 9,560 9,210Nevada 15,201 15,740 16,455 17,149 18,815 19,904 22,190 24,990 25,790 25,680New Mexico 17,892 17,353 17,822 16,131 18,264 17,931 18,660 19,080 19,080 18,840Oregon 32,958 32,602 32,394 33,446 34,949 35,138 35,300 35,410 34,780 34,730Utah 30,252 30,253 29,050 28,276 28,167 30,463 31,280 30,340 30,590 31,330Washington 61,274 61,094 60,213 62,801 61,625 62,764 66,470 66,580 66,720 66,790Wyoming 5,833 5,616 5,527 5,441 5,494 5,493 5,510 5,570 5,630 5,380
See notes at end of table.
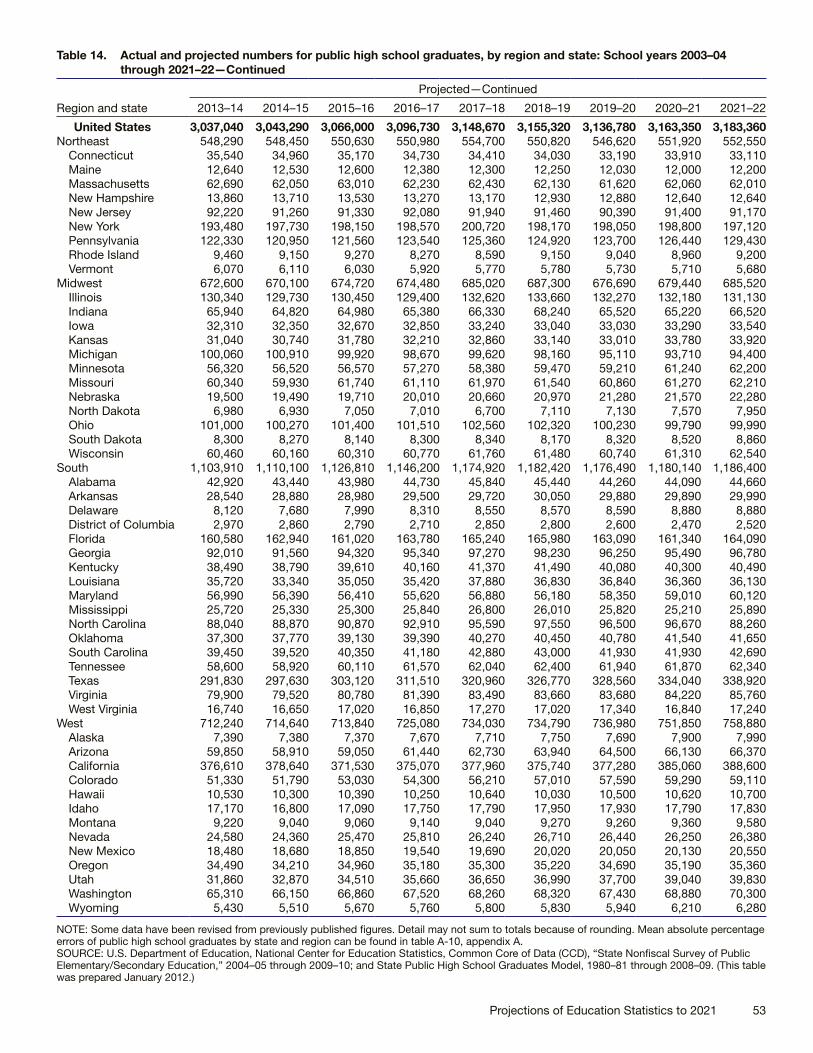
Projections of Education Statistics to 2021 53
Table 14. Actual and projected numbers for public high school graduates, by region and state: School years 2003–04 through 2021–22—Continued
Region and state
Projected—Continued
2013–14 2014–15 2015–16 2016–17 2017–18 2018–19 2019–20 2020–21 2021–22
United States 3,037,040 3,043,290 3,066,000 3,096,730 3,148,670 3,155,320 3,136,780 3,163,350 3,183,360Northeast 548,290 548,450 550,630 550,980 554,700 550,820 546,620 551,920 552,550
Connecticut 35,540 34,960 35,170 34,730 34,410 34,030 33,190 33,910 33,110Maine 12,640 12,530 12,600 12,380 12,300 12,250 12,030 12,000 12,200Massachusetts 62,690 62,050 63,010 62,230 62,430 62,130 61,620 62,060 62,010New Hampshire 13,860 13,710 13,530 13,270 13,170 12,930 12,880 12,640 12,640New Jersey 92,220 91,260 91,330 92,080 91,940 91,460 90,390 91,400 91,170New York 193,480 197,730 198,150 198,570 200,720 198,170 198,050 198,800 197,120Pennsylvania 122,330 120,950 121,560 123,540 125,360 124,920 123,700 126,440 129,430Rhode Island 9,460 9,150 9,270 8,270 8,590 9,150 9,040 8,960 9,200Vermont 6,070 6,110 6,030 5,920 5,770 5,780 5,730 5,710 5,680
Midwest 672,600 670,100 674,720 674,480 685,020 687,300 676,690 679,440 685,520Illinois 130,340 129,730 130,450 129,400 132,620 133,660 132,270 132,180 131,130Indiana 65,940 64,820 64,980 65,380 66,330 68,240 65,520 65,220 66,520Iowa 32,310 32,350 32,670 32,850 33,240 33,040 33,030 33,290 33,540Kansas 31,040 30,740 31,780 32,210 32,860 33,140 33,010 33,780 33,920Michigan 100,060 100,910 99,920 98,670 99,620 98,160 95,110 93,710 94,400Minnesota 56,320 56,520 56,570 57,270 58,380 59,470 59,210 61,240 62,200Missouri 60,340 59,930 61,740 61,110 61,970 61,540 60,860 61,270 62,210Nebraska 19,500 19,490 19,710 20,010 20,660 20,970 21,280 21,570 22,280North Dakota 6,980 6,930 7,050 7,010 6,700 7,110 7,130 7,570 7,950Ohio 101,000 100,270 101,400 101,510 102,560 102,320 100,230 99,790 99,990South Dakota 8,300 8,270 8,140 8,300 8,340 8,170 8,320 8,520 8,860Wisconsin 60,460 60,160 60,310 60,770 61,760 61,480 60,740 61,310 62,540
South 1,103,910 1,110,100 1,126,810 1,146,200 1,174,920 1,182,420 1,176,490 1,180,140 1,186,400Alabama 42,920 43,440 43,980 44,730 45,840 45,440 44,260 44,090 44,660Arkansas 28,540 28,880 28,980 29,500 29,720 30,050 29,880 29,890 29,990Delaware 8,120 7,680 7,990 8,310 8,550 8,570 8,590 8,880 8,880District of Columbia 2,970 2,860 2,790 2,710 2,850 2,800 2,600 2,470 2,520Florida 160,580 162,940 161,020 163,780 165,240 165,980 163,090 161,340 164,090Georgia 92,010 91,560 94,320 95,340 97,270 98,230 96,250 95,490 96,780Kentucky 38,490 38,790 39,610 40,160 41,370 41,490 40,080 40,300 40,490Louisiana 35,720 33,340 35,050 35,420 37,880 36,830 36,840 36,360 36,130Maryland 56,990 56,390 56,410 55,620 56,880 56,180 58,350 59,010 60,120Mississippi 25,720 25,330 25,300 25,840 26,800 26,010 25,820 25,210 25,890North Carolina 88,040 88,870 90,870 92,910 95,590 97,550 96,500 96,670 88,260Oklahoma 37,300 37,770 39,130 39,390 40,270 40,450 40,780 41,540 41,650South Carolina 39,450 39,520 40,350 41,180 42,880 43,000 41,930 41,930 42,690Tennessee 58,600 58,920 60,110 61,570 62,040 62,400 61,940 61,870 62,340Texas 291,830 297,630 303,120 311,510 320,960 326,770 328,560 334,040 338,920Virginia 79,900 79,520 80,780 81,390 83,490 83,660 83,680 84,220 85,760West Virginia 16,740 16,650 17,020 16,850 17,270 17,020 17,340 16,840 17,240
West 712,240 714,640 713,840 725,080 734,030 734,790 736,980 751,850 758,880Alaska 7,390 7,380 7,370 7,670 7,710 7,750 7,690 7,900 7,990Arizona 59,850 58,910 59,050 61,440 62,730 63,940 64,500 66,130 66,370California 376,610 378,640 371,530 375,070 377,960 375,740 377,280 385,060 388,600Colorado 51,330 51,790 53,030 54,300 56,210 57,010 57,590 59,290 59,110Hawaii 10,530 10,300 10,390 10,250 10,640 10,030 10,500 10,620 10,700Idaho 17,170 16,800 17,090 17,750 17,790 17,950 17,930 17,790 17,830Montana 9,220 9,040 9,060 9,140 9,040 9,270 9,260 9,360 9,580Nevada 24,580 24,360 25,470 25,810 26,240 26,710 26,440 26,250 26,380New Mexico 18,480 18,680 18,850 19,540 19,690 20,020 20,050 20,130 20,550Oregon 34,490 34,210 34,960 35,180 35,300 35,220 34,690 35,190 35,360Utah 31,860 32,870 34,510 35,660 36,650 36,990 37,700 39,040 39,830Washington 65,310 66,150 66,860 67,520 68,260 68,320 67,430 68,880 70,300Wyoming 5,430 5,510 5,670 5,760 5,800 5,830 5,940 6,210 6,280
NOTE: Some data have been revised from previously published figures. Detail may not sum to totals because of rounding. Mean absolute percentage errors of public high school graduates by state and region can be found in table A-10, appendix A.SOURCE: U.S. Department of Education, National Center for Education Statistics, Common Core of Data (CCD), “State Nonfiscal Survey of Public Elementary/Secondary Education,” 2004–05 through 2009–10; and State Public High School Graduates Model, 1980–81 through 2008–09. (This table was prepared January 2012.)

54 Reference Tables
Table 15. Actual and projected percentage changes in public high school graduates, by region and state: School years 2003–04 through 2021–22
Region and stateActual 2003–04
to 2008–09
Projected
2008–09 to 2015–16 2015–16 to 2021–22 2008–09 to 2021–22
United States 10.4 0.9 3.8 4.7Northeast 13.9 -0.4 0.3 -0.1
Connecticut 1.1 0.6 -5.9 -5.3Maine 6.1 -10.6 -3.2 -13.4Massachusetts 11.9 -3.4 -1.6 -5.0New Hampshire 10.9 -8.3 -6.6 -14.3New Jersey 13.4 -3.9 -0.2 -4.1New York 26.9 9.5 -0.5 9.0Pennsylvania 5.8 -7.0 6.5 -0.9Rhode Island 8.3 -7.6 -0.8 -8.3Vermont 1.5 -16.4 -5.8 -21.2
Midwest 5.5 -6.0 1.6 -4.5Illinois 5.5 -0.9 0.5 -0.4Indiana 13.7 2.1 2.4 4.5Iowa -1.2 -3.7 2.7 -1.1Kansas 0.7 4.6 6.7 11.7Michigan 14.1 -11.4 -5.5 -16.3Minnesota 1.1 -5.3 10.0 4.1Missouri 8.6 -2.0 0.8 -1.2Nebraska -4.0 1.1 13.0 14.3North Dakota -8.3 -2.5 12.8 9.9Ohio 2.7 -17.0 -1.4 -18.2South Dakota -9.8 0.2 8.8 9.1Wisconsin 4.2 -7.8 3.7 -4.4
South 12.8 5.5 5.3 11.1Alabama 15.4 4.5 1.5 6.1Arkansas 3.2 3.3 3.5 6.9Delaware 12.8 1.9 11.1 13.3District of Columbia 16.0 -20.7 -9.7 -28.3Florida 16.8 4.9 1.9 6.9Georgia 28.4 7.2 1.9 10.0Kentucky 10.8 -5.4 2.2 -3.3Louisiana -3.8 -1.6 3.1 1.4Maryland 10.3 -3.2 6.6 3.1Mississippi 3.2 3.2 2.3 5.7North Carolina 20.2 4.8 -2.9 1.8Oklahoma 1.1 5.1 6.4 11.9South Carolina 17.7 3.2 5.8 9.1Tennessee 31.0 -0.4 3.7 3.3Texas 8.2 14.7 11.8 28.2Virginia 10.6 1.4 6.2 7.7West Virginia 2.0 -3.8 1.3 -2.5
West 9.3 1.9 6.3 8.4Alaska 10.7 -8.0 8.4 -0.2Arizona 37.1 -5.3 12.4 6.4California 8.4 -0.2 4.6 4.4Colorado 6.0 11.7 11.5 24.5Hawaii 11.5 -9.7 3.0 -7.0Idaho 8.1 1.7 4.3 6.1Montana -4.0 -10.1 5.7 -4.9Nevada 30.9 28.0 3.6 32.5New Mexico 0.2 5.1 9.0 14.6Oregon 6.6 -0.5 1.1 0.6Utah 0.7 13.3 15.4 30.7Washington 2.4 6.5 5.1 12.0Wyoming -5.8 3.2 10.8 14.3
NOTE: Calculations are based on unrounded numbers. Mean absolute percentage errors of public high school graduates by state and region can be found in table A-10, appendix A. SOURCE: U.S. Department of Education, National Center for Education Statistics, Common Core of Data (CCD), “State Nonfiscal Survey of Public Elementary/Secondary Education,” 2004–05 and 2009–10; and State Public High School Graduates Model, 1980–81 through 2008–09. (This table was prepared January 2012.)
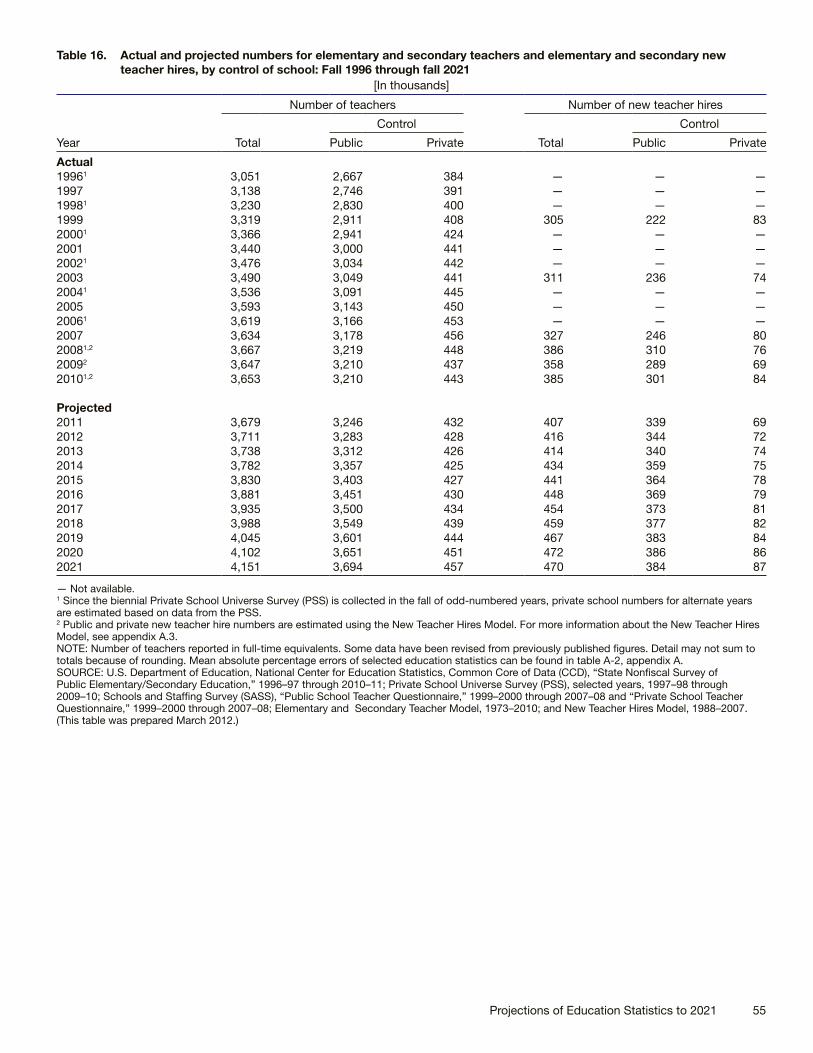
Projections of Education Statistics to 2021 55
Table 16. Actual and projected numbers for elementary and secondary teachers and elementary and secondary new teacher hires, by control of school: Fall 1996 through fall 2021
[In thousands]
Year
Number of teachers Number of new teacher hires
Total
Control
Total
Control
Public Private Public Private
Actual19961 3,051 2,667 384 — — —1997 3,138 2,746 391 — — —19981 3,230 2,830 400 — — —1999 3,319 2,911 408 305 222 8320001 3,366 2,941 424 — — —2001 3,440 3,000 441 — — —20021 3,476 3,034 442 — — —2003 3,490 3,049 441 311 236 7420041 3,536 3,091 445 — — —2005 3,593 3,143 450 — — —20061 3,619 3,166 453 — — —2007 3,634 3,178 456 327 246 8020081,2 3,667 3,219 448 386 310 7620092 3,647 3,210 437 358 289 6920101,2 3,653 3,210 443 385 301 84
Projected2011 3,679 3,246 432 407 339 692012 3,711 3,283 428 416 344 722013 3,738 3,312 426 414 340 742014 3,782 3,357 425 434 359 752015 3,830 3,403 427 441 364 782016 3,881 3,451 430 448 369 792017 3,935 3,500 434 454 373 812018 3,988 3,549 439 459 377 822019 4,045 3,601 444 467 383 842020 4,102 3,651 451 472 386 862021 4,151 3,694 457 470 384 87
— Not available.1 Since the biennial Private School Universe Survey (PSS) is collected in the fall of odd-numbered years, private school numbers for alternate years are estimated based on data from the PSS. 2 Public and private new teacher hire numbers are estimated using the New Teacher Hires Model. For more information about the New Teacher Hires Model, see appendix A.3. NOTE: Number of teachers reported in full-time equivalents. Some data have been revised from previously published figures. Detail may not sum to totals because of rounding. Mean absolute percentage errors of selected education statistics can be found in table A-2, appendix A. SOURCE: U.S. Department of Education, National Center for Education Statistics, Common Core of Data (CCD), “State Nonfiscal Survey of Public Elementary/Secondary Education,” 1996–97 through 2010–11; Private School Universe Survey (PSS), selected years, 1997–98 through 2009–10; Schools and Staffing Survey (SASS), “Public School Teacher Questionnaire,” 1999–2000 through 2007–08 and “Private School Teacher Questionnaire,” 1999–2000 through 2007–08; Elementary and Secondary Teacher Model, 1973–2010; and New Teacher Hires Model, 1988–2007. (This table was prepared March 2012.)
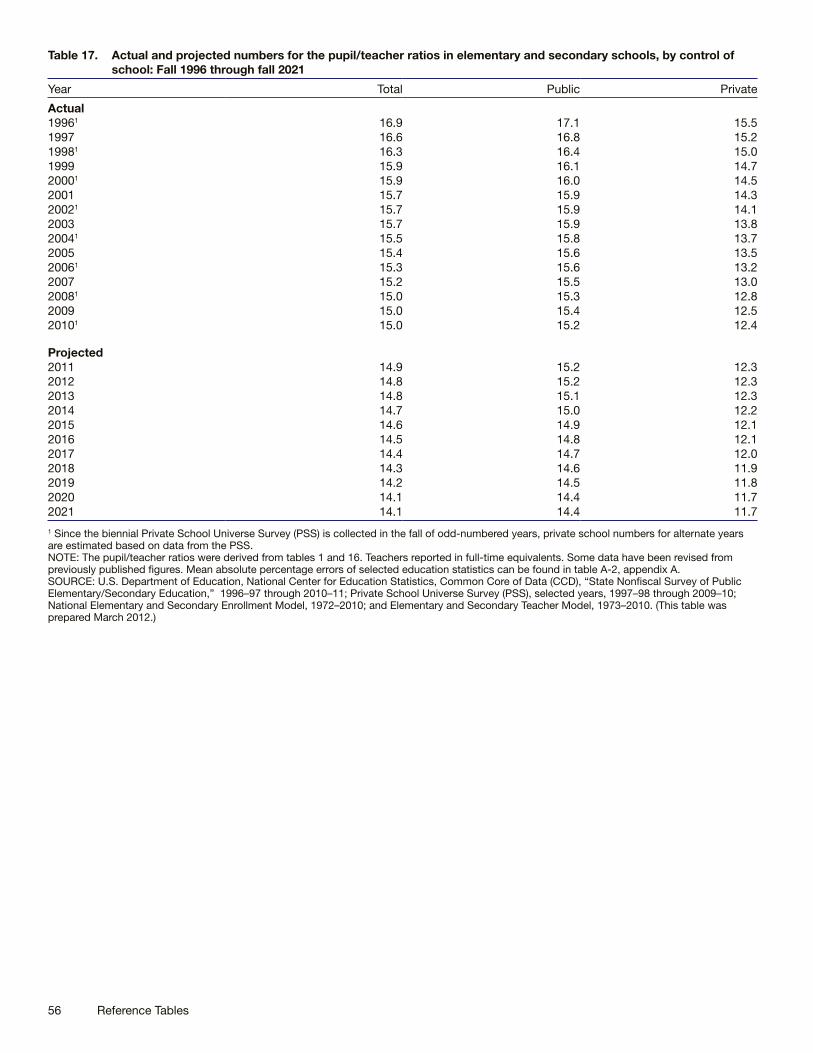
56 Reference Tables
Table 17. Actual and projected numbers for the pupil/teacher ratios in elementary and secondary schools, by control of school: Fall 1996 through fall 2021
Year Total Public Private
Actual19961 16.9 17.1 15.51997 16.6 16.8 15.219981 16.3 16.4 15.01999 15.9 16.1 14.720001 15.9 16.0 14.52001 15.7 15.9 14.320021 15.7 15.9 14.12003 15.7 15.9 13.820041 15.5 15.8 13.72005 15.4 15.6 13.520061 15.3 15.6 13.22007 15.2 15.5 13.020081 15.0 15.3 12.82009 15.0 15.4 12.520101 15.0 15.2 12.4
Projected2011 14.9 15.2 12.32012 14.8 15.2 12.32013 14.8 15.1 12.32014 14.7 15.0 12.22015 14.6 14.9 12.12016 14.5 14.8 12.12017 14.4 14.7 12.02018 14.3 14.6 11.92019 14.2 14.5 11.82020 14.1 14.4 11.72021 14.1 14.4 11.7
1 Since the biennial Private School Universe Survey (PSS) is collected in the fall of odd-numbered years, private school numbers for alternate years are estimated based on data from the PSS. NOTE: The pupil/teacher ratios were derived from tables 1 and 16. Teachers reported in full-time equivalents. Some data have been revised from previously published figures. Mean absolute percentage errors of selected education statistics can be found in table A-2, appendix A.SOURCE: U.S. Department of Education, National Center for Education Statistics, Common Core of Data (CCD), “State Nonfiscal Survey of Public Elementary/Secondary Education,” 1996–97 through 2010–11; Private School Universe Survey (PSS), selected years, 1997–98 through 2009–10; National Elementary and Secondary Enrollment Model, 1972–2010; and Elementary and Secondary Teacher Model, 1973–2010. (This table was prepared March 2012.)

Projections of Education Statistics to 2021 57
Table 18. Actual and projected numbers for current expenditures and current expenditures per pupil in fall enrollment for public elementary and secondary education: School years 1996–97 through 2021–22
School yearFall enrollment (in thousands)
Current expenditures
Constant 2010–11 dollars1 Current dollars
Total (in billions)
Per pupil in fall enrollment
Total (in billions)
Per pupil in fall enrollment
Actual1996–97 45,611 $375.9 $8,242 $270.2 $5,9231997–98 46,127 390.2 8,460 285.5 6,1891998–99 46,539 407.0 8,745 302.9 6,5081999–2000 46,857 423.0 9,028 323.9 6,9122000–01 47,204 440.0 9,321 348.4 7,3802001–02 47,672 457.1 9,589 368.4 7,7272002–03 48,183 470.6 9,767 387.6 8,0442003–04 48,540 479.2 9,873 403.4 8,3102004–05 48,795 490.2 10,047 425.0 8,7112005–06 49,113 499.2 10,163 449.1 9,1452006–072 49,262 516.5 10,473 476.8 9,6692007–082 49,221 529.4 10,741 506.9 10,2832008–092 49,003 534.6 10,909 519.0 10,591
Projected2009–103 49,373 519.3 10,518 519.3 10,5182010–113 49,484 539.5 10,902 539.4 10,9012011–12 49,636 541.6 10,912 556.0 11,2012012–13 49,828 548.7 11,012 571.4 11,4672013–14 50,067 556.8 11,121 591.3 11,8102014–15 50,407 571.3 11,335 619.1 12,2812015–16 50,773 585.6 11,534 — —2016–17 51,146 599.0 11,711 — —2017–18 51,524 612.5 11,888 — —2018–19 51,880 625.5 12,058 — —2019–20 52,260 639.8 12,243 — —2020–21 52,688 654.5 12,423 — —2021–22 53,113 665.5 12,530 — —
— Not available: projections in current dollars are not shown after 2014–15 due to uncertain behavior of inflation over time. 1 Based on the Consumer Price Index (CPI) for all urban consumers, Bureau of Labor Statistics, U.S. Department of Labor. For more detail about CPI, see table B-6 in appendix B.2 Fall enrollment pertains only to students for whom finance data were collected. This enrollment count differs slightly from enrollment counts reported on other tables. 3 The fall enrollment numbers for 2009–10 and 2010–11 are actual numbers.NOTE: Calculations were made using unrounded numbers. Some data have been revised from previously published figures. Mean absolute percentage errors of selected education statistics can be found in table A-2, appendix A. SOURCE: U.S. Department of Education, National Center for Education Statistics, Common Core of Data (CCD), “State Nonfiscal Survey of Public Elementary/Secondary Education,” 1996–97 through 2010–11; “National Public Education Financial Survey,” 1996–97 through 2008–09; National Elementary and Secondary Enrollment Model, 1972–2010; and Public Elementary and Secondary Education Current Expenditures Model, 1969–70 through 2008–09. (This table was prepared February 2012.)
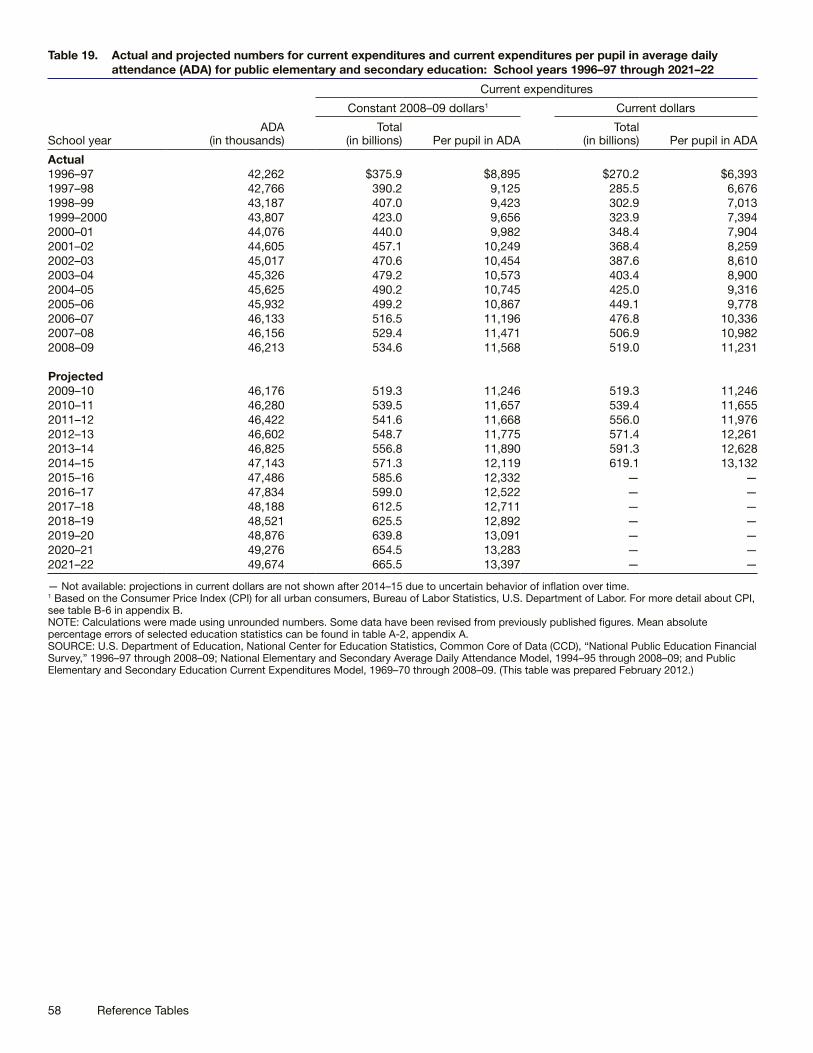
58 Reference Tables
Table 19. Actual and projected numbers for current expenditures and current expenditures per pupil in average daily attendance (ADA) for public elementary and secondary education: School years 1996–97 through 2021–22
School yearADA
(in thousands)
Current expenditures
Constant 2008–09 dollars1 Current dollars
Total (in billions) Per pupil in ADA
Total (in billions) Per pupil in ADA
Actual1996–97 42,262 $375.9 $8,895 $270.2 $6,3931997–98 42,766 390.2 9,125 285.5 6,6761998–99 43,187 407.0 9,423 302.9 7,0131999–2000 43,807 423.0 9,656 323.9 7,3942000–01 44,076 440.0 9,982 348.4 7,9042001–02 44,605 457.1 10,249 368.4 8,2592002–03 45,017 470.6 10,454 387.6 8,6102003–04 45,326 479.2 10,573 403.4 8,9002004–05 45,625 490.2 10,745 425.0 9,3162005–06 45,932 499.2 10,867 449.1 9,7782006–07 46,133 516.5 11,196 476.8 10,3362007–08 46,156 529.4 11,471 506.9 10,9822008–09 46,213 534.6 11,568 519.0 11,231
Projected2009–10 46,176 519.3 11,246 519.3 11,2462010–11 46,280 539.5 11,657 539.4 11,6552011–12 46,422 541.6 11,668 556.0 11,9762012–13 46,602 548.7 11,775 571.4 12,2612013–14 46,825 556.8 11,890 591.3 12,6282014–15 47,143 571.3 12,119 619.1 13,1322015–16 47,486 585.6 12,332 — —2016–17 47,834 599.0 12,522 — —2017–18 48,188 612.5 12,711 — —2018–19 48,521 625.5 12,892 — —2019–20 48,876 639.8 13,091 — —2020–21 49,276 654.5 13,283 — —2021–22 49,674 665.5 13,397 — —
— Not available: projections in current dollars are not shown after 2014–15 due to uncertain behavior of inflation over time.1 Based on the Consumer Price Index (CPI) for all urban consumers, Bureau of Labor Statistics, U.S. Department of Labor. For more detail about CPI, see table B-6 in appendix B. NOTE: Calculations were made using unrounded numbers. Some data have been revised from previously published figures. Mean absolute percentage errors of selected education statistics can be found in table A-2, appendix A. SOURCE: U.S. Department of Education, National Center for Education Statistics, Common Core of Data (CCD), “National Public Education Financial Survey,” 1996–97 through 2008–09; National Elementary and Secondary Average Daily Attendance Model, 1994–95 through 2008–09; and Public Elementary and Secondary Education Current Expenditures Model, 1969–70 through 2008–09. (This table was prepared February 2012.)

Projections of Education Statistics to 2021 59
Table 20. Actual and projected numbers for total enrollment in all postsecondary degree-granting institutions, by sex, attendance status, and control of institution: Fall 1996 through fall 2021
[In thousands]
Year Total
Sex Attendance status Control
Men Women Full-time Part-time Public Private
Actual1996 14,368 6,353 8,015 8,303 6,065 11,121 3,2471997 14,502 6,396 8,106 8,438 6,064 11,196 3,3061998 14,507 6,369 8,138 8,563 5,944 11,138 3,3691999 14,850 6,515 8,335 8,803 6,047 11,376 3,4742000 15,312 6,722 8,591 9,010 6,303 11,753 3,5602001 15,928 6,961 8,967 9,448 6,480 12,233 3,6952002 16,612 7,202 9,410 9,946 6,665 12,752 3,8602003 16,911 7,260 9,651 10,326 6,585 12,859 4,0532004 17,272 7,387 9,885 10,610 6,662 12,980 4,2922005 17,487 7,456 10,032 10,797 6,690 13,022 4,4662006 17,759 7,575 10,184 10,957 6,802 13,180 4,5792007 18,248 7,816 10,432 11,270 6,978 13,491 4,7572008 19,103 8,189 10,914 11,748 7,355 13,972 5,1312009 20,428 8,770 11,658 12,723 7,705 14,811 5,6172010 21,016 9,045 11,971 13,082 7,934 15,143 5,873
Projected2011 21,294 9,203 12,091 13,184 8,111 15,347 5,9472012 21,556 9,286 12,270 13,329 8,227 15,530 6,0272013 21,792 9,341 12,451 13,445 8,347 15,694 6,0982014 22,042 9,370 12,673 13,562 8,480 15,871 6,1712015 22,252 9,388 12,864 13,652 8,600 16,020 6,2332016 22,509 9,442 13,067 13,775 8,734 16,203 6,3072017 22,842 9,533 13,309 13,952 8,890 16,441 6,4012018 23,219 9,643 13,576 14,163 9,055 16,712 6,5082019 23,569 9,753 13,816 14,376 9,193 16,965 6,6042020 23,867 9,851 14,016 14,560 9,307 17,183 6,6852021 24,092 9,933 14,159 14,699 9,392 17,345 6,747
NOTE: Detail may not sum to totals because of rounding. Some data have been revised from previously published figures. Mean absolute percentage errors of selected education statistics can be found in table A-2, appendix A. SOURCE: U.S. Department of Education, National Center for Education Statistics, Integrated Postsecondary Education Data System (IPEDS), “Fall Enrollment Survey” (IPEDS-EF:96–99); IPEDS Spring 2001 through Spring 2011, Enrollment component; and Enrollment in Degree-Granting Institutions Model, 1980–2010. (This table was prepared January 2012.)
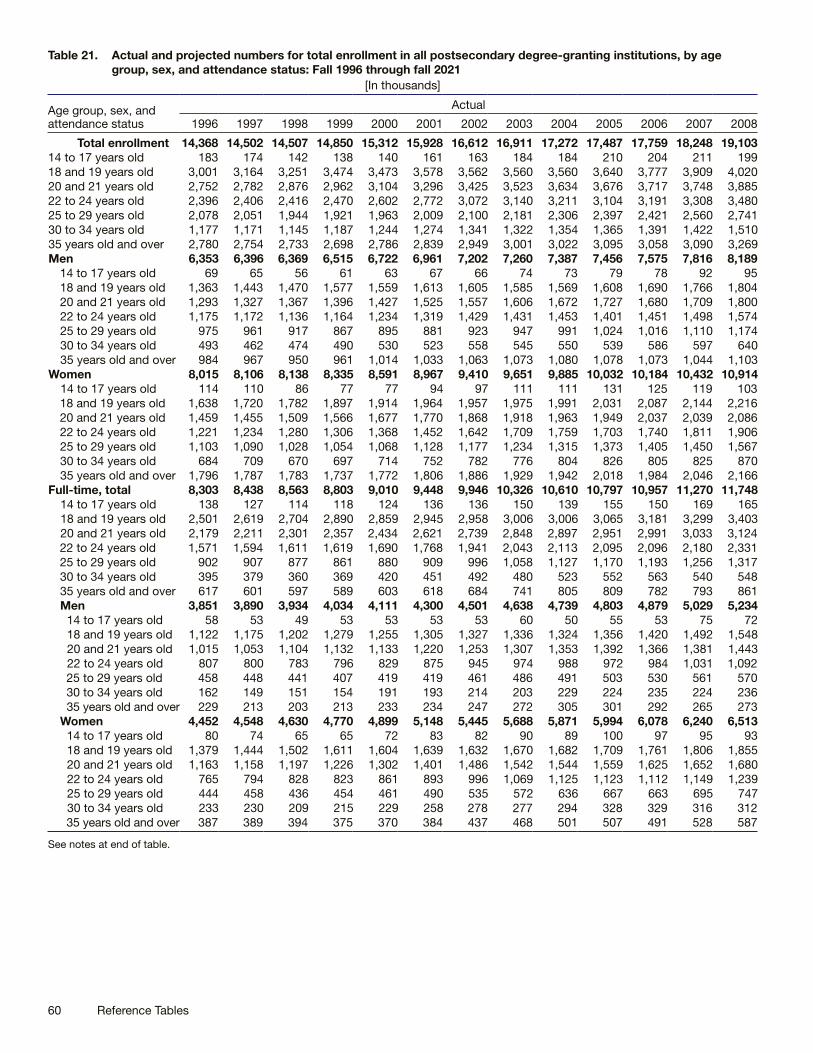
60 Reference Tables
Table 21. Actual and projected numbers for total enrollment in all postsecondary degree-granting institutions, by age group, sex, and attendance status: Fall 1996 through fall 2021
[In thousands]
Age group, sex, and attendance status
Actual
1996 1997 1998 1999 2000 2001 2002 2003 2004 2005 2006 2007 2008
Total enrollment 14,368 14,502 14,507 14,850 15,312 15,928 16,612 16,911 17,272 17,487 17,759 18,248 19,10314 to 17 years old 183 174 142 138 140 161 163 184 184 210 204 211 19918 and 19 years old 3,001 3,164 3,251 3,474 3,473 3,578 3,562 3,560 3,560 3,640 3,777 3,909 4,02020 and 21 years old 2,752 2,782 2,876 2,962 3,104 3,296 3,425 3,523 3,634 3,676 3,717 3,748 3,88522 to 24 years old 2,396 2,406 2,416 2,470 2,602 2,772 3,072 3,140 3,211 3,104 3,191 3,308 3,48025 to 29 years old 2,078 2,051 1,944 1,921 1,963 2,009 2,100 2,181 2,306 2,397 2,421 2,560 2,74130 to 34 years old 1,177 1,171 1,145 1,187 1,244 1,274 1,341 1,322 1,354 1,365 1,391 1,422 1,51035 years old and over 2,780 2,754 2,733 2,698 2,786 2,839 2,949 3,001 3,022 3,095 3,058 3,090 3,269Men 6,353 6,396 6,369 6,515 6,722 6,961 7,202 7,260 7,387 7,456 7,575 7,816 8,189
14 to 17 years old 69 65 56 61 63 67 66 74 73 79 78 92 9518 and 19 years old 1,363 1,443 1,470 1,577 1,559 1,613 1,605 1,585 1,569 1,608 1,690 1,766 1,80420 and 21 years old 1,293 1,327 1,367 1,396 1,427 1,525 1,557 1,606 1,672 1,727 1,680 1,709 1,80022 to 24 years old 1,175 1,172 1,136 1,164 1,234 1,319 1,429 1,431 1,453 1,401 1,451 1,498 1,57425 to 29 years old 975 961 917 867 895 881 923 947 991 1,024 1,016 1,110 1,17430 to 34 years old 493 462 474 490 530 523 558 545 550 539 586 597 64035 years old and over 984 967 950 961 1,014 1,033 1,063 1,073 1,080 1,078 1,073 1,044 1,103
Women 8,015 8,106 8,138 8,335 8,591 8,967 9,410 9,651 9,885 10,032 10,184 10,432 10,91414 to 17 years old 114 110 86 77 77 94 97 111 111 131 125 119 10318 and 19 years old 1,638 1,720 1,782 1,897 1,914 1,964 1,957 1,975 1,991 2,031 2,087 2,144 2,21620 and 21 years old 1,459 1,455 1,509 1,566 1,677 1,770 1,868 1,918 1,963 1,949 2,037 2,039 2,08622 to 24 years old 1,221 1,234 1,280 1,306 1,368 1,452 1,642 1,709 1,759 1,703 1,740 1,811 1,90625 to 29 years old 1,103 1,090 1,028 1,054 1,068 1,128 1,177 1,234 1,315 1,373 1,405 1,450 1,56730 to 34 years old 684 709 670 697 714 752 782 776 804 826 805 825 87035 years old and over 1,796 1,787 1,783 1,737 1,772 1,806 1,886 1,929 1,942 2,018 1,984 2,046 2,166
Full-time, total 8,303 8,438 8,563 8,803 9,010 9,448 9,946 10,326 10,610 10,797 10,957 11,270 11,74814 to 17 years old 138 127 114 118 124 136 136 150 139 155 150 169 16518 and 19 years old 2,501 2,619 2,704 2,890 2,859 2,945 2,958 3,006 3,006 3,065 3,181 3,299 3,40320 and 21 years old 2,179 2,211 2,301 2,357 2,434 2,621 2,739 2,848 2,897 2,951 2,991 3,033 3,12422 to 24 years old 1,571 1,594 1,611 1,619 1,690 1,768 1,941 2,043 2,113 2,095 2,096 2,180 2,33125 to 29 years old 902 907 877 861 880 909 996 1,058 1,127 1,170 1,193 1,256 1,31730 to 34 years old 395 379 360 369 420 451 492 480 523 552 563 540 54835 years old and over 617 601 597 589 603 618 684 741 805 809 782 793 861Men 3,851 3,890 3,934 4,034 4,111 4,300 4,501 4,638 4,739 4,803 4,879 5,029 5,234
14 to 17 years old 58 53 49 53 53 53 53 60 50 55 53 75 7218 and 19 years old 1,122 1,175 1,202 1,279 1,255 1,305 1,327 1,336 1,324 1,356 1,420 1,492 1,54820 and 21 years old 1,015 1,053 1,104 1,132 1,133 1,220 1,253 1,307 1,353 1,392 1,366 1,381 1,44322 to 24 years old 807 800 783 796 829 875 945 974 988 972 984 1,031 1,09225 to 29 years old 458 448 441 407 419 419 461 486 491 503 530 561 57030 to 34 years old 162 149 151 154 191 193 214 203 229 224 235 224 23635 years old and over 229 213 203 213 233 234 247 272 305 301 292 265 273
Women 4,452 4,548 4,630 4,770 4,899 5,148 5,445 5,688 5,871 5,994 6,078 6,240 6,51314 to 17 years old 80 74 65 65 72 83 82 90 89 100 97 95 9318 and 19 years old 1,379 1,444 1,502 1,611 1,604 1,639 1,632 1,670 1,682 1,709 1,761 1,806 1,85520 and 21 years old 1,163 1,158 1,197 1,226 1,302 1,401 1,486 1,542 1,544 1,559 1,625 1,652 1,68022 to 24 years old 765 794 828 823 861 893 996 1,069 1,125 1,123 1,112 1,149 1,23925 to 29 years old 444 458 436 454 461 490 535 572 636 667 663 695 74730 to 34 years old 233 230 209 215 229 258 278 277 294 328 329 316 31235 years old and over 387 389 394 375 370 384 437 468 501 507 491 528 587
See notes at end of table.
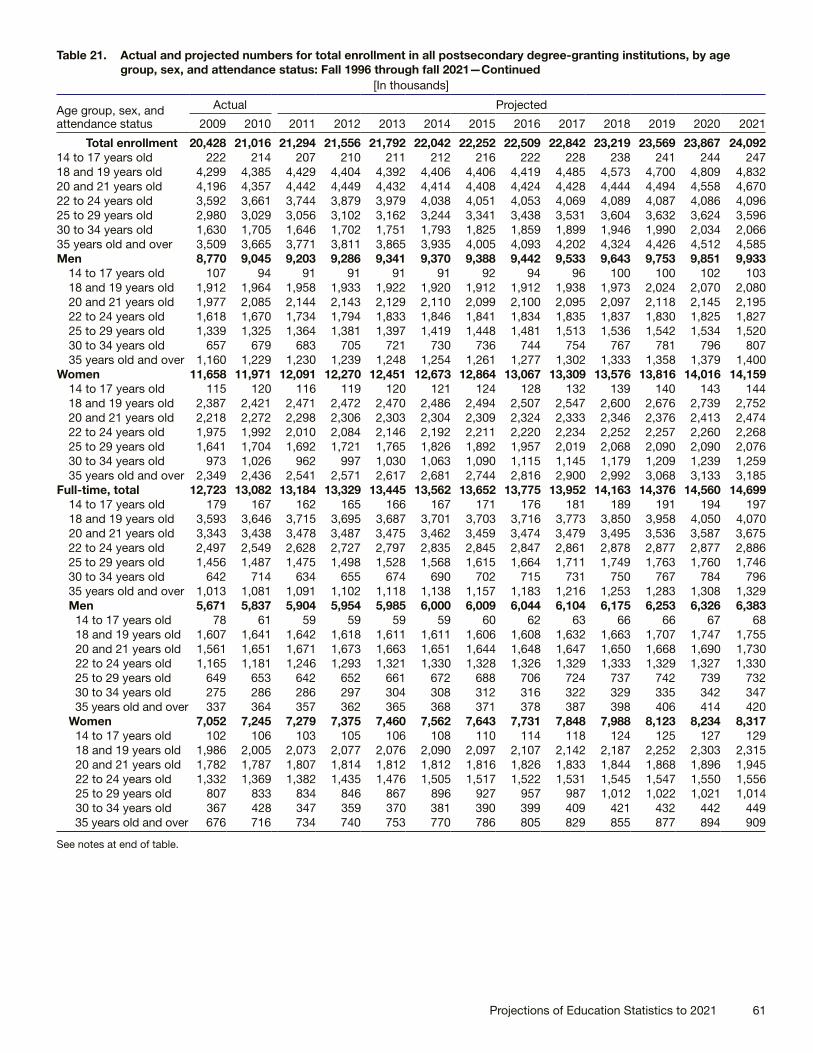
Projections of Education Statistics to 2021 61
Table 21. Actual and projected numbers for total enrollment in all postsecondary degree-granting institutions, by age group, sex, and attendance status: Fall 1996 through fall 2021—Continued
[In thousands]
Age group, sex, and attendance status
Actual Projected
2009 2010 2011 2012 2013 2014 2015 2016 2017 2018 2019 2020 2021
Total enrollment 20,428 21,016 21,294 21,556 21,792 22,042 22,252 22,509 22,842 23,219 23,569 23,867 24,09214 to 17 years old 222 214 207 210 211 212 216 222 228 238 241 244 24718 and 19 years old 4,299 4,385 4,429 4,404 4,392 4,406 4,406 4,419 4,485 4,573 4,700 4,809 4,83220 and 21 years old 4,196 4,357 4,442 4,449 4,432 4,414 4,408 4,424 4,428 4,444 4,494 4,558 4,67022 to 24 years old 3,592 3,661 3,744 3,879 3,979 4,038 4,051 4,053 4,069 4,089 4,087 4,086 4,09625 to 29 years old 2,980 3,029 3,056 3,102 3,162 3,244 3,341 3,438 3,531 3,604 3,632 3,624 3,59630 to 34 years old 1,630 1,705 1,646 1,702 1,751 1,793 1,825 1,859 1,899 1,946 1,990 2,034 2,06635 years old and over 3,509 3,665 3,771 3,811 3,865 3,935 4,005 4,093 4,202 4,324 4,426 4,512 4,585Men 8,770 9,045 9,203 9,286 9,341 9,370 9,388 9,442 9,533 9,643 9,753 9,851 9,933
14 to 17 years old 107 94 91 91 91 91 92 94 96 100 100 102 10318 and 19 years old 1,912 1,964 1,958 1,933 1,922 1,920 1,912 1,912 1,938 1,973 2,024 2,070 2,08020 and 21 years old 1,977 2,085 2,144 2,143 2,129 2,110 2,099 2,100 2,095 2,097 2,118 2,145 2,19522 to 24 years old 1,618 1,670 1,734 1,794 1,833 1,846 1,841 1,834 1,835 1,837 1,830 1,825 1,82725 to 29 years old 1,339 1,325 1,364 1,381 1,397 1,419 1,448 1,481 1,513 1,536 1,542 1,534 1,52030 to 34 years old 657 679 683 705 721 730 736 744 754 767 781 796 80735 years old and over 1,160 1,229 1,230 1,239 1,248 1,254 1,261 1,277 1,302 1,333 1,358 1,379 1,400
Women 11,658 11,971 12,091 12,270 12,451 12,673 12,864 13,067 13,309 13,576 13,816 14,016 14,15914 to 17 years old 115 120 116 119 120 121 124 128 132 139 140 143 14418 and 19 years old 2,387 2,421 2,471 2,472 2,470 2,486 2,494 2,507 2,547 2,600 2,676 2,739 2,75220 and 21 years old 2,218 2,272 2,298 2,306 2,303 2,304 2,309 2,324 2,333 2,346 2,376 2,413 2,47422 to 24 years old 1,975 1,992 2,010 2,084 2,146 2,192 2,211 2,220 2,234 2,252 2,257 2,260 2,26825 to 29 years old 1,641 1,704 1,692 1,721 1,765 1,826 1,892 1,957 2,019 2,068 2,090 2,090 2,07630 to 34 years old 973 1,026 962 997 1,030 1,063 1,090 1,115 1,145 1,179 1,209 1,239 1,25935 years old and over 2,349 2,436 2,541 2,571 2,617 2,681 2,744 2,816 2,900 2,992 3,068 3,133 3,185
Full-time, total 12,723 13,082 13,184 13,329 13,445 13,562 13,652 13,775 13,952 14,163 14,376 14,560 14,69914 to 17 years old 179 167 162 165 166 167 171 176 181 189 191 194 19718 and 19 years old 3,593 3,646 3,715 3,695 3,687 3,701 3,703 3,716 3,773 3,850 3,958 4,050 4,07020 and 21 years old 3,343 3,438 3,478 3,487 3,475 3,462 3,459 3,474 3,479 3,495 3,536 3,587 3,67522 to 24 years old 2,497 2,549 2,628 2,727 2,797 2,835 2,845 2,847 2,861 2,878 2,877 2,877 2,88625 to 29 years old 1,456 1,487 1,475 1,498 1,528 1,568 1,615 1,664 1,711 1,749 1,763 1,760 1,74630 to 34 years old 642 714 634 655 674 690 702 715 731 750 767 784 79635 years old and over 1,013 1,081 1,091 1,102 1,118 1,138 1,157 1,183 1,216 1,253 1,283 1,308 1,329Men 5,671 5,837 5,904 5,954 5,985 6,000 6,009 6,044 6,104 6,175 6,253 6,326 6,383
14 to 17 years old 78 61 59 59 59 59 60 62 63 66 66 67 6818 and 19 years old 1,607 1,641 1,642 1,618 1,611 1,611 1,606 1,608 1,632 1,663 1,707 1,747 1,75520 and 21 years old 1,561 1,651 1,671 1,673 1,663 1,651 1,644 1,648 1,647 1,650 1,668 1,690 1,73022 to 24 years old 1,165 1,181 1,246 1,293 1,321 1,330 1,328 1,326 1,329 1,333 1,329 1,327 1,33025 to 29 years old 649 653 642 652 661 672 688 706 724 737 742 739 73230 to 34 years old 275 286 286 297 304 308 312 316 322 329 335 342 34735 years old and over 337 364 357 362 365 368 371 378 387 398 406 414 420
Women 7,052 7,245 7,279 7,375 7,460 7,562 7,643 7,731 7,848 7,988 8,123 8,234 8,31714 to 17 years old 102 106 103 105 106 108 110 114 118 124 125 127 12918 and 19 years old 1,986 2,005 2,073 2,077 2,076 2,090 2,097 2,107 2,142 2,187 2,252 2,303 2,31520 and 21 years old 1,782 1,787 1,807 1,814 1,812 1,812 1,816 1,826 1,833 1,844 1,868 1,896 1,94522 to 24 years old 1,332 1,369 1,382 1,435 1,476 1,505 1,517 1,522 1,531 1,545 1,547 1,550 1,55625 to 29 years old 807 833 834 846 867 896 927 957 987 1,012 1,022 1,021 1,01430 to 34 years old 367 428 347 359 370 381 390 399 409 421 432 442 44935 years old and over 676 716 734 740 753 770 786 805 829 855 877 894 909
See notes at end of table.

62 Reference Tables
Table 21. Actual and projected numbers for total enrollment in all postsecondary degree-granting institutions, by age group, sex, and attendance status: Fall 1996 through fall 2021—Continued
[In thousands]
Age group, sex, and attendance status
Actual
1996 1997 1998 1999 2000 2001 2002 2003 2004 2005 2006 2007 2008
Part-time, total 6,065 6,064 5,944 6,047 6,303 6,480 6,665 6,585 6,662 6,690 6,802 6,978 7,35514 to 17 years old 45 47 28 21 16 25 28 34 45 55 53 42 3418 and 19 years old 500 545 547 583 614 633 604 554 554 574 596 610 61720 and 21 years old 573 571 575 605 670 675 686 675 737 725 726 715 76122 to 24 years old 825 812 805 850 912 1,003 1,130 1,097 1,098 1,009 1,096 1,128 1,14925 to 29 years old 1,176 1,144 1,067 1,060 1,083 1,100 1,104 1,123 1,179 1,227 1,228 1,304 1,42430 to 34 years old 782 793 785 817 825 823 848 841 832 814 828 882 96135 years old and over 2,164 2,153 2,136 2,110 2,184 2,222 2,265 2,261 2,217 2,287 2,275 2,297 2,408Men 2,502 2,506 2,436 2,482 2,611 2,661 2,701 2,622 2,648 2,653 2,695 2,786 2,955
14 to 17 years old 11 11 7 9 10 13 13 13 23 24 25 18 2418 and 19 years old 241 268 267 298 304 308 279 250 245 252 270 273 25620 and 21 years old 277 274 262 264 294 305 304 299 319 335 314 328 35622 to 24 years old 369 372 353 368 405 444 484 457 465 429 467 466 48225 to 29 years old 517 513 476 460 476 462 462 461 500 521 486 549 60430 to 34 years old 331 313 323 335 339 329 344 342 322 315 351 373 40335 years old and over 755 754 747 748 782 799 817 800 775 776 781 779 830
Women 3,563 3,559 3,508 3,565 3,692 3,820 3,964 3,963 4,014 4,038 4,106 4,192 4,40114 to 17 years old 34 36 22 12 5 11 15 21 22 31 28 24 1118 and 19 years old 259 276 280 285 310 325 325 305 310 322 326 337 36120 and 21 years old 295 297 313 341 376 369 382 376 419 390 412 387 40522 to 24 years old 456 441 452 482 507 559 646 639 633 580 628 662 66725 to 29 years old 659 632 591 600 607 638 642 662 679 706 742 755 82030 to 34 years old 451 480 461 482 485 494 504 499 510 499 477 509 55835 years old and over 1,409 1,398 1,389 1,362 1,402 1,422 1,449 1,460 1,441 1,511 1,494 1,518 1,579
See notes at end of table.

Projections of Education Statistics to 2021 63
Table 21. Actual and projected numbers for total enrollment in all postsecondary degree-granting institutions, by age group, sex, and attendance status: Fall 1996 through fall 2021—Continued
[In thousands]
Age group, sex, and attendance status
Actual Projected
2009 2010 2011 2012 2013 2014 2015 2016 2017 2018 2019 2020 2021
Part-time, total 7,705 7,934 8,111 8,227 8,347 8,480 8,600 8,734 8,890 9,055 9,193 9,307 9,39214 to 17 years old 43 46 45 45 45 45 46 46 48 49 49 50 5118 and 19 years old 706 739 714 709 705 705 703 703 711 723 741 759 76220 and 21 years old 853 919 963 962 957 951 948 950 949 949 958 971 99522 to 24 years old 1,096 1,112 1,115 1,151 1,182 1,203 1,207 1,206 1,208 1,211 1,210 1,209 1,21025 to 29 years old 1,524 1,542 1,580 1,604 1,634 1,676 1,726 1,775 1,821 1,856 1,869 1,864 1,85030 to 34 years old 988 991 1,012 1,047 1,077 1,103 1,124 1,144 1,168 1,196 1,223 1,250 1,27035 years old and over 2,496 2,584 2,680 2,709 2,747 2,797 2,847 2,910 2,986 3,071 3,143 3,204 3,256Men 3,099 3,208 3,299 3,332 3,356 3,370 3,379 3,398 3,429 3,468 3,500 3,525 3,550
14 to 17 years old 29 33 32 32 32 32 32 32 33 34 34 35 3518 and 19 years old 305 323 316 315 311 309 306 304 306 310 317 323 32520 and 21 years old 416 434 473 470 465 459 455 452 449 447 450 455 46522 to 24 years old 453 489 488 502 512 516 513 508 505 504 501 498 49725 to 29 years old 691 672 722 729 736 746 760 775 789 799 801 795 78830 to 34 years old 382 393 397 408 417 422 424 428 432 439 446 454 46035 years old and over 823 864 872 877 882 886 890 899 915 935 952 966 980
Women 4,606 4,726 4,812 4,895 4,991 5,111 5,221 5,336 5,461 5,588 5,693 5,782 5,84314 to 17 years old 14 13 13 13 13 14 14 14 15 15 15 15 1618 and 19 years old 401 416 399 395 394 396 397 399 405 413 424 436 43820 and 21 years old 437 485 491 492 492 492 494 498 500 502 508 517 53022 to 24 years old 643 623 628 650 670 687 694 698 703 707 709 711 71225 to 29 years old 833 871 858 875 898 930 965 1,000 1,032 1,057 1,068 1,069 1,06230 to 34 years old 606 598 615 639 660 682 699 716 736 757 777 796 80935 years old and over 1,673 1,720 1,807 1,831 1,865 1,911 1,958 2,011 2,071 2,136 2,191 2,238 2,276
NOTE: Detail may not sum to totals because of rounding. Some data have been revised from previously published figures. Data by age are based on the distribution by age from the Census Bureau. For additional information see section A.4 in appendix A. Mean absolute percentage errors of selected education statistics can be found in table A-2, appendix A. SOURCE: U.S. Department of Education, National Center for Education Statistics, Integrated Postsecondary Education Data System (IPEDS), “Fall Enrollment Survey” (IPEDS-EF:96–99); IPEDS Spring 2001 through Spring 2011, Enrollment component; Enrollment in Degree-Granting Institutions Model, 1980–2010; and U.S. Department of Commerce, Census Bureau, Current Population Reports, “Social and Economic Characteristics of Students,” various years. (This table was prepared January 2012.)

64 Reference Tables
Table 22. Actual and projected numbers for enrollment in all postsecondary degree-granting institutions, by sex and attendance status: Fall 1996 through fall 2021
[In thousands]
Year Total
Men Women
Full-time Part-time Full-time Part-time
Actual1996 14,368 3,851 2,502 4,452 3,5631997 14,502 3,890 2,506 4,548 3,5591998 14,507 3,934 2,436 4,630 3,5081999 14,850 4,034 2,482 4,770 3,5652000 15,312 4,111 2,611 4,899 3,6922001 15,928 4,300 2,661 5,148 3,8202002 16,612 4,501 2,701 5,445 3,9642003 16,911 4,638 2,622 5,688 3,9632004 17,272 4,739 2,648 5,871 4,0142005 17,487 4,803 2,653 5,994 4,0382006 17,759 4,879 2,695 6,078 4,1062007 18,248 5,029 2,786 6,240 4,1922008 19,103 5,234 2,955 6,513 4,4012009 20,428 5,671 3,099 7,052 4,6062010 21,016 5,837 3,208 7,245 4,726
Projected2011 21,294 5,904 3,299 7,279 4,8122012 21,556 5,954 3,332 7,375 4,8952013 21,792 5,985 3,356 7,460 4,9912014 22,042 6,000 3,370 7,562 5,1112015 22,252 6,009 3,379 7,643 5,2212016 22,509 6,044 3,398 7,731 5,3362017 22,842 6,104 3,429 7,848 5,4612018 23,219 6,175 3,468 7,988 5,5882019 23,569 6,253 3,500 8,123 5,6932020 23,867 6,326 3,525 8,234 5,7822021 24,092 6,383 3,550 8,317 5,843
NOTE: Detail may not sum to totals because of rounding. Some data have been revised from previously published figures. Mean absolute percentage errors of selected education statistics can be found in table A-2, appendix A. SOURCE: U.S. Department of Education, National Center for Education Statistics, Integrated Postsecondary Education Data System (IPEDS), “Fall Enrollment Survey” (IPEDS-EF:96–99); IPEDS Spring 2001 through Spring 2011, Enrollment component; and Enrollment in Degree-Granting Institutions Model, 1980–2010. (This table was prepared January 2012.)
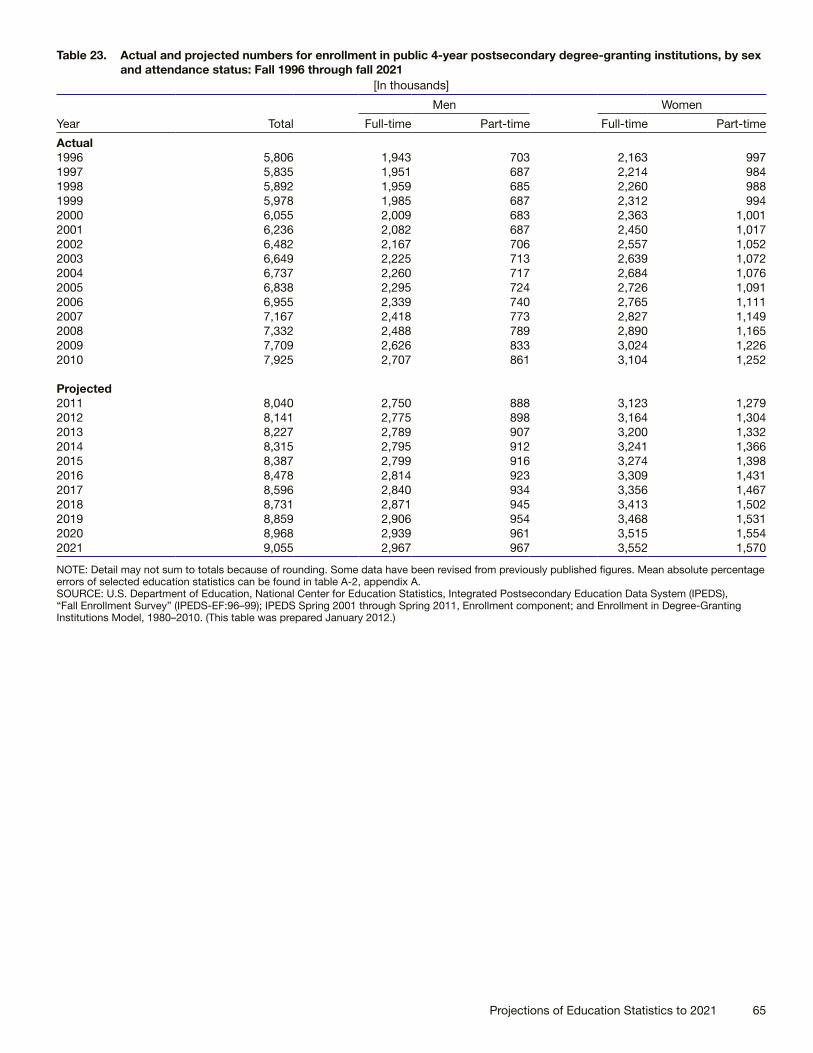
Projections of Education Statistics to 2021 65
Table 23. Actual and projected numbers for enrollment in public 4-year postsecondary degree-granting institutions, by sex and attendance status: Fall 1996 through fall 2021
[In thousands]
Year Total
Men Women
Full-time Part-time Full-time Part-time
Actual1996 5,806 1,943 703 2,163 9971997 5,835 1,951 687 2,214 9841998 5,892 1,959 685 2,260 9881999 5,978 1,985 687 2,312 9942000 6,055 2,009 683 2,363 1,0012001 6,236 2,082 687 2,450 1,0172002 6,482 2,167 706 2,557 1,0522003 6,649 2,225 713 2,639 1,0722004 6,737 2,260 717 2,684 1,0762005 6,838 2,295 724 2,726 1,0912006 6,955 2,339 740 2,765 1,1112007 7,167 2,418 773 2,827 1,1492008 7,332 2,488 789 2,890 1,1652009 7,709 2,626 833 3,024 1,2262010 7,925 2,707 861 3,104 1,252
Projected2011 8,040 2,750 888 3,123 1,2792012 8,141 2,775 898 3,164 1,3042013 8,227 2,789 907 3,200 1,3322014 8,315 2,795 912 3,241 1,3662015 8,387 2,799 916 3,274 1,3982016 8,478 2,814 923 3,309 1,4312017 8,596 2,840 934 3,356 1,4672018 8,731 2,871 945 3,413 1,5022019 8,859 2,906 954 3,468 1,5312020 8,968 2,939 961 3,515 1,5542021 9,055 2,967 967 3,552 1,570
NOTE: Detail may not sum to totals because of rounding. Some data have been revised from previously published figures. Mean absolute percentage errors of selected education statistics can be found in table A-2, appendix A. SOURCE: U.S. Department of Education, National Center for Education Statistics, Integrated Postsecondary Education Data System (IPEDS), “Fall Enrollment Survey” (IPEDS-EF:96–99); IPEDS Spring 2001 through Spring 2011, Enrollment component; and Enrollment in Degree-Granting Institutions Model, 1980–2010. (This table was prepared January 2012.)

66 Reference Tables
Table 24. Actual and projected numbers for enrollment in public 2-year postsecondary degree-granting institutions, by sex and attendance status: Fall 1996 through fall 2021
[In thousands]
Year Total
Men Women
Full-time Part-time Full-time Part-time
Actual1996 5,314 833 1,423 1,039 2,0191997 5,361 842 1,444 1,049 2,0261998 5,246 841 1,383 1,040 1,9811999 5,398 878 1,419 1,074 2,0262000 5,697 891 1,549 1,109 2,1482001 5,997 962 1,596 1,194 2,2452002 6,270 1,035 1,605 1,299 2,3322003 6,209 1,060 1,515 1,346 2,2882004 6,244 1,065 1,518 1,360 2,3002005 6,184 1,055 1,514 1,332 2,2832006 6,225 1,067 1,533 1,325 2,3002007 6,324 1,099 1,568 1,343 2,3142008 6,640 1,152 1,672 1,396 2,4202009 7,101 1,318 1,733 1,563 2,4882010 7,218 1,342 1,769 1,610 2,497
Projected2011 7,308 1,344 1,815 1,614 2,5352012 7,389 1,351 1,830 1,634 2,5742013 7,467 1,356 1,839 1,652 2,6202014 7,556 1,360 1,844 1,675 2,6782015 7,633 1,361 1,846 1,694 2,7322016 7,725 1,369 1,853 1,715 2,7882017 7,845 1,384 1,867 1,745 2,8492018 7,980 1,403 1,885 1,780 2,9122019 8,106 1,424 1,903 1,814 2,9672020 8,214 1,443 1,917 1,841 3,0142021 8,291 1,455 1,931 1,858 3,047
NOTE: Detail may not sum to totals because of rounding. Some data have been revised from previously published figures. Mean absolute percentage errors of selected education statistics can be found in table A-2, appendix A. SOURCE: U.S. Department of Education, National Center for Education Statistics, Integrated Postsecondary Education Data System (IPEDS), “Fall Enrollment Survey” (IPEDS-EF:96–99); IPEDS Spring 2001 through Spring 2011, Enrollment component; and Enrollment in Degree-Granting Institutions Model, 1980–2010. (This table was prepared January 2012.)

Projections of Education Statistics to 2021 67
Table 25. Actual and projected numbers for enrollment in private 4-year postsecondary degree-granting institutions, by sex and attendance status: Fall 1996 through fall 2021
[In thousands]
Year Total
Men Women
Full-time Part-time Full-time Part-time
Actual1996 2,998 991 356 1,133 5181997 3,061 1,008 360 1,170 5231998 3,126 1,038 353 1,220 5141999 3,218 1,069 360 1,270 5192000 3,308 1,107 365 1,315 5222001 3,441 1,151 365 1,389 5362002 3,601 1,199 377 1,468 5572003 3,768 1,250 382 1,561 5742004 3,990 1,313 400 1,670 6072005 4,162 1,354 402 1,774 6322006 4,285 1,381 411 1,830 6642007 4,464 1,422 433 1,911 6982008 4,800 1,496 480 2,041 7822009 5,197 1,596 518 2,228 8552010 5,410 1,646 565 2,260 940
Projected2011 5,482 1,669 583 2,270 9612012 5,558 1,686 590 2,302 9802013 5,624 1,697 595 2,331 1,0012014 5,692 1,702 599 2,364 1,0272015 5,750 1,706 602 2,390 1,0522016 5,818 1,717 607 2,417 1,0772017 5,905 1,734 614 2,453 1,1042018 6,003 1,754 622 2,496 1,1312019 6,090 1,774 628 2,535 1,1522020 6,163 1,793 633 2,568 1,1702021 6,221 1,808 637 2,593 1,182
NOTE: Detail may not sum to totals because of rounding. Some data have been revised from previously published figures. Mean absolute percentage errors of selected education statistics can be found in table A-2, appendix A.SOURCE: U.S. Department of Education, National Center for Education Statistics, Integrated Postsecondary Education Data System (IPEDS), “Fall Enrollment Survey” (IPEDS-EF:96–99); IPEDS Spring 2001 through Spring 2011, Enrollment component; and Enrollment in Degree-Granting Institutions Model, 1980–2010. (This table was prepared January 2012.)
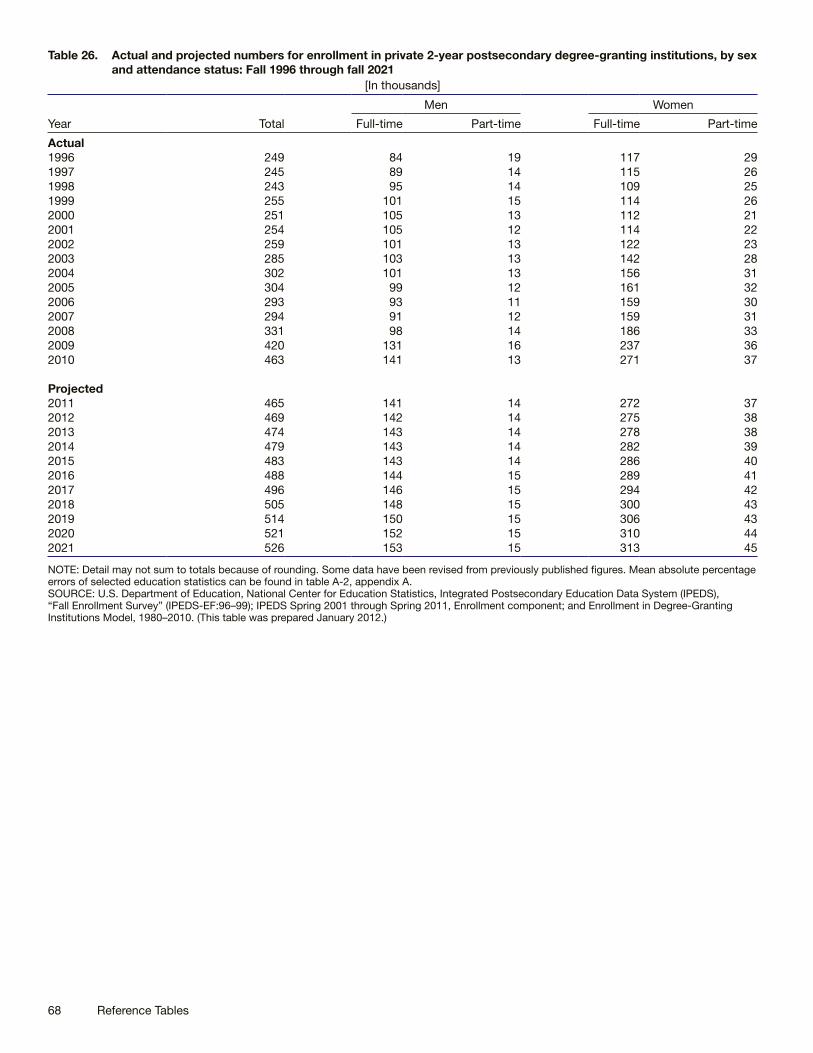
68 Reference Tables
Table 26. Actual and projected numbers for enrollment in private 2-year postsecondary degree-granting institutions, by sex and attendance status: Fall 1996 through fall 2021
[In thousands]
Year Total
Men Women
Full-time Part-time Full-time Part-time
Actual1996 249 84 19 117 291997 245 89 14 115 261998 243 95 14 109 251999 255 101 15 114 262000 251 105 13 112 212001 254 105 12 114 222002 259 101 13 122 232003 285 103 13 142 282004 302 101 13 156 312005 304 99 12 161 322006 293 93 11 159 302007 294 91 12 159 312008 331 98 14 186 332009 420 131 16 237 362010 463 141 13 271 37
Projected2011 465 141 14 272 372012 469 142 14 275 382013 474 143 14 278 382014 479 143 14 282 392015 483 143 14 286 402016 488 144 15 289 412017 496 146 15 294 422018 505 148 15 300 432019 514 150 15 306 432020 521 152 15 310 442021 526 153 15 313 45
NOTE: Detail may not sum to totals because of rounding. Some data have been revised from previously published figures. Mean absolute percentage errors of selected education statistics can be found in table A-2, appendix A. SOURCE: U.S. Department of Education, National Center for Education Statistics, Integrated Postsecondary Education Data System (IPEDS), “Fall Enrollment Survey” (IPEDS-EF:96–99); IPEDS Spring 2001 through Spring 2011, Enrollment component; and Enrollment in Degree-Granting Institutions Model, 1980–2010. (This table was prepared January 2012.)

Projections of Education Statistics to 2021 69
Table 27. Actual and projected numbers for undergraduate enrollment in all postsecondary degree-granting institutions, by sex, attendance status, and control of institution: Fall 1996 through fall 2021
[In thousands]
Year Total
Sex Attendance status Control
Men Women Full-time Part-time Public Private
Actual1996 12,327 5,421 6,906 7,299 5,028 9,935 2,3921997 12,451 5,469 6,982 7,419 5,032 10,007 2,4431998 12,437 5,446 6,991 7,539 4,898 9,950 2,4871999 12,739 5,584 7,155 7,754 4,986 10,174 2,5652000 13,155 5,778 7,377 7,923 5,232 10,539 2,6162001 13,716 6,004 7,711 8,328 5,388 10,986 2,7302002 14,257 6,192 8,065 8,734 5,523 11,433 2,8242003 14,480 6,227 8,253 9,045 5,435 11,523 2,9572004 14,781 6,340 8,441 9,284 5,496 11,651 3,1302005 14,964 6,409 8,555 9,446 5,518 11,698 3,2662006 15,184 6,514 8,671 9,571 5,613 11,847 3,3372007 15,604 6,728 8,876 9,841 5,763 12,138 3,4662008 16,366 7,067 9,299 10,255 6,111 12,591 3,7752009 17,565 7,595 9,970 11,144 6,422 13,387 4,1792010 18,079 7,835 10,244 11,452 6,627 13,704 4,374
Projected2011 18,326 7,979 10,347 11,563 6,763 13,893 4,4342012 18,528 8,038 10,489 11,671 6,856 14,045 4,4822013 18,704 8,076 10,628 11,753 6,950 14,181 4,5232014 18,894 8,093 10,802 11,839 7,055 14,329 4,5662015 19,050 8,100 10,950 11,902 7,148 14,451 4,5992016 19,248 8,138 11,110 11,996 7,252 14,605 4,6432017 19,515 8,210 11,305 12,141 7,374 14,811 4,7042018 19,824 8,300 11,524 12,320 7,504 15,048 4,7762019 20,129 8,398 11,731 12,514 7,615 15,279 4,8502020 20,395 8,488 11,907 12,687 7,708 15,480 4,9142021 20,597 8,564 12,033 12,819 7,778 15,632 4,965
NOTE: Detail may not sum to totals because of rounding. Some data have been revised from previously published figures. Mean absolute percentage errors of selected education statistics can be found in table A-2, appendix A.SOURCE: U.S. Department of Education, National Center for Education Statistics, Integrated Postsecondary Education Data System (IPEDS), “Fall Enrollment Survey” (IPEDS-EF:96–99); IPEDS Spring 2001 through Spring 2011, Enrollment component; and Enrollment in Degree-Granting Institutions Model, 1980–2010. (This table was prepared January 2012.)

70 Reference Tables
Table 28. Actual and projected numbers for postbaccalaureate enrollment in all postsecondary degree-granting institutions, by sex, attendance status, and control of institution: Fall 1996 through fall 2021
[In thousands]
Year Total
Sex Attendance status Control
Men Women Full-time Part-time Public Private
Actual1996 2,041 932 1,108 1,004 1,036 1,185 8551997 2,052 927 1,124 1,019 1,032 1,189 8631998 2,070 923 1,147 1,025 1,045 1,188 8821999 2,110 931 1,179 1,050 1,061 1,202 9092000 2,157 944 1,213 1,087 1,070 1,213 9432001 2,212 956 1,256 1,120 1,093 1,247 9652002 2,355 1,010 1,345 1,212 1,143 1,319 1,0352003 2,431 1,033 1,398 1,281 1,150 1,336 1,0962004 2,491 1,047 1,444 1,326 1,166 1,330 1,1622005 2,524 1,047 1,476 1,351 1,173 1,324 1,1992006 2,575 1,061 1,514 1,386 1,188 1,333 1,2422007 2,644 1,088 1,556 1,429 1,215 1,353 1,2912008 2,737 1,122 1,615 1,493 1,244 1,381 1,3562009 2,862 1,174 1,688 1,579 1,283 1,424 1,4382010 2,937 1,210 1,728 1,631 1,307 1,439 1,499
Projected2011 2,968 1,224 1,744 1,621 1,347 1,455 1,5132012 3,029 1,248 1,781 1,658 1,371 1,484 1,5452013 3,088 1,265 1,823 1,692 1,397 1,513 1,5752014 3,148 1,277 1,871 1,723 1,425 1,543 1,6062015 3,202 1,288 1,914 1,750 1,453 1,569 1,6332016 3,261 1,304 1,957 1,778 1,482 1,598 1,6632017 3,327 1,323 2,004 1,811 1,516 1,630 1,6972018 3,394 1,343 2,052 1,843 1,551 1,664 1,7312019 3,440 1,355 2,085 1,862 1,578 1,686 1,7542020 3,472 1,363 2,110 1,873 1,599 1,702 1,7702021 3,495 1,369 2,126 1,881 1,614 1,714 1,782
NOTE: Detail may not sum to totals because of rounding. Some data have been revised from previously published figures. Mean absolute percentage errors of selected education statistics can be found in table A-2, appendix A.SOURCE: U.S. Department of Education, National Center for Education Statistics, Integrated Postsecondary Education Data System (IPEDS), “Fall Enrollment Survey” (IPEDS-EF:96–99); IPEDS Spring 2001 through Spring 2011, Enrollment component; and Enrollment in Degree-Granting Institutions Model, 1980–2010. (This table was prepared January 2012.)

Projections of Education Statistics to 2021 71
Table 29. Actual and projected numbers for enrollment of U.S. residents in all postsecondary degree-granting institutions, by race/ethnicity: Fall 1996 through fall 2021
[In thousands]
Year Total
Race/ethnicity
White Black HispanicAsian/Pacific
IslanderAmerican Indian/
Alaska Native
Actual1996 13,901 10,264 1,506 1,166 828 1381997 14,037 10,266 1,551 1,218 859 1421998 14,063 10,179 1,583 1,257 900 1441999 14,362 10,329 1,649 1,324 914 1462000 14,784 10,462 1,730 1,462 978 1512001 15,363 10,775 1,850 1,561 1,019 1582002 16,021 11,140 1,979 1,662 1,074 1662003 16,314 11,281 2,068 1,716 1,076 1732004 16,682 11,423 2,165 1,810 1,109 1762005 16,903 11,495 2,215 1,882 1,134 1762006 17,163 11,572 2,280 1,964 1,165 1812007 17,624 11,756 2,383 2,076 1,218 1902008 18,442 12,089 2,584 2,273 1,303 1932009 19,743 12,731 2,920 2,547 1,338 2082010 20,307 12,930 3,088 2,785 1,303 200
Projected2011 20,551 12,996 3,144 2,871 1,338 2012012 20,782 13,042 3,216 2,959 1,364 2012013 20,987 13,060 3,288 3,051 1,386 2012014 21,209 13,073 3,372 3,159 1,405 2012015 21,390 13,053 3,448 3,267 1,422 2002016 21,613 13,066 3,527 3,379 1,442 2002017 21,910 13,136 3,610 3,498 1,466 2002018 22,248 13,236 3,694 3,626 1,492 2012019 22,561 13,328 3,764 3,750 1,517 2022020 22,822 13,388 3,824 3,868 1,540 2022021 23,010 13,407 3,873 3,967 1,560 202
NOTE: Race categories exclude persons of Hispanic ethnicity. Because of underreporting and nonreporting of racial/ethnic data and nonresident aliens, some estimates are slightly lower than corresponding data in other published tables. Enrollment data in the “race/ethnicity unknown” (all years) and “two or more races” (2008, 2009, and 2010 only) categories of the IPEDS “Enrollment component” have been prorated to the other racial/ethnic categories at the institutional level. Detail may not sum to totals because of rounding. Mean absolute percentage errors of selected education statistics can be found in table A-2, appendix A. Some data have been revised from previously published figures.SOURCE: U.S. Department of Education, National Center for Education Statistics, Integrated Postsecondary Education Data System (IPEDS), “Fall Enrollment Survey” (IPEDS-EF:96–99); IPEDS Spring 2001 through Spring 2011, Enrollment component; and Enrollment in Degree-Granting Institutions by Race/Ethnicity Model, 1980–2010. (This table was prepared February 2012.)
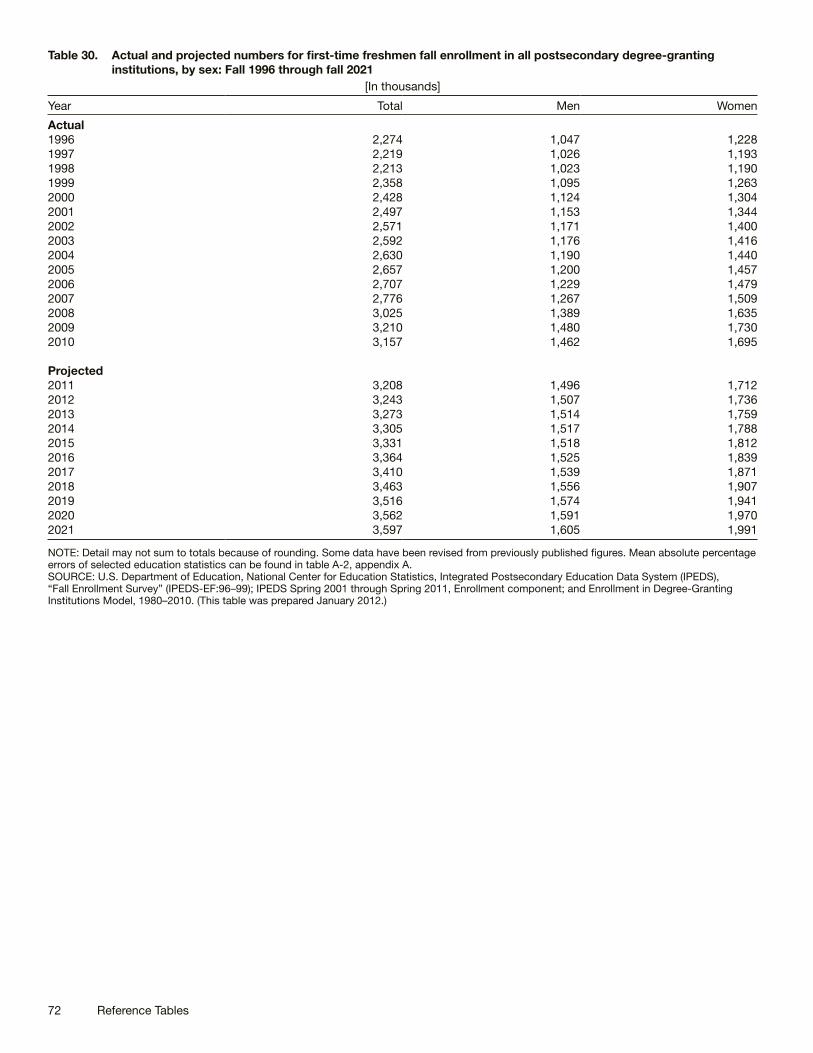
72 Reference Tables
Table 30. Actual and projected numbers for first-time freshmen fall enrollment in all postsecondary degree-granting institutions, by sex: Fall 1996 through fall 2021
[In thousands]
Year Total Men Women
Actual1996 2,274 1,047 1,2281997 2,219 1,026 1,1931998 2,213 1,023 1,1901999 2,358 1,095 1,2632000 2,428 1,124 1,3042001 2,497 1,153 1,3442002 2,571 1,171 1,4002003 2,592 1,176 1,4162004 2,630 1,190 1,4402005 2,657 1,200 1,4572006 2,707 1,229 1,4792007 2,776 1,267 1,5092008 3,025 1,389 1,6352009 3,210 1,480 1,7302010 3,157 1,462 1,695
Projected2011 3,208 1,496 1,7122012 3,243 1,507 1,7362013 3,273 1,514 1,7592014 3,305 1,517 1,7882015 3,331 1,518 1,8122016 3,364 1,525 1,8392017 3,410 1,539 1,8712018 3,463 1,556 1,9072019 3,516 1,574 1,9412020 3,562 1,591 1,9702021 3,597 1,605 1,991
NOTE: Detail may not sum to totals because of rounding. Some data have been revised from previously published figures. Mean absolute percentage errors of selected education statistics can be found in table A-2, appendix A. SOURCE: U.S. Department of Education, National Center for Education Statistics, Integrated Postsecondary Education Data System (IPEDS), “Fall Enrollment Survey” (IPEDS-EF:96–99); IPEDS Spring 2001 through Spring 2011, Enrollment component; and Enrollment in Degree-Granting Institutions Model, 1980–2010. (This table was prepared January 2012.)

Projections of Education Statistics to 2021 73
Table 31. Actual and projected numbers for full-time-equivalent enrollment in all postsecondary degree-granting institutions, by control and level of institution: Fall 1996 through fall 2021
[In thousands]
Year Total
Public Private
4-year 2-year 4-year 2-year
Actual1996 10,482 4,767 3,028 2,468 2191997 10,615 4,814 3,056 2,525 2201998 10,699 4,869 3,011 2,599 2201999 10,975 4,950 3,109 2,684 2312000 11,267 5,026 3,241 2,770 2312001 11,766 5,194 3,445 2,894 2332002 12,331 5,406 3,655 3,033 2372003 12,689 5,558 3,684 3,186 2602004 13,001 5,641 3,707 3,377 2762005 13,201 5,728 3,662 3,533 2772006 13,403 5,825 3,679 3,631 2682007 13,783 5,994 3,745 3,775 2682008 14,394 6,140 3,922 4,030 3022009 15,496 6,452 4,298 4,357 3892010 15,943 6,636 4,385 4,490 433
Projected2011 16,112 6,719 4,418 4,540 4342012 16,300 6,799 4,463 4,600 4382013 16,459 6,863 4,505 4,650 4422014 16,625 6,926 4,552 4,700 4472015 16,759 6,976 4,592 4,740 4502016 16,930 7,043 4,642 4,790 4552017 17,164 7,133 4,712 4,856 4622018 17,435 7,240 4,793 4,932 4702019 17,697 7,344 4,872 5,003 4792020 17,923 7,435 4,939 5,063 4862021 18,093 7,509 4,984 5,110 490
NOTE: Detail may not sum to totals because of rounding. Some data have been revised from previously published figures. Mean absolute percentage errors of selected education statistics can be found in table A-2, appendix A. SOURCE: U.S. Department of Education, National Center for Education Statistics, Integrated Postsecondary Education Data System (IPEDS), “Fall Enrollment Survey” (IPEDS-EF:96–99); IPEDS Spring 2001 through Spring 2011, Enrollment component; and Enrollment in Degree-Granting Institutions Model, 1980–2010. (This table was prepared January 2012.)

74 Reference Tables
Table 32. Actual and projected numbers for associate’s degrees conferred by postsecondary degree-granting institutions, by sex of recipient: 1996–97 through 2021–22
Year Total Men Women
Actual1996–97 571,226 223,948 347,2781997–98 558,555 217,613 340,9421998–99 564,984 220,508 344,4761999–2000 564,933 224,721 340,2122000–01 578,865 231,645 347,2202001–02 595,133 238,109 357,0242002–03 634,016 253,451 380,5652003–04 665,301 260,033 405,2682004–05 696,660 267,536 429,1242005–06 713,066 270,095 442,9712006–07 728,114 275,187 452,9272007–08 750,164 282,521 467,6432008–09 787,325 298,141 489,1842009–10 849,452 322,916 526,536
Projected2010–11 888,000 332,000 557,0002011–12 924,000 345,000 579,0002012–13 937,000 350,000 587,0002013–14 943,000 352,000 591,0002014–15 951,000 355,000 596,0002015–16 959,000 357,000 601,0002016–17 967,000 360,000 607,0002017–18 977,000 364,000 613,0002018–19 989,000 368,000 621,0002019–20 1,003,000 373,000 630,0002020–21 1,017,000 378,000 638,0002021–22 1,028,000 383,000 646,000
NOTE: Some data have been revised from previously published figures. Detail may not sum to totals because of rounding. Mean absolute percentage errors of selected education statistics can be found in table A-2, appendix A. SOURCE: U.S. Department of Education, National Center for Education Statistics, Integrated Postsecondary Education Data System (IPEDS), “Completions Survey” (IPEDS-C:97–99); IPEDS Fall 2000 through Fall 2010, Completions component; and Degrees Conferred Model, 1980–81 through 2009–10. (This table was prepared March 2012.)

Projections of Education Statistics to 2021 75
Table 33. Actual and projected numbers for bachelor’s degrees conferred by postsecondary degree-granting institutions, by sex of recipient: 1996–97 through 2021–22
Year Total Men Women
Actual1996–97 1,172,879 520,515 652,3641997–98 1,184,406 519,956 664,4501998–99 1,202,239 519,961 682,2781999–2000 1,237,875 530,367 707,5082000–01 1,244,171 531,840 712,3312001–02 1,291,900 549,816 742,0842002–03 1,348,811 573,258 775,5532003–04 1,399,542 595,425 804,1172004–05 1,439,264 613,000 826,2642005–06 1,485,242 630,600 854,6422006–07 1,524,092 649,570 874,5222007–08 1,563,069 667,928 895,1412008–09 1,601,368 685,382 915,9862009–10 1,650,014 706,633 943,381
Projected2010–11 1,703,000 732,000 971,0002011–12 1,776,000 766,000 1,010,0002012–13 1,812,000 784,000 1,028,0002013–14 1,836,000 795,000 1,040,0002014–15 1,855,000 800,000 1,054,0002015–16 1,870,000 803,000 1,066,0002016–17 1,886,000 806,000 1,080,0002017–18 1,902,000 809,000 1,093,0002018–19 1,922,000 815,000 1,107,0002019–20 1,948,000 823,000 1,124,0002020–21 1,976,000 833,000 1,142,0002021–22 2,004,000 844,000 1,160,000
NOTE: Some data have been revised from previously published figures. Detail may not sum to totals because of rounding. Mean absolute percentage errors of selected education statistics can be found in table A-2, appendix A.SOURCE: U.S. Department of Education, National Center for Education Statistics, Integrated Postsecondary Education Data System (IPEDS), “Completions Survey” (IPEDS-C:97–99); IPEDS Fall 2000 through Fall 2010, Completions component; and Degrees Conferred Model, 1980–81 through 2009–10. (This table was prepared March 2012.)

76 Reference Tables
Table 34. Actual and projected numbers for master’s degrees conferred by postsecondary degree-granting institutions, by sex of recipient: 1996–97 through 2021–22
Year Total Men Women
Actual1996–97 425,260 185,270 239,9901997–98 436,037 188,718 247,3191998–99 446,038 190,230 255,8081999–2000 463,185 196,129 267,0562000–01 473,502 197,770 275,7322001–02 487,313 202,604 284,7092002–03 518,699 215,172 303,5272003–04 564,272 233,056 331,2162004–05 580,151 237,155 342,9962005–06 599,731 241,656 358,0752006–07 610,597 242,189 368,4082007–08 630,666 250,169 380,4972008–09 662,079 263,538 398,5412009–10 693,025 275,197 417,828
Projected2010–11 723,000 291,000 432,0002011–12 738,000 298,000 440,0002012–13 756,000 303,000 453,0002013–14 778,000 311,000 466,0002014–15 798,000 317,000 481,0002015–16 817,000 322,000 494,0002016–17 836,000 328,000 508,0002017–18 857,000 335,000 523,0002018–19 879,000 342,000 538,0002019–20 898,000 347,000 551,0002020–21 915,000 351,000 564,0002021–22 930,000 354,000 576,000
NOTE: Includes some degrees formerly classified as first professional such as divinity degrees (M.Div. and M.H.L./Rav). All data have been revised from previously published figures.SOURCE: U.S. Department of Education, National Center for Education Statistics, Integrated Postsecondary Education Data System (IPEDS), “Completions Survey” (IPEDS-C:97–99); IPEDS Fall 2000 through Fall 2010, Completions component; and Degrees Conferred Model, 1980–81 through 2009–10. (This table was prepared March 2012.)

Projections of Education Statistics to 2021 77
Table 35. Actual and projected numbers for doctor’s degrees conferred by postsecondary degree-granting institutions, by sex of recipient: 1996–97 through 2021–22
Year Total Men Women
Actual1996–97 118,747 68,387 50,3601997–98 118,735 67,232 51,5031998–99 116,700 65,340 51,3601999–2000 118,736 64,930 53,8062000–01 119,585 64,171 55,4142001–02 119,663 62,731 56,9322002–03 121,579 62,730 58,8492003–04 126,087 63,981 62,1062004–05 134,387 67,257 67,1302005–06 138,056 68,912 69,1442006–07 144,690 71,308 73,3822007–08 149,378 73,453 75,9252008–09 154,425 75,639 78,7862009–10 158,558 76,605 81,953
Projected2010–11 164,000 78,500 85,5002011–12 170,300 81,500 88,7002012–13 174,700 84,700 90,1002013–14 176,600 85,700 90,9002014–15 179,000 86,100 92,9002015–16 182,400 87,400 95,0002016–17 185,200 88,100 97,0002017–18 187,500 88,600 98,9002018–19 190,000 89,200 100,8002019–20 192,800 90,000 102,8002020–21 195,500 90,900 104,5002021–22 197,400 91,500 105,800
NOTE: Doctor’s degrees include Ph.D., Ed.D., and comparable degrees at the doctoral level. Includes most degrees formerly classified as first-professional, such as M.D., D.D.S., and law degrees. See the glossary. Some data have been revised from previously published figures. Detail may not sum to totals because of rounding. Mean absolute percentage errors of selected education statistics can be found in table A-2, appendix A. SOURCE: U.S. Department of Education, National Center for Education Statistics, Integrated Postsecondary Education Data System (IPEDS), “Completions Survey” (IPEDS-C:97–99); IPEDS Fall 2000 through Fall 2010, Completions component; and Degrees Conferred Model, 1980–81 through 2009–10. (This table was prepared March 2012.)

This page intentionally left blank.

Projections of Education Statistics to 2021 79
Technical Appendixes

80 Appendix A: Introduction to Projection Methodology
Appendix AIntroduction to Projection Methodology
A.0. INTRODUCTION TO PROJECTION METHODOLOGY
Content of appendix ASince its inception in 1964, the Projections of Education Statistics series has been providing projections of key education statistics to policy makers, educators, researchers, the press, and the general public. This edition of Projections of Education Statistics is the fortieth in the series.
Appendix A contains this introduction, which provides a general overview of the projection methodology, as well as six additional sections, which discuss the specific methodology for the different statistics projected:
» » » » » » »
A.0. Introduction to Projection Methodology;A.1. Elementary and Secondary Enrollment;A.2. High School Graduates;A.3. Elementary and Secondary Teachers;A.4. Expenditures for Public Elementary and Secondary Education;A.5. Enrollment in Postsecondary Degree-Granting Institutions; andA.6. Postsecondary Degrees Conferred.
This introduction
» » » »
outlines the two major techniques used to make the projections;summarizes key demographic and economic assumptions underlying the projections;examines the accuracy of the projections; andintroduces the subsequent sections of appendix A.
Projection techniquesTwo main projection techniques were used to develop the projections presented in this publication:
»
»
Exponential smoothing was the technique used in the projections of elementary and secondary enrollments and high school graduates. This technique also played a role in the projections of teachers at the elementary and secondary level, as well as enrollments and degrees conferred at the postsecondary level.Multiple linear regression was the primary technique used in the projections of teachers and expenditures at the elementary and secondary level, as well as enrollments and degrees conferred at the postsecondary level.
Exponential smoothing
Two different types of exponential smoothing, single exponential smoothing and double exponential smoothing, were used in producing the projections presented in this publication.
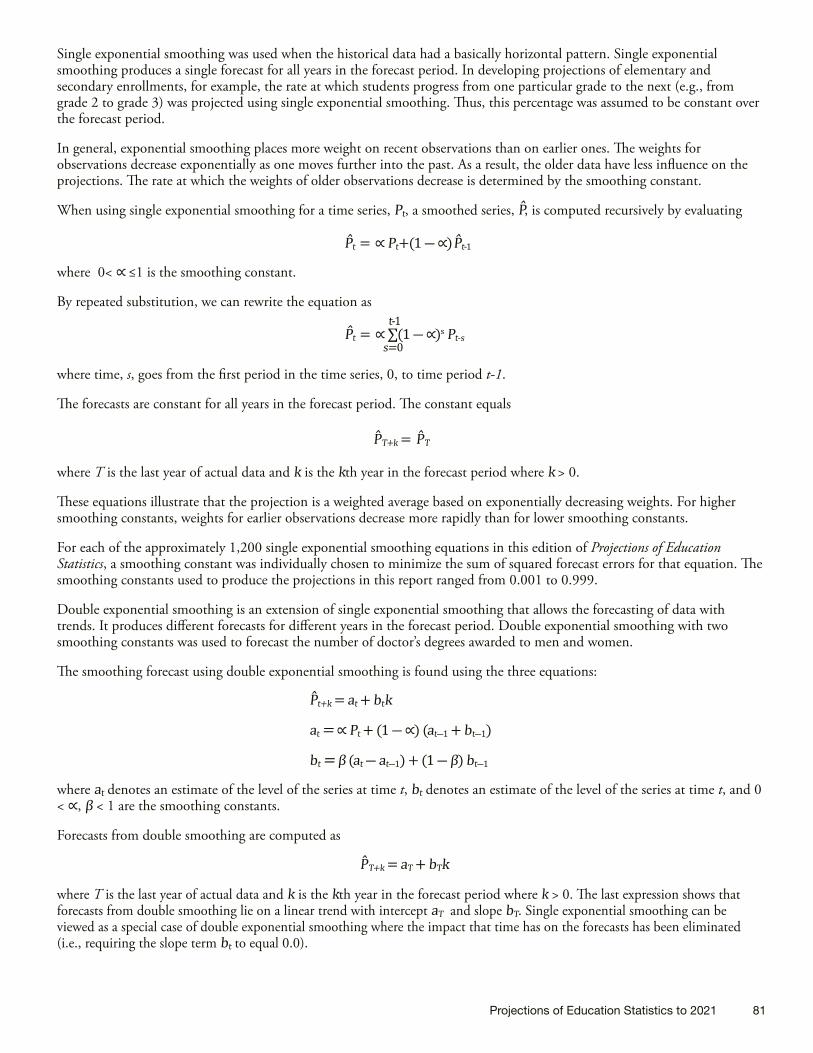
Projections of Education Statistics to 2021 81
Single exponential smoothing was used when the historical data had a basically horizontal pattern. Single exponential smoothing produces a single forecast for all years in the forecast period. In developing projections of elementary and secondary enrollments, for example, the rate at which students progress from one particular grade to the next (e.g., from grade 2 to grade 3) was projected using single exponential smoothing. Thus, this percentage was assumed to be constant over the forecast period.
In general, exponential smoothing places more weight on recent observations than on earlier ones. The weights for observations decrease exponentially as one moves further into the past. As a result, the older data have less influence on the projections. The rate at which the weights of older observations decrease is determined by the smoothing constant.
When using single exponential smoothing for a time series, , a smoothed series, , is computed recursively by evaluatingPt
Pt t-1t = P ∝ P +(1 ― ∝)
P
where 0< ∝ ≤1 is the smoothing constant.
By repeated substitution, we can rewrite the equation as
Pt = Pt-s ∝ ∑(1 ― ∝)s t-1
s=0
where time, s, goes from the first period in the time series, 0, to time period t-1.
The forecasts are constant for all years in the forecast period. The constant equals
PT+k = PT
where T is the last year of actual data and k is the kth year in the forecast period where k > 0.
These equations illustrate that the projection is a weighted average based on exponentially decreasing weights. For higher smoothing constants, weights for earlier observations decrease more rapidly than for lower smoothing constants.
For each of the approximately 1,200 single exponential smoothing equations in this edition of Projections of Education Statistics, a smoothing constant was individually chosen to minimize the sum of squared forecast errors for that equation. The smoothing constants used to produce the projections in this report ranged from 0.001 to 0.999.
Double exponential smoothing is an extension of single exponential smoothing that allows the forecasting of data with trends. It produces different forecasts for different years in the forecast period. Double exponential smoothing with two smoothing constants was used to forecast the number of doctor’s degrees awarded to men and women.
The smoothing forecast using double exponential smoothing is found using the three equations:
Pt+k = at + btk
at = ∝ Pt + (1 ― ∝) (at ―1 + bt ―1)
bt = β (at ― at ―1) + (1 ― β) bt ―1
where at denotes an estimate of the level of the series at time t, bt denotes an estimate of the level of the series at time t, and 0 < ∝, β < 1 are the smoothing constants.
Forecasts from double smoothing are computed as
where T is the last year of actual data and k is the kth year in the forecast period where k > 0. The last expression shows that forecasts from double smoothing lie on a linear trend with intercept aT and slope bT. Single exponential smoothing can be viewed as a special case of double exponential smoothing where the impact that time has on the forecasts has been eliminated (i.e., requiring the slope term bt to equal 0.0).
PT+k = aT + bTk

82 Appendix A: Introduction to Projection Methodology
The smoothing constants for each of the two double exponential smoothing equations used for this report were selected using a search algorithm that finds the pair of smoothing constants that together minimizes the sum of forecast errors for their equation.
Beginning with the Projections of Education Statistics to 2020, each smoothing constant was chosen separately. In earlier editions all the smoothing constants had been set to 0.4. Also beginnings with that edition, two smoothing constants, rather than one, were used for double exponential smoothing.
Multiple linear regression
Multiple linear regression was used in cases where a strong relationship exists between the variable being projected (the dependent variable) and independent variables. This technique can be used only when accurate data and reliable projections of the independent variables are available. Key independent variables for this publication include demographic and economic factors. For example, current expenditures for public elementary and secondary education are related to economic factors such as disposable income and education revenues from state sources. The sources of the demographic and economic projections used for this publication are discussed below, under “Assumptions.”
The equations in this appendix should be viewed as forecasting rather than structural equations. That is, the equations are intended only to project values for the dependent variables, not to reflect all elements of underlying social, political, and economic structures. Lack of available data precluded the building of large-scale structural models. The particular equations shown were selected on the basis of their statistical properties, such as coefficients of determination (R²s), the t-statistics of the coefficients, the Durbin-Watson statistic, the Breusch-Godfrey Serial Correlation LM test statistic, and residual plots.
The functional form primarily used is the multiplicative model. When used with two independent variables, this model takes the form:
Y = a ∙ X1 ∙ X2 b1 b2
This equation can easily be transformed into the linear form by taking the natural log (ln) of both sides of the equation:
ln(Y) = ln(a) + b1lnX1 + b2lnX2
One property of this model is that the coefficient of an independent variable shows how responsive in percentage terms the dependent variable is to a one percent change in that independent variable (also called the elasticity). For example, a 1 percent change in X1 in the above equation would lead to a b1 percent change in Y.
Assumptions All projections are based on underlying assumptions, and these assumptions determine projection results to a large extent. It is important that users of projections understand the assumptions to determine the acceptability of projected time series for their purposes. All the projections in this publication are to some extent dependent on demographic and/or economic assumptions.
Demographic assumptions
Many of the projections in this publication are demographically based on the U.S. Census Bureau’s 2008 National Population Projections (August 2008) and the Interim State Population Projections (April 2005).
The two sets of Census Bureau population projections are produced using cohort-component models. In order for the national-level population projections by age, sex, and race/ethnicity to be consistent with the most recent historical estimates released by the Census Bureau, the projections were ratio-adjusted by applying the ratio of the last historical estimate to the corresponding projections year to the projections for each age, sex, and race/ethnicity combination. This allows for a consistent set of historical estimates and projections. For more information on the methodology used for Census Bureau population projections, see appendix C, Data Sources.
The enrollment projections in this publication depend on Census Bureau population projections for the various age groups that attend school. The future fertility rate assumption (along with corresponding projections of female populations) determines projections of the number of births, a key factor for population projections. The fertility rate assumption plays a major role in determining population projections for the age groups enrolled in nursery school, kindergarten, and elementary grades. The effects of the fertility rate assumption are more pronounced toward the end of the forecast period, while immigration assumptions affect all years. For enrollments in secondary grades and college, the fertility rate assumption is of no consequence, since all the population cohorts for these enrollment ranges have already been born.

Projections of Education Statistics to 2021 83
Economic assumptions
Various economic variables are used in the forecasting models for numbers of elementary and secondary teachers, public elementary and secondary school expenditures, and postsecondary enrollment.
The source of these variables is the trend scenario of the “U.S. Monthly Model January 2012: Short-Term Projections” developed by the economic consulting firm IHS Global Insight. The trend scenario depicts a mean of possible paths that the economy could take over the forecast period, barring major shocks. The economy, in this scenario, evolves smoothly, without major fluctuations.
More information about specific assumptions
For details about the primary assumptions used in this edition of Projections of Education Statistics, see table A-1 on page 84.
Accuracy of the projections Projections of time series usually differ from the final reported data due to errors from many sources. This is because of the inherent nature of the statistical universe from which the basic data are obtained and the properties of projection methodologies, which depend on the validity of many assumptions.
The mean absolute percentage error (MAPE) is one way to express the forecast accuracy of past projections. This measure expresses the average absolute value of errors over past projections in percentage terms. For example, an analysis of projection errors over the past 28 editions of Projections of Education Statistics indicates that the MAPEs for public school enrollment in grades PK–12 for lead times of 1, 2, 5, and 10 years were 0.3, 0.6, 1.3, and 2.6 percent, respectively. For the 1-year-out projection, this means that one would expect the projection to be within 0.3 percent of the actual value, on average.
For a list of MAPEs for selected national statistics in this publication, see table A-2 on page 85. Sections A.1 through A.5 each contains at least one text table (tables A through F) that presents the MAPEs for the key national statistics of that section. Each text table appears directly after the discussion of accuracy of that section’s national projections. For a list of MAPEs by state and region for public elementary and secondary enrollment, see tables A-7 through A-9 on pages 94–99 and for a list of MAPEs by state and region for the number of high school graduates in public schools, see table A-10 on pages 104–105.
Tables A-3 and A-4 present an example of how the MAPEs were constructed using actual values for national public elementary and secondary enrollment projections for schools years 2007 through 2010 and enrollment projections from the last four editions of Projections of Education Statistics. The top two panels of table A-3 shows the actual values for school years 2007 through 2010 and enrollment projections for each year from Projections of Education Statistics to 2017 with the number of projections generally decreasing by one for each subsequent edition. The bottom panel of table A-3 shows the percentage differences between the actual values and the projected values. For example, the projected value for 2007 presented in Projections of Education Statistics to 2017 was 0.7 lower than the actual value for that year.
The top panel of table A-4 shows the absolute value of the percent differences from table A-3 arranged by lead time rather than year. For example, in the Projections of Education Statistics to 2018, the last year of actual data reported was 2006–07 and thus the lead time for the projection of 2007–08 data was 1 year. Thus, the 0.4 appearing in the 2007–08 column of Table A-3 for Projections of Education Statistics to 2018 appears in the column for lead times of 1 year in Table A-4, indicating that projection of the one-year-out forecast from Projections of Education Statistics to 2018 differed by 0.4 percent in absolute terms from its actual value. The MAPEs for each lead time shown in the bottom panel of table A-4 were calculated by computing the average of the absolute values of the percentage differences for that lead time. For example, the absolute values of the percentage differences for lead time 2 for the four editions of the Projections of Education Statistics appearing on the top panel table A-4 are 0.7, 0.7, 0.1, and 0.4. The MAPE for a lead time of 2 years was then calculated by taking the average of these numbers, or 0.5. This matches the MAPE that appears in the bottom panel for a lead time of 2 years. (Calculations for table A-3 are based on unrounded numbers.) These MAPEs are different from the MAPEs for public elementary and secondary enrollment projections elsewhere in this report because the MAPEs in the example were calculated using only the last 4 editions of Projections of Education Statistics.
The number of years used in the analysis of the projection error differs by statistics both because projections of additional education statistics have been added to the report over time and because, for some statistics, there have been such a substantial change in the methodology used to produce the projections that the projections produced using the earlier methodology were not included in the analysis of the projection error. MAPEs are presented for a statistic only after it has been produced using substantially the same methodology in five previous editions of Projections of Education Statistics.

84 Appendix A: Introduction to Projection Methodology
Table A-1. Summary of forecast assumptions to 2021
Variable Assumption
Demographic assumptionsPopulation Projections are consistent with the Census Bureau estimates1
18- to 24-year-old population Census Bureau projection: average annual growth rate of 0.1%25- to 29-year-old population Census Bureau projection: average annual growth rate of 0.6%30- to 34-year-old population Census Bureau projection: average annual growth rate of 1.3%35- to 44-year-old population Census Bureau projection: average annual growth rate of 0.6%
Economic assumptionsDisposable income per capita in
constant dollarsAnnual percent changes range between -1.9% and 2.2%
with an annual growth rate of 1.4%Education revenue receipts from state
sources per capita in constant dollarsAnnual percent changes range between -2.4% and 2.3%
with an annual growth rate of 1.3%Inflation rate Inflation rate ranges between 1.0% and 2.0%
Unemployment rate (men)Ages 18 and 19 Remains between 17.7% and 26.8%Ages 20 to 24 Remains between 10.8% and 15.6%Age 25 and over Remains between 5.3% and 7.9%
Unemployment rate (women)Ages 18 and 19 Remains between 14.3% and 19.6%Ages 20 to 24 Remains between 9.3% and 13.1%Age 25 and over Remains between 5.0% and 7.3%1 As the Census Bureau projections were not updated to reflect the 2011 Census Bureau population estimates, the Census Bureau age-specific population projections for each year were adjusted by multiplying the ratio of the total Census Bureau estimate for 2011 to the total Census Bureau projection for 2011.SOURCE: U.S. Department of Commerce, Census Bureau, Population Estimates, retrieved October 16, 2011, from http://www.census.gov/popest/data/index.html; and 2008 National Population Projections, retrieved November 2, 2008, from http://www.census.gov/population/www/projections/2008projections.html; and IHS Global Insight, “U.S. Monthly Model January 2012 Short-Term Projections.” (This table was prepared March 2012.)

Projections of Education Statistics to 2021 85
Table A-2. Mean absolute percentage errors (MAPEs), by lead time for selected statistics in all elementary and secondary schools and postsecondary degree-granting institutions: 2012
Statistic
Lead time (years)
1 2 3 4 5 6 7 8 9 10
Public elementary and secondary schoolsPrekindergarten–12 enrollment1 0.3 0.6 0.8 1.1 1.3 1.4 1.6 1.9 2.3 2.6
Prekindergarten–8 enrollment1 0.3 0.6 1.0 1.3 1.4 1.6 1.9 2.4 2.8 3.39–12 enrollment1 0.4 0.7 0.9 1.1 1.2 1.5 1.8 2.2 2.4 2.5
High school graduates2 1.0 1.0 1.5 1.6 1.5 2.0 2.7 3.7 4.3 4.3Elementary and secondary teachers3 0.8 1.4 1.7 2.2 2.8 3.4 3.9 4.3 5.0 5.9Total current expenditures4 1.3 2.1 2.0 2.1 2.6 3.3 3.9 4.1 4.0 4.0Current expenditures per pupil in fall enrollment4 1.3 2.1 2.0 2.0 2.9 3.6 4.3 4.6 5.2 5.2
Private elementary and secondary schools5
Prekindergarten–12 enrollment 3.4 4.6 3.7 7.2 7.7 10.6 9.3 9.4 8.1 6.3Prekindergarten–8 enrollment 3.5 4.9 4.1 8.0 9.2 12.1 10.6 10.4 10.2 7.99–12 enrollment 3.0 3.8 2.3 4.3 2.8 5.8 5.7 6.1 1.3 1.3
High school graduates 0.9 0.9 1.6 2.8 5.0 6.2 4.9 4.8 1.6 1.6
Postsecondary degree-granting institutions6
Total enrollment 1.7 2.6 3.6 4.7 5.3 6.2 7.6 9.4 11.7 13.1Men 1.7 3.0 4.2 5.5 6.3 7.0 8.1 9.8 11.7 13.3Women 1.8 2.6 3.7 4.3 4.6 5.6 7.2 9.0 11.7 12.94-year institutions 1.8 3.0 4.0 5.4 6.0 7.0 8.5 10.6 13.1 14.82-year institutions 2.2 3.2 4.2 4.8 5.0 5.0 5.9 7.1 9.4 10.1White 1.1 2.4 3.9 5.5 6.7 7.4 — — — —Black or African American 4.2 8.8 12.5 15.8 19.0 20.5 — — — —Hispanic or Latino 4.2 8.6 12.1 15.5 18.9 22.1 — — — —Asian/Pacific Islander 2.6 5.0 5.7 7.0 6.0 4.7 — — — —American Indian/Alaska Native 5.2 4.1 5.6 3.3 2.4 5.0 — — — —Nonresident alien 2.7 4.8 7.8 9.5 7.3 2.1 — — — —
— Not available.1 MAPEs for public prekindergarten–12 enrollments were calculated using the last 28 editions of Projections of Education Statistics.2 MAPEs for public high school graduates were calculated from the past 21 editions of Projections of Education Statistics.3 Data for teachers expressed in full-time equivalents. MAPEs for teachers were calculated from the past 20 editions containing teacher projections.4 In constant dollars based on the Consumer Price Index for all urban consumers, Bureau of Labor Statistics, U.S. Department of Labor. MAPEs for current expenditures were calculated using projections from the last 20 editions containing current expenditure projections.5 MAPEs for private prekindergarten–12 enrollments and high school graduates were calculated from the past 10 editions.6 MAPEs for postsecondary degree-granting institution enrollments were calculated using the last 14 editions of Projections of Education Statistics.NOTE: Mean absolute percentage error is the average value over past projections of the absolute values of errors expressed in percentage terms. No MAPEs are presented for degrees conferred as the current models used for producing these projections have only been used for two other editions of Projections of Education Statistics. Calculations were made using unrounded numbers. Some data have been revised from previously published figures.SOURCE: U.S. Department of Education, National Center for Education Statistics, Projections of Education Statistics, various issues. (This table was prepared February 2012.)

86 Appendix A: Introduction to Projection Methodology
Table A-3. Example of constructing mean absolute percentage errors, part 1
Source
Year of data
2007–08 2008–09 2009–10 2010–11
Enrollment, in thousandsActual 49,293 49,266 49,373 49,484
Projected enrollment, in thousandsProjections of Education Statistics to 2017 49,644 49,825 50,067 50,353Projections of Education Statistics to 2018 49,470 49,623 49,788 50,034Projections of Education Statistics to 2019 † 49,265 49,312 49,386Projections of Education Statistics to 2020 † † 49,282 49,306
Percentage difference between actual and projected valuesProjections of Education Statistics to 2017 0.7 1.1 1.4 1.8Projections of Education Statistics to 2018 0.4 0.7 0.8 1.1Projections of Education Statistics to 2019 † # -0.1 -0.2Projections of Education Statistics to 2020 † † -0.2 -0.4
† Not applicable.# Rounds to zero.NOTE: Some data have been revised from previously published figures. Calculations are based on unrounded numbers.SOURCE: U.S. Department of Education, National Center for Education Statistics, Common Core of Data (CCD), “State Nonfiscal Survey of Public Elementary/Secondary Education,” 2005–06 through 2010–11; and Projections of Education Statistics, various editions. (This table was prepared March 2012.)
Table A-4. Example of constructing mean absolute percentage errors, part 2
Source
Lead time (years)
1 2 3 4
Absolute value of percentage difference between actual and projected valuesProjections of Education Statistics to 2017 † 0.7 1.1 1.4Projections of Education Statistics to 2018 0.4 0.7 0.8 1.1Projections of Education Statistics to 2019 # 0.1 0.2 †Projections of Education Statistics to 2020 0.2 0.4 † †
Mean absolute percentage errorExample 0.2 0.5 0.7 1.3
† Not applicable.# Rounds to zero.NOTE: The mean absolute percentage errors presented on this table are for illustrative purpose only. Calculations are based on unrounded numbers. SOURCE: U.S. Department of Education, National Center for Education Statistics, Common Core of Data (CCD), “State Nonfiscal Survey of Public Elementary/Secondary Education,” 2005–06 through 2010–11; and Projections of Education Statistics, various editions. (This table was prepared March 2012.)

Projections of Education Statistics to 2021 87
A.1. ELEMENTARY AND SECONDARY ENROLLMENT
Projections in this editionThis edition of Projections of Education Statistics presents projected trends in elementary and secondary enrollment from 2011 to 2021. These projections were made using three models:
»
»
»
The National Elementary and Secondary Enrollment Model was used to project total, public, and private school enrollments for the nation by grade level and for ungraded elementary and ungraded secondary programs.
The State Public Elementary and Secondary Enrollment Model was used to project total public school enrollments by grade level for individual states and regions.
The National Public Elementary and Secondary Enrollment by Race/Ethnicity Model was used to project public school enrollments for the nation by race/ethnicity and grade level.
All three elementary and secondary enrollment models used the following same methods.
Overview of approachTwo methods were used in all the elementary and secondary enrollment models:
»
»
The grade progression rate method was used to project enrollments in grades 2 through 12. In this method, a rate of progression from each grade (1 through 11) to the next grade (2 through 12) was projected using single exponential smoothing. (For example, the rate of progression from grade 2 to grade 3 is the current year’s grade 3 enrollment expressed as a percentage of the previous year’s grade 2 enrollment.) To calculate enrollment for each year in the forecast period, the progression rate for each grade was applied to the previous year’s enrollment in the previous grade.The enrollment rate method was used to project prekindergarten, kindergarten, and first-grade enrollments as well as elementary special and ungraded and secondary special and ungraded enrollments. For each of these enrollment categories, the enrollment rate for the last year of actual data was used as the projected enrollment rate. To calculate enrollment for each year in the forecast period, the enrollment rate for each category was applied to the projected population in the appropriate age group.
Assumptions underlying these methods
The grade progression and enrollment rate methods assume that past trends in factors affecting public and private elementary and secondary school enrollments will continue over the forecast period. This assumption implies that all factors influencing enrollments will display future patterns consistent with past patterns. This method implicitly includes the net effect of such factors as migration, dropouts, deaths, nonpromotion, and transfers between public and private schools.
For more details on the use of the grade progression and enrollment rate methods, see “Procedures and equations used in all three elementary and secondary enrollment models,” below.
Procedures and equations used in all three elementary and secondary enrollment modelsThe notation and equations that follow describe the basic procedures used to project elementary and secondary enrollments in each of the three elementary and secondary enrollment models.
Let:i = Subscript denoting agej = Subscript denoting gradet = Subscript denoting timeT = Subscript of the first year in the forecast periodNt = Enrollment at the prekindergarten (nursery) levelKt = Enrollment at the kindergarten levelGj,t = Enrollment in grade jEt = Enrollment in elementary special and ungraded programs

88 Appendix A: Introduction to Projection Methodology
St = Enrollment in secondary special and ungraded programs
Pi,t = Population age iRj,t = Progression rate for grade j RNt = Enrollment rate for prekindergarten (nursery school)
RKt = Enrollment rate for kindergarten
RG1,t = Enrollment rate for grade 1
REt = Enrollment rate for elementary special and ungraded programs
RSt = Enrollment rate for secondary special and ungraded programs.
Step 1. Calculate historical grade progression rates for each of grades 2 through 12. The first step in projecting the enrollments for grades 2 through 12 using the grade progression method was to calculate, for each grade, a progression rate for each year of actual data used to produce the projections except for the first year. The progression rate for grade j in year t equals
Rj,t = Gj,t/Gj―1,t―1
Step 2. Produce a projected progression rate for each of grades 2 through 12. Projections for each grade’s progression rate were then produced for the forecast period using single exponential smoothing. A separate smoothing constant, chosen to minimize the sum of squared forecast errors, was used to calculate the projected progression rate for each grade. Single exponential smoothing produces a single forecast for all years in the forecast period. Therefore, for each grade j, the projected progression rate, Rj, is the same for each year in the forecast period.
Step 3. Calculate enrollment projections for each of grades 2 through 12. For the first year in the forecast period, T, enrollment projections, Gj,t, for grades 2 through 12, were produced using the projected progression rates and the enrollments of grades 1 through 11 from the last year of actual data, T–1. Specifically,
Gj,T = Rj ∙ Gj―1,T―1
Gj,T+1 = Rj ∙ Gj,T
This same procedure was then used to produce the projections for the following year, T+1, except that enrollment projections for year T were used rather than actual numbers:
The enrollment projections for grades 2 through 11 for year T were those just produced using the grade progression method. The projection for grade 1 for year T was produced using the enrollment rate method, as outlined in steps 4 and 5 below.
The same procedure was used for the remaining years in the projections period.
Step 4. For the last year of actual data, calculate enrollment rates for prekindergarten, kindergarten, grade 1, elementary special and ungraded, and secondary special and ungraded. The first step in projecting prekindergarten, kindergarten, first-grade, elementary special and ungraded, and secondary special and ungraded enrollments using the enrollment rate method was to calculate enrollment rates for each enrollment category for the last year of actual data, T–1, where:
RNT―1 = NT―1/P5,T―1
RKT―1 = KT―1/P5,T―1
RG1,T―1 = G1,T―1/P6,T―1
RET―1 = ET―1/Σi=5Pi,T―1
T―1 T―1 i=14 i,T―1
13
17RS = S /Σ P
These enrollment rates were then used as the projected enrollment rates for each year in the forecast period (RN, RK, RG1, RE, and RS.)

Projections of Education Statistics to 2021 89
Step 5. Using the rates for the last year of actual data as the projected enrollment rates, calculate enrollment projections for prekindergarten through grade 1 and the ungraded categories. For each year in the forecast period, the enrollment rates were then multiplied by the appropriate population projections from the U.S. Census Bureau ( ) to calculate enrollment projections for prekindergarten (nursery school) ( ), kindergarten ( ), first grade ( ), elementary ungraded ( ), and secondary ungraded ( )
Nt
Nt = RN ∙ P5,t
Kt = RK ∙ P5,t
G1,t = RG1 ∙ P5,t
(Σ Pi,t) Et = RE ∙ 13 i=5
i,tt17
i=14
Kt G1,t St
Et
Pi,t
(Σ P ) S = RS ∙
Step 6. Calculate total elementary and secondary enrollments by summing the projections for each grade and the ungraded categories. To obtain projections of total enrollment, projections of enrollments for the individual grades (prekindergarten through 12), elementary ungraded, and secondary ungraded were summed.
National Elementary and Secondary Enrollment ModelThis model was used to project national total, public, and private school enrollments by grade level and for ungraded elementary and ungraded secondary programs. National enrollment projections for public and private schools were developed separately, then added together to yield total elementary and secondary enrollment projections for the nation. To develop these projections, enrollment data from NCES were used, along with population estimates and projections from the U.S. Census Bureau. Below is information about the specific data used to develop the public school projections and the private school projections, as well as information about the grade progression rates and enrollment rates specific to public schools and private schools.
For details on procedures used to develop the projections, see “Procedures and equations used in all three elementary and secondary enrollment models,” earlier in this section of appendix A.
Data used to develop national elementary and secondary enrollment projections
Public school enrollment data. Public school enrollment data from the NCES Statistics of Public Elementary and Secondary School Systems for 1972 to 1980 and the NCES Common Core of Data (CCD) for 1981 to 2010 were used to develop the national public school enrollment projections.
Private school enrollment data. Private school enrollment data from the NCES Private School Universe Survey (PSS) for 1989–90, 1991–92, 1993–94, 1995–96, 1997–98, 1999–2000, 2001–02, 2003–04, 2005–06, 2007–08, and 2009–10 were used to develop the national private school enrollment projections. Since the PSS is collected in the fall of odd-numbered years, data for even-numbered years without a PSS collection were estimated by interpolating grade-by-grade progression data from PSS.
Population estimates and projections used for public school enrollment projections. Population estimates for 1972 to 2011 and population projections for 2011 to 2021 from the U.S. Census Bureau were also used to develop the public school enrollment projections. The set of population projections used in this year’s Projections of Education Statistics are the Census Bureau’s 2008 National Population Projections by age and sex (August 2008), adjusted to line up with the most recent historical estimates. This was done through the use of ratio adjustments in which, for each combination of state, age, and sex, the population projections from 2011 to 2021 were multiplied by the ratio of the population estimate for 2010 to the population projection for 2010.
Population estimates and projections used for private school enrollment projections. Population estimates for 1989 to 2010 and population projections for 2011 to 2021 from the U.S. Census Bureau were used to develop the private school enrollment projections. The population projections were ratio-adjusted to line up with the most recent historical estimates.
Grade progression and enrollment rates for national elementary and secondary enrollment projections
Public school grade progression and enrollment rates. Table A-5 on page 93 shows the public school grade progression rates for 2010 and projections for 2011 through 2021. Table A-6 on page 93 shows the public school enrollment rates for 2010 and projections for 2011 through 2021.

90 Appendix A: Introduction to Projection Methodology
Accuracy of national elementary and secondary enrollment projections
Mean absolute percentage errors (MAPEs) for projections of public school enrollment were calculated using the last 28 editions of Projections of Education Statistics, while MAPEs for projections of private school enrollment were calculated using the last 10 editions. Table A, below, shows MAPEs for both public and private school enrollment projections.
» »
Table A. Mean absolute percentage errors (MAPEs) of enrollment projections, by lead time, control of school, and grade in elementary and secondary schools: 2012
Statistic
Lead time (years)
1 2 3 4 5 6 7 8 9 10
Public elementary and secondary schoolsPrekindergarten–12 enrollment 0.3 0.6 0.8 1.1 1.3 1.4 1.6 1.9 2.3 2.6Prekindergarten–8 enrollment 0.3 0.6 1.0 1.3 1.4 1.6 1.9 2.4 2.8 3.39–12 enrollment 0.4 0.7 0.9 1.1 1.2 1.5 1.8 2.2 2.4 2.5
Private elementary and secondary schools Prekindergarten–12 enrollment 3.4 4.6 3.7 7.2 7.7 10.6 9.3 9.4 8.1 6.3Prekindergarten–8 enrollment 3.5 4.9 4.1 8.0 9.2 12.1 10.6 10.4 10.2 7.99–12 enrollment 3.0 3.8 2.3 4.3 2.8 5.8 5.7 6.1 1.3 1.3
NOTE: Mean absolute percentage error is the average value over past projections of the absolute values of errors expressed in percentage terms. MAPEs for public prekindergarten–12 enrollments were calculated using the last 28 editions of Projections of Education Statistics. MAPEs for private PK–12 enrollments were calculated from the past 10 editions. Calculations were made using unrounded numbers. Some data have been revised from previously published figures. SOURCE: U.S. Department of Education, National Center for Education Statistics, Projections of Education Statistics, various issues. (This table was prepared February 2012.)
For more information about MAPEs, see Section A.0. Introduction, earlier in appendix A.
State Public Elementary and Secondary Enrollment ModelThis edition of Projections of Education Statistics contains projected trends in public elementary and secondary enrollment by grade level from 2011 to 2021 for each of the 50 states and the District of Columbia, as well as for each region of the country. The state enrollment projections were produced in two stages:
first, an initial set of projections for each state was produced; and second, these initial projections were adjusted to sum to the national public enrollment totals produced by the National Elementary and Secondary Enrollment Model.
For each region, the enrollment projections equaled the sum of enrollment projections for the states within that region.
Initial set of state projections
The same methods used to produce the national enrollment projections—namely, the grade progression rate method and the enrollment rate method—were used to produce the initial sets of public school enrollment projections for each state and the District of Columbia. A separate smoothing constant, chosen to minimize the sum of squared forecast errors, was used to calculate the projected progression rate for each combination of jurisdiction and grade.
For details on the procedures used to develop the initial sets of projections, see “Procedures and equations used in all three elementary and secondary enrollment models,” earlier in this section of appendix A.
Limitations of the grade progression method for state projections
The grade progression rate method assumes that past trends in factors affecting public school enrollments will continue over the forecast period. This assumption implies that all factors influencing enrollments will display future patterns consistent with past patterns. Therefore, this method has limitations when applied to states with unanticipated changes in migration rates. This method implicitly includes the net effect of such factors as migration, dropouts, deaths, nonpromotion, and transfers to and from private schools.

Projections of Education Statistics to 2021 91
» »
Adjustments to the state projections
The initial projections of state public school enrollments were adjusted to sum to the national projections of public school prekindergarten (PK)–12, PK–8, and 9–12 enrollments shown in table 1 on page 31. This was done through the use of ratio adjustments in which all the states’ initial enrollment projections for each grade level were multiplied by the ratio of the national enrollment projection for that grade level to the sum of the state enrollment projections for that grade level.
Data used to develop state elementary and secondary enrollment projections
Public school enrollment data. Public school enrollment data from the NCES Statistics of Public Elementary and Secondary School Systems for 1980 and from the NCES Common Core of Data (CCD) for 1981 to 2010 were used to develop these projections.
Population estimates and projections. Population estimates for 1980 to 2010 and population projections for 2011 to 2021 from the U.S. Census Bureau were used to develop the state-level enrollment projections. The set of population projections used in this year’s Projections of Education Statistics are the Census Bureau’s set of State Interim Population Projections by age and sex (April 2005). In order for the state-level population projections to be consistent with the most recent historical estimates released by the Census Bureau, these projections were adjusted to line up with the most recent historical estimate for each state. This was done through the use of ratio adjustments in which, for each combination of state, age, and sex, the population projections from 2011 to 2021 were multiplied by the ratio of the population estimate for 2010 to the population projection for 2010.
Accuracy of state elementary and secondary enrollment projections
Mean absolute percentage errors (MAPEs) for projections of public school enrollment by state were calculated using the last 16 editions of Projections of Education Statistics. Tables A-7 through A-9 on pages 94–99 show MAPEs for PK–12, PK–8, and 9–12 enrollment in public elementary and secondary schools by state.
National Public Elementary and Secondary Enrollment by Race/Ethnicity Model This edition of Projections of Education Statistics contains projected trends in national public elementary and secondary enrollment by race/ethnicity from 2011 to 2021.
This is the first edition to include enrollment projections for students of two or more races. As 2010 is the first year in which all 50 states and the District of Columbia reported enrollment data for students of two or more races, enrollment projections for this category were produced using a different method than that used for the other five racial/ethnic groups.
Prior to 2008, there was a single category for students of Asian and/or Native Hawaiian or Other Pacific Islander origin. In 2008 and 2009, states could chose to either place these students in either single category, Asian and/or Native Hawaiian or Other Pacific Islander, or in one of three categories, (1) Asian, (2) Hawaiian or Other Pacific Islander, and (3) two or more races (for students of both Asian and Hawaiian or Other Pacific Islander origin). Beginning in 2010, the option of using the single category was eliminated and states were required to place students in one of those three categories. For students of Asian and/or Native Hawaiian or Other Pacific Islander origin, projections were calculated for a single category, Asian/Pacific Islander. For 2008 and 2009, the count of the Asian/Pacific Islander students included the total of the Asian and/or Native Hawaiian or Other Pacific Islander students for states reporting one category and the counts for Asian students and Native Hawaiian or Other Pacific Islander students for states reporting three categories. Beginning in 2010, the count of the Asian/Pacific Islander students was the sum of the counts Asian students and Native Hawaiian or Other Pacific Islander students.
The enrollment projections by race/ethnicity were produced in two stages:
first, an initial set of projections by race/ethnicity was produced; and
second, these initial projections were adjusted to sum to the national totals.
Initial set of projections by race/ethnicity
The same methods used to produce the national enrollment projections—namely, the grade progression rate method and the enrollment rate method—were used to produce initial sets of projections for each of the following five racial/ethnic groups: White, Black, Hispanic, Asian/Pacific Islander, and American Indian/Alaska Native. A separate smoothing constant, chosen to minimize the sum of squared forecast errors, was used to calculate the projected progression rate for each combination of race/ethnicity and grade.

92 Appendix A: Introduction to Projection Methodology
For details on the procedures used to develop the initial sets of projections, see “Procedures and equations used in all three elementary and secondary enrollment models,” earlier in this section of appendix A.
National enrollment projections for students of two or more races by grade level were produced by taking the 2010 grade level enrollment numbers for students of two or more races and applying the growth rates from 2011 to 2021 of the U.S. Census Bureau’s age specific population projections for two or more races.
Adjustments to the projections by race/ethnicity
The initial projections of enrollments by race/ethnicity were adjusted to sum to the national projections of public school PK–12, PK–8, and 9–12 enrollments shown in table 1 on page 31. This was done through the use of ratio adjustments in which all the initial enrollment projections by race/ethnicity for each grade level were multiplied by the ratio of the national enrollment projection for that grade level to the sum of the initial enrollment projections by race/ethnicity for that grade level.
Data and imputations used to develop enrollment projections by race/ethnicity
Public school enrollment data. Public school enrollment data by grade level and race/ethnicity from the NCES Common Core of Data (CCD) for 1994 to 2010 were used to develop these projections. While projections by race/ethnicity were produced at the national level only, the national data used to develop these projections were constructed from state-level data on enrollment by grade level and race/ethnicity. In those instances where states did not report their enrollment data by grade level and race/ethnicity, the state-level data had to be examined and some imputations made in order to produce the national public school enrollment by grade level and race/ethnicity data. For example, in 1994, North Dakota did not report grade-level enrollment data by race/ethnicity. It did, however, report these numbers for 1995. So, to impute these numbers for 1994, North Dakota’s 1994 grade-level enrollment data were multiplied by the state’s 1995 racial/ethnic breakdowns at each grade level.
Population estimates and projections. Population estimates for 2000 to 2010 and population projections for 2011 to 2021 from the U.S. Census Bureau were used to develop the enrollment projections by race/ethnicity. The set of population projections used in this year’s Projections of Education Statistics are the Census Bureau’s 2008 National Population Projections by age, sex, and race/ethnicity (August 2008), ratio-adjusted to line up with the most recent historical estimates.
Accuracy of enrollment projections by race/ethnicity
Because this is the third edition of Projections of Education Statistics to include projections of elementary and secondary public school enrollments by race/ethnicity, the difference between the projections and actual data for a reasonable sample of time points cannot yet be determined.

Projections of Education Statistics to 2021 93
Table A-5. Actual and projected national public school grade progression rates: Fall 2010, and fall 2011 through fall 2021
Grade Actual 2010 Projected 2011 through 2021
1 to 2 99.2 99.22 to 3 100.6 100.43 to 4 100.1 100.14 to 5 100.4 100.45 to 6 100.8 100.76 to 7 100.9 100.87 to 8 100.5 100.38 to 9 109.7 109.79 to 10 93.1 93.110 to 11 92.9 92.911 to 12 98.0 98.0
NOTE: The progression rate for a particular grade in a year equals the enrollment in the grade for that year divided by the enrollment in the previous grade in the previous year all multiplied by 100. For example, the progression rate for third-graders in 2010 equals the enrollment of third-graders in 2010 divided by the enrollment of second-graders in 2009, all multiplied by 100.SOURCE: U.S. Department of Education, National Center for Education Statistics, Common Core of Data (CCD), “State Nonfiscal Survey of Public Elementary/Secondary Education,” 2010–11; and National Elementary and Secondary Enrollment Model, 1972–2010. (This table was prepared January 2012.)
Table A-6. Actual and projected national enrollment rates in public schools, by grade level: Fall 2010, and fall 2011 through fall 2021
Grade level Actual 2010 Projected 2011 through 2021
Prekindergarten 31.4 31.4Kindergarten 90.5 90.5Grade 1 92.3 92.3Elementary ungraded 0.2 0.2Secondary ungraded 0.2 0.2
NOTE: The enrollment rate for each grade level equals the enrollment at that grade level divided by the population of that grade’s base age, all multiplied by 100. The base age for each grade level is as follows: kindergarten, 5 years old; grade one, 6 years old; elementary ungraded, 5 to 13 years old; and secondary ungraded, 14 to 17 years old. Projected values for 2011 through 2021 were held constant at the actual values for 2010. SOURCE: U.S. Department of Education, National Center for Education Statistics, Common Core of Data (CCD), “State Nonfiscal Survey of Public Elementary/Secondary Education,” 2010–11; and National Elementary and Secondary Enrollment Model, 1972–2010. (This table was prepared January 2012.)
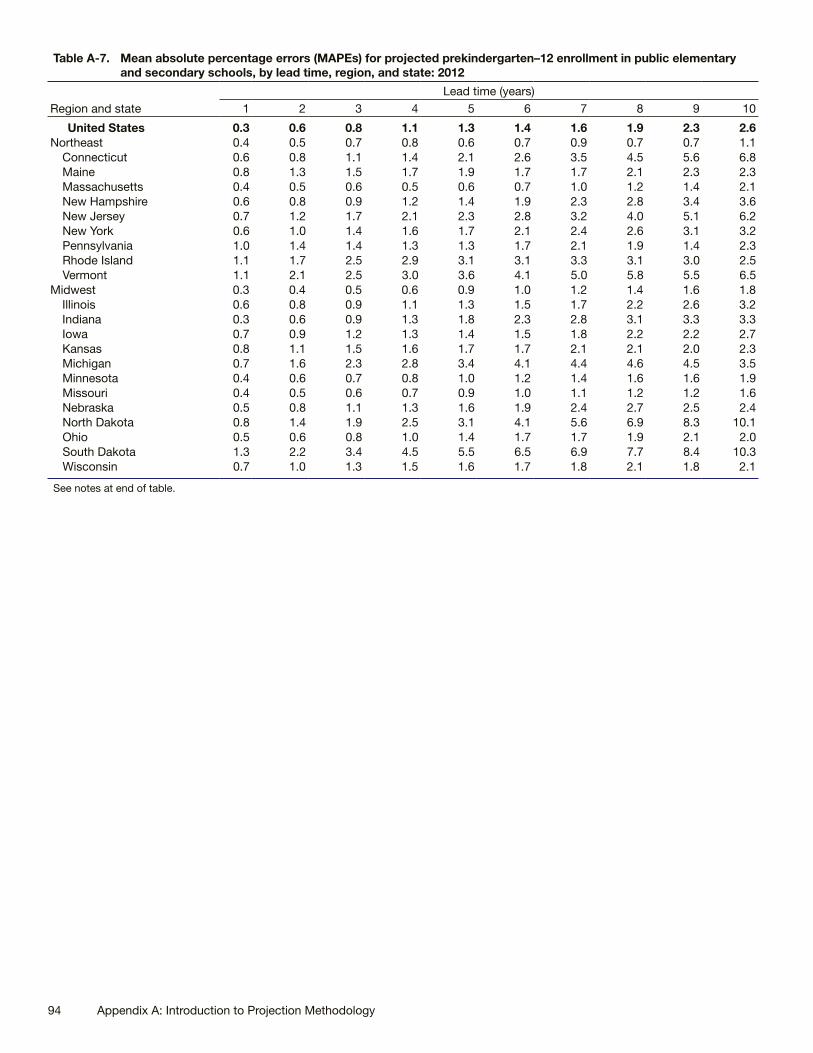
94 Appendix A: Introduction to Projection Methodology
Table A-7. Mean absolute percentage errors (MAPEs) for projected prekindergarten–12 enrollment in public elementary and secondary schools, by lead time, region, and state: 2012
Region and stateLead time (years)
1 2 3 4 5 6 7 8 9 10
United States 0.3 0.6 0.8 1.1 1.3 1.4 1.6 1.9 2.3 2.6Northeast 0.4 0.5 0.7 0.8 0.6 0.7 0.9 0.7 0.7 1.1
Connecticut 0.6 0.8 1.1 1.4 2.1 2.6 3.5 4.5 5.6 6.8Maine 0.8 1.3 1.5 1.7 1.9 1.7 1.7 2.1 2.3 2.3Massachusetts 0.4 0.5 0.6 0.5 0.6 0.7 1.0 1.2 1.4 2.1New Hampshire 0.6 0.8 0.9 1.2 1.4 1.9 2.3 2.8 3.4 3.6New Jersey 0.7 1.2 1.7 2.1 2.3 2.8 3.2 4.0 5.1 6.2New York 0.6 1.0 1.4 1.6 1.7 2.1 2.4 2.6 3.1 3.2Pennsylvania 1.0 1.4 1.4 1.3 1.3 1.7 2.1 1.9 1.4 2.3Rhode Island 1.1 1.7 2.5 2.9 3.1 3.1 3.3 3.1 3.0 2.5Vermont 1.1 2.1 2.5 3.0 3.6 4.1 5.0 5.8 5.5 6.5
Midwest 0.3 0.4 0.5 0.6 0.9 1.0 1.2 1.4 1.6 1.8Illinois 0.6 0.8 0.9 1.1 1.3 1.5 1.7 2.2 2.6 3.2Indiana 0.3 0.6 0.9 1.3 1.8 2.3 2.8 3.1 3.3 3.3Iowa 0.7 0.9 1.2 1.3 1.4 1.5 1.8 2.2 2.2 2.7Kansas 0.8 1.1 1.5 1.6 1.7 1.7 2.1 2.1 2.0 2.3Michigan 0.7 1.6 2.3 2.8 3.4 4.1 4.4 4.6 4.5 3.5Minnesota 0.4 0.6 0.7 0.8 1.0 1.2 1.4 1.6 1.6 1.9Missouri 0.4 0.5 0.6 0.7 0.9 1.0 1.1 1.2 1.2 1.6Nebraska 0.5 0.8 1.1 1.3 1.6 1.9 2.4 2.7 2.5 2.4North Dakota 0.8 1.4 1.9 2.5 3.1 4.1 5.6 6.9 8.3 10.1Ohio 0.5 0.6 0.8 1.0 1.4 1.7 1.7 1.9 2.1 2.0South Dakota 1.3 2.2 3.4 4.5 5.5 6.5 6.9 7.7 8.4 10.3Wisconsin 0.7 1.0 1.3 1.5 1.6 1.7 1.8 2.1 1.8 2.1
See notes at end of table.
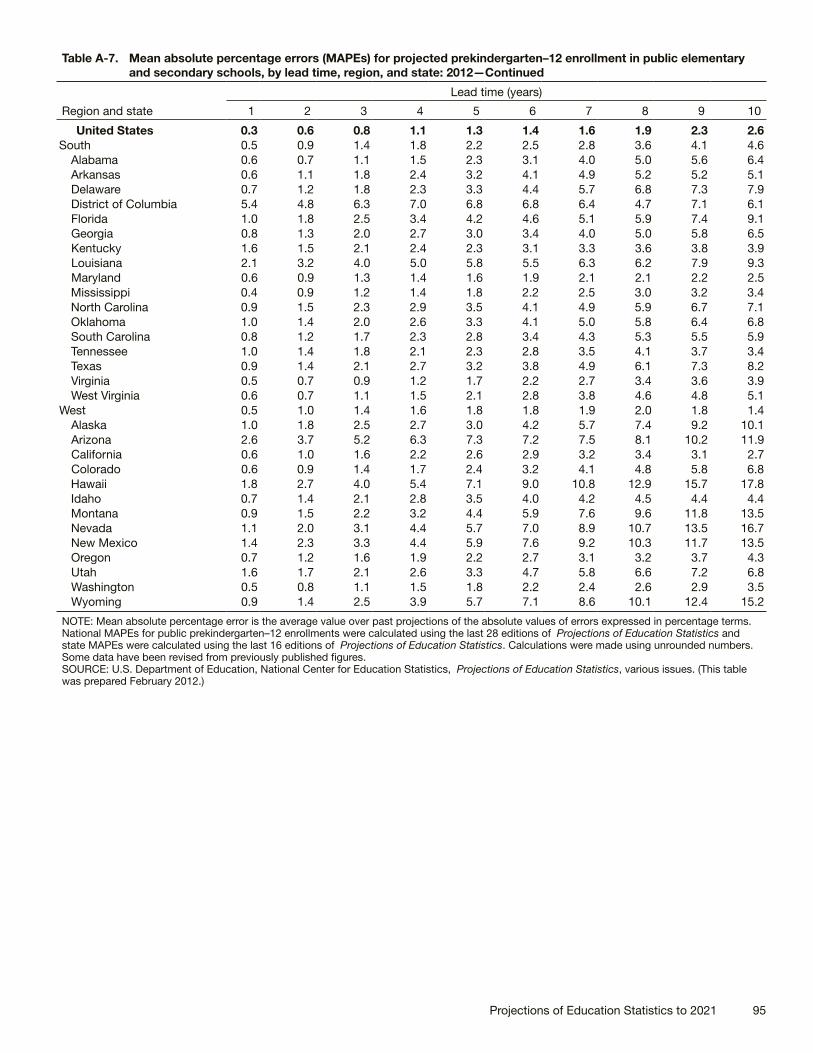
Projections of Education Statistics to 2021 95
Table A-7. Mean absolute percentage errors (MAPEs) for projected prekindergarten–12 enrollment in public elementary and secondary schools, by lead time, region, and state: 2012—Continued
Region and state
Lead time (years)
1 2 3 4 5 6 7 8 9 10
United States 0.3 0.6 0.8 1.1 1.3 1.4 1.6 1.9 2.3 2.6South 0.5 0.9 1.4 1.8 2.2 2.5 2.8 3.6 4.1 4.6
Alabama 0.6 0.7 1.1 1.5 2.3 3.1 4.0 5.0 5.6 6.4Arkansas 0.6 1.1 1.8 2.4 3.2 4.1 4.9 5.2 5.2 5.1Delaware 0.7 1.2 1.8 2.3 3.3 4.4 5.7 6.8 7.3 7.9District of Columbia 5.4 4.8 6.3 7.0 6.8 6.8 6.4 4.7 7.1 6.1Florida 1.0 1.8 2.5 3.4 4.2 4.6 5.1 5.9 7.4 9.1Georgia 0.8 1.3 2.0 2.7 3.0 3.4 4.0 5.0 5.8 6.5Kentucky 1.6 1.5 2.1 2.4 2.3 3.1 3.3 3.6 3.8 3.9Louisiana 2.1 3.2 4.0 5.0 5.8 5.5 6.3 6.2 7.9 9.3Maryland 0.6 0.9 1.3 1.4 1.6 1.9 2.1 2.1 2.2 2.5Mississippi 0.4 0.9 1.2 1.4 1.8 2.2 2.5 3.0 3.2 3.4North Carolina 0.9 1.5 2.3 2.9 3.5 4.1 4.9 5.9 6.7 7.1Oklahoma 1.0 1.4 2.0 2.6 3.3 4.1 5.0 5.8 6.4 6.8South Carolina 0.8 1.2 1.7 2.3 2.8 3.4 4.3 5.3 5.5 5.9Tennessee 1.0 1.4 1.8 2.1 2.3 2.8 3.5 4.1 3.7 3.4Texas 0.9 1.4 2.1 2.7 3.2 3.8 4.9 6.1 7.3 8.2Virginia 0.5 0.7 0.9 1.2 1.7 2.2 2.7 3.4 3.6 3.9West Virginia 0.6 0.7 1.1 1.5 2.1 2.8 3.8 4.6 4.8 5.1
West 0.5 1.0 1.4 1.6 1.8 1.8 1.9 2.0 1.8 1.4Alaska 1.0 1.8 2.5 2.7 3.0 4.2 5.7 7.4 9.2 10.1Arizona 2.6 3.7 5.2 6.3 7.3 7.2 7.5 8.1 10.2 11.9California 0.6 1.0 1.6 2.2 2.6 2.9 3.2 3.4 3.1 2.7Colorado 0.6 0.9 1.4 1.7 2.4 3.2 4.1 4.8 5.8 6.8Hawaii 1.8 2.7 4.0 5.4 7.1 9.0 10.8 12.9 15.7 17.8Idaho 0.7 1.4 2.1 2.8 3.5 4.0 4.2 4.5 4.4 4.4Montana 0.9 1.5 2.2 3.2 4.4 5.9 7.6 9.6 11.8 13.5Nevada 1.1 2.0 3.1 4.4 5.7 7.0 8.9 10.7 13.5 16.7New Mexico 1.4 2.3 3.3 4.4 5.9 7.6 9.2 10.3 11.7 13.5Oregon 0.7 1.2 1.6 1.9 2.2 2.7 3.1 3.2 3.7 4.3Utah 1.6 1.7 2.1 2.6 3.3 4.7 5.8 6.6 7.2 6.8Washington 0.5 0.8 1.1 1.5 1.8 2.2 2.4 2.6 2.9 3.5Wyoming 0.9 1.4 2.5 3.9 5.7 7.1 8.6 10.1 12.4 15.2
NOTE: Mean absolute percentage error is the average value over past projections of the absolute values of errors expressed in percentage terms. National MAPEs for public prekindergarten–12 enrollments were calculated using the last 28 editions of Projections of Education Statistics and state MAPEs were calculated using the last 16 editions of Projections of Education Statistics. Calculations were made using unrounded numbers. Some data have been revised from previously published figures. SOURCE: U.S. Department of Education, National Center for Education Statistics, Projections of Education Statistics, various issues. (This table was prepared February 2012.)

96 Appendix A: Introduction to Projection Methodology
Table A-8. Mean absolute percentage errors (MAPEs) for projected prekindergarten–8 enrollment in public elementary and secondary schools, by lead time, region, and state: 2012
Region and state
Lead time (years)
1 2 3 4 5 6 7 8 9 10
United States 0.3 0.6 1.0 1.3 1.4 1.6 1.9 2.4 2.8 3.3Northeast 0.4 0.7 0.8 0.7 0.6 0.7 0.8 0.8 0.7 0.9
Connecticut 0.6 0.9 1.3 1.8 2.5 3.1 3.8 4.8 5.4 6.2Maine 0.6 0.9 1.2 1.5 2.2 2.8 3.3 4.5 5.8 6.2Massachusetts 0.3 0.6 0.9 0.9 0.9 1.3 1.5 1.7 1.8 2.3New Hampshire 0.7 1.0 1.3 1.9 2.4 3.2 3.6 4.2 4.8 4.8New Jersey 0.8 1.3 1.7 2.0 2.1 2.3 2.7 3.4 4.2 4.9New York 0.6 1.0 1.3 1.5 1.7 1.9 2.4 2.7 3.1 3.2Pennsylvania 0.6 1.0 1.1 1.0 1.2 1.4 1.8 1.5 1.1 1.7Rhode Island 1.3 1.9 2.7 3.2 3.4 3.7 4.3 4.1 4.3 4.2Vermont 1.4 2.3 2.8 3.5 4.4 5.5 7.3 9.0 8.8 9.7
Midwest 0.3 0.4 0.6 0.6 0.8 0.9 0.9 1.2 1.3 1.4Illinois 0.7 0.9 1.0 1.3 1.6 1.7 1.9 2.4 2.6 3.0Indiana 0.4 0.7 1.0 1.3 1.6 2.0 2.5 2.7 3.0 3.4Iowa 0.8 1.2 1.5 1.8 2.1 2.2 2.8 3.1 3.2 3.6Kansas 0.9 1.2 1.5 1.7 1.9 2.1 2.6 2.7 2.7 3.1Michigan 0.7 1.5 2.0 2.8 3.2 3.7 3.8 4.4 4.3 3.2Minnesota 0.4 0.5 0.8 0.9 1.0 1.1 1.1 1.2 1.1 1.4Missouri 0.6 0.8 1.1 1.2 1.4 1.5 1.5 1.3 1.0 1.4Nebraska 0.7 1.0 1.3 1.4 1.8 2.1 2.7 3.0 2.8 2.8North Dakota 1.1 2.0 2.7 3.4 4.2 5.6 7.5 9.2 10.9 12.2Ohio 0.5 0.5 0.6 0.7 0.9 1.1 0.9 1.1 1.3 1.3South Dakota 1.3 2.1 3.4 4.8 6.2 7.8 8.7 10.6 11.9 12.9Wisconsin 0.7 0.9 1.2 1.4 1.6 1.7 1.8 1.9 1.6 1.9
See notes at end of table.

Projections of Education Statistics to 2021 97
Table A-8. Mean absolute percentage errors (MAPEs) for projected prekindergarten–8 enrollment in public elementary and secondary schools, by lead time, region, and state: 2012—Continued
Region and state
Lead time (years)
1 2 3 4 5 6 7 8 9 10
United States 0.3 0.6 1.0 1.3 1.4 1.6 1.9 2.4 2.8 3.3South 0.6 1.1 1.8 2.3 2.6 2.8 3.2 4.0 4.6 5.1
Alabama 0.7 1.0 1.6 2.2 2.8 3.6 4.5 5.6 6.4 7.3Arkansas 0.8 1.3 2.2 3.0 3.9 5.0 5.8 6.1 6.2 6.0Delaware 0.8 1.4 2.1 2.9 3.8 5.0 6.4 7.7 8.2 9.0District of Columbia 4.7 4.8 5.7 6.5 6.1 5.8 6.3 4.2 7.1 6.7Florida 1.1 2.1 3.3 4.3 5.1 5.3 5.9 6.8 8.4 9.8Georgia 1.0 1.7 2.6 3.3 3.7 3.9 4.5 5.4 6.2 7.1Kentucky 1.7 1.9 2.9 3.2 3.3 3.3 3.3 3.9 4.0 4.7Louisiana 1.9 3.0 3.5 4.2 4.8 4.9 5.4 5.2 6.8 8.0Maryland 0.6 1.0 1.4 1.7 2.0 2.6 3.1 3.5 4.0 4.5Mississippi 0.6 1.2 1.7 2.2 2.6 2.9 2.9 3.3 3.7 4.0North Carolina 1.2 2.0 3.0 3.6 4.2 5.0 5.8 7.4 8.5 9.0Oklahoma 1.3 1.9 2.6 3.4 4.3 5.4 6.6 7.4 8.1 8.8South Carolina 1.1 1.4 1.9 2.7 3.2 4.0 4.8 5.9 6.0 6.4Tennessee 0.9 1.3 2.0 2.3 2.4 2.6 2.6 3.2 2.9 2.7Texas 1.1 1.8 2.7 3.4 3.8 4.3 5.2 6.5 7.8 8.8Virginia 0.6 0.9 1.0 1.3 1.8 2.3 2.9 3.6 3.6 3.8West Virginia 0.6 0.7 1.1 1.4 2.1 2.8 3.8 4.6 4.8 5.1
West 0.6 1.2 1.6 1.8 2.0 1.9 2.0 2.3 2.2 1.7Alaska 1.3 1.9 2.9 3.5 4.5 6.0 8.1 11.0 13.2 14.3Arizona 2.4 3.4 4.8 5.5 6.1 6.9 7.4 8.5 10.3 11.8California 0.9 1.5 2.1 2.8 3.2 3.5 3.8 4.2 4.0 3.5Colorado 0.7 1.2 1.6 2.0 2.8 3.9 5.0 6.1 7.2 8.3Hawaii 1.8 3.1 4.5 6.2 8.5 11.0 13.3 16.2 19.5 21.6Idaho 0.9 2.0 3.0 3.7 4.4 5.0 5.0 5.3 5.3 5.4Montana 1.1 1.9 3.0 4.4 6.1 8.4 10.7 13.8 16.9 18.5Nevada 1.4 2.9 4.6 6.3 8.1 10.0 12.3 15.2 18.7 21.4New Mexico 1.3 2.1 2.8 3.7 5.0 7.0 9.0 10.7 12.2 13.1Oregon 0.7 1.2 1.2 1.5 2.1 2.6 2.9 3.3 3.8 4.5Utah 1.5 1.8 2.4 2.8 4.0 5.2 6.5 7.2 7.7 7.1Washington 0.5 0.8 1.1 1.5 1.9 2.5 2.7 2.8 3.0 3.4Wyoming 1.0 1.6 3.0 4.8 7.2 9.3 11.5 14.1 17.1 19.4
NOTE: Mean absolute percentage error is the average value over past projections of the absolute values of errors expressed in percentage terms. National MAPEs for public prekindergarten–8 enrollments were calculated using the last 28 editions of Projections of Education Statistics and state MAPEs were calculated using the last 16 editions of Projections of Education Statistics. Calculations were made using unrounded numbers. Some data have been revised from previously published figures.SOURCE: U.S. Department of Education, National Center for Education Statistics, Projections of Education Statistics, various issues. (This table was prepared February 2012.)

98 Appendix A: Introduction to Projection Methodology
Table A-9. Mean absolute percentage errors (MAPEs) for projected grades 9–12 enrollment in public schools, by lead time, region, and state: 2012
Region and state
Lead time (years)
1 2 3 4 5 6 7 8 9 10
United States 0.4 0.7 0.9 1.1 1.2 1.5 1.8 2.2 2.4 2.5Northeast 0.8 1.0 1.0 1.1 1.4 1.3 1.2 1.3 1.3 1.9
Connecticut 0.7 1.0 0.9 1.2 1.9 2.6 3.5 4.8 6.1 8.4Maine 1.8 3.1 4.0 5.1 5.5 6.3 7.2 8.6 9.1 8.7Massachusetts 0.6 1.0 1.5 1.7 2.1 2.5 2.5 2.2 2.4 2.5New Hampshire 0.6 1.1 1.4 1.7 2.0 2.4 2.9 4.0 4.5 5.0New Jersey 0.7 1.4 2.1 2.4 3.0 4.2 5.2 6.2 7.7 9.3New York 1.0 1.6 1.9 2.0 2.4 2.8 2.9 3.3 3.8 3.7Pennsylvania 1.9 2.3 2.2 2.2 2.1 2.6 2.8 2.8 2.0 3.7Rhode Island 0.9 1.6 2.3 3.1 4.0 4.5 4.8 4.4 3.8 4.0Vermont 1.1 2.6 3.1 3.8 4.1 4.3 4.3 4.6 4.2 4.1
Midwest 0.5 0.8 1.0 1.2 1.4 1.5 1.9 2.3 2.4 2.6Illinois 0.9 1.1 1.4 1.6 1.9 2.6 2.9 3.6 3.8 4.3Indiana 0.6 1.0 1.5 1.9 2.4 2.9 3.7 4.2 4.6 4.5Iowa 0.9 1.0 1.3 1.3 1.6 1.5 1.8 1.8 1.9 2.1Kansas 1.3 1.8 2.4 2.6 2.5 2.2 1.8 1.8 1.7 1.0Michigan 1.6 2.6 3.2 3.8 4.4 5.5 6.9 8.3 9.5 9.7Minnesota 0.6 1.0 1.3 1.5 1.8 2.1 2.5 2.7 2.9 3.4Missouri 0.4 0.8 1.0 1.3 1.6 1.7 1.8 1.8 2.1 2.1Nebraska 0.4 0.8 1.1 1.4 1.7 2.1 2.7 3.3 3.3 3.0North Dakota 0.7 1.3 1.5 2.0 2.5 3.1 4.4 6.1 7.0 7.6Ohio 1.1 1.8 2.1 2.3 2.6 3.2 3.7 3.8 3.8 3.5South Dakota 1.7 3.2 4.6 6.0 7.3 8.2 9.2 10.4 11.0 11.6Wisconsin 0.8 1.3 1.6 1.9 2.1 2.3 2.0 2.4 2.3 2.6
See notes at end of table.

Projections of Education Statistics to 2021 99
Table A-9. Mean absolute percentage errors (MAPEs) for projected grades 9–12 enrollment in public schools, by lead time, region, and state: 2012—Continued
Region and state
Lead time (years)
1 2 3 4 5 6 7 8 9 10
United States 0.4 0.7 0.9 1.1 1.2 1.5 1.8 2.2 2.4 2.5South 0.4 0.9 1.3 1.5 1.7 2.1 2.4 2.8 3.1 3.4
Alabama 0.9 1.4 1.9 2.4 2.7 3.8 4.4 5.1 5.6 5.5Arkansas 0.5 0.9 1.3 1.5 1.9 2.2 2.6 3.0 3.0 3.0Delaware 1.3 1.6 2.0 2.3 2.9 3.6 4.4 4.8 5.7 6.9District of Columbia 7.8 8.2 11.6 13.3 16.1 17.7 15.8 16.6 18.4 16.7Florida 0.8 1.2 1.3 1.7 2.2 3.2 4.1 5.1 5.8 7.3Georgia 0.6 1.0 1.3 1.5 1.9 2.6 3.3 4.0 4.6 5.0Kentucky 1.6 2.0 2.2 2.3 2.2 3.7 4.3 4.5 5.1 4.0Louisiana 3.1 4.2 5.7 7.2 8.4 7.8 8.7 9.0 10.9 13.1Maryland 0.6 0.9 1.4 1.5 1.3 1.4 1.6 1.9 2.2 2.2Mississippi 0.6 1.3 2.0 2.3 2.6 3.0 3.5 4.1 4.1 3.8North Carolina 1.0 1.5 1.6 1.8 2.2 2.8 3.1 3.1 3.4 4.1Oklahoma 0.5 0.9 1.3 1.7 2.1 2.5 3.0 3.3 3.6 3.9South Carolina 0.8 1.5 2.1 2.4 2.7 2.8 3.2 3.9 4.6 5.9Tennessee 2.1 2.2 3.0 3.8 4.9 5.5 5.9 6.5 5.7 5.3Texas 0.6 1.2 1.7 2.1 2.6 3.3 4.0 4.9 5.9 6.5Virginia 0.6 1.0 1.5 2.1 2.6 3.1 3.4 3.7 4.1 4.3West Virginia 0.7 1.0 1.3 1.6 2.2 3.0 3.8 4.5 4.8 5.0
West 0.5 0.8 1.1 1.5 1.7 1.9 2.2 2.2 2.2 1.7Alaska 1.1 2.3 3.2 3.3 3.4 3.2 3.5 4.0 3.8 4.0Arizona 4.1 6.0 8.5 9.5 10.1 8.4 7.8 7.0 10.0 13.0California 0.5 1.0 1.5 1.9 2.2 2.4 2.7 2.8 2.2 2.1Colorado 0.7 1.3 2.0 2.2 2.5 2.8 2.7 2.5 3.1 3.8Hawaii 1.9 2.5 3.4 4.1 4.6 5.4 6.2 7.2 7.0 8.6Idaho 0.6 1.0 1.5 2.1 2.7 3.2 4.0 4.6 4.2 3.7Montana 0.6 1.0 1.4 2.0 2.7 3.4 3.9 4.3 3.3 3.7Nevada 1.2 2.3 3.0 3.3 3.7 4.2 5.3 7.0 8.2 9.1New Mexico 2.9 4.6 6.1 7.3 9.0 10.1 11.4 12.8 13.1 15.2Oregon 1.2 1.8 2.6 3.1 3.3 3.7 4.2 4.7 5.0 5.2Utah 1.9 1.9 1.8 2.3 2.6 3.9 4.1 5.0 5.9 6.4Washington 0.6 0.9 1.3 1.8 2.2 2.7 3.1 3.6 4.1 4.3Wyoming 0.8 1.3 2.1 3.3 4.4 5.5 6.8 8.0 8.3 8.9
NOTE: Mean absolute percentage error is the average value over past projections of the absolute values of errors expressed in percentage terms. National MAPEs for public 9–12 enrollments were calculated using the last 28 editions of Projections of Education Statistics and state MAPEs were calculated using the last 16 editions of Projections of Education Statistics. Calculations were made using unrounded numbers. Some data have been revised from previously published figures.SOURCE: U.S. Department of Education, National Center for Education Statistics, Projections of Education Statistics, various issues. (This table was prepared February 2012.)

100 Appendix A: Introduction to Projection Methodology
A.2. HIGH SCHOOL GRADUATES
Projections in this editionThis edition of Projections of Education Statistics presents projected trends in the number of high school graduates from 2009–10 to 2021–22. These projections were made using three models:
»
»
»
The National High School Graduates Model was used to project the number of public high school graduates, the number of private high school graduates, and the total number of high school graduates for the nation.
The State Public High School Graduates Model was used to project the number of public high school graduates for individual states and regions.
The National Public High School Graduates by Race/Ethnicity Model was used to project the number of public high school graduates for the nation by race/ethnicity.
Overview of approachAll the high school graduates models first calculated the number of high school graduates as a percentage of grade 12 enrollment based on historical data. Single exponential smoothing was used to project this percentage. The projected percentage was then applied to projections of grade 12 enrollment.
Assumptions underlying this approach
The percentage of 12th-graders who graduate was assumed to remain constant at levels consistent with the most recent rates. This methodology assumes that past trends in factors affecting graduation rates, such as dropouts, migration, and public or private transfers, will continue over the forecast period. No specific assumptions were made regarding the dropout rate, retention rate, or the rate at which alternative credentials are awarded. The combined effect of these proportions is reflected implicitly in the graduate proportion. In addition to student behaviors, the projected number of graduates could be affected by changes in graduation requirements, but this is not considered in the projections in this report.
For more details on the steps used for projections of high school graduates, see “Procedures used in all three high school graduates models,” below.
Procedures used in all three high school graduates models
The following steps were used to project the numbers of high school graduates:
Step 1. For each year in the historic period, express the number of high school graduates as a percentage of grade 12 enrollment. This value represents the approximate percentage of 12th graders who graduate. For information about the specific historical data and analysis periods used for the National High School Graduates Model, the State Public High School Graduates Model, and the National Public High School Graduates by Race/Ethnicity Model, see the description of the appropriate model, later in this section of appendix A.
Step 2. Project the percentage of 12th-graders who graduate from step 1. This percentage was projected using single exponential smoothing with a smoothing constant chosen to minimize the sum of squared forecast errors. Because single exponential smoothing produces a single forecast for all years in the forecast period, the same projected percentage of grade 12 enrollment was used for each year in the forecast period.
Step 3. Calculate projections of the numbers of high school graduates. For each year in the forecast period, the projected percentage from step 2 was applied to projections of grade 12 enrollment to yield projections of high school graduates.
National High School Graduates ModelThis model was used to project the number of public high school graduates, the number of private high school graduates, and the total number of high school graduates for the nation. Public and private high school graduates were projected separately. The public and private projections were then summed to yield projections of the total number of high school graduates for the nation.
For details of the procedures used to develop the projections, see “Procedures used in all three high school graduates models,” above.

Projections of Education Statistics to 2021 101
Data used in the National High School Graduates Model
Public school data on graduates and grade 12 enrollment. Data on public school 12th-grade enrollments and high school graduates from the NCES Statistics of Public Elementary and Secondary School Systems for 1972–73 to 1980–81 and the NCES Common Core of Data (CCD) for 1981–82 to 2008–09 were used to develop national projections of public high school graduates.
Private school data on graduates and grade 12 enrollment. Data on private school 12th-grade enrollments for 1989–90 through 2009–10 and high school graduates for 1988–89 through 2008–09 were used to develop national projections of private high school graduates. The data were from the biennial NCES Private School Universe Survey (PSS) from 1989–90 to 2009–10 with data for 12th grade enrollment the same as the year of the survey and the data for high school graduates for the preceding year (i.e. the 2009–10 PSS presents high school graduates for 2008–09). Since the PSS is collected in the fall of odd-numbered years, data for missing years were estimated using data from the PSS. For 12th grade enrollment, estimates for missing years were linear interpolations of the prior year’s and succeeding year’s actual values. For high school graduates, estimates for the missing years were the interpolations of the high school graduates to estimated 12th grade enrollment percentages for the prior and succeeding years multiplied by the estimated enrollments for the current year.
Public and private school enrollment projections for grade 12. Projections of grade 12 enrollment in public schools and in private schools were used to develop projections of public high school graduates and private high school graduates, respectively. The grade 12 enrollment projections were made using the grade progression method. For more information, see Section A.1. Elementary and Secondary Enrollment, earlier in this appendix.
Accuracy of national high school graduates projections
Mean absolute percentage errors (MAPEs) for projections of graduates from public high schools were calculated using the last 21 editions of Projections of Education Statistics, while MAPEs for projections of graduates from private high schools were calculated using the last 10 editions. Table B, below, shows MAPEs for both public and private school graduation projections.
» »
Table B. Mean absolute percentage errors (MAPEs) of projections of high school graduates, by lead time and control of school: 2012
Statistic
Lead time (years)
1 2 3 4 5 6 7 8 9 10
Public high school graduates 1.0 1.0 1.5 1.6 1.5 2.0 2.7 3.7 4.3 4.3Private high school graduates 0.9 0.9 1.6 2.8 5.0 6.2 4.9 4.8 1.6 1.6NOTE: MAPEs for public high school graduates were calculated from the past 21 editions of Projections of Education Statistics. MAPEs for private high school graduates were calculated from the past 10 editions. Calculations were made using unrounded numbers. Some data have been revised from previously published figures. SOURCE: U.S. Department of Education, National Center for Education Statistics, Projections of Education Statistics, various issues. (This table was prepared February 2012.)
For more information about MAPEs, see Section A.0. Introduction, earlier in appendix A.
State Public High School Graduates ModelThis edition of Projections of Education Statistics contains projections of public high school graduates from 2009–10 to 2021–22 for each of the 50 states and the District of Columbia, as well as for each region of the country. The state projections of high school graduates were produced in two stages:
first, an initial set of projections for each state was produced; and second, these initial projections were adjusted to sum to the national public school totals produced by the National High School Graduates Model.
For each region, the high school graduate projections equaled the sum of high school graduate projections for the states within that region.

102 Appendix A: Introduction to Projection Methodology
Initial set of state projections
The same steps used to produce the national projections of high school graduates were used to produce an initial set of projections for each state and the District of Columbia. A separate smoothing constant, chosen to minimize the sum of squared forecast errors, was used to calculate the projected percentage of 12th grade enrollment for each jurisdiction.
For details on the steps used to develop the initial sets of projections, see “Procedures used in all three high school graduate models,” earlier in this section of appendix A.
Adjustments to the state projections
The initial projections of state public high school graduates were adjusted to sum to the national projections of public high school graduates shown in table 12 on page 49. This was done through the use of ratio adjustments in which all the states’ high school graduate projections were multiplied by the ratio of the national public high school graduate projection to the sum of the state public high school projections.
Data used in the State Public High School Graduates Model
Public school data on graduates and grade 12 enrollment at the state level. State-level data on public school 12th-grade enrollments and high school graduates from the NCES Statistics of Public Elementary and Secondary School Systems for 1980–81 and the NCES Common Core of Data (CCD) for 1981–82 to 2008–09 were used to develop these projections.
Public school projections for grade 12 enrollment at the state level. State-level projections of grade 12 enrollment in public schools were used to develop the state-level projections of public high school graduates. The grade 12 enrollment projections were made using the grade progression method. For more information, see Section A.1. Elementary and Secondary Enrollment, earlier in this appendix.
Accuracy of state public high school graduate projections
Mean absolute percentage errors (MAPEs) for projections of the number of public high school graduates by state were calculated using the last 16 editions of Projections of Education Statistics. Table A-10 on pages 104–105 show MAPEs for the number of high school graduates by state.
National Public High School Graduates by Race/Ethnicity ModelThe projections of public high school graduates by race/ethnicity were produced in two stages:
» »
first, an initial set of projections for each racial/ethnic group was produced; and
second, these initial projections were adjusted to sum to the national public school totals produced by the National High School Graduates Model.
Initial set of projections by race/ethnicity
The same steps used to produce the national projections of high school graduates were used to produce an initial set of projections for each of the following five racial/ethnic groups: White, Black, Hispanic, Asian/Pacific Islander, and American Indian/Alaska Native. For example, the number of White public high school graduates was projected as a percentage of White grade 12 enrollment in public schools. A separate smoothing constant, chosen to minimize the sum of squared forecast errors, was used to calculate the projected percentage of 12th-grade enrollment for each racial/ethnic group.
Adjustments to the projections by race/ethnicity
The projections of public high school graduates by race/ethnicity were adjusted to sum to the national projections of public high school graduates shown in table 12 on page 49. This was done through the use of ratio adjustments in which all high school graduate projections by race/ethnicity were multiplied by the ratio of the national high school graduate projection to the sum of the high school projections by race/ethnicity.

Projections of Education Statistics to 2021 103
Data and imputations used in the Public High School Graduates by Race/Ethnicity Model
Public school data on graduates and grade 12 enrollment by race/ethnicity. Data on public high school graduates and grade 12 enrollment by race/ethnicity from the NCES Common Core of Data (CCD) for 1994–95 to 2008–09 were used to develop these projections. In those instances where states did not report their high school graduate data by race/ethnicity, the state-level data had to be examined and some imputations made. For example, in 1994, Arizona did not release high school graduate data by race/ethnicity. It did, however, release grade 12 enrollment numbers by race/ethnicity for that year. So, to impute the high school graduate numbers by race/ethnicity for that year, Arizona’s total number of high school graduates for 1994 was multiplied by the state’s 1994 racial/ethnic breakdowns for grade 12 enrollment. In 2008–09, jurisdictions could classify high school graduates by an additional racial/ethnic group—those of two or more races. As only five states used this reporting category, those numbers were proportioned among the other five racial/ethnic groups by each of the five ethnic groups’ shares of total number of high school graduates, excluding those of two or more races. When a sufficient number of states use this racial/ethnic group, projections will be developed for this group.
Public enrollment projections for grade 12 by race/ethnicity. Projections of grade 12 enrollment in public schools by race/ethnicity were used to develop the projections of public high school graduates by race/ethnicity. The grade 12 enrollment projections were made using the grade progression method. For more information, see Section A.1. Elementary and Secondary Enrollment, earlier in this appendix.
Accuracy of enrollment projections by race/ethnicity
Because this is the third edition of Projections of Education Statistics to include projections of public high school graduates by race/ethnicity, the difference between the projections and actual data for a reasonable sample of time points cannot yet be determined.

104 Appendix A: Introduction to Projection Methodology
Table A-10. Mean absolute percentage errors (MAPEs) for the projected number of high school graduates in public schools, by lead time, region, and state: 2012
Region and state
Lead time (years)
1 2 3 4 5 6 7 8 9 10
United States 1.0 1.0 1.5 1.6 1.5 2.0 2.7 3.7 4.3 4.3Northeast 1.3 1.6 1.5 1.7 1.8 2.4 2.5 3.2 4.1 4.3
Connecticut 2.1 1.8 1.7 2.4 2.8 3.2 3.4 3.4 4.4 3.9Maine 2.9 4.5 4.3 5.0 5.4 5.6 7.1 7.9 9.8 10.5Massachusetts 0.9 1.4 2.3 2.5 2.5 2.4 2.6 1.9 1.2 1.7New Hampshire 1.1 2.1 2.2 2.5 2.8 3.8 4.3 5.3 5.2 4.6New Jersey 2.4 4.2 5.1 4.9 5.2 6.2 7.3 8.3 9.7 11.6New York 2.0 3.2 3.0 3.6 4.0 5.0 5.5 6.8 7.3 7.1Pennsylvania 1.9 2.5 2.6 1.6 1.6 2.1 2.3 2.8 3.6 3.5Rhode Island 1.4 1.1 2.1 1.9 2.4 3.4 4.9 5.5 5.2 5.1Vermont 2.1 2.4 3.7 4.5 6.3 6.2 6.9 7.8 9.0 8.5
Midwest 1.0 0.7 1.5 1.4 2.0 2.3 2.1 2.5 3.0 2.3Illinois 2.8 2.0 3.2 4.0 4.1 3.5 5.6 4.1 5.4 7.2Indiana 1.7 2.0 1.7 1.6 1.8 2.2 3.2 3.8 3.9 3.5Iowa 1.6 1.3 2.1 2.0 2.8 2.9 2.9 2.5 2.3 2.3Kansas 1.4 1.4 2.1 2.0 2.9 3.8 4.3 4.8 5.2 4.7Michigan 3.5 4.4 5.1 6.2 6.5 6.4 8.6 9.4 8.7 8.6Minnesota 2.4 1.5 1.4 1.8 2.1 2.2 2.8 3.4 4.1 4.8Missouri 1.0 1.6 2.5 2.8 3.1 3.9 4.4 5.1 5.7 5.1Nebraska 1.8 2.3 2.5 2.1 2.4 2.5 2.3 2.3 2.0 1.6North Dakota 1.4 1.7 1.9 2.0 2.2 2.5 3.5 3.7 4.3 6.1Ohio 1.7 1.4 2.8 3.1 3.5 3.4 3.0 3.6 3.8 4.9South Dakota 2.5 2.9 3.2 5.6 8.9 10.0 11.6 13.2 15.6 17.3Wisconsin 1.3 1.6 2.6 2.9 3.2 3.6 4.0 4.8 5.3 4.7
See notes at end of table.

Projections of Education Statistics to 2021 105
Table A-10. Mean absolute percentage errors (MAPEs) for the projected number of high school graduates in public schools, by lead time, region, and state: 2012—Continued
Region and state
Lead time (years)
1 2 3 4 5 6 7 8 9 10
United States 1.0 1.0 1.5 1.6 1.5 2.0 2.7 3.7 4.3 4.3South 1.2 1.4 2.4 2.1 2.2 3.1 3.6 4.8 5.4 5.9
Alabama 3.6 3.1 2.2 4.3 4.4 5.2 5.6 5.6 6.2 6.3Arkansas 1.5 1.8 2.3 2.5 2.9 2.7 2.7 2.9 2.3 2.7Delaware 2.2 3.0 3.8 4.9 3.2 4.3 4.5 5.6 6.0 6.6District of Columbia 6.5 6.6 11.8 13.3 14.6 16.4 17.4 19.8 16.1 15.6Florida 2.0 3.8 5.5 3.2 3.9 4.6 6.0 7.9 8.8 7.8Georgia 2.2 2.9 3.5 5.0 6.6 7.5 7.9 8.1 8.1 7.1Kentucky 2.2 3.6 3.6 4.4 5.2 5.7 6.6 6.3 4.0 6.3Louisiana 1.6 2.5 4.3 6.4 4.8 3.8 3.5 4.0 4.4 6.1Maryland 1.4 1.1 1.8 1.3 1.5 1.7 2.4 2.9 2.7 3.8Mississippi 1.2 1.7 2.2 2.5 3.3 3.8 3.7 3.9 3.6 2.9North Carolina 1.9 2.2 3.4 3.5 4.1 4.5 4.5 5.2 5.5 7.6Oklahoma 1.4 1.5 1.9 1.6 2.1 2.8 3.1 3.1 2.8 2.7South Carolina 1.8 3.4 2.6 4.0 4.7 6.0 6.1 6.6 6.8 6.5Tennessee 5.1 7.1 8.9 11.4 13.6 14.9 14.6 13.7 12.4 9.2Texas 2.6 3.6 4.8 5.6 5.8 7.1 8.3 10.6 12.1 13.8Virginia 1.5 2.1 2.8 3.5 4.3 4.4 4.3 4.0 4.6 5.2West Virginia 0.7 1.1 1.8 2.0 2.1 3.2 3.5 4.8 4.9 4.9
West 1.8 2.0 2.5 2.9 2.6 2.7 2.4 2.3 3.0 2.5Alaska 2.5 2.3 2.6 3.8 3.9 5.0 5.9 6.1 6.1 5.4Arizona 8.8 9.7 12.0 13.2 10.6 12.0 12.3 10.3 11.3 11.8California 2.4 2.4 2.9 3.7 3.9 4.3 4.6 3.9 5.0 4.8Colorado 1.9 2.1 2.5 1.6 2.2 2.1 2.2 3.1 3.9 3.8Hawaii 3.8 4.4 5.3 6.4 9.5 10.3 12.9 14.5 16.7 17.9Idaho 0.9 1.3 1.1 1.5 1.9 2.8 3.2 4.0 5.0 5.0Montana 0.9 0.9 1.4 1.3 2.4 3.7 4.9 6.7 8.1 9.7Nevada 4.8 6.2 8.6 10.2 9.2 10.9 9.8 10.3 11.2 12.4New Mexico 3.5 2.7 4.4 4.1 5.6 6.0 6.7 8.0 10.2 9.5Oregon 2.0 2.4 3.1 4.5 5.0 5.4 5.5 6.7 7.3 6.1Utah 5.5 5.7 5.0 5.6 5.0 3.9 4.2 4.4 4.2 2.4Washington 2.1 2.1 2.9 2.1 2.4 3.0 3.3 3.3 4.4 4.0Wyoming 1.6 2.0 2.3 2.6 3.7 5.2 7.0 7.8 9.4 10.1
NOTE: Mean absolute percentage error is the average value over past projections of the absolute values of errors expressed in percentage terms. National MAPEs for public high school graduates were calculated using the last 21 editions of Projections of Education Statistics and state MAPEs were calculated using the last 16 editions of Projections of Education Statistics. Calculations were made using unrounded numbers. Some data have been revised from previously published figures.SOURCE: U.S. Department of Education, National Center for Education Statistics, Projections of Education Statistics, various issues. (This table was prepared February 2012.)

106 Appendix A: Introduction to Projection Methodology
A.3. ELEMENTARY AND SECONDARY TEACHERS
Projections in this editionThis edition of Projections of Education Statistics presents projected trends in elementary and secondary teachers, pupil/teacher ratios, and new teacher hires from 2011 to 2021. These projections were made using two models:
»
»
The Elementary and Secondary Teacher Model was used to project the number of public school teachers, the number of private school teachers, and the total number of teachers for the nation. It was also used to project pupil/teacher ratios for public schools, private schools, and all elementary and secondary schools.The New Teacher Hires Model was used to project the number of new teacher hires in public schools, private schools, and all schools.
Overview of approach Approach for numbers of teachers and pupil/teacher ratios
Public schools. Multiple linear regression was used to produce initial projections of public school pupil/teacher ratios separately for elementary and secondary schools. The initial projections of elementary pupil/teacher ratios and secondary pupil/teacher ratios were applied to enrollment projections to project the numbers of elementary teachers and secondary teachers, which were summed to get the total number of public school teachers. Final projections of the overall public school pupil/teacher ratios were produced by dividing total projected public school enrollment by the total projected number of teachers.
Assumptions underlying this method
This method assumes that past relationships between the public school pupil/teacher ratio (the dependent variable) and the independent variables used in the regression analysis will continue throughout the forecast period. For more information about the independent variables, see “Elementary and Secondary Teacher Model,” later in this section of appendix A.
Private schools. Private school pupil/teacher ratios were projected by applying each year’s projected annual percentage change in the overall public school pupil/teacher ratio to the previous year’s private school pupil/teacher ratio. The projected private school pupil/teacher ratios were then applied to projected enrollments at private schools to produce projected numbers of private school teachers.
Assumptions underlying this method
This method assumes that the future pattern in the trend of private school pupil/teacher ratios will be the same as that for public school pupil/teacher ratios. The reader is cautioned that a number of factors could alter the assumption of consistent patterns of change in ratios over the forecast period.
Approach for new teacher hires
The following numbers were projected separately for public schools and for private schools:
»
»
The number of teachers needed to fill openings when there is an increase in the size of the teaching workforce from one year to the next and the decrease in the number of replacement teachers needed if there is a decrease in the size of the teaching workforce from one year to the next. This number was estimated based on continuation rates of teachers by their age.The number of teachers needed to fill openings due to an increase in the size of the teaching workforce from one year to the next. This number was estimated by subtracting the projected number of teachers in one year from the projected number of teachers in the next year.
These two numbers were summed to yield the total number of “new teacher hires” for each control of school—that is, teachers who will be hired in a given year, but who did not teach in that control the previous year. A teacher who moves from one control to the other control (i.e. from a public to private school or from a private to a public school) is considered a new teacher hire, but a teacher who moves from one school to another school in the same control is not considered a new teacher hire.
Elementary and Secondary Teacher ModelProjections for public schools were produced first. Projections for private schools were produced based partially on input from the public school projections. Finally, the public and private school projections were combined into total elementary and secondary school projections (not shown in the steps below).

Projections of Education Statistics to 2021 107
Steps used to project numbers of teachers and pupil/teacher ratios
Public school teachers. The following steps were used for the public school projections:
Step 1. Produce projections of pupil/teacher ratios for public elementary schools and public secondary schools separately. Two separate equations were used—one for elementary schools and one for secondary schools. The equations for elementary and secondary schools included an AR(1) term for correcting for autocorrelation and the following independent variables:
»
»
Independent variables for public elementary school pupil/teacher ratios—(1) average teacher wage relative to the overall economy-level wage, and (2) level of education revenue from state sources in constant dollars per public elementary student. Independent variables for public secondary school pupil/teacher ratios—(1) level of education revenue from state sources in constant dollars per public secondary student, and (2) the number of students enrolled in public secondary schools relative to the secondary school–age population.
To estimate the models, they were first transformed into nonlinear models and then the coefficients were estimated simultaneously by applying a Marquardt nonlinear least squares algorithm to the transformed equation.
For details on the equations, model statistics, and data used to project public school pupil/teacher ratios, see “Data and equations used for projections of teachers and pupil/teacher ratios,” below.
Step 2. Produce projections of the number of teachers for public elementary schools and public secondary schools separately. The projections of the public elementary pupil/teacher ratio and public secondary pupil/teacher ratio were applied to projections of enrollments in elementary schools and secondary schools, respectively, to produce projections of public elementary teachers and public secondary teachers.
Step 3. Produce projections of the total number of teachers for public elementary and secondary schools combined. The projections of public elementary teachers and public secondary teachers were added together to produce the projections of the total number of public elementary and secondary teachers.
Step 4. Produce projections of the pupil/teacher ratio for public elementary and secondary schools combined. The projections of the total number of public elementary and secondary teachers were divided by projections of total enrollment in public elementary and secondary schools to produce projections of the overall pupil/teacher ratio in public elementary and secondary schools.
Private school teachers. The following steps were used for the private school projections:
Step 1. Produce projections of the private school pupil/teacher ratio. First, the projection of the private school pupil/teacher ratio for 2010 was calculated by multiplying the private school pupil/teacher ratio for 2009 (the last year of actual data) by the percentage change from 2009 to 2010 in the public school pupil/teacher ratio. The same method was used to calculate the projections of the private school pupil/teacher ratio for 2011 through 2021. That is, each year’s projected annual percentage change in the public school pupil/teacher ratio was applied to the previous year’s private school pupil/teacher ratio.
Step 2. Produce projections of the number of private school teachers. The projected pupil/teacher ratios were applied to projected private school enrollments to produce projections of private school teachers from 2010 through 2021.
For information about the private school teacher and enrollment data used for the private school projections, see “Data and equations used for projections of teachers and pupil/teacher ratios,” below.
Data and equations used for projections of teachers and pupil/teacher ratios
Public school data used in these projections were by organizational level (i.e., school level), not by grade level. Thus, secondary school enrollment is not the same as enrollment in grades 9 through 12 because some jurisdictions count some grade 7 and 8 enrollment as secondary. For example, some jurisdictions may have 6-year high schools with grades 7 through 12.
Data used to estimate the equation for public elementary school pupil/teacher ratios. The following data were used to estimate the equation:
» To compute the historical elementary school pupil/teacher ratios—Data on 1973–74 to 1980–81 enrollments in public elementary schools came from the NCES Statistics of Public Elementary and Secondary Day Schools and data on 1981–82 to 2009–10 enrollment came from the NCES Common Core of Data (CCD). (Teachers data for 2010–11 became available after that projections were calculated.) The proportion of public school teachers who taught in elementary schools was taken from the National Education Association and then applied to the total number of public school teachers from the CCD to produce the number of teachers in elementary schools.

108 Appendix A: Introduction to Projection Methodology
» For 1973–74 and 1975–76, the education revenue from state sources data came from Statistics of State School Systems, published by NCES. For 1974–75 and 1976–77, the education revenue from state sources data came from Revenues and Expenditures for Public Elementary and Secondary Education, also published by NCES. For 1977–78 through 2008–09, these data came from the NCES Common Core of Data (CCD).
Estimated equation and model statistics for public elementary school pupil/teacher ratios. For the estimated equation and model statistics, see table A-11 on page 111. In the public elementary pupil/teacher ratio equation, the independent variables affect the dependent variable in the expected way:
» »
As the average teacher wage relative to the overall economy-level wage increases, the pupil/teacher ratio increases; andAs the level of education revenue from state sources in constant dollars per public elementary student increases, the pupil/teacher ratio decreases.
Data used to project public elementary school pupil/teacher ratios. The estimated equation was run using projected values for teacher salaries and education revenues from state sources from 2010–11 through 2021–22. For more information, see Section A.0. Introduction, earlier in this appendix and Section A.4 Expenditures for Public Elementary and Secondary Education later in this appendix.
Data used to estimate the equation for public secondary school pupil/teacher ratios. The following data were used to estimate the equation:
»
»
»
To compute the historical secondary school pupil/teacher ratios—Data on 1973–74 to 1980–81 enrollments in public elementary schools came from the NCES Statistics of Public Elementary and Secondary Day Schools and data on 1981–82 to 2009–10 enrollment came from the NCES Common Core of Data (CCD). The proportion of public school teachers who taught in secondary schools was taken from the National Education Association and then applied to the total number of public school teachers from the CCD to produce the number of teachers in secondary schools. For 1973–74 and 1975–76, the education revenue from state sources data came from Statistics of State School Systems, published by NCES. For 1974–75 and 1976–77, the education revenue from state sources data came from Revenues and Expenditures for Public Elementary and Secondary Education, also published by NCES. For 1977–78 through 2008–09, these data came from the NCES Common Core of Data (CCD).To compute the historical secondary school enrollment rate—Data on the secondary school-age population from 1973–74 to 2009–10 came from the U.S. Census Bureau. Data on enrollments in public secondary schools during the same period came from the CCD, as noted above.
Estimated equation and model statistics for public secondary school pupil/teacher ratios. For the estimated equation and model statistics, see table A-11 on page 111. In the public secondary pupil/teacher ratio equation, the independent variables affect the dependent variable in the expected way:
»
»
As enrollment rates (number of enrolled students relative to the school-age population) increase, the pupil/teacher ratio increases; and As the level of education revenue per secondary student increases, the pupil/teacher ratio decreases.
Data used to project public secondary school pupil/teacher ratios. The estimated equation was run using projections for education revenues, public secondary enrollments, and secondary school–age populations from 2010–11 through 2021–22. Secondary enrollment projections were derived from the enrollment projections described in Section A.1. Elementary and Secondary Enrollment. Population projections were from the Census Bureau’s 2008 National Population Projections by age and sex (August 2008), ratio-adjusted to line up with the most recent historical estimates.
Private school teacher and enrollment data. Private school data for 1989–90, 1991–92, 1993–94, 1995–96, 1997–98, 1999–2000, 2001–02, 2003–04, 2005–06, 2007–08, and 2009–10 came from the biennial NCES Private School Universe Survey (PSS). Since the PSS is collected in the fall of odd-numbered years, data for years without a PSS collection were estimated using data from the PSS.
Private school enrollment projections. Private school enrollments from 2010 to 2021 came from the projections described in Section A.1. Elementary and Secondary Enrollment, earlier in this appendix.
Accuracy of projections of numbers of teachers
Mean absolute percentage errors (MAPEs) for projections of public school teachers were calculated using the last 21 editions of Projections of Education Statistics. Table C, below, shows MAPEs for projections of the numbers of public school teachers. There was a change in the methodology for projecting private school teachers beginning with Projections of Education Statistics to 2017, and therefore there are too few years of data to present the MAPEs for private school teachers.

Projections of Education Statistics to 2021 109
Table C. Mean absolute percentage errors (MAPEs) of projections of number of public elementary and secondary school teachers, by lead time: 2012
Statistic
Lead time (years)
1 2 3 4 5 6 7 8 9 10
Public elementary and secondary teachers 0.8 1.4 1.7 2.2 2.8 3.4 3.9 4.3 5.0 5.9NOTE: MAPEs for teachers were calculated from the past 21 editions of Projections of Education Statistics containing teacher projections. Calculations were made using unrounded numbers. Some data have been revised from previously published figures. Number of teachers reported in full-time equivalents.SOURCE: U.S. Department of Education, National Center for Education Statistics, Projections of Education Statistics, various issues. (This table was prepared March 2012.)
For more information about MAPEs, see Section A.0. Introduction, earlier in this appendix.
New Teacher Hires ModelThe New Teacher Hires Model was estimated separately for public and private school teachers. The model produces projections of the number of teachers who were not teaching in the previous year, but who will be hired in a given year.
About new teacher hires
A teacher is considered to be a new teacher hire for a control of school (public or private) for a given year if the teacher teaches in that control that year but had not taught in that control in the previous year. Included among new teachers hires are: (1) teachers who are new to the profession; (2) teachers who had taught previously but had not been teaching the previous year; and (3) teachers who had been teaching in one control the previous year but have moved to the other control. Concerning the last category, if a teacher moves from one public school to a different public school, that teacher would not be counted as a new teacher hire for the purposes of this model. On the other hand, if a teacher moves from a public school to a private school, that teacher would be counted as a private school new teacher hire, since the teacher did not teach in a private school in the previous year.
The New Teacher Hires Model measures the demand for teacher hires. Due to difficulties in defining and measuring the pool of potential teachers, no attempt was made to measure the supply of new teacher candidates.
Steps used to project numbers of new teacher hires
The steps outlined below provide a general summary of how the New Teacher Hires Model was used to produce projections of the need for new teacher hires.
For more information about the New Teacher Hires Model, see Hussar (1999).
First, the series of steps outlined below was used to produce projections of public school new teacher hires. Then, the same steps were used to produce projections of private school new hires. Finally, the public and private new teacher hires were combined to produce projections of total new teacher hires.
Step 1. Estimate the age distribution of full-time-equivalent (FTE) teachers in 2007. For this estimate, the age distribution of the headcount of school teachers (including both full-time and part-time teachers) in 2007 was applied to the national number of FTE teachers in the same year.
Step 2. Estimate the number of new FTE teacher hires needed to replace those who left teaching between 2007 and 2008. In this step
»
»
»
Age-specific continuation rates for 2004 were applied to the FTE count of teachers by age for 2007, resulting in estimates of the number of FTE teachers who remained in teaching in 2008 by individual age. The FTE teachers who remained in teaching by individual age were summed across all ages to produce an estimate of the total number of FTE teachers who remained teaching in 2008. The total number of remaining FTE teachers in 2008 was subtracted from the total FTE teacher count for 2007 to produce the estimated number of FTE teachers who left teaching.
Step 3. Estimate the number of new FTE teacher hires needed due to the overall increase in the teacher workforce between 2007 and 2008. The total number of FTE teachers in 2007 was subtracted from the total number of FTE teachers in 2008 to determine the overall increase in the teaching workforce between 2007 and 2008.
Step 4. Estimate the total number of new FTE teacher hires needed in 2008. The number of FTE teachers who left teaching from step 2 was added to the estimated net change in the number of FTE teachers from step 3 to estimate the total number of new FTE teacher hires needed in 2008.
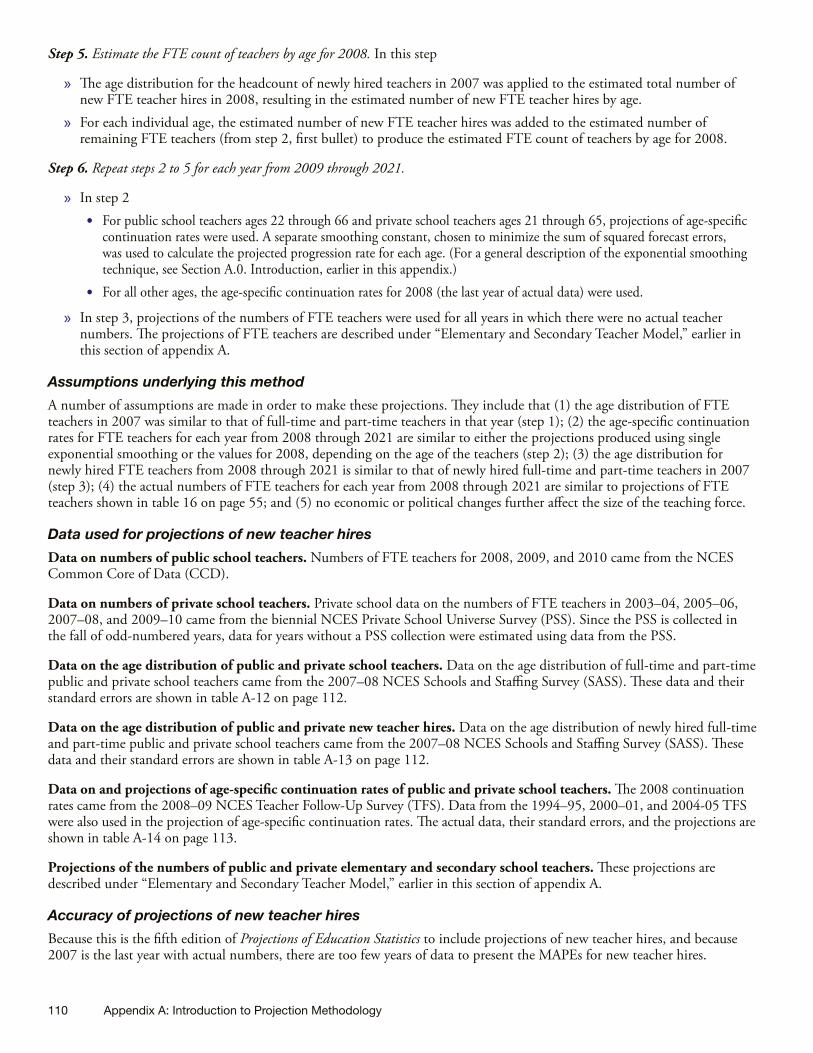
110 Appendix A: Introduction to Projection Methodology
Step 5. Estimate the FTE count of teachers by age for 2008. In this step
»
»
The age distribution for the headcount of newly hired teachers in 2007 was applied to the estimated total number of new FTE teacher hires in 2008, resulting in the estimated number of new FTE teacher hires by age.For each individual age, the estimated number of new FTE teacher hires was added to the estimated number of remaining FTE teachers (from step 2, first bullet) to produce the estimated FTE count of teachers by age for 2008.
Step 6. Repeat steps 2 to 5 for each year from 2009 through 2021.
»
»
In step 2
•
•
For public school teachers ages 22 through 66 and private school teachers ages 21 through 65, projections of age-specific continuation rates were used. A separate smoothing constant, chosen to minimize the sum of squared forecast errors, was used to calculate the projected progression rate for each age. (For a general description of the exponential smoothing technique, see Section A.0. Introduction, earlier in this appendix.) For all other ages, the age-specific continuation rates for 2008 (the last year of actual data) were used.
In step 3, projections of the numbers of FTE teachers were used for all years in which there were no actual teacher numbers. The projections of FTE teachers are described under “Elementary and Secondary Teacher Model,” earlier in this section of appendix A.
Assumptions underlying this method
A number of assumptions are made in order to make these projections. They include that (1) the age distribution of FTE teachers in 2007 was similar to that of full-time and part-time teachers in that year (step 1); (2) the age-specific continuation rates for FTE teachers for each year from 2008 through 2021 are similar to either the projections produced using single exponential smoothing or the values for 2008, depending on the age of the teachers (step 2); (3) the age distribution for newly hired FTE teachers from 2008 through 2021 is similar to that of newly hired full-time and part-time teachers in 2007 (step 3); (4) the actual numbers of FTE teachers for each year from 2008 through 2021 are similar to projections of FTE teachers shown in table 16 on page 55; and (5) no economic or political changes further affect the size of the teaching force.
Data used for projections of new teacher hires
Data on numbers of public school teachers. Numbers of FTE teachers for 2008, 2009, and 2010 came from the NCES Common Core of Data (CCD).
Data on numbers of private school teachers. Private school data on the numbers of FTE teachers in 2003–04, 2005–06, 2007–08, and 2009–10 came from the biennial NCES Private School Universe Survey (PSS). Since the PSS is collected in the fall of odd-numbered years, data for years without a PSS collection were estimated using data from the PSS.
Data on the age distribution of public and private school teachers. Data on the age distribution of full-time and part-time public and private school teachers came from the 2007–08 NCES Schools and Staffing Survey (SASS). These data and their standard errors are shown in table A-12 on page 112.
Data on the age distribution of public and private new teacher hires. Data on the age distribution of newly hired full-time and part-time public and private school teachers came from the 2007–08 NCES Schools and Staffing Survey (SASS). These data and their standard errors are shown in table A-13 on page 112.
Data on and projections of age-specific continuation rates of public and private school teachers. The 2008 continuation rates came from the 2008–09 NCES Teacher Follow-Up Survey (TFS). Data from the 1994–95, 2000–01, and 2004-05 TFS were also used in the projection of age-specific continuation rates. The actual data, their standard errors, and the projections are shown in table A-14 on page 113.
Projections of the numbers of public and private elementary and secondary school teachers. These projections are described under “Elementary and Secondary Teacher Model,” earlier in this section of appendix A.
Accuracy of projections of new teacher hires
Because this is the fifth edition of Projections of Education Statistics to include projections of new teacher hires, and because 2007 is the last year with actual numbers, there are too few years of data to present the MAPEs for new teacher hires.

Projections of Education Statistics to 2021 111
Table A-11. Estimated equations and model statistics for public elementary and secondary teachers
Dependent variable Equation1 R2
Breusch-Godfrey
Serial Correlation
LM test statistic2
Time period
Elementary ln(RELENRTCH) = 3.80 + .07 ln(RSALARY) - .22 ln(RSGRNTELENR) + .32 AR(1) 0.99 .88 (0.644) 1973 to2009(38.236) (5.210) (-9.868) (1.98)
Secondary ln(RSCENRTCH) = 4.14 - .24 ln(RSGRNTSCENR) + .54 ln(RSCENRPU) + .61 AR(1) 0.23 .18 (0.890) 1973 to2009(43.721) (-17.314) (4.476) (4.030)
1 AR(1) indicates that the model was estimated using least squares with the AR(1) process for correcting for first-order autocorrelation. To estimate the model, it was first transformed into a nonlinear model and then the coefficients were estimated simultaneously by applying a Marquardt nonlinear least squares algorithm to the transformed equation. For a general discussion of the problem of autocorrelation, and the method used to forecast in the presence of autocorrelation, see Judge, G., Hill, W., Griffiths, R., Lutkepohl, H., and Lee, T. (1985). The Theory and Practice of Econometrics, New York: John Wiley and Sons, pp. 315-318. Numbers in parentheses are t-statistics.2 The number in parentheses is the probability of the Chi-Square associated with the Breusch-Godfrey Serial Correlation LM Test. A p value greater than 0.05 implies that we do not reject the null hypothesis of no autocorrelation at the 5% significance level for a two-tailed test and the 10% significance level for a one-tailed test, i.e., there is no autocorrelation present. For an explanation of the Breusch-Godfrey Serial Correlation LM test statistic, see Greene, W. (2000). Econometric Analysis. New Jersey: Prentice-Hall.NOTE: R2 indicates the coefficient of determination. RELENRTCH = Ratio of public elementary school enrollment to classroom teachers (i.e., pupil/teacher ratio).RSCENRTCH = Ratio of public secondary school enrollment to classroom teachers (i.e., pupil/teacher ratio).RSALARY = Average annual teacher salary relative to the overall economy wage in 2000 dollars. RSGRNTELENR = Ratio of education revenue receipts from state sources per capita to public elementary school enrollment in 2000 dollars. RSGRNTSCENR = Ratio of education revenue receipts from state sources per capita to public secondary school enrollment in 2000 dollars. RSCENRPU = Ln of the ratio of enrollment in public secondary schools to the 11- to 18-year-old population. SOURCE: U.S. Department of Education, National Center for Education Statistics, Elementary and Secondary Teacher Model, 1973–2010. (This table was prepared March 2012.)

112 Appendix A: Introduction to Projection Methodology
Table A-12. Percentage distribution of full-time and part-time school teachers, by age, control of school, and teaching status: School year 2007–08
Control of school and teaching status
Percent of total
Age distribution
TotalLess than 25 years
25–29 years
30–39 years
40–49 years
50–59 years
60–64 years
65 years or more
Public-actual 100.0 (†) 100.0 3.7 (0.21) 14.3 (0.51) 26.4 (0.39) 23.7 (0.47) 25.8 (0.51) 4.8 (0.24) 1.3 (0.12)Full-time 91.8 (0.29) 100.0 3.8 (0.22) 14.6 (0.50) 26.5 (0.40) 23.6 (0.50) 25.7 (0.54) 4.7 (0.25) 1.2 (0.13)Part-time 8.2 (0.29) 100.0 2.5 (0.46) 11.8 (1.18) 25.3 (1.56) 24.7 (1.48) 27.6 (1.33) 6.0 (0.83) 2.1 (0.34)
Private-actual 100.0 (†) 100.0 4.6 (0.34) 11.7 (0.48) 22.3 (0.91) 23.8 (0.65) 26.2 (0.87) 7.9 (0.52) 3.6 (0.41)Full-time 78.8 (0.93) 100.0 5.0 (0.37) 13.0 (0.66) 23.0 (0.96) 23.0 (0.65) 25.0 (0.98) 8.0 (0.56) 3.0 (0.38)Part-time 21.2 (0.93) 100.0 3.0 (0.80) 7.0 (0.90) 19.0 (1.86) 27.0 (1.90) 29.0 (1.46) 9.0 (1.57) 7.0 (1.09)
† Not applicable.NOTE: Detail may not sum to totals because of rounding. Standard errors appear in parentheses. The 2007–08 data are the most recent data available.SOURCE: U.S. Department of Education, National Center for Education Statistics, Schools and Staffing Survey (SASS), “Public School Teacher Questionnaire,” 2007–08 and “Private School Teacher Questionnaire,” 2007–08; and unpublished tabulations. (This table was prepared October 2010.)
Table A-13. Percentage distribution of full-time and part-time newly hired teachers, by age and control of school: Selected school years, 1987–88 through 2007–08
Control of school and school year
Age distribution
TotalLess than 25 years
25–29 years
30–39 years
40–49 years
50–59 years
60–64 years
65 years or more
Public1987–88 100.0 17.7 (0.79) 23.7 (1.19) 33.0 (1.43) 21.2 (0.80) 4.0 (0.51) 0.3 ! (0.11) ‡ (†)1990–91 100.0 17.5 (1.06) 24.0 (1.35) 30.6 (1.33) 21.4 (1.28) 5.6 (0.65) 0.6 (0.18) ‡ (†)1993–94 100.0 16.2 (0.91) 28.7 (1.15) 24.9 (1.04) 24.6 (1.16) 5.0 (0.63) 0.5 (0.13) 0.2 ! (0.09)1999–2000 100.0 23.6 (1.28) 22.5 (0.97) 22.2 (1.10) 19.2 (0.90) 11.1 (0.88) 0.9 (0.23) 0.6 ! (0.26)2003–04 100.0 24.4 (1.21) 19.0 (1.23) 24.6 (1.10) 16.5 (1.18) 13.3 (0.93) 1.5 (0.29) 0.7 ! (0.29)2007–08 100.0 23.8 (1.75) 24.3 (1.79) 20.4 (1.56) 15.1 (0.94) 13.6 (1.22) 2.3 (0.39) 0.5 ! (0.22)
Private1987–88 100.0 17.0 (1.27) 22.8 (1.68) 32.5 (2.17) 17.9 (1.61) 5.3 (1.09) ‡ (†) 1.8 ! (0.77)1990–91 100.0 15.8 (1.47) 26.3 (1.83) 29.1 (1.86) 21.1 (1.67) 5.6 (0.88) 1.1 ! (0.40) 1.0 ! (0.42)1993–94 100.0 19.3 (1.13) 24.4 (1.19) 24.9 (1.49) 22.6 (1.18) 7.3 (0.85) 0.9 (0.20) 0.6 ! (0.23)1999–2000 100.0 18.5 (0.89) 17.2 (0.87) 24.1 (1.24) 22.1 (1.19) 14.0 (1.01) 2.6 (0.39) 1.5 (0.38)2003–04 100.0 17.1 (1.59) 16.0 (2.13) 23.0 (2.19) 22.8 (3.32) 15.3 (1.77) 3.6 (0.83) 2.1 (0.58)2007–08 100.0 14.3 (1.26) 18.2 (1.36) 23.2 (1.97) 23.6 (1.92) 14.4 (1.49) 4.2 (0.84) 2.1 ! (0.69)
† Not applicable.! Interpret data with caution. The coefficient of variation (CV) for this estimate is 30 percent or greater.‡ Reporting standards not met. The coefficient of variation (CV) for this estimate is 50 percent or greater.NOTE: Detail may not sum to totals because of rounding. Standard errors appear in parentheses. The 2007–08 data are the most recent data available.SOURCE: U.S. Department of Education, National Center for Education Statistics, Schools and Staffing Survey (SASS), “Public School Teacher Questionnaire,” 1987–88 through 2007–08 and “Private School Teacher Questionnaire,” 1987–88 through 2007–08; and unpublished tabulations. (This table was prepared October 2010.)

Projections of Education Statistics to 2021 113
Table A-14. Actual and projected continuation rates of full-time and part-time school teachers, by age and control of school: Selected school years, 1993–94 to 1994–95 through 2021–22 to 2022–23
Control of school and school year Total
Continuation rates, by age
Less than 25 years
25–29 years
30–39 years
40–49 years
50–59 years
60–64 years
65 years or older
Public actual1993–94 to 1994–95 93.4 (0.36) 96.2 (1.09) 90.0 (1.22) 93.3 (1.03) 96.1 (0.54) 93.7 (0.77) 69.5 (4.79) 65.9 (8.81)1999–2000 to
2000–01 92.4 (0.38) 95.8 (0.98) 89.3 (7.38) 93.2 (2.76) 94.5 (0.61) 92.9 (4.58) 76.8! (29.18) (‡) (†)2003–04 to 2004–05 91.4 (0.55) 94.9 (1.79) 90.1 (1.71) 92.6 (0.93) 94.5 (0.78) 90.8 (0.81) 77.2 (3.00) 70.3 (9.40)2007–08 to 2008–09 91.8 (0.45) 92.2 (1.95) 89.0 (2.33) 92.4 (1.29) 95.1 (1.06) 92.3 (1.23) 82.8 (3.97) 88.9 (4.26)
Public projected2008–09 to 2009–10 90.7 (†) 88.9 (†) 89.0 (†) 92.6 (†) 94.1 (†) 91.4 (†) 76.5 (†) 65.0 (†)2009–10 to 2010–11 90.6 (†) 89.1 (†) 89.0 (†) 92.6 (†) 93.9 (†) 91.4 (†) 76.4 (†) 64.6 (†)2010–11 to 2011–12 90.6 (†) 88.7 (†) 89.0 (†) 92.6 (†) 94.0 (†) 91.4 (†) 76.2 (†) 63.7 (†)2011–12 to 2012–13 90.6 (†) 89.0 (†) 89.0 (†) 92.6 (†) 94.1 (†) 91.4 (†) 76.1 (†) 62.6 (†)2012–13 to 2013–14 90.5 (†) 88.9 (†) 89.0 (†) 92.6 (†) 94.1 (†) 91.4 (†) 76.1 (†) 63.3 (†)2013–14 to 2014–15 90.5 (†) 88.9 (†) 89.0 (†) 92.6 (†) 94.1 (†) 91.5 (†) 76.0 (†) 63.1 (†)2014–15 to 2015–16 90.5 (†) 88.9 (†) 89.0 (†) 92.6 (†) 94.0 (†) 91.5 (†) 75.8 (†) 64.3 (†)2015–16 to 2016–17 90.6 (†) 88.9 (†) 89.0 (†) 92.6 (†) 94.1 (†) 91.5 (†) 75.8 (†) 64.1 (†)2016–17 to 2017–18 90.6 (†) 88.9 (†) 89.0 (†) 92.6 (†) 94.2 (†) 91.6 (†) 75.9 (†) 63.8 (†)2017–18 to 2018–19 90.6 (†) 88.9 (†) 89.0 (†) 92.6 (†) 94.1 (†) 91.6 (†) 75.9 (†) 63.8 (†)2018–19 to 2019–20 90.7 (†) 89.0 (†) 89.0 (†) 92.6 (†) 94.1 (†) 91.6 (†) 75.9 (†) 63.9 (†)2019–20 to 2020–21 90.7 (†) 88.9 (†) 89.0 (†) 92.6 (†) 94.1 (†) 91.6 (†) 75.9 (†) 63.7 (†)2020–21 to 2021–22 90.7 (†) 89.0 (†) 89.0 (†) 92.6 (†) 94.0 (†) 91.6 (†) 76.0 (†) 63.4 (†)2021–22 to 2022–23 90.7 (†) 89.0 (†) 89.0 (†) 92.6 (†) 94.1 (†) 91.6 (†) 76.0 (†) 63.4 (†)
Private actual1993–94 to 1994–95 88.1 (0.74) 80.0 (4.42) 86.9 (1.64) 85.1 (1.70) 91.3 (1.14) 91.8 (1.52) 86.9 (2.74) 58.1 (8.67)1999–2000 to
2000–01 83.0 (0.72) 61.7 (4.90) 72.2 (2.76) 80.2 (1.57) 86.1 (1.47) 92.3 (1.00) 78.8 (4.79) 75.2 (5.17)2003–04 to 2004–05 83.3 (2.06) 75.4 (5.97) 71.7 (3.62) 82.2 (2.30) 86.8 (2.28) 89.2 (9.17) 80.1 (4.15) 79.5 (6.07)2007–08 to 2008–09 82.2 (1.69) 77.7 (8.33) 71.7 (6.44) 79.1 (3.43) 86.1 (2.92) 86.8 (2.17) 85.2 (4.21) 77.3 (8.23)
Private projected2008–09 to 2009–10 82.3 (†) 68.5 (†) 73.1 (†) 80.5 (†) 86.2 (†) 87.7 (†) 80.7 (†) 78.4 (†)2009–10 to 2010–11 82.1 (†) 68.2 (†) 73.2 (†) 80.5 (†) 86.2 (†) 87.7 (†) 79.9 (†) 74.6 (†)2010–11 to 2011–12 82.1 (†) 67.7 (†) 73.3 (†) 80.4 (†) 86.1 (†) 87.8 (†) 79.4 (†) 76.7 (†)2011–12 to 2012–13 82.2 (†) 68.3 (†) 73.3 (†) 80.3 (†) 86.2 (†) 87.8 (†) 80.1 (†) 74.9 (†)2012–13 to 2013–14 82.2 (†) 68.0 (†) 73.2 (†) 80.3 (†) 86.1 (†) 87.7 (†) 80.4 (†) 75.4 (†)2013–14 to 2014–15 82.3 (†) 67.9 (†) 73.2 (†) 80.3 (†) 86.3 (†) 87.8 (†) 80.0 (†) 76.9 (†)2014–15 to 2015–16 82.2 (†) 68.0 (†) 73.1 (†) 80.3 (†) 86.2 (†) 87.8 (†) 79.8 (†) 76.4 (†)2015–16 to 2016–17 82.2 (†) 67.9 (†) 73.1 (†) 80.3 (†) 86.3 (†) 87.6 (†) 80.3 (†) 75.7 (†)2016–17 to 2017–18 82.2 (†) 67.9 (†) 73.1 (†) 80.3 (†) 86.2 (†) 87.8 (†) 80.4 (†) 76.2 (†)2017–18 to 2018–19 82.2 (†) 67.9 (†) 73.1 (†) 80.4 (†) 86.3 (†) 87.8 (†) 80.2 (†) 75.9 (†)2018–19 to 2019–20 82.2 (†) 67.9 (†) 73.1 (†) 80.3 (†) 86.3 (†) 87.7 (†) 80.3 (†) 75.7 (†)2019–20 to 2020–21 82.1 (†) 67.9 (†) 73.1 (†) 80.3 (†) 86.3 (†) 87.7 (†) 80.0 (†) 76.0 (†)2020–21 to 2021–22 82.1 (†) 67.9 (†) 73.1 (†) 80.3 (†) 86.3 (†) 87.7 (†) 80.1 (†) 76.1 (†)2021–22 to 2022–23 82.1 (†) 67.9 (†) 73.1 (†) 80.3 (†) 86.3 (†) 87.7 (†) 80.4 (†) 75.7 (†)
† Not applicable.! Interpret data with caution. The coefficient of variation (CV) for this estimate is 30 percent or greater.‡ Reporting standards not met. The coefficient of variation (CV) for this estimate is 50 percent or greater.NOTE: The continuation rate for teachers for each control of school (public schools and private schools) is the percentage of teachers in that control who continued teaching in the same control from one year to the next. Standard errors appear in parentheses. The 2008–09 data are the most recent data available.SOURCE: U.S. Department of Education, National Center for Education Statistics, Teacher Follow up Survey (TFS), “Public School Teacher Questionnaire,” 1994–95 through 2008–09 and “Private School Teacher Questionnaire,” 1994–95 through 2008–09; and unpublished tabulations. (This table was prepared January 2012.)

114 Appendix A: Introduction to Projection Methodology
A.4. EXPENDITURES FOR PUBLIC ELEMENTARY AND SECONDARY EDUCATION
Projections in this editionThis edition of Projections of Education Statistics presents projections of total current expenditures for public elementary and secondary education, current expenditures per pupil in fall enrollment, and current expenditures per pupil in average daily attendance for 2009–10 through 2021–22.
As the source of the elementary and secondary private school data, the NCES Private School Universe Survey, does not collect data for current expenditures, there are no projections for private school current expenditures.
Overview of approach
Theoretical and empirical background
The Public Elementary and Secondary Education Current Expenditure Model used in this report is based on the theoretical and empirical literature on the demand for local public services such as education.1 Specifically, it is based on a type of model that has been called a median voter model. In brief, a median voter model posits that spending for each public good in the community (in this case, spending for education) reflects the preferences of the “median voter” in the community. This individual is identified as the voter in the community with the median income and median property value. The amount of spending in the community reflects the price of education facing the voter with the median income, as well as his income and tastes. There are competing models in which the level of spending reflects the choices of others in the community, such as government officials.
In a median voter model, the demand for education expenditures is typically linked to four different types of independent variables: (1) measures of the income of the median voter; (2) measures of intergovernmental aid for education going indirectly to the median voter; (3) measures of the price to the median voter of providing one more dollar of education expenditures per pupil; and (4) any other variables that may affect one’s tastes for education. The Public Elementary and Secondary Education Current Expenditure Model contains independent variables of the first two types. It uses multiple linear regression analysis to define the relationships between these independent variables and current expenditures (the dependent variable).
Elementary and Secondary Education Current Expenditure ModelProjections for current expenditures per pupil in fall enrollment were produced first. These projections were then used in calculating total expenditures and expenditures per pupil in average daily attendance.
Steps used to project current expenditures for public elementary and secondary education
Step 1. Produce projections of education revenue from state sources. The equation for education revenue included an AR(1) term for correcting for autocorrelation and the following independent variables:
» »
disposable income per capita in constant dollars; and
the ratio of fall enrollment to the population.
To estimate the model, it was first transformed into a nonlinear model and then the coefficients were estimated simultaneously by applying a Marquardt nonlinear least squares algorithm to the transformed equation.
Step 2. Produce projections of current expenditures per pupil in fall enrollment. The equation for current expenditures per pupil for fall enrollment included an AR(1) term for correcting for autocorrelation and the following independent variables:
» »
disposable income per capita in constant dollars; and
education revenue from state sources per capita in constant dollars. This variable was projected in step 1.
1 For a discussion of the theory together with a review of some of the older literature, see Inman (1979). More recent empirical work includes Gamkhar and Oates (1996) and Mitias and Turnbull (2001).

Projections of Education Statistics to 2021 115
To estimate the models, they were first transformed into nonlinear models and then the coefficients were estimated simultaneously by applying a Marquardt nonlinear least squares algorithm to the transformed equation.
For details on the equations used in steps 1 and 2, the data used to estimate these equations, and their results, see “Data and equations used for projections of current expenditures for public elementary and secondary education,” below.
Step 3. Produce projections of total current expenditures. Projections of total current expenditures were made by multiplying the projections for current expenditures per pupil in fall enrollment by projections for fall enrollment.
Step 4. Produce projections of current expenditures per pupil in average daily attendance. The projections for total current expenditures were divided by projections for average daily attendance to produce projections of current expenditures per pupil in average daily attendance.
All the projections were developed in 1982–84 dollars and then placed in 2010–11 dollars using the projections of the Consumer Price Index. Current-dollar projections were produced by multiplying the constant-dollar projections by projections for the Consumer Price Index. The Consumer Price Index and the other economic variables used in calculating the projections presented in this report were placed in school year terms rather than calendar year terms.
Data and equations used for projections of current expenditures for public elementary and secondary education
Data used to estimate the equations for revenue from state sources and current expenditures per pupil. The following data for the period from 1973–74 to 2008–09 were used to estimate the equations:
»
»
»
Current expenditures and revenues from state sources—For 1973–74 and 1975–76, the current expenditures data came from Statistics of State School Systems, published by NCES. For 1974–75 and 1976–77, the current expenditures data came from Revenues and Expenditures for Public Elementary and Secondary Education, also published by NCES. For 1977–78 through 2008–09, these data came from the NCES Common Core of Data (CCD) and unpublished data. For most years, the sources for the past values of revenue from state sources were identical to the sources for current expenditures.Disposable personal income per capita—Disposable personal income from the Bureau of Economic Analysis were divided by population data from the U.S. Census Bureau.The ratio of fall enrollment to population data—Fall enrollment data from the CCD were divided by population data from the U.S. Census Bureau.
Estimated equations and model statistics for revenue from state sources and current expenditures per pupil. For the results of the equations, see table A-15 on page 117. In each equation, the independent variables affect the dependent variable in the expected way. In the revenues from state sources equation:
»
»
»
»
All other things being equal, as disposable income per capita increases so does local governments’ education revenue from state sources per capita; andAs enrollment increases relative to the population, so does the local governments’ education revenue from state sources per capita.In the current expenditures per pupil equation: All other things being equal, as disposable income per capita increases, so does current expenditures per pupil; andAs local governments’ education revenue from state sources per capita increases, so does current expenditures per pupil.
Projections for economic variables. Projections for economic variables, including disposable income and the Consumer Price Index, were from the “U.S. Monthly Model: January 2012 Short-Term Projections” from the economic consulting firm, IHS Global Insight (see supplemental table B-6). The values of all the variables from IHS Global Insight were placed in school-year terms. The school-year numbers were calculated by taking the average of the last two quarters of one year and the first two quarters of the next year.
Projections for fall enrollment. The projections for fall enrollment are those presented in section 1 of this publication. The methodology for these projections is presented in Section A.1. Elementary and Secondary Enrollment, earlier in this appendix.
Projections for population. Population estimates for 1973 to 2010 and population projections for 2011 to 2021 from the U.S. Census Bureau were used to develop the public school current expenditure projections. The set of population projections used in this year’s Projections of Education Statistics are the Census Bureau’s 2008 National Population Projections (August 2008).
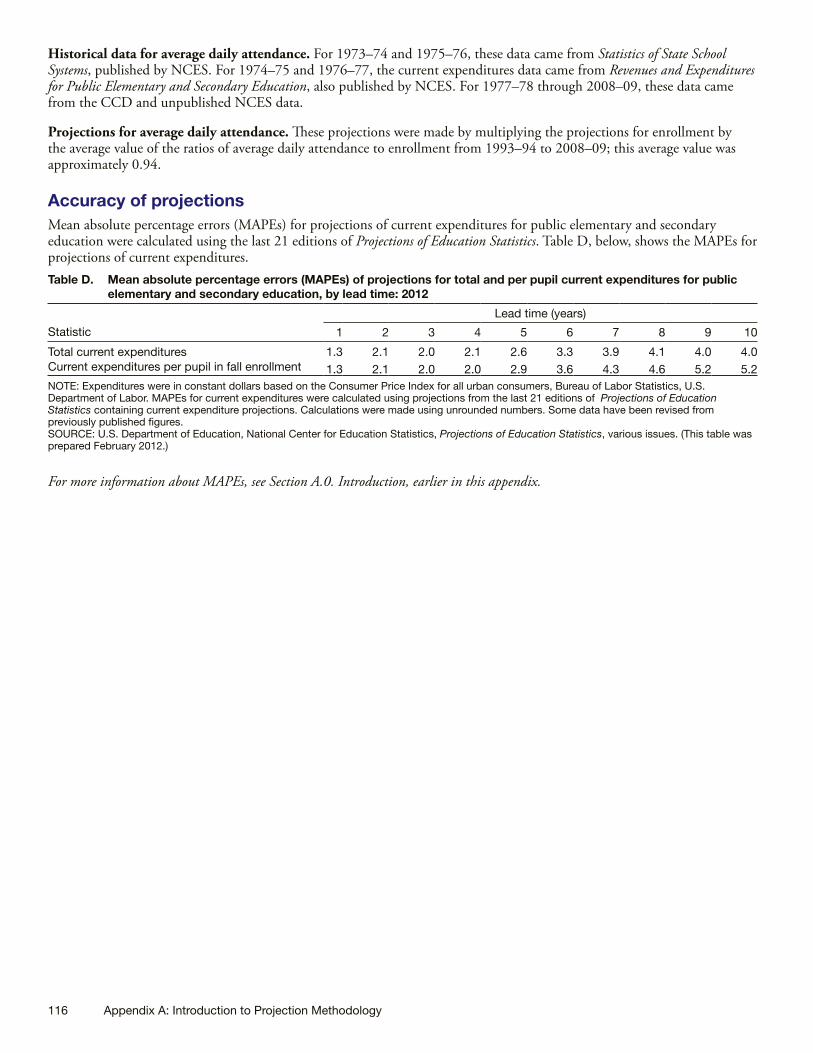
116 Appendix A: Introduction to Projection Methodology
Historical data for average daily attendance. For 1973–74 and 1975–76, these data came from Statistics of State School Systems, published by NCES. For 1974–75 and 1976–77, the current expenditures data came from Revenues and Expenditures for Public Elementary and Secondary Education, also published by NCES. For 1977–78 through 2008–09, these data came from the CCD and unpublished NCES data.
Projections for average daily attendance. These projections were made by multiplying the projections for enrollment by the average value of the ratios of average daily attendance to enrollment from 1993–94 to 2008–09; this average value was approximately 0.94.
Accuracy of projectionsMean absolute percentage errors (MAPEs) for projections of current expenditures for public elementary and secondary education were calculated using the last 21 editions of Projections of Education Statistics. Table D, below, shows the MAPEs for projections of current expenditures.Table D. Mean absolute percentage errors (MAPEs) of projections for total and per pupil current expenditures for public
elementary and secondary education, by lead time: 2012
Statistic
Lead time (years)
1 2 3 4 5 6 7 8 9 10
Total current expenditures 1.3 2.1 2.0 2.1 2.6 3.3 3.9 4.1 4.0 4.0Current expenditures per pupil in fall enrollment 1.3 2.1 2.0 2.0 2.9 3.6 4.3 4.6 5.2 5.2NOTE: Expenditures were in constant dollars based on the Consumer Price Index for all urban consumers, Bureau of Labor Statistics, U.S. Department of Labor. MAPEs for current expenditures were calculated using projections from the last 21 editions of Projections of Education Statistics containing current expenditure projections. Calculations were made using unrounded numbers. Some data have been revised from previously published figures.SOURCE: U.S. Department of Education, National Center for Education Statistics, Projections of Education Statistics, various issues. (This table was prepared February 2012.)
For more information about MAPEs, see Section A.0. Introduction, earlier in this appendix.

Projections of Education Statistics to 2021 117
Table A-15. Estimated equations and model statistics for current expenditures per pupil in fall enrollment for public elementary and secondary schools, and education revenue from state sources per capita
Dependent variable Equation1 R2
Breusch-Godfrey
Serial Correlation
LM test statistic2
Time period
Current expenditures per pupil
ln(CUREXP) = 2.51 (1.280)
+ 0.49ln(PCI) (2.551)
+ 0.18ln(SGRANT) (2.127)
+ 0.97AR(1) (35.854)
0.997 4.98 (0.08) 1973–74 to 2008–09
Education revenue from state sources per capita ln(SGRANT) =
1.03 (0.840) +
1.11ln(PCI) (20.129) +
0.74ln(ENRPOP) (4.280) +
0.56AR(1) (4.323) 0.989 1.63 (0.44)
1973–74 to 2008–09
1 AR(1) indicates that the model was estimated using least squares with the AR(1) process for correcting for first-order autocorrelation. To estimate the model, it was first transformed into a nonlinear model and then the coefficients were estimated simultaneously by applying a Marquardt nonlinear least squares algorithm to the transformed equation. For a general discussion of the problem of autocorrelation, and the method used to forecast in the presence of autocorrelation, see Judge, G., Hill, W., Griffiths, R., Lutkepohl, H., and Lee, T. The Theory and Practice of Econometrics, New York: John Wiley and Sons, 1985, pp. 315–318. Numbers in parentheses are t-statistics.2 The number in parentheses is the probability of the Chi-Square associated with the Breusch-Godfrey Serial Correlation LM Test. A p value greater than 0.05 implies that we do not reject the null hypothesis of no autocorrelation at the 5% significance level for a two-tailed test and the 10% significance level for a one-tailed test, i.e., there is no autocorrelation present. For an explanation of the Breusch-Godfrey Serial Correlation LM test statistic, see Greene, W. Econometric Analysis. New Jersey: Prentice-Hall, 2000.NOTE: R2 indicates the coefficient of determination. CUREXP = Current expenditures of public elementary and secondary schools per pupil in fall enrollment in constant 1982–84 dollars.SGRANT = Local governments’ education revenue from state sources, per capita, in constant 1982–84 dollars. PCI = Disposable income per capita in constant 2000 chained dollars. ENRPOP = Ratio of fall enrollment to the population. SOURCE: U.S. Department of Education, National Center for Education Statistics, Elementary and Secondary School Current Expenditures Model, 1973–74 through 2008–09; and Revenue Receipts from State Sources Model, 1973–74 through 2008–09. (This table was prepared March 2012.)

118 Appendix A: Introduction to Projection Methodology
A.5. ENROLLMENT IN POSTSECONDARY DEGREE-GRANTING INSTITUTIONS
Projections in this editionThis edition of Projections of Education Statistics presents projections of enrollment in postsecondary degree-granting institutions for fall 2011 through fall 2022. Three different models were used to produce these enrollment projections:
»
»
»
The Enrollment in Degree-Granting Institutions Model produced projections of enrollments by attendance status, level of student, level of institution, control of institution, sex, and age. It also produced projections of full-time-equivalent enrollments by level of student, level of institution, and control of institution.
The Enrollment in Degree-Granting Institutions by Race/Ethnicity Model produced projections of enrollments by race/ethnicity.
The First-Time Freshmen Model produced projections of enrollments of first-time freshmen by sex.
Overview of approach
Basic features of the three degree-granting enrollment models
The Enrollment in Degree-Granting Institutions Model is the primary model for projecting enrollment in postsecondary degree-granting institutions. For this model, enrollment rates by attendance status and sex are projected for various age categories using either the pooled seemingly unrelated regression method or the pooled seemingly unrelated regression method with a first-order autocorrelation correction. These rates are applied to projections of populations of the same sex and age to produce projections of enrollment by attendance status, sex, and age. To project enrollments by level of student, level of institution, and control of institution, rates for these characteristics are projected using single exponential smoothing and applied to enrollment projections previously produced by the model.
The Enrollment in Degree-Granting Institutions by Race/Ethnicity Model takes an approach similar to that of the Enrollment in Degree-Granting Institutions Model. Enrollment rates by attendance status, sex, and race/ethnicity are projected for the age categories using either the pooled seemingly unrelated regression method or the pooled seemingly unrelated regression method with a first-order autocorrelation correction. The resulting rates are iteratively corrected to ensure consistency with those projected by the Enrollment in Degree-Granting Institutions Model. The adjusted rates are then applied to projections of populations of the same sex, age, and race/ethnicity.
The First-Time Freshmen Enrollment in Degree-Granting Institutions Model uses single exponential smoothing to project the ratio of freshmen enrollment to undergraduate enrollment separately for males and for females. It then applies the projected ratios to the projections of undergraduate enrollment by sex that were produced by the Enrollment in Degree-Granting Institutions Model.
The Enrollment in Degree-Granting Institutions ModelThe Enrollment in Degree-Granting Institutions Model produces projections of enrollment counts by six levels of detail, as well as projections of full-time-equivalent enrollments by level of student, level of institution, and control of institution.
Steps used in the Enrollment in Degree-Granting Institutions Model
Step 1. Adjust age-specific enrollment counts from the U.S. Census Bureau to make them agree with the more highly aggregated NCES enrollment counts that do not include age. The Enrollment in Degree-Granting Institutions Model projects enrollments by six levels of detail: attendance status, level of student, level of institution, control of institution, sex, and age. While NCES does produce enrollment counts by the first five levels of detail, it does not produce data by the sixth level of detail, age, every year. However, the U.S. Census Bureau does produce age-specific enrollment counts.
In step 1, the age distributions from the Census Bureau counts for 1980 to 2010 were applied to the NCES counts to produce a set of enrollment data that breaks enrollments down by age while being consistent with NCES counts. Specifically, the most detailed level of Census Bureau data (by attendance status, level of student, level of institution, control of institution, sex, and age) was iteratively changed using proportions based on the more highly aggregated NCES enrollment numbers to ensure that all sums across this most detailed level of Census enrollment data equaled the more highly aggregated NCES enrollment totals that did not include age.
Projections of Education Statistics to 2021 119
Step 2. Calculate enrollment rates by attendance status, sex, and age category. The enrollment data were broken up into 14 age categories, with separate age categories for individual ages 14 through 24 as well as for the age groups 25 to 29, 30 to 34, and 35 and over. For each of the 14 age categories, 4 enrollment rates were calculated—part-time male, full-time male, part-time female, and full-time female—resulting in a total of 56 enrollment rates. Each of the 56 enrollment rates was calculated by dividing the enrollment count for that combination of attendance status, sex, and age category by the total population for the corresponding combination of sex and age category. For each combination of attendance and sex, the enrollment rate for the oldest age category was calculated by dividing the enrollment count for those 35 and over by the total population for those 35 to 44.
Step 3. Produce projections of enrollment rates by attendance status, sex, and age category. Enrollment rates for most of the age groups were projected using multiple linear regression. However, because enrollment in postsecondary degree-granting institutions is negligible for ages 14, 15, and 16, these ages were not included in the multiple linear regression models. Instead, projections for individual ages 14, 15, and 16 were produced by double exponential smoothing.
The following 11 age categories were modeled: individual ages 17 through 24 and age groups 25 to 29, 30 to 34, and 35 and over. For each of these age categories, enrollment rates by attendance status and sex were produced using 4 pooled time-series models—one for each combination of attendance status and sex. Each model was pooled across age categories. Each equation contained two independent variables, which were measures of
» »
disposable income; and
the unemployment rate.
Either the pooled seemingly unrelated regression method or the pooled seemingly unrelated regression method with a first-order autocorrelation correction was used to estimate each equation.
For more details on the equations used in step 3, the data used to estimate these equations, and their results, see tables A-16 through A-18 on pages 124–126.
Step 4. Produce projections of enrollments by attendance status, sex, and age category. For each combination of attendance status, sex, and age category, enrollment projections were produced by multiplying the projected enrollment rate for that combination by projections of the total population with the corresponding combination of sex and age category.
Step 5. Add two additional levels of detail—level of student and level of institution—to the projected enrollments by attendance status, sex, and age category. For this step, the 14 age categories used in the previous steps were collapsed into the following 8 categories: ages 14 to 16, 17, 18 and 19, 20 and 21, 22 to 24, 25 to 29, 30 to 34, and 35 and over. Step 5 can be broken into three parts:
First, the historic data were used to calculate the percentage distribution of enrollment by level of student and level of institution for each combination of attendance status, sex, and age category. Because it was assumed that there was no enrollment in 2-year institutions at the postbaccalaureate level, three combinations of student level and institution type were used: undergraduates at 4-year institutions, undergraduates at 2-year institutions, and postbaccalaureate students at 4-year institutions.
Second, for each combination of attendance status, sex, and age category, the percentage distribution by level of student and level of institution was projected using single exponential smoothing. A separate smoothing constant, chosen to minimize the sum of squared forecast errors, was used in each case. The percentages were then adjusted so the sum of the categories by attendance status, level of student, level of institution, sex, and age category would equal 100 percent.
For the projected percentage distributions from step 5 and the actual 2010 distributions, see tables A-19 and A-20 on pages 127–128.
Third, the projected distributions by level of student and type of institution were applied to the projected enrollments by attendance status, sex, and age category from step 4 to obtain the enrollment projections by attendance status, level of student, level of institution, sex, and age category.
Step 6. Add the sixth level of detail—control of institutions—to the projected enrollments in postsecondary degree-granting institutions. In this step, the data on enrollment by age category were not used. Control of institutions was added in the following manner:
First, the historic data were used to calculate the percentage of enrollment in public institutions for each combination of attendance status, level of student, level of institution, and sex.
Second, the percentages of enrollment in public institutions were projected using single exponential smoothing. A separate smoothing constant, chosen to minimize the sum of squared forecast errors, was used for each percentage.

120 Appendix A: Introduction to Projection Methodology
For the projected percentages from step 6 and the actual 2010 percentages, see table A-21 on page 128.
Third, the projected percentages were applied to the projected enrollments in each corresponding enrollment combination to obtain projections for public institutions by attendance status, level of student, level of institution, and sex.
Fourth, the projected enrollments for public institutions were subtracted from the total to produce the projected enrollments for private institutions.
Step 7. Produce projections of full-time-equivalent enrollment by level of student, level of institution, and control of institution. Full-time-equivalent enrollment represents total full-time and part-time enrollment as if it were enrollment on a full-time basis. It equals the sum of full-time enrollment plus the full-time-equivalent of part-time enrollment. Full-time-equivalent enrollment projections were produced in the following manner:
First, for each combination of level of student, level of institution, and control of institution, the historic data were used to calculate the full-time-equivalent of part-time enrollment as a percentage of part-time enrollment.
Second, for each combination of level of student, level of institution, and control of institution, the full-time equivalent of part-time enrollment as a percentage of part-time enrollment was projected using single exponential smoothing. A separate smoothing constant, chosen to minimize the sum of squared forecast errors, was used for each percentage.
Third, for each combination of level of student, level of institution, and control of institution, the projected percentages were applied to the projections of part-time enrollment to project the full-time equivalent of the part-time enrollment.
Fourth, the projections of full-time equivalents of part-time enrollment were added to projections of full-time enrollment to obtain projections of full-time-equivalent enrollment.
Data and equation results for the Enrollment in Degree-Granting Institutions Model
Enrollment data for postsecondary degree-granting institutions. Enrollment data for 1981 to 2010 by attendance status, level of student, level of institution, control of institution, and sex came from the NCES Integrated Postsecondary Education Data System (IPEDS). These are universe counts. The U.S. Census Bureau was the source for enrollment estimates for 1981 to 2010 by the characteristics listed above, as well as age of student.
Population data and projections. Population counts for 1980 to 2010 came from the U.S. Census Bureau. Population projections for 2011to 2021 are the Census Bureau’s 2008 National Population Projections of the population by sex and age (August 2008), ratio-adjusted to line up with the most recent historical estimates. For more information, see Section A.0. Introduction, earlier in this appendix.
Projections for economic variables. The economic variables used in developing these projections were from the “U.S. Monthly Model: January 2012 Short-Term Projections” from the economic consulting firm, IHS Global Insight.
Data and results for the equations. The following details for the equations are shown on pages 124–128:
»
»
»
»
Table A-16 shows enrollment rates by sex, attendance status, and age for fall 2010 and projected enrollment rates for fall 2016 and fall 2021.
Table A-17 shows the estimated equations and model statistics used to project enrollments for men by attendance status, and table A-18 shows the estimated equations and model statistics used to project enrollment rates for women by attendance status. The particular equations shown were selected on the basis of their statistical properties, such as coefficients of determination (R2s), the t-statistics of the coefficients, the Durbin-Watson statistic, the Breusch-Godfrey Serial Correlation LM test statistic, and residual plots.
Table A-19 shows actual and projected percentage distributions of full-time students, and table A-20 shows actual and projected percentage distributions of part-time students.
Table A-21 shows actual and projected data for enrollment in public degree-granting institutions as a percentage of total enrollment by sex, attendance status, student level, and level of institution.

Projections of Education Statistics to 2021 121
Accuracy of projections for the Enrollment in Degree-Granting Institutions Model
Mean absolute percentage errors (MAPEs) for enrollment in degree-granting institutions were calculated using the last 14 editions of Projections of Education Statistics. Table E, below, shows MAPEs for key projections of the Enrollment in Degree-Granting Institutions Model.
Table E. Mean absolute percentage errors (MAPEs) of projected enrollment in postsecondary degree-granting institutions, by lead time, sex, and level of institution: 2012
Statistic
Lead time (years)
1 2 3 4 5 6 7 8 9 10
Total enrollment 1.7 2.6 3.6 4.7 5.3 6.2 7.6 9.4 11.7 13.1Men 1.7 3.0 4.2 5.5 6.3 7.0 8.1 9.8 11.7 13.3Women 1.8 2.6 3.7 4.3 4.6 5.6 7.2 9.0 11.7 12.94-year institutions 1.8 3.0 4.0 5.4 6.0 7.0 8.5 10.6 13.1 14.82-year institutions 2.2 3.2 4.2 4.8 5.0 5.0 5.9 7.1 9.4 10.1
NOTE: MAPEs for degree-granting institution enrollments were calculated using the last 14 editions of Projections of Education Statistics. Calculations were made using unrounded numbers. Some data have been revised from previously published figures. SOURCE: U.S. Department of Education, National Center for Education Statistics, Projections of Education Statistics, various issues. (This table was prepared February 2012.)
For more information about MAPEs, see Section A.0. Introduction, earlier in this appendix.
The Enrollment in Degree-Granting Institutions by Race/Ethnicity ModelThe Enrollment in Degree-Granting Institutions by Race/Ethnicity Model projects enrollments in degree-granting institutions by attendance status, sex, age, and race/ethnicity. The following groups are projected in this model:
» » » » » »
White;
Black;
Hispanic;
Asian/Pacific Islander;
American Indian/Alaska Native; and
nonresident alien.
See the glossary for definitions of the five racial/ethnic categories and the nonresident alien category. (The race/ethnicity of nonresident aliens is unknown, but they are considered a separate group for purposes of this analysis.)
Steps used in the Degree-Granting Institutions by Race/Ethnicity Model
Step 1. Adjust U.S. Census Bureau enrollment counts by attendance status, sex, age, and race/ethnicity to make them sum to NCES enrollment counts by attendance status, sex, and race/ethnicity. For 1981 to 2010, the most detailed levels of Census Bureau enrollment data (by enrollment status, sex, age, and race/ethnicity) were iteratively changed using proportions that were based on the more highly aggregated NCES enrollment numbers to ensure that the sums across these most detailed levels of enrollment data equaled the more highly aggregated NCES enrollment numbers that did not include age.
Step 2. Calculate enrollment rates by attendance status, sex, age category, and race/ethnicity. The enrollment data were broken up into 14 age categories, with separate age categories for individual ages 14 through 24 as well as for the age groups 25 to 29, 30 to 34, and 35 and over. For each of the 14 age categories, enrollment rates were calculated for each combination of attendance status, sex, and the six racial/ethnic groups, resulting in a total of 336 enrollment rates. Each of the 336 enrollment rates was calculated by dividing the enrollment count for that combination of attendance status, sex, age category, and race/ethnicity by the total population for the corresponding combination of sex, age category, and race/ethnicity. For each combination of attendance status, sex and racial/ethnic group, the enrollment rate for the oldest age category was calculated by dividing the enrollment count for those 35 and over by the total population for those 35 to 44.
122 Appendix A: Introduction to Projection Methodology
Step 3. Produce projections of enrollment rates by attendance status, sex, age category, and race/ethnicity. Enrollment rates for most of the age groups and racial/ethnic groups were projected using multiple linear regression. However, there were several exceptions:
»
»
»
Due to negligible enrollments for ages 14, 15, and 16, these ages were not included in the multiple linear regression models. Instead, projections of enrollment rates for individual ages 14, 15, and 16 were produced by single exponential smoothing. Due to the relatively large fluctuations in the historical enrollment rates resulting from small sample sizes, American Indian/Alaska Native enrollments were projected using single exponential smoothing.Since there were no applicable population counts to compute enrollment rates for non-resident aliens, their enrollments were projected using patterns in recent historical growth.
Four racial/ethnic groups were modeled: White, Black, Hispanic, and Asian/Pacific Islander. Eleven age categories were modeled: individual ages 17 through 24 and age groups 25 to 29, 30 to 34, and 35 to 44. For each of the age categories, projected enrollment rates by attendance status, sex, and race/ethnicity were produced using 16 pooled time-series models—one for each combination of attendance status, sex, and the four racial/ethnic groups. Each equation included variables measuring
» » »
recent trends; economic conditions (such as disposable income); and demographic changes.
For more information on the equations used to project enrollment rates for the combinations of attendance status, sex, and race/ethnicity, see tables A-22 through A-29, under “Data and equations used for the Enrollment in Degree-Granting Institutions by Race/Ethnicity Model,” below.
The final set of projected rates by attendance status, sex, age, and race/ethnicity were controlled to enrollment rates by attendance status, sex, and age produced by the Enrollment in Degree-Granting Institutions Model to ensure consistency across models.
Step 4. Produce projections of enrollments by attendance status, sex, age category, and race/ethnicity. For each combination of attendance status, sex, age category, and race/ethnicity, enrollment projections were produced by multiplying the projected enrollment rate for that combination by projections of the total population with the corresponding combination of sex, age category, and race/ethnicity.
Data and equations used for the Enrollment in Degree-Granting Institutions by Race/Ethnicity Model
Enrollment data for degree-granting institutions by race/ethnicity. Enrollment data for 1981 to 2010 by attendance status, sex, and race/ethnicity came from the NCES Integrated Postsecondary Education Data System (IPEDS). These are universe counts. The U.S. Census Bureau, Current Population Survey was the source for enrollment estimates for 1981 to 2010 by the characteristics listed above, as well as age of student.
Population data and projections by race/ethnicity. Population counts for 1981 to 2010 came from the U.S. Census Bureau, Population Estimates series. Population projections for 2011 to 2021 are the Census Bureau’s 2008 National Population Projections of the population by sex, age and race/ethnicity (August 2008), ratio-adjusted to line up with most recent historical estimates.
Projections for economic variables. The economic variables used in developing these projections were from the “U.S. Monthly Model: January 2012 Short-Term Projections” from the economic consulting firm, IHS Global Insight.
Estimated equations and model statistics. Tables A-22 through A-29 show the estimated equations and model statistics used to project enrollment rates for the various combinations of attendance status, sex, and race/ethnicity.

Projections of Education Statistics to 2021 123
Accuracy of projections for the Degree-Granting Institutions by Race/Ethnicity Model
Mean absolute percentage errors (MAPEs) for enrollment in degree-granting institutions by race/ethnicity were calculated using the last six editions of Projections of Education Statistics. Table F, below, shows MAPEs for key projections of the Enrollment in Degree-Granting Institutions by Race/Ethnicity Model.
Table F. Mean absolute percentage errors (MAPEs) of projected enrollment in postsecondary degree-granting institutions, by lead time and race/ethnicity: 2012
Statistic
Lead time (years)
1 2 3 4 5 6 7 8 9 10
Total enrollment 1.7 2.6 3.6 4.7 5.3 6.2 7.6 9.4 11.7 13.1White 1.1 2.4 3.9 5.5 6.7 7.4 — — — —Black 4.2 8.8 12.5 15.8 19.0 20.5 — — — —Hispanic 4.2 8.6 12.1 15.5 18.9 22.1 — — — —Asian/Pacific Islander 2.6 5.0 5.7 7.0 6.0 4.7 — — — —American Indian/Alaska Native 5.2 4.1 5.6 3.3 2.4 5.0 — — — —Nonresident alien 2.7 4.8 7.8 9.5 7.3 2.1 — — — —
— Not available. NOTE: MAPEs for total postsecondary degree-granting institution enrollments were calculated using the last 14 editions of Projections of Education Statistics, and MAPEs for degree-granting institution enrollments were calculated using the last six editions of Projections of Education Statistics. Calculations were made using unrounded numbers. Some data have been revised from previously published figures. SOURCE: U.S. Department of Education, National Center for Education Statistics, Projections of Education Statistics, various issues. (This table was prepared February 2012.)
The First-Time Freshmen Enrollment in Degree-Granting Institutions ModelThe First-Time Freshmen Enrollment in Degree-Granting Institutions Model produced projections of first-time freshmen enrollment in degree-granting institutions by sex.
Steps used in the First-Time Freshmen Enrollment in Degree-Granting Institutions Model
The projections were produced in the following manner:
Step 1. Calculate the ratio of first-time freshmen enrollment to undergraduate enrollment. For 1975 to 2010, the ratio of first-time freshmen enrollment to undergraduate enrollment was calculated for males and females.
Step 2. Project the ratio of first-time freshmen enrollment to undergraduate enrollment. The percentages of undergraduate enrollment for both males and females were projected using single exponential smoothing. A separate smoothing constant, chosen to minimize the sum of squared forecast errors, was used for each percentage.
Step 3. Apply the projected ratio to projected undergraduate enrollment. The projected ratios were applied to projections of undergraduate enrollment by sex from the Enrollment in Degree-Granting Institutions Model to yield projections of first-time freshmen enrollment.
Assumptions underlying this method
This method assumes that the future pattern in the trend of first-time freshmen enrollment will be the same as that for undergraduate enrollment.
Data used in the First-Time Freshmen Enrollment in Degree-Granting Institutions Model
Undergraduate and freshmen enrollment data for degree-granting institutions. Undergraduate and freshmen enrollment data by sex for 1975 to 2010 came from the NCES Integrated Postsecondary Education Data System (IPEDS).
Projections of undergraduate enrollment. Projections of undergraduate enrollment by sex came from the Enrollment in Degree-Granting Institutions Model, discussed earlier in this section of appendix A.
Accuracy of projections for the First-Time Freshmen Enrollment Model
Because this is the fourth edition of Projections of Education Statistics to include projections of first-time freshmen, there are too few years of data to present the MAPEs.

124 Appendix A: Introduction to Projection Methodology
Table A-16. Actual and projected numbers for enrollment rates of all students at postsecondary degree-granting institutions, by sex, attendance status, and age: Fall 2010, fall 2016, and fall 2021
Sex, attendance status, and age Actual 2010
Projected
2016 2021
MenFull-time
16 years old 0.2 0.2 0.217 years old 2.2 2.2 2.318 years old 31.1 31.6 32.519 years old 39.6 41.5 42.520 years old 36.8 38.0 38.921 years old 34.7 35.4 36.322 years old 23.5 25.5 26.223 years old 16.5 17.8 18.424 years old 13.9 14.8 15.325 to 29 years old 6.1 6.2 6.430 to 34 years old 2.8 2.9 3.035 to 44 years old 1.8 1.8 1.9
Part-time16 years old 0.4 0.4 0.417 years old 1.1 1.1 1.118 years old 6.4 6.4 6.419 years old 7.5 7.4 7.420 years old 9.6 10.2 10.221 years old 9.2 10.0 10.022 years old 6.6 6.5 6.623 years old 7.9 7.9 7.924 years old 7.8 7.8 7.925 to 29 years old 6.2 6.8 6.930 to 34 years old 3.9 3.9 4.035 to 44 years old 4.2 4.4 4.4
WomenFull-time
16 years old 0.6 0.6 0.617 years old 3.8 4.3 4.618 years old 42.5 49.0 50.519 years old 48.2 51.0 52.320 years old 42.7 44.6 46.021 years old 38.8 40.7 42.022 years old 27.7 29.4 30.723 years old 22.3 23.8 24.924 years old 15.7 16.9 17.725 to 29 years old 7.9 8.6 9.130 to 34 years old 4.3 3.7 3.935 to 44 years old 3.5 3.9 4.1
Part-time16 years old 0.3 0.3 0.317 years old 0.3 0.4 0.418 years old 7.4 7.3 7.519 years old 11.4 11.7 12.020 years old 10.9 11.4 11.821 years old 11.3 11.8 12.222 years old 9.4 10.0 10.523 years old 10.6 11.3 11.824 years old 9.9 10.7 11.225 to 29 years old 8.3 9.0 9.530 to 34 years old 6.0 6.6 7.035 to 44 years old 8.4 9.7 10.3
SOURCE: U.S. Department of Education, National Center for Education Statistics, Integrated Postsecondary Education Data System, Spring 2010; Enrollment in Degree-Granting Institutions Model, 1980–2010; and U.S. Department of Commerce, Census Bureau, Current Population Reports, “Social and Economic Characteristics of Students,” 2010. (This table was prepared February 2012.)

Projections of Education Statistics to 2021 125
Table A-17. Estimated equations and model statistics for full-time and part-time enrollment rates of men at postsecondary degree-granting institutions
Independent variable Coefficient Standard error t-statistic R2 D.W. statistic
Full-timeIntercept term for 17-year-olds -7.66 0.324 -23.64 1.00 1.9*Intercept term for 18-year-olds -4.73 0.284 -16.63Intercept term for 19-year-olds -4.34 0.255 -17.02Intercept term for 20-year-olds -4.40 0.258 -17.07Intercept term for 21-year-olds -4.55 0.257 -17.69Intercept term for 22-year-olds -4.99 0.261 -19.12Intercept term for 23-year-olds -5.48 0.258 -21.24Intercept term for 24-year-olds -5.81 0.277 -20.98Intercept term for 25- to 29-year-olds -6.51 0.262 -24.87Intercept term for 30- to 34-year-olds -7.47 0.295 -25.33Intercept term for 35- to 44-year-olds -7.95 0.298 -26.65Log of three-period weighted average of per capita
disposable income in 2000 dollars, using the present period and the previous two periods 0.70 0.043 16.23
Log of age-specific unemployment rate for men 0.22 0.022 10.07Autocorrelation coefficient for 17-year-olds 0.88 0.044 19.85Autocorrelation coefficient for 18-year-olds 0.90 0.043 21.05Autocorrelation coefficient for 19-year-olds 0.39 0.141 2.77Autocorrelation coefficient for 20-year-olds 0.61 0.118 5.15Autocorrelation coefficient for 21-year-olds 0.58 0.144 4.04Autocorrelation coefficient for 22-year-olds 0.77 0.105 7.30Autocorrelation coefficient for 23-year-olds 0.64 0.122 5.30Autocorrelation coefficient for 24-year-olds 0.85 0.103 8.28Autocorrelation coefficient for 25- to 29-year-olds 0.71 0.076 9.34Autocorrelation coefficient for 30- to 34-year-olds 0.90 0.069 12.97Autocorrelation coefficient for 35- to 44-year-olds 0.87 0.071 12.31
Part-timeIntercept term for 17-year-olds -8.16 0.375 -21.79 0.99 1.9*Intercept term for 18-year-olds -5.79 0.324 -17.88Intercept term for 19-year-olds -5.32 0.387 -13.77Intercept term for 20-year-olds -5.26 0.327 -16.08Intercept term for 21-year-olds -5.40 0.313 -17.23Intercept term for 22-year-olds -5.61 0.329 -17.04Intercept term for 23-year-olds -5.61 0.312 -17.99Intercept term for 24-year-olds -5.65 0.312 -18.12Intercept term for 25- to 29-year-olds -6.07 0.328 -18.52Intercept term for 30- to 34-year-olds -6.53 0.321 -20.32Intercept term for 35- to 44-year-olds -6.47 0.314 -20.63Log of three-period weighted average of per capita
disposable income in 2000 dollars, using the present period and the previous two periods 0.48 0.051 9.44
Log of unemployment rate 0.18 0.021 8.38Autocorrelation coefficient for 17-year-olds 0.72 0.109 6.57Autocorrelation coefficient for 18-year-olds 0.78 0.086 9.07Autocorrelation coefficient for 19-year-olds 0.91 0.058 15.69Autocorrelation coefficient for 20-year-olds 0.81 0.092 8.87Autocorrelation coefficient for 21-year-olds 0.58 0.088 6.57Autocorrelation coefficient for 22-year-olds 0.80 0.080 10.11Autocorrelation coefficient for 23-year-olds 0.47 0.099 4.73Autocorrelation coefficient for 24-year-olds 0.51 0.110 4.66Autocorrelation coefficient for 25- to 29-year-olds 0.87 0.043 20.20Autocorrelation coefficient for 30- to 34-year-olds 0.87 0.041 21.38Autocorrelation coefficient for 35- to 44-year-olds 0.63 0.061 10.36* p < .05.NOTE: R2 = Coefficient of determination. D.W. statistic = Durbin-Watson statistic, a test for autocorrelation among regression residuals. For more details see Johnston, J., and Dinardo, J. (1996). Econometric Methods, New York: McGraw-Hill. The regression method used to estimate the full-time and part-time equations was the pooled seemingly unrelated regression method with a first-order autocorrelation correction. The time period used to estimate both equations is from 1981 to 2010 and the number of observations is 330 after the correction for autocorrelation. For additional information, see Intriligator, M. D. (1978). Econometric Models, Techniques, & Applications. New Jersey: Prentice-Hall, Inc., pp. 165–173.SOURCE: U.S. Department of Education, National Center for Education Statistics, Enrollment in Degree-Granting Institutions Model, 1980–2010. (This table was prepared February 2012.)

126 Appendix A: Introduction to Projection Methodology
Table A-18. Estimated equations and model statistics for full-time and part-time enrollment rates of women at postsecondary degree-granting institutions
Independent variable Coefficient Standard error t-statistic R2 D.W. statistic
Full-timeIntercept term for 17-year-olds -9.56 0.158 -60.53 1.00 1.25~Intercept term for 18-year-olds -6.78 0.139 -48.90Intercept term for 19-year-olds -6.64 0.133 -49.80Intercept term for 20-year-olds -6.73 0.134 -50.15Intercept term for 21-year-olds -6.95 0.134 -51.71Intercept term for 22-year-olds -7.60 0.136 -55.88Intercept term for 23-year-olds -8.10 0.138 -58.60Intercept term for 24-year-olds -8.48 0.139 -60.98Intercept term for 25- to 29-year-olds -9.05 0.141 -64.01Intercept term for 30- to 34-year-olds -9.75 0.139 -69.92Intercept term for 35- to 44-year-olds -9.97 0.140 -71.25Log of three-period weighted average of per capita
disposable income in 2000 dollars, using the present period and the previous two periods 1.20 0.026 46.79
Log of age-specific unemployment rate for women 0.33 0.035 9.36
Part-timeIntercept term for 17-year-olds -11.54 0.567 -20.37 0.99 1.86*Intercept term for 18-year-olds -8.71 0.313 -27.83Intercept term for 19-year-olds -8.17 0.302 -27.06Intercept term for 20-year-olds -8.33 0.299 -27.89Intercept term for 21-year-olds -8.35 0.294 -28.37Intercept term for 22-year-olds -8.53 0.295 -28.90Intercept term for 23-year-olds -8.59 0.297 -28.96Intercept term for 24-year-olds -8.66 0.300 -28.87Intercept term for 25- to 29-year-olds -9.08 0.306 -29.62Intercept term for 30- to 34-year-olds -9.51 0.305 -31.22Intercept term for 35- to 44-year-olds -9.16 0.308 -29.79Log of three-period weighted average of per capita
disposable income in 2000 dollars, using the present period and the previous two periods 1.04 0.047 22.03
Log of unemployment rate 0.17 0.023 7.15Autocorrelation coefficient for 17-year-olds 0.85 0.070 12.16Autocorrelation coefficient for 18-year-olds 0.78 0.079 9.87Autocorrelation coefficient for 19-year-olds 0.77 0.075 10.34Autocorrelation coefficient for 20-year-olds 0.65 0.105 6.18Autocorrelation coefficient for 21-year-olds 0.33 0.128 2.58Autocorrelation coefficient for 22-year-olds 0.49 0.097 5.04Autocorrelation coefficient for 23-year-olds 0.55 0.075 7.32Autocorrelation coefficient for 24-year-olds 0.75 0.061 12.30Autocorrelation coefficient for 25- to 29-year-olds 0.87 0.035 25.13Autocorrelation coefficient for 30- to 34-year-olds 0.89 0.025 35.24Autocorrelation coefficient for 35- to 44-year-olds 0.89 0.027 32.56
* p < .05. ~ Inconclusive.NOTE: R2 = Coefficient of determination. D.W. statistic = Durbin-Watson statistic, a test for autocorrelation among regression residuals. For more details see Johnston, J., and Dinardo, J. (1996). Econometric Methods. New York: McGraw-Hill.The regression method used to estimate the full-time equation was the pooled seemingly unrelated regression method. The regression method used to estimate the part-time equation was the pooled seemingly unrelated regression method with a first-order autocorrelation correction. The time period used to estimate the full-time equation was from 1980 to 2010 and that for the part-time equation was from 1981 to 2010. The number of observations for the full-time equation is 341 and the number of observations for the part-time equation, after the correction for autocorrelation, is 330. For additional information, see Intriligator, M.D. (1978). Econometric Models, Techniques, & Applications. New Jersey: Prentice-Hall, Inc., pp. 165–173.SOURCE: U.S. Department of Education, National Center for Education Statistics, Enrollment in Degree-Granting Institutions Model, 1980–2010. (This table was prepared February 2012.)

Projections of Education Statistics to 2021 127
Table A-19. Actual and projected percentages of full-time students at postsecondary degree-granting institutions, by sex, age group, student level, and level of institution: Fall 2010, and fall 2011 through fall 2021
Age group, student level, and level of institution
Men Women
Actual 2010Projected 2011
through 2021 Actual 2010Projected 2011
through 2021
18 and 19 years oldUndergraduate, 4-year institutions 64.8 65.4 68.0 67.7Undergraduate, 2-year institutions 34.2 34.0 31.8 32.0Postbaccalaureate, 4-year institutions 1.0 0.5 0.2 0.3
20 and 21 years oldUndergraduate, 4-year institutions 76.1 77.2 78.2 78.5Undergraduate, 2-year institutions 20.6 20.9 20.0 19.6Postbaccalaureate, 4-year institutions 3.3 1.9 1.8 1.9
22 to 24 years oldUndergraduate, 4-year institutions 61.2 61.0 59.2 59.1Undergraduate, 2-year institutions 19.9 19.9 18.8 18.7Postbaccalaureate, 4-year institutions 18.9 19.1 22.0 22.1
25 to 29 years oldUndergraduate, 4-year institutions 40.8 40.1 40.1 40.1Undergraduate, 2-year institutions 23.9 22.1 26.6 26.6Postbaccalaureate, 4-year institutions 35.4 37.8 33.3 33.3
30 to 34 years oldUndergraduate, 4-year institutions 41.4 41.3 44.5 44.5Undergraduate, 2-year institutions 27.0 27.0 30.0 30.0Postbaccalaureate, 4-year institutions 31.6 31.7 25.4 25.4
35 years old and overUndergraduate, 4-year institutions 48.4 48.1 43.5 43.6Undergraduate, 2-year institutions 26.0 25.8 32.6 32.7Postbaccalaureate, 4-year institutions 25.5 26.1 23.9 23.8
NOTE: Detail may not sum to totals because of rounding. Some data have been revised from previously published figures.SOURCE: U.S. Department of Education, National Center for Education Statistics, Integrated Postsecondary Education Data System, Spring 2011; Enrollment in Degree-Granting Institutions Model, 1980–2010; and U.S. Department of Commerce, Census Bureau, Current Population Reports, “Social and Economic Characteristics of Students,” 2010. (This table was prepared February 2012.)

128 Appendix A: Introduction to Projection Methodology
Table A-20. Actual and projected percentages of part-time students at postsecondary degree-granting institutions, by sex, age group, student level, and level of institution: Fall 2010, and fall 2011 through fall 2021
Age group, student level, and level of institution
Men Women
Actual 2010Projected 2011
through 2021 Actual 2010Projected 2011
through 2021
18 and 19 years oldUndergraduate, 4-year institutions 19.6 19.5 24.5 24.5Undergraduate, 2-year institutions 80.3 80.0 74.9 75.0Postbaccalaureate, 4-year institutions # 0.5 0.6 0.5
20 and 21 years oldUndergraduate, 4-year institutions 24.9 24.8 24.6 24.7Undergraduate, 2-year institutions 75.2 74.5 74.3 74.2Postbaccalaureate, 4-year institutions # 0.7 1.1 1.1
22 to 24 years oldUndergraduate, 4-year institutions 31.8 31.8 36.3 36.3Undergraduate, 2-year institutions 58.1 58.2 51.5 51.4Postbaccalaureate, 4-year institutions 10.0 9.9 12.2 12.3
25 to 29 years oldUndergraduate, 4-year institutions 32.7 32.7 32.3 32.3Undergraduate, 2-year institutions 49.2 49.2 48.3 48.3Postbaccalaureate, 4-year institutions 18.1 18.1 19.5 19.4
30 to 34 years oldUndergraduate, 4-year institutions 36.9 36.9 29.3 29.3Undergraduate, 2-year institutions 41.3 41.3 47.9 47.9Postbaccalaureate, 4-year institutions 21.8 21.8 22.8 22.8
35 years old and overUndergraduate, 4-year institutions 27.0 27.0 27.4 27.4Undergraduate, 2-year institutions 45.9 46.1 47.9 47.9Postbaccalaureate, 4-year institutions 27.2 26.9 24.7 24.7
# Rounds to zero.NOTE: Detail may not sum to totals because of rounding. Some data have been revised from previously published figures.SOURCE: U.S. Department of Education, National Center for Education Statistics, Integrated Postsecondary Education Data System, Spring 2011; Enrollment in Degree-Granting Institutions Model, 1981–2010; and U.S. Department of Commerce, Census Bureau, Current Population Reports, “Social and Economic Characteristics of Students,” 2010. (This table was prepared February 2012.)
Table A-21. Actual and projected enrollment in public postsecondary degree-granting institutions as a percent of total postsecondary enrollment, by sex, attendance status, student level, and level of institution: Fall 2010, and fall 2011 through fall 2021
Attendance status, student level, and level of institution
Men Women
Actual 2010Projected 2011
through 2021 Actual 2010Projected 2011
through 2021
Full-time, undergraduate, 4-year institutions 64.8 64.8 60.4 60.4Part-time, undergraduate, 4-year institutions 65.2 65.2 60.6 60.6Full-time, undergraduate, 2-year institutions 90.5 90.5 85.6 85.6Part-time, undergraduate, 2-year institutions 99.3 99.2 98.5 98.6Full-time, postbaccalaureate, 4-year institutions 49.0 49.0 45.6 45.6Part-time, postbaccalaureate, 4-year institutions 51.2 51.2 51.3 51.3
SOURCE: U.S. Department of Education, National Center for Education Statistics, Integrated Postsecondary Education Data System, Spring 2011; and Enrollment in Degree-Granting Institutions Model, 1980–2010. (This table was prepared February 2012.)

Projections of Education Statistics to 2021 129
Table A-22. Estimated equations and model statistics for full-time and part-time enrollment rates of White men at postsecondary degree-granting institutions
Independent variable Coefficient Standard error t-statistic R2 D.W. statistic
Full-timeIntercept term for 17-year-olds -9.36 0.203 -46.08 1.00 1.45~Intercept term for 18-year-olds -6.33 0.187 -33.95Intercept term for 19-year-olds -6.10 0.183 -33.36Intercept term for 20-year-olds -6.28 0.184 -34.19Intercept term for 21-year-olds -6.42 0.183 -35.01Intercept term for 22-year-olds -6.91 0.183 -37.67Intercept term for 23-year-olds -7.47 0.183 -40.72Intercept term for 24-year-olds -7.88 0.186 -42.41Intercept term for 25- to 29-year-olds -8.73 0.184 -47.47Intercept term for 30- to 34-year-olds -9.77 0.187 -52.39Intercept term for 35- to 44-year-olds -10.40 0.187 -55.53Log of White per capita disposable
income in current dollars 0.29 0.009 31.22
Part-timeIntercept term for 17-year-olds -5.04 0.150 -33.54 0.94 1.48~Intercept term for 18-year-olds -1.72 0.083 -20.71Intercept term for 19-year-olds -1.33 0.097 -13.75Intercept term for 20-year-olds -1.30 0.084 -15.33Intercept term for 21-year-olds -1.33 0.086 -15.42Intercept term for 22-year-olds -1.53 0.082 -18.55Intercept term for 23-year-olds -1.56 0.079 -19.83Intercept term for 24-year-olds -1.57 0.079 -19.92Intercept term for 25- to 29-year-olds -1.89 0.078 -24.16Intercept term for 30- to 34-year-olds -2.34 0.081 -28.97Intercept term for 35- to 44-year-olds -2.39 0.077 -30.93Log of real total private compensation
employment cost index 1.16 0.100 11.66
~ Inconclusive.NOTE: R2 = Coefficient of determination. D.W. statistic = Durbin-Watson statistic, a test for autocorrelation among regression residuals. For more details see Johnston, J., and Dinardo, J. (1996). Econometric Methods. New York: McGraw-Hill. The regression method used to estimate the full-time and part-time equations was the pooled seemingly unrelated regression method. The time period used to estimate the equations is from 1980 to 2010. The number of observations is 341. For additional information, see Intriligator, M. D. (1978). Econometric Models, Techniques, & Applications. New Jersey: Prentice-Hall, Inc., pp. 165–173. Race categories exclude persons of Hispanic ethnicity. SOURCE: U.S. Department of Education, National Center for Education Statistics, Enrollment in Degree-Granting Institutions by Race/Ethnicity Model, 1980–2010. (This table was prepared February 2012.)

130 Appendix A: Introduction to Projection Methodology
Table A-23. Estimated equations and model statistics for full-time and part-time enrollment rates of White women at postsecondary degree-granting institutions
Independent variable Coefficient Standard error t-statistic R2 D.W. statistic
Full-timeIntercept term for 17-year-olds -14.04 0.251 -56.04 1.00 1.46~Intercept term for 18-year-olds -11.07 0.233 -47.51Intercept term for 19-year-olds -10.94 0.230 -47.58Intercept term for 20-year-olds -11.18 0.230 -48.61Intercept term for 21-year-olds -11.44 0.231 -49.61Intercept term for 22-year-olds -12.17 0.231 -52.60Intercept term for 23-year-olds -12.74 0.233 -54.77Intercept term for 24-year-olds -13.13 0.233 -56.40Intercept term for 25- to 29-year-olds -13.93 0.232 -60.15Intercept term for 30- to 34-year-olds -14.65 0.231 -63.45Intercept term for 35- to 44-year-olds -14.84 0.231 -64.14Log of White per capita disposable
income in current dollars 0.56 0.012 47.26
Part-timeIntercept term for 17-year-olds -9.50 0.352 -26.95 0.78 1.51*Intercept term for 18-year-olds -6.18 0.306 -20.19Intercept term for 19-year-olds -5.74 0.308 -18.63Intercept term for 20-year-olds -5.82 0.307 -18.94Intercept term for 21-year-olds -5.90 0.306 -19.29Intercept term for 22-year-olds -6.09 0.305 -19.98Intercept term for 23-year-olds -6.14 0.305 -20.11Intercept term for 24-year-olds -6.17 0.305 -20.26Intercept term for 25- to 29-year-olds -6.49 0.304 -21.38Intercept term for 30- to 34-year-olds -6.82 0.305 -22.36Intercept term for 35- to 44-year-olds -6.51 0.304 -21.41Log of real total private compensation
employment cost index 0.20 0.016 12.99
* p < .05. ~ Inconclusive.NOTE: R2 = Coefficient of determination. D.W. statistic = Durbin-Watson statistic, a test for autocorrelation among regression residuals. For more details see Johnston, J., and Dinardo, J. (1996). Econometric Methods. New York: McGraw-Hill. The regression method used to estimate the full-time and part-time equations was the pooled seemingly unrelated regression method. The time period used to estimate the equations is from 1980 to 2010. The number of observations is 341. For additional information, see Intriligator, M. D. (1978). Econometric Models, Techniques, & Applications. New Jersey: Prentice-Hall, Inc., pp. 165–173. Race categories exclude persons of Hispanic ethnicity. SOURCE: U.S. Department of Education, National Center for Education Statistics, Enrollment in Degree-Granting Institutions by Race/Ethnicity Model, 1980–2010. (This table was prepared February 2012.)

Projections of Education Statistics to 2021 131
Table A-24. Estimated equations and model statistics for full-time and part-time enrollment rates of Black men at postsecondary degree-granting institutions
Independent variable Coefficient Standard error t-statistic R2 D.W. statistic
Full-timeIntercept term for 17-year-olds -10.69 0.668 -16.01 0.96 1.80*Intercept term for 18-year-olds -8.41 0.663 -12.69Intercept term for 19-year-olds -8.15 0.662 -12.31Intercept term for 20-year-olds -8.23 0.662 -12.42Intercept term for 21-year-olds -8.48 0.663 -12.78Intercept term for 22-year-olds -8.67 0.663 -13.07Intercept term for 23-year-olds -9.14 0.666 -13.73Intercept term for 24-year-olds -9.43 0.664 -14.20Intercept term for 25- to 29-year-olds -10.21 0.664 -15.38Intercept term for 30- to 34-year-olds -11.00 0.667 -16.49Intercept term for 35- to 44-year-olds -11.35 0.666 -17.06Log of Black per capita disposable
income in current dollars 0.37 0.036 10.30
Part-timeIntercept term for 17-year-olds -11.10 0.546 -20.33 0.62 1.86*Intercept term for 18-year-olds -10.22 0.563 -18.15Intercept term for 19-year-olds -9.41 0.550 -17.11Intercept term for 20-year-olds -9.31 0.550 -16.93Intercept term for 21-year-olds -9.31 0.543 -17.14Intercept term for 22-year-olds -9.40 0.551 -17.05Intercept term for 23-year-olds -9.60 0.556 -17.26Intercept term for 24-year-olds -9.62 0.556 -17.29Intercept term for 25- to 29-year-olds -9.69 0.543 -17.87Intercept term for 30- to 34-year-olds -9.94 0.541 -18.37Intercept term for 35- to 44-year-olds -10.00 0.539 -18.55Log of Black per capita disposable
income in current dollars 0.35 0.029 11.97
* p < .05. NOTE: R2 = Coefficient of determination. D.W. statistic = Durbin-Watson statistic, a test for autocorrelation among regression residuals. For more details see Johnston, J., and Dinardo, J. (1996). Econometric Methods. New York: McGraw-Hill. The regression method used to estimate the full-time and part-time equations was the pooled seemingly unrelated regression method. The time period used to estimate the equations is from 1980 to 2010. The number of observations is 341. For additional information, see Intriligator, M. D. (1978). Econometric Models, Techniques, & Applications. New Jersey: Prentice-Hall, Inc., pp. 165–173. Race categories exclude persons of Hispanic ethnicity.SOURCE: U.S. Department of Education, National Center for Education Statistics, Enrollment in Degree-Granting Institutions by Race/Ethnicity Model, 1980–2010. (This table was prepared February 2012.)
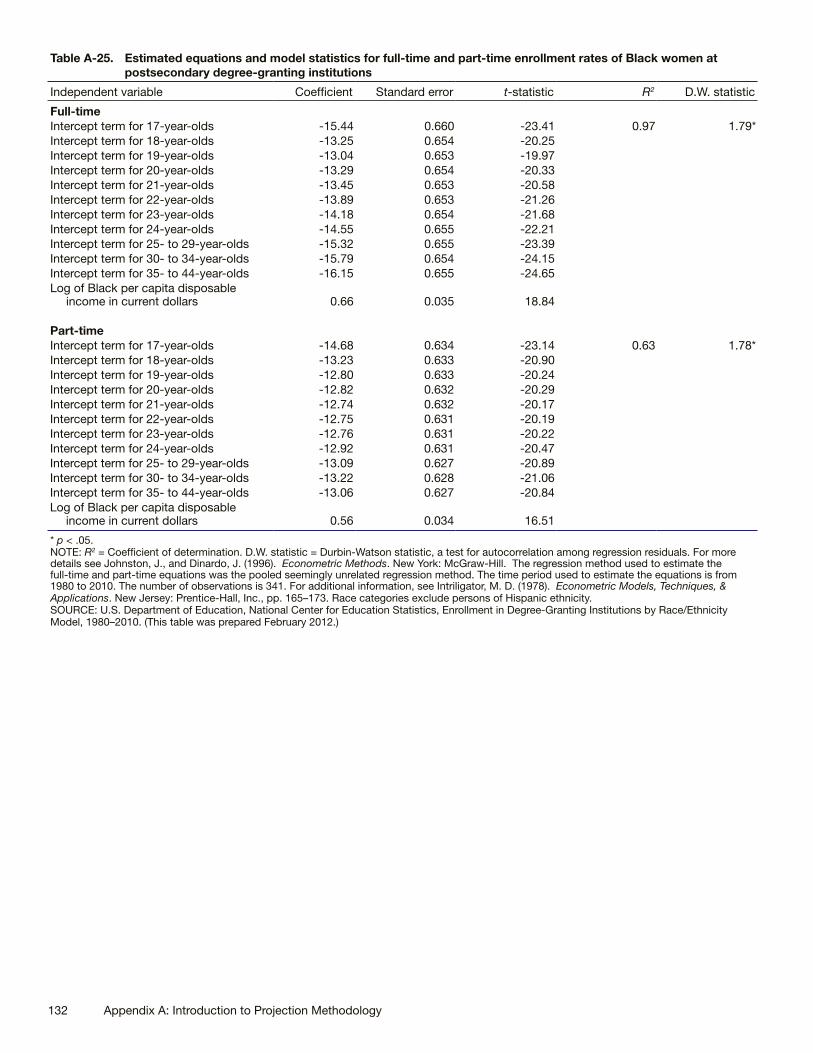
132 Appendix A: Introduction to Projection Methodology
Table A-25. Estimated equations and model statistics for full-time and part-time enrollment rates of Black women at postsecondary degree-granting institutions
Independent variable Coefficient Standard error t-statistic R2 D.W. statistic
Full-timeIntercept term for 17-year-olds -15.44 0.660 -23.41 0.97 1.79*Intercept term for 18-year-olds -13.25 0.654 -20.25Intercept term for 19-year-olds -13.04 0.653 -19.97Intercept term for 20-year-olds -13.29 0.654 -20.33Intercept term for 21-year-olds -13.45 0.653 -20.58Intercept term for 22-year-olds -13.89 0.653 -21.26Intercept term for 23-year-olds -14.18 0.654 -21.68Intercept term for 24-year-olds -14.55 0.655 -22.21Intercept term for 25- to 29-year-olds -15.32 0.655 -23.39Intercept term for 30- to 34-year-olds -15.79 0.654 -24.15Intercept term for 35- to 44-year-olds -16.15 0.655 -24.65Log of Black per capita disposable
income in current dollars 0.66 0.035 18.84
Part-timeIntercept term for 17-year-olds -14.68 0.634 -23.14 0.63 1.78*Intercept term for 18-year-olds -13.23 0.633 -20.90Intercept term for 19-year-olds -12.80 0.633 -20.24Intercept term for 20-year-olds -12.82 0.632 -20.29Intercept term for 21-year-olds -12.74 0.632 -20.17Intercept term for 22-year-olds -12.75 0.631 -20.19Intercept term for 23-year-olds -12.76 0.631 -20.22Intercept term for 24-year-olds -12.92 0.631 -20.47Intercept term for 25- to 29-year-olds -13.09 0.627 -20.89Intercept term for 30- to 34-year-olds -13.22 0.628 -21.06Intercept term for 35- to 44-year-olds -13.06 0.627 -20.84Log of Black per capita disposable
income in current dollars 0.56 0.034 16.51
* p < .05. NOTE: R2 = Coefficient of determination. D.W. statistic = Durbin-Watson statistic, a test for autocorrelation among regression residuals. For more details see Johnston, J., and Dinardo, J. (1996). Econometric Methods. New York: McGraw-Hill. The regression method used to estimate the full-time and part-time equations was the pooled seemingly unrelated regression method. The time period used to estimate the equations is from 1980 to 2010. The number of observations is 341. For additional information, see Intriligator, M. D. (1978). Econometric Models, Techniques, & Applications. New Jersey: Prentice-Hall, Inc., pp. 165–173. Race categories exclude persons of Hispanic ethnicity. SOURCE: U.S. Department of Education, National Center for Education Statistics, Enrollment in Degree-Granting Institutions by Race/Ethnicity Model, 1980–2010. (This table was prepared February 2012.)

Projections of Education Statistics to 2021 133
Table A-26. Estimated equations and model statistics for full-time and part-time enrollment rates of Hispanic men at postsecondary degree-granting institutions
Independent variable Coefficient Standard error t-statistic R2 D.W. statistic
Full-timeIntercept term for 17-year-olds -11.46 0.723 -15.84 0.94 1.90*Intercept term for 18-year-olds -9.44 0.717 -13.18Intercept term for 19-year-olds -9.22 0.717 -12.86Intercept term for 20-year-olds -9.43 0.717 -13.16Intercept term for 21-year-olds -9.66 0.719 -13.44Intercept term for 22-year-olds -10.09 0.718 -14.05Intercept term for 23-year-olds -10.42 0.718 -14.51Intercept term for 24-year-olds -10.58 0.718 -14.75Intercept term for 25- to 29-year-olds -11.38 0.718 -15.85Intercept term for 30- to 34-year-olds -12.17 0.719 -16.92Intercept term for 35- to 44-year-olds -12.68 0.722 -17.55Log of Hispanic per capita disposable
income in current dollars 0.41 0.039 10.47
Part-timeIntercept term for 17-year-olds -10.87 0.537 -20.25 0.70 1.75*Intercept term for 18-year-olds -9.30 0.534 -17.42Intercept term for 19-year-olds -8.99 0.539 -16.67Intercept term for 20-year-olds -8.90 0.533 -16.70Intercept term for 21-year-olds -8.93 0.533 -16.74Intercept term for 22-year-olds -9.29 0.532 -17.46Intercept term for 23-year-olds -9.25 0.539 -17.15Intercept term for 24-year-olds -9.36 0.533 -17.55Intercept term for 25- to 29-year-olds -9.67 0.526 -18.39Intercept term for 30- to 34-year-olds -10.13 0.528 -19.20Intercept term for 35- to 44-year-olds -10.16 0.526 -19.33Log of Hispanic per capita disposable
income in current dollars 0.34 0.029 11.95
* p < .05. NOTE: R2 = Coefficient of determination. D.W. statistic = Durbin-Watson statistic, a test for autocorrelation among regression residuals. For more details see Johnston, J., and Dinardo, J. (1996). Econometric Methods. New York: McGraw-Hill. The regression method used to estimate the full-time and part-time equations was the pooled seemingly unrelated regression method. The time period used to estimate the equations is from 1980 to 2010. The number of observations is 341. For additional information, see Intriligator, M. D. (1978). Econometric Models, Techniques, & Applications. New Jersey: Prentice-Hall, Inc., pp. 165–173. SOURCE: U.S. Department of Education, National Center for Education Statistics, Enrollment in Degree-Granting Institutions by Race/Ethnicity Model, 1980–2010. (This table was prepared February 2012.)

134 Appendix A: Introduction to Projection Methodology
Table A-27. Estimated equations and model statistics for full-time and part-time enrollment rates of Hispanic women at postsecondary degree-granting institutions
Independent variable Coefficient Standard error t-statistic R2 D.W. statistic
Full-timeIntercept term for 17-year-olds -17.77 0.628 -28.27 0.94 1.85*Intercept term for 18-year-olds -15.26 0.615 -24.83Intercept term for 19-year-olds -15.16 0.613 -24.72Intercept term for 20-year-olds -15.49 0.614 -25.23Intercept term for 21-year-olds -15.61 0.614 -25.42Intercept term for 22-year-olds -16.19 0.616 -26.27Intercept term for 23-year-olds -16.47 0.615 -26.76Intercept term for 24-year-olds -16.95 0.619 -27.36Intercept term for 25- to 29-year-olds -17.58 0.613 -28.66Intercept term for 30- to 34-year-olds -18.28 0.615 -29.70Intercept term for 35- to 44-year-olds -18.57 0.617 -30.09Log of Hispanic per capita disposable
income in current dollars 0.76 0.033 22.75
Part-timeIntercept term for 17-year-olds -15.18 0.531 -28.60 0.70 1.90*Intercept term for 18-year-olds -13.05 0.519 -25.15Intercept term for 19-year-olds -12.66 0.515 -24.57Intercept term for 20-year-olds -12.96 0.521 -24.86Intercept term for 21-year-olds -12.80 0.521 -24.57Intercept term for 22-year-olds -13.11 0.522 -25.14Intercept term for 23-year-olds -12.98 0.517 -25.12Intercept term for 24-year-olds -13.23 0.520 -25.44Intercept term for 25- to 29-year-olds -13.52 0.511 -26.45Intercept term for 30- to 34-year-olds -13.89 0.511 -27.19Intercept term for 35- to 44-year-olds -13.75 0.510 -26.94Log of Hispanic per capita disposable
income in current dollars 0.57 0.028 20.59
* p < .05. NOTE: R2 = Coefficient of determination. D.W. statistic = Durbin-Watson statistic, a test for autocorrelation among regression residuals. For more details see Johnston, J., and Dinardo, J. (1996). Econometric Methods. New York: McGraw-Hill. The regression method used to estimate the full-time and part-time equations was the pooled seemingly unrelated regression method. The time period used to estimate the equations is from 1980 to 2010. The number of observations is 341. For additional information, see Intriligator, M. D. (1978). Econometric Models, Techniques, & Applications. New Jersey: Prentice-Hall, Inc., pp. 165–173. SOURCE: U.S. Department of Education, National Center for Education Statistics, Enrollment in Degree-Granting Institutions by Race/Ethnicity Model, 1980–2010. (This table was prepared February 2012.)
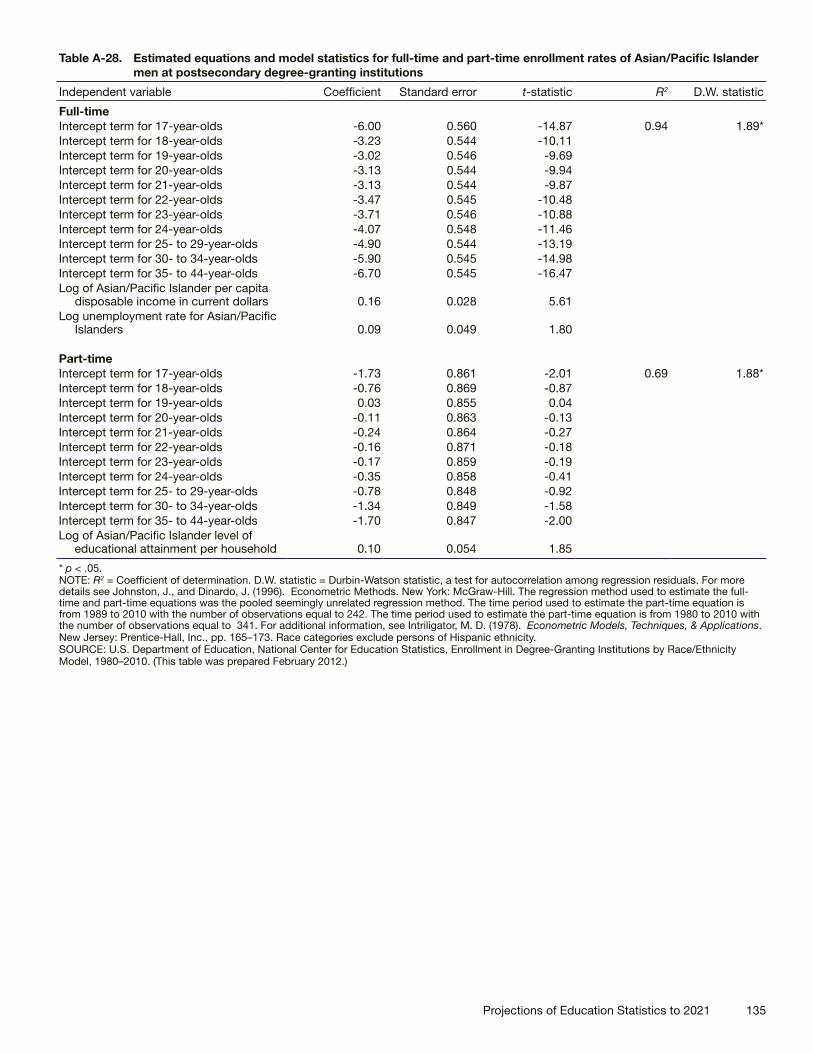
Projections of Education Statistics to 2021 135
Table A-28. Estimated equations and model statistics for full-time and part-time enrollment rates of Asian/Pacific Islander men at postsecondary degree-granting institutions
Independent variable Coefficient Standard error t-statistic R2 D.W. statistic
Full-timeIntercept term for 17-year-olds -6.00 0.560 -14.87 0.94 1.89*Intercept term for 18-year-olds -3.23 0.544 -10.11Intercept term for 19-year-olds -3.02 0.546 -9.69Intercept term for 20-year-olds -3.13 0.544 -9.94Intercept term for 21-year-olds -3.13 0.544 -9.87Intercept term for 22-year-olds -3.47 0.545 -10.48Intercept term for 23-year-olds -3.71 0.546 -10.88Intercept term for 24-year-olds -4.07 0.548 -11.46Intercept term for 25- to 29-year-olds -4.90 0.544 -13.19Intercept term for 30- to 34-year-olds -5.90 0.545 -14.98Intercept term for 35- to 44-year-olds -6.70 0.545 -16.47Log of Asian/Pacific Islander per capita
disposable income in current dollars 0.16 0.028 5.61Log unemployment rate for Asian/Pacific
Islanders 0.09 0.049 1.80
Part-timeIntercept term for 17-year-olds -1.73 0.861 -2.01 0.69 1.88*Intercept term for 18-year-olds -0.76 0.869 -0.87Intercept term for 19-year-olds 0.03 0.855 0.04Intercept term for 20-year-olds -0.11 0.863 -0.13Intercept term for 21-year-olds -0.24 0.864 -0.27Intercept term for 22-year-olds -0.16 0.871 -0.18Intercept term for 23-year-olds -0.17 0.859 -0.19Intercept term for 24-year-olds -0.35 0.858 -0.41Intercept term for 25- to 29-year-olds -0.78 0.848 -0.92Intercept term for 30- to 34-year-olds -1.34 0.849 -1.58Intercept term for 35- to 44-year-olds -1.70 0.847 -2.00Log of Asian/Pacific Islander level of
educational attainment per household 0.10 0.054 1.85
* p < .05. NOTE: R2 = Coefficient of determination. D.W. statistic = Durbin-Watson statistic, a test for autocorrelation among regression residuals. For more details see Johnston, J., and Dinardo, J. (1996). Econometric Methods. New York: McGraw-Hill. The regression method used to estimate the full-time and part-time equations was the pooled seemingly unrelated regression method. The time period used to estimate the part-time equation is from 1989 to 2010 with the number of observations equal to 242. The time period used to estimate the part-time equation is from 1980 to 2010 with the number of observations equal to 341. For additional information, see Intriligator, M. D. (1978). Econometric Models, Techniques, & Applications. New Jersey: Prentice-Hall, Inc., pp. 165–173. Race categories exclude persons of Hispanic ethnicity.SOURCE: U.S. Department of Education, National Center for Education Statistics, Enrollment in Degree-Granting Institutions by Race/Ethnicity Model, 1980–2010. (This table was prepared February 2012.)

136 Appendix A: Introduction to Projection Methodology
Table A-29. Estimated equations and model statistics for full-time and part-time enrollment rates of Asian/Pacific Islander women at postsecondary degree-granting institutions
Independent variable Coefficient Standard error t-statistic R2 D.W. statistic
Full-timeIntercept term for 17-year-olds -9.32 0.648 -14.38 0.97 1.96*Intercept term for 18-year-olds -6.96 0.638 -10.92Intercept term for 19-year-olds -6.48 0.642 -10.09Intercept term for 20-year-olds -6.75 0.639 -10.55Intercept term for 21-year-olds -6.82 0.639 -10.67Intercept term for 22-year-olds -7.29 0.640 -11.39Intercept term for 23-year-olds -7.66 0.639 -11.98Intercept term for 24-year-olds -8.20 0.649 -12.64Intercept term for 25- to 29-year-olds -9.08 0.637 -14.26Intercept term for 30- to 34-year-olds -10.33 0.640 -16.13Intercept term for 35- to 44-year-olds -10.88 0.641 -16.97Log of Asian/Pacific Islander per capita
disposable income in current dollars 0.35 0.033 10.70
Part-timeIntercept term for 17-year-olds -7.39 0.667 -11.09 0.82 2.04*Intercept term for 18-year-olds -5.56 0.659 -8.43Intercept term for 19-year-olds -4.93 0.688 -7.17Intercept term for 20-year-olds -5.24 0.670 -7.83Intercept term for 21-year-olds -4.69 0.665 -7.05Intercept term for 22-year-olds -4.89 0.654 -7.48Intercept term for 23-year-olds -5.15 0.659 -7.82Intercept term for 24-year-olds -5.38 0.669 -8.05Intercept term for 25- to 29-year-olds -5.86 0.649 -9.03Intercept term for 30- to 34-year-olds -6.53 0.651 -10.02Intercept term for 35- to 44-year-olds -6.38 0.648 -9.85Log of Asian/Pacific Islander per capita
disposable income in current dollars 0.18 0.033 5.45
* p < .05. NOTE: R2 = Coefficient of determination. D.W. statistic = Durbin-Watson statistic, a test for autocorrelation among regression residuals. For more details see Johnston, J., and Dinardo, J. (1996). Econometric Methods. New York: McGraw-Hill. The regression method used to estimate the full-time and part-time equations was the pooled seemingly unrelated regression method. The time period used to estimate the equations is from 1989 to 2010. The number of observations is 242. For additional information, see Intriligator, M. D. (1978). Econometric Models, Techniques, & Applications. New Jersey: Prentice-Hall, Inc., pp. 165–173. Race categories exclude persons of Hispanic ethnicity. SOURCE: U.S. Department of Education, National Center for Education Statistics, Enrollment in Degree-Granting Institutions by Race/Ethnicity Model, 1980–2010. (This table was prepared February 2012.)

Projections of Education Statistics to 2021 137
A.6. POSTSECONDARY DEGREES CONFERRED
Projections in this editionThis edition of Projections of Education Statistics presents projections of postsecondary degrees conferred by level of degree and sex of recipient for 2010–11 through 2021–22.
Overview of approach Basic approach
Projections of associate’s, bachelor’s, master’s, and doctor’s degrees for men and women were produced using forecasting equations that relate degrees conferred to full-time enrollment in degree-granting institutions by sex, student level (undergraduate or postbaccalaureate), and institution level (2-year or 4-year).
Degrees Conferred ModelProcedures used to project degrees
For all degree levels, projections of degrees conferred were made separately for men and for women. The projections for men and women were then summed to get projections of the total number of degrees.
Multiple linear regression was used to project associate’s, bachelor’s, master’s, and doctor’s degrees based on enrollment variables for men and women. The enrollment variables used for the different levels of degrees are briefly described below.
For details and results of the regression analyses used to project associate’s, bachelor’s, master’s, and doctor’s degrees, see table A-30, under “Data and equations used to project degrees,” later in this section.
Associate’s degrees. Projections were based on full-time undergraduate enrollment in 2-year institutions by sex. Men’s projections of associate’s degrees were based on current full-time enrollment and full-time enrollment lagged 2 years. Women’s projections of associate’s degrees were based on current full-time enrollment and full-time enrollment lagged 1 and 2 years.
Bachelor’s degrees. Projections were based on full-time undergraduate enrollment in 4-year institutions by sex. For men and for women, bachelor’s degree projections were based on current full-time enrollment and full-time enrollment lagged 2 years.
Master’s degrees. Projections were based on full-time postbaccalaureate enrollment by sex. Men’s projections of master’s degrees were based on current full-time enrollment and full-time enrollment lagged 1 year. Women’s projections of master’s degrees were based on current full-time enrollment.
Doctor’s degrees. Projections were based on full-time postbaccalaureate enrollment by sex. For men and for women, doctor’s degree projections were based on current full-time postbaccalaureate enrollment and full-time postbaccalaureate enrollment lagged 1 and 2 years.
Data and equations used to project degrees
Enrollment data and projections for degree-granting institutions. Historical enrollment data by sex, level of student, and level of institution came from the NCES Integrated Postsecondary Education Data System (IPEDS). For the time period used for each level of degree, see table A-30 on page 139. The enrollment projections used are those produced for this edition of Projections of Education Statistics. For more information about the enrollment projections, see Section A.5. Enrollment in Postsecondary Degree-Granting Institutions, earlier in this appendix.
Data on degrees awarded at all levels. Historical data by level of degree and sex of recipient came from the NCES Integrated Postsecondary Education Data System (IPEDS). All degrees were projected using data for 1980–81 to 2009–10.
Estimated equations and model statistics. For details on the equations used to project associate’s, bachelor’s, master’s, and doctor’s degrees, see table A-30 on page 139. The equations shown were selected on the basis of their statistical properties, such as coefficients of determination (R2s), the t-statistics of the coefficients, the Durbin-Watson statistic, the Breusch-Godfrey Serial Correlation LM test statistic, and residual plots.

138 Appendix A: Introduction to Projection Methodology
Accuracy of projectionsNo MAPEs were calculated for degrees conferred because, for associate’s and bachelor’ degrees, the current models for producing the projections have been used for only three other editions of Projections of Education Statistics, and for master’s and doctor’s degrees, there have been substantial changes in the data.
For more information about MAPEs, see Section A.0. Introduction, earlier in this appendix.

Projections of Education Statistics to 2021 139
Table A-30. Estimated equations and model statistics for degrees conferred, by degree level and sex
Dependent variable Equation1 R2
Breusch-Godfrey
Serial Correlation
LM test statistic2
Time period
Associate’s degrees, men DASSOCM = 1,877 + 96DUGFT2M + 57DUGFT2ML2 0.66 1.46 (0.482) 1980–81 to(2.3) (6.4) (3.0) 2009–10
Associate’s degrees, women DLOGASSOCW = # + 0.7DLOGUGFT2WS3 + .3MA(1) 0.58 0.14 (0.932) 1980–81 to(†) (4.5) (1.9) 2009–10
Bachelor’s degrees, men DBACHM = 1153 + 59DUGFT4M + 144DUGFT4ML2 0.81 2.43 (0.297) 1980–81 to(1.10) (2.9) (5.9) 2009–10
Bachelor’s degrees, women DBACHW = 4845 + 57DUGFT4W + 118DUGFT4WL2 0.69 0.67 (0.716) 1980–81 to(2.3) (2.3) (3.5) 2009–10
Master’s degrees, men PCHMASTM = # + 0.6PCHPBFTM + 0.5PCHPBFTML1 0.67 0.83 (0.661) 1980–81 to(†) (3.57) (3.15) 2009–10
Master’s degrees, women PCHMASTW = # + 0.4PCHPBFTW + 0.6AR(1) 0.57 3.83 (0.148) 1980–81 to(†) (2.2) (4.03) 2009–10
Doctor’s degrees, men DDOCM = -362 + 51DPBFTML1 + 59DPBFTML2 0.43 1.70 (0.413) 1980–81 to (1.5) (2.1) (2.4) 2009–10
Doctor’s degrees, women DDOCW = 562 + 29DPBFTWL1 + 39DPBFTWL2 0.46 0.53 (0.7) 1980–81 to (1.8) (1.6) (2.1) 2009–10
† Not applicable.# Rounds to zero.1 AR(1) indicates that the model was estimated to account for first-order autocorrelation. To estimate the model, it was first transformed into a nonlinear model and then the coefficients were estimated simultaneously by applying a Marquardt nonlinear least squares algorithm to the transformed equation. MA(1) indicates that the model was estimated to incorporate moving average of the residual into model fit. For a general discussion of the problem of autocorrelation and the method used to forecast in the presence of autocorrelation, see Judge, G., Hill, W., Griffiths, R., Lutkepohl, H., and Lee, T. (1985). The Theory and Practice of Econometrics, New York: John Wiley and Sons, pp. 315-318. Numbers in parentheses are t-statistics.2 The number in parentheses is the probability of the Chi-Square associated with the Breusch-Godfrey Serial Correlation LM Test. A p value greater than 0.05 implies that we do not reject the null hypothesis of no autocorrelation at the 5% significance level for a two-tailed test and the 10% significance level for a one-tailed test, i.e., there is no autocorrelation present. For an explanation of the Breusch-Godfrey Serial Correlation LM test statistic, see Greene, W. (2000). Econometric Analysis. New Jersey: Prentice-Hall.NOTE: R2 is the coefficient of determination. DASSOCM = First difference of associate’s degrees awarded to men. DLOGASSOCW = First difference of the log of associate’s degrees awarded to women. DBACHM = First difference of bachelor’s degrees awarded to men. DBACHW = First difference of bachelor’s degrees awarded to women. PCHMASTM = Percentage change in master’s degrees awarded to men.PCHMASTW = Percentage change in master’s degrees awarded to women. DDOCM = First difference of doctor’s degrees awarded to men.DDOCW = First difference of doctor’s degrees awarded to women.DUGFT2M = First difference of full-time male undergraduate enrollment in 2-year institutions. DUGFT2ML2 = First difference of full-time male undergraduate enrollment in 2-year institutions, lagged two periods. DLOGUGFT2WS3 = First difference of the sum of the full-time female undergraduate enrollment in 2-year institutions over the present year and the previous 2 years. DUGFT4M = First difference of full-time male undergraduate enrollment in 4-year institutions. DUGFT4ML2 = First difference of full-time male undergraduate enrollment in 4-year institutions, lagged two periods. DUGFT4W = First difference of full-time female undergraduate enrollment in 4-year institutions. DUGFT4WL2 = First difference of full-time female undergraduate enrollment in 4-year institutions, lagged two periods. PCHPBFTM = Percentage change in full-time male postbaccalaureate enrollment. PCHPBFTML1 = Percentage change in full-time female postbaccalaureate enrollment lagged 1 year. PCHPBFTW = Percentage change in full-time female postbaccalaureate enrollment. DBPFTML1 = First difference of full-time male postbaccalaureate enrollment lagged 1 year. DBPFTML2 = First difference of full-time male postbaccalaureate enrollment lagged 2 years. DBPFTWL1 = First difference of full-time female postbaccalaureate enrollment lagged 1 year. DBPFTWL2 = First difference of full-time female postbaccalaureate enrollment lagged 2 years. SOURCE: U.S. Department of Education, National Center for Education Statistics, Degrees Conferred Model, 1980–81 through 2009–10. (This table was prepared March 2012.)

This page intentionally left blank.

Projections of Education Statistics to 2021 141
Appendix BSupplementary Tables

142 Appendix B: Supplementary Tables
Table B-1. Annual number of births: 1946 through 2010
Calendar year
Number of births, in thousands Calendar year
Number of births, in thousands
1946 3,426 1979 3,494 1947 3,834 1980 3,612 1948 3,655 1981 3,629 1949 3,667 1982 3,681 1950 3,645 1983 3,639 1951 3,845 1984 3,669 1952 3,933 1985 3,761 1953 3,989 1986 3,757 1954 4,102 1987 3,809 1955 4,128 1988 3,910 1956 4,244 1989 4,041 1957 4,332 1990 4,158 1958 4,279 1991 4,111 1959 4,313 1992 4,065 1960 4,307 1993 4,000 1961 4,317 1994 3,953 1962 4,213 1995 3,900 1963 4,142 1996 3,891 1964 4,070 1997 3,881 1965 3,801 1998 3,942 1966 3,642 1999 3,959 1967 3,555 2000 4,059 1968 3,535 2001 4,026 1969 3,626 2002 4,022 1970 3,739 2003 4,090 1971 3,556 2004 4,112 1972 3,258 2005 4,138 1973 3,137 2006 4,266 1974 3,160 2007 4,317 1975 3,144 2008 4,248 1976 3,168 2009 4,131 1977 3,327 2010 4,000 1978 3,333
NOTE: Some data have been revised from previously published figures. SOURCE: U.S. Department of Health and Human Services, National Center for Health Statistics (NCHS), National Vital Statistics Reports, various years. (This table was prepared February 2012.)
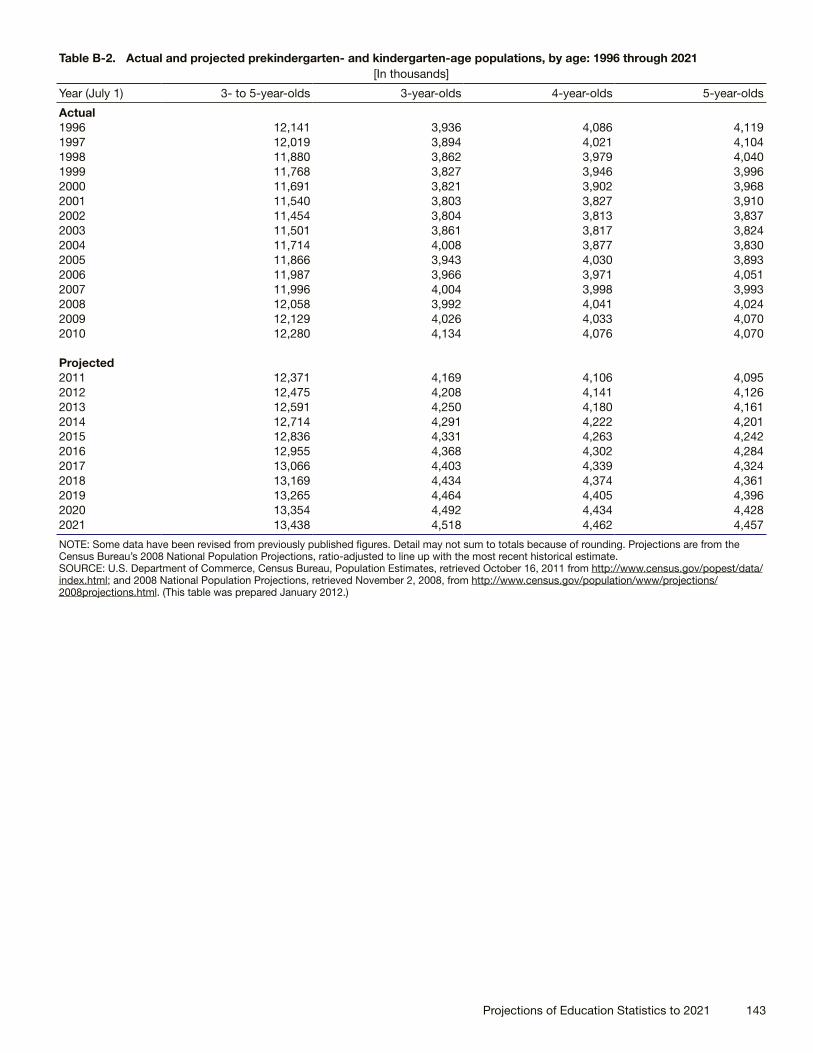
Projections of Education Statistics to 2021 143
Table B-2. Actual and projected prekindergarten- and kindergarten-age populations, by age: 1996 through 2021[In thousands]
Year (July 1) 3- to 5-year-olds 3-year-olds 4-year-olds 5-year-olds
Actual1996 12,141 3,936 4,086 4,119 1997 12,019 3,894 4,021 4,104 1998 11,880 3,862 3,979 4,040 1999 11,768 3,827 3,946 3,996 2000 11,691 3,821 3,902 3,968 2001 11,540 3,803 3,827 3,910 2002 11,454 3,804 3,813 3,837 2003 11,501 3,861 3,817 3,824 2004 11,714 4,008 3,877 3,830 2005 11,866 3,943 4,030 3,893 2006 11,987 3,966 3,971 4,051 2007 11,996 4,004 3,998 3,993 2008 12,058 3,992 4,041 4,024 2009 12,129 4,026 4,033 4,070 2010 12,280 4,134 4,076 4,070
Projected2011 12,371 4,169 4,106 4,095 2012 12,475 4,208 4,141 4,126 2013 12,591 4,250 4,180 4,161 2014 12,714 4,291 4,222 4,201 2015 12,836 4,331 4,263 4,242 2016 12,955 4,368 4,302 4,284 2017 13,066 4,403 4,339 4,324 2018 13,169 4,434 4,374 4,361 2019 13,265 4,464 4,405 4,396 2020 13,354 4,492 4,434 4,428 2021 13,438 4,518 4,462 4,457
NOTE: Some data have been revised from previously published figures. Detail may not sum to totals because of rounding. Projections are from the Census Bureau’s 2008 National Population Projections, ratio-adjusted to line up with the most recent historical estimate. SOURCE: U.S. Department of Commerce, Census Bureau, Population Estimates, retrieved October 16, 2011 from http://www.census.gov/popest/data/ index.html; and 2008 National Population Projections, retrieved November 2, 2008, from http://www.census.gov/population/www/projections/ 2008projections.html. (This table was prepared January 2012.)

144 Appendix B: Supplementary Tables
Table B-3. Actual and projected school-age populations, by selected ages: 1996 through 2021[In thousands]
Year (July 1) 5-year-olds 6-year-olds5- to 13- year-olds
14- to 17- year-olds
Actual1996 4,119 4,088 35,375 15,443 1997 4,104 4,127 35,915 15,769 1998 4,040 4,112 36,454 15,829 1999 3,996 4,045 36,804 16,007 2000 3,968 4,004 37,054 16,144 2001 3,910 3,973 37,093 16,280 2002 3,837 3,913 37,001 16,506 2003 3,824 3,838 36,814 16,694 2004 3,830 3,822 36,458 17,054 2005 3,893 3,828 36,248 17,358 2006 4,051 3,891 36,269 17,549 2007 3,993 4,046 36,296 17,597 2008 4,024 3,988 36,438 17,395 2009 4,070 4,018 36,657 17,232 2010 4,070 4,068 36,932 17,063
Projected2011 4,095 4,095 37,307 16,905 2012 4,126 4,122 37,713 16,812 2013 4,161 4,152 38,117 16,787 2014 4,201 4,188 38,522 16,833 2015 4,242 4,228 38,820 17,086 2016 4,284 4,271 39,163 17,343 2017 4,324 4,313 39,520 17,585 2018 4,361 4,353 39,870 17,835 2019 4,396 4,391 40,227 17,963 2020 4,428 4,426 40,591 18,120 2021 4,457 4,458 40,954 18,282
NOTE: Some data have been revised from previously published figures. Projections are from the U.S. Census Bureau’s 2008 National Population Projections, ratio-adjusted to line up with the most recent historical estimate.SOURCE: U.S. Department of Commerce, Census Bureau, Population Estimates, retrieved October 16, 2011, from http://www.census.gov/popest/data/ index.html; and 2008 National Population Projections, retrieved November 2, 2008, from http://www.census.gov/population/www/projections/ 2008projections.html. (This table was prepared January 2012.)

Projections of Education Statistics to 2021 145
Table B-4. Actual and projected college-age populations, by selected ages:[In thousands]
1996 through 2021
Year (July 1) 18-year-olds18- to 24- year-olds
25- to 29- year-olds
30- to 34- year-olds
35- to 44- year-olds
Actual1996 3,650 25,376 19,927 21,996 43,605 1997 3,780 25,574 19,960 21,494 44,282 1998 3,984 26,155 19,863 20,999 44,802 1999 3,993 26,780 19,632 20,647 45,130 2000 4,082 27,390 19,328 20,560 45,217 2001 4,106 28,081 18,866 20,689 45,101 2002 4,087 28,598 18,752 20,705 44,706 2003 4,206 29,121 18,872 20,545 44,251 2004 4,218 29,474 19,193 20,220 43,881 2005 4,228 29,609 19,629 19,787 43,594 2006 4,303 29,758 20,200 19,343 43,325 2007 4,397 29,973 20,640 19,231 42,879 2008 4,590 30,355 21,003 19,365 42,275 2009 4,537 30,687 21,184 19,708 41,573 2010 4,489 30,865 21,259 20,157 41,067
Projected2011 4,446 31,103 21,305 20,729 40,849 2012 4,386 31,268 21,401 21,193 40,815 2013 4,365 31,329 21,579 21,551 40,891 2014 4,343 31,275 21,869 21,760 40,998 2015 4,293 31,028 22,234 21,835 41,090 2016 4,297 30,786 22,561 21,888 41,317 2017 4,346 30,647 22,825 21,990 41,714 2018 4,395 30,599 22,964 22,173 42,267 2019 4,554 30,769 22,951 22,467 42,867 2020 4,561 30,967 22,778 22,836 43,440 2021 4,596 31,221 22,585 23,168 44,092
NOTE: Some data have been revised from previously published figures. Projections are from the U.S. Census Bureau’s 2008 National Population Projections, ratio-adjusted to line up with the most recent historical estimate.SOURCE: U.S. Department of Commerce, Census Bureau, Population Estimates, retrieved October 16, 2011, from http://www.census.gov/popest/data/ index.html; and 2008 National Population Projections, retrieved November 2, 2008, from http://www.census.gov/population/www/projections/ 2008projections.html. (This table was prepared January 2012.)

146 Appendix B: Supplementary Tables
Table B-5. Actual and projected fall enrollment in public elementary and secondary schools, change in fall enrollment from previous year, resident population, and fall enrollment as a ratio of the population: School years 1996–97 through 2021–22
School yearFall enrollment (in thousands)
Change in fall enrollment from previous year
(in thousands)
Resident population (in millions)
Fall enrollment as a ratio of
the population
Actual1996–97 45,611 771 269.7 0.1691997–98 46,127 516 272.9 0.1691998–99 46,539 412 276.1 0.1691999–2000 46,857 319 279.3 0.1682000–01 47,204 346 282.4 0.1672001–02 47,672 468 285.2 0.1672002–03 48,183 511 287.9 0.1672003–04 48,540 357 290.6 0.1672004–05 48,795 255 293.2 0.1662005–06 49,113 318 295.9 0.1662006–07 49,316 203 298.8 0.1652007–08 49,293 -23 301.7 0.1632008–09 49,266 -27 304.5 0.1622009–10 49,373 108 307.2 0.1612010–11 49,484 111 309.8 0.160
Projected2011–12 49,636 151 312.8 0.1592012–13 49,828 192 315.8 0.1582013–14 50,067 239 318.9 0.1572014–15 50,407 340 322.0 0.1572015–16 50,773 366 325.1 0.1562016–17 51,146 372 328.2 0.1562017–18 51,524 378 331.4 0.1552018–19 51,880 356 334.5 0.1552019–20 52,260 380 337.7 0.1552020–21 52,688 428 340.9 0.1552021–22 53,113 425 344.1 0.154
NOTE: Resident population includes civilian population and armed forces personnel residing within the United States; it excludes armed forces personnel overseas. Calculations were made using unrounded numbers. Some data have been revised from previously published figures. Projections are from the U.S. Census Bureau’s 2008 National Population Projections, ratio-adjusted to line up with the most recent historical estimate.SOURCE: U.S. Department of Commerce, Census Bureau, Population Estimates, retrieved October 16, 2011, from http://www.census.gov/popest/data/ index.html; and 2008 National Population Projections, retrieved November 2, 2008, from http://www.census.gov/population/www/projections/ 2008projections.html. U.S. Department of Education, National Center for Education Statistics, Common Core of Data (CCD), “State Nonfiscal Survey of Public Elementary/Secondary Education,” 1996–97 through 2010–11; and Elementary and Secondary Enrollment Model, 1972–2010. (This table was prepared February 2012.)
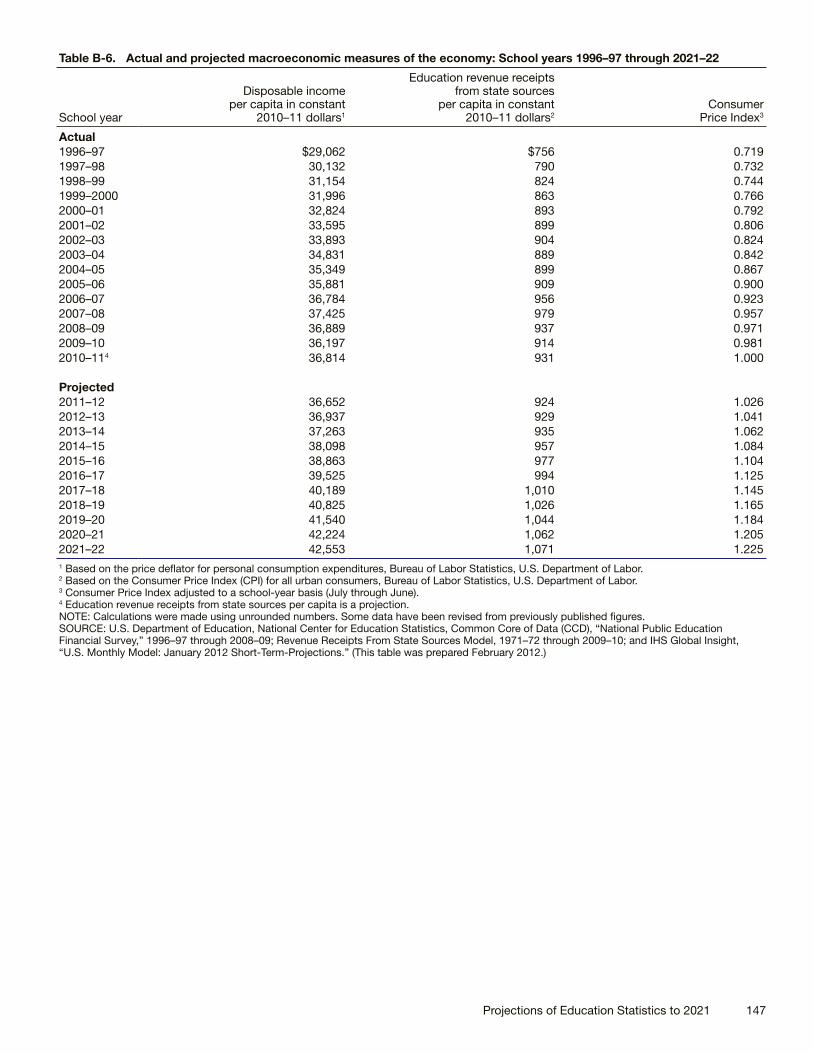
Projections of Education Statistics to 2021 147
Table B-6. Actual and projected macroeconomic measures of the economy: School years 1996–97 through 2021–22
School year
Disposable income per capita in constant
2010–11 dollars1
Education revenue receipts from state sources
per capita in constant 2010–11 dollars2
Consumer Price Index3
Actual1996–97 $29,062 $756 0.7191997–98 30,132 790 0.7321998–99 31,154 824 0.7441999–2000 31,996 863 0.7662000–01 32,824 893 0.7922001–02 33,595 899 0.8062002–03 33,893 904 0.8242003–04 34,831 889 0.8422004–05 35,349 899 0.8672005–06 35,881 909 0.9002006–07 36,784 956 0.9232007–08 37,425 979 0.9572008–09 36,889 937 0.9712009–10 36,197 914 0.9812010–114 36,814 931 1.000
Projected2011–12 36,652 924 1.0262012–13 36,937 929 1.0412013–14 37,263 935 1.0622014–15 38,098 957 1.0842015–16 38,863 977 1.1042016–17 39,525 994 1.1252017–18 40,189 1,010 1.1452018–19 40,825 1,026 1.1652019–20 41,540 1,044 1.1842020–21 42,224 1,062 1.2052021–22 42,553 1,071 1.2251 Based on the price deflator for personal consumption expenditures, Bureau of Labor Statistics, U.S. Department of Labor.2 Based on the Consumer Price Index (CPI) for all urban consumers, Bureau of Labor Statistics, U.S. Department of Labor.3 Consumer Price Index adjusted to a school-year basis (July through June).4 Education revenue receipts from state sources per capita is a projection.NOTE: Calculations were made using unrounded numbers. Some data have been revised from previously published figures. SOURCE: U.S. Department of Education, National Center for Education Statistics, Common Core of Data (CCD), “National Public Education Financial Survey,” 1996–97 through 2008–09; Revenue Receipts From State Sources Model, 1971–72 through 2009–10; and IHS Global Insight, “U.S. Monthly Model: January 2012 Short-Term-Projections.” (This table was prepared February 2012.)

This page intentionally left blank.

Projections of Education Statistics to 2021 149
Appendix C Data Sources
SOURCES AND COMPARABILITY OF DATAThe information in this report was obtained from many sources, including federal and state agencies, private research organizations, and professional associations. The data were collected by many methods, including surveys of a universe (such as all colleges) or of a sample, and compilations of administrative records. Care should be used when comparing data from different sources. Differences in procedures, such as timing, phrasing of questions, and interviewer training, mean that the results from the different sources are not strictly comparable. More extensive documentation of one survey’s procedures than of another’s does not imply more problems with the data, only that more information is available on the survey.
ACCURACY OF DATAThe accuracy of any statistic is determined by the joint effects of “sampling” and “nonsampling” errors. Estimates based on a sample will differ from the figures that would have been obtained if a complete census had been taken using the same survey instruments, instructions, and procedures. Besides sampling errors, both of the surveys, universe and sample, are subject to errors of design, reporting, and processing, and errors due to nonresponse. To the extent possible, these nonsampling errors are kept to a minimum by methods built into the survey procedures. In general, however, the effects of nonsampling errors are more difficult to gauge than those produced by sampling variability.
SAMPLING ERRORSThe standard error is the primary measure of the sampling variability of an estimate. Standard errors can be used to produce confidence intervals. For example, from table A-12, an estimated 91.8 percent of public school teachers reported that they worked full time in 2007–08. This figure has an estimated standard error of 0.29 percent. Therefore, the estimated 95 percent confidence interval for this statistic is approximately 91.27 to 92.41 percent (91.8 ± 1.96 (0.29)). That is, if the processes of selecting a sample, collecting the data, and constructing the confidence interval were repeated, it would be expected that in 95 out of 100 samples from the same population, the confidence interval would contain the true full-time working rate.
Analysis of standard errors can help assess how valid a comparison between two estimates might be. The standard error of a difference between two independent sample estimates is equal to the square root of the sum of the squared standard errors of the estimates. The standard error (se) of the difference between independent sample estimates a and b is
sea-b = (sea2 + seb
2)1/2
Note that some of the standard errors in the original documents are approximations. That is, to derive estimates of standard errors that would be applicable to a wide variety of items and could be prepared at a moderate cost, a number of approximations were required. As a result, most of the standard errors presented provide a general order of magnitude rather than the exact standard error for any specific item.
NONSAMPLING ERRORSBoth universe and sample surveys are subject to nonsampling errors. Nonsampling errors are of two kinds—random and nonrandom. Random nonsampling errors may arise when respondents or interviewers interpret questions differently, when respondents must estimate values, or when coders, keyers, and other processors handle answers differently. Nonrandom nonsampling errors result from total nonresponse (no usable data obtained for a sampled unit), partial or item nonresponse (only a portion of a response may be usable), inability or unwillingness on the part of respondents to provide information, difficulty interpreting questions, mistakes in recording or keying data, errors of collection or processing, and overcoverage

150 Appendix C: Data Sources
or undercoverage of the target universe. Random nonresponse errors usually, but not always, result in an understatement of sampling errors and thus an overstatement of the precision of survey estimates. Because estimating the magnitude of nonsampling errors would require special experiments or access to independent data, these magnitudes are seldom available.
To compensate for suspected nonrandom errors, adjustments of the sample estimates are often made. For example, adjustments are frequently made for nonresponse, both total and partial. Imputations are usually made separately within various groups of sample members that have similar survey characteristics. Imputation for item nonresponse is usually made by substituting for a missing item the response to that item of a respondent having characteristics similar to those of the respondent.
Although the magnitude of nonsampling errors in the data used in Projections of Education Statistics is frequently unknown, idiosyncrasies that have been identified are noted on the appropriate tables.
FEDERAL AGENCY SOURCES
National Center for Education Statistics (NCES)Common Core of Data
NCES uses the Common Core of Data (CCD) to acquire and maintain statistical data from each of the 50 states, the District of Columbia, the Bureau of Indian Education, Department of Defense Dependents’ Schools (overseas), and the outlying areas (American Samoa, Guam, Northern Marianas, Puerto Rico, and U.S. Virgin Islands). Information about staff and students is collected annually at the school, local education agency (LEA) or school district, and state levels. Information about revenues and expenditures is also collected at the state and LEA levels.
Data are collected for a particular school year via an online reporting system open to state education agencies during the school year. Since the CCD is a universe collection, CCD data are not subject to sampling errors. However, nonsampling errors could come from two sources: nonresponse and inaccurate reporting. Almost all of the states submit the five CCD survey instruments each year, but submissions are sometimes incomplete.
Misreporting can occur when 58 education agencies compile and submit data for approximately 100,000 public schools and over 18,000 local education agencies. Typically, this results from varying interpretations of NCES definitions and differing record-keeping systems. NCES attempts to minimize these errors by working closely with the state education agencies through the National Forum on Education Statistics.
The state education agencies report data to NCES from data collected and edited in their regular reporting cycles. NCES encourages the agencies to incorporate into their own survey systems the NCES items they do not already collect so that these items will also be available for the subsequent CCD survey. Over time, this has meant fewer missing data cells in each state’s response, reducing the need to impute data.
NCES subjects data from the state education agencies to a comprehensive edit. Where data are determined to be inconsistent, missing, or out of range, NCES contacts the agencies for verification. NCES-prepared state summary forms are returned to the agencies for verification. Each year, states are also given an opportunity to revise their state-level aggregates from the previous survey cycle.
Some of the oldest public elementary and secondary data used in the production of the projections in this report came from the predecessor to the CCD, the “NCES Statistics of Public Elementary and Secondary School Systems.” This system was similar to the CCD.
Further information on the nonfiscal CCD may be obtained from
Patrick Keaton Elementary/Secondary and Libraries Studies Division Elementary/Secondary Cooperative System and Institutional Studies Program National Center for Education Statistics 1990 K Street NW Washington, DC 20006 [email protected] http://nces.ed.gov/ccd/

Projections of Education Statistics to 2021 151
Further information on the fiscal CCD data may be obtained from
Stephen Cornman Elementary/Secondary and Libraries Studies Division Elementary/Secondary Cooperative System and Institutional Studies Program National Center for Education Statistics 1990 K Street NW Washington, DC [email protected] http://nces.ed.gov/ccd/
Integrated Postsecondary Education Data System
The Integrated Postsecondary Education Data System (IPEDS) surveys approximately 7,500 postsecondary institutions, including universities and colleges, as well as institutions offering technical and vocational education beyond the high school level. IPEDS, which began in 1986, replaced the Higher Education General Information Survey (HEGIS).
IPEDS consists of nine integrated components that obtain information on who provides postsecondary education (institutions), who participates in it and completes it (students), what programs are offered and what programs are completed, and both the human and financial resources involved in the provision of institutionally-based postsecondary education. Until 2000 these components included: institutional characteristics, fall enrollment, completions, salaries, finance, and fall staff. Since 2000, data are collected in the fall for institutional characteristics and completions; in the winter for employees by assigned position (EAP), salaries, and fall staff; and in the spring for enrollment, student financial aid, finances, and graduation rates. With the winter 2005–06 survey the employees by assigned position, fall staff, and salaries components were merged into the human resources component. In 2007–08, the enrollment component was broken into two separate components: 12-month enrollment (collected in the fall) and fall enrollment (collected in the spring). The Graduation rates 200 percent survey is new to the Spring 2010 collection. Data are collected for the number of students who completed their program within 200 percent of the normal time period. This survey was developed to fulfill requirements in the Higher Education Opportunity Act of 2008.
The degree-granting institutions portion of IPEDS is a census of colleges awarding associate’s or higher degrees, that are eligible to participate in Title IV financial aid programs. Prior to 1993, data from technical and vocational institutions were collected through a sample survey. Beginning in 1993, all data were gathered in a census of all postsecondary institutions. The IPEDS tabulations developed for this edition of Projections of Education Statistics are based on lists of all institutions and are not subject to sampling errors.
The definition of institutions generally thought of as offering college and university education has changed in recent years. The old standard for higher education institutions included those institutions that had courses leading to an associate’s degree or higher, or that had courses accepted for credit toward those degrees. The higher education institutions were accredited by an agency or association that was recognized by the U.S. Department of Education, or were recognized directly by the Secretary of Education. The current category includes institutions that award associate’s or higher level degrees and that are eligible to participate in Title IV federal financial aid programs. The impact of this change has generally not been large. For example, tables on degrees awarded at the bachelor’s level or higher were not heavily affected. Most of the data on public 4-year colleges have been affected only to a minimal extent. The impact on enrollment in public 2-year colleges was noticeable in certain states, but relatively small at the national level. The largest impact has been on private 2-year college enrollment. Overall, total enrollment for all institutions was about one-half of a percent higher for degree-granting institutions than for higher education institutions.
Prior to the establishment of IPEDS in 1986, HEGIS acquired and maintained statistical data on the characteristics and operations of institutions of higher education. Implemented in 1966, HEGIS was an annual universe survey of institutions accredited at the college level by an agency recognized by the Secretary of the U.S. Department of Education. These institutions were listed in the NCES publication Education Directory, Colleges and Universities.
HEGIS surveys collected information concerning institutional characteristics, faculty salaries, finances, enrollment, and degrees. Since these surveys were distributed to all higher education institutions, the data presented are not subject to sampling error. However, they are subject to nonsampling error, the sources of which varied with the survey instrument. Information concerning the nonsampling error of the HEGIS enrollment and degrees surveys can be obtained from the HEGIS Post Survey Validation Study conducted in 1979.

152 Appendix C: Data Sources
Further information may be obtained from
Jessica Shedd Postsecondary, Adult, and Career Education Division Postsecondary Institutional Studies Program National Center for Education Statistics 1990 K Street NW Washington, DC 20006 [email protected] http://nces.ed.gov/ipeds/
Fall (Institutional Characteristics) This survey collects the basic information necessary to classify institutions, including control, level, and types of programs offered, as well as information on tuition, fees, and room and board charges. Beginning in 2000, the survey collected institutional pricing data from institutions with first-time, full-time, degree/certificate-seeking undergraduate students. Unduplicated full-year enrollment headcounts and instructional activity are now collected in a separate component (12-month Enrollment), part of the fall collection. The overall response rate was almost 100.0 percent for Title IV degree-granting institutions in reporting fall 2010 data.
Further information may be obtained from
Tara LawleyPostsecondary, Adult, and Career Education Division Postsecondary Institutional Studies Program National Center for Education Statistics 1990 K Street NW Washington, DC 20006 [email protected] http://nces.ed.gov/ipeds/
Spring (Fall Enrollment) This survey has been part of the HEGIS and IPEDS series since 1966. Response rates for this survey have been relatively high, generally exceeding 85 percent. Beginning in 2000, with web-based data collection, higher response rates were attained. In 2009–10, the overall response rate was almost 100.0 percent for degree-granting institutions. The response rate for 4-year private not-for-profit institutions was 99.9 percent, while 4-year public, 4-year private-for-profit, 2-year public, 2-year private not-for-profit, and 2-year private for-profit institutions had response rates of 100.0 percent. Imputation methods and the response bias analysis for the 2010–11 survey are discussed in Knapp, Kelly-Reid, and Ginder (2012).
Public institutions made the majority of changes to enrollment data during the 2004 revision period (Jackson et al. 2005). The majority of changes were made to unduplicated headcount data, with the net differences between the original data and the revised data at about 1 percent. Part-time students in general and enrollment in private not-for-profit institutions were often underestimated. The fewest changes by institutions were to Classification of Instructional Programs (CIP) code data.
Further information about the Spring (Fall Enrollment) survey may be obtained from
Allison Bell Postsecondary, Adult, and Career Education Division Postsecondary Institutional Studies Program National Center for Education Statistics 1990 K Street NW Washington, DC 20006 [email protected] http://nces.ed.gov/ipeds/
Fall (Completions) This survey was part of the HEGIS series throughout its existence. Collection of degree data has been maintained through IPEDS. However, the degree classification taxonomy was revised in 1970–71, 1982–83, 1991–92, 2002–03, and 2009–10.
The nonresponse rate does not appear to be a significant source of nonsampling error for this survey. The response rate over the years has been high, with the overall response rate for fall 2010 at 100.0 percent for degree-granting institutions. Because of the high response rate for degree-granting institutions, nonsampling error caused by imputation is also minimal. Imputation methods and the response bias analysis for the fall 2010 survey are discussed in Knapp, Kelly-Reid, and Ginder (2011).

Projections of Education Statistics to 2021 153
Most Title IV institutions supplying revised data on completions in 2003–04 were able to supply missing data for the prior year (Jackson et al. 2005). The size of the differences between imputed data for the prior year and the revised actual data supplied by the institution indicated that the imputed values produced by NCES were acceptable.
Further information on the IPEDS Completions surveys may be obtained from
Sabrina Ratchford Postsecondary, Adult, and Career Education Division Postsecondary Institutional Studies Program National Center for Education Statistics 1990 K Street NW Washington, DC 20006 [email protected]://nces.ed.gov/ipeds/
Private School Universe Survey
The purposes of Private School Universe Survey (PSS) data collection activities are to build an accurate and complete list of private schools to serve as a sampling frame for NCES sample surveys of private schools, and to report data on the total number of private schools, teachers, and students in the survey universe. The PSS is conducted every 2 years, with collections in the 1989–90, 1991–92, 1993–94, 1995–96, 1997–98, 1999–2000, 2001–02, 2003–04, 2005–06, 2007–08, and 2009–10 school years.
The PSS produces data similar to that of the CCD for public schools and can be used for public-private comparisons. The data are useful for a variety of policy and research-relevant issues, such as the growth of religiously affiliated schools, the number of private high school graduates, the length of the school year for various private schools, and the number of private school students and teachers.
The target population for this universe survey is all private schools in the United States that meet the PSS criteria of a private school (i.e., a private school is an institution that provides instruction for any of grades K through 12, has one or more teachers to give instruction, is not administered by a public agency, and is not operated in a private home). The survey universe is composed of schools identified from a variety of sources. The main source is a list frame, initially developed for the 1989–90 PSS. The list is updated regularly, matching it with lists provided by nationwide private school associations, state departments of education, and other national guides and sources that list private schools. The other source is an area frame search in approximately 124 geographic areas, conducted by the U.S. Census Bureau.
Further information on the PSS may be obtained from
Steve Broughman Elementary/Secondary and Libraries Studies Division Elementary/Secondary Sample Survey Studies Program National Center for Education Statistics 1990 K Street NW Washington, DC [email protected] http://nces.ed.gov/surveys/pss/
Census BureauCurrent Population Survey
Prior to July 2001, estimates of school enrollment rates, as well as social and economic characteristics of students, were based on data collected in the Census Bureau’s monthly household survey of about 50,000 dwelling units. Beginning in July 2001, this sample was expanded to 60,000 dwelling units. The monthly Current Population Survey (CPS) sample consists of 754 areas comprising 2,007 geographic areas, independent cities, and minor civil divisions throughout the 50 states and the District of Columbia. The samples are initially selected based on the decennial census files and are periodically updated to reflect new housing construction.
The monthly CPS deals primarily with labor force data for the civilian noninstitutional population (i.e., excluding military personnel and their families living on post and inmates of institutions). In addition, in October of each year, supplemental questions are asked about highest grade completed, level and grade of current enrollment, attendance status, number and type

154 Appendix C: Data Sources
of courses, degree or certificate objective, and type of organization offering instruction for each member of the household. In March of each year, supplemental questions on income are asked. The responses to these questions are combined with answers to two questions on educational attainment: highest grade of school ever attended and whether that grade was completed.
The estimation procedure employed for monthly CPS data involves inflating weighted sample results to independent estimates of characteristics of the civilian noninstitutional population in the United States by age, sex, and race. These independent estimates are based on statistics from decennial censuses; statistics on births, deaths, immigration, and emigration; and statistics on the population in the armed services. Generalized standard error tables are provided in the Current Population Reports or methods for deriving standard errors can be found within the CPS technical documentation at http://www.census.gov/apsd/techdoc/cps/cps-main.html. The CPS data are subject to both nonsampling and sampling errors.
Caution should also be used when comparing data between Census years. With the release of the January 2003 CPS data, population controls that reflect the results of Census 2000 were used in the monthly CPS estimation process. The new controls increased the size of the civilian noninstitutional population by about 3.5 million in May 2002. This adjustment usually occurs 3 to 4 years after the census, and, if the adjustment is substantial, historical data will be revised. Data from January 2000 through December 2002 were revised to reflect these new controls. Over and above these revisions, the U.S. Census Bureau introduced another large upward adjustment to the controls as part of its annual update of population estimates for 2003. The prior change in population controls occurred in March 1993, where data after this date were based on the 1990 census-based population controls and data before this date were based on 1980 or earlier census based population controls. This change in population controls between 1980-based and 1990-based had relatively little impact on summary measures, such as means, medians, and percentage distributions. It does, however, have a significant impact on levels. For example, use of 1990-based population controls resulted in about a 1 percent increase in the civilian noninstitutional population and in the number of families and households. Thus, estimates of levels for data collected in 1994 and later years differed from those for earlier years by more than what could be attributed to actual changes in the population. These differences could be disproportionately greater for certain subpopulation groups than for the total population.
In addition to the changes in population controls, two other relevant changes were introduced into the CPS with the release of the January 2003 data. First, the questions on race and Hispanic origin in the CPS were modified to comply with the new standards for maintaining, collecting, and presenting Federal data on race and ethnicity for Federal statistical agencies. A major change under those standards is that respondents may select more than one race when answering the survey. Respondents continued to be asked a separate question to determine if they are Hispanic or Latino, which is considered an ethnicity rather than a race. The ethnicity question was reworded to ask directly whether the respondent was Hispanic. Persons who report they are Hispanic also are classified separately in the race (or races) they consider themselves to be. Second, improvements were introduced to both the second stage and composite weighting procedures. These changes adapt the weighting procedures to the new race/ethnic classification system and enhance the stability over time of national and state/substate labor force estimates for demographic groups. These two changes, in addition to the change in population controls discussed above, benchmark the CPS data to the results of Census 2000, improve the estimation procedures, and ensure that the data series produced from the survey reflect the evolving composition of the U.S. population.
Further information on CPS may be obtained from
Education and Social Stratification Branch Population Division Census Bureau U.S. Department of Commerce Washington, DC 20233 http://www.census.gov/cps
School Enrollment Each October, the Current Population Survey (CPS) includes supplemental questions on the enrollment status of the population 3 years old and over, in addition to the monthly basic survey on labor force participation. Prior to 2001, the October supplement consisted of approximately 47,000 interviewed households. Beginning with the October 2001 supplement, the sample was expanded by 9,000 to a total of approximately 56,000 interviewed households. The main sources of non-sampling variability in the responses to the supplement are those inherent in the survey instrument. The question of current enrollment may not be answered accurately for various reasons. Some respondents may not know current grade information for every student in the household, a problem especially prevalent for households with members in college or in nursery school. Confusion over college credits or hours taken by a student may make it difficult to determine the year in which the student is enrolled. Problems may occur with the definition of nursery school (a group or class organized to provide educational experiences for children), where respondents’ interpretations of “educational experiences” vary.

Projections of Education Statistics to 2021 155
The October 2010 basic CPS household-level response rate was 91.5 percent and the school enrollment supplement person-level response rate was 92.6 percent. Since these rates are determined at different levels they cannot be combined to derive an overall response rate.
Further information on CPS methodology may be obtained from
http://www.census.gov/cps
Further information on CPS “School Enrollment” may be obtained from
Education and Social Stratification Branch Census Bureau U.S. Department of Commerce Washington, DC 20233 http://www.census.gov/hhes/school/index.html
National Population Projections The 2008 National Population Projections provide projections of resident population and demographic components of change (births, deaths, and net international migration) through 2050. Population projections are available by age, sex, race and Hispanic origin. The following is a general description of the methods used to produce the 2008 National Population Projections.
The projections originated with a base population from Census 2000 and were produced using a cohort-component method. Many of the characteristics of the U.S. resident population, as measured by Census 2000, were preserved as demographic patterns that worked their way through the projection period. Using the cohort-component method, the components of population change (births, deaths, and net international migration) were projected for each birth cohort (persons born in a given year). For each passing year, the population was advanced one year of age. The new age categories were updated using survival rates and levels of net international migration projected for the passing year. A new birth cohort was added to form the population under one year of age by applying projected age-specific fertility rates to the female population aged 15 to 49, and updating the new cohort for the effects of mortality and net international migration.
The assumptions for the components of change were based on time series analysis. Initially, demographic models were used to summarize historical trends. The forecast parameters obtained from these models were utilized in the models’ framework to create fertility, mortality, and migration schedules required for the cohort-component method. Because of limited data about racial characteristics in the fertility and mortality historical series, the assumptions were first developed for three mutually exclusive and exhaustive groups: Hispanic origin (any race), non-Hispanic Black alone, and non-Hispanic all other races. These assumptions were then applied to their respective detailed race/ethnic categories to project the population, allowing presentation of the race categories described above.
Further information on the National Population Projections may be obtained from
Population Division Census Bureau U.S. Department of Commerce Washington, DC 20233 http://www.census.gov
State Population Projections These state population projections were prepared using a cohort-component method by which each component of population change—births, deaths, state-to-state migration flows, international in-migration, and international out-migration—was projected separately for each birth cohort by sex, race, and Hispanic origin. The basic framework was the same as in past Census Bureau projections.
Detailed components necessary to create the projections were obtained from vital statistics, administrative records, census data, and national projections.
The cohort-component method is based on the traditional demographic accounting system:
P1 = P0 + B ― D + DIM ― DOM + IIM ― IOM

156 Appendix C: Data Sources
where:
P1 = population at the end of the periodP0 = population at the beginning of the periodB = births during the periodD = deaths during the periodDIM = domestic in-migration during the periodDOM = domestic out-migration during the periodIIM = international in-migration during the periodIOM = international out-migration during the period
To generate population projections with this model, the Census Bureau created separate datasets for each of these components. In general, the assumptions concerning the future levels of fertility, mortality, and international migration are consistent with the assumptions developed for the national population projections of the Census Bureau.
Once the data for each component were developed the cohort-component method was applied to produce the projections. For each projection year, the base population for each state was disaggregated into eight race and Hispanic categories (non-Hispanic White; non-Hispanic Black; non-Hispanic American Indian, Eskimo, and Aleut; non-Hispanic Asian and Pacific Islander; Hispanic White; Hispanic Black; Hispanic American Indian, Eskimo, and Aleut; and Hispanic Asian and Pacific Islander), by sex, and single year of age (ages 0 to 85+). The next step was to survive each age-sex-race-ethnic group forward 1 year using the pertinent survival rate. The internal redistribution of the population was accomplished by applying the appropriate state-to-state migration rates to the survived population in each state. The projected out-migrants were subtracted from the state of origin and added to the state of destination (as in-migrants). Next, the appropriate number of immigrants from abroad was added to each group. The population under age 1 was created by applying the appropriate age-race-ethnic-specific birth rates to females of childbearing age (ages 15 to 49). The number of births by sex and race/ethnicity were survived forward and exposed to the appropriate migration rate to yield the population under age 1. The final results of the projection process were proportionally adjusted to be consistent with the national population projections by single years of age, sex, race, and Hispanic origin. The entire process was then repeated for each year of the projection.
More information on Census Bureau projections may be obtained from
Population Division Census Bureau U.S. Department of Commerce Washington, DC 20233 http://www.census.gov
OTHER SOURCES
IHS Global InsightIHS Global Insight provides an information system that includes databases of economic and financial information; simulation and planning models; regular publications and special studies; data retrieval and management systems; and access to experts on economic, financial, industrial, and market activities. One service is the IHS Global Insight Model of the U.S. Economy, which contains annual projections of U.S. economic and financial conditions, including forecasts for the federal government, incomes, population, prices and wages, and state and local governments, over a long-term (10- to 25-year) forecast period.
Additional information is available from
IHS Global Insight 1000 Winter Street Suite 4300N Waltham, MA 02451-124 http://www.ihsglobalinsight.com/

Projections of Education Statistics to 2021 157
Appendix DReferences
Gamkhar, S., and Oates, W. (1996). Asymmetries in the Response to Increases and Decreases in Intergovernmental Grants: Some Empirical Findings. National Tax Journal, 49(3): 501–512.
Greene, W. (2000). Econometric Analysis. New Jersey: Prentice-Hall.
Hussar, W.J. (1999). Predicting the Need for Newly Hired Teachers in the United States to 2008–09 (NCES 99-026). National Center for Education Statistics, U.S. Department of Education. Washington, DC.
Inman, R.P. (1979). The Fiscal Performance of Local Governments: An Interpretive Review. In P. Mieszkowski and M. Straszheim (Eds.), Current Issues in Urban Economics, (pp. 270–321). Baltimore: Johns Hopkins Press.
Intriligator, M.D. (1978). Econometric Models, Techniques, & Applications. New Jersey: Prentice-Hall, Inc.
IHS Global Insight, “U.S. Monthly Model January 2012: Short-Term Projections.”
Jackson, K.W., Jang, D., Sukasih, A., and Peeckson, S. (2005). Integrated Postsecondary Education Data System Data Quality Study (NCES 2005-175). National Center for Education Statistics, Institute of Education Sciences, U.S. Department of Education. Washington, DC.
Johnston, J., and Dinardo, J. (1996). Econometric Methods. New York: McGraw-Hill.
Judge, G., Hill, W., Griffiths, R., Lutkepohl, H., and Lee, T. (1985). The Theory and Practice of Econometrics. New York: John Wiley and Sons.
Knapp, L.G., Kelly-Reid, J.E., and Ginder, S.A. (2011). Postsecondary Institutions and Price of Attendance in the United States: 2010–11, Degrees and Other Awards Conferred: 2009–10, and 12-Month Enrollment: 2009–10 (NCES 2011-250). National Center for Education Statistics, Institute of Education Sciences, U.S. Department of Education. Washington, DC.
Knapp, L.G., Kelly-Reid, J.E., and Ginder, S.A. (2012). Enrollment in Postsecondary Institutions, Fall 2010; Financial Statistics, Fiscal Year 2010; and Graduation Rates, Selected Cohorts, 2002–07 (NCES 2012-280). National Center for Education Statistics, Institute of Education Sciences, U.S. Department of Education. Washington, DC.
Mitias, P., and Turnbull, G. (2001). Grant Illusion, Tax Illusion, and Local Government Spending. Public Finance Review, 29(5): 347–368.
U.S. Department of Commerce, Census Bureau, 2008 National Population Projections, retrieved November 2, 2008, from http://www.census.gov/population/www/projections/2008projections.html.
U.S. Department of Commerce, Census Bureau, Current Population Reports, “Social and Economic Characteristics of Students,” 2010.
U.S. Department of Commerce, Census Bureau, Population Estimates, retrieved October 16, 2011, from http://www.census.gov/popest/data/index.html.
U.S. Department of Commerce, Census Bureau, State Interim Population Projections, retrieved November 2, 2008, from http://www.census.gov/population/www/projections/projectionsagesex.html.

This page intentionally left blank.

Projections of Education Statistics to 2021 159
Appendix EList of Abbreviations
ADA Average daily attendance
CCD Common Core of Data
CPI Consumer Price Index
CPS Current Population Survey
CV Coefficient of Variation
D.W. statistic Durbin-Watson statistic
FTE Full-time-equivalent
HEGIS Higher Education General Information Survey
IPEDS Integrated Postsecondary Education Data System
IPEDS-C Integrated Postsecondary Education Data System, Completions Survey
IPEDS-EF Integrated Postsecondary Education Data System, Fall Enrollment Survey
MAPE Mean absolute percentage error
NCES National Center for Education Statistics
PK Prekindergarten
PK–8 Prekindergarten through grade 8
PK–12 Prekindergarten through grade 12
PSS Private School Survey
SASS Schools and Staffing Survey

This page intentionally left blank.

Projections of Education Statistics to 2021 161
Appendix FGlossary
American Indian/Alaska Native: A person having origins in any of the original peoples of North America and who maintains cultural identification through tribal affiliation or community recognition.
Asian: A person having origins in any of the original peoples of the Far East, southeast Asia, or the Indian subcontinent including, for example, Cambodia, China, Japan, Korea, Malaysia, Pakistan, the Philippine Islands, Thailand, and Vietnam.
Asian/Pacific Islander: A person having origins in any of the original peoples of the Far East, Southeast Asia, the Indian subcontinent, or the Pacific Islands. This area includes, for example, Cambodia, China, India, Japan, Korea, Malaysia, Pakistan, Thailand, Vietnam, Guam, the Philippine Islands, Samoa, and other Pacific Islands.
Associate’s degree: An award that normally requires at least 2 but less than 4 years of full-time equivalent college work.
Autocorrelation: Correlation of the error terms from different observations of the same variable. Also called serial correlation.
Average daily attendance (ADA): The aggregate attendance of a school during a reporting period (normally a school year) divided by the number of days school is in session during this period. Only days on which the pupils are under the guidance and direction of teachers should be considered days in session.
Average daily membership (ADM): The aggregate member-ship of a school during a reporting period (normally a school year) divided by the number of days school is in session during this period. Only days on which the pupils are under the guidance and direction of teachers should be considered as days in session. The ADM for groups of schools having varying lengths of terms is the average of the ADMs obtained for the individual schools.
Bachelor’s degree: An award (baccalaureate or equivalent degree, as determined by the Secretary, U.S. Department of Education) that normally requires at least 4 but not more than 5 years of full-time equivalent college-level work. This includes all bachelor’s degrees conferred in a 5-year cooperative (work-study) program. A cooperative plan provides for alternate class attendance and employment in business, industry, or government; thus, it allows students to combine actual work experience with their college studies. Also includes bachelor’s degrees in which the normal 4 years of work are completed in 3 years.
Black: A person having origins in any of the black racial groups of Africa (except those of Hispanic origin).
Breusch-Godfrey serial correlation LM test: A statistic testing the independence of errors in least-squares regression against alternatives of first-order and higher degrees of serial correlation. The test belongs to a class of asymptotic tests known as the Lagrange multiplier (LM) tests.
Classroom teacher: A staff member assigned the professional activities of instructing pupils in self-contained classes or courses, or in classroom situations. Usually expressed in full-time-equivalents.
Cohort: A group of individuals that have a statistical factor in common (e.g., year of birth).
Cohort-component method: A method for estimating and projecting a population is distinguished by its ability to preserve knowledge of an age distribution of a population (which may be of a single sex, race, and Hispanic origin) over time.
College: A postsecondary school that offers a general or liberal arts education, usually leading to an associate’s, bachelor’s, master’s, doctor’s, or first-professional degree. Junior colleges and community colleges are included in this term.
Constant dollars: Dollar amounts that have been adjusted by means of price and cost indexes to eliminate inflationary factors and allow direct comparison across years.
Consumer Price Index (CPI): This price index measures the average change in the cost of a fixed-market basket of goods and services purchased by consumers.
Current dollars: Dollar amounts that have not been adjusted to compensate for inflation.
Current expenditures (elementary/secondary): The expendi-tures for operating local public schools and school districts, excluding capital outlay, interest on school debt, and programs outside of public elementary and secondary education. These expenditures include such items as salaries for school personnel, fixed charges, student transportation, school books and materials, and energy costs.
Current expenditures per pupil in average daily attendance (ADA): Current expenditures for the regular school term divided by the ADA of full-time pupils (or full-time-equivalency of pupils) during the term. See also Current expenditures and Average daily attendance.

162 Appendix F: Glossary
Current Population Survey: See appendix C, Data Sources.
Degree-granting institutions: Postsecondary institutions that are eligible for Title IV federal financial aid programs and that grant an associate’s or higher degree. For an institution to be eligible to participate in Title IV financial aid programs it must offer a program of at least 300 clock hours in length, have accreditation recognized by the U.S. Department of Education, have been in business for at least 2 years, and have signed a participation agreement with the Department.
Degrees of freedom: The number of free or linearly independent sample observations used in the calculation of a statistic. In a time series regression with t time periods and k independent variables including a constant term, there would be t minus k degrees of freedom.
Dependent variable: A mathematical variable whose value is determined by that of one or more other variables in a function. In regression analysis, when a random variable, y, is expressed as a function of variables x1, x2, ...xk, plus a stochastic term, then y is known as the “dependent variable.”
Disposable income: Current income received by persons less their contributions for social insurance, personal tax, and nontax payments. It is the income available to persons for spending and saving. Nontax payments include passport fees, fines and penalties, donations, and tuitions and fees paid to schools and hospitals operated mainly by the government. See also Personal income.
Doctor’s degree: An earned degree that generally carries the title of Doctor. The Doctor of Philosophy degree (Ph.D.) is the highest academic degree and requires mastery within a field of knowledge and demonstrated ability to perform scholarly research. Other doctor’s degrees are awarded for fulfilling specialized requirements in professional fields, such as education (Ed.D.), musical arts (D.M.A.), business administration (D.B.A.), and engineering (D.Eng. or D.E.S.). Many doctor’s degrees in academic and professional fields require an earned master’s degree as a prerequisite. The doctor’s degree classification includes most degrees that NCES formerly classified as first-professional degrees. Such degrees are awarded in the fields of dentistry (D.D.S. or D.M.D.), medicine (M.D.), optometry (O.D.), osteopathic medicine (D.O.), pharmacy (Pharm.D.), podiatry (D.P.M., Pod.D., or D.P.), veterinary medicine (D.V.M.), chiropractic (D.C. or D.C.M.), and law (L.L.B. or J.D.).
Double exponential smoothing: A method that takes a single smoothed average component of demand and smoothes it a second time to allow for estimation of a trend effect.
Durbin-Watson statistic: A statistic testing the independence of errors in least squares regression against the alternative of first-order serial correlation. The statistic is a simple linear transformation of the first-order serial correlation of residuals and, although its distribution is unknown, it is tested by bounding statistics that follow R. L. Anderson’s distribution.
Econometrics: The quantitative examination of economic trends and relationships using statistical techniques, and the development, examination, and refinement of those techniques.
Elementary and secondary schools: As used in this publication, includes only schools that are part of state and local school systems and also most private elementary and secondary schools, both religiously affiliated and nonsectarian. Schools not included in this term are subcollegiate departments of institutions of higher education, federal schools for Indians, and federal schools on military posts and other federal installations.
Elementary school: A school classified as elementary by state and local practice and composed of any span of grades not above grade 8.
Enrollment: The number of students registered in a given school unit at a given time, generally in the fall of a year.
Estimate: A numerical value obtained from a statistical sample and assigned to a population parameter. The particular value yielded by an estimator in a given set of circumstances or the rule by which such particular values are calculated.
Estimating equation: An equation involving observed quantities and an unknown that serves to estimate the latter.
Estimation: Estimation is concerned with inference about the numerical value of unknown population values from incomplete data, such as a sample. If a single figure is calc-ulated for each unknown parameter, the process is called point estimation. If an interval is calculated within which the parameter is likely, in some sense, to lie, the process is called interval estimation.
Expenditures: Charges incurred, whether paid or unpaid, that are presumed to benefit the current fiscal year. For elementary and secondary schools, these include all charges for current outlays plus capital outlays and interest on school debt. For degree-granting institutions, these include current outlays plus capital outlays. For government, these include charges net of recoveries and other correcting transactions other than for retirement of debt, investment in securities, or extension of credit. Government expenditures include only external transactions, such as the provision of perquisites or other payments in kind. Aggregates for groups of governments exclude intergovernmental transactions.
Expenditures per pupil: Charges incurred for a particular period of time divided by a student unit of measure, such as average daily attendance or average daily membership.
Exponential smoothing: A method used in time series analysis to smooth or to predict a series. There are various forms, but all are based on the supposition that more remote history has less importance than more recent history.
First-order serial correlation: When errors in one time period are correlated directly with errors in the ensuing time period. Also called autocorrelation.

Projections of Education Statistics to 2021 163
First-professional degree: NCES no longer uses this classification. Most degrees formerly classified as first-professional—such as M.D., D.D.S., and law degrees—are now classified as doctor’s degrees. However, master’s of divinity degrees are now classified as master’s degrees.
First-time freshman: A student attending any institution for the first time at the undergraduate level. Includes students enrolled in academic or occupational programs. Also includes students enrolled in the fall term who attended college for the first time in the prior summer term, as well as students who entered with advanced standing (college credits earned before graduation from high school).
Forecast: An estimate of the future based on rational study and analysis of available pertinent data, as opposed to subjective prediction.
Forecasting: Assessing the magnitude that a quantity will assume at some future point in time, as distinct from “estimation,” which attempts to assess the magnitude of an already existent quantity.
Four-year institution: A postsecondary institution that offers programs of at least 4 years duration or one that offers programs at or above the baccalaureate level. Includes schools that offer postbaccalaureate certificates only or those that offer graduate programs only. Also includes free-standing medical, law or other first-professional schools.
Full-time-equivalent (FTE) enrollment: A measurement equal to one student enrolled full time for one academic year. Total FTE enrollment includes full time plus the calculated equivalent of the part-time enrollment. The full-time equivalent of the part-time students can be estimated using different factors depending on the type and control of institution and level of student.
Full-time worker: In educational institutions, an employee whose position requires being on the job on school days throughout the school year at least the number of hours the schools are in session; for higher education, a member of an educational institution’s staff who is employed full time.
Function: A mathematical correspondence that assigns exactly one element of one set to each element of the same or another set. A variable that depends on and varies with another.
Functional form: A mathematical statement of the relationship among the variables in a model.
Graduate: An individual who has received formal recog nition for the successful completion of a prescribed program of studies.
Graduate enrollment: The number of students who are working towards a master’s or doctor’s degree. These enrollment data measure those students who are registered at a particular time during the fall. Graduate enrollment also includes students who are in postbaccalaureate classes, but not in degree programs.
Higher education: Study beyond secondary school at an institution that offers programs terminating in an associate’s, baccalaureate, or higher degree.
Higher education institutions (traditional classifications):
4-year institution: An institution legally authorized to offer and offering at least a 4-year program of college-level studies wholly or principally creditable toward a bachelor’s degree. A university is a postsecondary institution that typically includes one or more graduate professional schools.
2-year institution: An institution legally authorized to offer and offering at least a 2-year program of college-level studies that terminates in an associate’s degree or is principally creditable toward a baccalaureate.
See also Degree-granting institutions and Postsecondary education.
High school: A secondary school offering the final years of high school work necessary for graduation, usually including grades 10, 11, and 12 (in a 6-3-3 plan) or grades 9, 10, 11, and 12 (in a 6-2-4 plan).
Hispanic: A person of Mexican, Puerto Rican, Cuban, Central or South American or other Spanish culture or origin, regardless of race.
Independent variable: In regression analysis, a random variable, y, is expressed as a function of variables x1, x2, ...xk, plus a stochastic term; the x’s are known as “independent variables.’’
Interpolation: See Linear interpolation.
Lag: An event occurring at time t + k (k > 0) is said to lag behind an event occurring at time t, the extent of the lag being k. An event occurring k time periods before another may be regarded as having a negative lag.
Lead time: When forecasting a statistic, the number of time periods since the last time period of actual data for that statistic used in producing the forecast.
Linear interpolation: A method that allows the prediction of an unknown value if any two particular values on the same scale are known and the rate of change is assumed constant.
Master’s degree: A degree awarded for successful completion of a program generally requiring 1 or 2 years of full-time college-level study beyond the bachelor’s degree. One type of master’s degree, including the Master of Arts degree, or M.A., and the Master of Science degree, or M.S., is awarded in the liberal arts and sciences for advanced scholarship in a subject field or discipline and demonstrated ability to perform scholarly research. A second type of master’s degree is awarded for the completion of a professionally oriented program, for example, an M.Ed. in education, an M.B.A. in business administration, an M.F.A. in fine arts, an M.M. in music, an M.S.W. in social work, and an M.P.A. in public

164 Appendix F: Glossary
administration. Some master’s degrees—such as divinity degrees (M.Div. or M.H.L./Rav), which were formerly classified as “first-professional”—may require more than 2 years of full-time study beyond the bachelor’s degree.
Mean absolute percentage error (MAPE): The average value of the absolute value of errors expressed in percentage terms.
Model: A system of postulates, data, and inferences presented as a mathematical description of a phenomenon, such as an actual system or process. The actual phenomenon is represented by the model in order to explain, predict, and control it.
Native Hawaiian or other Pacific Islander: A person having origins in any of the original peoples of Hawaii, Guam, Samoa, or other Pacific Islands.
Nonresident alien: A person who is not a citizen or national of the United States and who is in this country on a visa or temporary basis and does not have the right to remain indefinitely.
Ordinary least squares (OLS): The estimator that minimizes the sum of squared residuals.
Parameter: A quantity that describes a statistical population.
Part-time enrollment: Undergraduate—A student enrolled for either 11 semester credits or less, or 11 quarter credits or less, or less than 24 contact hours a week each term. Graduate—A student enrolled for either 8 semester credits or less, or 8 quarter credits or less.
Personal income: Current income received by persons from all sources minus their personal contributions for social insurance. Classified as “persons” are individuals (including owners of unincorporated firms), nonprofit institutions serving individuals, private trust funds, and private noninsured welfare funds. Personal income includes transfers (payments not resulting from current production) from government and business such as social security benefits, military pensions, and so forth, but excludes transfers among persons.
Postbaccalaureate enrollment: The number of students with a bachelor’s degree who are enrolled in graduate-level or first-professional courses.
Postsecondary education: The provision of a formal instructional program whose curriculum is designed primarily for students who are beyond the compulsory age for high school. This includes programs whose purpose is academic, vocational, and continuing professional education, and excludes avocational and adult basic education programs.
Postsecondary education institution: An institution which has as its sole purpose or one of its primary missions, the provision of postsecondary education.
Private institution: A school or institution that is controlled by an individual or agency other than a state, a subdivision of a state, or the federal government (i.e., usually supported primarily by other than public funds) and the operation of whose program rests with other than publicly elected or appointed officials.
Projection: In relation to a time series, an estimate of future values based on a current trend.
Property tax: The sum of money collected from a tax levied against the value of property.
Public school or institution: A school or institution controlled and operated by publicly elected or appointed officials, and generally deriving its primary support from public funds.
Pupil/teacher ratio: The enrollment of pupils at a given period of time, divided by the full-time-equivalent number of classroom teachers serving these pupils during the same period.
R2: The coefficient of determination; the square of the correlation coefficient between the dependent variable and its OLS estimate.
Race/ethnicity: Categories used to describe groups to which individuals belong, identify with, or belong in the eyes of the community. The categories do not denote scientific definitions of anthropological origins. A person may be counted in only one group. The groups used to categorize U.S. citizens, resident aliens, and other eligible non-citizens in this report are as follows: Black, American Indian/Alaska Native, Asian/Pacific Islander, Hispanic, White, and Two or more races.
Region: The four geographical regions of the United States as defined by the Census Bureau of the U.S. Department of Commerce presented below:
Northeast: Connecticut, Maine, Massachusetts, New Hampshire, New Jersey, New York, Pennsylvania, Rhode Island, and Vermont.
Midwest: Illinois, Indiana, Iowa, Kansas, Michigan, Minnesota, Missouri, Nebraska, North Dakota, Ohio, South Dakota, and Wisconsin.
South: Alabama, Arkansas, Delaware, District of Columbia, Florida, Georgia, Kentucky, Louisiana, Maryland, Mississippi, North Carolina, Oklahoma, South Carolina, Tennessee, Texas, Virginia, and West Virginia.
West: Alaska, Arizona, California, Colorado, Hawaii, Idaho, Montana, Nevada, New Mexico, Oregon, Utah, Washington, and Wyoming.
Regression analysis: A statistical technique for investigating and modeling the relationship between variables.

Projections of Education Statistics to 2021 165
Revenue receipts: Additions to assets that do not incur an obligation that must be met at some future date and do not represent exchanges of property for money. Assets must be available for expenditures.
Revenues: All funds received from external sources, net of refunds and correcting transactions. Noncash transactions such as receipt of services, commodities, or other receipts “in kind’’ are excluded, as are funds received from the issuance of debt, liquidation of investments, or nonroutine sale of property.
Rho: A measure of the correlation coefficient between errors in time period t and time period t minus 1.
Salary: The total amount regularly paid or stipulated to be paid to an individual, before deductions, for personal services rendered while on the payroll of a business or organization.
School: A division of the school system consisting of students in one or more grades or other identifiable groups and organized to give instruction of a defined type. One school may share a building with another school or one school may be housed in several buildings.
Secondary instructional level: The general level of instruction provided for pupils in secondary schools (generally covering grades 7 through 12 or 9 through 12), and any instruction of a comparable nature and difficulty provided for adults and youth beyond the age of compulsory school attendance.
Secondary school: A school including any span of grades beginning with the next grade following elementary or middle school (usually 7, 8, or 9) and ending with or below grade 12. Both junior high schools and senior high schools are included.
Senior high school: A secondary school offering the final years of high school work necessary for graduation.
Serial correlation: Correlation of the error terms from different observations of the same variable. Also called autocorrelation.
Standard error of estimate: An expression for the standard deviation of the observed values about a regression line. An estimate of the variation likely to be encountered in making predictions from the regression equation.
Student: An individual for whom instruction is provided in an educational program under the jurisdiction of a school, school system, or other educational institution. No distinction is made between the terms “student” and “pupil,” although “student” may refer to one receiving instruction at any level while “pupil” refers only to one attending school at the elementary or secondary level. The term “student” is used to include individuals at all instructional levels. A student may receive instruction in a school facility or in another location, such as at home or in a hospital. Instruction may
be provided by direct student-teacher interaction or by some other approved medium, such as the Internet, television, radio, telephone, or correspondence.
Tax base: The collective value of sales, assets, and income components against which a tax is levied.
Time series: A set of ordered observations on a quantitative characteristic of an individual or collective phenomenon taken at different points in time. Usually the observations are successive and equally spaced in time.
Time series analysis: The branch of quantitative forecasting in which data for one variable are examined for patterns of trend, seasonality, and cycle.
Two or more races: A person identifying himself or herself as of two or more of the following race groups: White, Black, Asian, Native Hawaiian or Other Pacific Islander, or American Indian or Alaska Native.
Two-year institution: A postsecondary institution that offers programs of at least 2 but less than 4 years duration. Includes occupational and vocational schools with programs of at least 1800 hours and academic institutions with programs of less than 4 years. Does not include bachelor’s degree-granting institutions where the baccalaureate program can be completed in 3 years.
Undergraduate enrollment: The number of students enrolled in a 4- or 5-year bachelor’s degree program, an associate’s degree program, or a vocational or technical program below the baccalaureate.
Undergraduate students: Students registered at an institution of higher education who are working in a program leading to a baccalaureate or other formal award below the baccalaureate, such as an associate’s degree.
Ungraded student (elementary/secondary): A student who has been assigned to a school or program that does not have standard grade designations.
Variable: A quantity that may assume any one of a set of values.
White: A person having origins in any of the original peoples of Europe, North Africa, or the Middle East (except those of Hispanic origin).
Years out: In forecasting by year, the number of years since the last year of actual data for that statistic used in producing the forecast.


www.ed.gov
ED PubsU.S. Department of EducationP.O. Box 22207Alexandria, VA 22304
ies.ed.gov