project test plan - utah broadband outreach center · pdf filedefining the requirements ......
TRANSCRIPT

Thinking outside the sphere
www.isotrope.im Isotrope, LLC ◦ 505 Main Street ◦ Medfield, MA ◦ 02052 508 359 8833
PROJECT TEST PLAN
IN SUPPORT OF THE
WIRELESS VERIFICATION FOR THE STATE OF UTAH RFP
June 20, 2011
[Ed note: this Test Plan was annotated September 1, 2011 to report minor changes made to the Test Plan.
Annotations use this editorial format.]
Contact:
Steve Riggs, COO
Isotrope, LLC
508 359 8833 ext 205

Isotrope, LLC
2
CONTENTS Scope ....................................................................................................................................................... 3
Defining the Requirements ....................................................................................................................... 3
“Broadband”......................................................................................................................................... 3
Project Goals ........................................................................................................................................ 5
Drive Test ............................................................................................................................................. 6
Services to Measure.............................................................................................................................. 7
Test System Primary Configuration ......................................................................................................... 11
Main Platform Data ................................................................................................................................ 12
WiMAX and WiFi Platforms ..................................................................................................................... 20
Test Apparatus ................................................................................................................................... 21
Test Program Execution .......................................................................................................................... 22
Resumes…………………………………………………………………………………………………………………………………………………..29
Isotrope, LLC
3
SCOPE
Isotrope, LLC is contracted to the International Research Center, LLC to conduct a statewide
“drive test” survey of the availability of mobile wireless broadband services in Utah. The
project is in support of the State of Utah Public Service Commission’s efforts, with the aid of
federal State Broadband Data and Development Grant Program.
DEFINING THE REQUIREMENTS
“BROADBAND” The provision of broadband service in the USA is a national priority. At the spring 2011 CTIA
(The Wireless Association) conference March 22, 2011, FCC Chairman Julius Genachowski
spoke at length of the role of broadband in our society. Among his remarks, he said,
A … report by McKinsey concluded that better utilization of broadband is essential to
boosting productivity and growing our economy. That’s why the FCC developed the
country’s first National Broadband Plan a year ago – to identify the key strategic issues
our country faces, and set a path forward. One strategic challenge is extending the
benefits to the nearly 100 million Americans who currently aren’t connected.
(www.fcc.gov)
WO R KI N G S P E C I F I C A T I O N
In 2009, the Broadband Technology Opportunities Program (“BTOP”) began the push for
universal broadband availability. The NTIA Notice of Funds Availability describes “broadband”
this way,
Broadband means providing two-way data transmission with advertised speeds of at
least 768 kilobits per second (kbps) downstream and at least 200 kbps upstream to end
users, or providing sufficient capacity in a Middle Mile project to support the provision of
broadband service to end users.1
Clearly, because the NTIA under the auspices of the SBDD is the administrator of the Project
funding, this is the official threshold for benchmarking performance in Utah – services that
1 NTIA NOFA, Federal Register, Vol. 74, p. 33104, July 9, 2009

Isotrope, LLC
4
have the potential of offering 768 kbps downlink/200 kbps uplink throughput or better
(“≥768/200 Service”).2
By using ≥768/200 Service as a guideline for the development of a Test Plan for the Project,
those services that are not capable of delivering true broadband performance can be
eliminated from consideration. This is particularly important in a cost-benefit assessment, in
which millions of data points, each represented by hundreds of bytes of data, are collected
over thousands of miles of roadway. The two primary burdens caused by over-collecting data
are 1) committing resources in the test platform design, programming and operation to the
measurement of services that are incapable by design of providing the minimum throughput,
and 2) committing resources to post processing and presenting the data of such services.
FO C U S O N BR O A D BA ND -CA P A B L E W I R E L E S S T E C H NO L O G I E S
As further described below in Services to Measure, incumbent wireless networks consist of
layers of several generations of technology, which may require certain hardware and software
decisions to be made to ensure that the focus of the test and measurement program remains
on the objective – broadband performance measurement.
The Test Plan focuses focus on those wireless technologies that are capable of delivering least
≥768/200 Service, even if they might fall short in actual performance at some locations. These
technologies include3 3G and 4G services, as well as networks that have followed lower cost
network upgrades only to the most current of the 2G versions4, which can be capable of
crossing the 768/200 kbps threshold under appropriate circumstances. To the extent a
provider’s service and the data collection system both automatically shift down to slower
technologies when fully broadband speeds are unavailable, key data will continue to be
collected.
The test apparatus will log the actual Link Technology5 being employed between the user
equipment (“UE”) and the base facility with each measurement. This is particularly helpful in
two ways. First, information on the specific Link Technologies available by location by provider
2 It may be interesting to note that the FCC recently raised the bar on its definition of broadband. The National Broadband Plan recommends as a national broadband availability target that every household in America have access to affordable broadband service offering actual download (i.e., to the customer) speeds of at least 4 Mbps and actual upload (i.e., from the customer) speeds of at least 1 Mbps…. this speed threshold provides an appropriate benchmark for measuring whether broadband deployment to all Americans is proceeding in a reasonable and timely fashion. FCC, Sixth Broadband Deployment Report, July 20, 2010.
3 We mark in boldface items that were specifically responsive to section 2.2 of the RFP
4 e.g. “2.5G” or “2.9G” technologies, as they are informally named.
5 When referring to “Link Technologies” we include the various communications air interface protocols such as CDMA, EVDO RevA, LTE, GSM, EDGE, HSPA+, WiMAX and the like.

Isotrope, LLC
5
will support informal Broadband Map validation efforts. Even if there are temporary
shortcomings in performance due to such factors as limited backhaul capacity or high traffic
load at the time of measurement, one can infer the maximum practicable throughput based on
the installed technology. (Also, a discrepancy between the potential throughput of a Link
Technology and its actual performance at a cell site could be a valuable indicator of what may
be needed to improve performance in a particular area.)
The second role of logging the best available Link Technology for each service provider at each
measurement is as an indicator of things to come. Even today, many 3G technologies may be
selectively deployed only to urban and denser residential and higher traffic areas. Because
these are the higher-value locations, and because 4G technologies have only begun to be
deployed, today’s 3G locations are also the most likely locations for initial deployment of 4G
services. By differentiating the collected field data among the applicable 2G, 3G and 4G
services provided by each service provider, there will be a more complete picture of not only
the current state of the networks, but also of their likely growth patterns.
PROJECT GOALS
“SNA P S H O T”
The Project’s Request for Proposals6 (“RFP”) indicates in its §1.1 Scope the fundamental goal of
the Project is, “to provide a real-world snapshot of mobile wireless and potentially fixed
wireless broadband data performance and coverage measurements to its portfolio of
verification data and sources.”
The data collection platform includes augmented GPS logging of time and position of each data
point. The output of the test will include various families of tabular files, described further
below, representing the key indicators of each carrier and technology monitored.
BR O A D BA N D T H R O U G H P U T R A T E S A ND S E R V I C E S T H A T A R E CO NF I G U R E D
For the fundamental snapshot of mobile wireless broadband performance in Utah, the Project
objective is stated in section 2.2 of the RFP as “Wireless Drive Testing.”
The data collection will capture typical data throughputs along the drive route. It should be
understood that for a given location in a communications network, mobile wireless data
transfer is inherently slower than fixed wireless data transfer for a variety of reasons.
6 International Research Center, LLC Wireless Verification for the State of Utah RFP, April 15, 2011

Isotrope, LLC
6
The broadband map is based on “maximum advertised” data rates7 as required by NTIA
BTOP/SBDD definition of broadband (“advertised speeds”)8 During the test, the characteristics
of the currently serving cell sites will be collected. Regardless of the actual data transfer speed
at the time of data collection, the cell site configuration will identify the maximum practicable
throughput available, under perfect conditions. This metric is the most consistent with the
maximum advertised speeds. In post processing, a relationship between the maximum and
the typical mobile performance can be established for each wireless technology and region
(urban/suburban/rural).
DRIVE TES T The drive test will cover the three road classifications identified in the RFP. A modified Drive
Test road inventory provided by Utah AGRC and approved by Isotrope will be employed for the
test.
The project team will arrive in Salt Lake City on or about June 29, 2011. The test platform will
be installed on June 30. To the extent that Utah representatives can be present, Isotrope will
be available on the afternoon of June 30 for staff to observe the installation and setup process
for the drive test gear. The test gear will be operational by July 1, at which time (if not sooner)
a trial run will be performed and the data will be evaluated. Once the test gear is confirmed as
working properly, the drive test will commence.
The initial drive team will consist of David Maxson and Steve Riggs of Isotrope. As time
progresses, there may be an occasional substitution of other personnel for either Mr. Maxson
or Mr. Riggs, but not both at the same time. Decisions on substitutions, with whom and
if/when, will be made ad hoc. Isotrope will make such substitutions without advance approval
from IRC, on the condition that either Mr. Maxson or Mr. Riggs is participating in the conduct
of the test in person.
7 http://utah.gov/broadband/map.html
8 In contrast, for semiannual FCC reporting, service providers must file form 477, II.a. which
says “…entities that are facilities-based providers of broadband connections – which, for purposes of this information collection, are wired “lines” or wireless “channels” that enable the end user to receive information from and/or send information to the internet at information transfer rates exceeding 200 kbps in at least one direction – must complete and file the applicable portions of this form...” This criterion lacks the word “advertised.”

Isotrope, LLC
7
SERVICES TO MEASURE The primary objective of the Project is to conduct a statewide drive test of mobile wireless
telecommunications services.
M O BI L E S E R V I C E S
Mobile broadband services in the following personal wireless service hyperbands will be
included in the test. These are the Commercial Mobile Radio Services under Title 47 of the
Code of Federal Regulations.
C E L L U L A R
The spectrum that the FCC labels as the cellular service band is the original set of frequencies
between 824 MHz and 894 MHz that the first two cellular telephone companies in each market
were licensed to occupy. This service is articulated in FCC regulations 47 CFR §22.900 et seq –
Cellular Radiotelephone Service. This service continues to be utilized today. It evolved from
its analog start in the 1980’s to a full-fledged digital service offering the new generation
services as they evolved (the various “2G” and “3G” technologies, for example).
P C S
The FCC service spectrum that was auctioned beginning in 1995 was called Personal
Communications Service (“PCS”). This service is codified in 47 CFR 24, Personal
Communications Services and consists of two classes – Narrowband and Broadband.
Naturally, it is the Broadband PCS assigned to frequency blocks in the range of 1900 MHz that
is of interest to the Project.
O T H E R M O B I L E S E R V I C E S
Other services that will be used by wireless service providers to deliver mobile broadband
connectivity include certain bands listed in 47 CFR 27, Miscellaneous Wireless
Communications Services, such as the Advanced Wireless Service (“AWS”), Broadband Radio
Service (“BRS”) and the 700 MHz service.
Table 1 shows in which county each mobile wireless service provider holds a license to provide
services. Some additional detail about certain local and regional service providers is
incorporated in the table.

Isotrope, LLC
8
Bea
ver
Bo
x El
der
Cac
he
Car
bo
n
Dag
gett
Dav
is
Du
ches
ne
Emer
y
Gar
fiel
d
Gra
nd
Iro
n
Juab
Kan
e
Mill
ard
Mo
rgan
Piu
te
Ric
h
Salt
Lak
e
San
Ju
an
San
pet
e
Sevi
er
Sum
mit
Too
ele
Uin
tah
Uta
h
Was
atch
Was
hin
gto
n
Way
ne
We
ber
ATT GSM UMTS/GPRS • Cell/PCS/AWS X X X X X X X X X X X X X X X X X X X X X X X X X X X X X
ATT LTE • 700 MHz X X X X X X X X X X X
Sprint PCS CDMA X X X X X X X X X X X X X X X X X X X X X X X X X X X X
T-Mobile GSM UMTS/GPRS • PCS/AWS X X X X X X X X X X X X X X X X X X X X X X X X X X X X
Clearwire WiMAX
X X X X X X X
X
X
X X X X X
X X X X X X X
X X
Leap CDMA EVDO • PCS X X x x X x x r x r x x x x x x X x x x x X x X X r x X
VZW CDMA EVDO • Cell/PCS/AWS X X X X X X X X X X X X X X X X X X X X X X X X X X X X
VZW LTE •700 MHz X X X X X X X X X X X X X X X X X X X X X X X X X X X X X
Manti (Breakaway) CDMA EVDO • PCS x
x
x x x x
x
x X x
x x x
Strata Uintah Basin CDMA, 1xRTT • Cell/PCS/AWS x x X x x x X x
All West Wireless: CDMA 1xRTT • PCS
x
x
Silverstar PCS (wyoming)
x
Chinook (cellular one) x x
Smith Bagley (Cellular One)
x
Commnet PCS (roaming provider) X X X X
Commnet 700 (roaming Provider) X X
Union PCS
x
x
x
x
x
x
Union 700 MHz x
x
x
x
x
TABLE 1- INVENTO RY OF RELEVANT SERVICE PROVIDERS
o Any appearance of the letter “X” or “x” indicates carrier is a holder of one or more FCC licenses in county,
o Bold Capital X indicates a comparison was made with the Utah Broadband Map and the carrier shows broadband service in that county
o lower case x indicates FCC licensed in county, but not shown on BB or provider map as native service,
black lower case x indicates provider map or BB map shows roaming data,
blue lower case x shows no service on provider BB map
o lower case r indicates carrier shows on BB map that it has roaming service in county where is has no license of its own

9
C A R R I E R S U N D E R T E S T
The primary providers of mobile broadband wireless services are the familiar first-tier national
carriers who have been providing wireless telephone services to the marketplace: T-Mobile,
Sprint, AT&T Mobility, and Verizon Wireless. Second tier national providers Leap Wireless and
Clearwire are also included. National provider MetroPCS is licensed in the region, but public
information indicates that service to the Utah market has not yet been launched.
Local and regional providers are considered; however Table 1- Inventory of Relevant Service
Providers illustrates how several such providers are not active in the state. Two exceptions are
noted. According to advertising and to the information accumulated on the Utah BB map,
Manti (Breakaway) and Strata (Uintah Basin) are active in a total of three Utah counties. To
the extent these providers offer broadband or near-broadband service, they shall be included
in the test.
CO U NT Y M A T R I X
The test is conducted statewide, with routes repeatedly crossing county lines. To ensure an
efficient testing process that provides comprehensive results for all mobile wireless broadband
service providers, the test system must be configured to capture all relevant services in each
county. A key method of minimizing technical and operational complexity will be to exploit
roaming arrangements among service providers. If a regional or local service provider’s
network will be accessed under a roaming agreement routinely by a major carrier that lacks
native service in a particular county, there will be no need to reconfigure the test gear to
access the local or regional provider’s service directly. The test system will log roaming activity
and identify the network on which the device is roaming.
To facilitate the use of roaming in the test program, project stakeholders have agreed to report
to Isotrope how each provider roams in non-native counties, if such information is available
from cooperating providers. Isotrope will adjust the providers provisioned in the test system,
by county, to accommodate any services that might otherwise be missed with the primary
configuration of the test system. The primary configuration is outlined in a section below.
S E R V I C E S U N D E R T E S T
The voice communications service providers utilize one of two families of technology: GSM or
CDMA. These are the names for the second generation (“2G”) technologies that form the
foundations of their networks. Each technology was expanded upon since their inception in
the 1990’s.
AT&T and T-Mobile offer service on a GSM platform. GSM was expanded with data services
such as the early GPRS, and the more recent EDGE. The third generation technology – HSPA –
has been adopted by T-Mobile and AT&T among others. Recently, the HSPA technology has
been further expanded in scope, enabling it to earn designation as a 4G technology.
Sprint, Leap and Verizon offer service on the CDMA platform. Basic CDMA technology (under
the IS-95 specification, then CDMA2000) has been expanded with data services called 1xRTT,
and subsequently EVDO

10
Technology Category Data Technology Version Throughput Rates - Theoretical
GSM GPRS
Up to 100 kbps forward link, depending on assignment of 1 to 5 time slots and of one of 4 coding schemes dependent on signal reception quality
9
EDGE Up to 300 kbps forward
CDMA 2000
1xRTT 154 kbps packet data with 50-90 kbps average end user
1xEV-DO Release 0 2.4 Mbps peak, 400-700 kbps average end user rate
Enhanced EV-DO, Revision A 3.1 MBPS forward (1.8 Mbps reverse)
Scalable Bandwidth EV-DO Aggregates up to 15 radio channels for up to 48 Mbps forward (27 Mbps reverse)
UMTS
Release 99 64 kbps circuit/384 kbps packet data – 64-250 kbps average end user
HSDPA Release 5 1.8 to 14.4 Mbps forward link, scaled by amount of resources assigned to user
HSUPA Release 6 5.7 Mbps reverse link
HSPA+ Release 7 28/11 Mbps forward/reverse
HSPA+ Release 8 42/11
HSPA+ Release 9 & 10 84-168/23
HSPA+ Advanced 336/46
LTE 73-150/36-75 Mbps LTE Advanced Up to 1 Gbps/375 Mbps
WIMAX
Up to 63 Mbps in a 10 MHz radio channel, ideal conditions and use of MIMO multi-antenna technology. Double that for 20 MHz channels.
TABLE 2 - LINK TECHNOLOGIES AND THEIR DATA BANDWIDTH CAPABILITIES
The sole operator of mobile WiMAX services10
in Utah is Clearwire. Deployment in Utah is
presently limited to portions of urban areas. Unlike the CDMA and GSM families of services,
the Clearwire WiMAX network consists of one link technology that will operate within a single
9 All current data transmission technologies in this table adjust data rate depending on radio
channel bandwidth available and the quality of the link between base station and subscriber.
Maximum theoretical throughput is based on maximum assignment of channel bandwidth to the
data transfer and on best quality signal conditions.
10 Mobile WiMAX services are set up on a regional “cellular” model and are designed to reach
mobile and nomadic devices.
11
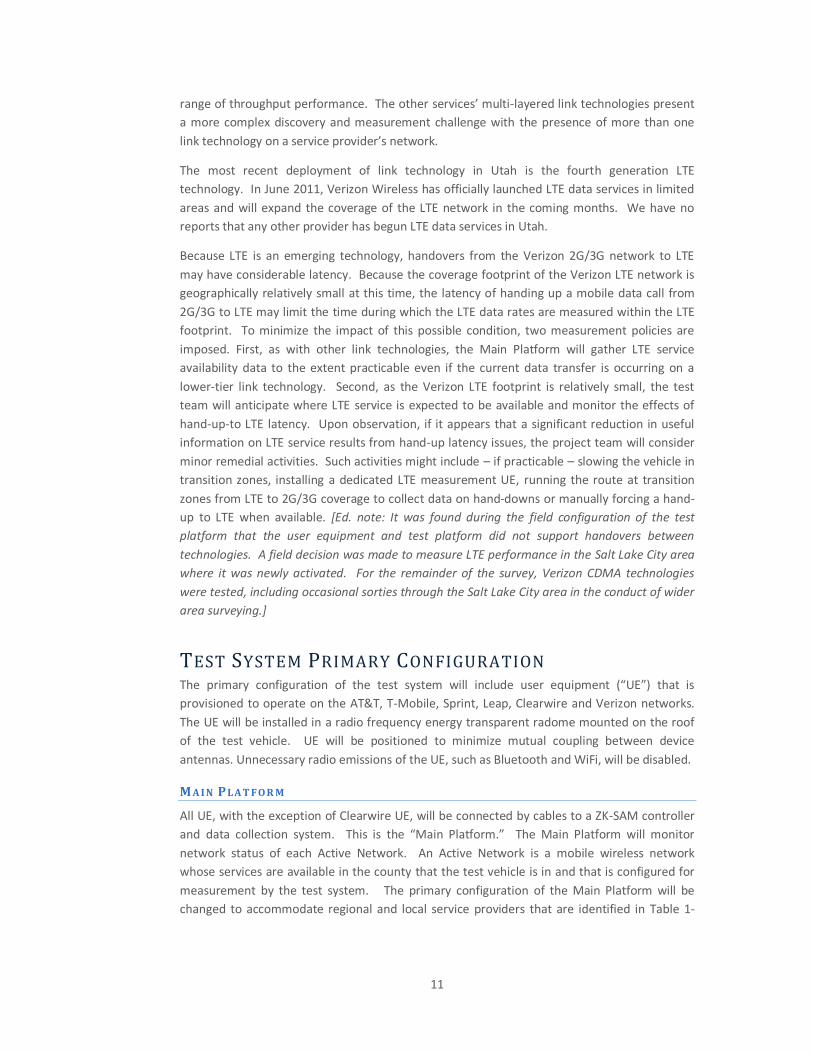
range of throughput performance. The other services’ multi-layered link technologies present
a more complex discovery and measurement challenge with the presence of more than one
link technology on a service provider’s network.
The most recent deployment of link technology in Utah is the fourth generation LTE
technology. In June 2011, Verizon Wireless has officially launched LTE data services in limited
areas and will expand the coverage of the LTE network in the coming months. We have no
reports that any other provider has begun LTE data services in Utah.
Because LTE is an emerging technology, handovers from the Verizon 2G/3G network to LTE
may have considerable latency. Because the coverage footprint of the Verizon LTE network is
geographically relatively small at this time, the latency of handing up a mobile data call from
2G/3G to LTE may limit the time during which the LTE data rates are measured within the LTE
footprint. To minimize the impact of this possible condition, two measurement policies are
imposed. First, as with other link technologies, the Main Platform will gather LTE service
availability data to the extent practicable even if the current data transfer is occurring on a
lower-tier link technology. Second, as the Verizon LTE footprint is relatively small, the test
team will anticipate where LTE service is expected to be available and monitor the effects of
hand-up-to LTE latency. Upon observation, if it appears that a significant reduction in useful
information on LTE service results from hand-up latency issues, the project team will consider
minor remedial activities. Such activities might include – if practicable – slowing the vehicle in
transition zones, installing a dedicated LTE measurement UE, running the route at transition
zones from LTE to 2G/3G coverage to collect data on hand-downs or manually forcing a hand-
up to LTE when available. [Ed. note: It was found during the field configuration of the test
platform that the user equipment and test platform did not support handovers between
technologies. A field decision was made to measure LTE performance in the Salt Lake City area
where it was newly activated. For the remainder of the survey, Verizon CDMA technologies
were tested, including occasional sorties through the Salt Lake City area in the conduct of wider
area surveying.]
TEST SYSTEM PRIMARY CONFIGURATION The primary configuration of the test system will include user equipment (“UE”) that is
provisioned to operate on the AT&T, T-Mobile, Sprint, Leap, Clearwire and Verizon networks.
The UE will be installed in a radio frequency energy transparent radome mounted on the roof
of the test vehicle. UE will be positioned to minimize mutual coupling between device
antennas. Unnecessary radio emissions of the UE, such as Bluetooth and WiFi, will be disabled.
M A I N P L A T F O R M
All UE, with the exception of Clearwire UE, will be connected by cables to a ZK-SAM controller
and data collection system. This is the “Main Platform.” The Main Platform will monitor
network status of each Active Network. An Active Network is a mobile wireless network
whose services are available in the county that the test vehicle is in and that is configured for
measurement by the test system. The primary configuration of the Main Platform will be
changed to accommodate regional and local service providers that are identified in Table 1-

12
Inventory of Relevant Service Providers, as needed. [Ed. note: due to the success of roaming
data collection, Main Platform configuration remained constant throughout the survey.]
W I MAX P L A T F O R M
A Clearwire UE will be connected to a computer that will control data collection. This is the
“WiMAX Platform.”
W I F I P L A T F O R M
The stakeholders and Isotrope agreed to add a WiFi “wardrive” to the test program. This test
will be performed with an external antenna connected to a computer running wardrive data
collection software. The software will be configured to log the appearance of WIFi nodes that
are configured as access points. The results will include personal, industrial, commercial
private and commercial public access points. As the software scrolls through the unlicensed
spectrum that includes the 802.11a/b/g/n link technologies, it will repeatedly capture some
access points’ communications, providing a range of locations where a particular access point
is accessible.
MAIN PLATFORM DATA The following data will be collected for each link technology monitored. Data are collected in
various record formats depending on the link technology and the information collected. In
general, the data collected on each link technology will include signal characteristics such as
signal strength and signal-to-noise-and-interference ratio. The characteristics of the
communications link between the base station and the UE are logged, including such attributes
as cell ID, carrier ID, the settings of the link technology (from which maximum practicable
bandwidth can be inferred). Events such as handovers and connection failures will be logged.
In addition to the status information on the communications link, the data throughput test will
log data transfer rates at regular intervals, even if a file transfer does not complete. Where
applicable, the throughput rates of completed file transfers will be available, although in some
instances it will require post-processing of the data to identify start and end times of the file
transfers.
P O R T
Each record or file, as applicable, will be identified with a port number indicating the UE that is
connected to the data collection. The Primary Configuration will maintain a consistent use of
the same port for the same service provider. When a UE must be changed to one that is
subscribed to a difference service provider, a notation of the time and data of the change will
be made in the Field Test Log. In addition, many records will contain the unique identifier of
the wireless carrier whose network is being accessed by the UE at a given time and whether
that connection is native or roaming from the service provider the UE is subscribed to.

13
Port Primary Configuration Service
Provider
1 AT&T
2 T-Mobile
3 Leap
4 Sprint
5 Verizon
GPS A ND T I M E
Each record will contain GPS time and GPS coordinates. The GPS receiver is independent of
the UE and will provide a master time and position value that will be consistent among the
data collected on all five ports. The GPS receiver employs an augmentation protocol that
increases the specified accuracy to better than 7.6 m horizontal offset 95% of the time. A wide
ranging study found the actual offsets to be typically less than 3 m 95% of the time. Other
equipment will also be logging GPS time and coordinates independently, in the event of a
primary GPS failure.
Attribute Note
Date
Time – Local
Time – UTC Offset
Latitude Blank until first fix is acquired. Updates in
every record. Holds last value if fix is lost.
(See Fix)
Longitude Blank until first fix is acquired. Updates in
every record. Holds last value if fix is lost.
(See Fix)
Fix? Blank if fix is lost
The following tables provide lists of key attributes that will be collected based on the link
technology in use. Different record/field structures are described in separate tables. Data files
will be segregated accordingly. All records have a time/location stamp.

14
CDMA PC
Attribute Note
Time/Date/GPS Information
UE Port
Status Phone is either Synchronizing, Paging, or
Handling Traffic.
Hyperband Cellular, PCS, AWS…
Frequency Channel # Based on standard for the applicable
hyperband
Receive AGC (also called “RSSI”)
Transmit Power Adjustment Indicates how hard UE is working to stay
linked to base
Base Station ID Carrier Assigned Identifier
System ID Carrier Assigned Identifier
Network ID Standard Nationwide ID for Carrier
Aggregate Ec/Io of active codes A signal to interference ratio indicating
quality of the radio channel in use
Number of active codes Number of cell site sectors available and
activated for carrying a call
CDMA HA ND O F F S HC
Attribute Note
Time/Date/GPS/Port Information
Before Handoff After Handoff
Phone State
Hyperband
Frequency channel
AGC (“RSSI”)
Frame Error Rate
Base ID
System ID
Network ID

15
GSM PG
Attribute Note
Time/Date/GPS/ Port Information
Hyperband Cellular, PCS…
Frequency Channel # Based on standard for the applicable
hyperband
Base Station ID
RSSI 28 RSSI sub – accounts for discontinuous
mode transmissions
Receive Data Quality 8 point scale corresponds to BER
Transmit Power Adjust Indicates how hard UE is working to stay
linked to base
Timing Advance Indicates if distance from cell site is significant
Carrier to Interference Ratio A signal to interference ratio indicating
quality of the radio channel in use
Network Code
GSM N E I G H BO R S NG
Attribute Note
Time/Date/GPS/ Port Information
Repeats for serving channel and up to 6
neighbors:
Serving channel blank if in UMTS mode
Hyperband Cellular, PCS…
Frequency Channel # Based on standard for the applicable
hyperband
Base Station ID
RSSI 28 RSSI sub – accounts for discontinuous
mode transmissions

16
GSM HA ND O F F HG
Attribute Note
Time/Date/GPS/ Port Information
Before Handoff After handoff
Hyperband Cellular, PCS…
Frequency Channel # Based on standard for the applicable hyperband
Base Station ID
RSSI 28 RSSI sub – accounts for discontinuous mode
transmissions
Receive Data Quality 8 point scale corresponds to BER
Transmit Power Adjust Indicates how hard UE is working to stay linked to
base
Timing Advance Indicates if distance from cell site is significant
Carrier to Interference Ratio A signal to interference ratio indicating quality of
the radio channel in use
Network Code
UMTS PU
Attribute Note
Time/Date/GPS/ Port Information
Hyperband Cellular, PCS…
Device State 19 Idle, Paging, Dedicated…
Frequency Channel #
21
Based on standard for the applicable
hyperband
RSSI 24 Carrier RSSI for specific scrambling code
Mobile Network Code 33
Location Area Code 34
Cell ID 38
Number of Inter-frequency Channels
Available 41
Communications channels available on other
RF channels
Number of Active Channels 45 Up to 6
Number of Intra-frequency Neighbors 46 Neighbors found on same frequency and
same communications code
Active Code Ec/Io 49 Signal to interference ratio
Active Code RSCP 50 Received Pilot Signal Code Power
RSSI 51 Received Channel Code Power
Repeat previous four items for up to six Actives

17
UMTS HA ND O F F HU
Attribute Note
Time/Date/GPS/Port Information
Before Handoff After Handoff
Device State 19 Idle, Paging, Dedicated…
Hyperband 20
Frequency channel 21
RSSI 24
Mobile Network Code 33
Location Area Code 34
Cell ID 38
Number of Inter-frequency Channels
Available 41
Communications channels available on other
RF channels
Number of Active Channels 45 Up to 6
Number of Intra-frequency Neighbors 46 Neighbors found on same frequency and
same communications code
Active Code Ec/Io 49 Signal to interference ratio
Active Code RSCP 50 Received Pilot Signal Code Power
RSSI 51 Received Channel Code Power
Repeat previous four items for up to six Actives
EVDO PE
Attribute Note
Time/Date/GPS/Port Information
Device State 16 Acquisition, Sync, Idle, Access, Connected
Hyperband 26
Frequency channel 27
Serving Pilot SINR 29 Signal to interference and noise ratio of pilot channel
RSSI Antenna 1
RSSI Antenna 2
Sector ID 24 LSB of Sector ID
Number of pilots in active set Up to 6
Number of Pilots in Candidate Set
Transmit Power Adjustment Indicates how hard UE is working to stay linked to base
Number of active codes Number of cell site sectors available and activated for
carrying a call

18
EVDO HA N D O F F HE
Attribute Note
Time/Date/GPS/Port Information
Before Handoff After Handoff
Device State 16 Acquisition, Sync, Idle, Access, Connected
Hyperband 26
Frequency channel 27
Serving Pilot SINR 29 Signal to interference and noise ratio of pilot
channel
RSSI Antenna 1
RSSI Antenna 2
Sector ID 24 LSB of Sector ID
Number of pilots in active set Up to 6
Number of Pilots in Candidate Set
Transmit Power Adjustment Indicates how hard UE is working to stay linked
to base
Number of active codes Number of cell site sectors available and
activated for carrying a call
LTE, LTE HA N D O F F PL, HL
New technology upgrade to test gear. Available attributes are not formally documented yet.
Isotrope will identify attributes similar to those in other technologies and generate a set of
tables.
D A T A T E S T I N G DTS
Attribute Note
Time/Date/GPS/ Port
Information
Hyperband Cellular, PCS…
Band Indicates the licensed frequency block within the hyper
band; e.g Blocks A-F in the PCS hyperband
Base Station ID
Link Technology Various flavors of CDMA, GSM, UMTS, LTE protocols from
which absolute maximum potential throughput can be
inferred
Receive Data Quality 8 point scale corresponds to BER
State of Connection Connection
attempt/established/upload/download/termination
Termination Type Normal or various types of abnormal
Session ID In the event there are simultaneous connections being
logged, such as uplink and downlink

19
Transfer ID Sequential number of file transfer during current session
(connection)
Bytes Transferred Current number of bytes completed in current transfer
Bytes Remaining Remaining bytes to transfer
Average Throughput Average file throughput (application layer) since start of
current transfer
Current throughput Throughput over past 5 seconds divided by 5 seconds
(updates every 1 second)
GPRS or EDGE mode?
GPRS/EDGE coding scheme
assigned (uplink or downlink as
applicable)
Indicates channel coding complexity, based on quality of link
to base. Higher link quality, higher complexity, higher
throughput rate
GPRS/EDGE timeslots assigned More time slots are assigned with less traffic contending for
the channel
GPRS/EDGE/UMTS/HSPA Radio
Link layer throughput
Includes errors and retries – can be used to assess efficiency
EVDO State Acquisition, sync, idle, access, connected
EVDO Rev 0 (only) Forward
Good/Bad Data served
Master counter of all Rev 0 forward data served since start
of test run – two figures: good & bad. Must run calculations
to obtain short and long term averages. Updates ~ once a
second.
EVDO Rel. A (only) Reverse
Physical Throughput
NEED INFO63
EVDO Forward Current
Throughput
NEED INFO64
EVDO Data Rate – Forward or
Reverse as applicable
Indicates data rate granted to the connection based on
channel coding complexity, based on quality of link to base.
Higher link quality, higher complexity, higher throughput
rate assigned
EVDO RLP (Radio Link Layer)
67-68Current throughput,
(fwd and rev as applicable)
EVDO RLP Total bytes in
measurement session
Fwd and Rev as applicable
EVDO RLP throughput interval
UMTS Spreading Factor
Number of HSDPA Codes
assigned
Provides information on the resources assigned to the UE
based on channel quality and/or traffic loading
HSDPA MAC layer throughput One second – Bytes/sec, only for blocks with good CRC
HSDPA MAC layer throughput 5 sec interval averages (Field 39 interval)

20
D A T A L I N K DTL
Attribute Note
Time/Date/GPS/ Port
Information
Hyperband Cellular, PCS…
Band Indicates the licensed frequency block within the hyper
band; e.g Blocks A-F in the PCS hyperband
Base Station ID
Link Technology Various flavors of CDMA, GSM, UMTS, LTE protocols from
which absolute maximum potential throughput can be
inferred
Link Session ID Combines Phone ID with Unit ID for unique ID
Total Link Bring-up Time Total time to “dial in” and establish data connection. Blank
until established.
Data Link State Normal or various types of abnormal
attempts/established/terminations
Dial-up time One part of Total Bring-up Time
Link-connect time Another part of Total Bring-up Time
WIMAX AND WIFI PLATFORMS
W I MAX
The WiMAX link technology employed by Clearwire will be monitored and logged with a
dedicated test platform. Information will be limited to data rates, location, time. Because the
Clearwire network is monolithic (no layering of various link technologies) the configuration of
each cell site will be the same. The external variables affecting signal quality due to mobile UE
speed, distance from cell site, and interference, plus any effects of traffic loading, will be the
only variables in the WiMAX test.

21
W I F I
Conventional “wardriving” tools will be employed to capture available WiFi access points.
Attribute Note
Time/Date/GPS
Hyperband 2.4 and 5 GHz
RF Channel
SSID User-assigned name for the access point
Hardware Manufacturer Software cross-indexes hard coded MAC address to a
registered manufacturer. High probability of correct
identification. This information may help distinguish
between consumer-installed access points and commercial
ones.
Link Technology 802.11 a, b, g or n
Authentication and Encryption
Type
Configured Maximum Data
Transfer Rate
Access point instructs UE as to the data transfer rate setting
of the link technology, when variable
Signal strength
TEST APPARATUS Specially selected and equipped wireless devices are plugged into a controller’s USB data ports.
The computer is programmed to initiate and supervise the measurement cycles and
simultaneously capture the data from multiple wireless devices.
The wireless devices will be mounted in a weather tight radome mounted on the roof of the
test vehicle. They will be remotely powered and controlled via USB cable connection to the
interior of the vehicle, where the controller will be installed. The controller has a real time
display of system and device activity.
The controller has alarm functions. The test team will configure alarms to help identify faults
in the measurement process, such as alarms that indicate when a device is no longer
communicating with the controller (due to loss of power or firmware freeze-up) or when a
device has lost contact with its network.
The test team will be cognizant of the potential for unwanted radio frequency emissions to
disturb or interfere with the data collection process. Other emitters in or near the radio
spectra under test will be kept away from the devices under test.
The test team will inspect and monitor operations for continuing performance, and for
possible effects of thermal, humidity and mechanical stress. The UE will be mounted within
the radome in a manner that maximizes the spacing between devices, thereby minimizing
mutual coupling of the emissions of their antennas.
22
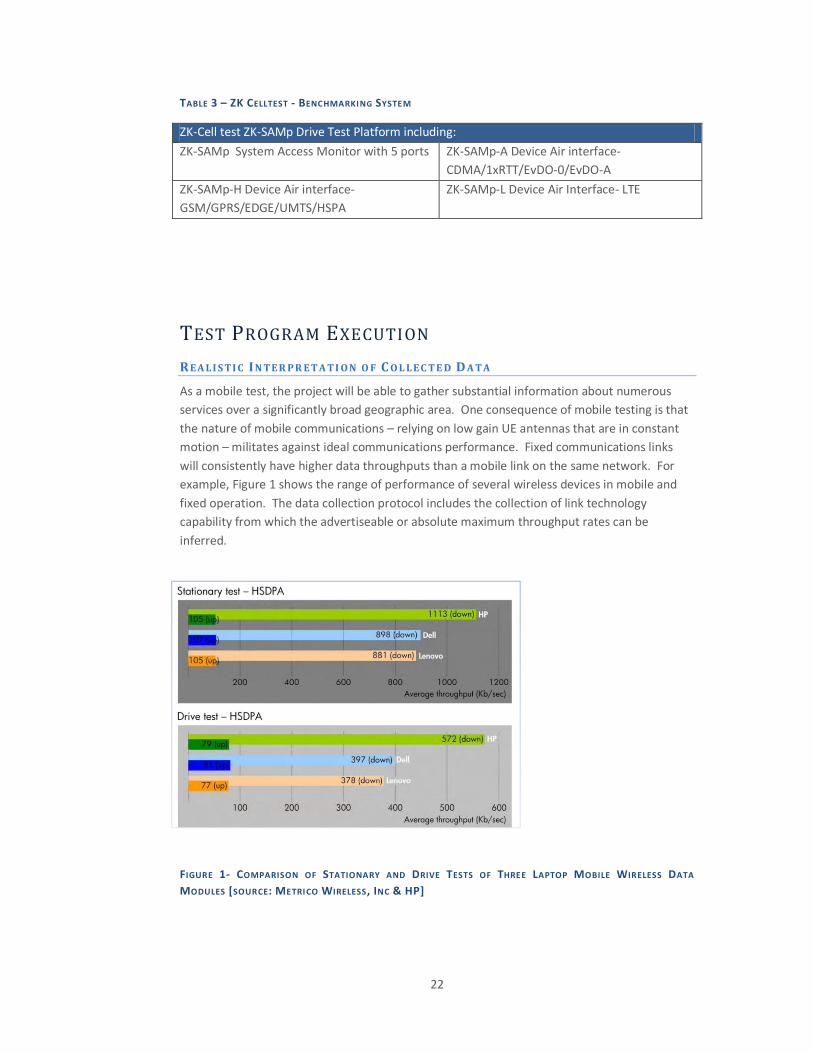
TABLE 3 – ZK CELLTEST - BENCHMARKING SYSTEM
ZK-Cell test ZK-SAMp Drive Test Platform including:
ZK-SAMp System Access Monitor with 5 ports
ZK-SAMp-A Device Air interface-
CDMA/1xRTT/EvDO-0/EvDO-A
ZK-SAMp-H Device Air interface-
GSM/GPRS/EDGE/UMTS/HSPA
ZK-SAMp-L Device Air Interface- LTE
TEST PROGRAM EXECUTION
R E A L I S T I C I N T E R P R E T A T I O N O F C O L L E C T E D D A T A
As a mobile test, the project will be able to gather substantial information about numerous
services over a significantly broad geographic area. One consequence of mobile testing is that
the nature of mobile communications – relying on low gain UE antennas that are in constant
motion – militates against ideal communications performance. Fixed communications links
will consistently have higher data throughputs than a mobile link on the same network. For
example, Figure 1 shows the range of performance of several wireless devices in mobile and
fixed operation. The data collection protocol includes the collection of link technology
capability from which the advertiseable or absolute maximum throughput rates can be
inferred.
FIGURE 1- COMPARISON OF STATIONARY AND DRIVE TESTS OF THREE LAPTOP MOBILE WIRELESS DATA
MODULES [SOURCE: METRICO WIRELESS, INC & HP]

23
FIGURE 2 - CARTOP CARRIER SIMILAR TO THAT WHICH WILL BE USED AS A RADOME FOR DRIVE TESTING
F I L E T R A NS F E R T E S T I NG
Wireless data speeds span several orders of magnitude. While 2G technologies tend to run
under the 768 kbps downlink speed that is defined as broadband, and 3G technologies have
been delivering speeds in the vicinity of 768 kbps, perhaps up to 2 Mbps, in practical usage, the
4G technologies (LTE and HSPA+) are now being provisioned to deliver rates about 10 times
faster, up to a practical rate near 20 Mbps. Isotrope obtained 15 mbps downlink and 5 mbps
uplink speed on the just-launched Verizon LTE network in Salt Lake City in early June.
Considering that the test platform will collect real-time throughput data at 5 second intervals,
whether or not the entire file has transferred, it is reasonable to select a file size that may be
larger than the slow data services can readily deliver. A slow data rate of 100 to 500 kbps will
be identified as readily with a large file as a small one. In contrast, because the objective of
the test is to characterize broadband performance as the technology can deliver today, it
would be advisable to use a file size that is not insignificant to the faster 3G and 4G services,
such that several data points at 5 second intervals could be taken during one file transfer
event.
Assuming a three-decade range of 20 Mbps, 2 Mbps and 0.2 Mbps (200 kbps), and a 6 second
transfer at the highest speed, a file with 6*20/8 = 15 megabytes (MB) would be necessary. At
2 Mbps, this same file would require 1 minute to transfer. At 0.2 Mbps, it would be 10
minutes.
Using the ratio of 200 kbps uplink to 768 kbps downlink, uplink speeds are nominally ¼ of the
downlink speed. ¼ of the 15 MB downlink file size would be approximately 4 MB for an uplink
file.
Isotrope will employ a 15 MB data file for downlink testing and a 4 MB file for uplink testing. If
initial testing in Salt Lake City, where there are 4G services available, indicates a lesser file size
will work well, or that a larger file size is necessary, Isotrope will consider the benefits of
changing the file size for the remainder of the test, and inform the client of any such
recommendation. [Ed. note: Final uplink and downlink file sizes for each technology platform
were selected in the field and are reported in the <Look-Up Tables.xslx> file in the Test Packet
Size tab.]
24
M O BI L E S E R V I C E S D A T A CO L L E C T I O N
Collected data will be backed up off-vehicle at least daily to ensure data are protected from
accidental loss in the field and data collection is running smoothly. The initial drive testing will
be performed in the Salt Lake area in the event it becomes necessary to address technical
issues that crop up early in the testing program.
Isotrope will consolidate the data and on a daily basis review them for completeness and
consistency. As data becomes ready, draft copies will be posted for client review. Post
processing will consist of viewing relevant data for consistency and consolidating data to files
and file groupings that are easiest for the client to ingest. The file groupings will be separated
by service provider. Subgroupings of files will include each of the file types described in the
tables above. The above tables list key attributes that will be collected, but do not represent
the final record and field structures. Final structure will be developed and documented. [Ed.
note: file structures are presented in <Isotrope File Structure 20110802.xslx> and various cross
reference lists are contained in <Look-Up Table.xslx>.]
The test team will not perform any statistical analysis or derivative GIS layer development,
other than separating desired data sets into their own GIS layer files as agreed upon.
P R O J E C T T I M E L I NE
The map of roads to be tested is in final revision, pending agreement of the vendors and client.
The expected duration of five weeks from start of data collection is reaffirmed by the initial
drive routing prepared by Isotrope. There will be a deadhead ratio that is about one mile for
every two miles of required data collection, resulting in approximately 9000 miles of test
route.
At the initiation of testing, Isotrope will share its itinerary with the client. During the
performance of the testing, Isotrope will provide updates no less frequently than once a week
on its progress on the drive route.
Isotrope arrives in state on June 29, 2011 and commences work immediately.
##