project review maturity and project performance: an
TRANSCRIPT

University of Central Florida University of Central Florida
STARS STARS
Electronic Theses and Dissertations, 2004-2019
2008
Project Review Maturity And Project Performance: An Empirical Project Review Maturity And Project Performance: An Empirical
Case Study Case Study
Catherine Vergopia University of Central Florida
Part of the Industrial Engineering Commons
Find similar works at: https://stars.library.ucf.edu/etd
University of Central Florida Libraries http://library.ucf.edu
This Doctoral Dissertation (Open Access) is brought to you for free and open access by STARS. It has been accepted
for inclusion in Electronic Theses and Dissertations, 2004-2019 by an authorized administrator of STARS. For more
information, please contact [email protected].
STARS Citation STARS Citation Vergopia, Catherine, "Project Review Maturity And Project Performance: An Empirical Case Study" (2008). Electronic Theses and Dissertations, 2004-2019. 3653. https://stars.library.ucf.edu/etd/3653
PROJECT REVIEW MATURITY AND PROJECT PERFORMANCE: AN EMPIRICAL CASE STUDY
by
CATHERINE VERGOPIA B.S.B.A. University of Hartford, CT, 1988
MBA, Fayetteville State University, NC, 1990
A dissertation submitted in partial fulfillment of the requirements for the degree of Doctor of Philosophy
in the Department of Industrial Engineering and Management Systems in the College of Engineering and Computer Science
at the University of Central Florida Orlando, Florida
Fall Term 2008
Major Professors: Timothy Kotnour (Dissertation Advisor)
Linda Malone Mansooreh Mollaghasemi
Charles Reilly Assad Tavakoly
ii
ABSTRACT
Many organizations use project management maturity models to improve their project
performance. These systematic and sequential frameworks are designed to help organizations
quantify their project management maturity and improve their project management
processes. However, these models rarely put enough emphasis on project reviews as tools to
improve project performance, because, too often, project reviews are considered as non-
productive administrative processes.
The lack of emphasis on project reviews in project management maturity models is also
illustrated by the limited amount of research published on the relationship between project
reviews and project performance.
Based on the concept of project management maturity models, this dissertation presents a
project review maturity model used to measure the project review maturity for four (4) types
of reviews (routine, gate, post-mortem, and focused-learning) as well as the overall project
review maturity. In addition, this research establishes the quantitative relationship between
project review maturity and project performance. This dissertation also quantifies the concept
of project review performance and its relationship with project performance for all four (4)
types of reviews, as well as for the overall project review performance. Finally, this research
provides enablers, barriers, and best practices for effective reviews, based on the answers of
written interview questions, and observations from a post-mortem review meeting at a
highly-technical organization.

iii
The empirical case study and survey analysis conducted by this dissertation led to some
unique findings. Five (5) specific conclusions were developed:
• Organizations use all types of reviews in their project management procedures, and
view each review role differently.
• Some reviews are more related than others to project performance, although
generally, review maturity and performance are significantly relevant to project
performance.
• Organization culture (beliefs, expected actions, etc.) is not significantly relevant to
project team members when assessing project status or PM procedures during project
life-cycle.
• Post-mortem and focused-learning reviews are linked with higher levels of learning
than routine and gate reviews.
• Effective reviews need managerial support.
This research is the first of its kind to show significant positive relationships between project
review maturity and performance with project performance and to provide quantifiable
results for organizations to further improve their review processes.

iv
TABLE OF CONTENTS LIST OF FIGURES .....................................................................................................................................................vi LIST OF TABLES......................................................................................................................................................vii CHAPTER ONE: INTRODUCTION ...........................................................................................................................1
1.1 Problem Statement: ....................................................................................................................................1 1.2 Overall Research Questions and Hypotheses:............................................................................................4 1.3 Research Sub-Questions: ...........................................................................................................................6 1.4 Research Objectives:..................................................................................................................................6 1.5 Research Methodology: .............................................................................................................................7 1.6 Research General Limitations:.................................................................................................................10 1.7 List of Acronyms/Abbreviations:.............................................................................................................11
CHAPTER TWO: LITERATURE REVIEW .............................................................................................................13 2.1 Introduction:.............................................................................................................................................13 2.2 Project Performance, Success, and Failure: .............................................................................................17 2.3 Project Management Maturity and PMMMs: ..........................................................................................21 2.4 Project Management Maturity Model (PMMM) Taxonomy: ..................................................................25
2.4.1 Capability Maturity Model for Software (CMM® or CMM-SW®) (Paulk et al, 1993):....................28 2.4.2 Project Management Maturity Model (PMMM) (Kernzer, 2001):......................................................41 2.4.3 Organization Project Management Maturity Model – OPM3 (PMI, 2003): .......................................44 2.4.4 Systems Engineering Capability Maturity Model (SE-CMM®) (Bate, et al, 1995): ..........................48 2.4.5 Capability Maturity Model Integration (CMMI®) (SEI-CM):.............................................................50 2.4.6 ProMMM (PMProfessional): .............................................................................................................55 2.4.7 Berkeley PM Process Maturity Model (PM)² (Kwak and Ibbs – 2000) : ............................................58 2.4.8 Project Management Maturity Model (PMMM) by PM Solutions: ....................................................60 2.4.9 PRINCE2 (Office of Government Commerce - 2002) .......................................................................61 2.4.10 Project Management Body of Knowledge ( Guide) (1987 – PMI).................................................66
2.5 Project Management Maturity Models: Current Studies..........................................................................71 2.6 Most Common PMMM Criticisms: .........................................................................................................80 2.7 Current PR Practices – Organizational Learning: ....................................................................................85 2.8 Proposed Methodology and Limitations: .................................................................................................92
CHAPTER THREE: RESEARCH METHODOLOGY..............................................................................................96 3.1. Introduction..............................................................................................................................................96 3.2. Conceptualization of the Research...........................................................................................................96
3.2.1. Refined Conceptual Model..................................................................................................................97 3.2.2. Construct and Factor Definitions ........................................................................................................98
3.3. Operationalization of the Research ........................................................................................................106 3.3.1. Research Design Selection and Overall Research Approach. ...........................................................107 3.3.2. Data Collection Instrument Selection................................................................................................108 3.3.3. Data Collection Instrument Description............................................................................................112
3.3.3.1. Survey:........................................................................................................................................113 3.3.3.2. Written Interviews: .....................................................................................................................119 3.3.3.3. Observations: ..............................................................................................................................120
3.3.4. Validity and Reliability of the Survey Data Collection Instrument...................................................122 3.3.4.1. Construct Validity.......................................................................................................................122 3.3.4.2. Reliability Analysis.....................................................................................................................128
3.4. Data Analysis .........................................................................................................................................129 3.4.1. Descriptive Statistics: ........................................................................................................................129 3.4.2. Hypothesis Testing:...........................................................................................................................129
v
3.5. Comments ..............................................................................................................................................132 3.6. Conclusion .............................................................................................................................................133
CHAPTER FOUR: DATA COLLECTION DESCRIPTION AND ANALYSIS – HYPOTHESIS TESTING.......134 4.1. Introduction............................................................................................................................................134 4.2. The Survey Data Collection Instrument.................................................................................................134
4.2.1. Constructs and Conceptual Model ....................................................................................................134 4.2.2. Proposed Hypotheses to Be Tested with Survey Results ..................................................................136 4.2.3. Survey overall structure: ...................................................................................................................141 4.2.4. Survey Results: General Questions (Demographics, PR Usefulness and Training)..........................147 4.2.5. Survey Construct Validity, Score Development, and Reliability ......................................................151
4.2.5.1. PR Maturity Construct for Each Review Type ..........................................................................154 4.2.5.2. PR Performance Construct for Each Review Type....................................................................168 4.2.5.3. Project Performance Construct ..................................................................................................173
4.2.6. Survey Analysis: Conclusion ............................................................................................................175 4.3. Hypothesis Testing.................................................................................................................................176
4.3.1. Hypotheses Regarding “Routine Reviews”: H1a, H2a, and H3a .....................................................178 4.3.2. Hypotheses Regarding “Gate Reviews”: H1b, H2b, and H3b..........................................................179 4.3.3. Hypotheses Regarding “Post-mortem Reviews”: H1c, H2c, and H3c .............................................181 4.3.4. Hypotheses Regarding “Focused-learning Reviews”: H1d, H2d, and H3d......................................182 4.3.5. Hypotheses Regarding “Overall Reviews”: H1, H2, and H3 ...........................................................184 4.3.6. Hypothesis Testing: Conclusion........................................................................................................185
4.4. Review Frequencies: Analysis ...............................................................................................................186 4.5. Observations: Post Mortem Review.......................................................................................................189 4.6. Written Interviews: Open-ended Questions in Survey...........................................................................191 4.7. Conclusion .............................................................................................................................................192
CHAPTER FIVE: FINDINGS, CONCLUSIONS, AND IMPLICATIONS.............................................................194 5.1. Introduction............................................................................................................................................194 5.2. Findings and Conclusions ......................................................................................................................194
5.2.1. Conclusion #1: The studied organizations use all types of reviews in their project management procedures, and view each review role differently. .........................................................................................195 5.2.2. Conclusion #2: Some reviews are more related than others to project performance, although generally, review maturity and performance are significantly relevant to project performance......................199 5.2.3. Conclusion #3: Organization culture (beliefs, expected actions, etc.) is not significantly relevant to project team members when assessing project status or PM procedures during project life-cycle. ................204 5.2.4. Conclusion #4: Post-mortem and focused-learning reviews are linked with higher levels of learning than routine and gate reviews. .........................................................................................................................205 5.2.5. Conclusion#5: Effective reviews need managerial support: ............................................................206
5.3. Managerial and Theoretical Implications:..............................................................................................209 5.3.1. Managerial Implications:...................................................................................................................210 5.3.2. Theoretical implications and Areas for Future Potential Research: ..................................................212
5.4. Lessons Learned during the Research Process:......................................................................................213 5.5. Conclusion: ............................................................................................................................................215
APPENDIX A: SURVEY.........................................................................................................................................217 APPENDIX B: IRB HUMAN SUBJECTS PERMISSION LETTER......................................................................226REFERENCES .........................................................................................................................................................228

vi
LIST OF FIGURES Figure 1: Research Topic Selection:............................................................................................... 4 Figure 2: Basic conceptual model:.................................................................................................. 5 Figure 3: Refined Overall Conceptual Model: ............................................................................. 97 Figure 4: Constructs and Underlying Factors. ............................................................................ 103 Figure 5: Overall Research Approach. ....................................................................................... 111 Figure 6: Survey Data Collection Instrument - Questions for PR Maturity Construct............... 115 Figure 7: Survey Data Collection Instrument - Questions for PR Performance Construct. ....... 116 Figure 8: Survey Data Collection Instrument – Questions for Project Performance Construct. 116 Figure 9: Construct Validity of the Survey................................................................................. 128 Figure 10: Construct Model........................................................................................................ 136 Figure 11: Question #1: Review Frequency and Use. ................................................................ 142 Figure 12: Question Example for Project Performance Construct. ............................................ 143 Figure 13: Overall PR Maturity Construct. ................................................................................ 146 Figure 14: Overall PR Performance Construct. .......................................................................... 147 Figure 15: Research Factor Analyses ......................................................................................... 153 Figure 16: Routine Review PR Maturity: Scree Plot.................................................................. 161

vii
LIST OF TABLES Table 1: Proposed Research Methodology: .................................................................................... 8 Table 2: Summary of Major Maturity Models.............................................................................. 27 Table 3: CMM’s Maturity Levels and KPAs: .............................................................................. 33 Table 4: Krasner’s Accumulating the Body of Evidence for Payoff of Software Process Improvement, (Krazner, 1997, used as reference in CMU-SEI publication #2004-SR-010)....... 35 Table 5: Summary of most Common CMM’s Advantages, Disadvantages, Enablers and Barriers:40 Table 6: PMMM Maturity Levels................................................................................................. 42 Table 7: Kerzner’s PMMM Advantages, Disadvantages, Enablers, and Barriers....................... 44 Table 8: SE-CMM’s Process Areas. ............................................................................................. 49 Table 9: SE-CMM Maturity Levels.............................................................................................. 50 Table 10: CMMI: The Staged-Representation: The MaturityLlevels. ......................................... 54 Table 11: CMMI – The Continuous Representation: The Capability Levels............................... 55 Table 12: ProMMM Levels of PM Organizational Capabilities. ................................................. 56 Table 13: ProMMM Attributes at Each Maturity Level. .............................................................. 57 Table 14: Berkeley Model Maturity Levels.................................................................................. 59 Table 15: PM Solutions’ PMMM:................................................................................................ 61 Table 16: Prince2’s Components.................................................................................................. 63 Table 17: PMBOK’s Knowledge Areas. ...................................................................................... 69 Table 18: PMBOK s Knowledge Areas and Process Groups....................................................... 70 Table 19: Summary of PMMM Studies:....................................................................................... 79 Table 20: von Zedwitz’s Capability Maturity Model for Post-Project Review Processes: .......... 88 Table 21: Barriers and Recommendations to Effective PRs: ....................................................... 91 Table 22: Overall methodology: ................................................................................................... 93 Table 23: Potential Limitations and Suggestions: ........................................................................ 94 Table 24: Review Type............................................................................................................... 102 Table 25: Levels of Learning...................................................................................................... 105 Table 26: Data Collection Techniques: Advantages and Disadvantages. .................................. 112 Table 27: PR Maturity Model/Survey. ....................................................................................... 114 Table 28: Operationalization of the PR Maturity Construct: 12 Questions for Each 4 Ttype of Reviews....................................................................................................................................... 117 Table 29: Operationalization of the PR performance Construct: 8 Questions for Each 4 Type of Reviews....................................................................................................................................... 118 Table 30: Operationalization of the Project Performance Construct: 6 Questions..................... 118 Table 31: Interview Questions.................................................................................................... 120 Table 32: Checklist for Observations for Routine Reviews. ...................................................... 121 Table 33: Comparison of EFA and CFA for this Research (Hurley, et al, 1997)....................... 124 Table 34: EFA Procedures.......................................................................................................... 127 Table 35: Research Hypotheses.................................................................................................. 141 Table 36: Survey Structure: PR Maturity Construct................................................................... 144 Table 38: Surveyed Organizations.............................................................................................. 148 Table 39: Number of Respondents per Organizations................................................................ 149 Table 40: Summary of Project Work Experience....................................................................... 149 Table 41: Summary of Job Status. .............................................................................................. 150 Table 42: Summary of Answers to Review Usefulness and Training........................................ 150
viii
Table 43: Factor Analysis Processes. ......................................................................................... 152 Table 44: Descriptive Statistics for PR Maturity Survey for Routine Reviews. ........................ 155 Table 45: Correlation Matrix for Routine Review PR Maturity................................................. 156 Table 46: Significance levels for Correlation Coefficients – Routine Review PR Maturity...... 157 Table 47: KMO Scores: Routine Review PR Maturity: All Questions ...................................... 158 Table 48: KMO Scores: Routine Review PR Maturity: All but V10 Questions ........................ 158 Table 49: PCA Extraction Communalities: ................................................................................ 159 Table 50: Eigenvalues – Routine Review PR Maturity Construct ............................................. 160 Table 51: Routine Review PR Maturity Construct: Varimax Rotation ...................................... 162 Table 52: Factor Score Development for each factor and each variable for Routine Review PR Maturity Construct...................................................................................................................... 163 Table 53: Routine Review PR Maturity Construct: Reliability Analysis - Cronbach's Alpha Analysis ...................................................................................................................................... 164 Table 54: FA Results for Gate, Post-mortem, and Focused-learning Review PR Maturity Constructs. .................................................................................................................................. 165 Table 55: Original Structure and Qustions for the PR Maturity Constructs............................... 166 Table 56: New Routine, Gate, Post-mortem, and Focused-learning PR Maturity Construct Structures Based on FA Results, and Reliability Analysis Results.. .......................................... 167 Table 57: Original Structure and Qustions for the PR Performance Constructs. ....................... 169 Table 58: FA Results for Gate, Post-mortem, and Focused-learning Review PR Performance Constructs. .................................................................................................................................. 170 Table 59: New Routine, Gate, Post-mortem, and Focused-learning PR Performance Construct Structures Based on FA Results, and Reliability Analysis Results. ........................................... 172 Table 60: FA Results for Project Performance Construct. ......................................................... 174 Table 61: Original Structure and Qquestions for the Project Performance Construct................ 175 Table 62: Project Performance Construct Structure Based on FA Results and Reliability Analysis Results......................................................................................................................................... 175 Table 63: Spearman’s Rho Rank Correlation Coefficient at α=0.1............................................ 177 Table 64: Research Hypotheses.................................................................................................. 178 Table 65: Descriptive Statistics for Survey Question #1 on Review Frequencies ..................... 186 Table 66: Question #1 Review Mean Rank ................................................................................ 187 Table 67: Question #1 Friedman Test Results............................................................................ 187 Table 68: Question #1 Sum of the Ranks ................................................................................... 188 Table 69: Question #1 Absolute Difference Between the sums ................................................. 188 Table 70: Observations from Post-mortem Review at KSC – Summary#1 ............................... 189 Table 71: Observations from Post-mortem Review at KSC-Summary#2.................................. 190 Table 72: Observations from Post-mortem Review at KSC-Summary#3.................................. 191 Table 73: Open-ended Written Interview Questions. ................................................................. 192 Table 74: Summarized Answers to the Survey Open-ended Questions ..................................... 199 Table 75: Spearman's Correlation............................................................................................... 200 Table 76: Correlation Coefficient P-Values ............................................................................... 201 Table 77: PR Enablers and Barriers............................................................................................ 208 Table 78: Conclusion Summary. ................................................................................................ 209
1
CHAPTER ONE: INTRODUCTION
1.1 Problem Statement:
Project management (PM) PM has become a way to manage engineering organizations and
implement their strategic goals. It has developed into a discipline as important in itself as other
functions such as manufacturing, IT, or finance (Kenny, 2003), and its critical processes and core
competencies are constantly studied and reviewed by practitioners as well as academicians
(Crawford, Simpson, and Koll, 1999). All this fairly new focus notwithstanding, many projects
are deemed unsuccessful as numerous studies show. Too many times, projects go over budgets,
beyond their planned schedule, or deliver products that are not satisfying their customers.
Organizations facing these challenges are categorized as organizations with low PM maturity.
Therefore, in order to improve project performance and PM maturity, organizations are
considering adopting a methodical and sequential framework (project management maturity
models: PMMMs) to help them enhance their project management processes. These project
management maturity models can be used as an assessment tool to measure PM maturity levels,
as well as a tool to show in which area an organization should focus its efforts to improve its PM
capabilities. Although in existence only for the past 15-20 years, some of these models have
shown in both empirical and statistical studies, that, 1) PM maturity and project performance are
positively correlated, and 2) by adopting a PM maturity model, organizations can often increase
their PM maturity and therefore, attain more successful project performance. At the highest level
of PM maturity, an organization is able to constantly learn from its actions (successful or not)
and to share the learning to other members within the organization so that the “wheel is not
reinvented”. This retrospective learning is primarily done through project reviews (PRs), where
2
“what happened” is compared to “what was planned”, and the emphasis is placed on the
managerial root cause of any variances.
Effective project reviews are essential tools for organizations to continuously improve their
project management processes and advance better project maturity and performance. Some PM
maturity models, incorporating the Project Management Institute (PMI)’s Project Management
Book of Knowledge ()‘s directives, might include project reviews in their steps, but only as a
process at the project close-out phase, and not as a learning tool. When project reviews are
mentioned in PM maturity models, they focus on the use of metrics and benchmarking to see if a
project is “on track” from its planned budget and schedule (what was done), but do not
emphasize on how PM processes were carried out (how things were done), or why any variance
from a plan may have happened (why things happened). Furthermore, PM maturity models
seldom mention how the organizational knowledge derived from the review process should be
disseminated for further use by other organizational members.
Although, it appears that the PM maturity models might improve project performance, they do
not focus enough on how knowledge from project reviews should be obtained and carried out.
The lack of emphasis on learning from project reviews in the models is also shown by the results
of studies that indicate that too many organizations “bypass” project reviews for various reasons
(von Zedtwitz, 2002). The most commonly cited reasons are lack of time or managerial buy-in
(Busby, 1999c). However, project reviews are essential to further organizational learning and
improve PM performance, since they are a source of unique knowledge on PM processes that
can help other project teams. No true learning can happen without an honest and thorough
3
introspection of how PM processes were carried out, and the reason why events went the way
they did (Love, 2003). The lack of emphasis on project reviews in organizations and the PM
models is also illustrated by the limited number of articles in the literature on the subject. Further
research is needed in the area of project review in order to help organizations improve and
practically conduct their review processes so they can continuously advance their PM processes
and their project performance.
The following is a summary of how this research evolved:
• First, the general area of project performance was explored.
• Second, from this research area, the concept of project management maturity was
investigated. The relationship between project management maturity and project
performance was studied.
• Third, the research into project management maturity and project performance led to the
exploration of the project management maturity models. First their taxonomy was
researched, then, the studies conducted on their efficiency were analyzed, and finally
their major disadvantages were explored.
• Fourth, studying the project management maturity models and their most recognized
drawbacks led this research to the management practices of project reviews and the
concepts of organizational learning and improved project review performance to promote
better project performance.
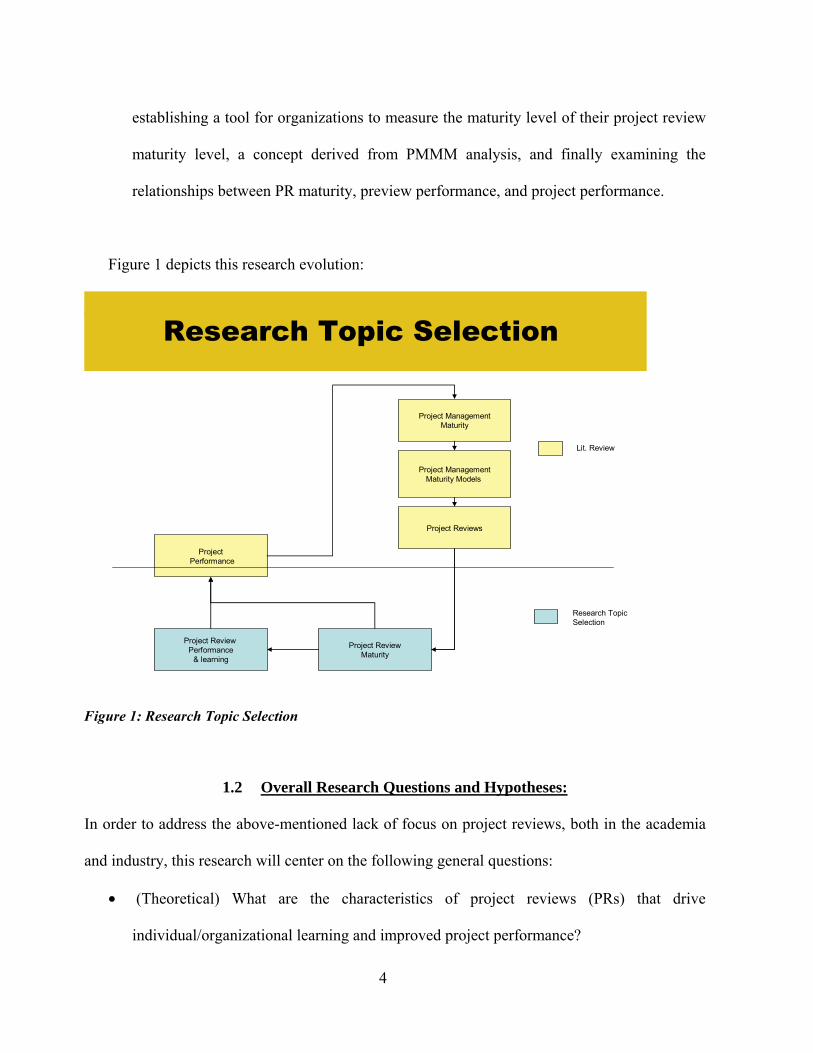
• Fifth, the lack of project reviews conducted in the industry, as well as the limited
academic research in the area, led this research to focus on studying project review
practices in an technical environment, determining what the enablers and barriers are,
4
establishing a tool for organizations to measure the maturity level of their project review
maturity level, a concept derived from PMMM analysis, and finally examining the
relationships between PR maturity, preview performance, and project performance.
Figure 1 depicts this research evolution:
Research Topic Selection
ProjectPerformance
Project Reviews
Project ManagementMaturity
Project ReviewMaturity
Project ManagementMaturity Models
Project Review Performance
& learning
Lit. Review
Research TopicSelection
Figure 1: Research Topic Selection
1.2 Overall Research Questions and Hypotheses:
In order to address the above-mentioned lack of focus on project reviews, both in the academia
and industry, this research will center on the following general questions:
• (Theoretical) What are the characteristics of project reviews (PRs) that drive
individual/organizational learning and improved project performance?

5
• (Theoretical/Operational) What is the relationship between PR maturity, PR
performance, and project performance?
• (Operational) What are the enablers and barriers of project review maturity?
Figure 2 depicts the conceptual model, which represents the relationship that this research is
exploring:
Project Review Maturity
PR performance
Project Performance
• Barriers• Enablers •Barriers
•Enablers
Basic Conceptual Model
Figure 2: Basic conceptual model
The model stipulates that an organization’s PR maturity is related to its PR performance and
project performance. In addition, by determining its PR maturity level and the PR review
enablers and barriers, an organization could improve its PR processes. The model is based on the
following overall hypotheses that this research seeks to test:
• The higher the PR maturity level, the higher the project review performance.
• The higher the project review performance, the higher the project performance.
• The higher the PR maturity level, the higher the project performance.
6
In addition, a set of sub-questions provided in the next section will also be investigated in order
to provide some insights to the questions above.
1.3 Research Sub-Questions:
The following topics are also explored by this research in order to provide a better answer to the
overall research questions:
• What are project management maturity and project review maturity?
• What is the relationship between PM maturity and project performance?
o What are the current PM maturity models available to organizations?
o What are the shortfalls of PM maturity models?
• What are the different types of project reviews (PRs)?
o What types of learning levels are associated with each review?
Answers to these sub-questions and to the overall research questions will allow this research to
reach the objectives described in the next section.
1.4 Research Objectives:
This research seeks to help both practitioners and researchers by:
• Developing a project review (PR) maturity model that can measure how organizations are
currently conducting PR processes, and give them insights as to which PR processes they
need to focus on and improve.
• Generating best practices that assist organizations carrying out their project reviews
(PRs).
7
• Providing insights on barriers and enablers to productive PRs.
• Describing the relationship between 1) PR maturity and project review performance, 2)
PR maturity and project performance, 3) project review maturity and project
performance.
1.5 Research Methodology:
To answer the research questions and attain the research objectives, an empirical case study will
be conducted among several technical organizations in the Central Florida area. The selected
methodology for the case study will include 1) survey, 2) written interviews, and 3) observations
by this research to a post-mortem review. This method was chosen for several reasons:
• Case study: the use of a case study is an empirical research strategy, which is especially
appropriate for contemporary observable facts within their real life settings (Yin, 1993).
The case study methodology also allows for multiple sources of data, both qualitative and
quantitative. Being able to test a hypothesis through data obtained from multiple sources
permits a triangulation approach to validation. For these reasons, the case study research
methodology is suitable to organizational management issues.
• Action research (A/R): A/R is a scientific research process, which collects data about an
on-going system, such as an organization (Cunningham, 1993). Action research is firmly
founded in real life situations and practical solutions. Because of the dynamic nature of
organizational problems, traditional scientific methods (with controlled environment
settings) may not always be suitable, or practical. In addition, the subject of this research
(project review) requires the active involvement of the participants, which is one of the
8
pillars of action research methodology. The purpose of action research is to achieve both
action (that is, change) and research (that is, understanding).
Project team members at Kennedy Space Center (KSC), Boeing, Siemens, Darden, Walt Disney
World Resorts (WDW), and Harris are participating in this research. These organizations offer a
remarkable data source due to their highly complex project-oriented environments. Attendance at
a post-mortem review, along with the use of an online survey, including open-ended interview
questions will allow gathering data through the following tools: participants’ opinions,
researcher’s own observations from PR meeting attendance with specific checklists, and survey
intended to measure project review maturity and conduct statistical analyses to gauge the
relationships between the project review maturity, the project review performance, and the
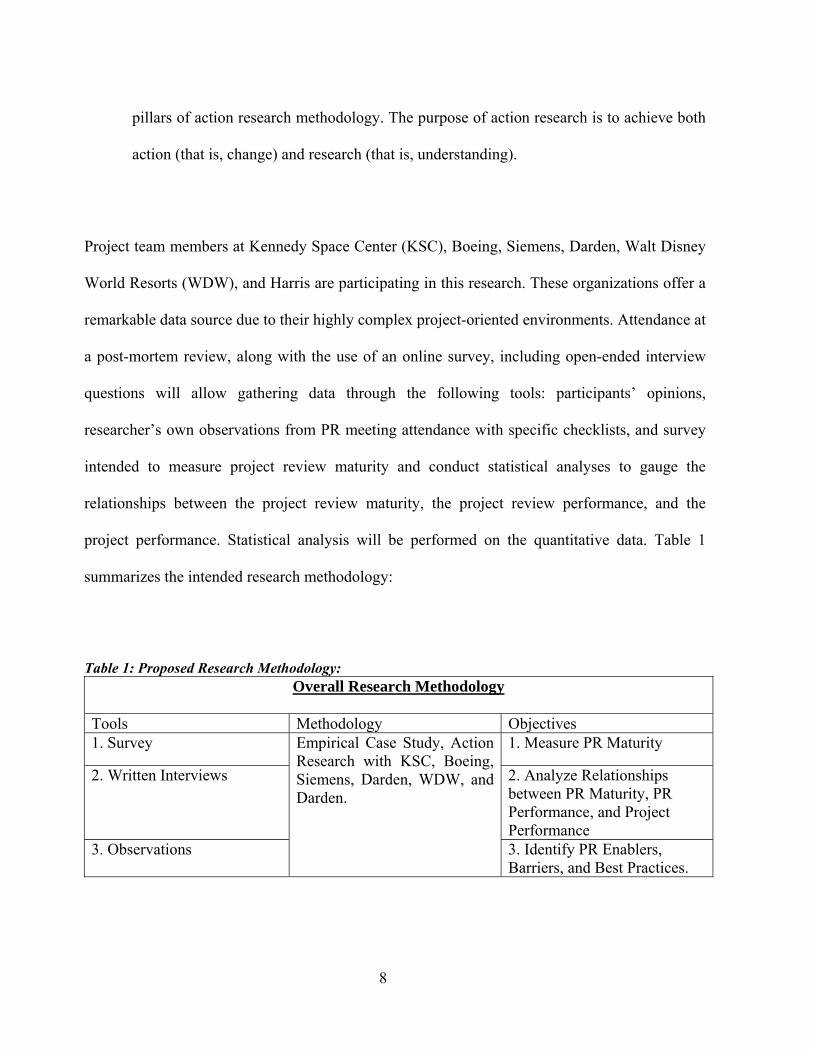
project performance. Statistical analysis will be performed on the quantitative data. Table 1
summarizes the intended research methodology:
Table 1: Proposed Research Methodology: Overall Research Methodology
Tools Methodology Objectives 1. Survey 1. Measure PR Maturity
2. Written Interviews 2. Analyze Relationships between PR Maturity, PR Performance, and Project Performance
3. Observations
Empirical Case Study, Action Research with KSC, Boeing, Siemens, Darden, WDW, and Darden.
3. Identify PR Enablers, Barriers, and Best Practices.
9
The high-level methodology of this research contains 9 steps:
1) Define the research area: the purpose is to choose a research subject relevant to
academicians and practitioners in the field of engineering management.
2) Review of the literature: the goal is to review what has already been published in the
literature in this area, and define what the current level of understanding in the research
area is, as well, as potential unexplored research theme(s) that has (have) not been
addressed yet.
3) Identify the gaps and the research objectives: at this stage, after reviewing the literature
review and gaining a better understanding of the research area, the major unexplored
gaps in the literature review and the main research objectives are delimited for further
exploration by this research. Steps 1, 2, and 3 are at the subject of Chapters 1 and 2 of
this research and provide the overall research scope, objectives, questions, and
hypotheses.
4) Conceptualize the research objectives: the purpose is to define in more details the
conceptual model of the research questions, refining the hypotheses, describe in details
how the constructs and variables will be defined, and narrowing the research
components.
5) Formulate, operationalize the research methodology, and practically design the research:
the purpose is to select the data collection instruments that will be used to measure the
constructs, develop these data collection instruments, and determine how the data will be
analyzed. Steps 4 and 5 are the subjects of Chapter 3 of this research.
6) Execute the research:

10
a. First, the goal is to develop pilot interviews, surveys and other data collection
instruments, test them, and make appropriate changes in order to refine the data
collection instruments;
b. The second goal is to gather the data with those improved data collection
instruments from the sampled population.
7) Analyze the data: the objective is to examine the data and conduct statistical analysis to
test the hypotheses.
8) Provide and interpret research results: the goal is to determine if the conceptual model
has been validated, if the hypotheses have been proven, and to what extent.
9) Conclude the research and refine the theory: the objective is to determine what additional
research might help this research, and provide the research documents. Steps 6, 7, and 8
provide the content of this research’s Chapters 4 and 5.
1.6 Research General Limitations:
General limitations associated with case study research will also apply to this research.
Generalization of the results is not likely possible since there is no randomization of the subjects
participating in this research. Secondly, the small number of participants will also limit the
ability to infer general theories about the relationships between project review maturity, project
review performance, and project performance for other samples. However, this research is
designed to be an instrumental case study, which will provide insight into the project review
processes. Being theory-driven, this research can be replicable with other case studies further
validating this research. In addition, this research will conduct validity and reliability analyses on
11
the developed survey in order to authenticate its structure and make it possible to be used under
similar circumstances.
1.7 List of Acronyms/Abbreviations:
• CMM®: Capability Maturity Model by CMU-SEI
• CMMI®: Capability Maturity Model Integration by CMI-SEI
• CMU-SEI: Carnegie Mellon University - Software Engineering Institute
• FA: Factor Analysis
• FL Reviews: Focused-Learning Reviews
• KMO: Kaiser-Meyer-Okin Measure of Sampling Adequacy
• KPA: Key Process Area
• KSC: Kennedy Space Center
• NPD: New Product Development
• OASIG: Organizational Aspects Special Interest Group (UK)
• OGC: Office of Government Commerce (UK)
• OPM3™: Organization Project Management Maturity Model by PMI
• PA: Process Area
• PM: Project Management
• PM Reviews: Post-Mortem Reviews
• : Project Management Book of Knowledge
• PMI: Project Management Institute
12
• PMMM: Project Management Maturity Model
• PR: Project Review
• PRMM: Project Review Maturity Model
• PRs: Project Reviews
• PRINCE2: Projects in Controlled Environments 2
• ProMMM: Project Management Maturity Model by PMProfessional
• SE-CWW®: Systems Engineering Capability Maturity Model
• WDW: Walt Disney World and Resorts

13
CHAPTER TWO: LITERATURE REVIEW
2.1 Introduction:
Project management (PM) has been increasingly viewed as a part of overall organizational
management practices, similar in importance to other practices in the financial, marketing, or
human resource management areas (Kenny, 2003). The PM area has evolved from operations
research tools and techniques to the less easily defined discipline of management (Bredillet,
1998). PM has developed into a way to manage a company and implement organizational
strategic goals. Management of projects (managing projects within the organization) and
management by projects (managing projects as a way to organize the organization) illustrate this
new approach. Crawford (1999) also quotes Dinsmore (1996, p.10) who, in an article in PM
Network describes this philosophy as: "Managing organizations by projects is an organizational
mindset. It is a way of thinking about business. It means the company is project-driven, that
corporate goals are targeted and achieved by managing a web of simultaneous projects …
Mission, visions, strategies, objectives, and goals are transformed into company-wide programs
that translate corporate intentions into actions. These programs are, in turn, broken into projects
to be managed by … project management personnel." Therefore, it is not surprising that the
number of organizations that are managed by projects (either in part or as a whole) continues to
grow. Frame (1995) states that many organizations use project management as a tool to increase
their productivity as companies have downsized, are constantly under competitive pressures to
be “mean and lean”, and use teams and projects as a means to attain these goals. He further
stipulates that project management is no longer restricted to “traditional” project oriented
industries such as construction and aerospace, but has spread to information-based industries

14
such as telecommunications, computers, or banking. Project management has emerged as a
profession in its own right since the last decade, as it is now viewed as a critical process and core
competency (Crawford, Simpson, and Koll, 1999). This growth is also illustrated by the creation
of the Project Management Institute (PMI) in 1969, which has set standards and certification
programs for project managers such as the Guide to the Project Management Body of Knowledge
Guide ( - 2000). The growth of PM as a profession has also materialized in other industrial
nations. In Australia, the Australian Institute of Project Management (AIPM) was established
and has defined some industry standards for project managers along with industry
representatives and governmental agents; the United Kingdom has even set up a specific
government agency, the Office of Government Commerce, a branch of the department of the
Treasury, to be a catalyst to organizations “to achieve efficiency, value for money in commercial
activities and improved success in the delivery of programs and projects” (OGC,
http://www.ogc.gov.uk). Projects, defined by PMI as means to implement strategy, are therefore
recognized in today’s world economy as crucial to an organization’s success; thus, the
effectiveness and efficiency of project management are vital capabilities that organizations must
possess.
The importance of improving project management capabilities is all the more crucial as several
studies conducted over the past years have concluded that most projects fail. A study from the
Standish Group (1995), a PM management research firm, showed that only 16.2% of projects
were on-time and on-schedule (study sample size of 365 respondents). In addition, according to
Ali, et al. (2001), the Organizational Aspects Special Interest Group, (OASIG, a Special Interest
Group in the UK) conducted a survey of over 14,000 IT organizations supported by the
15
Economic and Social Research Council and UK Department of Trade and Industry, which
showed that 80-90% did not meet their pre-set performance goals, while about 80% of systems
were delivered late and over budget, and just 10-20% met all organizational success criteria as
previously stated.
The poor performance of many projects is difficult to understand because of the multi-
dimensional (human, technical, organizational, and environmental) factors used in project
management. In order to alleviate this problem and find some practical solutions, organizations
need to improve their project management maturity, or in other words, organizations need to
understand and improve their capabilities to manage projects effectively. Recently, this need has
increased interest both in the academic and operational fields to develop some type of descriptive
reference models which would help organizations improve their project management processes;
for the past 15 to 20 years, several project management maturity models (PMMMs) have been
developed as methodical, sequential, step-by-step frameworks to help organizations enhance
their project management processes and maturity. They are designed to assess the current
maturity level of an organization’s PM and to detail the next required steps to achieve a higher
level of PM maturity. Because of the models’ relative novelty, and the scarce numbers of
statistical studies measuring the extent to which PMMMs impact project performance, it is still
unclear for some PM practitioners if the cost and time involved in the implementation of such
models are worth undertaking. Some other skeptics, like Judgev and Thomas (2002), have
challenged the use of PMMMs as “silver bullet of competitive advantage” and should not be
thought as “cure-all” to PM problems. However, there are many anecdotal examples that seem to
support the implementation of such models, especially in the software industry (Carnergie-
16
Mellon, Software Engineering Institute). Whether PMMMs can or cannot significantly improve
organizational PM maturity, several empirical studies have shown that increased PM maturity
(attained through a PMMM or otherwise) is correlated to increased project performance (Jiang et
al, 2003, Dooley et al, 2001). PM maturity involves organization-wide efforts to define and
standardize PM processes. In addition, the concept of organizational PM maturity stresses the
need for PM processes to be updated when necessary. At the highest level of maturity, an
organization experiences continuous feedback from project performance throughout the project
life-cycle, is able to create lessons learned files, which are readily available to other current and
future project teams, and displays an organization culture which nurtures, facilitates formal and
informal organizational learning in order to achieve continuous process improvement.
One PM process that is at the core of this continuous PM performance feedback is project review
(PR). By learning what goes wrong earlier through PR, organizations can take actions more
quickly to make appropriate corrections at lower costs. By reviewing its PM processes
throughout the project life cycle and making the learning available to other projects,
organizations can avoid “reinventing the wheel” (Newell, 2004). Unfortunately, most
organizations do not undergo any retrospective review of their projects or do not have any type
of structured approach to learning from their projects (von Zedtwitz, 2002). Furthermore, too
many PMMMs do not emphasize PR as a practice required to improving PM maturity (Williams,
2003). The limited number of articles published in the literature on PR only parallels and
illustrates the unimportance that most organizations as well as PMMMs still give to the PR
processes.
17
Consequently there is a need to further investigate how organizations can implement or improve
PR practices that will lead to continuous learning from their projects. This research therefore
proposed to study best practices, enablers, and barriers to successful PRs, and to develop a
means to measure PR maturity, improve PR processes, in order to enhance overall organizational
learning, and improve project performance.
In order to start this research, a literature review was conducted; the areas that were examined
follow the pattern as described in Figure 1 in Chapter 1 of this research. The following sections
illustrate the literature review.
2.2 Project Performance, Success, and Failure:
As mentioned earlier, too many projects, especially in the IT industry, are deemed unsuccessful.
In 2000, The Standish Group, famous after its publication of the CHAOS report (1995), which
showed that only 16.2% of IT projects were completed on time, within budget and
specifications, found that in 2000, 28% of projects were successful. This is an improvement over
the years, but still indicates that 7 out of 10 projects are not successful. The definition of a
successful project by the Standish group was that of a project that was on-time, on-budget, and at
promised quality standards. The top five (5) factors found in successful projects were: 1) user
involvement, 2) executive management support, 3) clear statement of requirements, 4) proper
planning, and 5) realistic expectations. The OASIG study in 1995, also showed that 7 out 10
projects “fail” in some respect (results similar to those of the Standish Group 2000) (Ali, et al.,
2001). Project failure factors used in this study were: 1) extent to which project performance is
not delivered on time and within budget, 2) extent to which project deliverables meet
18
expectations, and 3) project is abandoned. In another study, in 1998, 204 organizations in the UK
(finance, utilities, manufacturing, business services, telecoms, and IT services) were studied in
The Bull Survey (IT-cortex S.A., 2001). The results showed that 75% of IT projects missed their
deadlines, 55% exceeded their budget, and 37% were unable to meet the requirements. The 3
major factors associated with project failure were: 1) breakdown in communications between the
stakeholders, 2) lack of planning of resources and activities, and 3) poor quality control. All
these studies point to the fact that most projects are unsuccessful, and generally define project
success as being on schedule, on budget, and within specifications. Others in the field define and
evaluate project success somewhat differently. For example, according to Kendra and Taplin
(2004), project success is reached when the following six (6) factors are met: 1) meeting user’s
requirements, 2) achieving stated goals, 3) meeting time deadlines, 4) meeting budgets, 5)
meeting required quality, and 6) making customers happy. This, in turn, can be achieved when
the four (4) following dimensions in project management are addressed: 1) social/micro (project
manager’s skills and competencies), 2) micro/technical (project performance measurement
systems), 3) macro/social (organizational structures at project level), and 4) macro/technical
(project management organizational supporting practices). Other researchers, with the
advancement of the concepts of Total Quality, have enlarged the definition of a successful
project to also include the satisfaction of the key project stakeholders, including customers, as a
necessary performance measure for project success (Tukel and Rom, 2001). Furthermore, some
in the literature have raised some issues with the way project performance are used as an
indication of project success or failure; Pillai, et all (2002) suggest that project performance
measurements are too often devised and used in isolation for the three phases of the project life
cycle as described by them: 1) selection – how to select the most appropriate project, 2)
19
execution – how to evaluate if resources are efficiently and effectively used during the project
execution, and 3) implementation – how to evaluate if sales will be sufficient to sustain profits, if
technology will not be obsolete by the time the project is completed, and if original purpose of
the project still fits the current business strategy. Therefore the metrics used at a particular phase
are devised in isolation from the other phases. In a world of high uncertainty and constant
changes, the authors assert that this can lead to false project performance assessment, and the
authors have proposed an integrated performance index, which integrates metrics used in all
three life-cycle phases into one single measurement including technical, commercial, and
organizational aspects. Although this integrated index lacks examples of real-life implementation
and application to further validate its use, it stresses the need to include many aspects in defining
a successful project, above and beyond schedules and budgets. At the project level, project
managers use performance measurements in order to evaluate if the project performs according
to a pre-set schedule, budget, and specification objectives. The project performance
measurements commonly used include techniques such as PERT/CPM, earned value analysis,
cost and budget variances, etc. These methods allow managers to check if a project is executed
“according to plans”, and often determine if a project is successful in terms of dollars and time
units, at the project team level. However, these techniques lack organizational perspective. After
all, a project can be on budget, time, and of sound quality, but it may not offer any marketable
benefits to the organization. Net present value, IRR, and discounted cash flow methods, along
with accurate sales forecasts are methods used to determine the profitability and financial
success of a project within an organization. On the other hand, a project may be deemed a
“success” although it has little marketable value, has high cost and time variance, or offers little
quality improvement opportunities. For example, such a project was undertaken to meet a

20
specific organizational strategic need, offer technological spin-offs or other non-tangible
benefits, help increase the product life of other products, etc. Knowledge transfer, staff training
etc. may be other organizational objectives sought when undertaking a project, and therefore, the
traditional measurements of project success will have little meaning in assessing such a project
performance. In addition, a project positive results in areas such as government policies,
economic regulations, customer goodwill, legal and competitive environments, etc., may also
determine whether a project is perceived as successful or not.
The above discussion illustrates that most project performance results are measured in terms or
schedule, budget and specifications, although other important organizational factors might be
considered for project performance evaluation. Therefore, each organization needs to define
successful project performance according to what makes sense to its strategic goals. Thus,
although most studies show that the great majority of projects fail in terms or costs and
schedules, they could still be viewed as “successful” in some other respect, in a meaningful way
to a organization. However, in today’s world of intensive international competition, time and
money are essential (although perhaps not exclusive) criteria to meet so that an organization is
able to deliver cheaper, faster project deliveries to customers than the competition. And, when
measured in terms of costs or schedule, most project fail; thus, most organizations must improve
the way they manage their projects to not only meet their respective project objectives, but to
also assure that cost, budget, and customers’ satisfaction are also part of the equation. In any
case, improving PM processes will lead to higher PM maturity, no matter which main goal(s) is
(are) pursued in a project. Organizations with high PM maturity are viewed as more effective at

21
managing successful projects. The next section explores the concepts of PM maturity and PM
maturity models.
2.3 Project Management Maturity and PMMMs:
Project management maturity describes how a project organization is able to successfully deliver
its project performance (i.e. within time, budget, and specifications) in a consistent manner. The
concept started with the Total Quality Movement, where the use of statistical process control
(SPC) enabled to demonstrate that improved technical process maturity led to the reduction of
special causes (non-normal) variations. Based on Dr. Deming’s concept of statistical process
control, the reasoning behind the creation of the project management maturity concept arises
from the belief that more mature management processes will lead to a reduction in project
management process inherent variability, and therefore, improve their mean performance.
Crosby (1979) also first detailed the evolutionary structure of reaching process maturity in
“Quality is Free” where he described five stages in adopting quality practices in an organization.
He stipulated that the introduction of new practices in an organization must take place in five
stages: 1) the organization is aware of the new practice; 2) the organization learns more about:
then 3) it tries it in a pilot testing; 4) it implements it across the organization; and 5) it finally
masters its use. Others, like W. Humphrey at IBM realized that software product quality was
directly related to the quality of the process used to develop it. Then, the first standardized
process model to continuously improve software development processes (Capability Maturity
Model – CMM® or SW-CMM®) was developed in 1993 by Carnegie Mellon University and
the Software Engineering Institute after years of research (http://www.sei.cmu.edu/). CMM®
provides recommended required practices in a number of key areas that should lead to enhanced
22
software process capability. Paulk, et al (1993), ones of the researchers on the CMM® model,
defined PM maturity as: “the extent to which a specific process is explicitly defined, managed,
measured, controlled, and effective”. Skulmoski (2001), citing Saures from the Project
Management Institute 29th Annual Seminars/Symposium in Long Beach, CA (October 9-15,
1998) recognizes project management maturity as the organization’s receptivity to project
management. Project management maturity can also be characterized by the degree to which an
organization fully supports and permits its project managers to do what is needed to successfully
manage a project (Skulmoski, 2001). Andersen, et al (2002), also indicates that project maturity
is synonym to how well conditioned an organization is to handle its projects. The authors also
define project maturity in three (3) different dimensions: 1) action (organizational ability to act
and decide), 2) attitude (organizational willingness to act), and 3) knowledge (organizational
understanding of the consequences of its actions and attitude.
Most researches in the area of project management maturity use a five-tiered assessment ladder
in order to define and measure maturity:
• Maturity level 1: no established PM practices exist.
• Maturity level 2: some PM practices are in place but not across the organization.
• Maturity level 3: PM practices and standards are instituted, and mostly followed
throughout the entire organization using established reporting forms and documents.
• Maturity level 4: in addition, the organization uses benchmarking metrics as a means to
rate itself against commonly accepted/expected standards and/or against others.
23
• Maturity level 5: continuous improvement through the efficient collection, use, and
decimation of data obtained in level 4 is in place.
Other researchers, like Dooley, et all (2001) base their definition of maturity on that of Paulk et
al (1993). But they replace the term “controlled” by “improved”, because the term controlled
only implies the elimination of special causes for variations in the process, and not necessarily
improvement in the process common causes. Therefore, in their research they define PM
maturity as the degree, to which a PM process is explicitly defined, managed, measured, and
continuously improved (2001). Based on this definition and after running a factor analysis, their
research showed that 8 items should be used in identifying and assessing PM maturity. These
items are:
• Clear production process documentation.
• Clear project objectives with expected economic, market, and product outcomes.
• Prevention of problems included in project planning.
• Entire new product development (NPD) team involved in project process improvement.
• Prevention of problems before their occurrence.
• NPD process improvements through sharing lessons learned among project.
• Control of NPD processes through information from multiple project intermediate steps.
• Clearly documented processes for NPD.
In essence, project management maturity describes the extent to which an organization can
consistently deliver successful project performance. Over the past 20 years, researchers in the
PM area developed project management maturity models (PMMMs) to help organizations
24
improve their project management maturity. These PMMMs are designed to help organizations
successfully, consistently, and predictably bring projects to completion. They are sequential
frameworks which enable organizations to evaluate their project management maturity level and
show which specific areas in project management need to be changed/improved in order to attain
a higher maturity level. The assumption behind the models is that by reaching predetermined
goals in specified key areas of project management, an organization will be able to improve
project performance on a consistent basis. Even though the PMMM concept is relatively new in
the project management area, many models have already been developed. Most PMMMs
incorporate the project management processes detailed in the Project Management Body of
Knowledge () guide and are based on the first developed model: the Software Engineering
Institute’s Capability Maturity Model (SW-CMM®). Although, they all have some unique
aspects differentiating them from other PMMMs, they all imply that PM maturity is the degree to
which an organization is able to manage its projects in an efficient and predictable manner.
As mentioned earlier, the first standardized process model created to improve PM processes was
CMM®. Produced for the software development industry, it provides recommended practices in
a number of key areas to enhance software development process capability. Other models that
have been created since then, adapted to either fit specific industries or to address different
management areas such as human resource management, systems engineering, etc. Other
PMMMs aimed at PM practices in general and not specific to a particular industry, are those that
tend to incorporate project management practices as detailed in the Project Management Body of
Knowledge () guide like the Berkeley model (Kwak and Ibbs, 2000), or the Project Management
Maturity Model (PMMM) from PM Solutions. In all cases, the researchers in this area have
25
recognized the need organizations have for continuous project management process
improvement in today’s economy. By developing these models, the researchers’ goals were
generally two-fold: 1) assess the organization current maturity level (diagnostic (assessment)
tool), and 2) provide a methodical framework for project management process improvement with
well-defined targets (operational (directional) tool).
The next section presents a summarized description and analysis of the most commonly-known
PMMMs.
2.4 Project Management Maturity Model (PMMM) Taxonomy:
There are currently over 30 maturity models on the market (Pennypacker, Grant, 2003). Some
are specific to particular organizations such as the Trillium Model used by Bell Canada (Bell
Canada, 1993) while others seek to apply to all organizations within an industry/profession.
Some models focus on a specific industry such as CMM for software organizations (SEI-CMU,
Paulk, et al. 1993), or the Standardized Process Improvement for Construction Enterprises,
SPICE, (Hutchinson, et al, 1999), while others are more generic to fit all organizations involved
in project management such as Kerzner’s Maturity Model (Kerzner, 2001). However, they all
aspire to improve project management capabilities and organizational project success.
The models can be classified as process-based or system-based (McBride et al, 2004).
• A process-based model, such as CMM®, demands that a process be fully mastered
before moving to another one in a higher maturity level.
26
• A system-based model stipulates that, in addition to perhaps adding new processes,
higher PM maturity is also attained by improving the efficiency of an already learned
PM process. Most models are system-based.
The following Table 2 provides a quick summary of the most popular models that are examined
by this research:

27
Table 2: Summary of Major Maturity Models.
In addition to the above-referred maturity models, the Project Management Institute (PMI)’s
(Project Management Book of Knowledge) guide, and UK government’s PRINCE2 (Project IN a
Controlled Environment) were also explored in this research. Although they are not maturity
models per se (even though PRINCE2 is often considered as one by some), do not offer maturity
assessment, nor a sequential framework for PM process improvement as PM maturity models do,
they are, however, a source of immense PM knowledge, are recognized worldwide as standards
for the PM profession, and are widely used to improve project management practices.
Model Author
Focus Primary targeted industries
Levels Classification
SW-CMM® (now integrated into CMMI®) SEI-CMI
Software development
Software industry 5 Process-based
Berkeley (PM)2 Ibbs-Kwak
Project management
Project-driven organizations
5 System-based
PMMM Kerzner
Project management
Project-driven organizations
5 System-based
OPM3 PMI
Project management
Project-driven organizations
4 System-based
PMMM PM solutions
Project management
Project-driven organizations
5 System-based
SE-CMM® (now integrated into CMMI) SEI-CMI
Systems engineering
Systems engineering organizations
6 staged levels, 3 continuous areas
System-based
CMMI® SEI-CMI
Project management, Software development, Systems engineering
Software developing, acquiring, systems engineering organizations
5 staged levels, 4 continuous areas.
Process-based System-based
ProMMM (PMProfessional Solutions Limited)
Project management
Project-driven organizations
4 System-based
PMMM by PM Solutions, Inc.
Project management
Project-driven organizations
5 System-based
28
Furthermore, as previously stated, knowledge areas have also been integrated in many of the
maturity models examined in this paper and therefore needed to be examined by this research.
Most of those models have used the basic structure of CMM®, the first developed model. It is a
very detailed model for software product development. Although now integrated into another
model (CMMI®) and no longer advocated by its creators, it is normal to start the maturity model
taxonomy with a description of this model since it has served as the foundation for so many
others.
The other following models were described in this taxonomy: 1) CMM®, 2) PMMM by
Kerzner, 3) OPM3 (PMI), 4) SE-CMM®, 5) CMMI®, 6) ProMMM (PMProfessional), 7)
Berkeley model (Kwak and Ibbs), 8) PMMM (PM Solutions), 9) Prince2, and 10) (PMI).
The general format for each model presentation included the following: 1) overview, 2)
objectives, 3) structure, 4) assessment in terms of advantages/disadvantages, and/or,
praises/criticism, and/or barriers/enablers.
2.4.1 Capability Maturity Model for Software (CMM® or CMM-SW®) (Paulk et al, 1993):
Overview:
In 1984, the government established the software Engineering Institute (SEI is a federally funded
research and development center sponsored by the U.S. Department of Defense and operated by
Carnegie Mellon University : CMU-SEI) in order to address the Department of Defense’s needs

29
for improved software. It had become apparent that DoD software contractors didn’t have a
defined and standardized process for software development. In the early 90’s, CMU-SEI with the
involvement of a wide body of experts who provided input as well as validated the substance of
the model, developed the Capability Maturity Model (CMM®) as a standardized assessment tool
for asserting how well defined contractors’ software development processes were, and provide
them with a structured framework for process improvement. As mentioned earlier, the basis for
CMM® is rooted in the Total Quality concepts whereas, the quality of any product is linked to
the quality of the processes used to develop the product. More mature processes lead to less
rework, better quality products, improved project control, and more successful project
deliverables. The same principles were used to develop CMM®. Recently CMM® has been
integrated into SEI’s other model CMMI® (Capability Maturity Model Integration) (see below
for more details) as a major source of material. Most of the content in CMM® is also present in
CMMI®. (For the next sections, this research referred CMM® simply as CMM.)
Objectives:
It provides a conceptual structure to improve software development process management in a
consistent and organized fashion. In addition, CMM aims at helping organizations gain control
over their software development and maintenance processes by determining their current
software process maturity level, and at presenting a set of activities that can lead to higher
process maturity. CMM is primarily targeted for software development companies. CMM has
four (4) practical uses:
30
1. Assessment teams use CMM to identify organizational strengths and weaknesses. It
assists them in identifying and prioritizing the necessary improvements needed to better
current processes.
2. Evaluation teams use CMM to evaluate the risks associated with contractor selection, and
contract monitoring. The more CMM mature a contractor organization, the more reliable
its software should be.
3. Upper management team use CMM to understand the necessary activities to launch and
maintain an organizational software process improvement program. The model provides
a benchmark against which it can measure its future improvements.
4. Technical and process improvement team use CMM to help define and improve software
processes from a technical and technological point of view by identifying the essential
key process areas (KPAs) necessary for improving processes.
Even though CMM was developed for the software development industry solely, it has often
been used as a basis for later project management maturity models since it was the first
articulated and detailed model of its sort.
Structure:
CMM is a staged model and has five maturity levels (precise evolutionary step toward mature
software process). Each maturity level is composed of key process areas (KPAs). Those
activities, when performed collectively, identify requirements for achieving each maturity level.
They help organizations understand which areas need to be improved in order to progress to
higher levels of maturity.

31
CMM‘s five (5) maturity levels are:
• Level 1: initial level. The organization doesn’t have an infrastructure that provides for
consistent and repeatable software development and maintenance processes. Project
success results from individual capabilities, such as an exceptional project manager. No
methodology has been developed to facilitate project success throughout the
organization. There is no organizational training program in the area of project
management. Top executives do not see the importance of standardizing PM processes
throughout the organization.
• Level 2: repeatable level. Basic project management processes are established to track
cost, schedule, and functionality. Basic project management guide has been developed
throughout the organization, but its use is not widespread for all projects.
• Level 3: defined level. All projects use an organized, documented, and standardized set
of activities, consistent throughout the organization. Organizational-wide project training
programs are implemented. Both software activities and management practices are
repeatable.
• Level 4: managed level. Detailed time, cost, and other metrics are developed and
systematically collected and used to quantitatively manage software development and
potentially improve processes. The organization has a quality focus with tools and
training to support development.
• Level 5: optimizing level. The entire organization is focused on continuous process
improvement. Technology and process improvements are planned and managed as
ordinary business activities.

32
Skipping maturity levels is considered counterproductive because each maturity level forms a
foundation from which to achieve the next level. To improve its software process maturity, an
organization must incorporate the new key process areas at the corresponding level to those from
the previous levels. Table 3 summarizes CMM maturity levels and the corresponding key
process areas:

33
Table 3: CMM’s Maturity Levels and KPAs:
Assessment:
Many empirical examples seem to show that implementing CMM lead to improved software
development projects. For example, Raytheon claims that its productivity doubled after its
Maturity Level
Level 1 - Initial
Level 2 – Repeatable
Level 3 - Defined Level 4 - Managed
Level 5 - Optimizing
Classifica-tion
• Undefined processes
• Software development success fully dependent on individual effort.
• No methodology has been developed to facilitate project success throughout the organization.
• Basic Project Management best practices are in place (cost, schedule tracking).
• Project Management tools are successfully used on individual analogous projects.
• Successful processes are not transferable across the organization.
• Organization wide software process standards employed by both Management and engineering.
• All best practices are documented, standardized and integrated.
• All processes are repeatable and transferable.
• Software development process detailed measures are quantitatively collected, managed, quantified, analyzed, understood, and controlled.
• Future process implementation performance can be predicted.
• Software process continuously improved by quantified feedback.
• Innovative ideas are tested.
• Employees understand hoe its organizational process is related to the overall enterprise business strategies.
KPA’s NA Basic PM controls: 1. Requirements
management 2. Software
project planning
3. Software project tracking and oversight
4. Software subcontract management
5. Software quality assurance
6. Software configuration management
Institutionalization of software engineering and PM processes: 1. Organization
process definition and focus
2. Training program
3. Integrated-software management
4. Software product engineering
5. Intergroup coordination
6. Peer reviews
Quantitative controls:
1. Quantitative process management
2. Software quality management
Continuous software process improvement: 1. Defect
prevention, 2. Technology-
change Management
3. Process-change Management

34
maturity level increased from 1 to level 3 (invested about $1 million from 1988 to 1992). It also
specifies that for every $1 it spent due to CMM standard requirements, it received a return of
$7.7. It also indicated that more intangible results were incurred such as improvement in
communication, employee’s moral, and turnover.
Schlumberger started its software process improvement in 1989. It also claims that its
productivity raised by 30% from 1988 to 1992, received a return of $8.8 for every $1 invested
during the process, and experienced benefits in cycle times, schedule adherence, and defect rates.
The following Table 4 summarizes some case studies of organizations that embarked on the
CMM software process improvement journey *Krasner, et al, 1997).
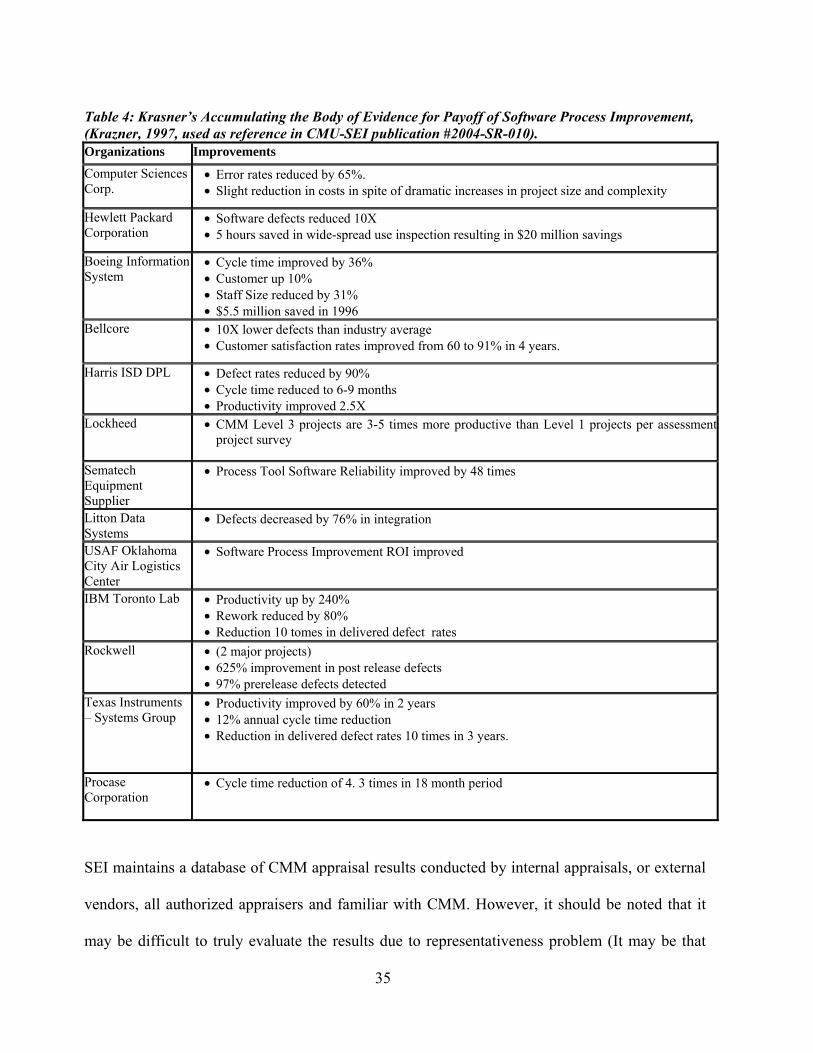
35
Table 4: Krasner’s Accumulating the Body of Evidence for Payoff of Software Process Improvement, (Krazner, 1997, used as reference in CMU-SEI publication #2004-SR-010). Organizations Improvements
Computer Sciences Corp.
• Error rates reduced by 65%. • Slight reduction in costs in spite of dramatic increases in project size and complexity
Hewlett Packard Corporation
• Software defects reduced 10X • 5 hours saved in wide-spread use inspection resulting in $20 million savings
Boeing Information System
• Cycle time improved by 36% • Customer up 10% • Staff Size reduced by 31% • $5.5 million saved in 1996
Bellcore • 10X lower defects than industry average • Customer satisfaction rates improved from 60 to 91% in 4 years.
Harris ISD DPL • Defect rates reduced by 90% • Cycle time reduced to 6-9 months • Productivity improved 2.5X
Lockheed • CMM Level 3 projects are 3-5 times more productive than Level 1 projects per assessment project survey
Sematech Equipment Supplier
• Process Tool Software Reliability improved by 48 times
Litton Data Systems
• Defects decreased by 76% in integration
USAF Oklahoma City Air Logistics Center
• Software Process Improvement ROI improved
IBM Toronto Lab • Productivity up by 240% • Rework reduced by 80% • Reduction 10 tomes in delivered defect rates
Rockwell • (2 major projects) • 625% improvement in post release defects • 97% prerelease defects detected
Texas Instruments – Systems Group
• Productivity improved by 60% in 2 years • 12% annual cycle time reduction • Reduction in delivered defect rates 10 times in 3 years.
Procase Corporation
• Cycle time reduction of 4. 3 times in 18 month period
SEI maintains a database of CMM appraisal results conducted by internal appraisals, or external
vendors, all authorized appraisers and familiar with CMM. However, it should be noted that it
may be difficult to truly evaluate the results due to representativeness problem (It may be that

36
only successful organizations submit their results), and appraisers’ bias (can self appraisal be
truly relied upon?). Even then, this rich database offers many empirical examples and special
reports of successful CMM-based software process improvement implementations.
In addition, Lawlis and his colleagues (used as reference in CMU-SEI publication #2003-TN-
015) showed the benefits of CMM by demonstrating a positive correlation between CMM rating
and software development success (Lawlis, et al, 1995). Their study revealed that at higher
maturity levels better project performance was observed in the area of cost and schedule (see
section 2.5 for further details).
Others (Jung, Goldenson 2003) also confirmed that higher maturity levels as measured by CMM
lead to lower deviation from schedule, and more accurate (less variance) schedule estimates (see
section 2.5 for further details).
Another advantage of CMM is that it identifies the key process areas that are crucial for software
improvement as defined by current professionals in the field. The model was designed through
workshops with industry and government professionals helping identify key factors affecting
software development project success. The model was reviewed and updated by over 500
practitioners and approved by an advisory board of 14 senior software engineering professionals.
Although no longer sponsored by SEI, its structure has been the main basis for their newly
integrated model: CMMI® (see section 2.4.5 for further details).
Criticism associated with model:

37
CMM was often considered too voluminous (over 500 pages), and complex in nature. Its
terminology was often difficult to understand by organizational employees. Its concepts needed
to be simplified and converted into an understandable, concise, and meaningful set of actions and
objectives for the people in the organization.
Even if the implementation of CMM should lead to more efficient processes, higher quality
products, and ultimately better profits, organizations had to advance large investment dollars to
support their initiative. For example, some typical increased costs associated with CMM-related
process improvement actions were: first-time testing and overhead costs, software, hardware,
data collection, design defects repair, and code defects repair. The costs associated with
implementing CMM were especially hard on small businesses, which might not have had the
initial capital investment (in terms of time, people and money) to undergo such a framework.
In addition, improving software processes with CMM meant that training time had to be
increased, too often to the detriment of manufacturing time, which could have hurt organizations
under tight commitments to deliver products to customers.
Furthermore, if a subcontractor was at a high level of maturity such as level 5, while the
customers was at lower maturity levels such as levels 1 or 2, the latter were not likely to have the
internal disciple and infrastructure to take advantage of the outsourcer’s standardized processes
(King, 2003).

38
Another common complaint about CMM was that CMM standards were descriptive not
prescriptive. They described what needed to be done, rather than how it should have been done.
Therefore, an organization might have selected the best possible standards to improve maturity
levels, but selected an implementation strategy, which was not the most effective one for that
particular process. In this case, improvement in maturity level was doubtful. In a survey
(Herbsled, et al, 1996) of 138 respondents, 2/3 of all respondents felt they needed more
directions on how to change, and over half thought that individualized assistance and mentoring
during the CMM implementation would have greatly benefited their organization.
These criticisms notwithstanding, CMM provided a framework against which organizational
processes could be measured, and offered an approach to standardize processes throughout the
organization in order to diminish variations and unpredictability in performance in the software
development industry.
Enablers and Barriers:
Many factors associated with CMM successes and failures are also common to other models.
Many of the obstacles in successful CMM implementation were under management control. For
example, organization culture was often a threat to successful CMM implementation. As with
many organizations, politics, lack of leadership and the fear of change inhibited any new process
improvement. Executives’ buy-in was also necessary to assure that any process improvement
was carried out. If CMM was not presented to all employees as top priority standards to follow,
it was viewed as “another fad” that would take time away from busy schedules.

39
Another common barrier that hindered successful deployment of new CMM policies was
unrealistic expectations. In the previously-mentioned Herbsled’s survey (1996), it was found that
many who undertook CMM standards were somewhat disappointed with the results. Over-
ambitious results led to discouragement and potentially to the rejection of CMM. Finally, when
implemented during difficult economic trends (lower demands, high interest rates, rising price,
etc.), or hard internal times (mergers, lay-offs., etc.), CMM did not bring the anticipated results.
Table 5 is a summary of the advantages and disadvantages of CMM.
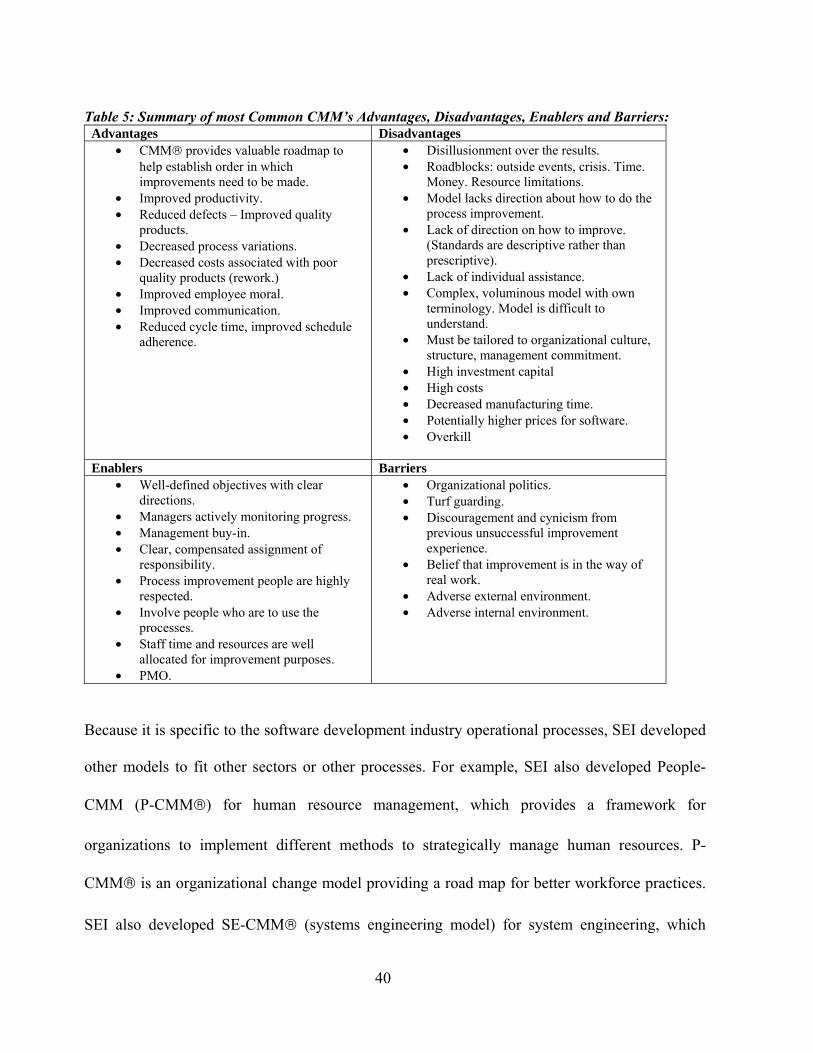
40
Table 5: Summary of most Common CMM’s Advantages, Disadvantages, Enablers and Barriers: Advantages Disadvantages
• CMM® provides valuable roadmap to help establish order in which improvements need to be made.
• Improved productivity. • Reduced defects – Improved quality
products. • Decreased process variations. • Decreased costs associated with poor
quality products (rework.) • Improved employee moral. • Improved communication. • Reduced cycle time, improved schedule
adherence.
• Disillusionment over the results. • Roadblocks: outside events, crisis. Time.
Money. Resource limitations. • Model lacks direction about how to do the
process improvement. • Lack of direction on how to improve.
(Standards are descriptive rather than prescriptive).
• Lack of individual assistance. • Complex, voluminous model with own
terminology. Model is difficult to understand.
• Must be tailored to organizational culture, structure, management commitment.
• High investment capital • High costs • Decreased manufacturing time. • Potentially higher prices for software. • Overkill
Enablers Barriers • Well-defined objectives with clear
directions. • Managers actively monitoring progress. • Management buy-in. • Clear, compensated assignment of
responsibility. • Process improvement people are highly
respected. • Involve people who are to use the
processes. • Staff time and resources are well
allocated for improvement purposes. • PMO.
• Organizational politics. • Turf guarding. • Discouragement and cynicism from
previous unsuccessful improvement experience.
• Belief that improvement is in the way of real work.
• Adverse external environment. • Adverse internal environment.
Because it is specific to the software development industry operational processes, SEI developed
other models to fit other sectors or other processes. For example, SEI also developed People-
CMM (P-CMM®) for human resource management, which provides a framework for
organizations to implement different methods to strategically manage human resources. P-
CMM® is an organizational change model providing a road map for better workforce practices.
SEI also developed SE-CMM® (systems engineering model) for system engineering, which

41
enabled organizations to assess and improve their systems engineering capabilities. SEI also
developed SA-CMM® (software acquisition model) for software acquisition. This model is
intended for the software buyer organizations, which can use SA-CMM® as a tool to improve
their software acquisition process, while the software supplier organization can use CMM to
improve its software development process. However, the models are very specific, and not often
used in the industry.
2.4.2 Project Management Maturity Model (PMMM) (Kernzer, 2001):
Overview:
According to Kerzner (2001), a well-respected researcher in the PM field, an organization must
develop a repetitive PM methodology, while laying the foundations for a supportive
organizational culture that beliefs in the methodology in order to excel in project management.
Kerzner developed a PMMM (Project Management Maturity Model), which describes the basis
for improving PM processes in order to attain higher levels of maturity in project management.
Objectives:
Kerzner’s PMMM provides guidance for organizations to improve their project management
processes. The model is aimed at any organization in any industry that uses project management
as a means to operate and implement strategic planning. It describes activities necessary to
achieve specific maturity levels in project management.
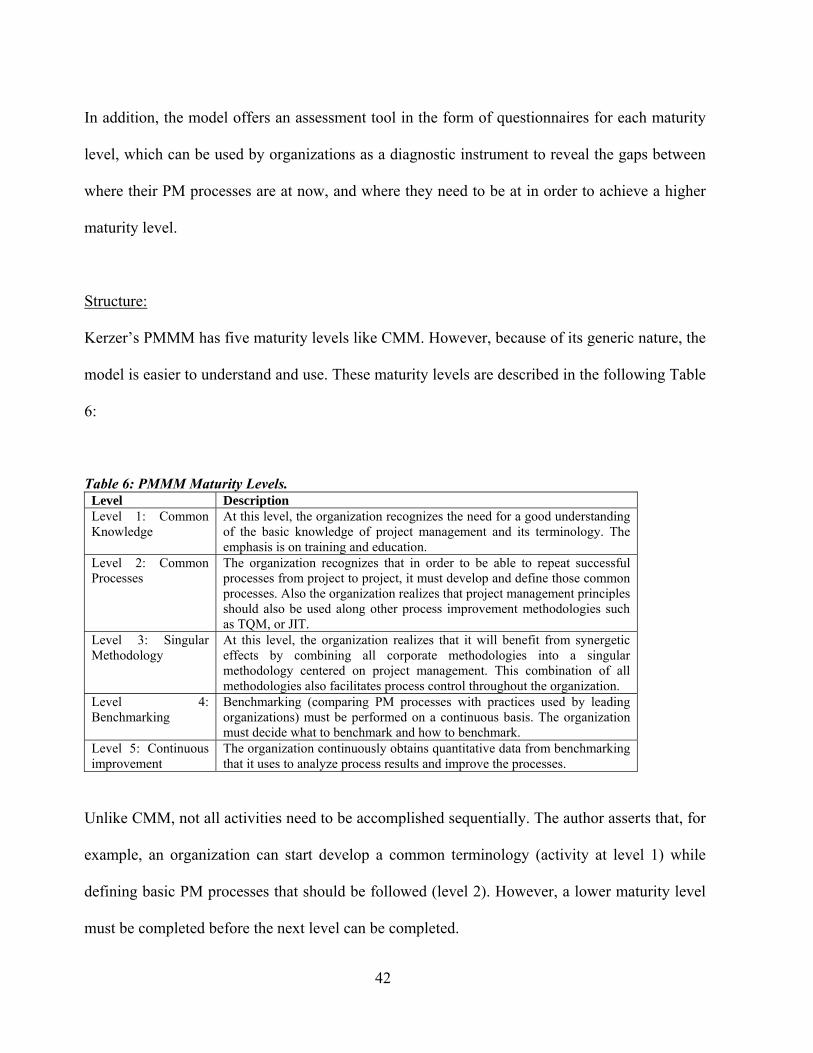
42
In addition, the model offers an assessment tool in the form of questionnaires for each maturity
level, which can be used by organizations as a diagnostic instrument to reveal the gaps between
where their PM processes are at now, and where they need to be at in order to achieve a higher
maturity level.
Structure:
Kerzer’s PMMM has five maturity levels like CMM. However, because of its generic nature, the
model is easier to understand and use. These maturity levels are described in the following Table
6:
Table 6: PMMM Maturity Levels. Level Description Level 1: Common Knowledge
At this level, the organization recognizes the need for a good understanding of the basic knowledge of project management and its terminology. The emphasis is on training and education.
Level 2: Common Processes
The organization recognizes that in order to be able to repeat successful processes from project to project, it must develop and define those common processes. Also the organization realizes that project management principles should also be used along other process improvement methodologies such as TQM, or JIT.
Level 3: Singular Methodology
At this level, the organization realizes that it will benefit from synergetic effects by combining all corporate methodologies into a singular methodology centered on project management. This combination of all methodologies also facilitates process control throughout the organization.
Level 4: Benchmarking
Benchmarking (comparing PM processes with practices used by leading organizations) must be performed on a continuous basis. The organization must decide what to benchmark and how to benchmark.
Level 5: Continuous improvement
The organization continuously obtains quantitative data from benchmarking that it uses to analyze process results and improve the processes.
Unlike CMM, not all activities need to be accomplished sequentially. The author asserts that, for
example, an organization can start develop a common terminology (activity at level 1) while
defining basic PM processes that should be followed (level 2). However, a lower maturity level
must be completed before the next level can be completed.
43
Assessment:
This model is very broad and more like a general theoretical guideline to improve PM processes.
Its simplicity, generic format makes it an excellent straightforward tool for senior managers who
want to implement a maturity model to explain the concepts behind maturity models, what these
models seek to accomplish, and what each maturity level implies in term of project management
competencies.
However, its generality and descriptive nature offer little assistance as to how an organization
can actually move up the maturity curve.
Barriers and Enablers:
As with CMM, resistance to change is one of the biggest barriers when new processes are
introduced. Fear of the unknown and biased belief that new measures will only bring additional
rigid procedures can also be tremendous obstacles to overcome, especially if the organizational
culture is very inflexible and adverse to change. Also, a strongly fragmented culture will be an
obstacle to change since it won’t promote a single cooperative corporate environment. In
addition, singular methodologies, developed at level 3, can be defied because they may shift the
balance of power.
Another barrier to the successful implementation of the PMMM is related to benchmarking.
Careful selection of whom an organization will benchmark against is crucial. Although it is
logical to try to benchmark against one’s best competitors, sometimes choosing organizations

44
outside one’s industry can bring better performance results. The author cites an aerospace
company which learned new methodologies through benchmarking against non-aerospace
organizations (p.102). However, it is also important not to compare the organization’s results to
unreachable, unrealistic metrics, which may only create discouragement among employees.
Finally, Kerzner advocates for organizations to carefully choose a project maturity model that
adapts to the organizational culture and not the other way around, in order to facilitate the
deployment of new project management processes and methodologies.
Table 7 is a summary of the advantages and disadvantages of PMMM.
Table 7: Kerzner’s PMMM Advantages, Disadvantages, Enablers, and Barriers Advantages Disadvantages
• Broad, generic model, • Easy to explain.
• Not enough direction.
Enablers Barriers • Senior management buy-in. • Supportive organizational culture.
• Resistance to change. • Fragmented corporate culture. • Alignment of PMMM with corporate
culture. • Adequate benchmarking.
2.4.3 Organization Project Management Maturity Model – OPM3 (PMI, 2003):
Overview:
The Project Management Institute (PMI) worked for over 5 years to develop the organizational
project management maturity model or OPM3™ (later mentioned by this research as OPM3),
which aims at becoming a source for best practices in the domain of organizational project

45
management including portfolio, program, and project management, as well as the standard to
assess project management capabilities. OPM3 is a generic model and can be applied to
organizations from diverse industries, sizes, and geographical locations.
According to PMI, they have enrolled the help of over 800 professionals in the PM community
from over 35 countries for this endeavor. OPM3 is aligned to the content in . PMI has announced
a second edition update to be released late 2008. PMI is collecting case studies of organizations
that purchased and implemented OPM3, which are scheduled to be released in the near future.
According to PMI Hong Kong Chapter vice president, OPM3 is a reference model for project
organizations, as is for project (Hoffman, 2005).
Objectives:
This model was designed:
• To help organizations assess their level of project management maturity compared to best
practices in the project management field,
• To identify specific areas needing improvement,
• To promote organizational maturity awareness among senior management, and,
• To link organizational strategy to consistent and predictable project completion.
With this model, PMI believes users will be able to tell which best practice belongs to which
domain (project, program – group of related projects managed in a coordinated fashion-,
portfolio – collection of projects and/or programs not necessarily interdependent from each
46
other-) and at what stage(s) of organizational process improvement (standardize, measure,
control, improve).
According to OPM3, it has documented hundreds of best practices in the field of organizational
project management, has established which specific capabilities are needed to achieve those best
practices, and how to ascertain when each capability has been mastered. According to PMI,
OPM3 enables organizations to assess their degree of maturity in organizational project
management (self-assessment), develop a plan for improvements based on the assessment
results, organizational strategic priorities and resources, and implement the plan over time in
order to attain the needed capabilities and move ahead on the organizational project management
maturity path.
Structure:
The basic components of OPM3 are:
• Directory of Best Practices: these are the optimal ways recognized by the industry
standards to achieve a stated goal. In the case of project management this includes the
ability to deliver projects successfully, consistently, and predictably in order to
implement organizational strategies.
• Directory of Capabilities: these abilities are necessary for attaining the best practices,
• List of Observable Outcomes: these should show the existence of a particular capability,
• List of Key Performance Indicators: these are the tools to measure each outcome.
• Improvement Plan Directory: it lists all the capabilities required for each Best Practice,
including those from other Best Practices. Understanding the “dependencies” between

47
capabilities should provide a more comprehensive view of the organizational needs in
terms of achieving a given Best Practice. PMI has stated that its OPM3 project team has
diligently worked on these complex interdependencies, and has identified over 600 Best
Practices, 3,000 Capabilities, and 4,000 relationships between Capabilities.
Best Practices are organized by the stages of process improvement (levels of maturity):
Standardize Measure, Control, and Improve. They are also categorized according to the
organizational project management domains: project, program, and portfolio (PPP).
The capabilities are classified by the process groups of the project life cycle: Initiating, Planning,
Executing, Controlling, and Closing processes. PMI believes that this structure allows for finer
tuning of the model so that organizations can fully understand every best practice and its
potential application to all three domains.
OPM3’s structure is based on 3 elements: knowledge (learn about best practices), assessment
(determine current level of PM maturity), and improvement (identify a path for continuous
improvement based on the acquired knowledge of best practices and current level of PM
maturity).
Assessment:
As indicated earlier, this model is still relatively new and few case studies on its use are
available. However, PMI has collected some case studies on organizations that have purchased
the standard. On their website, they cite to success stories: 1) Pinellas County IT: OPM3 helped

48
increased performance and customer confidence, 2) Washington Savanah River Co.: OPM3
helped the organization improve its PM maturity. Although these results are excellent, additional
data on the impact of OPM3 need to be gathered to fully validate OPM3’s success.
2.4.4 Systems Engineering Capability Maturity Model (SE-CMM®) (Bate, et al, 1995):
Overview:
This model has also been integrated into SEI’s CMMI model, and is no longer used. However,
because it was one of the rare models developed on a continuous framework, a brief description
is provided for illustration purposes. Continuous models focus on single process improvement
roadmap versus families of key areas as in the staged models.
SE-CMM® (further referred as SE-CMM in this research) describes the elements an
organization needed to have in order to develop efficient and effective systems engineering
processes. This model also made it possible for organizations to assess their systems engineering
capabilities. The model was developed to help systems engineers and process developers as well
as decision makers from organizations such as GTE, Texas Instrument Incorporated, Lockheed
Martin Corporation, etc.
Structure:
In order to support as many organizations as possible, SE-CMM tried to define characteristics
necessary for sound systems engineering processes, but it did not define/impose any specific
process. It was not intended to change organizational culture. SE-CMM was composed of two

49
aspects: 1) domain portion (systems engineering process specific) and 2) capability portion
(generic process management, and institutionalization capability).
Within the domain aspect of SE-CMM, there were 18 process areas (PA). PAs were major topic
areas necessary for effective systems engineering. The 18 PAs were grouped into three
categories: engineering, project, and organization process areas. Each PA was composed of
mandatory characteristics that needed to be implemented in order to satisfy that PA. The
following table provides a listing of the PAs within each category. The choice of a PA and the
order in which an organization would focus on a PA depended on its unique situation. SE-CMM
didn’t prescribe any particular process or sequence. Table 8 summarizes the process areas of SE-
CMM.
Table 8: SE-CMM’s Process Areas.
Engineering Process Areas Project Process Areas Organizational Areas Analyze Candidate Solution Ensure Quality Coordinate with Suppliers Derive and Allocate Requirements
Manage Configurations Define Organization’s SE Processes
Evolve System Architecture Manage Risk Improve Organization’s SE Processes
Integrate Disciplines Monitor and Control Technical Efforts
Manage Product Line Evolution
Integrate System Plan Technical Effort Manage SE Support Environment
Understand Customers’ needs and expectations
Provide On-going Knowledge and Skills
Verify and Validate System
Within the capability portion of SE-CMM there were six process capability levels for each PA.
The six capability levels applied to all PAs, and described the change that a process had to go
through in order to increase its maturity. The six capability levels are described in Table 9.
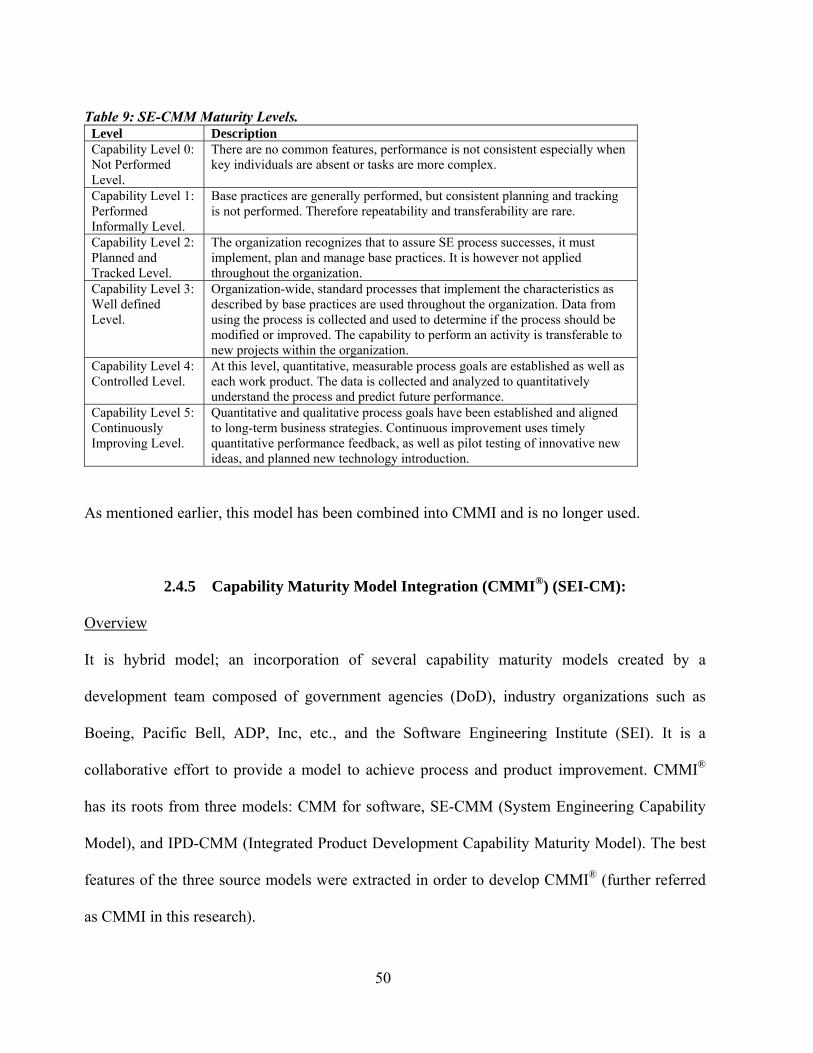
50
Table 9: SE-CMM Maturity Levels. Level Description Capability Level 0: Not Performed Level.
There are no common features, performance is not consistent especially when key individuals are absent or tasks are more complex.
Capability Level 1: Performed Informally Level.
Base practices are generally performed, but consistent planning and tracking is not performed. Therefore repeatability and transferability are rare.
Capability Level 2: Planned and Tracked Level.
The organization recognizes that to assure SE process successes, it must implement, plan and manage base practices. It is however not applied throughout the organization.
Capability Level 3: Well defined Level.
Organization-wide, standard processes that implement the characteristics as described by base practices are used throughout the organization. Data from using the process is collected and used to determine if the process should be modified or improved. The capability to perform an activity is transferable to new projects within the organization.
Capability Level 4: Controlled Level.
At this level, quantitative, measurable process goals are established as well as each work product. The data is collected and analyzed to quantitatively understand the process and predict future performance.
Capability Level 5: Continuously Improving Level.
Quantitative and qualitative process goals have been established and aligned to long-term business strategies. Continuous improvement uses timely quantitative performance feedback, as well as pilot testing of innovative new ideas, and planned new technology introduction.
As mentioned earlier, this model has been combined into CMMI and is no longer used.
2.4.5 Capability Maturity Model Integration (CMMI®) (SEI-CM):
Overview
It is hybrid model; an incorporation of several capability maturity models created by a
development team composed of government agencies (DoD), industry organizations such as
Boeing, Pacific Bell, ADP, Inc, etc., and the Software Engineering Institute (SEI). It is a
collaborative effort to provide a model to achieve process and product improvement. CMMI®
has its roots from three models: CMM for software, SE-CMM (System Engineering Capability
Model), and IPD-CMM (Integrated Product Development Capability Maturity Model). The best
features of the three source models were extracted in order to develop CMMI® (further referred
as CMMI in this research).

51
Objectives:
The main goals of CMMI are:
• To eliminate any inconsistencies between models, and reduce redundancy,
• To simplify and integrate the models for multi-disciplinary organizations,
• To increase clarity and understanding of project management maturity models by using
common terminology, components, and style.
It aims at offering an efficient and effective single assessment and improvement methodology
across organizational multi-process disciplines, therefore reducing assessment and training costs
for software-related organizations. It is also designed to help organizations in this industry to
develop a common vision for improvements in a standard fashion.
Structure:
Unlike CMM, it has two representations: staged (organizational maturity approach) and
continuous (process capability approach). The former pertains to a group of process areas, which
organizations need to master in order to increase their maturity levels. The later relates to
individual process area capabilities necessary to achieve effective improvement in the specified
process area.
The staged representation is very similar to the maturity levels of CMM. It provides a pre-
defined roadmap for organizational improvement based on a sequential process grouping
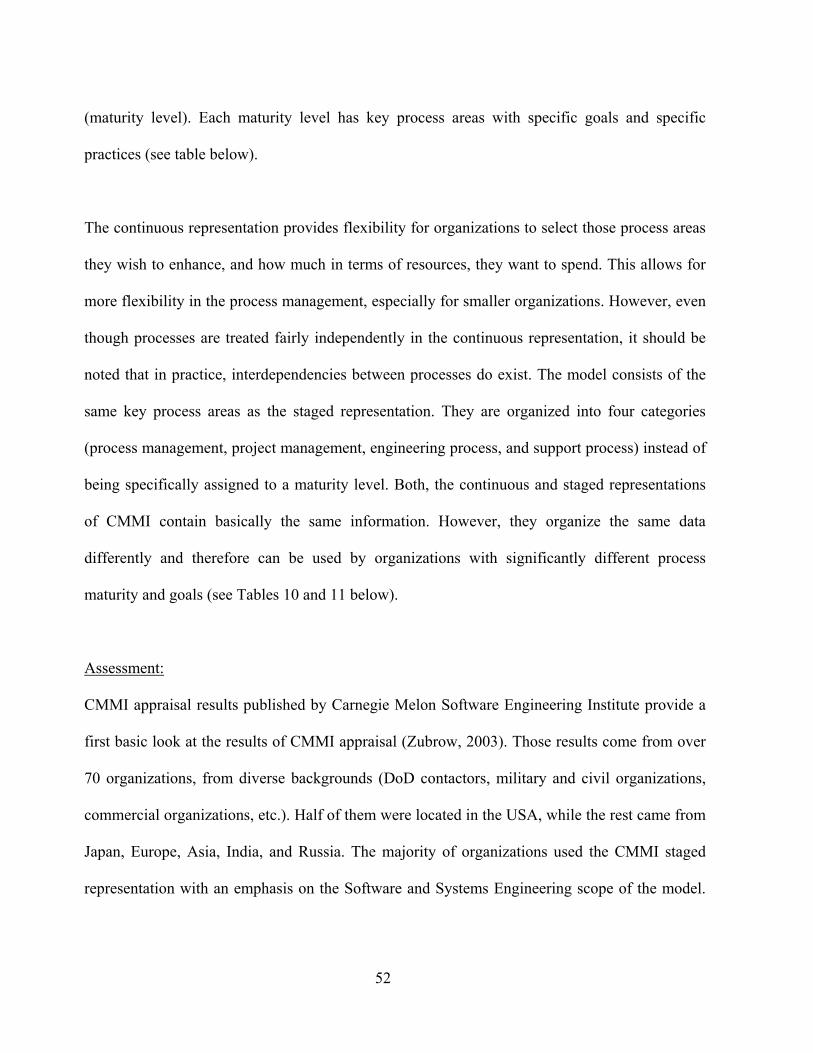
52
(maturity level). Each maturity level has key process areas with specific goals and specific
practices (see table below).
The continuous representation provides flexibility for organizations to select those process areas
they wish to enhance, and how much in terms of resources, they want to spend. This allows for
more flexibility in the process management, especially for smaller organizations. However, even
though processes are treated fairly independently in the continuous representation, it should be
noted that in practice, interdependencies between processes do exist. The model consists of the
same key process areas as the staged representation. They are organized into four categories
(process management, project management, engineering process, and support process) instead of
being specifically assigned to a maturity level. Both, the continuous and staged representations
of CMMI contain basically the same information. However, they organize the same data
differently and therefore can be used by organizations with significantly different process
maturity and goals (see Tables 10 and 11 below).
Assessment:
CMMI appraisal results published by Carnegie Melon Software Engineering Institute provide a
first basic look at the results of CMMI appraisal (Zubrow, 2003). Those results come from over
70 organizations, from diverse backgrounds (DoD contactors, military and civil organizations,
commercial organizations, etc.). Half of them were located in the USA, while the rest came from
Japan, Europe, Asia, India, and Russia. The majority of organizations used the CMMI staged
representation with an emphasis on the Software and Systems Engineering scope of the model.

53
Most first appraised companies were at maturity levels 1, 2 and 3, while those reappraised were
at level 5.
Furthermore, Goldenson, et al (2003) wrote a report showing CMMI’s results on a study of 12
cases from 11 organizations. Five (5) had home offices in the US, and six (6) were located in
Europe and Australia. The results of the study were classified into five (5) benefit categories:
cost, schedule, quality, customer satisfaction, and return on investment (cost benefits issues).
The following are just examples of some of the results reported in the analysis:
• 33% decrease in average cost to fix defect (Boeing, Australia).
• 15% decrease in defect find and fixed costs (Lockheed Martin).
• Decreased in the average number of days late from 50 to fewer than 10 (General Motors).
• 15% improvement in internal on-time delivery (Bosch Gasoline System).
Even though these results show that CMMI-based process improvements can lead to better
project performance and quality products, additional data is needed in order to further
corroborate these first results of CMMI implementation. The following Tables 10 and 11
summarize CMMI’s staged and continuous representations.

54
Table 10: CMMI: The Staged-Representation: The Maturity Levels. Level Description Key Process Areas Generic Goals Generic Practices
Level 1: Initial
Ad Hoc Processes
NA NA NA
Level 2: Repeatable
Basic Project Management
• Software Configuration Management
• Software Quality Assurance
• Software Acquisition Management
• Software Project Control • Software Project
Planning • Requirements
Management
• Institutionalize managed process
• Establish org. policy. • Plan process • Provide resources • Assign responsibilities • Train people • Perform managed
process • Manage
configurations. • Identify and involve
relevant • Stakeholders. • Monitor and control
the • Process. • Objectively verify
adherence. • Review status with
mgmt.
Level 3: Defined
Process Standardization
• Peer Reviews • Project Interface
Coordination • Software Product
Engineering • Organization Training
Program • Organization Process
Definition • Organization Process
Focus
• Institutionalize a
• Defined Process.
• Establish a defined process.
• Collect improvement information.
Level 4: Managed
Quantitative Management
• Organization Process Performance
• Statistical Process Management
• Org Software Asset Commonality
• None • None
Level 5: Optimizing
Continuous Process Improvement
• Org Improvement Deployment
• Org Process and Tech Innovation
• Defect Prevention
• None • None
55
Table 11: CMMI – The Continuous Representation: The Capability Levels. Level Description Generic Goals Generic practices Level 0: Incomplete
Process is either not performed or partially performed
NA NA
Level 1: Performed
Process satisfies all specific goals of the process area
• Achieve Specific goals
• Perform base practices
Level 2: Managed
Process is planned and executed in accordance with policy, monitored, controlled, and evaluated.
• Establish org. policy.
• Plan the process.
• Provide resources.
• Assign responsibility.
• Train people. • Perform
managed process.
• Manage configurations. • Identify and involve
relevant stakeholders. • Monitor and control the
process. • Objectively verify
adherence. • Review status with
managemt.
Level 3: Defined Process standards and procedures are applicable to all projects throughout the organization.
• Institutionalize a defined Process.
• Establish a defined process.
• Collect improvement information.
Level 4: Quantitatively Managed
Processes are controlled using statistical and other quantitative techniques.
• Institutionalize a quantitatively managed process.
• Establish quality objectives for the process.
• Stabilize sub process performance.
Level 5: Optimizing
Processes are continuously improved through incremental and innovative technological improvements.
• Institutionalize an optimizing Process.
• Ensure continuous process improvement.
• Correct root causes of problems.
2.4.6 ProMMM (PMProfessional):
Overview:
Developed by PMProfessional Solutions Limited, a UK-based project management organization,
it is intended for organizations to evaluate their project management process adequacy, and
compare them to best practices. This model was used in a case study by David Hillson (2003)
where the author measured project management capability maturity in a multinational
organization. The model structure originates from concepts from other existing models such as

56
CMM, measuring PM maturity according to a scale, but also emphasizes the importance of
organizational culture (David Hillson, 2003).
Objectives:
The ProMMM aims to offer a generic framework so that organizations from any industries can
easily assess their project management capabilities. It also shows the different defined stages that
an organization can follow to benchmark itself and check if/how it is improving its PM
capabilities.
Structure:
There are four (4) levels of project management capabilities, which correspond to four (4) well-
defined stages of project management excellence. These are summarized in Table 12.
Table 12: ProMMM Levels of PM Organizational Capabilities. Level Description Level 1: Naïve. There is no structure for project management. The organization has not yet
recognized the need for project management. Level 2: Novice. Top management is not yet convinced of the benefits of project
management. Some project management processes are used, but no formal processes are in place. Project management effectiveness depends on the limited experience of a few individuals.
Level 3: Normalized: The organization values the benefits of project management. Generic and formal processes have been developed and are in place. Project management application is routine and consistent across projects.
Level 4: Natural. The organization has developed a project-based culture that fully support project management best practices for all projects. All staff use project management best practices and is widely trained at it.
For each level, there are four (4) attributes that must be measured:
1. Culture: how the organization thinks and behaves toward PM.

57
2. Process: how well the organization has implemented tools and techniques that support
PM.
3. Experience: how knowledgeable the organization’s employees are in project
management, and how well the organization trains them for PM.
4. Application: how well the organization implements and institutionalizes PM principles
toward PM maturity.
These attributes are defined at each level, and are used to measure the organization PM
capabilities. A summary of what these attributes appear at each maturity level is provided below
in Table 13.
Table 13: ProMMM Attributes at Each Maturity Level. Maturity Culture Process Experience Application Naïve Resistant to change No PM processes
in place No PM experience No application
within the business Novice Not fully convinced
of PM benefits Ad hoc, Some employees
have limited PM experience
Inconsistent, irregular
Normalized PM benefits are recognized and appreciated
Generic and formal processes are in place
Staff has adequate PM experience
Habitual and consistent across the organization.
Natural Fosters proactive PM Best practices implemented at all levels
All staff has experience
Second-nature to all areas.
Assessment:
This model was designed to simplify the PM maturity assessment process, and it seeks to be
more accessible to any organization in any industry. It also specifically mentions the importance
of organizational culture, how training, implementation, and the tools used in managing projects
can influence PM maturity. However, as mentioned by David Hillson (2001), the model lacks
academic research, although the author indicated that ProMMM has been used by many
58
organizations in various industries such as nuclear, construction, telecoms, defense,
pharmaceutical, and engineering. The author’s case study referred earlier, shows how this model
can be used for PM maturity assessment and how it can help organizations detect their PM
strengths and weakness.
2.4.7 Berkeley PM Process Maturity Model (PM)² (Kwak and Ibbs – 2000) :
Overview:
The Berkeley model has been used as an assessment tool by the authors to evaluate
organizational maturity levels. It illustrates a series of steps necessary to incrementally improve
overall PM effectiveness. The model breaks up the PM processes and practices into the eight
knowledge areas from (scope, time, cost, quality, human resources, communication, risk, and
procurement) and six process phases (initiate, plan, execute, control, close, and project-driven
organization). It is not industry specific. The model helps organizations evaluate what maturity
level they are at, and what processes and requirements they need to have to achieve higher
maturity levels.
Structure:
The Berkeley Model’s five maturity levels are described in Table 14:
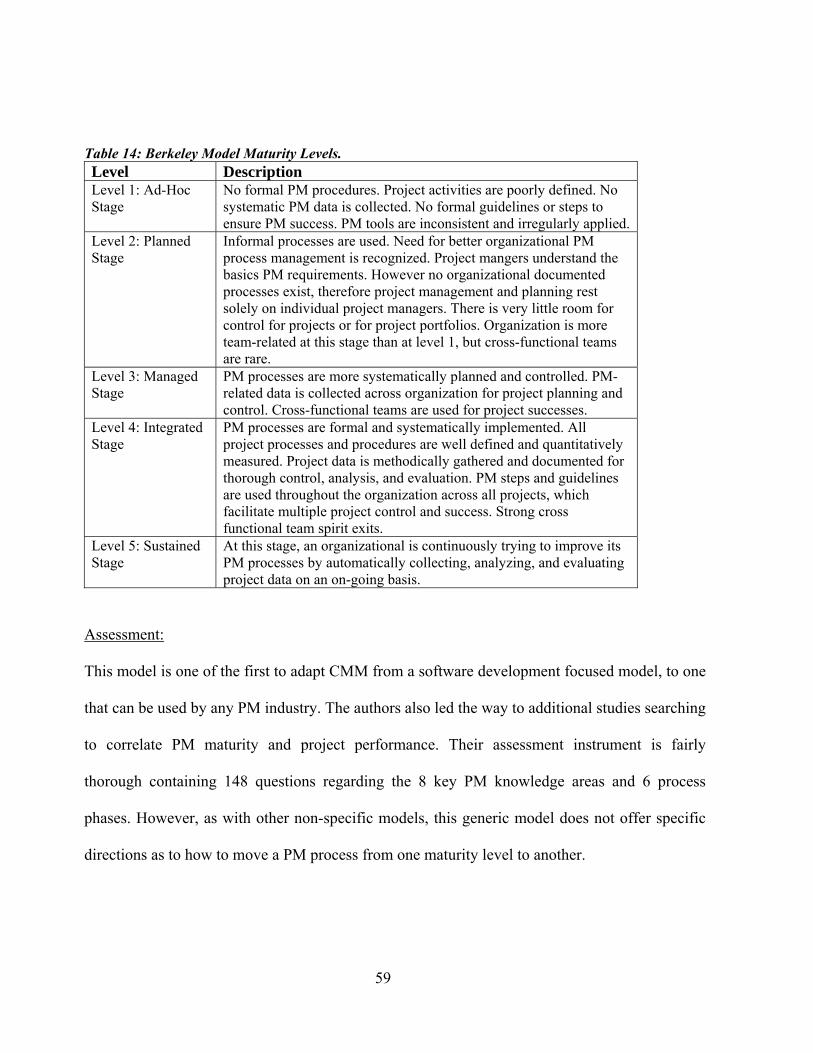
59
Table 14: Berkeley Model Maturity Levels. Level Description Level 1: Ad-Hoc Stage
No formal PM procedures. Project activities are poorly defined. No systematic PM data is collected. No formal guidelines or steps to ensure PM success. PM tools are inconsistent and irregularly applied.
Level 2: Planned Stage
Informal processes are used. Need for better organizational PM process management is recognized. Project mangers understand the basics PM requirements. However no organizational documented processes exist, therefore project management and planning rest solely on individual project managers. There is very little room for control for projects or for project portfolios. Organization is more team-related at this stage than at level 1, but cross-functional teams are rare.
Level 3: Managed Stage
PM processes are more systematically planned and controlled. PM-related data is collected across organization for project planning and control. Cross-functional teams are used for project successes.
Level 4: Integrated Stage
PM processes are formal and systematically implemented. All project processes and procedures are well defined and quantitatively measured. Project data is methodically gathered and documented for thorough control, analysis, and evaluation. PM steps and guidelines are used throughout the organization across all projects, which facilitate multiple project control and success. Strong cross functional team spirit exits.
Level 5: Sustained Stage
At this stage, an organizational is continuously trying to improve its PM processes by automatically collecting, analyzing, and evaluating project data on an on-going basis.
Assessment:
This model is one of the first to adapt CMM from a software development focused model, to one
that can be used by any PM industry. The authors also led the way to additional studies searching
to correlate PM maturity and project performance. Their assessment instrument is fairly
thorough containing 148 questions regarding the 8 key PM knowledge areas and 6 process
phases. However, as with other non-specific models, this generic model does not offer specific
directions as to how to move a PM process from one maturity level to another.

60
2.4.8 Project Management Maturity Model (PMMM) by PM Solutions:
Overview:
This maturity model has been created by Kent Crawford who is the CEO and founder of Project
Management Solutions, Inc. (PM Solutions) and PM College. Kent Crawford is the former
president and chair of the Project Management Institute (PMI), which explains why the model
uses PMI’s for its structure. The model also follows the five (5) levels of process maturity
similar to CMM.
Objectives:
As with many other models, the purpose of this framework is to measure an organization's
project management maturity. It also seeks to provide a generic roadmap, outlining the “must-
have” PM capabilities that organizations should acquire in order to achieve project management
growth and excellence.
Structure:
Similar to the Software Engineering Institute's CMM's five progressive maturity levels, PM
Solutions’ PMMM also incorporates nine PM knowledge areas from the Project Management
Institute's guide: 1) project integration, 2) project scope management, 3) project time
management, 4) project cost management, 5) project quality management, 6) project human
resource management, 7) project communication management, 8) project risk management, and
9) project procurement management; for each maturity level, the model indicates what the status
of the nine knowledge area processes should be at. Table 15 summarizes the maturity levels:

61
Table 15: PM Solutions’ PMMM: Maturity Levels Description Level 1: Initial Process Not established practices or standards. Metrics and
project documentation are informally collected. Level 2: Structured Process and Standards Basic metrics and project documentation are present but
no organizational standard is set. Level 3: Organizational Standards and Institutionalized Process
All projects use organizationally institutionalized formal standards.
Level 4: Managed Process Metrics are used to manage projects, and integrated into other corporate systems to maximize overall organizational performance.
Level 5: Optimizing Process Lessons Learned are routinely studied to improve PM processes.
PMI Knowledge Areas: • Project Integration Management • Scope Management • Time Management • Cost Management • Quality Management • Project H/R Management • Communications Management • Risk Management • Procurement Management
Assessment:
This model is very thorough in that it tries to incorporate both best practices provided by PMI, as
well as the successful tracks of CMM. As cited earlier, it has been used by Pennypacker and K.
Grant (2003) to measure PM maturity levels of organizations from diverse industries. This study
used the model to assess maturity levels in organizations. In addition, this model has been used
by organizations such as Petrotrin, an oil and gas producer, where the maturity level went from 1
to 3 in some areas within the PM Solutions‘s PMMM framework (Jedd, 2005) However, this
model has been considered tedious and repetitious to follow (Jachimowicz, 2003).
2.4.9 PRINCE2 (Office of Government Commerce - 2002)
Overview:

62
PRINCE2 (formally PRINCE = Projects in Controlled Environments) is a project management
methodology developed under the direction of the UK government (Office of Government
Commerce OGC) with the collaboration of the UK Association of Project Managers, and over
150 public and private sector organizations in the 80’s. Several updates have been developed
since then, and the latest PRINCE2 update was released in 2002. Although it was first created for
IT organizations, it has evolved toward a more generic, best practice approach for the
management of all projects. It is the de facto standard project management methodology in the
UK, and many other European countries. It is the European.
Objectives:
PRINCE2 is a process-based approach to project management. It describes how a project can be
divided into various manageable processes with well-defined inputs, outputs, and specific goals.
Control management is at the basis of PRINCE2 in order to enable organizations to practice PM
that delivers controlled project start, progress, and closure. Simply, PRINCE2 defines:
• The project and its stages,
• Eight (8) fundamental processes for implementing the project plans,
• Some basic project management techniques,
• A set of control to keep the project according to plan.
It is also a source of common language for the project stakeholders.
Structure:
PRINCE2’s methodology defines 4 key attributes to each project.

63
• 8 well-defined processes that provide the framework for PM;
• 8 components used by each processes;
• 3 techniques that support the processes;
• Some product and role definitions useful for project control.
Table 16 below provides a summary of PRINCE2’s main aspects.
Table 16: Prince2’s Components. Components:
1. Business Case: Description of the reasons for the project.
2. Organization: Structure and Role definitions.
3. Plans: Products, Activities, Resources, and Costs.
4. Controls: Management, Technical, Quality, and Stages.
5. Risk Management: Risk evaluation and management.
6. Quality in Project Environment: Quality requirements and responses.
7. Configuration Management: Tracking products and documentation
8. Change Control: Capture and assessment of issues.
Processes: 1. Start up project. 2. Initiate project. 3. Direct project. 4. Control stages. 5. Manage product delivery. 6. Manage stage boundaries 7. Close project. 8. Plan.
Product and Role Descriptions: 1. Product descriptions. 2. Work package definitions. 3. Project control roles.
Techniques: 1. Product based planning: product breakdown,
description, and flow diagram. 2. Quality reviews: preparation, review, and
follow-up. 3. Change control: capture, log, assess, and decide.
In addition, a project, according to PRINCE2, should also contain the following:
• A stated business case indicating the benefits and risks of the project venture,
• A properly defined set of products with corresponding sets of activities leading to the
completion of those deliverables,
• A predetermined life span,

64
• A set of control tools and methods,
• Adequate allocations of required resources,
• Well-defined responsibilities for those involved in the project execution,
• A set of processes with techniques to plan and control project activities for successful
completion.
PRINCE2 is divided into stages, each being considered a distinct unit for management purposes.
Like a project, a stage is compartmentalized into sub-processes, should have well defined
activities, finite life span, and organizational structure. The deliveries of the stage products
indicate the completion of that stage. The project stages correspond to the steps in a typical
project life cycle.
PRINCE2’s processes state the minimum that organizations should follow for each project, but
the methodology lets senior and project managers decide how to address each process given each
project’s uniqueness. Some PM techniques are also made available for the implementation of the
processes, but PRINCE2 anticipates that organizations are already using some types of PM
techniques, and encourages continuing utilizing them if they already have proven helpful in
process improvement.
Assessment-Benefits:
PRINCE2 is a project management reference that has been widely accepted within the industry,
specifically in Europe. It provides certification for practitioners and educators. Its focus is on
how to improve the chances of successfully delivering projects with the sponsorship of the UK

65
government. It is based on sound principles such as the business case, which studies if and why a
project should be undertaken. It also provides detailed process definitions, with precise inputs
and outputs, and techniques to improve project management. This makes its implementation
somewhat easy within an organization. PRINCE2’s benefits can be summarized as:
• Roadmap: It provides a sequential and logical path for project management that anyone
can follow in any given project situation.
• Standardization: even if organizations have never used the methodology before,
PRINCE2 provides a common approach, method and terminology, which can be applied
to all organizational projects.
• Popularity: by being the de facto standard for UK project management, it has been
adopted by a growing number of skilled practitioners, who can apply its principles in
their organizations.
On the other hand, PRINCE2 is not an assessment tool per se and does not measure PM on a
maturity scale. It is not intended for organizations to position their PM level according to some
benchmarked quantitative criteria.
PRINCE2 offers generic common sense in the area of project management, and describes a
straightforward structured methodology (with serial steps) for effective project management.
This easy-to-follow framework for running projects is especially effective for projects with clear
objectives, well-described deliverables, and limited numbers of stakeholders outside the
performing organization. For example, the issue of work coordination responsibility when many
suppliers are involved is beyond the scope of the document.

66
Another drawback also mentioned about PRINCE2, is its lack of details with regard to all PM
knowledge areas. It also does not address the issue of how organizations can continuously
improve their PM processes.
2.4.10 Project Management Body of Knowledge ( Guide) (1987 – PMI)
Overview:
During the 80’s, the Project Management Institute (PMI) started developing to try to
“standardize” the PM profession. Today, the Project Management Institute with over 100,000
members in 125 countries is often recognized as the US (if not the world’s) authority for the
project management profession.
The guide provides definitions of some basic PM concepts, and description of key knowledge
areas a project manager should be familiar with. is approved by the American National
Standards Institute (ANSI) as an American Standard.
Objectives:
The purpose of this guide is to define the sum of knowledge in the project management field that
is generally accepted (applicable to most projects most of the time and widely recognized as
valuable by practitioners and academics in the PM area).
67
It also aims at providing a common glossary within the profession of project management, which
is all the more important as PM is a relatively young profession and needs a collective sets of
words to be used by professionals.
The guide also provides a basic reference for all the stakeholders involved in a project
completion, educators, and trainers, as well as the basis for Project Management Professionals
(PMP) certification, and project management educational program accreditation.
The focus of the guide is to provide a well-defined body of knowledge that successful project
managers should understand and be able to practice.
Structure:
The PM process groups according to, representing the project life cycle, are:
• Initiating processes: authorization for the project r to beginning.
• Planning processes: definition of the project objectives, and selection of the best alternate
set of actions to complete project.
• Executing processes: coordination of all necessary resources (people, financing, material,
etc.) required for carrying out the project.
• Controlling processes: progress monitoring and identification of variance from
anticipated results in order to take any corrective actions if necessary.
• Closing processes: orderly end of the project and project review.
The nine key knowledge areas that describes are:
68
• Project Integration Management, to ensure that all the project elements are well
coordinated into a coherent and consistent method,
• Project Scope Management, to ensure that the project include all (and only) the necessary
work for successful project completion.
• Project Time Management, to ensure timely completion of the project,
• Project Cost Management, to ensure project completion is within approved budget,
• Project Quality Management, to ensure that the project satisfied customers’ needs, and
quality requirements,
• Project Human Resource Management, to ensure the most effective and efficient use of
the individuals involved in the project completion,
• Project Communications Management, to ensure effective and efficient generation,
collection, dissemination, storage, and disposition of the project information,
• Project Risk Management, to identify, analyze, risk and create alternative courses of
action,
• Project Procurement Management, to ensure effective and efficient acquisition of goods
and services from outside the performing organization.
Table 17 below summarizes processes for each key knowledge area.
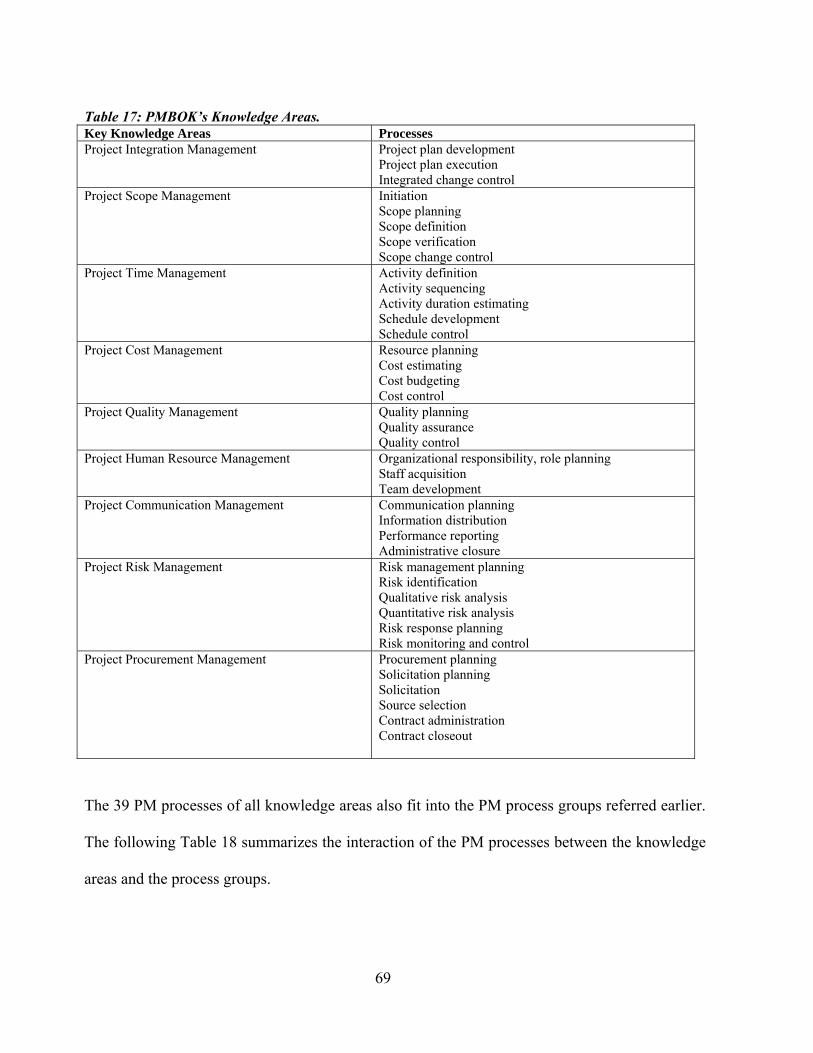
69
Table 17: PMBOK’s Knowledge Areas. Key Knowledge Areas Processes Project Integration Management Project plan development
Project plan execution Integrated change control
Project Scope Management Initiation Scope planning Scope definition Scope verification Scope change control
Project Time Management Activity definition Activity sequencing Activity duration estimating Schedule development Schedule control
Project Cost Management Resource planning Cost estimating Cost budgeting Cost control
Project Quality Management Quality planning Quality assurance Quality control
Project Human Resource Management Organizational responsibility, role planning Staff acquisition Team development
Project Communication Management Communication planning Information distribution Performance reporting Administrative closure
Project Risk Management Risk management planning Risk identification Qualitative risk analysis Quantitative risk analysis Risk response planning Risk monitoring and control
Project Procurement Management Procurement planning Solicitation planning Solicitation Source selection Contract administration Contract closeout
The 39 PM processes of all knowledge areas also fit into the PM process groups referred earlier.
The following Table 18 summarizes the interaction of the PM processes between the knowledge
areas and the process groups.
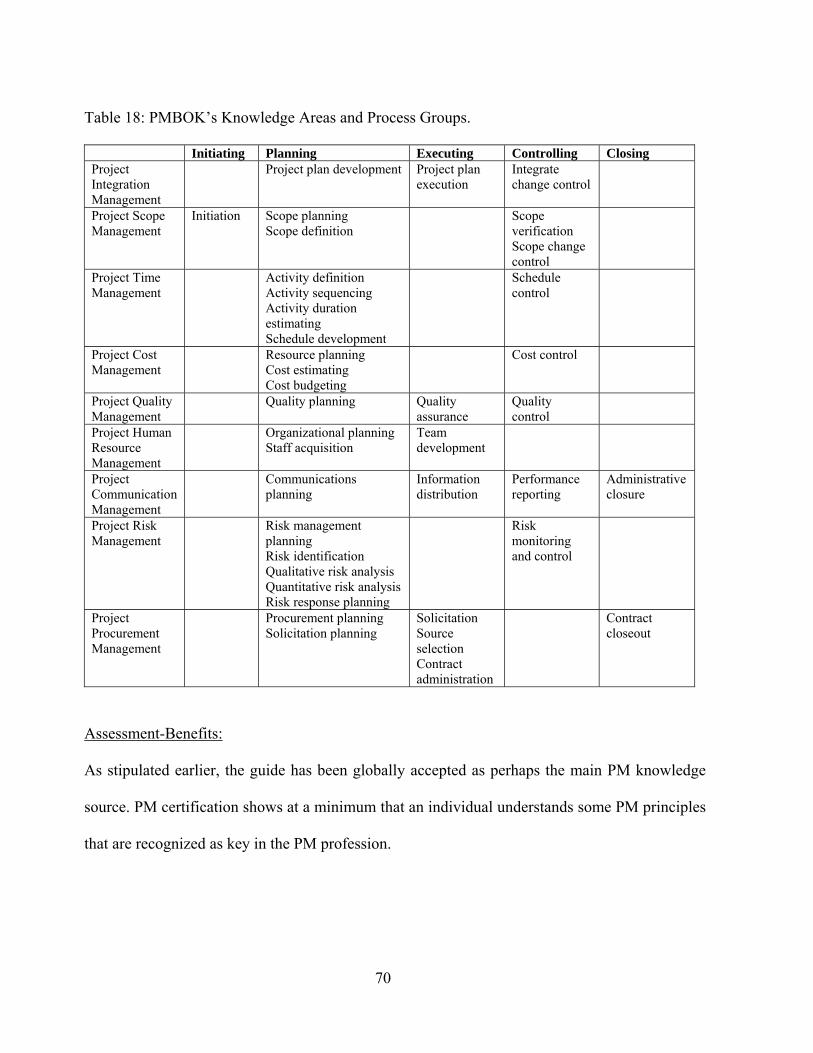
70
Table 18: PMBOK’s Knowledge Areas and Process Groups.
Initiating Planning Executing Controlling Closing Project Integration Management
Project plan development Project plan execution
Integrate change control
Project Scope Management
Initiation Scope planning Scope definition
Scope verification Scope change control
Project Time Management
Activity definition Activity sequencing Activity duration estimating Schedule development
Schedule control
Project Cost Management
Resource planning Cost estimating Cost budgeting
Cost control
Project Quality Management
Quality planning Quality assurance
Quality control
Project Human Resource Management
Organizational planning Staff acquisition
Team development
Project Communication Management
Communications planning
Information distribution
Performance reporting
Administrative closure
Project Risk Management
Risk management planning Risk identification Qualitative risk analysis Quantitative risk analysis Risk response planning
Risk monitoring and control
Project Procurement Management
Procurement planning Solicitation planning
Solicitation Source selection Contract administration
Contract closeout
Assessment-Benefits:
As stipulated earlier, the guide has been globally accepted as perhaps the main PM knowledge
source. PM certification shows at a minimum that an individual understands some PM principles
that are recognized as key in the PM profession.

71
It has also influenced some project maturity models such as Berkeley, PM Solutions’ PMMM,
OPM3, where key knowledge areas are integrated with the maturity levels and process groups.
However, the guide is not prescriptive, and does not recommend a specific methodology for
running a project successfully; instead it specifies the minimum amount of knowledge that a
successful project manager needs to have. is not intended to tell users how to do any of the
techniques or use of the tools it describes. It simply lays out PM processes, knowledge areas, and
how they link together. In addition, it doesn’t offer a means for organizations to assess their
project management maturity level against a benchmarked model or industry best practices.
Furthermore, the guide offers very little insights as to how an organization can learn from (in
order to improve) its PM practices.
After examining some of the most mentioned models in the literature, this research now
examines the empirical studies that have been conducted with some of the models in the next
section.
2.5 Project Management Maturity Models: Current Studies
The studies available in the literature can be generally characterized as 1) anecdotal, case studies
relating the improvement (or lack of) in PM maturity after the implementation of a PMMM, 2)
statistical, studying the significance of the relationship between PM maturity and project
performance, or 3) bench marketing, measuring and comparing the PM maturity across
organizations and or industries using a specific PMMM.

72
There are many anecdotal, descriptive examples and case studies showing the positive impact of
CMM on project management maturity, project performance as described by CMU/SEI-94-13
1994 Special Report of the Carnegie Melon Software Engineering Institute, and Krasner’s
accumulating the Body of Evidence for the Payoff of Software Process Improvement report of
1997. Furthermore, additional studies/appraisal (Goldenson, and Herbsleb, 1995) have shown
that there was a positive correlation between CMM maturity levels, staff moral, fewer
bureaucratic paperwork requirements, product quality, and customer satisfaction.
For example, a correlation study of CMM and software development performance (Lawlis et al,
1995) showed that, positive correlation exists between CMM rating and software development
success. The authors collected data from 11 DoD contractors rated by the CMM protocol on 31
software projects. A total of 52 data points were obtained. Scatter, box plots, as well as Kruskal-
Wallis nonparametric analysis of variance and multiple comparison of mean rank test were used
for analysis purposes. Cost Performance Index (CPI) and the Schedule Performance Index (SPI)
were used in relation to maturity levels. CPI was defined as the planned value of the completed
work (estimated costs), divided by the actual costs spent on the work done. SPI was defined as
the planned value of the completed work, divided by planned expenditures of funds over time,
based on work completion. The maturity ratings were obtained from the respondent
organizations and were not independently verified. The authors based their hypothesis on the
works of Paulk et al (1993), which asserts that the relationship between maturity and cost as well
as schedule performance can be depicted by a probability distribution. At level 1, the central
tendency is below the average of 1, and exhibits high variance. At level two, the central tendency
is close to the target of 1, but still displays high levels of variance. At level 3, the central

73
tendency is on target with less variance than at level 2. Levels 4 and 5 also show a central
tendency on target with the variance of the distribution diminishing as maturity increases. Lawlis
et al concluded that there was high variation with a central tendency lower than a CPI of 1 at
maturity level 1, high variation with the central tendency near a CPI of 1 at level 2, and low
variation and a central tendency near CPI of 1 at level 3 (they did not use level 4 or 5, since none
of the organizations in their study attained these maturity levels). There was a statistically
significant difference between levels 1 and 2, and levels 1 and 3. With regard to SPI, they
concluded that from level 1 to 2, the variation was significantly lower, but remained fairly
constant from level 2 to 3. With regard to the central tendency, there was no significant
difference between the maturity levels (SPI close to 1), although they noted that in project less
than 80% completed, SPI average was consistently below 1. For those projects near 80%
completion, they exhibit a SPI of near 1 at all maturity levels, which can be explained by the fact
that, by definition, SPI nears 1 at program completion. The findings of this study showed that
there was positive correlation between CPI, SPI, and maturity levels. However the correlation
was stronger between CPI and maturity versus SPI and maturity.
SEI-CMU has also published a report in 2003 that describes the positive impacts of the
Capability Maturity Model Integrated (CMMI) and SW-CMM on cost, schedule, quality, and
return on investment in 12 cases from 11 different organizations. However, all the above-
referred studies are limited to the impact of CMM or CMMI on project performance in the area
of software product development and do not try to statistically prove the positive impact of these
models on PM maturity.
74
Some researchers have tried to find out if the relationship between PM maturity and project
performance was statically significant without using a specific model. In a survey, Dooley,
Anderson and Subra, (2001) studied the impact of project management maturity on project
performance in new product development. They used a Likert-scaled survey, which was
answered by 39 organizations (out of 250) in the general field of electro-mechanical devices.
Two-thirds of them had at least one quality award (state, national, and supplier). The regression
analysis conducted by the authors indicates that a defined, managed, measured, and continuously
improved new product development process (maturity) is positively correlated with project
success. Therefore, the survey found that higher levels of maturity were positively related to
projects that met cost, schedule, and organizational constraints. The authors also concluded that
the positive relationship between maturity and project performance was not dependable on
company size, or the market type the organization was from, nor was it dependant on the
volatility of the market the firms were in. However, a low R² (32%) seems to indicate that
additional factors also play a role in successful project performance, which were not studied in
this analysis. Also, the organizations selected for this study were limited exclusively to new
product development organizations, and did not include a more encompassing type of
companies. However, although the results of this study are somewhat limited due to the fairly
small sample size (39), it has successfully provided empirical statistical validity that the concept
of maturity can evolve outside the software engineering field, and be applied to other industries
(such as NPD organizations in the electro-mechanical device industry).
Another examination at correlating maturity levels and project performance was conducted
(Kwak, Ibbs, 2000) with the support and sponsorship of the Project Management Institute. The
75
authors developed a project management process maturity assessment methodology (Berkeley
model) to assess the maturity level of project management processes among four different
industries (Telecom, Engineering and Construction, Software development, and High-tech
Manufacturing) with the help of 38 organizations who responded to the survey. The authors
developed a three-section questionnaire where respondents were asked 1) general organizational
information (section 1), 2) a 148 Likert-scaled question survey (section 2), and 3) actual one-on-
one project performance interviews with senior project managers. The survey questions were
designed to reflect each project management knowledge areas as defined by the Project
Management Institute (PMI)’s Project Management Book of Knowledge, and project
management processes (initiate, plan, execute, control, close). They also added another phase
(project-driven organization environment process), which includes activities such a PM training,
career development, etc. In a first paper (Kwak, Ibbs, 2000a), the authors concluded that
organizations in the software development industry, had the lowest maturity levels (3.06 on a
scale from 1 (lowest maturity) to 5 (highest maturity), while those in engineering and
construction had the highest maturity score (3.36). For all organizations, among the various
knowledge areas, cost management scored the highest maturity level while risk management
showed the lowest average. Among the six project management processes, the project-driven
organization environment phase had the lowest maturity. This process involves training, career-
development, etc. and other activities allowing project managers to possess the tools to
successfully be performance-driven in a project-based organization, indicating that organizations
do not seem to view those activities as successful project management enablers. On the other
side, the project-planning phase had the highest maturity score across all companies, indicating
this phase as crucial for successful project performance. This study is one of the first to try to

76
quantitatively assess organizations’ current level of project management practices and processes
across various industries and companies using a PMMM. It is also one of the first studies to try
to integrate project management knowledge areas, project management phases against actual
project performance data. In addition, Kwak and Ibbs also performed a regression analysis
between the organizations’ maturity levels (as calculated in the above-referred paper) and project
performance results (measured by the Cost Index (Actual Project Costs/Original Budget), and
the Schedule Index (Actual Project Duration/Original Project Duration)). The results of the
regression analysis (Kwak, Ibbs, 2000b) show that the relationships were not statistically
significant. The small number of respondents might have been responsible for those results.
However, the non-linearity (downward sloping curves) of the functions (maturity as a function of
the cost index, and maturity as a function of the schedule index) indicates, according to the
authors that there seems to be diminishing returns on higher levels of PM maturity. This notion
of diminishing returns is also mentioned by Julia King in Computerworld (2003). She concluded
that although the higher the maturity levels the fewer defects, the biggest improvement in terms
of cost savings takes place when organizations go from level 3 to level 4. Even though the results
of the Kwak/Ibb study were not statistically significant, this study gave insights on the value of
PMMMs and project management maturity in organizations from various industries.
Additional surveys have been conducted with regard to PMMMs, focusing on the benchmarking
abilities of PMMMs, and how benchmarking can provide considerable benefits to an
organization by comparing its project deliveries with best practices or its competitors (diagnosis
tool). The first study (Pennypacker and Grant, March 2003) was conducted across several
industries. The purpose was to measure PM maturity levels of organizations from diverse
77
industries. The authors used the PM Solutions’ Project Management Maturity Model to measure
PM maturity. They received 123 responses from four industries (Manufacturing, Information,
Finance and Insurance, Professional Scientific and Technical Services) to their survey questions.
Most of the respondents self-reported that their organizations operated at level 1 or 2 (67%). The
authors also concluded that there was no statistically significant difference in project
management maturity among various industries, nor among organizations of different sizes.
These findings are very similar to those concluded by Dooley et al’s (2001) analysis.
In another benchmarking case study (Hillson, 2003), the Project Maturity Model Model
(ProMMM) from PMProfessional Learning was used. David Hillson is a fellow of the
Association for Project Management (APM) in the UK, and is also an active member in the
Project Management Institute (PMI) in the US. The author conducted a case study with 750 staff
from an undisclosed multinational organization ranging from project managers to project team
members. In additional to the questionnaires, interviews were conducted with 30 staff members
from project directors to project managers. The results of the study indicated that the
organization maturity level was 2.6 (out of 4, indicating that this particular organization was
somewhat familiar with project management capabilities, although it has not yet fully integrated
all PM processes into routine business processes). Further analysis also offered some specific
insights on some of the organizational strengths and weaknesses in the organization’s project
management.
In another research Cooke-Davis and Arzymanow (2002) investigated the variations between
project management practices in six industries. In-depth interviews with knowledgeable project

78
management practitioners in 21 organizations from 6 industries were conducted. A total of 10
“domains” were identified as the basis for optimum project management model. Each interview
produced a quantitative assessment of the processes with regard to the specific domain using pre-
determined scales, as well as qualitative comments from the experience of the interviewee. The
results show that differences between organizations and industries exist in each domain. The
Petrochemical and Defense industries showed the highest PM maturity, and the engineering-
based industries scored more highly than other industries that have just recently started to use
project management as a core capability, such as financial services. This study also shows that
all organizations scored poorly when dealing with multi-project management, especially when
resources must be continuously shared and adapted, and project prioritization is necessary.
Because of the differences in PM in different environments and industries, the authors also
suggested the potential need for various project management models, which would adapt to
different business environment to better manage project portfolios. Table 19 summarizes the
above-referred studies:

79
Table 19: Summary of PMMM Studies: Name
Purpose Type of Study Sample Results Comments
Ibbs and Kwak, 2000
Determine impact of PM maturity on project costs and schedules.
Survey with 148-multiple choice questionnaire based on Berkeley model to measure maturity. Regression analysis between maturity and CI, maturity and SI.
38 orgs from 4 industries: Telecom, Engineering and Construction, Software Development, and High-tech Manufacturing
Low R² for both CI and SI (below .5) No statistically significant relationship (high P) But positive relationship Non-linearity of relationship may indicate diminishing returns
Small sample (only 17 org. gave cost data, and 15 gave schedule data). No statistical significance was found between maturity, SI, and CI. Low R². Project performance only measured in terms of costs and schedules.
Dooley, Anderson, and Subra, 2001
Determine impact of PM maturity (after generalizing its concept beyond the software engineering domain) on project performance in new product development.
Survey (Likert-scale questions) Maturity and project performance constructs were defined for study. Regression analysis between maturity and project performance
39 organizations in new product development in electro-mechanical device field)
Model is statistically valid (low overall P value). PM Maturity regress successfully on project performance. No statistical significance between maturity and company size, or maturity and market volatility.
No details on survey questions. Only NPD organizations were sampled. Low R²(.32) shows additional studies need to be done. Only 3 factors to define project performance.
Hillson, 2003
Benchmarking case study using ProMMM in one multinational organization.
Survey with ProMMM questionnaire (Likert scale). Some examples of questions were provided.
1 multinational org was used. Survey e-mailed to 750. 30 interviews were conducted with senior PMs.
Descriptive statistics used for maturity measurements.
No data on how many responded. Benchmarking study only.
Pennypacker, Grant, 2003
Benchmarking study of PM maturity level among various organizations/industries using the PM Solutions model.
Web-based Likert-scale survey using PM Solutions’ Management Maturity Model.
123 respondents from the Center for Business Practices, which includes over 900 senior PM practitioners in 4 industries (manufacturing, information, finance and insurance and professional scientific services.
Descriptive statistics used for maturity measurements. No statistical difference among industries or organizational sizes were found (Kruskall-Wallis test).
Descriptive statistics used for maturity measurements. No statistical difference among industries or organizational sizes were found (Kruskall-Wallis test).
Cooke-Davis, Arzymanow, 2002
Determine the nature of variations in PM practices in 6 industries.
Phone-interview with senior PM members. Likert-scale 18 question survey across 10 PM domains (factors) determined to measure PM maturity, representing optimum PM.
31 organizations in 6 industries ((Pharmaceuticals, telecoms, Defense, Financial, Construction, Petrochemical)
Qualitatively defined research instrument Descriptive statistics used for maturity measurements. Petrochemical and defense score better than financial or pharmaceutical. Need for specific models for specific industries?
Questions are disclosed.Benchmarking study only. Maturity defined for each question from 0 (worst practice) to 5 (best practice).
Lawlis et al, 1995
Establish correlation between maturity level (CMM) and cost and schedule performance indexes
CMM rated projects used for Kruskal-Wallis and multiple comparison of mean rank test.
31 projects rated by CMM from 11 DoD contractors (52 data points)
High variation in cost performance index at levels 1 and 2, and low variation of CPI at level 3. Central tendency of CPI was below 1 at level 1, while it was near 1 for levels 2 and 3. Statistical difference between level 1 and 2, and 1 and 3. High variation in schedule performance index at level 1. Lower variation in SPI at levels 2 and 3. Central tendency near 1 at all levels (due to nature of SPI when projects are near completion).
No analysis on organizations at level 4 or 5.
80
Based on the above-referred studies, it appears that higher PM maturity leads to better project
performance, especially in terms of cost and schedule. Numerous anecdotal case studies in the
software industry have shown that implementing a PMMM such as CMM or CMMI has lead to
improved performance. Other PMMMs aimed at other project organizations in various industries
have been used to benchmark organizations’ PM maturity. However, probably because of their
novelty, there are no existing articles in the literature that show empirical studies correlating the
use of these PMMMs with project maturity and performance.
Since increasing their PM maturity seems to lead to improved PM performance, why aren’t
organizations “jumping on the band wagon” and adopting one suited for their specific case?
Perhaps because some researchers have voiced some criticisms about these models. The
following section explores the most common criticisms in the literature with regard to PMMMs.
2.6 Most common PMMM criticisms:
Many models are considered overdisciplinary, impractical and rigid (Judgev, Thomas, 2002).
For example, CMMI has over 500 pages. Furthermore, models are often viewed as inflexible
because of the disciplinary steps they embrace for improvement. They are feared to add to an
organization’s bureaucratic red-tape (Herbsled, et al, 1997) making it difficult for an
organizational to find creative solutions to technical problems. Herbsled, et al further adds that
by becoming “mature”, some organizations fear that they will also develop into risk adverse
entities, afraid to take risky endeavors (but potentially high payoff) because they may lose their
high maturity rating.

81
In addition, such models are often criticized for their lack of implementation guidance. Many
organizations are reluctant to start a PM improvement program without mentoring assistance.
This criticism is at the core of many models; the models do not offer a cognitive means to
improve knowledge throughout the organization in order to improve its PM processes and reach
higher PM maturity levels. The models focus on acquiring the “know-what” (what processes
need to be acquired and at what level of mastery they need to be at) vs. “the know-how” (how
does the organization learn the new processes, how does it implement them, learn from then,
change them if necessary, in order to continuously improve their quality) (Judgev, Thomas,
2002).
Another common criticism of the models is that the models are implemented for project
management process improvement, and the positive results are often too difficult to measure
financially in the overall organizational bottom line. Furthermore, because the results take time
to be witnessed and the models can be expensive to implement, some organizations might not
perceive their benefits. Besides, some industry practitioners view these models as additional
bureaucratic red-tape to their management, reducing flexibility and creativity necessary with
many projects by forcing the project execution through a set of predetermined procedural steps
(Kerzner, 2001). However, as the author also states, this shows the potential for misuse of formal
PM systems, used to impose unrealistic controls and penalties for variances from the preplanned
execution, instead of a means to help improve PM processes. In addition, Kerzner also points out
that implementing such PM process improvement also requires the involvement of customers
and suppliers, which is not always feasible.

82
Other authors such as Andersen, et al (2002), point out that the PMMMs are too narrow and
strict in nature, and somewhat limited in their scope because their main focus is to categorize
organizations vs. helping understanding what PM maturity means for them.
These criticisms notwithstanding, most PMMMs aim at improving the PM processes of an
organization. Learning from past experience to improve future project performance is at the core
of improved PM maturity; the way to learn from a project is to review, analyze, and study what
and how processes are conducted during the project life cycle. De Weerd-Nederhof and Pacitti
(2002), using Huber’s 4 learning processes of 1) information acquisition (process by which
knowledge is obtained), 2) information distribution (process by which information from different
sources is shared), 3) information interpretation (process by which distributed knowledge is
understood), and 4) organizational memory (process by which knowledge is stored for future
use) (1991), specifically relate project reviews (PRs) to information distribution, interpretation,
and organizational learning (2002). By helping in the learning process, PRs help organizations
improve their PM processes, and therefore, PRs are a crucial part of PM maturity improvement,
as organizations not only reflect on what went wrong against the plan, but why, and what can be
learned from it for future use. Nevertheless, too many PMMMs do not put emphasis on PR as a
practice required to improving PM maturity (Williams, 2003).
More specifically, the next paragraph examines in more details what role if any PRs are given in
the models:
• Although CMMI specifically mentioned reviews at level 2, it is mostly intended for
control function to assure that the project is performing as planned. There is little

83
emphasis to create lessons learned for the benefits of other teams through ongoing
retrospective evaluations of the project management processes, and building
organizational learning.
• In Kerzner’s PMMM, PRs are not explicitly mentioned, only that the information
obtained through benchmarking should be used to improve PM methodology.
• In the Berkeley model, Kwak and Ibbs refer to some types of reviews at the closing stage,
where contract closeout, lessons learned documentation, and administrative closure take
place (Ibbs, Kwak, 2000). Depending on its PM maturity, they stipulate that an
organization exhibits a formal process where records are consolidated, classified and
stored on a consistent basis, or will display no systematic closing procedures. They also
state that when reaching level 3, an organization starts focusing on reviewing its PM
processes and documenting best PM practices. This is the model that addresses PRs and
some types of procedures for learning the most; however, the authors recommend this
review process only at the end of the project, instead of during the project life cycle, not
capitalizing on immediate feedback. It should also be pointed out that the authors
attributed the lowest number of questions to the close-out phase (versus, initiating,
planning, executing, and controlling) in their maturity model assessment instrument in
their research, perhaps suggesting that reviews are not viewed as important a PM
function as the others.
• PM Solutions’ PMMM stresses the importance of lessons learned at the highest level of
maturity, especially with the use of metrics developed at maturity level 4. However, this
idea that learning from past project performance should only be the main focus at the
84
highest maturity level inhibits the potential for learning at other maturity levels through
on-going project reviews.
• In addition, both PRINCE2 and view reviews as mostly 1) control tools (statistical and
technical control) to assure that the project outcomes are as scheduled or 2)
administrative tasks to be handled at the end of a project life, in order to properly
closeout the project. They do not emphasize the learning opportunity that PRs have
through collecting, gathering, and distributing lessons learned. Furthermore, according to
Koners, et al (2005), citing Williams, et al, (2001), did not mention project reviews until
their 2000 edition.
Therefore, although aimed at increasing PM maturity, the models seem to pay little attention to
PRs, and how learning from past experience can help improve PM processes. When mentioned
in the models, PRs are to be carried out to appropriately close a project from an administrative
point of view, or PRs should heavily use metrics to assure that the project is performing
according to plans. In most models, PRs are in place only at the highest levels of maturity.
However, PRs, when conducted throughout the project life cycle, can be a great source of
learning for an organization. In addition, by focusing on how things were done (processes) along
with what was done (metrics for performance measurement), PRs can facilitate organizations at
nurturing those PM processes that help their project performance, while improving those that
hinder successful outcomes. When the PMMMs do incorporate PRs in their framework, they do
not specifically detail how PRs should be conducted. Some practical tools need to be developed
so that organizations can conduct effective PRs aimed at improving their project performance
and PM maturity.

85
If an organization wants to improve it PM processes in order to improve PM maturity and project
performance, it can use a PMMM as a guiding tool for what it needs to accomplish, but unless it
continuously seeks to learn from its past experience through efficient retrospective project
reviews, it will keep on “reinventing the wheel”. The lack of emphasis on PRs in PMMMs, one
of their major weaknesses, is paralleled by the limited amount of research in this area. The
following section presents the main findings in the literature on the subject of project reviews.
2.7 Current PR practices – Organizational Learning:
Because of today’s complex and competitive environment, organizations must deliver better
than-the competition project performance on a consistent basis, and they need to continuously
improve their project management maturity. As described above, practitioners and researchers
have developed useful sequential PM models that can assist organizations in choosing what
types of PM processes need to be improved. However, in order to remain a “continuously”
improving project organization, it must also focus on its learning capabilities, and how its
acquired knowledge can help future project performance. Williams (2003) states that the need to
learn from past projects, to adapt future management behaviors, is essential. Becoming a
learning organization that learns from its projects, means that the organization is able to create,
gather, and disseminate this knowledge to others within the organization, which is at the crux for
PM process improvement by developing new knowledge. Learning from projects also helps
organizations avoid repeating the same PM mistakes, and contribute to the organization’s
continuous learning (Ayas, 1997). This organization’s continuous learning promotes better PM
maturity for better PM performance. Project reviews are viewed as important knowledge tools
86
for learning, although rarely used (Busby, 1999, von Kork, 1998, Williams, 2003, von Zedtwitz,
2002 and2003, Koners, 2005). Furthermore, Learning from past project experience includes both
tacit (difficult to articulate) and explicit (easy to define and document) knowledge sharing so that
individuals can convert this learning into continuous improvement of project management
processes (Cooke-Davies, 2002, Newell, 2004).
Project reviews (PRs) are an essential process in a project life cycle. They are tools that can be
used for organizational learning (Busby, 1999), or opportunities to improve performance in
future projects (von Zedtwitz, 2003). However, the limited literature on the subject only shows
the somewhat low priority that most organizations give to this process. An empirical survey from
27 multinationals showed that 4 out of 5 organizations don’t conduct PRs (von Zedtwitz, 2002).
Another qualitative analysis based on 44 semi-structured interviews with members of 19
European project organizations on practices used to promote learning through projects concluded
that time pressure limits were the biggest hurdles in limiting the use of PRs, although most
organizations had some PR practices in place to, in theory, capture, codify data from a past
project, and make it available to other employees (Keegan, 2001). Furthermore, the study also
cited pressures on short-term objectives, lack of organizational nurturing of informal networks
(social networks developed by employees, which are believed by the author to be the most
efficient conduit for knowledge transfer from individuals and teams), centralization of resources
to promote learning (thus limiting exploration of new ideas and limiting the responsibility of the
learning process to a few), and deferral of PRs after a project was completed (thus forfeiting
learning opportunities during the entire project life-cycle) as the worst barriers to effective PRs.
In another study of 5 equipment manufacturers, it was found that the main barriers for learning

87
from past project experience was linked to limitations imposed on the use of feedback, on
learning from feedback, and how feedback was viewed (not as a motivational tool) (Busby,
1999). This qualitative analysis looking at engineering designers and how PRs were conducted
showed that these limitations were largely linked to sporadic retrospectives PRs, emphasis on
negative feedback, and poor communications between designers, customers, and people in other
departments. However PRs were also linked to opportunities for team members to show their
concerns with their organizational setting, gave them a therapeutic opportunity to explain why
things were wrong, and provided a chance for greater knowledge to be shared among different
individuals (Busby, 1999). In another study of 4 PRs in 3 different organizations, the author
identified 3 primarily obstacles to efficient PRs: overspecificity (lack of focus on the bigger
organizational system, instead of day-to-day activities), absence of deep diagnose (difficulty in
drawing effect-to-cause maps), lack of historical reference (failure to differentiate between
characteristic or systemic types of problems) (Busby, 1999). Others also cite “Corporate
amnesia” as one of the barriers in implementing effective PRs (Kandroff, 1996). Specifically,
defensive reasoning, and/or retrospective, selective memory can all sabotage PR processes and
produce inaccurate recollected data.
On the other hand, learning from experience and becoming a “learning organization” are the two
most direct benefits that organizations can derive from conducting efficient PRs (Williams,
2003). The author explores the use of Modeling with Systems Dynamics in order to extract the
most relevant quantifiable data from PRs. In addition, an empirical study of 6 projects in 3
different organizations has also concluded that PRs are essential learning tools to be used for
building the “organizational memory” (De Weerd-Nederhorf, 2002). It is during PRs that
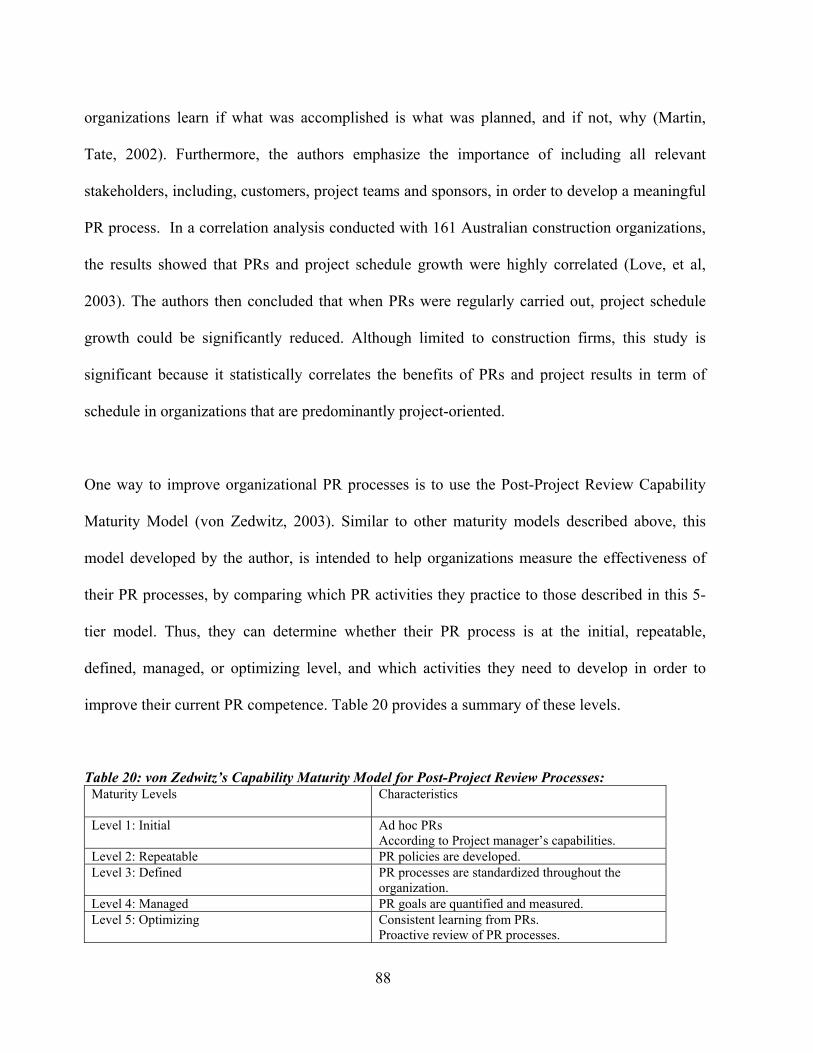
88
organizations learn if what was accomplished is what was planned, and if not, why (Martin,
Tate, 2002). Furthermore, the authors emphasize the importance of including all relevant
stakeholders, including, customers, project teams and sponsors, in order to develop a meaningful
PR process. In a correlation analysis conducted with 161 Australian construction organizations,
the results showed that PRs and project schedule growth were highly correlated (Love, et al,
2003). The authors then concluded that when PRs were regularly carried out, project schedule
growth could be significantly reduced. Although limited to construction firms, this study is
significant because it statistically correlates the benefits of PRs and project results in term of
schedule in organizations that are predominantly project-oriented.
One way to improve organizational PR processes is to use the Post-Project Review Capability
Maturity Model (von Zedwitz, 2003). Similar to other maturity models described above, this
model developed by the author, is intended to help organizations measure the effectiveness of
their PR processes, by comparing which PR activities they practice to those described in this 5-
tier model. Thus, they can determine whether their PR process is at the initial, repeatable,
defined, managed, or optimizing level, and which activities they need to develop in order to
improve their current PR competence. Table 20 provides a summary of these levels.
Table 20: von Zedwitz’s Capability Maturity Model for Post-Project Review Processes: Maturity Levels
Characteristics
Level 1: Initial Ad hoc PRs According to Project manager’s capabilities.
Level 2: Repeatable PR policies are developed. Level 3: Defined PR processes are standardized throughout the
organization. Level 4: Managed PR goals are quantified and measured. Level 5: Optimizing Consistent learning from PRs.
Proactive review of PR processes.
89
Furthermore, a multiple case study analysis in 4 large organizations regarding Knowledge
Management in project organizations concluded that, in order to improve PRs and overall
organizational feedback, organizations must also focus their efforts on facilitating the
development of social networks (Newell, 2004). These results reaffirm the findings obtained by
Keegan as noted above (2001). In addition, although the author specified that mandated, codified
PRs readily available in database are a source of organizational learning through feedback from
previous projects, most of the project learning occurred through social networks where
individuals share their experience freely. The author also stresses the fact that organizations
should focus PRs on procedural knowledge (how activities were carried, solved, etc.) instead of
product knowledge (what was accomplished).
Finally, it should be noted that some researchers are proponents of on-going PRs throughout the
project life-cycle (Gaynore, 1996), (Keegan, 2001). They argue that the earliest a deviation from
intended results is discovered, and the causes identified, the easier and cheaper any correction
can be initiated. Furthermore, by conducting PRs throughout the project, it is more likely that
project team members will avoid the natural predisposition to focus on the most recent events or
the most troublesome (Kotnour, 1999).
In any cases, project reviews should be conducted to acquire knowledge from a project, analyze
and interpret the acquired knowledge (team learning), and disseminate the knowledge throughout
the organization for others to use (organizational learning) (von Zedtwitz, 2002). During a
project, individual learning (personal experience, memory) takes place no matter what, but team
90
learning (sharing anecdotes, reports, etc.) will depend on whether or not a system of reviews is in
place for promoting such knowledge sharing and if not, how team members are willing to share
knowledge. Organizational learning will only happen if there are predetermined processes in
place to harvest, analyze, and distribute the acquired knowledge throughout the organization.
Table 21 summarizes the main barriers to effective project reviews as well as some proposed
recommendations available in the literature.

91
Table 21: Barriers and Recommendations to Effective PRs: Authors Barriers to Effective PRS Recommendations for Effective PRs
Von Zedtwitz, M. Organizational Learning through Post-project Reviews in RandD, RandD Management 2002. Post-Project Reviews in RandD, Research Technology Management 2003.
• Managerial (Time constraints, bureaucratic overheads).
• Psychological ( Inability to reflect, memory bias) • Team-based (reluctance to blame, Poor internal
communication) • Epistemological (Difficulty to generalize, tacitness of
process knowledge).
• Post-project review capability maturity model.
Busby, J.S. An Assessment of Post-Project Reviews, Project Management Journal 1999c
• Overspecificity (try to focus on the bigger system, not just day-to-day activities),
• Inability to diagnose (both psychological and organizational),
• Lack of historical reference (Inability to differentiate between characteristic or systemic problems.
Organizational support for: • Use of cause-effect diagrams. • Finding is same occurrence happened before. • Looking at the big pictures. • Avoiding simple categorization. • Following up on suggested remedies through
implementation. • Including key outside shareholders.
Williams, T. Learning from Projects, Journal of the Operational Research Society 2003
• Little motivation or time to be spent on finished project.
• No standardized procedures for conducting project reviews.
• Past PRs were not helpful. • Insignificant bureaucratic exercise. • Difficulties in conveying lessons learned throughout
the organization. • Difficulties in determining true causes of a problem.
Use of DECISION EXPLORER® software to model and map systemic relationships within a project.
Newell, S. Enhancing Cross-Project Learning, Engineering Management Journal 2004
• Too much emphasis on Codification (Information and Communication Technologies) model which focuses on what was accomplished, codified the information in a written document, and stored into a database to be retrieved when needed.
• Personalization (community) models will be more efficient in sharing knowledge, especially when it is tacit, or when individuals are from different backgrounds:
• Social networks are more efficient at sharing knowledge than expensive database.
• Procedural knowledge (how things were done) is more efficient at sharing knowledge than project knowledge (what was done).
• Try to assemble project teams with people with commonality, and overlapping knowledge.
Kransdrorff, A Viewpoint: Using the Benefits of Hindsight – The Role of Post-project Analysis. Managerial Auditing Journal 1996
• Defensive Reasoning: individuals have difficulties looking at their accomplishment objectively.
• Difficulty to communicate about the past: information on events is stored differently depending on the individuals and therefore.
• Selective and short-term memory: individuals only recall parts of an events and quality of the recollections deteriorates fast even after a relatively short time.
• Frequent and Regular “oral diaries” either in writing or recorded depicting events (fewer instances of capricious memory recall).
• Independent experts analyze these “diaries” (avoidance of defensive reasoning).
• Appropriate corporate culture nurturing learning and downgrading managerial sensitivities.
Keegan, A., Turner, J.R. Quantity versus Quality in Project-based Learning Practices. Management Learning 2001
• Time pressures • Focus on short-term objectives. • Not enough organizational nurturing on
informal networks within the companies, which were believed to be the more important conduit to knowledge transfer from individuals and teams.
• Centralization of resources to promote learning promoting retention (of data) over variation (of ideas) and exploration (of alternatives).
• Deferral of PRs to after a project is completed doesn’t allow for learning opportunities throughout the project life cycle.
• Less pressure on time. • Less focus on short-term objectives. • Less emphasis on the quantity of data/lessons
learned gathering tools (manuals, databases, etc.) for data retention.
• More focus on the quality of the processes to gather data.
92
The above literature review indicates that, for various reasons, project reviews, although very
beneficial and a major learning tool, are too often not conducted. In the few instances where
organizations do have processes to conduct PRs, either the focus for future project teams to use
that knowledge is missing, or/and there are no specific efforts to nurture a cultural and social
environment that promotes learning from tacit and explicit knowledge within the organization.
Therefore, additional studies are needed to help organizations implement and/or improve their
PR processes, so that they can gather, produce, and propagate the knowledge from a current/past
project for future projects. In doing so, organizations increase their internal learning capabilities,
build on their unique lessons learned repertory. By sharing the project management lessons
learned from previous projects, organizations are able to improve their current PM processes and
achieve greater PM maturity. Based on the literature, this should lead to better project
performance.
The following section will describe the overall selected research methodology.
2.8 Proposed Methodology and limitations:
To conduct this research, an action research/case study with project team members from
Kennedy Space Center (KSC), Boeing, Siemens, Darden, Harris, and WDW was proposed. A
combination of written open-ended questions (written interviews), survey, and direct and
personal observations from attendance to a post-mortem PR meeting were the main data
collection instruments. Action research methodology, a special type of case studies, allowed for
the active participation of the project team members as well as the researchers. This active
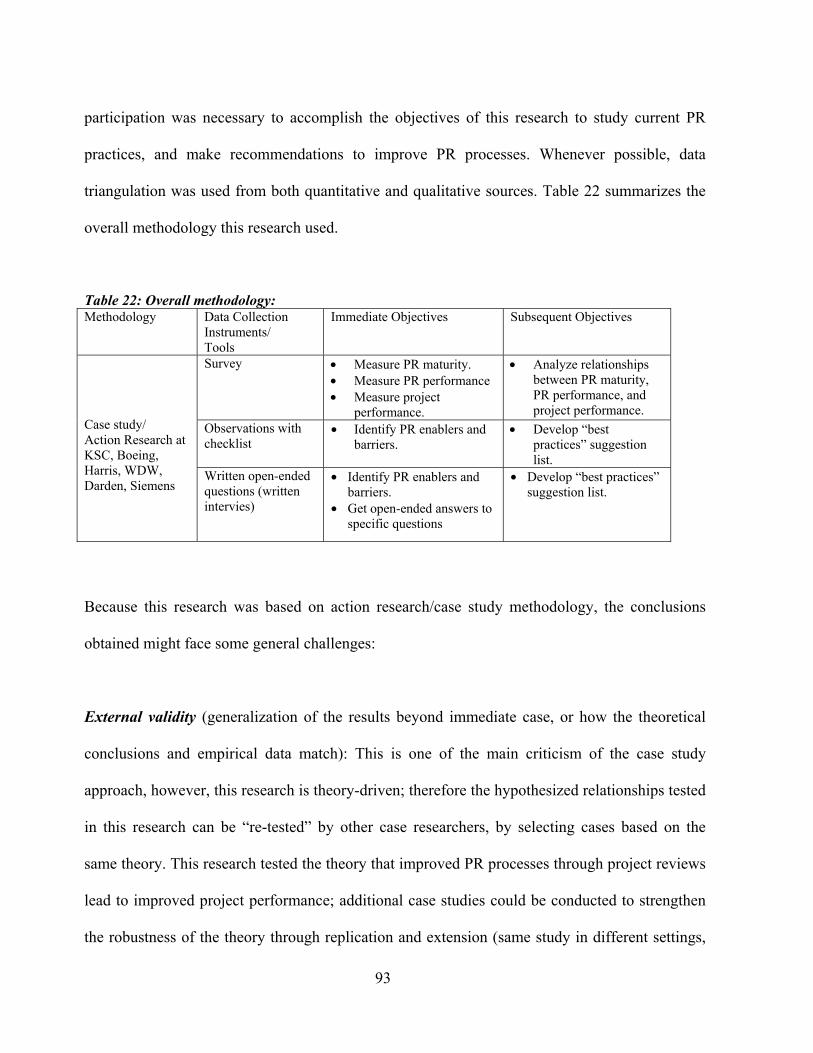
93
participation was necessary to accomplish the objectives of this research to study current PR
practices, and make recommendations to improve PR processes. Whenever possible, data
triangulation was used from both quantitative and qualitative sources. Table 22 summarizes the
overall methodology this research used.
Table 22: Overall methodology: Methodology Data Collection
Instruments/ Tools
Immediate Objectives Subsequent Objectives
Survey • Measure PR maturity. • Measure PR performance • Measure project
performance.
• Analyze relationships between PR maturity, PR performance, and project performance.
Observations with checklist
• Identify PR enablers and barriers.
• Develop “best practices” suggestion list.
Case study/ Action Research at KSC, Boeing, Harris, WDW, Darden, Siemens
Written open-ended questions (written intervies)
• Identify PR enablers and barriers.
• Get open-ended answers to specific questions
• Develop “best practices” suggestion list.
Because this research was based on action research/case study methodology, the conclusions
obtained might face some general challenges:
External validity (generalization of the results beyond immediate case, or how the theoretical
conclusions and empirical data match): This is one of the main criticism of the case study
approach, however, this research is theory-driven; therefore the hypothesized relationships tested
in this research can be “re-tested” by other case researchers, by selecting cases based on the
same theory. This research tested the theory that improved PR processes through project reviews
lead to improved project performance; additional case studies could be conducted to strengthen
the robustness of the theory through replication and extension (same study in different settings,
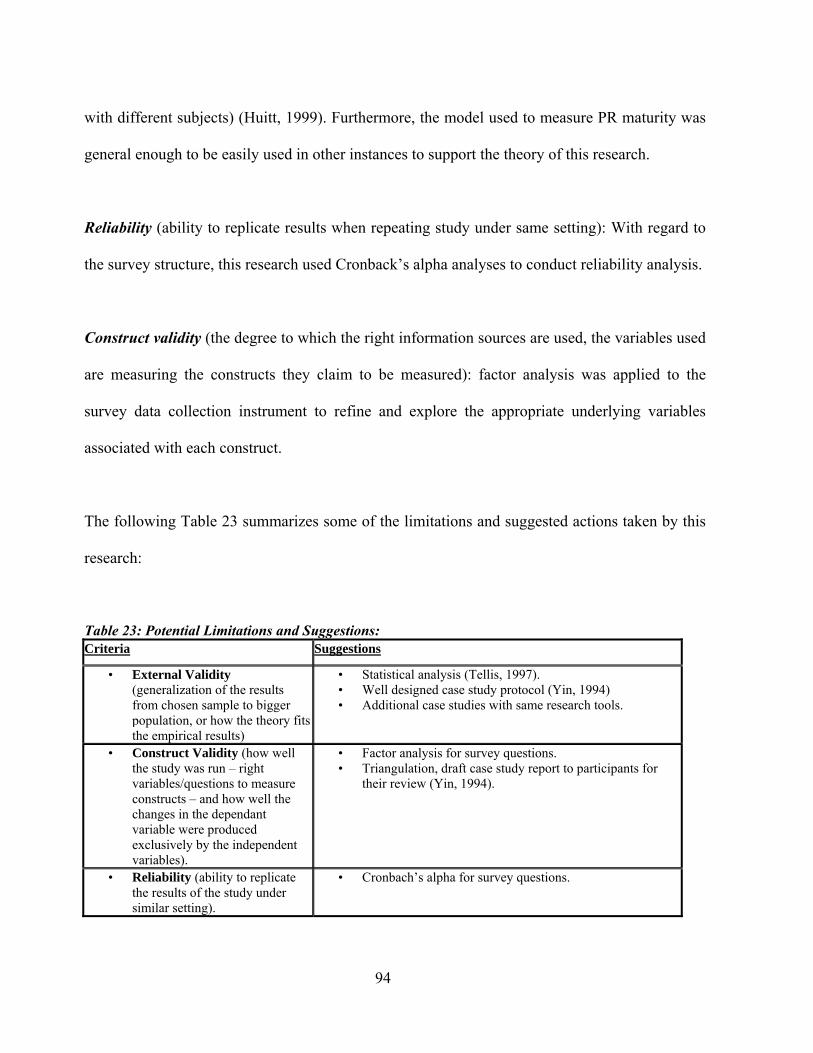
94
with different subjects) (Huitt, 1999). Furthermore, the model used to measure PR maturity was
general enough to be easily used in other instances to support the theory of this research.
Reliability (ability to replicate results when repeating study under same setting): With regard to
the survey structure, this research used Cronback’s alpha analyses to conduct reliability analysis.
Construct validity (the degree to which the right information sources are used, the variables used
are measuring the constructs they claim to be measured): factor analysis was applied to the
survey data collection instrument to refine and explore the appropriate underlying variables
associated with each construct.
The following Table 23 summarizes some of the limitations and suggested actions taken by this
research:
Table 23: Potential Limitations and Suggestions: Criteria Suggestions
• External Validity (generalization of the results from chosen sample to bigger population, or how the theory fits the empirical results)
• Statistical analysis (Tellis, 1997). • Well designed case study protocol (Yin, 1994) • Additional case studies with same research tools.
• Construct Validity (how well the study was run – right variables/questions to measure constructs – and how well the changes in the dependant variable were produced exclusively by the independent variables).
• Factor analysis for survey questions. • Triangulation, draft case study report to participants for
their review (Yin, 1994).
• Reliability (ability to replicate the results of the study under similar setting).
• Cronbach’s alpha for survey questions.

95
First, this research developed a survey to measure PR maturity model (which incorporated the
theories currently available in the literature on PRs) and measured the constructs of project
review performance and project performance. Then, the survey was submitted to the participants
to ascertain their current PR processes against the model matrix. Project performance was also
evaluated. Periodically, other data collection instruments (observations with checklists,
interviews, etc.) were used by this research to gather additional data on PR procedures.
The following Chapter explains in greater details the methodology chosen for this research.
96
CHAPTER THREE: RESEARCH METHODOLOGY
3.1. Introduction
This Chapter presents in details the research methodology used in this research. The first step
was the research conceptualization. This is the process where:
1) The conceptual model is refined, the constructs and their underlying factors are defined
and,
2) The relationship(s) between the constructs is (are) hypothesized.
The next step was the research operationalization. This is the process where:
1) The research methodology is selected,
2) The data research instruments are developed to be used to measure the conceptual
definitions established during the conceptualization process, and
3) The statistical techniques to test the hypotheses are described.
The following sections will illustrate how the research planned the conceptualization and
operationalization processes.
3.2. Conceptualization of the Research
During the conceptualization process, this research intended to develop the abstract and broad
definitions of the concepts this research intends to study. First the conceptual model and research
questions were refined, and then the definitions of the constructs (concepts) were described.
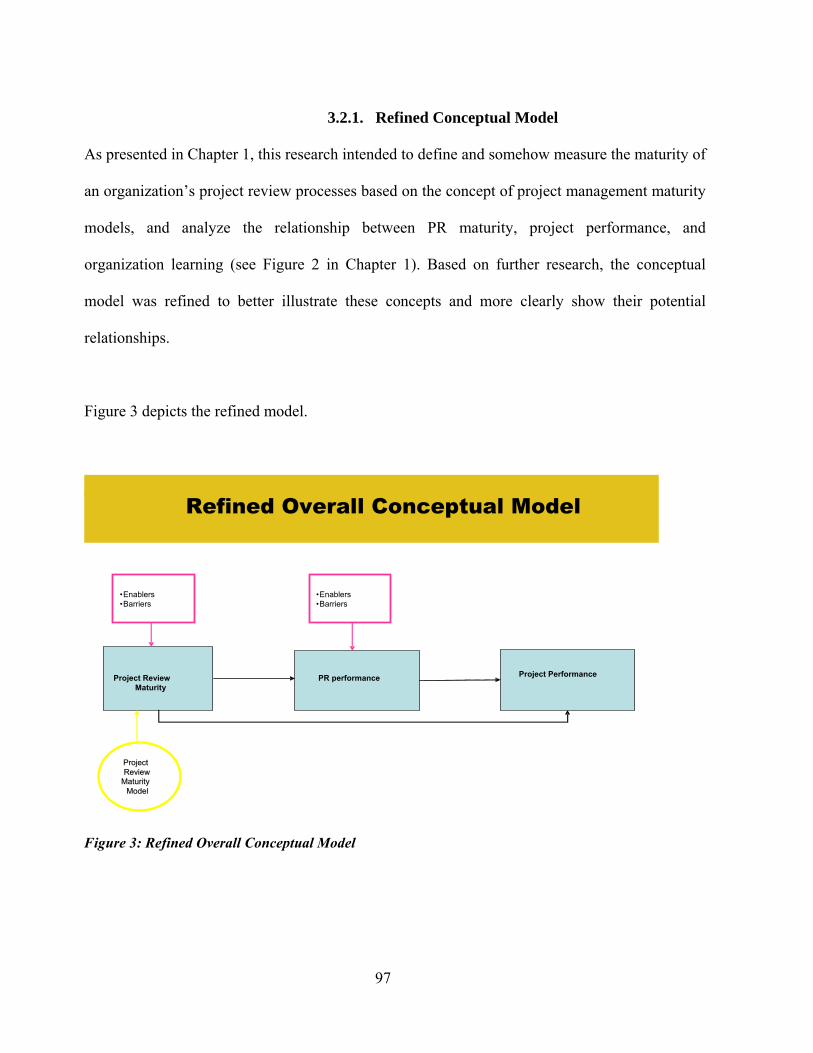
97
3.2.1. Refined Conceptual Model
As presented in Chapter 1, this research intended to define and somehow measure the maturity of
an organization’s project review processes based on the concept of project management maturity
models, and analyze the relationship between PR maturity, project performance, and
organization learning (see Figure 2 in Chapter 1). Based on further research, the conceptual
model was refined to better illustrate these concepts and more clearly show their potential
relationships.
Figure 3 depicts the refined model.
Figure 3: Refined Overall Conceptual Model
Project Project Review Review
Maturity Maturity ModelModel
• Enablers• Barriers
Project Review Maturity PR performance Project Performance
• Enablers• Barriers
Refined Overall Conceptual Model
98
In addition to the constructs given in the conceptual model in Chapter 1, a project review
maturity model (PRMM) has been added. This model, based on the concepts of project
management maturity model (PMMM) was intended to measure the maturity level of an
organization’s PR levels. The PRMM was also based on the five levels of maturity as many
PMMMs and used survey questions to determine the PR maturity level (see more details in part
3.3.3.1). Furthermore, as introduced in Chapter 1, the core research questions remained the
following:
• Research question #1: (theoretical): What are the characteristics of project reviews that drive
continuous individual/organizational learning (improved PR review performance), and improved
project performance?
• Research Question #2: (theoretical/operational): What is the relationship between PR maturity
and project performance?
• Research Question #3: (operational): What are the enablers and barriers of project reviews?
The core hypothesis of this research stipulates that there is a positive relationship between
project review maturity, project review performance, and project performance.
Further discussion of these constructs is explained in the following section.
3.2.2. Construct and Factor Definitions
As shown in the refined conceptual model, this research focused on three (3) constructs based on the
literature review evaluation in Chapter 2: project review maturity, project review performance, and
project performance.
99
The following is a description of these constructs:
A. “Project review maturity” construct: based on the idea of project management maturity model
depicted in Chapter 2, and von Zedtwitz, (2002), project review maturity measures how well established
the project review processes are within an organization. This construct represents the extent to which an
organization successfully and consistently generates and disseminates knowledge on project practices
from its PRs. The scale is from 1 to 5 and the more mature the review processes, the higher the score.
In addition, this research identified 4 types of reviews through the literature review, which apply to the
project review maturity and project review performance:
• Routine Reviews: current status debriefing meetings. Kransdroff (1996) and Gaynor
(1996) favor frequent (almost daily) reviews to avoid short-memory loss. These reviews
give the opportunity to team members to receive feedback on the project current versus
planned status, and to identify potential future problems. They should be conducted
frequently (daily, or weekly depending on the size, routine, and difficulty of the project)
in order to avoid instances of weak memory recall, or inaccurate memory (Kandroff
1996). All project team members should participate, although large projects (20 people or
more) should facilitate a series of such reviews as stated by Collier et. all (1996). These
informal reviews are short, frequent, and somewhat casual reviews where the primary
purpose is to review the current status of the project (versus planned scheduled) and to
capture recent events while avoiding memory bias due to time delay when reviews are
conducted at later and more infrequent dates. Potential challenges are also identified
during theses reviews and addressed early to avoid future, more serious obstacles.
100
• Gate Reviews: status reports and current PM implications. Swanson (1998) also stipulates
that reviews (after important events/phases) benefit organizations. At the end of major
project phases, a review needs to be held to assess whether the project is on track with
planned resources (and if not, how to correct the variance), and to determine the PM
practices that need to be changed/improved to avoid such problem in the future. The
frequency of the gate reviews should depend on the scale of the project. The focus is both
on product (technical- what is being accomplished) and process (causal – how things are
done) data. A facilitator who has not been directly involved in the project should be used
to manage the review to assure that the meeting is not viewed as a personal performance
assessment as stated by Dingsoyr (2005). The author also stipulates that all major players
(including external stakeholders, such as customers, contractors, suppliers, as well as
future project managers) should idyllically participate to broaden the organizational
knowledge by promoting learning through participation (2005). Gate reviews are used to
summarize the results of the previous informal reviews and try to discover the
relationship “between cause and effect” for major successful or unsuccessful PM
processes in the project. The focus of these reviews is not only on the current versus
planned results of the project so far, but also examines the managerial processes
involved. The goal is to make sure that any variance from planned outcome is caught
before it is too late or costly to fix, and to understand the root causes (both technical and
managerial) behind it.
• Postmortem/Knowledge-within-Project Reviews (PM reviews): Post-mortem, End-of-
project reviews. At the end of the project, a review needs to be held to completely
summarize what happened in the project, what went wrong/right, what actions were
101
taken, and what PM practices helped/impaired the project performance. Von Zedtwitz,
(2002), Williams (2003), and Martin et. al (2002) stress the importance of postmortem
reviews to make sure that organizations learn from the past. PM reviews are essentially a
synopsis of all the informal/gate reviews. The focus is both on product (technical- what is
being accomplished) and process (causal – how things are done) data. A facilitator who
has not been directly involved in the project should be used to manage the review to
assure that the meeting is not viewed as a personal performance assessment. All major
players (including external stakeholders, such as customers, contractors, suppliers, as
well as future project managers) should idyllically participate to broaden the
organizational knowledge by promoting learning through participation as stated by
Dingsoyr (2005). PM reviews are used to sum up the results of the previous gate reviews
and “connect the dots”. PM reviews are essentially a synopsis of all the informal/gate
reviews. The PM reviews are intended to address all the main issues faced during the
project as well as the underlying managerial root causes. These reviews are like
“summary” project reviews, where project history, challenges, problem causes, and
lessons learned are gathered, summarized, and analyzed.
• Focused-learning/Knowledge-across-Project Reviews (FL-PRs): reflective practices.
This research also recognizes this other type of reviews that would benefit organizations:
They are held after the postmortem reviews are completed. They should reflect on if/how
the project’s PM practices impact overall organizational PM practices, and/or if lessons
learned from a specific project management practice should apply to the overall
organization. They direct knowledge from the project level to the organizational level.
Any project managers and any other managers should conduct and use the knowledge of
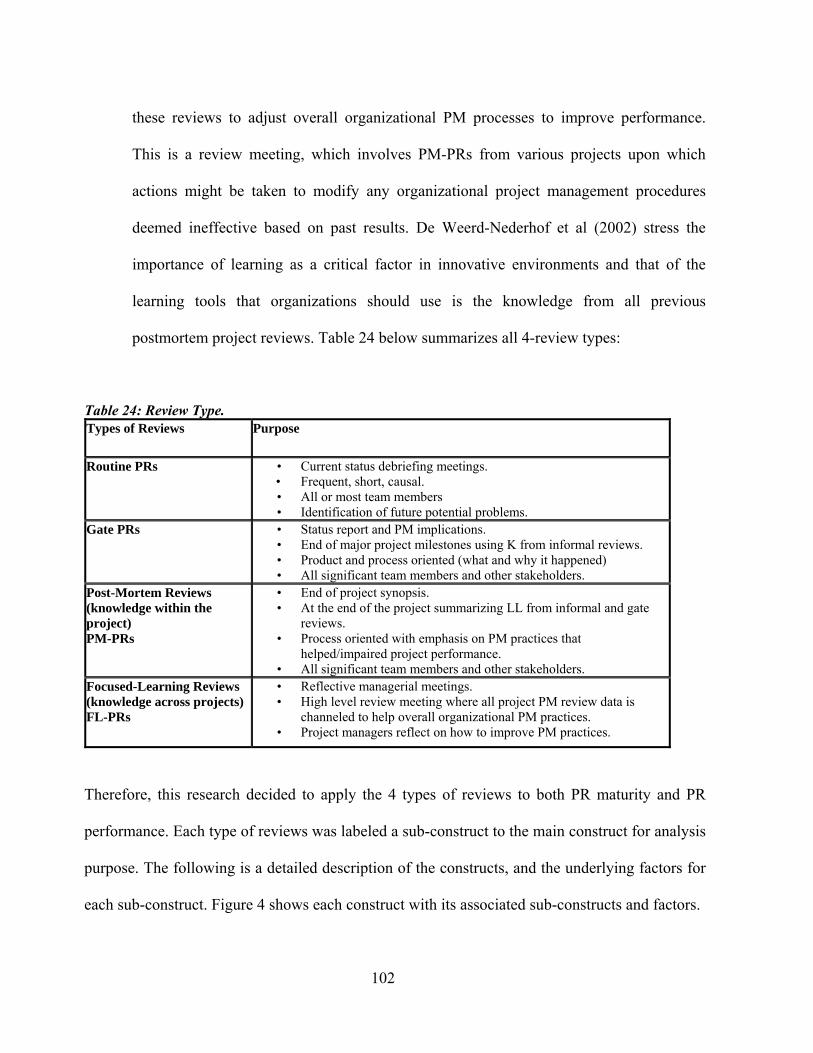
102
these reviews to adjust overall organizational PM processes to improve performance.
This is a review meeting, which involves PM-PRs from various projects upon which
actions might be taken to modify any organizational project management procedures
deemed ineffective based on past results. De Weerd-Nederhof et al (2002) stress the
importance of learning as a critical factor in innovative environments and that of the
learning tools that organizations should use is the knowledge from all previous
postmortem project reviews. Table 24 below summarizes all 4-review types:
Table 24: Review Type. Types of Reviews Purpose
Routine PRs • Current status debriefing meetings. • Frequent, short, causal. • All or most team members • Identification of future potential problems.
Gate PRs • Status report and PM implications. • End of major project milestones using K from informal reviews. • Product and process oriented (what and why it happened) • All significant team members and other stakeholders.
Post-Mortem Reviews (knowledge within the project) PM-PRs
• End of project synopsis. • At the end of the project summarizing LL from informal and gate
reviews. • Process oriented with emphasis on PM practices that
helped/impaired project performance. • All significant team members and other stakeholders.
Focused-Learning Reviews (knowledge across projects) FL-PRs
• Reflective managerial meetings. • High level review meeting where all project PM review data is
channeled to help overall organizational PM practices. • Project managers reflect on how to improve PM practices.
Therefore, this research decided to apply the 4 types of reviews to both PR maturity and PR
performance. Each type of reviews was labeled a sub-construct to the main construct for analysis
purpose. The following is a detailed description of the constructs, and the underlying factors for
each sub-construct. Figure 4 shows each construct with its associated sub-constructs and factors.

103
PR Maturity
PR Performance
Project Performance
Post-Mortem
Focused-learningGateRoutine
Constructs Sub-constructs and Underlying Factors: a Detailed Construct
Post-Mortem
Focused-learningGateRoutine
CorporateCulture Knowledge
TransferPR
logisticsManagerial
Buy-in
Impact On project
performanceLevels ofLearning
AchievementOf
objectives
•Enablers•Barriers
•Enablers•Barriers
Constructs
Sub-Constructs
Factors
Figure 4: Constructs and Underlying Factors.
Through reviewing the literature review and the various empirical studies conducted on project reviews,
this research determined that 4 general factors constitute the “project review maturity” construct:
1. Corporate culture: Kransdroff (1996), Pan et al (2002), and Newell (2004) stress the importance of
corporate culture as a facilitator for high-quality reviews. An open and forgiving culture where
members are not afraid of reprisals when failing is a necessary trait for mature reviews. A corporate
culture that also encourages learning from past actions and offers training to improve the learning
processes among its members also promotes more mature reviews.
2. Managerial buy-in: this factor examines the extent to which senior managers and project managers
place on reviews. This factor also evaluates if managers require project teams to conduct reviews
(what types), offer the appropriate tools (forms, process to conduct reviews, etc.) and allocate the
necessary resources (time, place, etc.) for proper reviews. Von Zedtwitz, (2002) and Pan et al (2002)
emphasize the critical role that managerial commitment plays in conducting productive reviews.
104
3. PR Logistics: this factor focuses on what types of reviews are conducted, if the appropriate
participants are included (all the right stakeholders), and if the right type of data is extracted
(depending on the type of project reviews, different types of data, learning should be
expected).
4. Knowledge Sharing: this factor represents an organization’s existing processes used to share lessons
learned from previous reviews. Martin et al (2002), Kransdroff (1996), and de Weerd-Nederhof et al
(2002) emphasize the importance of information distribution as a key element for successful reviews.
If lessons learned from reviews are not shared, then “corporate amnesia” prevails and project review
maturity is low.
B. Project review performance construct: this construct describes how effective project reviews
are. More specifically, it 1) conceptualizes the appropriate levels of learning for each review (what is
being learned), and 2) evaluates if the knowledge acquired during each review impacts the project
performance of the team members. As for the previous construct (PR maturity), the PR performance
construct is also divided into the same four types of reviews: routine, gate, post-mortem, and focused-
learning. The two following factors theoretically apply to all 4 sub-constructs:
1. Levels of learning: this factor represents the four stages involved in organizational learning as
described by Kotnour and Vergopia (2005).
a. Level I: status learning: The first level of learning in a project review is: learning
focuses on understanding the current status of the project. The emphasis is on “what” is
happening in the project (product knowledge– what are we accomplishing). At this
level, the most important data, sequence of events, and information creation are the
focus.
b. Level II: status and challenge learning. Using the information from level I, changes are
made within the project to adjust any variances from planned performance, and

105
information from these actions is gathered for the next learning level. At this level,
learning is still focused on what happened (product knowledge) and how it needs to be
fixed (product knowledge).
c. Level III: team project management procedures. : At this stage, information from Levels
I and II (product knowledge) is used to study project management practices, and study
the underlying managerial causes involved in the project performance problems within
the project team.(process knowledge).
d. Level IV: organizational project management processes: This highest learning level
focuses on improving the organization’s practices. all lessons learned from previous
project reviews, especially from project postmortem reviews, are integrated to evaluate
current organizational PM processes, and check what PM procedure(s) should be
changed in order to improve overall project performance. It is important to recognize
that each level of learning is built upon the foundation of the previous one.
Table 25 is a summary of the four (4) levels or learning described above.
Table 25: Levels of Learning. Levels of Learning Description
Level I: status learning • Product-knowledge focused. • Information awareness.
Level II: status and challenge learning
• Product-knowledge focused. • Information awareness and action selection.
Level III: team project procedures
• Knowledge from levels II and I used to identify PM practices in project and root causes of any variances.
• Process-knowledge focused. • Managerial root cause identification.
Level IV: organizational processes
• High-level learning based on knowledge obtained from level III learning, integrated to evaluate current overall PM organizational processes.
• Process-knowledge focused. • Organizational PM policy generation
106
2. Impact on project performance: This factor focuses on the impact(s) that the reviews have
on the project performance. The previous factor (levels of learning) emphasizes “what do I
learn” during a specific PR, while this factor emphasizes “how does what I have learned
impact my performance and my project performance” from a specific PR. This factor also
examines how the information gathered during the various reviews impacts project
performance. This research hypothesized that Levels of learning I and II are addressed in
routine reviews. Levels of learning II and III happen more during gate reviews, while
Levels of learning III and IV occur more frequently during PM-PRs. Finally, Level of
learning IV is more likely to take place during FL-PRs.
C. Project performance construct: this construct represents the extent to which an organization delivers
successful projects, or achieves project objectives. Based on the literature review and prior researches this
construct is a single-factor construct.
Achievement of project objectives: This factor describes project performance based on planned
expectations on project costs, schedules, and technical performance versus actual performance (adapted
from Taplin, 2004, and Tukel and Rom, 2001), as well as stakeholders’satisfaction.
The next section presents the operationalization of this research.
3.3. Operationalization of the Research
After having determined the conceptual definitions of the constructs, this research proceeded
to the operationalization of the concepts. This process describes the practical steps that this
research proposes to take to answer the research questions and test the hypotheses. In this

107
process, the abstract concepts developed earlier are transformed into measurable elements to
further the research.
The next section presents the research methodology, the data collection instruments, and the
statistical tools that this research intended to use.
3.3.1. Research Design Selection and Overall Research Approach.
The overall goal of this study (and core research questions) was to study project reviews in a
technical environment in order to:
• Determine practical best practices, enablers and barriers to effective reviews,
• Create a tool to measure project review maturity,
• Establish if there are relationships between:
o Project review maturity (independent variable), and project review performance
(dependent variable),
o Project review maturity (independent variable), and project performance
(dependent variable),
o Project review performance (independent variable), and project performance
(dependent variable),
Therefore, this research design was an empirical case study/action research. As outlined in
Chapter 1, this approach is best suited for observable facts within their real life settings (Yin,
108
1993), which specifically applies to organizational managerial issues. Cullingham (1993) also
specifies that case study/action research is a scientific research process, which collects data about
an on-going system, such as an organization where traditional scientific methods (with
controlled environment, settings) may not always be suitable, or practical. Gliner et al (1999)
also favor case study methodology when the researcher deals with an independent variable that
he/she cannot control. Therefore, this research, through the empirical case study methodology,
concentrated on analyzing PRs, identifying best practices, enablers, and barriers, as well as
evaluating the relationships between PR maturity, PR performance, and project performance.
The following paragraph describes the data collection instruments that this research planned on
utilizing.
3.3.2. Data Collection Instrument Selection
This research proposed to use three (3) different sources of data:
1) Survey,
2) Written open-ended questions in survey (written interviews), and
3) Observations.
This selection was made based on the following analysis of data collection instruments.
Surveys are data collection instruments that allow the collection of information not otherwise
available; for example, data on how subjects feel or perceive a matter (tacit information) can be
more easily extracted with a survey than with observations (Girden, 2001). Surveys can be
109
conducted by a person (personal interviews or telephone interviews) or by administrating a
written questionnaire (mail-in, on-line, etc.). In interviews, personal or sensitive questions are
more easily answered in written anonymous questionnaires. However, the reliability and validity
of the data collected through written surveys are closely dependent on the respondents’ candor
and memories (Bourque, et al, 1992). Because a written survey features a uniform presentation
in nature, it presents fewer opportunities for interviewer/interviewee bias, as opposed to face-to-
face or telephone interviews, while it makes the analysis easier to conduct. Interviews, especially
semi-structured ones, are better sources for deeper, additional information because of the probing
opportunity the interviewer has (Leedy, 1997). This advantage notwithstanding, the interview
questions should also follow a rigorous planning strategy and be pilot-tested to ensure clarity,
precision, and little bias (Leedy, 1997). In addition, Gall, et al (1996), also stipulate that efficient
interviews should avoid leading or cross-examining questions. Yin (2002) furthermore contends
that interviews may also face “reflexivity” problem, when the interviewee answers questions in
the way he/she thinks the interviewer may want to hear it.
With regard to observations, Yin (2002) also stipulates that this data collection technique has
been widely used in anthropological studies, but is also appropriate for large or small groups
such as organizations. Observations of the participating subjects can provide “insider”
information on events or their environment, which would not be otherwise observed. However,
caution about the potential bias linked to personal observations due to possible manipulation of
events, facts, by the interviewer, should be noted (Becker, 1958, Yin, 2002).
110
Finally, according to Yin (2002), a case study, such as this research intends to be, will benefit
from data collections instruments such as surveys, interviews, and observations, because they
help this research in obtaining several sources of evidence, which will help with the issues of
construct validity and reliability. This principle of using multiple data sources (triangulation) is
at the core of the case study data collection protocol. For example, surveys might provide
quantitative data for analysis, while individual or verbal/open-ended written information can be
obtained through interviews or observations, thus presenting additional data to support the same
facts, and multiple measures for the same event. Although Patton (1987) mentions 4 types of
triangulations: 1) data sources, 2) evaluators (several researchers with the same data collection
instruments) 3) theory (using outside-the-field-of-study professionals to interpret the theory), and
4) methods (multiple use of other qualitative and quantitative methods to test the theory),
triangulation in the context of case study analysis refers to data sources, and the ability to
measure/witness the same fact from various data collection instruments. In all cases, the purpose
of data triangulation is to provide validity to a case study or other studies that are part qualitative.
The multiple-source data collection process also help validate the empirical results (Iversen, et
al, 2006). Figure 5 represents the various data collection instruments this research intended to
use.

111
Empirical Case Study
KSC, Boeing,WDW, Harris,
Darden, Siemens
Written Interviews
Survey
Observations PR Maturity
Relationship //PR Maturity,
PR Performance &P. Performance
PR Enablers,Barriers, &
Best Practices
Tools Methodology Objectives
Overall Research Approach
Figure 5: Overall Research Approach.
Table 26 summarizes the various data collection techniques intended to be used in this study and
their advantages/disadvantages.
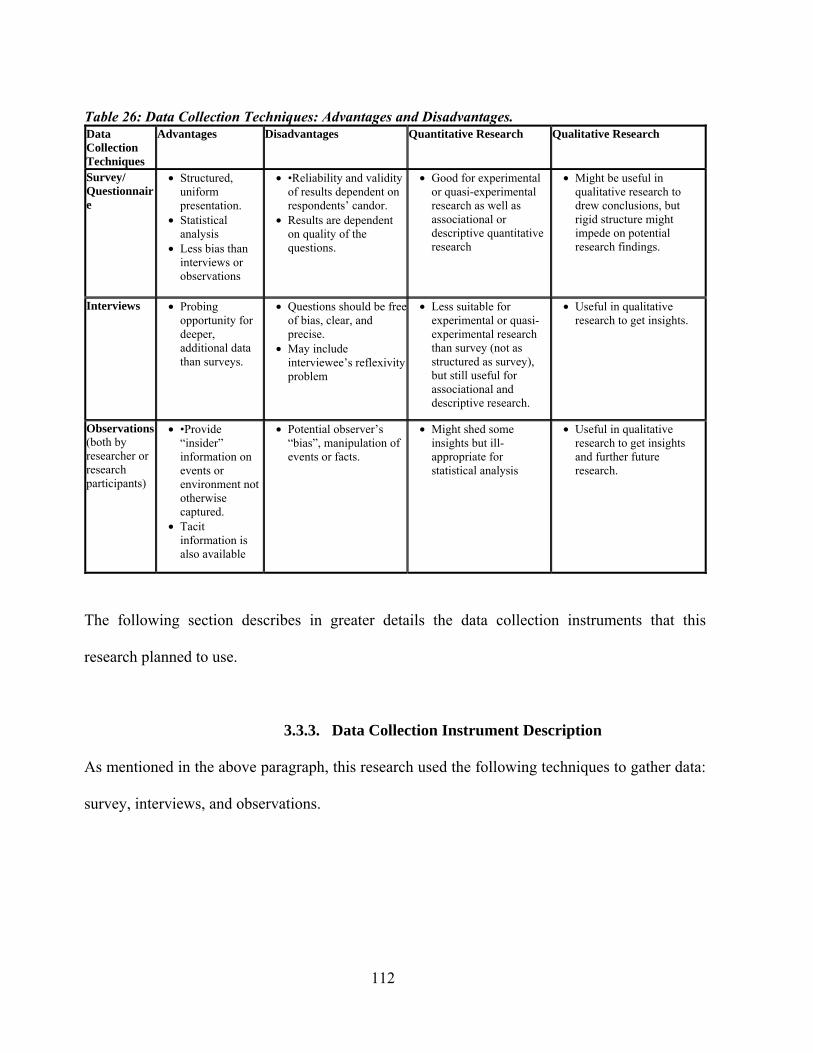
112
Table 26: Data Collection Techniques: Advantages and Disadvantages. Data Collection Techniques
Advantages Disadvantages Quantitative Research Qualitative Research
Survey/ Questionnaire
• Structured, uniform presentation.
• Statistical analysis
• Less bias than interviews or observations
• •Reliability and validity of results dependent on respondents’ candor.
• Results are dependent on quality of the questions.
• Good for experimental or quasi-experimental research as well as associational or descriptive quantitative research
• Might be useful in qualitative research to drew conclusions, but rigid structure might impede on potential research findings.
Interviews • Probing opportunity for deeper, additional data than surveys.
• Questions should be free of bias, clear, and precise.
• May include interviewee’s reflexivity problem
• Less suitable for experimental or quasi-experimental research than survey (not as structured as survey), but still useful for associational and descriptive research.
• Useful in qualitative research to get insights.
Observations (both by researcher or research participants)
• •Provide “insider” information on events or environment not otherwise captured.
• Tacit information is also available
• Potential observer’s “bias”, manipulation of events or facts.
• Might shed some insights but ill-appropriate for statistical analysis
• Useful in qualitative research to get insights and further future research.
The following section describes in greater details the data collection instruments that this
research planned to use.
3.3.3. Data Collection Instrument Description
As mentioned in the above paragraph, this research used the following techniques to gather data:
survey, interviews, and observations.
113
3.3.3.1. Survey:
A survey was developed to quantitatively measure all 3 constructs in this research. The basis for
the questions in this survey was rooted in the literature review or supported by previous survey
instrument questions used in previous research efforts. The survey was a 5-point Likert-scaled
survey with at least 3 questions for each factor underlying each construct. This allowed using
continuous data analysis for the factor analysis. The questions for the survey followed the
guidelines of de Vaus (1995) and Alston and Bowles (1998). Because the same questions applied
to each type of review, and for simplification purposes, the survey was divided into 4 parts:
• Part A: question pertaining to organizational review procedures (to verify their frequency
significance).
• Part B: questions pertaining to all types of review (both for PR maturity and PR
performance constructs).
• Part C: questions pertaining to project performance construct.
• Part D: questions pertaining to demographics, and open-end questions.
Based on the previous works of such researchers such as Hillson (2003), and Cooke-Davis
(2002), the following answers corresponded to the following PR maturity levels:
• Strongly disagree: this answer corresponds to a level of PR maturity of 1, the lowest,
when the “event” is never or almost never occurring.
• Disagree: this answer corresponds to a level 2 of maturity, indicating that most of the
times the specific “event” does not occur, although it may take place sporadically.

114
• Neutral (neither agree nor disagree): this answer indicates that the respondent is familiar
with the “event”, that there is somewhat of an “organizational” emphasis on the event,
although it is only optional. This would correspond to a level 3 PR maturity.
• Agree: this answer should be chosen when the “event” does happen the majority of the
time and when the organization has taken the steps to make it part of its required
processes. This corresponds to a level 4 PR maturity.
• Strongly agree: this is the strongest level of all. This answer indicates that not only do the
event happens constantly, or almost always, but that the organization has made sure that
processes to carry that “event” are in place and carried out.
Table 27 is a representation of this research’s PR maturity model and survey combined
together:
Table 27: PR Maturity Model/Survey.
Level 5: Level 4:Level 3:Level 2:Level 1:PR Maturity levels & Corresponding survey answer
PR Maturityfactors
Routine PRsPR Logistics
Gate PRs
Post-Mortem PRs
Focused-Learning PRs
Routine PRsManagerial Buy-in
Gate PRs
Focused-Learning PRs
Post-Mortem PRs
Post-Mortem PRs
Gate PRs
Focused-Learning PRs
Routine PRsKnowledge Sharing
Focused-Learning PRs
Post-Mortem PRs
Gate PRs
Routine PRsCorporate Culture
STRONGLY AGREE“Event” happens almost all the time, and efficient organizational PR procedures are in place.
AGREE“Event” is familiar to the respondent, and required to be carried the majority of the time.
NEUTRAL (neither agree nor disagree)“Event” is familiar to the respondent, although still optional.
DISAGREE“Event” may occur sporadically, although rarely.
STRONGLY DISAGREE“Event’ never or almost never occur.
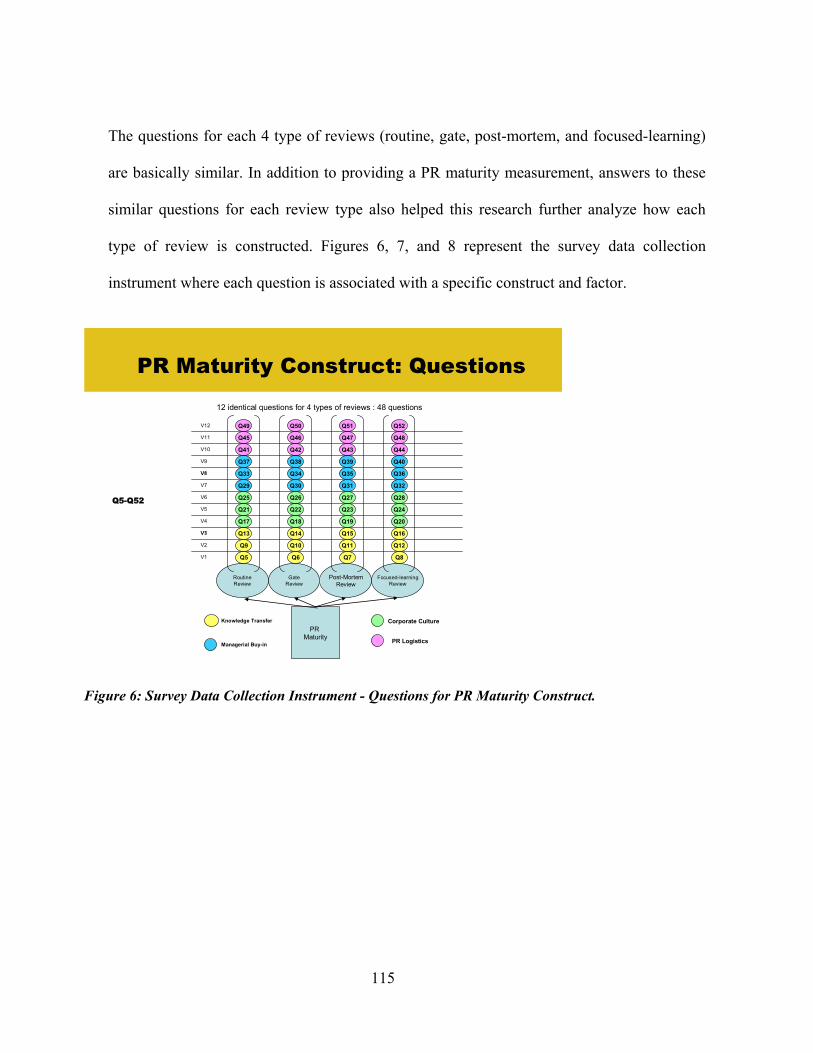
115
The questions for each 4 type of reviews (routine, gate, post-mortem, and focused-learning)
are basically similar. In addition to providing a PR maturity measurement, answers to these
similar questions for each review type also helped this research further analyze how each
type of review is constructed. Figures 6, 7, and 8 represent the survey data collection
instrument where each question is associated with a specific construct and factor.
PR Maturity Construct: Questions
PR Maturity
Post-MortemReview
Focused-learningReview
GateReview
RoutineReview
Q13
Q9
Q5
Q22
Q18
Q14
Q10
Q6
Q23
Q19
Q15
Q11
Q7
Q24
Q20
Q16
Q12
Q8
Q25
Q21
Q17
Q34
Q30
Q26
Q35
Q31
Q27
Q36
Q32
Q28
Q45
Q41
Q37
Q33
Q29
Q50
Q46
Q42
Q38
Q51
Q47
Q43
Q39
Q52
Q48
Q44
Q40
Q49
Knowledge Transfer
Managerial Buy-in PR Logistics
Corporate Culture
V1
V2
V1V3
V4
V5
V6
V7
V1V8
V9
V10
V11
V12
12 identical questions for 4 types of reviews : 48 questions
Q5-Q52
Figure 6: Survey Data Collection Instrument - Questions for PR Maturity Construct.

116
PR Performance Construct:Questions
PR Performance
Post-MortemReview
Focused-learningReview
GateReview
RoutineReview
Q61
Q57
Q53
Q70
Q66
Q62
Q58
Q54
Q71
Q67
Q63
Q59
Q55
Q72
Q68
Q64
Q60
Q56
Q73
Q69
Q65
Q82
Q78
Q74
Q83
Q79
Q75
Q84
Q80
Q76
Q81
Q77
Levels of learningImpact on project performance
V13
V14
V15
V16
V17
V18
V19
V20
Q53-Q84
Figure 7: Survey Data Collection Instrument - Questions for PR Performance Construct.
Project Performance Construct: Questions
Project Performance
Q88
Q87
Q86
Q85
Q90
Q89
AchievementOf projectobjectives
Figure 8: Survey Data Collection Instrument – Questions for Project Performance Construct.
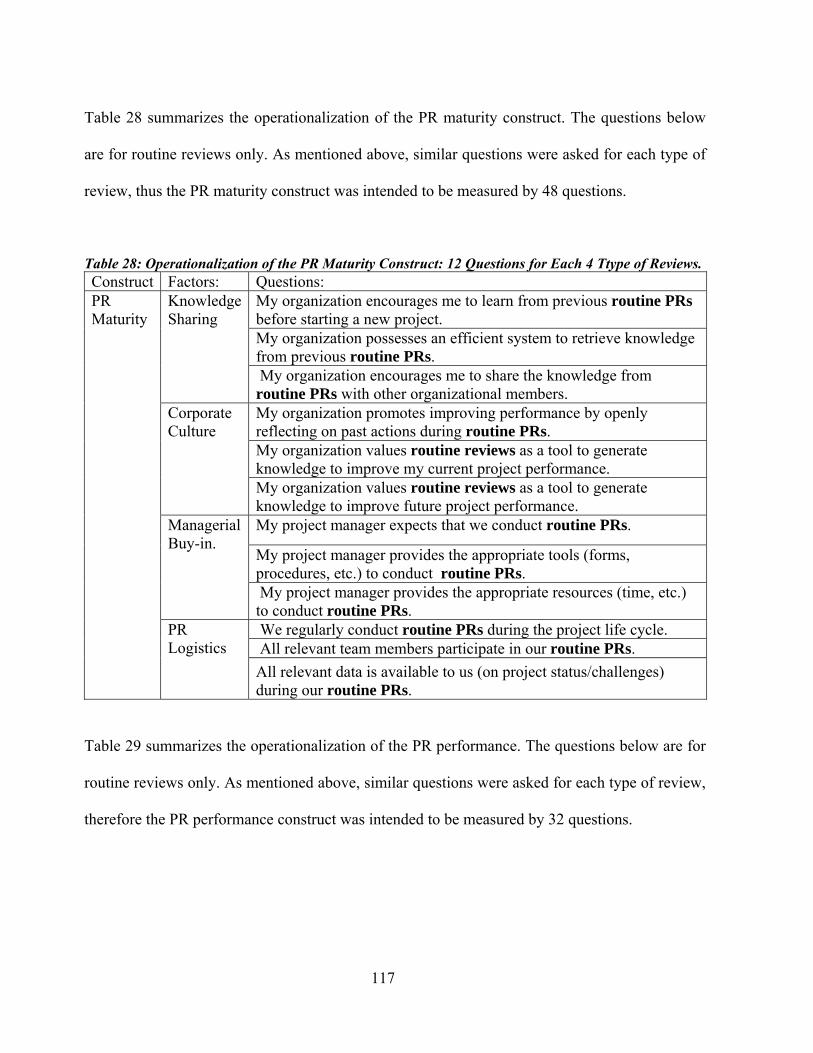
117
Table 28 summarizes the operationalization of the PR maturity construct. The questions below
are for routine reviews only. As mentioned above, similar questions were asked for each type of
review, thus the PR maturity construct was intended to be measured by 48 questions.
Table 28: Operationalization of the PR Maturity Construct: 12 Questions for Each 4 Ttype of Reviews. Construct Factors: Questions:
My organization encourages me to learn from previous routine PRs before starting a new project. My organization possesses an efficient system to retrieve knowledge from previous routine PRs.
Knowledge Sharing
My organization encourages me to share the knowledge from routine PRs with other organizational members. My organization promotes improving performance by openly reflecting on past actions during routine PRs. My organization values routine reviews as a tool to generate knowledge to improve my current project performance.
Corporate Culture
My organization values routine reviews as a tool to generate knowledge to improve future project performance. My project manager expects that we conduct routine PRs.
My project manager provides the appropriate tools (forms, procedures, etc.) to conduct routine PRs.
Managerial Buy-in.
My project manager provides the appropriate resources (time, etc.) to conduct routine PRs. We regularly conduct routine PRs during the project life cycle. All relevant team members participate in our routine PRs.
PR Maturity
PR Logistics
All relevant data is available to us (on project status/challenges) during our routine PRs.
Table 29 summarizes the operationalization of the PR performance. The questions below are for
routine reviews only. As mentioned above, similar questions were asked for each type of review,
therefore the PR performance construct was intended to be measured by 32 questions.

118
Table 29: Operationalization of the PR performance Construct: 8 Questions for Each 4 Type of Reviews. Construct: Factors: Questions:
Routine PRs help us gain knowledge on the PM procedures used in our project. Routine PRs help us gain knowledge on the status of our project. Routine PRs help us gain knowledge on the challenges of our project and control the potential problems. Routine PRs help us gain knowledge on the PM procedures used in our project and their impact on project performance.
Levels of learning
Routine PRs help us gain knowledge on organizational procedures used in our project and their impact on project performance. Routine PRs help us improve our project performance during the project life cycle. Routine PRs help us improve our organizational PM procedures.
PR Performance
Impact on project performance
Routine PRs help us reduce the risk of potential project challenges.
Table 30 summarizes the operationalization of the PR performance. The project performance
construct was intended to be measured by 6 questions.
Table 30: Operationalization of the Project Performance Construct: 6 Questions. Construct: Factors: Questions:
Our projects are delivered on planned time schedule. Our projects meet original technical performance objective. Our projects are delivered on planned within planned costs. Our customers are satisfied with the outcome of our projects. We have a productive relationship with our contractors/suppliers
Project Performance
Achievement of project objectives
Our team’s PM processes are more efficient because of our studying our past experience.
With regard to sample selection and size, this research proposed the following:

119
The respondents for the survey were all employees of project oriented organizations including,
KSC, Boeing, Siemens, Harris, WDW, and Harris. The survey would be available on line via
surveymonkey.com for 3 months. This research planed to give out this survey to at least 75
potential respondents to obtain a number of data significant enough to improve the statistical
significance of the research. This research realized that the sample selection was not random
(limited to only a few organizations located in Central Florida); therefore the results of this study
might not be generalizable. However, this research hoped to provide substantive insights on the
review processes in technical organizations, and a conceptual model and tool (survey) to
measure project review maturity, which could be used in other research efforts.
3.3.3.2. Written Interviews:
Written interviews were also conducted in this research to gain additional knowledge on the
review processes at KSC. Some of pre-established open-ended questions were presented to the
respondents at the end of the survey. Open-ended questions should encourage respondents to
share additional data uncovered by the more formal Likert-scale questions.
The knowledge obtained from these written interviews should not only give additional insights
on review processes, but should also help in the triangulation process of this research by
measuring, witnessing the same facts from a different data collection instrument. A list of the
proposed interview questions is given in the Table 31:

120
Table 31: Interview Questions. Question Topics
Questions
How would you describe your use of “Routine Reviews” How would you describe your use of “Gate Reviews” How would you describe your use of “Post-Mortem Reviews”
Reflections on the Review Process
How would you describe your use of “Focused-Learning Reviews” 3.3.3.3. Observations:
This research also conducted observations while on site at KSC. As stipulated by Yin (2002),
observations are particularly useful at providing “insider information” which would not be
otherwise available. This is especially true with regard to individuals’ attitude, mind-sets,
thoughts and feelings. These observations were mostly geared at identifying psychological
barriers/enablers to project reviews. This research intended to attend a post-mortem project
review at KSC. A checklist of potential observable behaviors was used to ascertain the major
enablers and barriers of project reviews. These observations also contributed to the triangulation
process of this research and provided additional highlights on PRs. Table 32 presents an example
of checklist used during Routine PRs. Similar checklists should be used for the other types of
reviews.
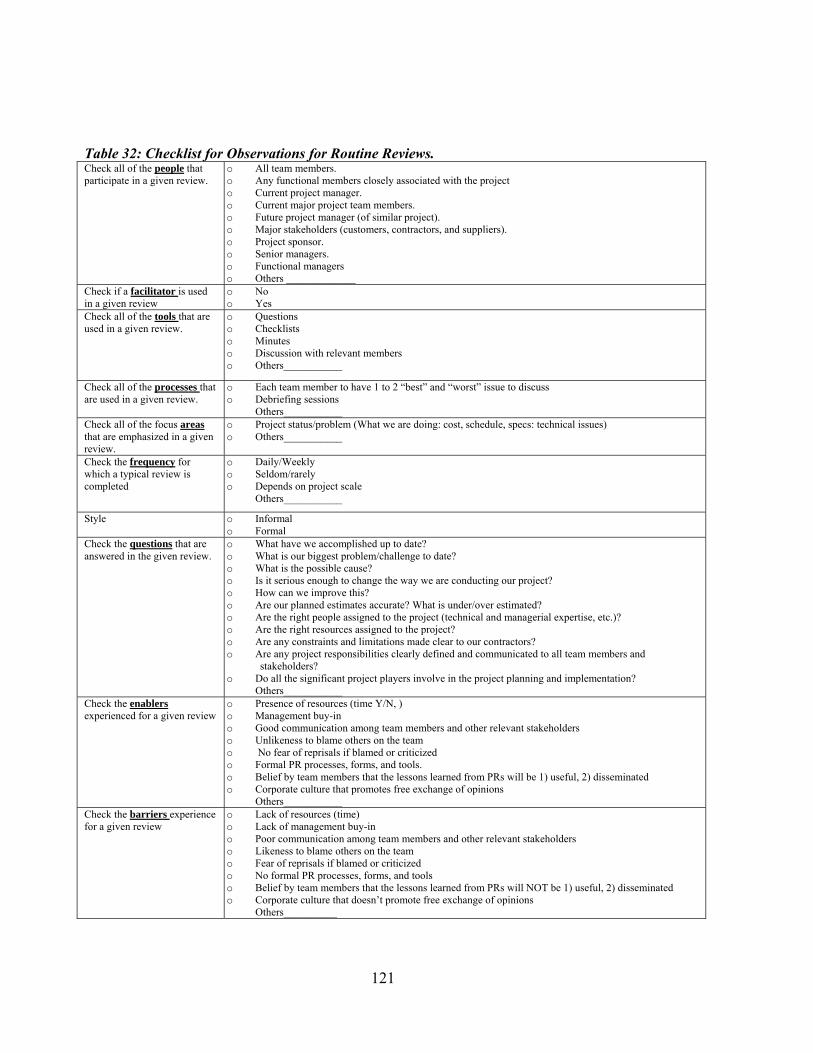
121
Table 32: Checklist for Observations for Routine Reviews. Check all of the people that participate in a given review.
o All team members. o Any functional members closely associated with the project o Current project manager. o Current major project team members. o Future project manager (of similar project). o Major stakeholders (customers, contractors, and suppliers). o Project sponsor. o Senior managers. o Functional managers o Others _____________
Check if a facilitator is used in a given review
o No o Yes
Check all of the tools that are used in a given review.
o Questions o Checklists o Minutes o Discussion with relevant members o Others___________
Check all of the processes that are used in a given review.
o Each team member to have 1 to 2 “best” and “worst” issue to discuss o Debriefing sessions
Others___________ Check all of the focus areas that are emphasized in a given review.
o Project status/problem (What we are doing: cost, schedule, specs: technical issues) o Others___________
Check the frequency for which a typical review is completed
o Daily/Weekly o Seldom/rarely o Depends on project scale
Others___________
Style o Informal o Formal
Check the questions that are answered in the given review.
o What have we accomplished up to date? o What is our biggest problem/challenge to date? o What is the possible cause? o Is it serious enough to change the way we are conducting our project? o How can we improve this? o Are our planned estimates accurate? What is under/over estimated? o Are the right people assigned to the project (technical and managerial expertise, etc.)? o Are the right resources assigned to the project? o Are any constraints and limitations made clear to our contractors? o Are any project responsibilities clearly defined and communicated to all team members and
stakeholders? o Do all the significant project players involve in the project planning and implementation?
Others___________ Check the enablers experienced for a given review
o Presence of resources (time Y/N, ) o Management buy-in o Good communication among team members and other relevant stakeholders o Unlikeness to blame others on the team o No fear of reprisals if blamed or criticized o Formal PR processes, forms, and tools. o Belief by team members that the lessons learned from PRs will be 1) useful, 2) disseminated o Corporate culture that promotes free exchange of opinions
Others___________ Check the barriers experience for a given review
o Lack of resources (time) o Lack of management buy-in o Poor communication among team members and other relevant stakeholders o Likeness to blame others on the team o Fear of reprisals if blamed or criticized o No formal PR processes, forms, and tools o Belief by team members that the lessons learned from PRs will NOT be 1) useful, 2) disseminated o Corporate culture that doesn’t promote free exchange of opinions
Others__________
122
3.3.4. Validity and Reliability of the Survey Data Collection Instrument
Some issues need to be addressed concerning the survey: reliability and construct validity.
Reliability refers to the ability of the survey to present similar results under the same setting,
while construct validity refers to the extent the survey instrument appropriately measures the
constructs and factors specified in the conceptual model. Although a survey data collection
instrument can be reliable but not valid, it cannot be valid if it is not reliable.
3.3.4.1. Construct validity
Construct validity refers to the accuracy of the measurement tool to measure what it intends to
measure. Factor analysis (FA) was conducted to verify the construct validity of the survey
(conceptual model) and the relevance of the questions in the survey (loading of the questions in
the survey for each factor). Factor analysis is a collection of methods used to study the
interrelationships among variables (DeCoster, 1998) (Carr, 1992). As stated by Bollen (1989),
factor analysis intends to simplify a concept by using relatively fewer underling latent variables.
In other words, FA can be used to simplify complex sets of data (Kline, 2002), and helps at
exploring the underlying factor structure of the constructs in a model (Kim et al, 1978). The
theoretical concepts of FA were first developed by Pearson and Spearman at the beginning of the
20th century, but because of the mathematical complexities involved in the multiple
computations, FA has only started to be utilized in the research area since the use of computers
and software packages for the past 30 years. There are two types of FA: exploratory factor
analysis (EFA), and confirmatory factor analysis (CFA). The use of one method over the other is
often debated among researchers (Hurley, et al, 1997, citing Chet Shriesheim, Bob Vanderberg,
123
Larry Williams, and Anson Seers). Most FA have been exploratory and only recently have
researchers started to use CFA, which has become the “preferred FA methodology” in analysis
today. However, as quoted by Hurley, et al (1997), Gerbing and Hamilton (1996, p. 71) stated
about CFA: “ Most uses of “confirmatory” factor analyses are, in actually, partly exploratory and
partly confirmatory in that the resultant model is derived in part from theory and in part from a
respecification based on the analysis of model fit”. As this quote illustrates, the difference
between the two is very blurred and there are no precise guidelines but only general guiding
principles available in the literature today to choose EFA or CFA. This research agrees with the
principles that both types of FAs have their place in the research areas, depending on the criteria
and foundations used to substantiate the use of either EFA or CFA in data analysis (Hurley, et al,
1997). After examining the various issues associated with EFA and CFA, and the pros and cons
of each analysis, this research proposed to use EFA for each construct in the conceptual model,
as a mean to explore the various measures (variables) underlying these constructs because, after
all, this research utilized a newly developed conceptualized model without a priori on the factor
loadings versus testing an already existing model on a new set of data. Further discussion on
EFA, CFA, and the criteria used for such decision in this research are described below in Table
33 based on literature review from Hurley, et al (1997), Kim, et al (1978), Stapleton (1997), and
Kline (1994).

124
Table 33: Comparison of EFA and CFA for this Research (Hurley, et al, 1997). EFA CFA This research Purpose, Suitable application, Factor assumption.
• To simplify interrelated measures, to explore underlying factor structure of a set of observed variables.
• To describe, summarize or reduce data to make them more easily understood.
• To build new theory.
• To examine causal relationships between variables based on a priori hypotheses/loadings, to confirm such relationships between factors and constructs.
• To test hypotheses about population data based on sample data.
• To confirm existing theory
• Because this research hypothesizes the underlying factors for each 3 construct using a newly conceptualized model, EFA will be used.
• CFA could be used in the future to confirm the factor structure theorized in this research using other sample data.
Limitations • EFA-yielded factor structure dependent on the mechanics of extraction and rotation procedures.
• Researcher’s accurate judgment of the constructs and their underlying factors critical.
• Still little theoretical foundation.
• Researcher must possess large amount of knowledge on the research subject.
• This research will follow generally-accepted EFA procedures.
Scale/Survey development
• Can be more appropriate due to factor loads on all factors.
• May be suitable for researcher-inherit surveys where researchers have little control over the design or administration of the survey.
• May be more suitable for researcher-control surveys where researchers have control over development and administration of the survey instruments, although CFA will probably not fit the data (too restrictive)
• Although this research has developed the survey questions, this research will use EFA due to the factor load aspect for the survey.
The following steps were followed when conducting the EFA (Kim, et. Al 1978, Friel, 2005):
1) Compute correlation matrix of the variables (questions) to ensure the factorability of the data.
The following question should be answered: is the collinearity (common variance) among the
variables sufficient to justify EFA, i.e., do they measure the same thing? Is the data suitable
for EFA? Which sets of variables cluster together:
a) Calculate the Bartlett’s test of sphericity: this test (chi-square) is designed to test if the
correlation matrix for the variables is an “identity matrix” (the null hypothesis), i.e. that
all variables correlate only with themselves. The goal of the test was to reject the null
hypothesis, with the results of the test indicating that the intercorrelation matrix did not
come from a population with an intercorrelation “identity matrix”.
125
b) Kaiser-Meyer-Olkin measure’s of sampling adequacy: this test measures the percentage
of common variance among the questions for a specific construct. A minimum of 0.6 is at
least required, although 0.7 and above is a better indicator of factorability.
c) Correlation coefficients: there should be a sizeable number of correlation coefficients
higher than 0.3 to indicate that the data is suitable for EFA.
2) Identify the initial solution: once the factorability of the data was established, this research
generated an initial solution using SPSS principle component analysis (PCA) to extract an
initial set of factors for a specific construct. PCA tries to explain as much as possible of the
total variance by as few as possible factors. First communalities were determined for each
variable. These are the percentage of variance in the given variable explained by all the
factors. Although it is preferable that these communalities are high, the extent to which the
variable associated with a specific communality plays a role in the interpretation of the factor
is more critical. The number of factors for that construct was determined by the eigenvalues
obtained during the principle component analysis. The initial solution regarding the number
of factors that PCA extracted was also dependent on the eigenvalues of the variables.
a) Kaiser or K1 rule: only variables with an eigenvalue greater than 1 should be considered,
as they explain more variance than a single variable. Eigenvalues represent the
unit/proportion of total variance of all the variables accounted by a factor. It should be
noted that the cumulative percentage of variance of those variables with eigenvalues
greater than 1 should be close to the KMO reading.
b) Cattell’s scree plot is another way to determine the number of underlying factors in a
construct. It represents each eigenvalue associated with each extracted factor. At the
126
point where the plot starts to level off in a linear manner often indicates the number of
factors to select for a specific construct.
3) Execute factor rotation: if more satisfactory results are desired, and if one or more
variable/question loads about the same on more than one factor (see next bullet), additional
steps must be taken to clarify the factor structure. Factor rotation, using SPSS was used to
clarify these patterns. Rotation was used in the research to help separate each variable
according to a single factor. This research proposed to run Varimax because it minimizes the
incidence of variables that have high loadings on each given factor.
4) Compute factor loadings: once the most satisfactory structure is found, this research assessed
if the factor loading for each variables was significant (greater than 0.5) in sample size less
than 100). Factor loadings are the correlation coefficient between the variables and the
factors and obtained from the component matrix., then this variable will be excluded from
the analysis.
5) Compute factor scores: using Principal Component Analysis (PCA) (in SPSS factor scores
matrix), this research calculated the factor scores to be used later on in hypotheses testing
(correlation analysis in this research). This step yielded a factor score weight for each
variable per each factor, which was then multiplied by the value of each question (obtained
from the survey) and then added to determine the values of each factor for each respondent.
Table 34 summarizes the EFA procedures.

127
Table 34: EFA Procedures.
Factor Analysis Procedures
Steps Results Purpose Threshold
1. Develop correlation matrix between all variables (questions) within a specific construct.
•Compute Correlation coef ficient matrix.
•Determine if data is f actorable.•Determine a priori which var iables cluster together.
•Substantial number of correlation coefficients > 0.3.
2. Run principal component analysis (or other extraction methods).
•Compute Communalities for the variables (% of variance in given variable explained by the extracted the f actors.
•Indicate if variables are reliable indicators.
•NA, although higher is bett er t han lower, although variable role in factor interpretation is more critical.
• Compute Eigen values for the variables (proportion of total variance of all variables accounted by a factor•Cattell’s scree plot
•Determine the number of potential fact ors (# of var iables with values >1).
• Eigen value >1
3. Rotate factors •Improve f actor loadings for each variables to get better model.
•Assure that variables highly load on one fact or only.
• Factor loading > 0.4 = correlation coefficient between variable and factor.
4. Get factor scores • Compute Score (weight) for each variable.
• Use later on hypotheses t esting to measure constructs.
•NA
Figure 9 shows how this research intended to use FA for construct validity. As indicated, this
research conducted the following:
• PR Maturity Construct: 4 FA’s for routine, gate, post-mortem, and focused-learning
reviews.
• PR Performance Construct: 4 FA’s for routine, gate, post-mortem, and focused-learning
reviews.
• Project Performance: 1 FA.

128
PR Maturity
PR Performance
Project Performance
Post-Mortem
Focused-learningGateRoutine
Construct Validity: Factor Analyses
Post-Mortem
Focused-learningGateRoutine
H1 H2
H3
FA#1 FA#2 FA#3 FA#4 FA#5 FA#6 FA#7 FA#8
FA#9
9 factor analyses
Figure 9: Construct Validity of the Survey.
3.3.4.2. Reliability Analysis
After establishing the final structure of the survey data collection instrument, Cronbach's alpha
was calculated for investigating the internal consistency of the survey or reliability of the survey
(ability to yield consistent results each time it is applied under same setting) through establishing
whether or not each factor within each construct reliably reflects the structure of its construct.
Cronbach’s alpha should be used for questions measuring the same factors, and is most
appropriately used when the items measure different substantive variables within a single
construct (Girden, 2001). Cronbach’s alpha ranges in value from 0 to 1. The higher the score, the
more reliable the generated scale, or survey data collection instrument. Nunnaly (1978) indicted
that 0.7 was an acceptable reliability coefficient, although lower thresholds (0.5), especially for
newly developed concepts, are sometimes used in the literature.
129
Once the research conducted each factor analysis and developed the underlying structure for
each review within each construct, then it performed reliability analysis with SPSS’s Cronbach’s
alpha for each factor found in the FA analyses. For example, assume that the research found 4
factors for routine reviews for the PR maturity construct, then the research would conduct 4
reliability analyses for each of the 4 factors.
3.4. Data Analysis
In this section, the statistical methods used to manipulate the data and test the hypotheses are
described:
3.4.1. Descriptive Statistics:
These numerical measures were computed to summarize and describe the data collected. This
research computed these statistics for each question, type of reviews, and construct:
• Measures of central tendency. Mean (arithmetic average), mode (most frequent value),
and median (middle value when data is arranged in ascending order) will be calculated.
• Measures of variation. Standard deviation (average distance of a set of scores from the
mean) will also be computed for each question.
3.4.2. Hypothesis Testing:
Because this research intended to show that there is a positive association between
1) project review maturity and project review performance,
2) project review maturity and project performance, and

130
3) project review performance and project performance,
correlation analysis was used. Depending on the number of answered surveys, either Pearson
Product coefficient of correlation or Spearman’s non-parametric rank correlation coefficient
were going to be used. Pearson’s coefficient would be chosen if there were at least 30 (rule of
thumb for the size of a “large” sample) fully answered surveys and if the distribution of the data
seems normally distributed. Spearman’s coefficient would be used if there were fewer than 30
answred surveys available or if the distribution of the data could not be found to be normally
distributed. 3 Correlation analyses were conducted for the 4 types of reviews (routine, gate, post-
mortem, and focused-learning) as well as for “an overall” PR maturity, PR performance, and
project performance. Therefore the total correlation analyses was 15. The “overall” values for
PR maturity were obtained by weight-averaging the values of the 4 types of reviews (routine,
gate, post-mortem, and focused-learning) obtained during the FA analyses. The weight-
averaging was also used for the “overall” PR performance construct.
This research intended to test the following correlation hypotheses for the constructs and
subconstructs as shown in Figure 4 at the beginning of the Chapter:
• Overall PR matutity, overall PR performance, and project performance (H1, H2, and
H3),
• Routine PR matutity, routine PR performance, and project performance (H1a, H2a,
and H3a),
• Gate PR matutity, gate PR performance, and project performance (H1b, H2b, and
H3b),
131
• Post-Mortem PR matutity, post-mortem PR performance, and project performance
(H1c, H2c, and H3c),
• Focused-Learning PR matutity, focused-learning PR performance, and project
performance (H1d, H2d, and H3d),
Therefore this research conducted 15 correlation analyses. The following is a description of the
hypotheses for “overall” PR maturity, PR performance, and project performance (H1, H2, and
H3). The same applied to routine review hypothese (H1a, H2a, and H3a), to gate review
hypothese (H1b, H2b, and H3b), post-mortem review hypotheses (H1c, H2c, and H3c), and
focused-learning review hypotheses (H1d, H2d, and H3d). Only a description of hypotheses for
the “overall” PR maturity, PR performance, and project performance are given below:
Hypothesis 1: H1. The higher the “overall” project review maturity, the higher the “overall”
project review performance. This hypothesis assumes a positive relationship (correlation) with
“overall” PR maturity and “overall” PR performance, therefore:
o H10 (null hypothesis): there is no correlation between “overall” PR maturity and
PR performance (ρ=0).
o H11 (alternate hypothesis): there is a positive relationship between “overall” PR
maturity and PR performance (ρ>0).
Hypothesis 2: H2. The higher the “overall” project review performance, the higher the “overall”
project performance. This hypothesis assumes a positive relationship (correlation) with “overall”
PR performance and “overall” project performance, therefore:
132
o H20 (null hypothesis): there is no correlation between “overall” PR performance
and roject performance (ρ=0).
o H21 (alternate hypothesis): there is a positive relationship between “overall” PR
performance and project performance (ρ>0).
Hypothesis 3: H3. The higher the “overall” project review maturity, the higher the “overall”
project performance. This hypothesis assumes a positive relationship (correlation) with “overall’
PR maturity and “overall” project performance, therefore:
o H30 (null hypothesis): there is no correlation between “overall” PR maturity and
roject performance (ρ=0).
o H31 (alternate hypothesis): there is a positive relationship between “overall” PR
maturity and project performance (ρ>0).
As previously mentioned, to test all hypotheses, t-test (Pearson’s correlation) or ρ-test
(spearman’s rank correlation) were conducted with a significance level at α=0.1.
3.5. Comments
Through the administration of the proposed survey, this research intended to show for the first
time that there was a statistically significant positive relationship between project review
maturity and project review performance, project review maturity and project performance, and
between project review performance and project performance. If this research were not
successful at rejecting the null hypothesis (thus showing that there is no specific relationship
among the constructs) then additional scrutiny should be brought on the survey instrument to see

133
if it could be refined or modified. It should be noted that the lack of specific relationship between
the constructs could also be the result of the sample selection (non-randomized sample).
However, if this research, for the first time, were to statistically prove positive correlations
between the constructs, additional research in the area based on the results of this analysis could
and should be conducted. Depending on the potential relationship between the two constructs
(for example after plotting the data on PR maturity against the data on project performance)
regression analysis might be conducted to further investigate the overall relationship between PR
maturity and project performance.. The positive impact of this potential research would clearly
show organizations the significance of improving project review process efficiency in order to
improve project performance.
3.6. Conclusion
In this Chapter, this research has presented the definitions of the constructs in the conceptual
model and their relationships (conceptualization), and also described the research methodology it
intended to use to test the hypotheses set forth (operationalization). The next steps were to
administer the data collection instruments, collect the results, analyze and interpret the results.
Chapter 4 describes these findings.

134
CHAPTER FOUR: DATA COLLECTION DESCRIPTION AND ANALYSIS – HYPOTHESIS TESTING
4.1. Introduction
This Chapter describes the data collection instruments that this research utilized in order to test
the hypotheses (survey) and identify the PR barriers and enablers (observations from attending a
post-mortem review at KSC and written open-ended interview questions). First, a description
and analysis (construct validity and reliability) of the survey is provided. Then, the research
hypotheses are tested. Furthermore, statistical analysis of the Question #1 results is provided to
assess the occurrence of each review type. In addition, a narrative of the answers provided by the
respondents to the open-ended questions is presented, as well as an account of the observations
from the attended review. Finally, the research hypotheses are tested and the results provided in
the last section of this Chapter.
4.2. The Survey Data Collection Instrument
4.2.1. Constructs and Conceptual Model
In order to test the hypotheses, the constructs need to be quantified. This research developed a
survey data collection instrument in order to give measurements to the constructs for further
statistical analysis. The questions were developed based on the areas of project review important
in the literature review. The purpose of the survey was to establish some numerical values to the
constructs of: 1) overall project review maturity, 2) overall project review performance, and 3)
project performance. The overall PR maturity and PR performance are the averages of the sub-
135
construct values of the four types of reviews as defined by this research based on the literature
review:
• Routine reviews: current status debriefing meetings: these reviews focus on the status and
challenges of the project. Potential challenges are also identified during theses reviews
and addressed early to avoid future, more serious obstacles.
• Gate reviews: status reports and current PM implications: these reviews focus on the
status, challenges of the project during a specific project life cycle or important
milestone, as well as the associated underlying managerial issues. The goal of these
reviews is to make sure that any variance from planned outcome is caught before it is too
late or costly to fix, and to understand the root causes (both technical and managerial)
behind it.
• Post-mortem reviews/PM reviews: post-mortem, end-of-project reviews: these reviews
focus on Lessons Learned within the project. These reviews are like “summary” project
reviews, based on previous routine and gate reviews, where project history, challenges,
problem causes, and lessons learned are gathered, summarized, and analyzed.
• Focused-learning reviews/FL reviews: reflective practices: these reviews focus on
Lessons Learned across projects for a specific time frame. This is a high-level review
meeting, which involves PM reviews from various projects and upon which the senior
management takes actions to adjust overall organizational PM processes to improve
performance.
As previously stipulated, the construct model is described in Figure 10:

136
PR Maturity
PR Performance
Project Performance
Post-Mortem
Focused-learningGateRoutine
Constructs and Underlying Factors – CM
Post-Mortem
Focused-learningGateRoutine
CorporateCulture
KnowledgeTransfer
PRlogistics
ManagerialBuy-in
Impact On project
performance
Levels ofLearning
AchievementOf
objectives
H1 H2
H3
Figure 10: Construct Model.
The survey results will be used to measure the constructs and test the hypotheses of this research.
4.2.2. Proposed Hypotheses to Be Tested with Survey Results
This research intended to test the hypotheses H1, H2, and H3, not only at the overall PR
maturity, PR performance, and project performance, but also at each individual review type (for
example with regard to routine project reviews: How is routine PR maturity correlated to routine
PR performance? How is routine PR performance related to project performance? How is routine
PR maturity related to project performance?)
Below are all 15 hypotheses that this research intend to test:
• Overall hypotheses
o H1: The higher “overall” PR maturity, the higher “overall” PR performance.
137
H1o (null hypothesis): there is no correlation between “overall” PR
maturity and “overall” PR performance.
H11 (alternative hypothesis): “Overall” PR maturity and “overall” PR
performance are positively correlated.
o H2: The higher “overall” PR performance, the higher project performance.
H2o (null hypothesis): there is no correlation between “overall” PR
performance and project performance.
H21 (alternative hypothesis): “Overall” PR performance and project
performance are positively correlated.
o H3: The higher “overall” PR maturity, the higher project performance.
H3o (null hypothesis): there is no correlation between “overall” PR
maturity and project performance.
H31 (alternative hypothesis): “Overall” PR maturity and project
performance are positively correlated.
• Routine review hypotheses
o H1a: The higher routine PR maturity, the higher routine project review
performance.
H1a0 (null hypothesis): there is no correlation between routine PR
maturity and routine PR performance.
H1a1 (alternative hypothesis): routine PR maturity and PR performance
are positively correlated.
o H2a: The higher routine PR performance, the higher the project performance
138
H2ao (null hypothesis): there is no correlation between routine PR
performance and project performance.
H2a1 (alternative hypothesis): routine PR performance and project
performance are positively correlated.
o H3a: The higher routine project review maturity, the higher project performance.
H3ao (null hypothesis): there is no correlation between routine PR
maturity and project performance.
H3a1 (alternative hypothesis): routine PR maturity and project
performance are positively correlated.
• Gate review hypotheses
o H1b: The higher gate PR maturity, the higher gate project review performance.
H1b0 (null hypothesis): there is no correlation between gate PR maturity
and gate PR performance.
H1b1 (alternative hypothesis): gate PR maturity and gate PR performance
are positively correlated.
o H2b: The higher gate PR performance, the higher project performance.
H2bo (null Hypothesis): there is no correlation between gate PR
performance and project performance.
H2b1 (alternate hypothesis): gate PR performance and project performance
are positively correlated.
o H3b: The higher gate project review maturity, the higher project performance.
H3bo (null hypothesis): there is no correlation between gate PR maturity
and project performance.

139
H3b1 (alternative hypothesis): gate PR maturity and project performance
are positively correlated.
• Post-mortem review hypotheses
o H1c: The higher post-mortem PR maturity, the higher post-mortem PR
performance.
H1c0 (null hypothesis): there is no correlation between post-mortem PR
maturity and post-mortem PR performance.
H1c1 (alternative hypothesis): post-mortem PR maturity and post-mortem
PR performance are positively correlated.
o H2c: The higher post-mortem PR performance, the higher project performance.
H2co (null Hypothesis): there is no correlation between post-mortem PR
performance and project performance.
H2c1 (alternative hypothesis): post-mortem PR performance and project
performance are positively correlated.
o H3c: The higher post-mortem project review maturity, the higher project
performance.
H3co (null Hypothesis): there is no correlation between post-mortem PR
maturity and project performance.
H3c1 (alternative hypothesis): post-mortem PR maturity and project
performance are positively correlated.
• Focused-learning review hypotheses
o H1d: The higher focused-learning PR maturity, the higher focused-learning
project review performance.
140
H1d0 (null hypothesis): there is no correlation between focused-learning
PR maturity and focused-learning PR performance.
H1d1 (alternate hypothesis): focused-learning PR maturity and focused-
learning PR performance are positively correlated.
o H2d: The higher focused-learning PR performance, the higher project
performance.
H2do (null hypothesis): there is no positive correlation between focused-
learning PR performance and project performance.
H2d1 (alternative hypothesis): focused-learning PR performance and
project performance are positively correlated.
o H3d: The higher focused-learning project review maturity, the higher project
performance.
H3do (null hypothesis): there is no correlation between focused-learning
PR maturity and project performance.
H3d1 (alternative hypothesis): focused-learning PR maturity and project
performance are positively correlated.
The following Table 35 summarizes the hypotheses that this research intends to test.
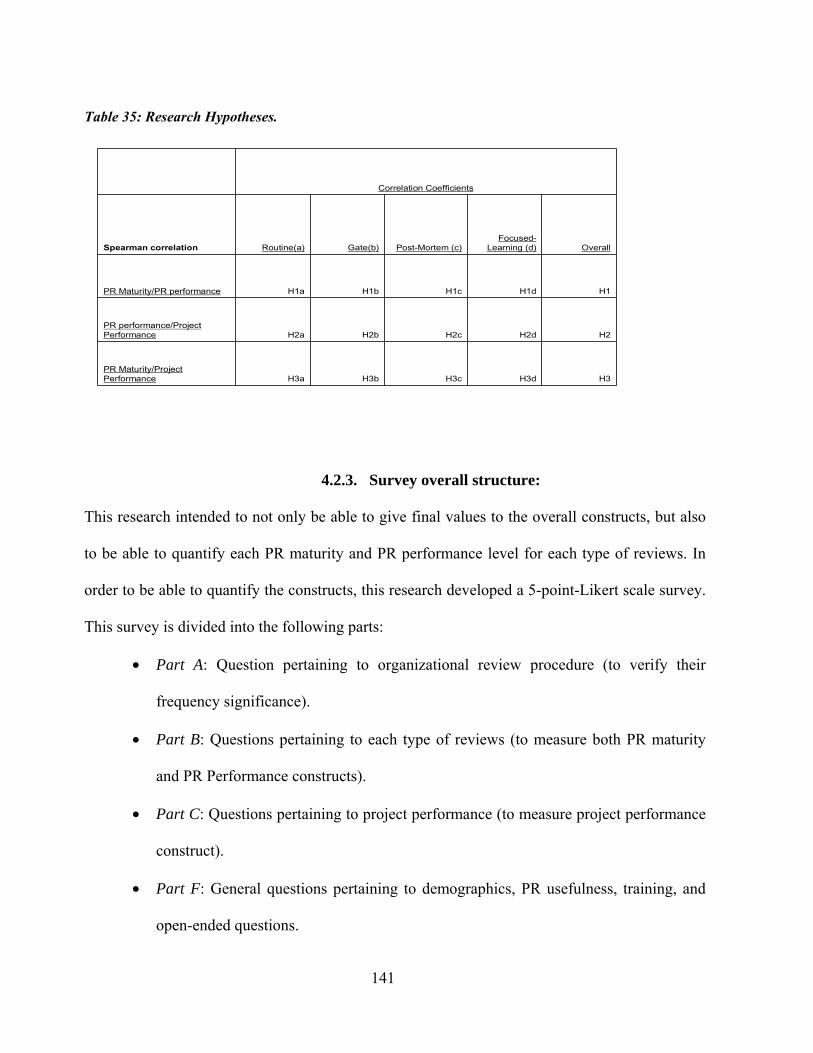
141
Table 35: Research Hypotheses.
Correlation Coefficients
Spearman correlation Routine(a) Gate(b) Post-Mortem (c)Focused-
Learning (d) Overall
PR Maturity/PR performance H1a H1b H1c H1d H1
PR performance/Project Performance H2a H2b H2c H2d H2
PR Maturity/Project Performance H3a H3b H3c H3d H3
4.2.3. Survey overall structure:
This research intended to not only be able to give final values to the overall constructs, but also
to be able to quantify each PR maturity and PR performance level for each type of reviews. In
order to be able to quantify the constructs, this research developed a 5-point-Likert scale survey.
This survey is divided into the following parts:
• Part A: Question pertaining to organizational review procedure (to verify their
frequency significance).
• Part B: Questions pertaining to each type of reviews (to measure both PR maturity
and PR Performance constructs).
• Part C: Questions pertaining to project performance (to measure project performance
construct).
• Part F: General questions pertaining to demographics, PR usefulness, training, and
open-ended questions.
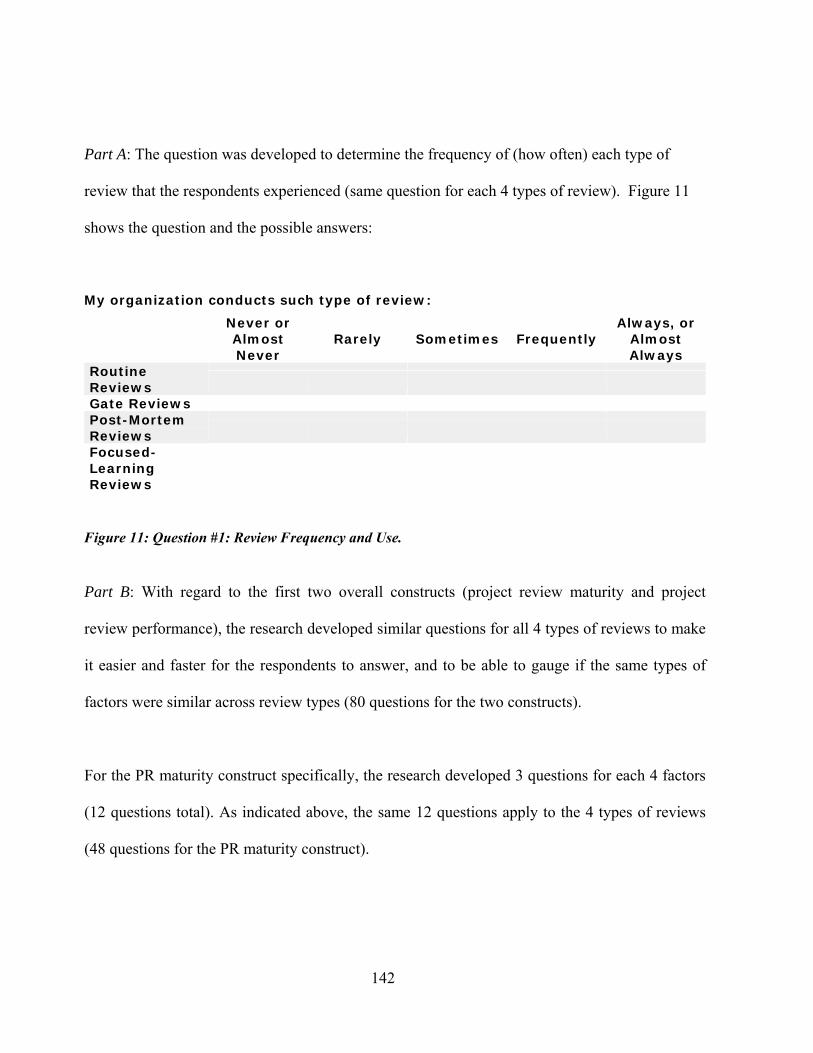
142
Part A: The question was developed to determine the frequency of (how often) each type of
review that the respondents experienced (same question for each 4 types of review). Figure 11
shows the question and the possible answers:
My organization conducts such type of review:
Never or Almost Never
Rarely Sometimes Frequently Always, or
Almost Always
Routine Reviews
Gate Reviews Post-Mortem Reviews
Focused-Learning Reviews
Figure 11: Question #1: Review Frequency and Use.
Part B: With regard to the first two overall constructs (project review maturity and project
review performance), the research developed similar questions for all 4 types of reviews to make
it easier and faster for the respondents to answer, and to be able to gauge if the same types of
factors were similar across review types (80 questions for the two constructs).
For the PR maturity construct specifically, the research developed 3 questions for each 4 factors
(12 questions total). As indicated above, the same 12 questions apply to the 4 types of reviews
(48 questions for the PR maturity construct).
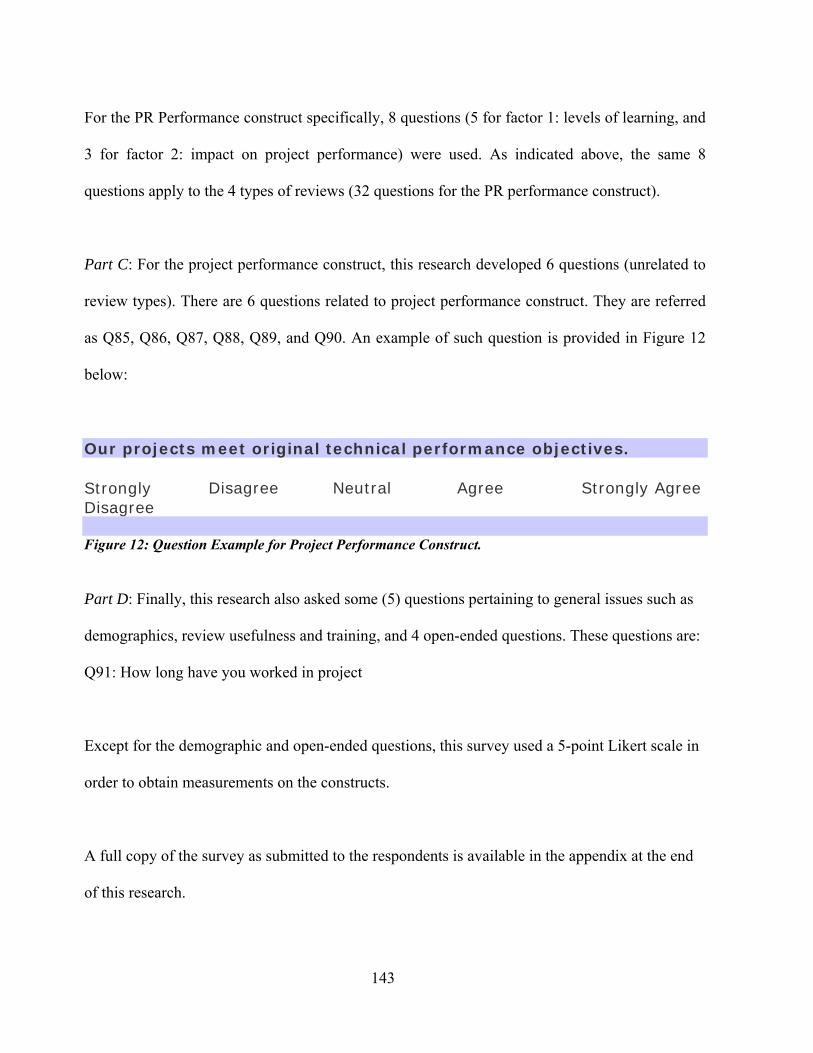
143
For the PR Performance construct specifically, 8 questions (5 for factor 1: levels of learning, and
3 for factor 2: impact on project performance) were used. As indicated above, the same 8
questions apply to the 4 types of reviews (32 questions for the PR performance construct).
Part C: For the project performance construct, this research developed 6 questions (unrelated to
review types). There are 6 questions related to project performance construct. They are referred
as Q85, Q86, Q87, Q88, Q89, and Q90. An example of such question is provided in Figure 12
below:
Our projects meet original technical performance objectives.
Strongly Disagree
Disagree
Neutral
Agree
Strongly Agree
Figure 12: Question Example for Project Performance Construct.
Part D: Finally, this research also asked some (5) questions pertaining to general issues such as
demographics, review usefulness and training, and 4 open-ended questions. These questions are:
Q91: How long have you worked in project
Except for the demographic and open-ended questions, this survey used a 5-point Likert scale in
order to obtain measurements on the constructs.
A full copy of the survey as submitted to the respondents is available in the appendix at the end
of this research.
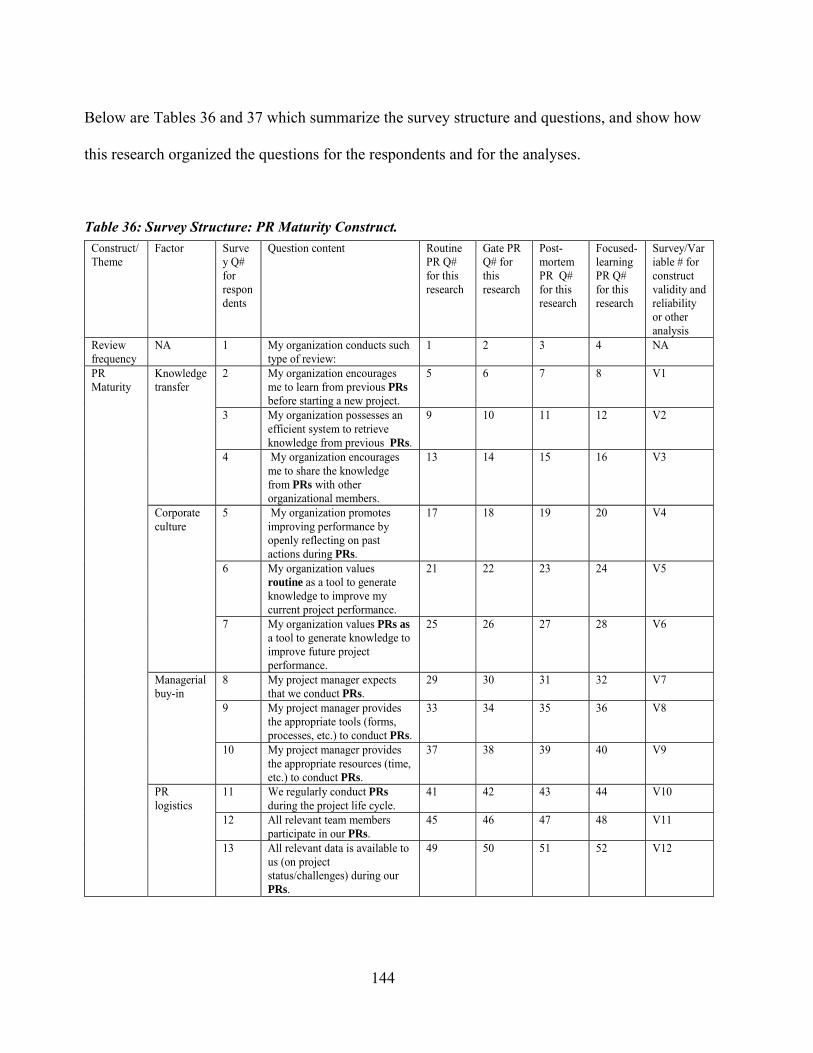
144
Below are Tables 36 and 37 which summarize the survey structure and questions, and show how
this research organized the questions for the respondents and for the analyses.
Table 36: Survey Structure: PR Maturity Construct. Construct/
Theme Factor Surve
y Q# for respondents
Question content
Routine PR Q# for this research
Gate PR Q# for this research
Post-mortem PR Q# for this research
Focused-learning PR Q# for this research
Survey/Variable # for construct validity and reliability or other analysis
Review frequency
NA 1 My organization conducts such type of review:
1 2 3 4 NA
2 My organization encourages me to learn from previous PRs before starting a new project.
5 6 7 8 V1
3 My organization possesses an efficient system to retrieve knowledge from previous PRs.
9 10 11 12 V2
Knowledge transfer
4 My organization encourages me to share the knowledge from PRs with other organizational members.
13 14 15 16 V3
5 My organization promotes improving performance by openly reflecting on past actions during PRs.
17 18 19 20 V4
6 My organization values routine as a tool to generate knowledge to improve my current project performance.
21 22 23 24 V5
Corporate culture
7 My organization values PRs as a tool to generate knowledge to improve future project performance.
25 26 27 28 V6
8 My project manager expects that we conduct PRs.
29 30 31 32 V7
9 My project manager provides the appropriate tools (forms, processes, etc.) to conduct PRs.
33 34 35 36 V8
Managerial buy-in
10 My project manager provides the appropriate resources (time, etc.) to conduct PRs.
37 38 39 40 V9
11 We regularly conduct PRs during the project life cycle.
41 42 43 44 V10
12 All relevant team members participate in our PRs.
45 46 47 48 V11
PR Maturity
PR logistics
13 All relevant data is available to us (on project status/challenges) during our PRs.
49 50 51 52 V12

145
Construct/ Theme
Factor Survey Q# for respondents
Question content Routine PR Q# for this research
Gate PR Q# for this research
Post-mortem PR Q# for this research
Focused-learning PR Q# for this research
Survey/Variable # for construct validity and reliability or other analysis
14 PRs help us gain knowledge on how well we are consistently following our PM procedures.
53 54 55 56 V13
15 PRs help us gain knowledge on the status of our project.
57 58 59 60 V14
16 PRs help us gain knowledge on the challenges of our project and control the potential problems.
61 62 63 64 V15
17 PRs help us gain knowledge on the PM procedures used in our project and their impact on project performance.
65 66 67 68 V16
Levels of learning
18 PRs help us gain knowledge on organizational procedures used in our project and their impact on project performance.
69 70 71 72 V17
19 PRs help us improve our project performance during the project life cycle.
73 74 75 76 V18
20 PRs help us improve our probability to deliver a successful project.
77 78 79 80 V19
PR Performance
Impact on project performance
21 PRs help us reduce the risk of potential project challenges.
81 82 83 84 V20
22 Our projects are delivered on planned time schedule.
85
23 Our projects meet original technical performance objective.
86
24 Our projects are delivered within planned costs.
87
25 Our customers are satisfied with the outcome of our projects.
88
26 We have a productive relationship with our contractors/suppliers
89
Project Performance
Achievement of project objectives
27 Our project team is satisfied with its deliveries.
NA
90
28 How long have you worked in projects?
91
29 How long have you been employed at your current job?
92
30 What is your primary role? 93
General Questions: Demographics PR Usefulness & Training
31 Do you personally feel that project reviews (any types) are valuable tools for improving performance?
94
32 Have you received any type of training or guidelines to conduct project reviews?
95
33 How would you describe your use of “routine” reviews?
96
34 How would you describe your use of “routine” reviews?
97
35 How would you describe your use of “routine” reviews?
98
Written Open-ended Interview Questions
36 How would you describe your use of “routine” reviews?
99
Table 37: Survey Structure: PR Performance and Project Performance Constructs, General Questions and Written Open-ended Interview Questions
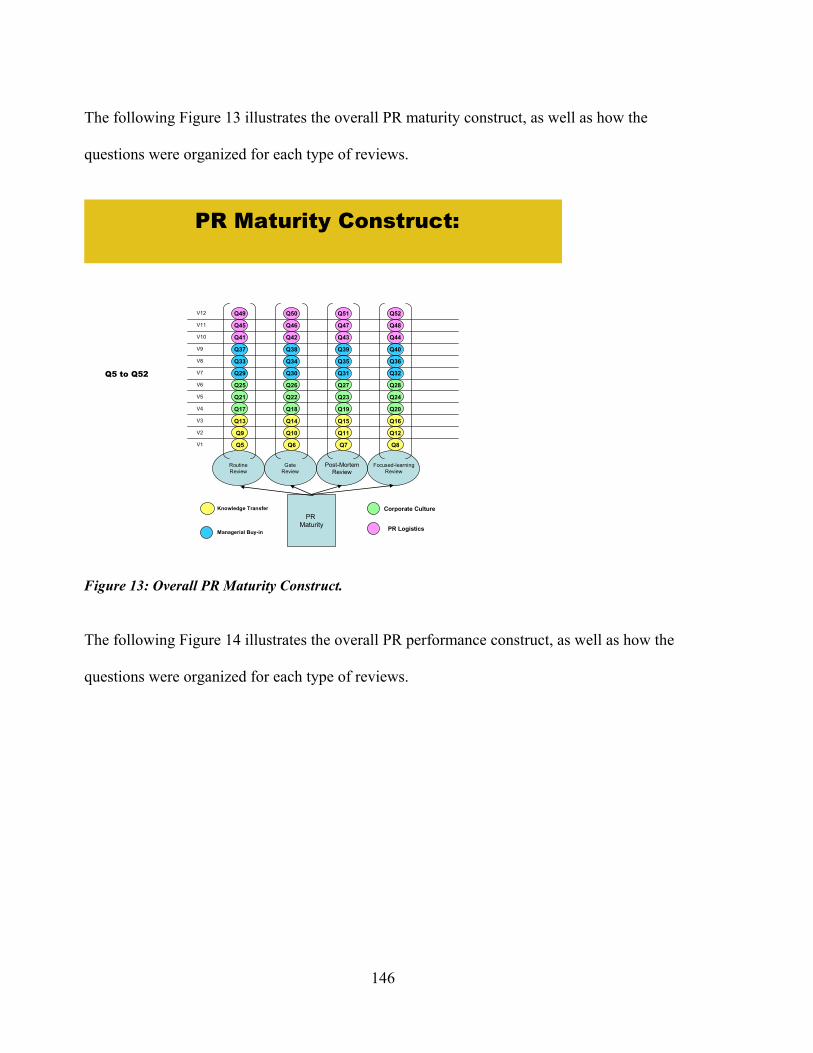
146
The following Figure 13 illustrates the overall PR maturity construct, as well as how the
questions were organized for each type of reviews.
PR Maturity Construct:
PR Maturity
Post-MortemReview
Focused-learningReview
GateReview
RoutineReview
Q13
Q9
Q5
Q22
Q18
Q14
Q10
Q6
Q23
Q19
Q15
Q11
Q7
Q24
Q20
Q16
Q12
Q8
Q25
Q21
Q17
Q34
Q30
Q26
Q35
Q31
Q27
Q36
Q32
Q28
Q45
Q41
Q37
Q33
Q29
Q50
Q46
Q42
Q38
Q51
Q47
Q43
Q39
Q52
Q48
Q44
Q40
Q49
Knowledge Transfer
Managerial Buy-in PR Logistics
Corporate Culture
V1
V2
V3
V4
V5
V6
V7
V8
V9
V10
V11
V12
Q5 to Q52
Figure 13: Overall PR Maturity Construct.
The following Figure 14 illustrates the overall PR performance construct, as well as how the
questions were organized for each type of reviews.

147
PR Performance Construct:
PR Performance
Post-MortemReview
Focused-learningReview
GateReview
RoutineReview
Q61
Q57
Q53
Q70
Q66
Q62
Q58
Q54
Q71
Q67
Q63
Q59
Q55
Q72
Q68
Q64
Q60
Q56
Q73
Q69
Q65
Q82
Q78
Q74
Q83
Q79
Q75
Q84
Q80
Q76
Q81
Q77
Levels of learningImpact on project performance
V13
V14
V15
V16
V17
V18
V19
V20
Q53-Q84
Figure 14: Overall PR Performance Construct.
4.2.4. Survey Results: General Questions (Demographics, PR Usefulness and
Training).
The survey was distributed electronically (surveymonkey.com). The targeted sample was
composed of project managers or other professionals working in a project environment in
organizations in Central Florida from different industries. However, the sample is non-
probabilistic and non-randomized. Table 38 shows the targeted organizations and the number of
respondents per organizations.

148
Table 38: Surveyed Organizations. Organizations Number of
respondents Kennedy Space Center 25The Boeing Company 6Siemens PG 6World Disney World – Disney Park and Resorts Worldwide
4
Harris Corporation 2Darden 1 Total
44
Respondents were free to skip questions and to answer only those they felt comfortable with.
Furthermore, some respondents may have started the survey, but did not finish it. Therefore there
were 17 cases with missing responses (from 1 to 87 out of 90). This research calculated the
percentage of unanswered response per question, and started to take out of the analysis the cases
with the most unanswered responses, until the percentage of “blank” answers for each question
was less than 10%. This treatment of missing values, made it possible to retain some of the
respondents that did not answer some of the questions (limiting the shrinkage of the sample)
while being able to use the average of each question as the value of the missing answer when
applicable (because the “blank” count is less than 10%).
Table 39 shows the final count per organization.
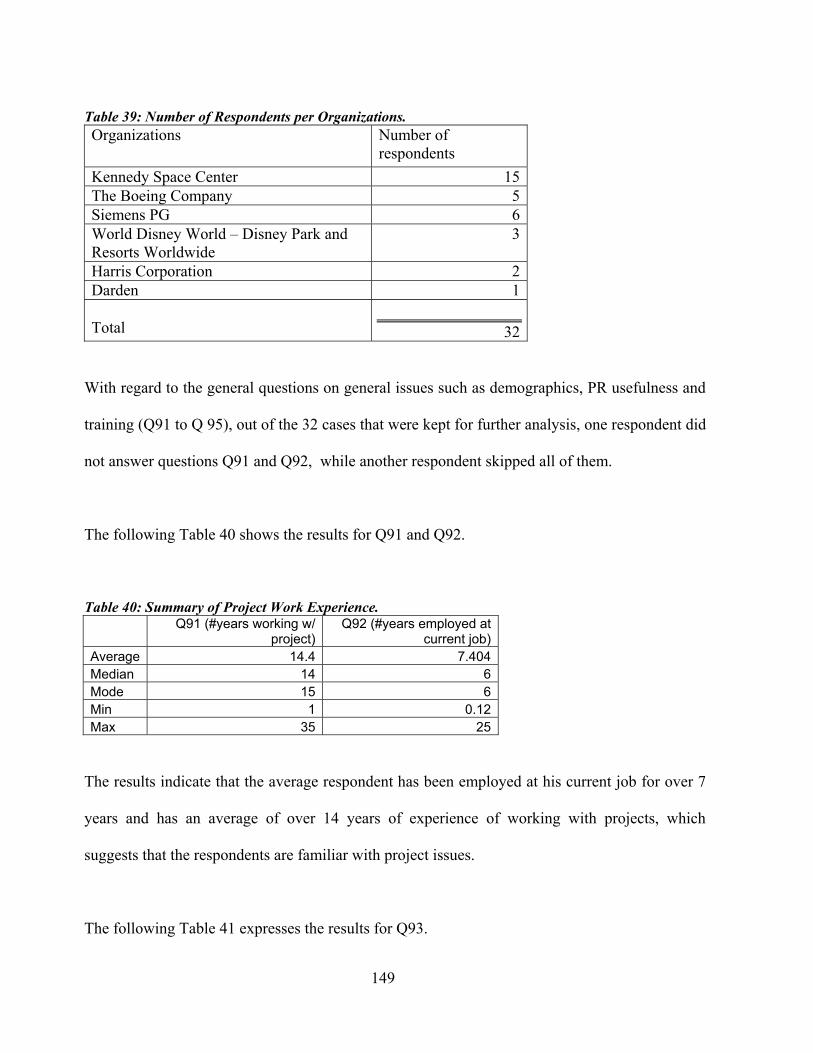
149
Table 39: Number of Respondents per Organizations. Organizations Number of
respondents Kennedy Space Center 15The Boeing Company 5Siemens PG 6World Disney World – Disney Park and Resorts Worldwide
3
Harris Corporation 2Darden 1 Total
32
With regard to the general questions on general issues such as demographics, PR usefulness and
training (Q91 to Q 95), out of the 32 cases that were kept for further analysis, one respondent did
not answer questions Q91 and Q92, while another respondent skipped all of them.
The following Table 40 shows the results for Q91 and Q92.
Table 40: Summary of Project Work Experience.
Q91 (#years working w/
project) Q92 (#years employed at
current job)Average 14.4 7.404Median 14 6Mode 15 6Min 1 0.12Max 35 25
The results indicate that the average respondent has been employed at his current job for over 7
years and has an average of over 14 years of experience of working with projects, which
suggests that the respondents are familiar with project issues.
The following Table 41 expresses the results for Q93.

150
Table 41: Summary of Job Status. Q93: Primary role
Project Manager
Project Team Member
Other
Current Primary role
55% 32% 13%
The results indicate that overwhelmingly, the respondents (87%) are either project managers or
project team members, therefore well aware of project issues.
Table 42 shows the results for Q94 and Q95.
Table 42: Summary of Answers to Review Usefulness and Training. Q94: PRs are
useful?Q95: Any PR
training?Yes 94% 58%No 0% 42%Somewhat 6% NA
These results show that the vast majority of the respondents believe that PRs play an important
role in project management, and that the majority of the respondents have received some type of
training to conduct reviews.
The demographics results indicate that the sample used in this research is composed by a large
majority of project team members or managers experienced in project issues, thus increasing the
quality of the answers given in this survey.

151
4.2.5. Survey Construct Validity, Score Development, and Reliability
Construct validity refers to the accuracy of the measurement tool to measure what it intends to
measure. Are the constructs properly measuring the construct? Is the factor structure accurate?
Can the survey be simplified? How do the variables (questions) load on the factors? Factor
analysis (FA) will be conducted to verify the construct validity of the survey (conceptual model)
and the relevance of the questions in the survey (loading of the questions in the survey for each
factor). As explained in the previous Chapter, this research proposes to use exploratory factor
analysis (EFA) for each construct in the conceptual model, as a mean to explore the various
measures (variables) underlying these constructs because, this research utilizes a newly
developed theoretical conceptualized model without a priori on the factor loadings versus testing
an already existing model on a new set of data. In addition FA will also develop score values to
be used for the measurement of each sub-construct.
Table 43 provides a summary of the FA steps this research intends to follow to establish
construct validity and better determine the construct structure.

152
Table 43: Factor Analysis Processes. Factor Analysis: Steps – Summary
Steps Questions Answered Statistical tools Threshold • Is the data suitable for FA? • Correlation
Matrix (all variables)
• Substantial numbers of correlations >0.3
• No correlations >0.9 (extreme multicollinearity)
• Is the data suitable for FA? • KMO measure of sampling adequacy
• (Kaiser-Meyer-Okin)
• Minimum of 0.5 • If 0.5<KMO<0.7:
mediocre data set • If 0.7<KMO<0.8: good
data set • If KMO>0.8: excellent
data set • Is the data suitable for FA? • Bartlett’s test of
sphericity • P<0.5 (The matrix is not
an identity matrix)
1. Determine if FA applicable to data set
• Is the data suitable for FA? • 1st Extraction with SPSS PCA: Communalities
• Although not always a conclusive test, this test indicates that the more communalities >0.5 show that there are more variables explained by the factors
• How many potential factors are there?
• 1st Extraction with SPSS PCA: Eigenvalues – Kaiser 1
• Number of components with Eigenvalues > 1
2. Determine # of factors
• How many potential factors are there?
• Scree plot • Where plot levels off to a linear decreasing pattern show number of components.
• Optimize the factor structure using Varimax
• Factor rotation • Variable loadings are maximized on one factor for easier interpretation.
3. Develop factor structure • Which variables load more on which
factor? • Variables and
factors • Using rotation results,
obtain factor loading matrix
4. Determine factor score and construct computation
• What is the factor score for each variable for each factor?
• Find the value of the construct for each respondent by 1) For each factor: multiplying each variable (question) value with the corresponding factor score, 2) Sum these values for each factor to find the overall factor score for each respondent, 3) Compute the overall construct value by summing the product of each factor with its construct variance percent.
• Factor Score Matrix and Compute Construct final value (score development and construct calculation)
• Values are used to compute final construct value for each respondent
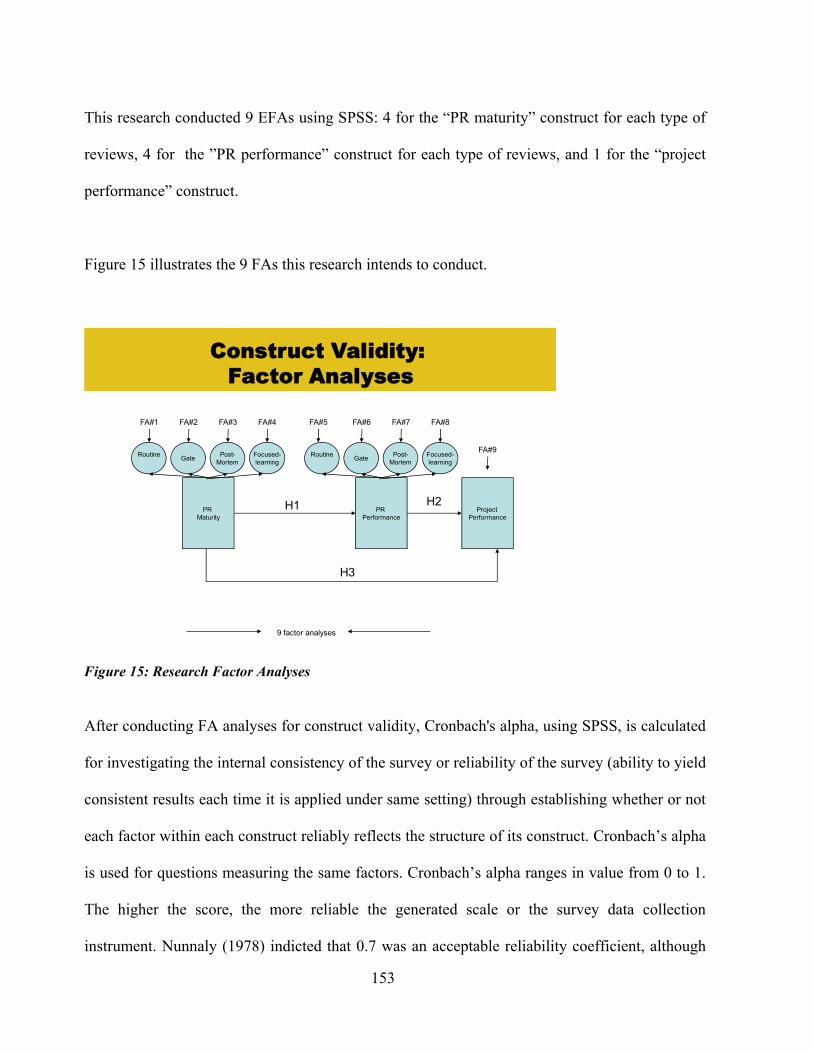
153
This research conducted 9 EFAs using SPSS: 4 for the “PR maturity” construct for each type of
reviews, 4 for the ”PR performance” construct for each type of reviews, and 1 for the “project
performance” construct.
Figure 15 illustrates the 9 FAs this research intends to conduct.
PR Maturity
PR Performance
Project Performance
Post-Mortem
Focused-learningGateRoutine
Construct Validity: Factor Analyses
Post-Mortem
Focused-learningGateRoutine
H1 H2
H3
FA#1 FA#2 FA#3 FA#4 FA#5 FA#6 FA#7 FA#8
FA#9
9 factor analyses
Figure 15: Research Factor Analyses
After conducting FA analyses for construct validity, Cronbach's alpha, using SPSS, is calculated
for investigating the internal consistency of the survey or reliability of the survey (ability to yield
consistent results each time it is applied under same setting) through establishing whether or not
each factor within each construct reliably reflects the structure of its construct. Cronbach’s alpha
is used for questions measuring the same factors. Cronbach’s alpha ranges in value from 0 to 1.
The higher the score, the more reliable the generated scale or the survey data collection
instrument. Nunnaly (1978) indicted that 0.7 was an acceptable reliability coefficient, although
154
lower thresholds, especially for newly developed concepts, are sometimes used in the literature
(such as 0.5). This research computed the Cronbach’s alpha for each factor (using the questions
that loaded on these factors) for each construct.
This research also used the results of the nine factor analyses to compute the factor scores to be
used to measure PR maturity and PR performance for each type of review sub-constructs, as well
as the project performance constructs. The measurements obtained for each type of reviews for
the PR maturity and PR performance constructs will be averaged in order to obtain an “overall”
PR maturity value, and an “overall” PR performance value.
Below are the research results of the nine (9) factor analyses, as well as the results of the
Cronbach’s alpha for each found factor for each construct. Due to the length of the analyses, this
research presents the detailed results for the PR maturity construct for routine reviews only and
the summarized results for the other eight (8) FAs.
4.2.5.1. PR Maturity Construct for Each Review Type
As stated above, this research conducted FA analyses for each type of review with regard to the
PR maturity constructs. This research presents below the detailed results for the PR maturity for
routine reviews, and the summarized results for gate, post-mortem, and focused-learning
reviews.
First the descriptive statistics were calculated.
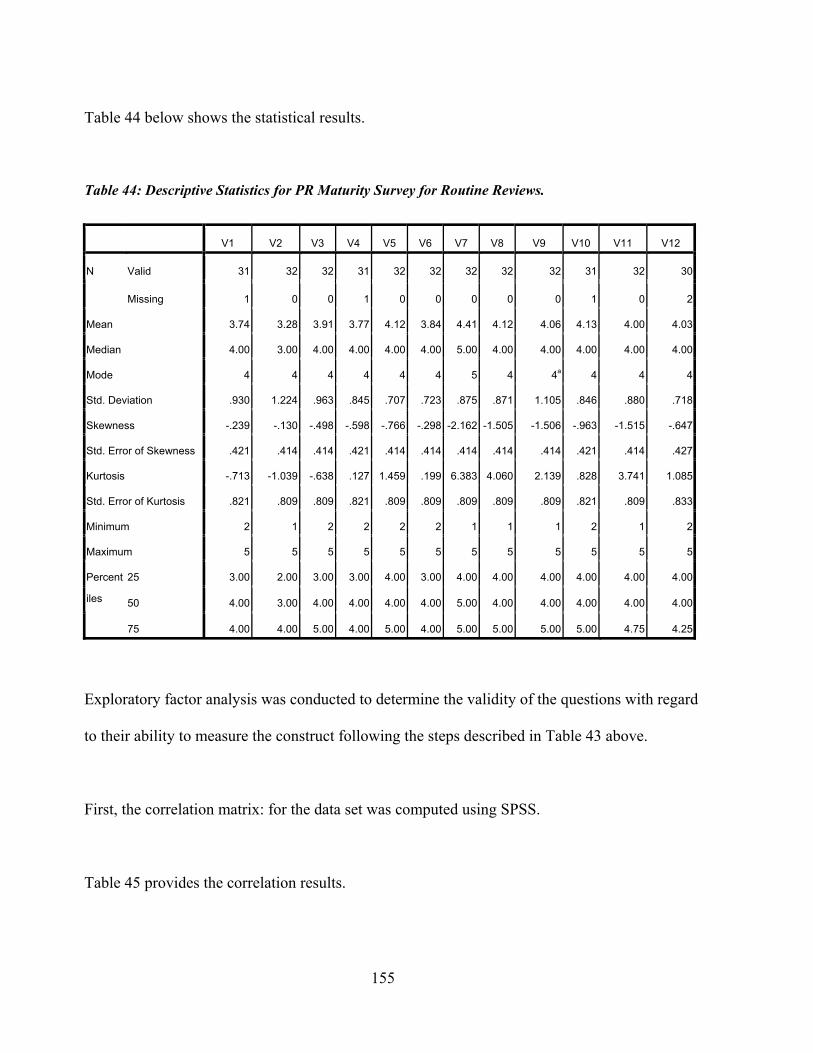
155
Table 44 below shows the statistical results.
Table 44: Descriptive Statistics for PR Maturity Survey for Routine Reviews.
V1 V2 V3 V4 V5 V6 V7 V8 V9 V10 V11 V12
Valid 31 32 32 31 32 32 32 32 32 31 32 30N
Missing 1 0 0 1 0 0 0 0 0 1 0 2
Mean 3.74 3.28 3.91 3.77 4.12 3.84 4.41 4.12 4.06 4.13 4.00 4.03
Median 4.00 3.00 4.00 4.00 4.00 4.00 5.00 4.00 4.00 4.00 4.00 4.00
Mode 4 4 4 4 4 4 5 4 4a 4 4 4
Std. Deviation .930 1.224 .963 .845 .707 .723 .875 .871 1.105 .846 .880 .718
Skewness -.239 -.130 -.498 -.598 -.766 -.298 -2.162 -1.505 -1.506 -.963 -1.515 -.647
Std. Error of Skewness .421 .414 .414 .421 .414 .414 .414 .414 .414 .421 .414 .427
Kurtosis -.713 -1.039 -.638 .127 1.459 .199 6.383 4.060 2.139 .828 3.741 1.085
Std. Error of Kurtosis .821 .809 .809 .821 .809 .809 .809 .809 .809 .821 .809 .833
Minimum 2 1 2 2 2 2 1 1 1 2 1 2
Maximum 5 5 5 5 5 5 5 5 5 5 5 5
25 3.00 2.00 3.00 3.00 4.00 3.00 4.00 4.00 4.00 4.00 4.00 4.00
50 4.00 3.00 4.00 4.00 4.00 4.00 5.00 4.00 4.00 4.00 4.00 4.00
Percent
iles
75 4.00 4.00 5.00 4.00 5.00 4.00 5.00 5.00 5.00 5.00 4.75 4.25
Exploratory factor analysis was conducted to determine the validity of the questions with regard
to their ability to measure the construct following the steps described in Table 43 above.
First, the correlation matrix: for the data set was computed using SPSS.
Table 45 provides the correlation results.
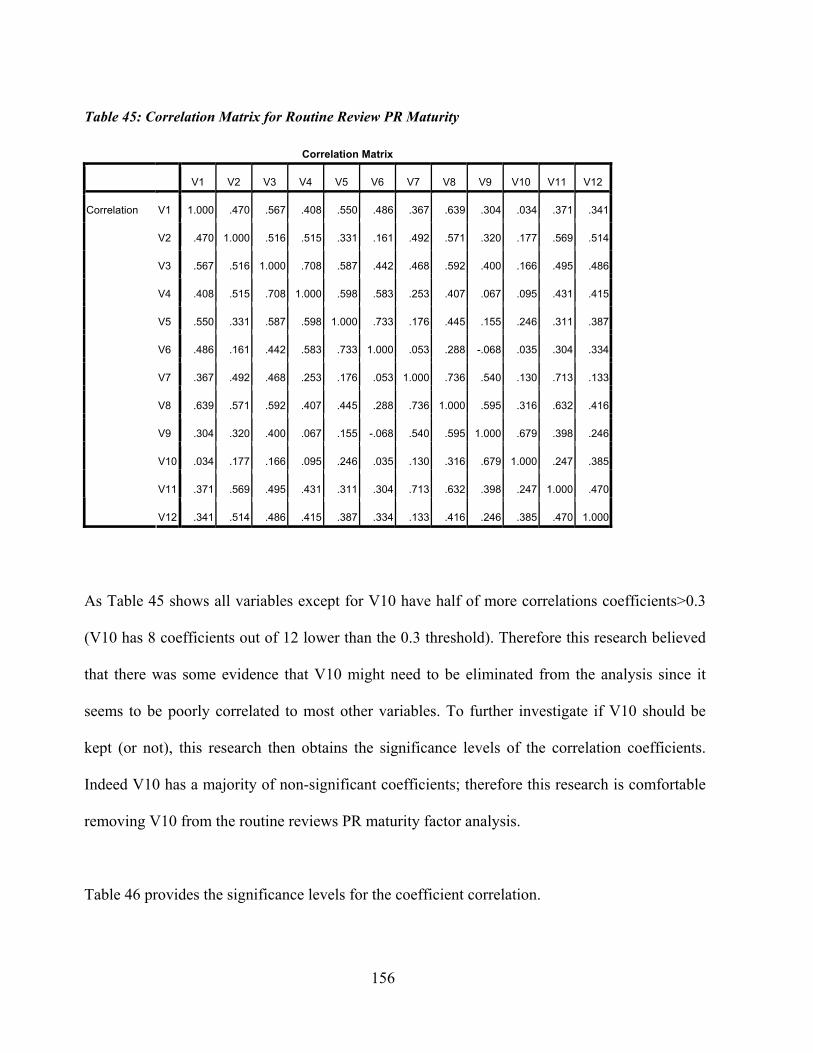
156
Table 45: Correlation Matrix for Routine Review PR Maturity
Correlation Matrix
V1 V2 V3 V4 V5 V6 V7 V8 V9 V10 V11 V12
V1 1.000 .470 .567 .408 .550 .486 .367 .639 .304 .034 .371 .341
V2 .470 1.000 .516 .515 .331 .161 .492 .571 .320 .177 .569 .514
V3 .567 .516 1.000 .708 .587 .442 .468 .592 .400 .166 .495 .486
V4 .408 .515 .708 1.000 .598 .583 .253 .407 .067 .095 .431 .415
V5 .550 .331 .587 .598 1.000 .733 .176 .445 .155 .246 .311 .387
V6 .486 .161 .442 .583 .733 1.000 .053 .288 -.068 .035 .304 .334
V7 .367 .492 .468 .253 .176 .053 1.000 .736 .540 .130 .713 .133
V8 .639 .571 .592 .407 .445 .288 .736 1.000 .595 .316 .632 .416
V9 .304 .320 .400 .067 .155 -.068 .540 .595 1.000 .679 .398 .246
V10 .034 .177 .166 .095 .246 .035 .130 .316 .679 1.000 .247 .385
V11 .371 .569 .495 .431 .311 .304 .713 .632 .398 .247 1.000 .470
Correlation
V12 .341 .514 .486 .415 .387 .334 .133 .416 .246 .385 .470 1.000
As Table 45 shows all variables except for V10 have half of more correlations coefficients>0.3
(V10 has 8 coefficients out of 12 lower than the 0.3 threshold). Therefore this research believed
that there was some evidence that V10 might need to be eliminated from the analysis since it
seems to be poorly correlated to most other variables. To further investigate if V10 should be
kept (or not), this research then obtains the significance levels of the correlation coefficients.
Indeed V10 has a majority of non-significant coefficients; therefore this research is comfortable
removing V10 from the routine reviews PR maturity factor analysis.
Table 46 provides the significance levels for the coefficient correlation.

157
Table 46: Significance levels for Correlation Coefficients – Routine Review PR Maturity Correlation Matrix
V1 V2 V3 V4 V5 V6 V7 V8 V9 V10 V12
V1 1.000 .426 .499 .385 .585 .572 .213 .589 .092 -.014 .271 .396
V2 .426 1.000 .557 .563 .477 .348 .552 .638 .183 .237 .611 .624
V3 .499 .557 1.000 .713 .612 .454 .386 .521 .179 .097 .419 .486
V4 .385 .563 .713 1.000 .613 .600 .224 .482 -.043 .087 .409 .415
V5 .585 .477 .612 .613 1.000 .732 .206 .587 .129 .211 .416 .474
V6 .572 .348 .454 .600 .732 1.000 .106 .494 -.108 -.017 .414 .322
V7 .213 .552 .386 .224 .206 .106 1.000 .573 .394 .215 .560 .407
V8 .589 .638 .521 .482 .587 .494 .573 1.000 .302 .356 .631 .810
V9 .092 .183 .179 -.043 .129 -.108 .394 .302 1.000 .768 .257 .215
V10 -.014 .237 .097 .087 .211 -.017 .215 .356 .768 1.000 .419 .401
V11 .271 .611 .419 .409 .416 .414 .560 .631 .257 .419 1.000 .692
Correlation
V12 .396 .624 .486 .415 .474 .322 .407 .810 .215 .401 .692 1.000
V1
.012 .003 .022 .001 .001 .138 .000 .320 .472 .082 .019
V2 .012
.001 .001 .005 .035 .001 .000 .176 .112 .000 .000
V3 .003 .001
.000 .000 .008 .021 .002 .181 .312 .013 .004
V4 .022 .001 .000
.000 .000 .126 .005 .413 .330 .015 .014
V5 .001 .005 .000 .000
.000 .147 .001 .256 .140 .014 .005
V6 .001 .035 .008 .000 .000
.295 .004 .293 .465 .014 .047
V7 .138 .001 .021 .126 .147 .295
.001 .019 .136 .001 .016
V8 .000 .000 .002 .005 .001 .004 .001
.059 .031 .000 .000
V9 .320 .176 .181 .413 .256 .293 .019 .059
.000 .094 .136
V10 .472 .112 .312 .330 .140 .465 .136 .031 .000
.013 .017
V11 .082 .000 .013 .015 .014 .014 .001 .000 .094 .013
.000
Sig. (1-tailed)
V12 .019 .000 .004 .014 .005 .047 .016 .000 .136 .017 .000
Removing V10 from the analysis is also rationalized by the KMO scores obtained before and
after removing the variables.
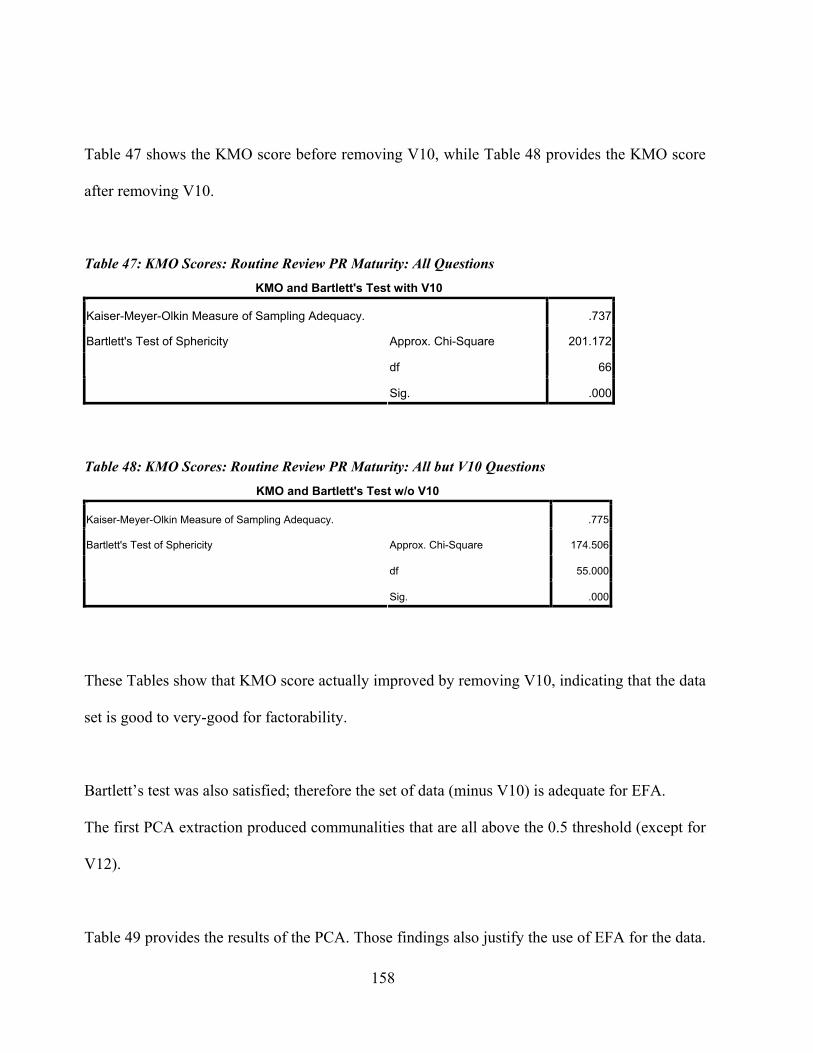
158
Table 47 shows the KMO score before removing V10, while Table 48 provides the KMO score
after removing V10.
Table 47: KMO Scores: Routine Review PR Maturity: All Questions KMO and Bartlett's Test with V10
Kaiser-Meyer-Olkin Measure of Sampling Adequacy. .737
Approx. Chi-Square 201.172
df 66
Bartlett's Test of Sphericity
Sig. .000
Table 48: KMO Scores: Routine Review PR Maturity: All but V10 Questions
KMO and Bartlett's Test w/o V10
Kaiser-Meyer-Olkin Measure of Sampling Adequacy. .775
Approx. Chi-Square 174.506
df 55.000
Bartlett's Test of Sphericity
Sig. .000
These Tables show that KMO score actually improved by removing V10, indicating that the data
set is good to very-good for factorability.
Bartlett’s test was also satisfied; therefore the set of data (minus V10) is adequate for EFA.
The first PCA extraction produced communalities that are all above the 0.5 threshold (except for
V12).
Table 49 provides the results of the PCA. Those findings also justify the use of EFA for the data.
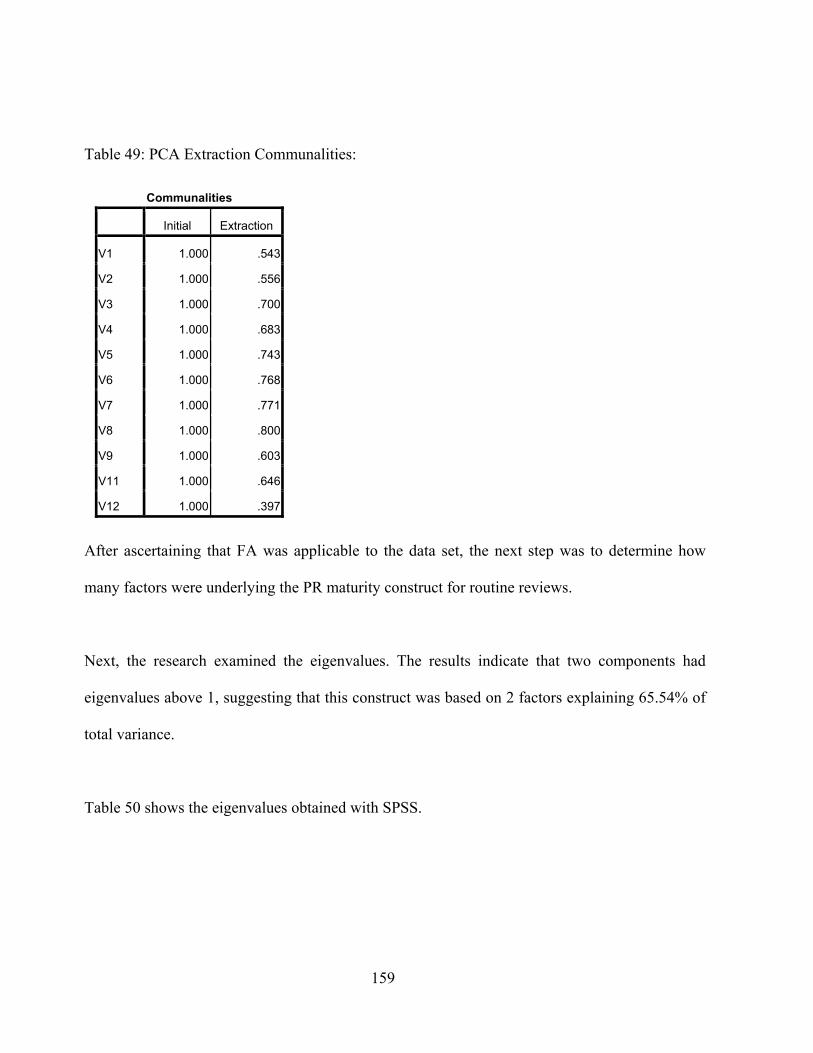
159
Table 49: PCA Extraction Communalities:
Communalities
Initial Extraction
V1 1.000 .543
V2 1.000 .556
V3 1.000 .700
V4 1.000 .683
V5 1.000 .743
V6 1.000 .768
V7 1.000 .771
V8 1.000 .800
V9 1.000 .603
V11 1.000 .646
V12 1.000 .397
After ascertaining that FA was applicable to the data set, the next step was to determine how
many factors were underlying the PR maturity construct for routine reviews.
Next, the research examined the eigenvalues. The results indicate that two components had
eigenvalues above 1, suggesting that this construct was based on 2 factors explaining 65.54% of
total variance.
Table 50 shows the eigenvalues obtained with SPSS.
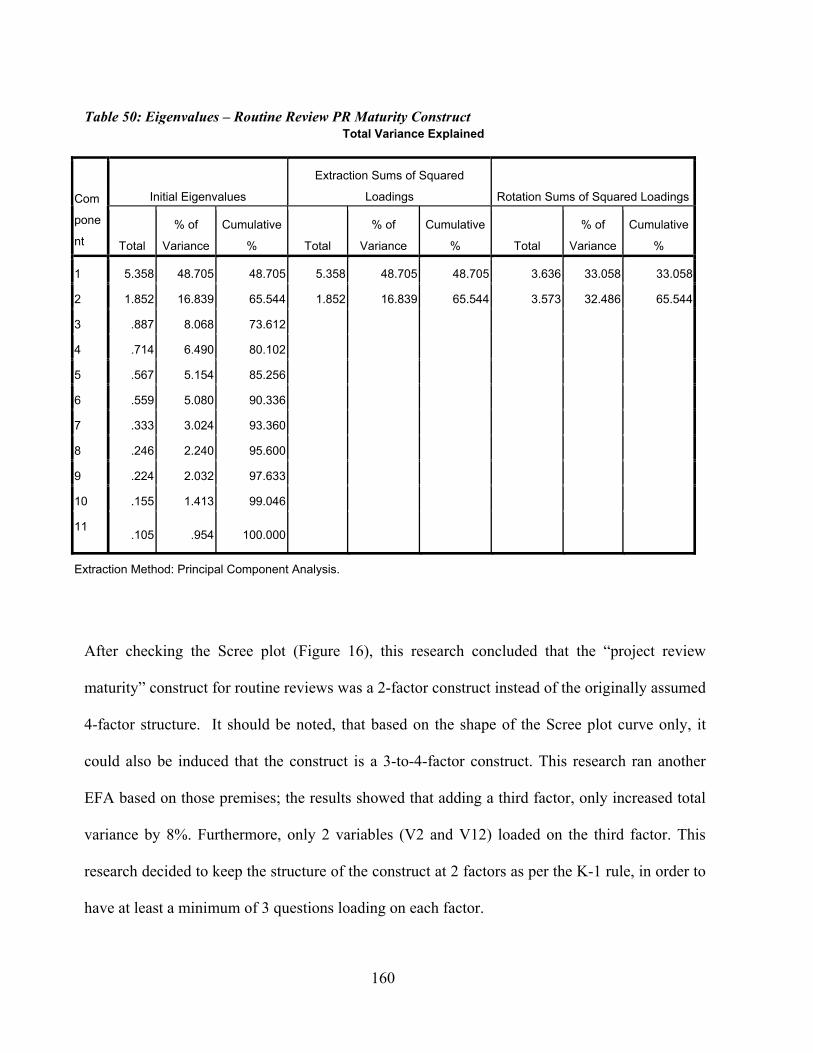
160
Table 50: Eigenvalues – Routine Review PR Maturity Construct Total Variance Explained
Initial Eigenvalues
Extraction Sums of Squared
Loadings Rotation Sums of Squared LoadingsCom
pone
nt Total
% of
Variance
Cumulative
% Total
% of
Variance
Cumulative
% Total
% of
Variance
Cumulative
%
1 5.358 48.705 48.705 5.358 48.705 48.705 3.636 33.058 33.058
2 1.852 16.839 65.544 1.852 16.839 65.544 3.573 32.486 65.544
3 .887 8.068 73.612
4 .714 6.490 80.102
5 .567 5.154 85.256
6 .559 5.080 90.336
7 .333 3.024 93.360
8 .246 2.240 95.600
9 .224 2.032 97.633
10 .155 1.413 99.046
11 .105 .954 100.000
Extraction Method: Principal Component Analysis.
After checking the Scree plot (Figure 16), this research concluded that the “project review
maturity” construct for routine reviews was a 2-factor construct instead of the originally assumed
4-factor structure. It should be noted, that based on the shape of the Scree plot curve only, it
could also be induced that the construct is a 3-to-4-factor construct. This research ran another
EFA based on those premises; the results showed that adding a third factor, only increased total
variance by 8%. Furthermore, only 2 variables (V2 and V12) loaded on the third factor. This
research decided to keep the structure of the construct at 2 factors as per the K-1 rule, in order to
have at least a minimum of 3 questions loading on each factor.

161
Figure 16 illustrates the shape of the curve in the Scree Plot.
Figure 16: Routine Review PR Maturity: Scree Plot
Then rotation of the variables was used in order to make the output more understandable and
help interpreting the factors. This research used Varimax rotation because it makes it possible to
easily identify with variable has a large loading on which factor.
Table 51 shows the results of SPSS Varimax rotation.
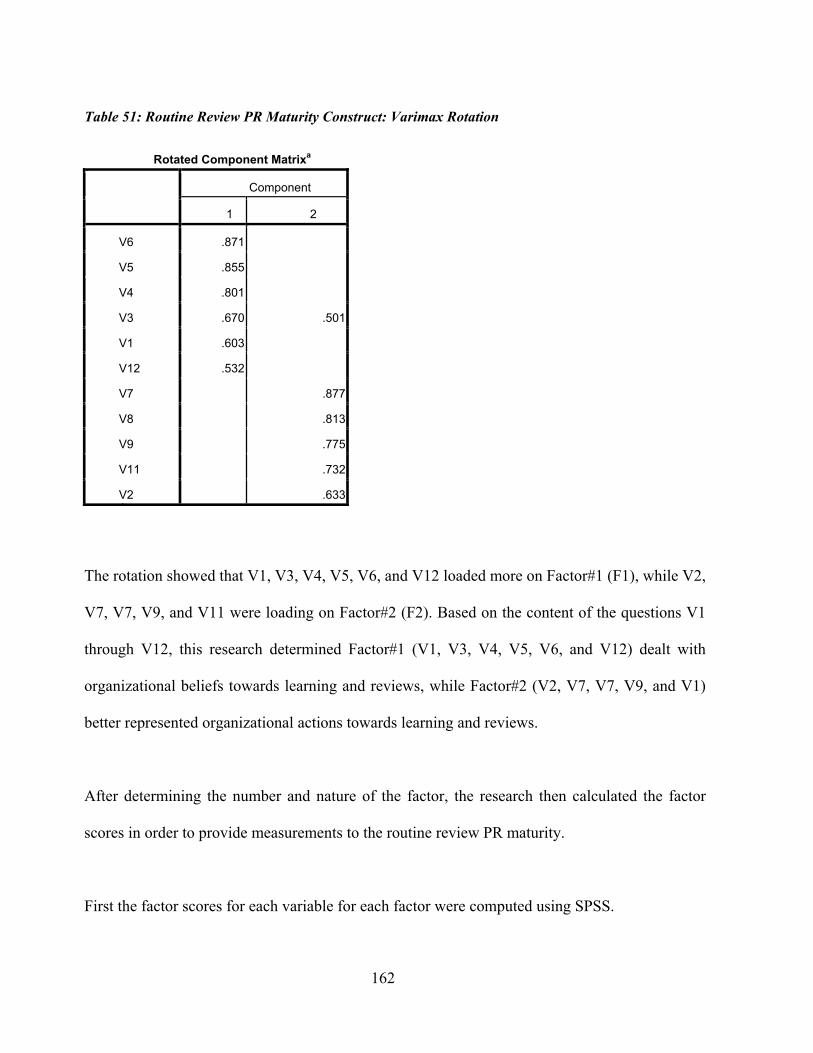
162
Table 51: Routine Review PR Maturity Construct: Varimax Rotation
Rotated Component Matrixa
Component
1 2
V6 .871
V5 .855
V4 .801
V3 .670 .501
V1 .603
V12 .532
V7 .877
V8 .813
V9 .775
V11 .732
V2 .633
The rotation showed that V1, V3, V4, V5, V6, and V12 loaded more on Factor#1 (F1), while V2,
V7, V7, V9, and V11 were loading on Factor#2 (F2). Based on the content of the questions V1
through V12, this research determined Factor#1 (V1, V3, V4, V5, V6, and V12) dealt with
organizational beliefs towards learning and reviews, while Factor#2 (V2, V7, V7, V9, and V1)
better represented organizational actions towards learning and reviews.
After determining the number and nature of the factor, the research then calculated the factor
scores in order to provide measurements to the routine review PR maturity.
First the factor scores for each variable for each factor were computed using SPSS.
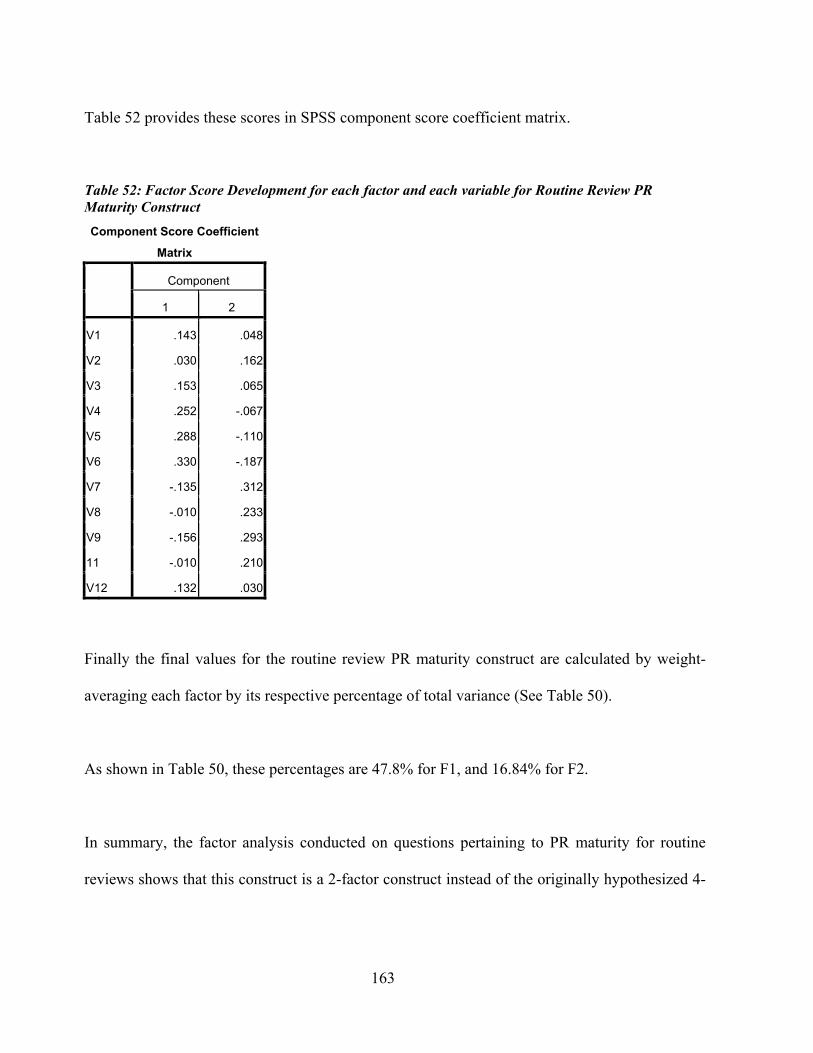
163
Table 52 provides these scores in SPSS component score coefficient matrix.
Table 52: Factor Score Development for each factor and each variable for Routine Review PR Maturity Construct
Finally the final values for the routine review PR maturity construct are calculated by weight-
averaging each factor by its respective percentage of total variance (See Table 50).
As shown in Table 50, these percentages are 47.8% for F1, and 16.84% for F2.
In summary, the factor analysis conducted on questions pertaining to PR maturity for routine
reviews shows that this construct is a 2-factor construct instead of the originally hypothesized 4-
Component Score Coefficient
Matrix
Component
1 2
V1 .143 .048
V2 .030 .162
V3 .153 .065
V4 .252 -.067
V5 .288 -.110
V6 .330 -.187
V7 -.135 .312
V8 -.010 .233
V9 -.156 .293
11 -.010 .210
V12 .132 .030
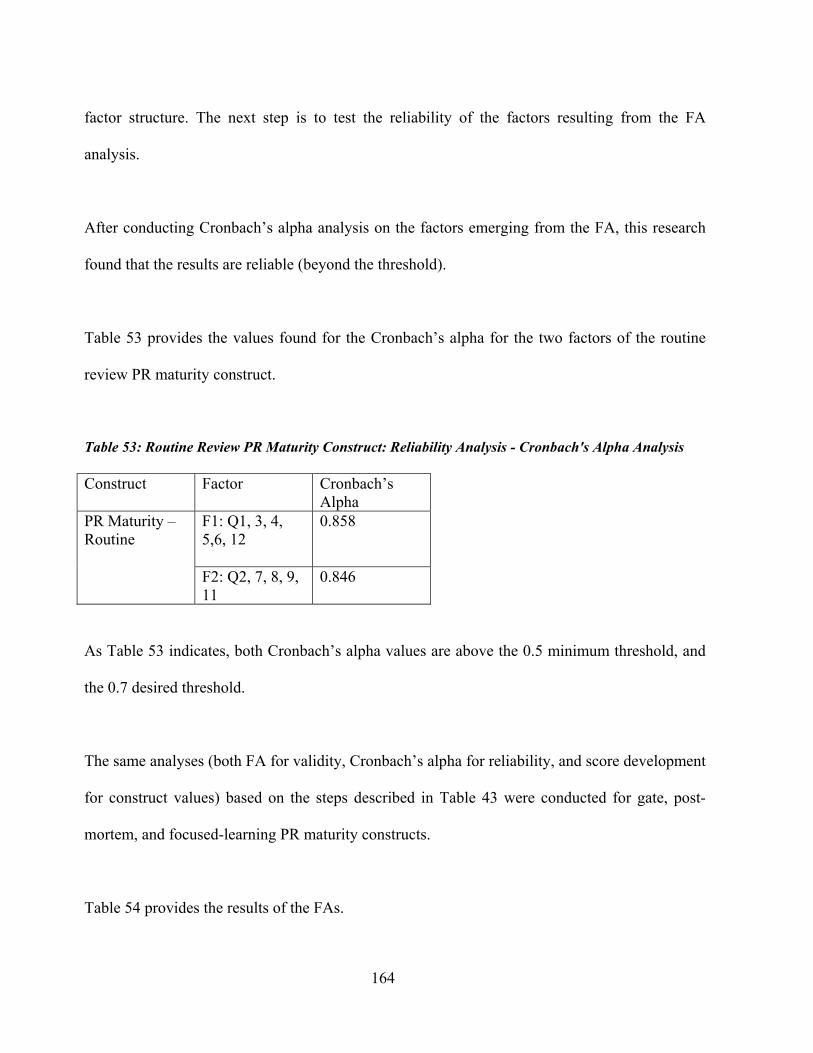
164
factor structure. The next step is to test the reliability of the factors resulting from the FA
analysis.
After conducting Cronbach’s alpha analysis on the factors emerging from the FA, this research
found that the results are reliable (beyond the threshold).
Table 53 provides the values found for the Cronbach’s alpha for the two factors of the routine
review PR maturity construct.
Table 53: Routine Review PR Maturity Construct: Reliability Analysis - Cronbach's Alpha Analysis Construct Factor Cronbach’s
Alpha F1: Q1, 3, 4, 5,6, 12
0.858 PR Maturity – Routine
F2: Q2, 7, 8, 9, 11
0.846
As Table 53 indicates, both Cronbach’s alpha values are above the 0.5 minimum threshold, and
the 0.7 desired threshold.
The same analyses (both FA for validity, Cronbach’s alpha for reliability, and score development
for construct values) based on the steps described in Table 43 were conducted for gate, post-
mortem, and focused-learning PR maturity constructs.
Table 54 provides the results of the FAs.

165
Table 54: FA Results for Gate, Post-mortem, and Focused-learning Review PR Maturity Constructs. Factor Analysis Results for PR Maturity for Gate, Post-mortem, and Focused-learning Reviews
Steps Steps Results and comments: Gate Reviews
Results and comments: Post-Mortem Reviews
Results and comments
Correlation Matrix (all variables)
• All variables have at least half of more of their correlation coefficients > 0.3, except V7
• All data except V7 is suitable for FA
• All variables have at least half of more of their correlation coefficients > 0.3
• Data is suitable for FA
• All variables have at least half of more of their correlation coefficients > 0.3
• Data is suitable for FA
KMO measure of sampling adequacy (Kaiser-Meyer-Okin)
• KMO=0.864 • The data set is the
“good” (almost excellent) level for FA
• KMO=0.697 • The data set is almost
at the “good” level for FA
• KMO=0.756 • The data set is almost
at the “good” level for FA
Bartlett’s test of sphericity
• Test is significant (P<0.05).
• The data id factorable.
• Test is significant (P<0.05).
• The data id factorable.
• Test is significant (P<0.05).
• The data id factorable.
1. Determine if FA applicable to data set
1st Extraction with SPSS PCA: Communalities
• All but three variables have communalities above the threshold level (two very close to 0.5).
• The results show factorability.
• All variables have communalities above the threshold level.
• The results show factorability.
• All variables have communalities above the threshold level.
• The results show factorability.
1st Extraction with SPSS PCA: Eigenvalues – Kaiser 1
• One factor has an Eigen value > 1 explaining 61.062% of the total variance.
• The second factor has an Eigen value of .9 (close to one) adding 8.24% to total variance.
• This is a two-factor construct.
• Three factors have an Eigen value > 1 explaining 75.27% of the total variance
• This is a three-factor construct.
• Two factors have an Eigen value > 1 explaining 69.06% of the total variance
• By adding a third factor with Eigen value of 0.9, total explained variance totals: 78.8%.
• This is a three-factor construct.
2. Determine # of factors
Scree plot • Scree plot shows that two components has an Eigen value above, or near 1 where the plot starts to flatten in a linear way.
• This also shows that this is a two -factor construct
• Scree plot shows that three components has an Eigen value >1, where the plot starts to flatten in a linear way.
• This also shows that this is a three-factor construct
• Scree plot shows that three components has an Eigen value > or close to 1, where the plot starts to flatten in a linear way.
• This also shows that this is a three-factor construct
3. Develop factor structure
Factor rotation • F1: V1, V2, V3, V4, V5, V6
• F2: V8, V9, V10, V11, V12
• F1: V7, V8, V9, V10, V11
• F2: V2, V3, V4, V12 • F3: V1, V5, V6
• F1: V2, V3, V4, V8 • F2: V1, V5, V6, V7,
V9 • F3: V10, V11, V12

166
Based on the FA results of routine, gate, post-mortem, and focused-learning PR maturity
reviews, this research concludes that routine and gate PR maturity constructs are based on a 2-
factor structure, while post-mortem and focused-learning PR maturity constructs are better
explained by a 3-factor structure as opposed the originally hypothesized 4-factor structure.
Table 55 provides the original factor-structure for the PR maturity constructs and the original
questions associated with each factor.
Table 55: Original Structure and Qustions for the PR Maturity Constructs. Initial PR Maturity Construct Structure and Questions for Routine, Gate, Post-mortem, and Focused-
learning Reviews Constructs: Initial
Factors: Questions: #
1. My organization encourages me to learn from previous ______PRs before starting a new project.
V1
2. My organization possesses an efficient system to retrieve knowledge from previous _______PRs.
V2
Knowledge Transfer
3. My organization encourages me to share the knowledge from _______ PRs with other organizational members.
V3
4. My organization promotes improving performance by openly reflecting on past actions during ________PRs.
V4
5. My organization values ______PRs as a tool to generate knowledge to improve my current project performance.
V5
Corporate Culture
6. My organization values _______PRs as a tool to generate knowledge to improve future project performance: V6
V6
7. My project manager expects that we conduct _______PRs. V7
8. My project manager provides the appropriate tools (forms, processes, etc.) to conduct ______ PRs.
V8
Managerial Buy-in.
9. My project manager provides the appropriate resources (time, etc.) to conduct ________ PRs.
V9
10. We regularly conduct ______ PRs during the project life cycle. V10
11. All relevant team members participate in our ________PRs. V11
PR Maturity for all review types
PR Logistics
12. All relevant data is available to us (on project status/challenges) during our _______PRs.
V12
Table 56 summarizes how each construct structure (routine, gate, post-mortem, and focused-
learning PR maturity constructs) was modified to better reflect the underlying factors. Table 56
also provides the reliability analysis results after computing the Cronbach’s alpha for each factor.

167
Table 56: New Routine, Gate, Post-mortem, and Focused-learning PR Maturity Construct Structures Based on FA Results, and Reliability Analysis Results..
Routine, Gate, Post-mortem, and Focused-learning Review PR Maturity Constructs: FA results
Constructs Sub-constructs
Original factor Structure/factors
Modified FA Structure/Factors
Reliability Analysis Cronbach’s Alpha
Conclusions
Knowledge Transfer: V1, V2, V3 Corporate Culture: V4, V5, V6
Organizational Beliefs twds Learning and Reviews (F1): V1, V3, V4, V5, V6, V12
0.858
Managerial Buy-in V7, V8, V9
Routine Review
PR Logistics V10, V11, V12
Organizational Actions twds Learning and Reviews (F2) V2, V7, V8, V9, V11
0.846
• Construct is better explained by simpler 2- factor structure.
• “Organizational beliefs twrds learning and reviews” factor is more influential to the construct structure than organizational actions twds learning and reviews.
• V10 is irrelevant to the construct.
• The factors are reliable. Knowledge Transfer: V1, V2, V3 Corporate Culture: V4, V5, V6
Organizational Beliefs twds Learning and Reviews (F1): V1, V2, V3, V4, V5, V6,
0.898
Managerial Buy-in V7, V8, V9
Gate Reviews
PR Logistics V10, V11, V12
Organizational Actions twds Learning and Reviews (F2): V8, V9, V10, V11, V12
0.883
• Construct is better explained by simpler 2- factor structure.
• “Organizational beliefs twrds learning and reviews” factor is more influential to the construct structure than organizational actions twds learning and reviews.
• V7 is irrelevant to the construct.
• The factors are reliable. Knowledge Transfer: V1, V2, V3 Corporate Culture: V4, V5, V6
Organizational Beliefs twds Learning and Reviews (F3): V1, V5, V6
0.878
Managerial Buy-in V7, V8, V9
Organizational Actions twds Learning and Reviews (F1): V7, V8, V9, V10, V11
0.831
Post-mortem Reviews
PR Logistics V10, V11, V12
Knowledge Transfer (F2): V2, V3, V4, V12
0.875
• Construct is better explained by simpler 3- factor structure.
• “Organizational actions twds learning and reviews” factor is the most influential factor followed by “knowledge transfer” factor and “organizational beliefs twrds learning and reviews” factor.
• The factors are reliable.
Knowledge Transfer: V1, V2, V3 Corporate Culture: V4, V5, V6
Organizational Beliefs twds Learning and Review (F2)s: V1, V5, V6, V7, V9
0.883
Managerial Buy-in V7, V8, V9
Organizational Actions twds Learning and Reviews (F3): V10, V11, V12
0.903
“Overall” PR Maturity
Focused-learning Reviews
PR Logistics V10, V11, V12
Knowledge Transfer (F1): V2, V3, V4, V8
0.840
• Construct is better explained by simpler 3- factor structure.
• “Knowledge transfer” factor is the most influential factor followed by “organizational beliefs twrds learning and reviews” and “organizational actions twrds learning and reviews” factor.
• The factors are reliable.

168
Further analysis on the FA conclusions is provided in Chapter 5.
As with the routine review PR maturity construct, the values for the gate, post-mortem, and
focused-learning PR maturity constructs are derived by weight-averaging the factor scores for
each construct with their respective percentage of the construct variance.
The values for the “overall PR maturity” construct are then derived by averaging the values
obtained for routine, gate, post-mortem, and focused-learning PR maturity constructs.
4.2.5.2. PR Performance Construct for Each Review Type
This research also conducted factor analyses, reliability analyses, and score developments for
each type of reviews for the PR performance construct.
This research had hypothesized that these constructs were better explained by 2 factors: levels of
learning and impact on project performance.
Table 57 provides the original factors and questions underlying the constructs.

169
Table 57: Original Structure and Qustions for the PR Performance Constructs. Initial PR Performance Construct Structure and Questions for Routine, Gate, Post-mortem, and Focused-
learning Reviews Constructs Initial Factors Questions #
1 ______ PRs help us gain knowledge on how well we are consistently following our PM procedures.
V13
2. ______ PRs help us gain knowledge on the status of our project. V14 3. _______ PRs help us gain knowledge on the challenges of our project and control the potential problems.
V15
4. _______ PRs help us gain knowledge on the PM procedures used in our project and their impact on project performance.
V16
Levels of learning
5. _______ PRs help us gain knowledge on organizational procedures used in our project and their impact on project performance.
V17
6. _______ PRs help us improve our project performance during the project life cycle.
V18
7 _______PRs help us improve our probability to deliver a successful project. V19
PR Performance
Impact on project performance
8. ______ PRs help us reduce the risk of potential project challenges. V20
The same FA steps described in Table 43 were followed to conduct the FAs for routine, gate,
post-mortem, and focused-learning PR performance constructs.
Table 58 provides a summary of the results.

170
Table 58: FA Results for Gate, Post-mortem, and Focused-learning Review PR Performance Constructs.
Factor Analysis Results for PR Performance for Routine, Gate, Post-mortem, and Focused-learning Reviews
Steps Results and comments: Routine Reviews
Results and comments: Gate Reviews
Results and comments: Post-mortem Reviews
Results and comments: Focused-learning Reviews
Correlation Matrix (all variables)
• All variables have at least half of more of their correlation coefficients > 0.3.
• Data is suitable for FA
• All variables have at least half of more of their correlation coefficients > 0.3.
• Data is suitable for FA
• All variables have at least half of more of their correlation coefficients > 0.3, except for V13, and V15.
• Omit V13 and V15 from the analysis.
• All variables have at least half of more of their correlation coefficients > 0.3.
• Data is suitable for FA
KMO measure of sampling adequacy (Kaiser-Meyer-Okin)
• KMO=0.747 • The data is good
for FA
• KMO=0.735 • The data is good
for FA
• KMO=0.679 • The data is mediocre to good
for FA
• KMO=0.653 • The data is good
for FA
Bartlett’s test of Sphericity
• Test is significant (P<0.05).
• The data id factorable.
• Test is significant (P<0.05).
• The data id factorable.
• Test is significant (P<0.05). • The data id factorable.
• Test is significant (P<0.05).
• The data id factorable.
1st Extraction with SPSS PCA: Communalities
• All variables have communalities above the threshold level.
• The results show factorability.
• Allr variables have communalities above the threshold level.
• The results show factorability.
• All variables have communalities above the threshold level.
• The results show factorability.
• All variables have communalities above the threshold level.
• The results show factorability.
1st Extraction with SPSS PCA: Eigenvalues – Kaiser 1
• Two factors have an Eigen value > 1 explaining 71.46% of the total variance
• This is a two-factor construct.
• Two factors have an Eigen value > 1 explaining 68.149% of the total variance
• This is a two-factor construct.
• Two factors have an Eigen value > 1 explaining 73.6% of the total variance, while a third component has an Eigen value of 0.96 (total variance explained by the 3 factors is 89.6%)
• This is a three-factor construct.
• Three factors have an Eigen value > 1 explaining 81.4% of the total variance
• This is a three-factor construct.
Scree plot • Scree plot shows that two components has an Eigen value >1, at which point the plot starts to level off in a decreasing linear fashion.
• This also shows that this is a two-factor construct
• Scree plot shows that two components has an Eigen value >1, at which point the plot starts to level off in a decreasing linear fashion.
• This also shows that this is a two-factor construct
• Scree plot shows that three components have an Eigen value >1 or close to 1, at which point the plot starts to level off in a decreasing linear fashion.
• This also shows that this is a three-factor construct
• Scree plot shows that three components has an Eigen value >1, at which point the plot starts to level off in a decreasing linear fashion.
• This also shows that this is a three-factor construct
Factor rotation
• F1: V13, V16, V17, V20
• F2: V14, V15, V8, V19
• F1: V13, V16, V17,
• F2: V14, V15, V18, V19, V20
• F1: V4, V18, • F2: V16, V17 • F3: V19, V20
• F1: V13, V16, V17,
• F2: V14, V15
171
• F3: V18, V19, V20
Therefore, the routine, gate, post-mortem, and focused-learning constructs are restructured to
reflect the results from the factor analyses. Based on the content of the questions, this research
concluded that routine and gate reviews PR performance constructs were better explained by 2
factors: 1) knowledge on PM procedures, and 2) knowledge /impact on project performance. On
the other hand, post-mortem and focused-learning PR performance constructs were better
explained by a 3-factor structure: 1) knowledge on PM procedures, 2) knowledge on project
status, and 3) impact on project performance.
Table 59 summarizes how the constructs were restructured after the factor analyses and also
provides the results of the reliability analyses with Cronback’s alpha values.

172
Table 59: New Routine, Gate, Post-mortem, and Focused-learning PR Performance Construct Structures Based on FA Results, and Reliability Analysis Results.
Routine, Gate, Post-mortem, and Focused-learning Review PR Performance Constructs: FA results
Constructs Sub-constructs
Original factor Structure/Factors
Modified FA Structure/Factors
Reliability Analysis: Cronback’s Alpha
Conclusion
Levels of Learning: V13, V14, V15, V16, V17
Knowledge on PM Procedures: (F1) V13, V16, V17, V20
0.869 Routine Review
Impact on Project Performance: V18, V19, V20
Knowledge and Impact on Project Performance (F2): V14, V15, V18, V19
0.813
• Construct is better explained by simpler 2- factor structure.
• “Knowledge on PM procedures” factor is more influential to the routine PR performance construct than “knowledge/impact on project performance” factor.
• The factors are reliable.
Levels of Learning: V13, V14, V15, V16, V17
Knowledge and Impact on Project Performance (F1): V14, V15, V18, V19, v20
0.853 Gate Reviews
Impact on Project Performance: V18, V19, V20
Knowledge on PM Procedures (F2): V13, V16, V17
0.817
• Construct is better explained by simpler 2- factor structure.
• “Knowledge and Impact on project performance” factor is more influential on the construct than “knowledge on PM procedures” factor.
• The factors are reliable.
Levels of Learning: V13, V14, V15, V16, V17
Impact on Project Performance (F1): V19, V20
0.837
Knowledge on PM Procedures (F2): V16, V17
0.784
Post-mortem Reviews
Impact on Project Performance: V18, V19, V20
Knowledge on Project Status (F3) V14, V18
0.676
• Construct is better explained by simpler 3- factor structure.
• “Impact on project performance” factor is more influential on the construct structure than “knowledge on PM procedures” and “knowledge on project status” factors.
• V13 and V15 are irrelevant for the construct.
• The factors are reliable. Levels of Learning: V13, V14, V15, V16, V17
Knowledge on PM Procedures (F1) V13, V16, V17
0.827
Impact on Project Performance (F2): V18, V19, V20
0.851
“Overall” PR Performance
Focused-learning Reviews
Impact on Project Performance: V18, V19, V20
Knowledge on Project Status (F3) V14, V15
0.834
• Construct is better explained by simpler 3- factor structure.
• “Knowledge on PM procedures” factor is more influential to the construct than “impact on project performance” and “knowledge on project status” factors.
• The factors are reliable.
Further analysis on the FA conclusions for the PR performance construct conclusions is provided
in Chapter 5.

173
As with the routine, gate, post-mortem, and focused-learning PR maturity constructs in the
previous section, the values for the gate, post-mortem, and focused-learning PR Performance
constructs are derived by weight-averaging the factor scores for each construct with their
respective percentage of the construct variance.
In addition, similarly to the “overall PR maturity” construct computation, the “overall PR
performance” construct is derived by averaging the values obtained for routine, gate, post-
mortem, and focused-learning PR performance constructs.
4.2.5.3. Project Performance Construct
This research also conducted a factor analysis, reliability analysis, and score development for the
project performance construct using the same steps as for the previous analyses described in
Table 43.
Table 60 provides the results of the project performance construct FA.
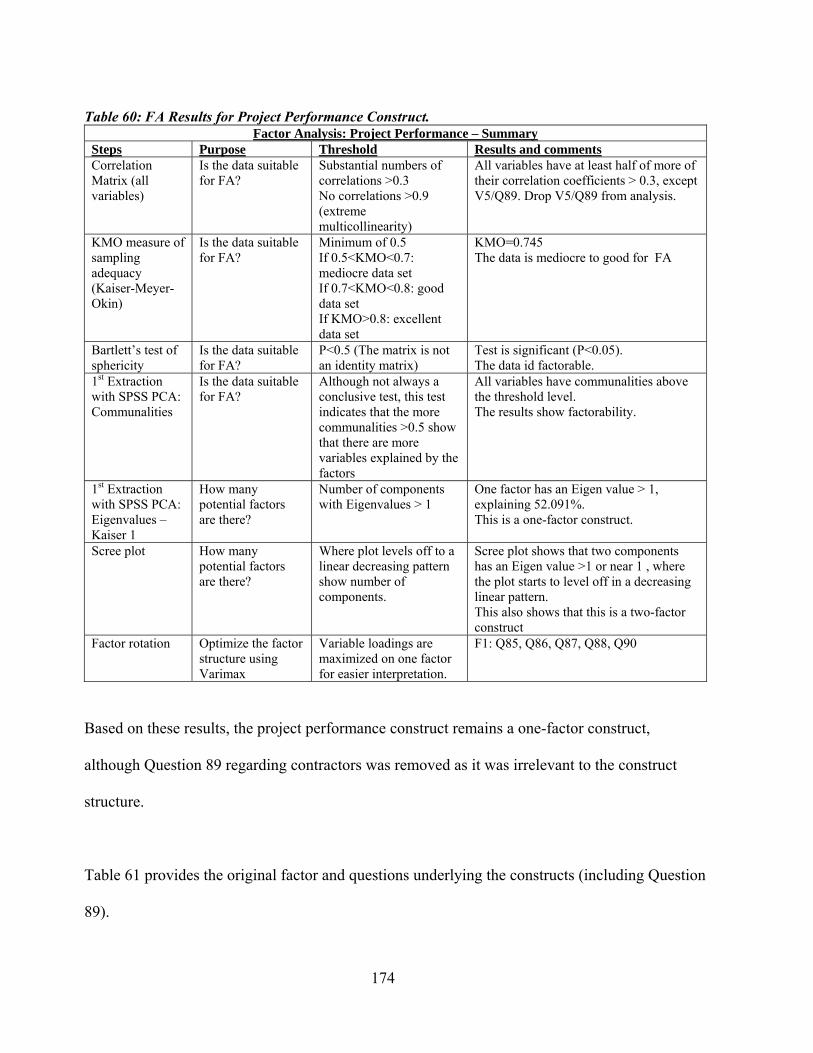
174
Table 60: FA Results for Project Performance Construct. Factor Analysis: Project Performance – Summary
Steps Purpose Threshold Results and comments Correlation Matrix (all variables)
Is the data suitable for FA?
Substantial numbers of correlations >0.3 No correlations >0.9 (extreme multicollinearity)
All variables have at least half of more of their correlation coefficients > 0.3, except V5/Q89. Drop V5/Q89 from analysis.
KMO measure of sampling adequacy (Kaiser-Meyer-Okin)
Is the data suitable for FA?
Minimum of 0.5 If 0.5<KMO<0.7: mediocre data set If 0.7<KMO<0.8: good data set If KMO>0.8: excellent data set
KMO=0.745 The data is mediocre to good for FA
Bartlett’s test of sphericity
Is the data suitable for FA?
P<0.5 (The matrix is not an identity matrix)
Test is significant (P<0.05). The data id factorable.
1st Extraction with SPSS PCA: Communalities
Is the data suitable for FA?
Although not always a conclusive test, this test indicates that the more communalities >0.5 show that there are more variables explained by the factors
All variables have communalities above the threshold level. The results show factorability.
1st Extraction with SPSS PCA: Eigenvalues – Kaiser 1
How many potential factors are there?
Number of components with Eigenvalues > 1
One factor has an Eigen value > 1, explaining 52.091%. This is a one-factor construct.
Scree plot How many potential factors are there?
Where plot levels off to a linear decreasing pattern show number of components.
Scree plot shows that two components has an Eigen value >1 or near 1 , where the plot starts to level off in a decreasing linear pattern. This also shows that this is a two-factor construct
Factor rotation Optimize the factor structure using Varimax
Variable loadings are maximized on one factor for easier interpretation.
F1: Q85, Q86, Q87, Q88, Q90
Based on these results, the project performance construct remains a one-factor construct,
although Question 89 regarding contractors was removed as it was irrelevant to the construct
structure.
Table 61 provides the original factor and questions underlying the constructs (including Question
89).
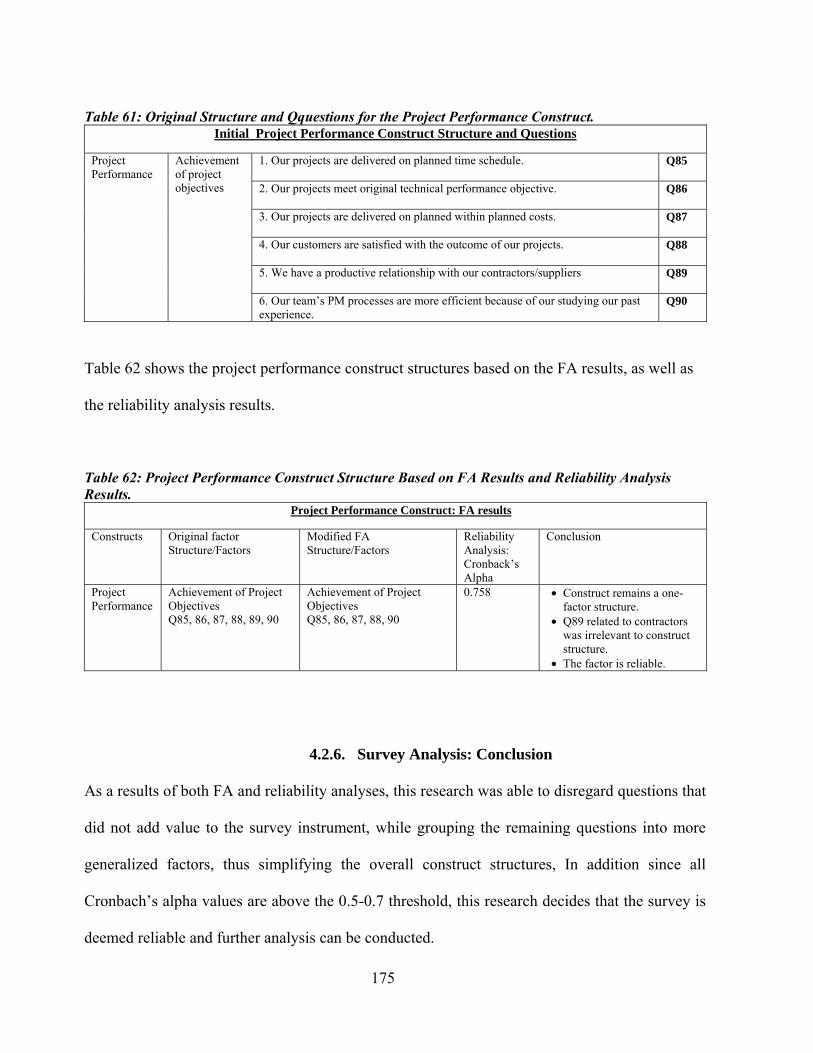
175
Table 61: Original Structure and Qquestions for the Project Performance Construct. Initial Project Performance Construct Structure and Questions
1. Our projects are delivered on planned time schedule. Q85
2. Our projects meet original technical performance objective. Q86
3. Our projects are delivered on planned within planned costs. Q87
4. Our customers are satisfied with the outcome of our projects. Q88
5. We have a productive relationship with our contractors/suppliers Q89
Project Performance
Achievement of project objectives
6. Our team’s PM processes are more efficient because of our studying our past experience.
Q90
Table 62 shows the project performance construct structures based on the FA results, as well as
the reliability analysis results.
Table 62: Project Performance Construct Structure Based on FA Results and Reliability Analysis Results.
Project Performance Construct: FA results
Constructs Original factor Structure/Factors
Modified FA Structure/Factors
Reliability Analysis: Cronback’s Alpha
Conclusion
Project Performance
Achievement of Project Objectives Q85, 86, 87, 88, 89, 90
Achievement of Project Objectives Q85, 86, 87, 88, 90
0.758 • Construct remains a one-factor structure.
• Q89 related to contractors was irrelevant to construct structure.
• The factor is reliable.
4.2.6. Survey Analysis: Conclusion
As a results of both FA and reliability analyses, this research was able to disregard questions that
did not add value to the survey instrument, while grouping the remaining questions into more
generalized factors, thus simplifying the overall construct structures, In addition since all
Cronbach’s alpha values are above the 0.5-0.7 threshold, this research decides that the survey is
deemed reliable and further analysis can be conducted.
176
4.3. Hypothesis Testing.
The next step in this research is to test if the hypotheses that were described in Section 4.2.2 of
this Chapter.
This research decided to use non-parametric statistics (SPSS Spearman’ s rho rank correlation
coefficient) because of the non-randomized nature of the sample, the size of the sample (barely
above the 30 threshold). Although both Kolmogorov-Smirnov and Shapiro-Wilk tests showed
that for most of the data set, the null hypothesis (there is no difference between the data set
distribution and that of a normal one) could not be rejected, further examinations of the
histogram shapes, showed that the normality of the data sets could not be ascertained in a
conclusive manner, which further justified the use of Spearman’s coefficient.
Table 63 below shows the correlation results and significance levels from Spearman’s non-
parametric rank correlation.

177
Table 63: Spearman’s Rho Rank Correlation Coefficient at α=0.1
Hypothesis-testing: Spearman’s rho rank correlation coefficient (α ≤ 0.1)
Correlation Coefficients Degree of significance ≤ 0.1
Spearman correlation Routine(a) Gate(b)
Post-Mortem (c)
Focused-Learning
(d) Overall Routine GatePost-
MortemFocused-Learning Overall
PR Maturity/PR performance 0.251 0.12 0.314 0.409 0.327 0.1 NA 0.05 0.01 0.05
PR performance/Project Performance 0.394 0.278 0.214 0.105 0.36 0.05 0.1 0.1 NA 0.05
PR Maturity/Project Performance 0.425 0.287 0.46 0.141 0.535 0.01 0.1 0.01 NA 0.01
Black font = Statistically significant correlationBlue font = Not-statistically significant correlation
12 out 15 hypotheses are significant
The results showed in black font show significant correlations while these in blue font are not
significant.
Table 64 provides a summary of the hypotheses for clarification purposes.
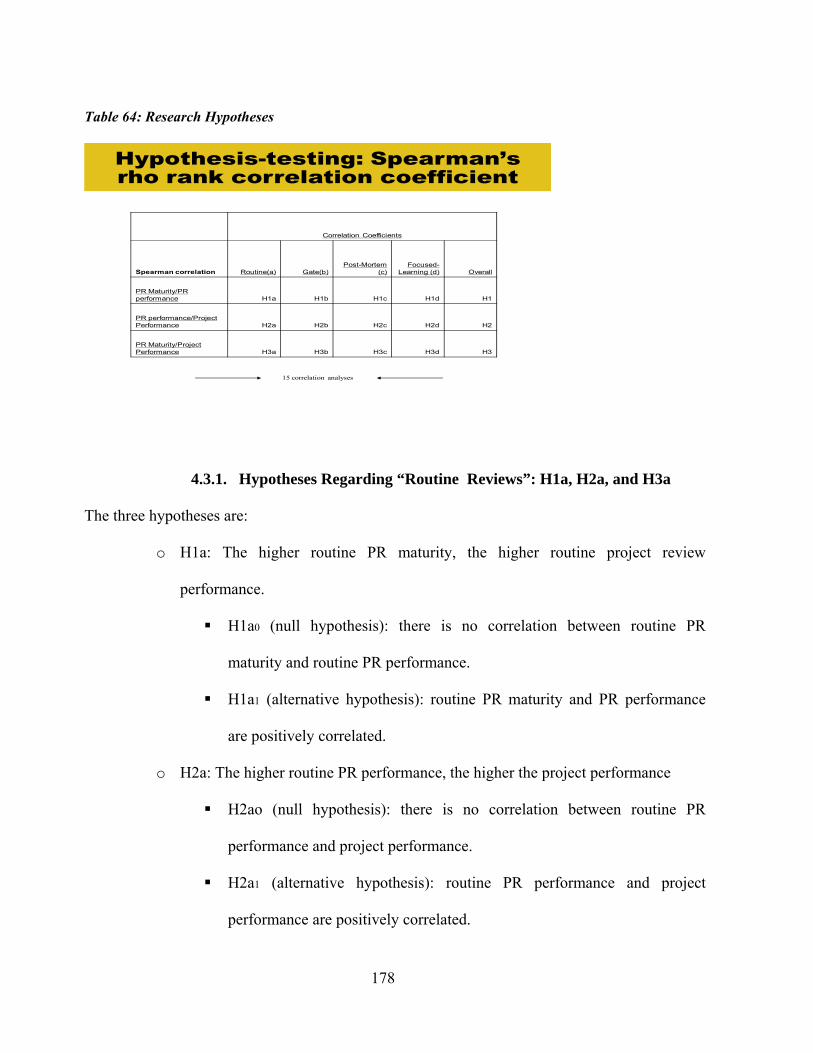
178
Table 64: Research Hypotheses
Hypothesis-testing: Spearman’srho rank correlation coefficient
Correlation Coefficients
Spearman correlation Routine(a) Gate(b)Post-Mortem
(c)Focused-
Learning (d) Overall
PR Maturity/PR performance H1a H1b H1c H1d H1
PR performance/Project Performance H2a H2b H2c H2d H2
PR Maturity/Project Performance H3a H3b H3c H3d H3
15 correlation analyses
4.3.1. Hypotheses Regarding “Routine Reviews”: H1a, H2a, and H3a
The three hypotheses are:
o H1a: The higher routine PR maturity, the higher routine project review
performance.
H1a0 (null hypothesis): there is no correlation between routine PR
maturity and routine PR performance.
H1a1 (alternative hypothesis): routine PR maturity and PR performance
are positively correlated.
o H2a: The higher routine PR performance, the higher the project performance
H2ao (null hypothesis): there is no correlation between routine PR
performance and project performance.
H2a1 (alternative hypothesis): routine PR performance and project
performance are positively correlated.
179
o H3a: The higher routine project review maturity, the higher project performance.
H3ao (null hypothesis): there is no correlation between routine PR
maturity and project performance.
H3a1 (alternative hypothesis): routine PR maturity and project
performance are positively correlated.
The variable measurements (routine PR maturity, routine PR performance, and project
performance) used in Spearman’s non-parametric correlation were obtained in the fashion
described in Section 4.2.5.1, mainly by weight-averaging the factor scores associated with its
variable using each factor percentage of the construct total variance.
The results of the correlation analyses show that there is a significantly positive relationship
between:
• Routine PR maturity and routine PR performance,
• Routine PR performance and project performance,
• Routine PR maturity and project performance.
The null Hypotheses H1ao, H2ao, and H3ao are rejected.
4.3.2. Hypotheses Regarding “Gate Reviews”: H1b, H2b, and H3b
The three hypotheses are:
o H1b: The higher gate PR maturity, the higher gate project review performance.
180
H1bo (null hypothesis): there is no correlation between gate PR maturity
and gate PR performance.
H1b1 (alternative hypothesis): gate PR maturity and gate PR performance
are positively correlated.
o H2b: The higher gate PR performance, the higher project performance.
H2bo (null hypothesis): there is no correlation between gate PR
performance and project performance.
H2b1 (alternate hypothesis): gate PR performance and project performance
are positively correlated.
o H3b: The higher gate project review maturity, the higher project performance.
H3bo (null hypothesis): there is no correlation between gate PR maturity
and project performance.
H3b1 (alternative hypothesis): gate PR maturity and project performance
are positively correlated.
The variable measurements for gate reviews PR maturity and PR performance constructs were
obtained in the same manner as the routine review PR maturity and PR performance constructs
described in section 4.3.1.
The results of the correlation analyses show that there is a significantly positive relationship
between:
• Gate PR performance and project performance,
• Gate PR maturity and project performance.

181
The null Hypotheses H2bo and H3bo are rejected.
However, the results show that the positive relationship between gate PR maturity and gate PR
performance is not significant at α=0.1. Therefore, this research could not reject the null
hypothesis H1bo.
4.3.3. Hypotheses Regarding “Post-mortem Reviews”: H1c, H2c, and H3c
The three hypotheses are:
o H1c: The higher post-mortem PR maturity, the higher post-mortem PR
performance.
H1co (null hypothesis): there is no correlation between post-mortem PR
maturity and post-mortem PR performance.
H1c1 (alternative hypothesis): post-mortem PR maturity and post-mortem
PR performance are positively correlated.
o H2c: The higher post-mortem PR performance, the higher project performance.
H2co (null hypothesis): there is no correlation between post-mortem PR
performance and project performance.
H2c1 (alternative hypothesis): post-mortem PR performance and project
performance are positively correlated.
o H3c: The higher post-mortem project review maturity, the higher project
performance.
182
H3co (null hypothesis): there is no correlation between post-mortem PR
maturity and project performance.
H3c1 (alternative hypothesis): post-mortem PR maturity and project
performance are positively correlated.
The variable measurements for post-mortem reviews were obtained in the same manner as the
routine review variables in Section 4.3.1.
The results of the correlation analyses show that there is a significantly positive relationship
between:
• Post-mortem PR maturity and post-mortem PR performance,
• Post-mortem PR performance and project performance,
• Post-mortem PR maturity and project performance.
The null Hypotheses H1co, H2co, and H3co are rejected.
4.3.4. Hypotheses Regarding “Focused-learning Reviews”: H1d, H2d, and H3d
The three hypotheses are:
o H1d: The higher focused-learning PR maturity, the higher focused-learning
project review performance.
H1do (null hypothesis): there is no correlation between focused-learning
PR maturity and focused-learning PR performance.
H1d1 (alternate hypothesis): focused-learning PR maturity and focused-
learning PR performance are positively correlated.

183
o H2d: The higher focused-learning PR performance, the higher project
performance.
H2do (null hypothesis): there is no positive correlation between focused-
learning PR performance and project performance.
H2d1 (alternative hypothesis): focused-learning PR performance and
project performance are positively correlated.
o H3d: The higher focused-learning project review maturity, the higher project
performance.
H3do (null hypothesis): there is no correlation between focused-learning
PR maturity and project performance.
H3d1 (alternative hypothesis): focused-learning PR maturity and project
performance are positively correlated.
The variable measurements for focused-learning reviews were obtained in the same manner as
the routine review variables in Section 4.3.1.
The results of the correlation analyses show that there is a significantly positive relationship
between:
• Focused-learning PR maturity and focused-learning PR performance.
The null Hypotheses H1do is rejected.
184
However, the results show that the positive relationships between focused-learning PR
performance (H2d), focused-learning PR maturity (H3d), and project performance are not
significant at α=0.1. Therefore, this research could not reject the null hypotheses H2do and
H3do.
4.3.5. Hypotheses Regarding “Overall Reviews”: H1, H2, and H3
The three hypotheses are:
o H1: The higher “overall” PR maturity, the higher “overall” PR performance.
H1o (null Hypothesis): there is no correlation between “overall” PR
maturity and “overall” PR performance.
H11 (alternative hypothesis): “Overall” PR maturity and “overall” PR
performance are positively correlated.
o H2: The higher “overall” PR performance, the higher project performance.
H2o (null Hypothesis): there is no correlation between “overall” PR
performance and project performance.
H21 (alternative hypothesis): “Overall” PR performance and project
performance are positively correlated.
o H3: The higher “overall” PR maturity, the higher project performance.
H3o (null Hypothesis): there is no correlation between “overall” PR
maturity and project performance.
H31 (alternative hypothesis): “Overall” PR maturity and project
performance are positively correlated.
185
The variable measurements for “overall” reviews were obtained by averaging the values
previously obtained for the routine, gate, post-mortem, focused-learning PR maturity constructs,
and PR performance constructs.
The results of the correlation analyses show that there is a significantly positive relationship
between:
• “Overall” PR maturity and “overall” PR performance,
• “Overall” PR performance and project performance,
• “Overall” PR maturity and project performance.
The null Hypotheses H1o, H2o, and H3o are rejected.
Therefore, the results show that the null hypotheses can be rejected for H1, H2, H3, H1a, H1c,
H1d, H2a, H2b, H2c, H3a, H3b, H3c, and H3d, showing that there is a significant positive
relationship between the variables in each set. However, for H1b, H2d, and H3d, the results
show that the null hypotheses can not be rejected at α=0.1.
4.3.6. Hypothesis Testing: Conclusion
In conclusion, this research has demonstrated that the survey data instrument it created was valid
and reliable at measuring the 3 constructs and 8 sub-constructs it put forward. The hypotheses
were tested using the data obtained from the factor analyses, and the results showed that 12 out
of 15 hypotheses were accepted at α=0.1.
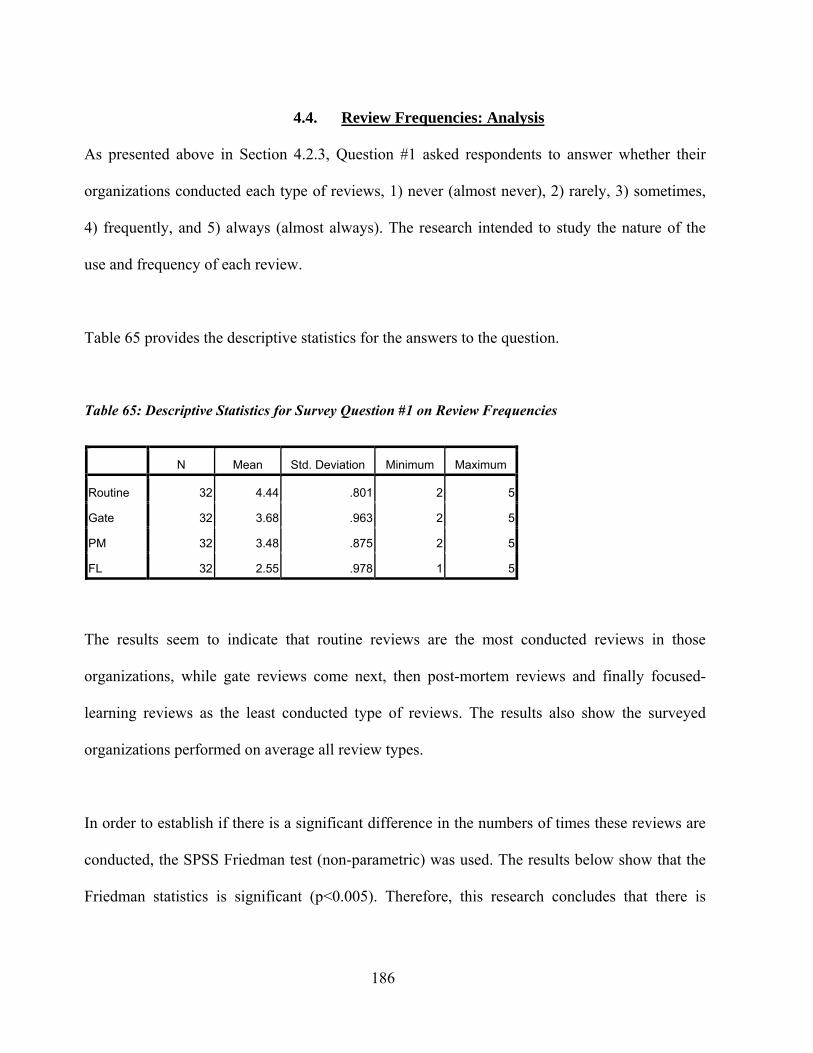
186
4.4. Review Frequencies: Analysis
As presented above in Section 4.2.3, Question #1 asked respondents to answer whether their
organizations conducted each type of reviews, 1) never (almost never), 2) rarely, 3) sometimes,
4) frequently, and 5) always (almost always). The research intended to study the nature of the
use and frequency of each review.
Table 65 provides the descriptive statistics for the answers to the question.
Table 65: Descriptive Statistics for Survey Question #1 on Review Frequencies
N Mean Std. Deviation Minimum Maximum
Routine 32 4.44 .801 2 5
Gate 32 3.68 .963 2 5
PM 32 3.48 .875 2 5
FL 32 2.55 .978 1 5
The results seem to indicate that routine reviews are the most conducted reviews in those
organizations, while gate reviews come next, then post-mortem reviews and finally focused-
learning reviews as the least conducted type of reviews. The results also show the surveyed
organizations performed on average all review types.
In order to establish if there is a significant difference in the numbers of times these reviews are
conducted, the SPSS Friedman test (non-parametric) was used. The results below show that the
Friedman statistics is significant (p<0.005). Therefore, this research concludes that there is
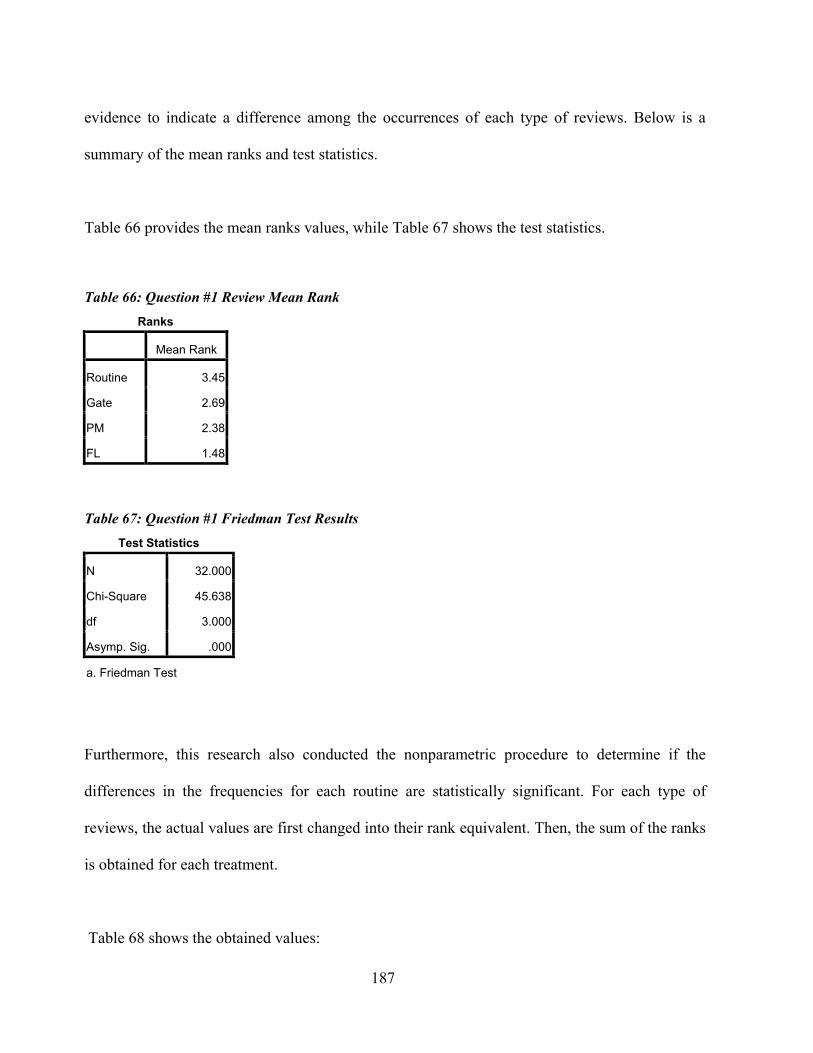
187
evidence to indicate a difference among the occurrences of each type of reviews. Below is a
summary of the mean ranks and test statistics.
Table 66 provides the mean ranks values, while Table 67 shows the test statistics.
Table 66: Question #1 Review Mean Rank
Ranks
Mean Rank
Routine 3.45
Gate 2.69
PM 2.38
FL 1.48
Table 67: Question #1 Friedman Test Results
Test Statistics
N 32.000
Chi-Square 45.638
df 3.000
Asymp. Sig. .000
a. Friedman Test
Furthermore, this research also conducted the nonparametric procedure to determine if the
differences in the frequencies for each routine are statistically significant. For each type of
reviews, the actual values are first changed into their rank equivalent. Then, the sum of the ranks
is obtained for each treatment.
Table 68 shows the obtained values:

188
Table 68: Question #1 Sum of the Ranks Routine Reviews Gate Reviews PM Reviews FL Reviews
Sum of the ranks 308 410 395 401
Next, the absolute difference between the sums of the ranks for each type of reviews was
calculated.
Table 69 shows these results.
Table 69: Question #1 Absolute Difference Between the sums Routine Gate PM FL Routine NA 102 87 93 Gate 102 NA 15 9 PM 87 15 NA 6 FL 93 9 6 NA
At α=0.1, the test statistics is z√(bk(k+1)/6 = 24.68, where b is the number of respondents (32), k
is the number of review type (4), and z is the value from the normal curve table corresponding to
α/k(k-1) (0.0083).
In order to be statistically significant, the absolute difference between any two rank sums must
equal to or be higher than the test statistic (in this case 24.68).
The results indicate that routine reviews are the only types of reviews that are significantly
conducted more often than any other type of reviews. The difference in the frequencies of gate,
post-mortem, and focused-learning reviews is not statistically significant.
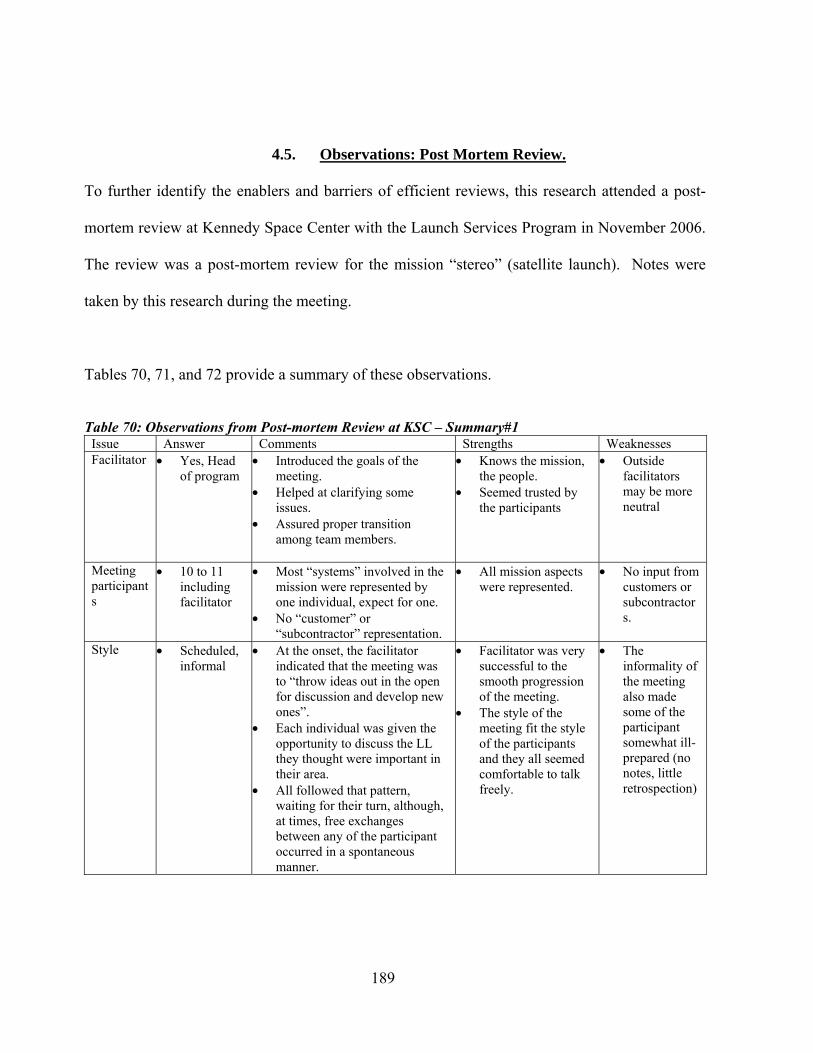
189
4.5. Observations: Post Mortem Review.
To further identify the enablers and barriers of efficient reviews, this research attended a post-
mortem review at Kennedy Space Center with the Launch Services Program in November 2006.
The review was a post-mortem review for the mission “stereo” (satellite launch). Notes were
taken by this research during the meeting.
Tables 70, 71, and 72 provide a summary of these observations.
Table 70: Observations from Post-mortem Review at KSC – Summary#1
Issue Answer Comments Strengths Weaknesses Facilitator • Yes, Head
of program • Introduced the goals of the
meeting. • Helped at clarifying some
issues. • Assured proper transition
among team members.
• Knows the mission, the people.
• Seemed trusted by the participants
• Outside facilitators may be more neutral
Meeting participants
• 10 to 11 including facilitator
• Most “systems” involved in the mission were represented by one individual, expect for one.
• No “customer” or “subcontractor” representation.
• All mission aspects were represented.
• No input from customers or subcontractors.
Style • Scheduled, informal
• At the onset, the facilitator indicated that the meeting was to “throw ideas out in the open for discussion and develop new ones”.
• Each individual was given the opportunity to discuss the LL they thought were important in their area.
• All followed that pattern, waiting for their turn, although, at times, free exchanges between any of the participant occurred in a spontaneous manner.
• Facilitator was very successful to the smooth progression of the meeting.
• The style of the meeting fit the style of the participants and they all seemed comfortable to talk freely.
• The informality of the meeting also made some of the participant somewhat ill-prepared (no notes, little retrospection)

190
Table 71: Observations from Post-mortem Review at KSC-Summary#2 Issue Answer Comments Strengths Weaknesses Participants’ attitude toward meeting
• Although some were better prepared than others, most contributed LL from their experience with the mission
• Prior to meeting, facilitator was someone nonchalant about the importance of the meeting.
• All participants had written lists of items to talk about except 2.
• One “system” even distributed to all participants a written documents listing the problems they faced, the LL from them, and potential future actions.
• One participant seemed to be “not involved” in the meeting and working on something else away from the others.
• Another participant seemed to be the “note-taker” for the meeting, while a third one, although listening to all comments and taking notes, did not participate in the discussion
• Almost participants focused on the problems they faced in their area, offered some potential solutions, or foreworn for potential future problems, and seemed truly interested to learn from their experience and not to reinvent to the “wheel”
• Only one participant had a somewhat “hostile” attitude toward another one, and was more eager to blame. The exchange may have generated some ideas, but I did not feel that either party was satisfied or committed to “change”
• Almost all seemed eager to learn from their experience to improve future performance.
• One participant focused on specific issues that arose during the mission, putting blame on another department without self-introspection, and was not happy with the explanation offered. This seemed to offer very little to the overall review process.
Process used in the meeting
• Each participant offered 3 or more “issues” they faced during the missions
• Most issues were “problem” issues, although on 1 or 2 occasions some positive events were mentioned.
• Some free “brain-storming” moments also took place when warranted.
• Participants were free to bring to the table issues they viewed important during the mission
• Facilitator may have wanted to ask direct generic questions to stir the meeting instead of leaving the course to the participants

191
Table 72: Observations from Post-mortem Review at KSC-Summary#3 Issue Answer Comments Strengths Weaknesses Outputs • A list of the
issues/problems addressed in the meeting was gathered with the LL from them and potential or suggested solutions
• This document is to be distributed to all meeting participants for their review.
• When approved by all, then it will be sent to the facilitator for his final review, and then posted on the LL web site (from what I understood).
• LL will be documented and reviewed by the participants
• Only outputs from the team members. No outputs from customers or subcontractors (also mentioned in the meeting as a drawback by one of the participants).
Outcomes • It appears that the majority of the participants seriously learned from issues they faced and are eager not to face them in future mission.
• Unless management sincerely requires for future projects to study the lessons learned, it does not appear that the outputs of this meeting will be used for increasing knowledge (this was also a concern mentioned in the meeting by one of the participant).
• Personally, I felt that this meeting was like a debriefing where the LL will be gathered, available for future projects, only if the future teams actively decide to study them.
• Some important LL have been drawn from the meeting.
• Will it be helpful for future missions?
• Will the LL be required to be studied prior to future missions?
From the observations witnessed during the meeting, this research discovered certain enablers
and barriers to the efficiency of the PR process which are further discussed in the next Chapter.
4.6. Written Interviews: Open-ended Questions in Survey.
This research included 4 open-ended questions in the survey in order to determine the opinions
of the respondents with regard to the 4 different types of reviews.
Table 73 provides the narrative for each question.
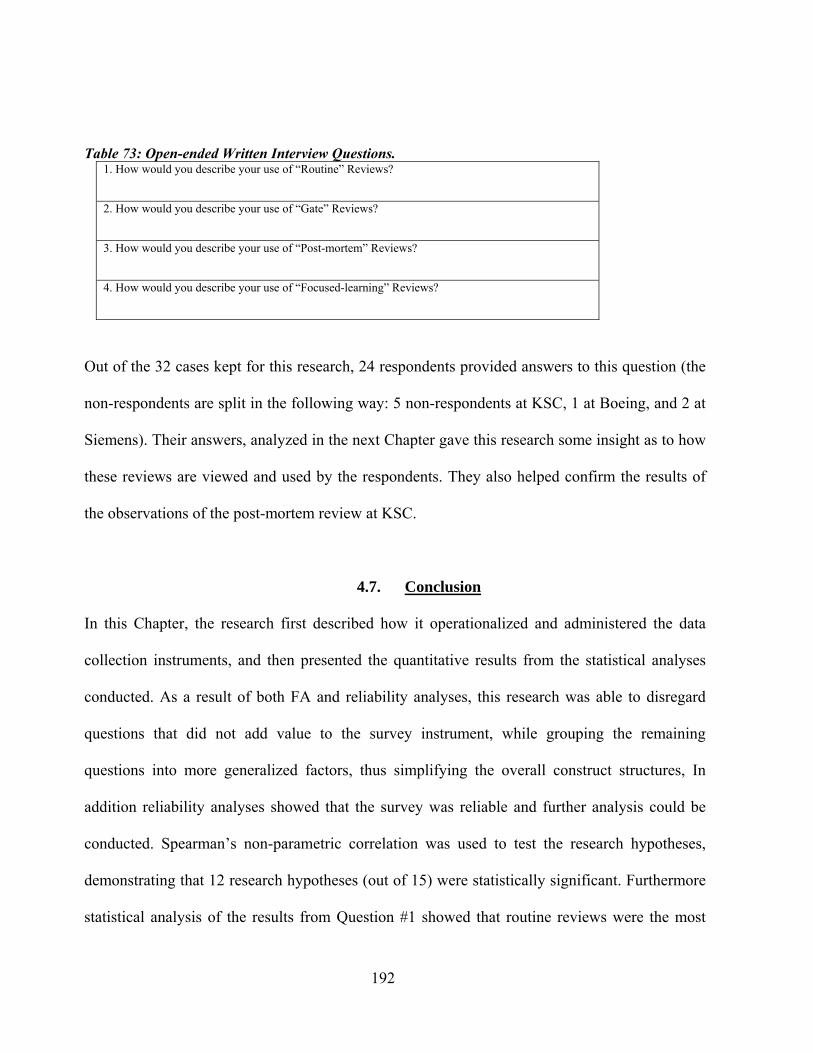
192
Table 73: Open-ended Written Interview Questions. 1. How would you describe your use of “Routine” Reviews?
2. How would you describe your use of “Gate” Reviews?
3. How would you describe your use of “Post-mortem” Reviews?
4. How would you describe your use of “Focused-learning” Reviews?
Out of the 32 cases kept for this research, 24 respondents provided answers to this question (the
non-respondents are split in the following way: 5 non-respondents at KSC, 1 at Boeing, and 2 at
Siemens). Their answers, analyzed in the next Chapter gave this research some insight as to how
these reviews are viewed and used by the respondents. They also helped confirm the results of
the observations of the post-mortem review at KSC.
4.7. Conclusion
In this Chapter, the research first described how it operationalized and administered the data
collection instruments, and then presented the quantitative results from the statistical analyses
conducted. As a result of both FA and reliability analyses, this research was able to disregard
questions that did not add value to the survey instrument, while grouping the remaining
questions into more generalized factors, thus simplifying the overall construct structures, In
addition reliability analyses showed that the survey was reliable and further analysis could be
conducted. Spearman’s non-parametric correlation was used to test the research hypotheses,
demonstrating that 12 research hypotheses (out of 15) were statistically significant. Furthermore
statistical analysis of the results from Question #1 showed that routine reviews were the most
193
conducted in a statistically significant fashion compared to the other types of reviews. Finally the
responses to the open-ended questions and the observations gathered from the post-mortem
review provided this research with insights on project review enablers, barriers, and best
practices.
The next Chapter is focusing on the interpretation of the quantitative results, and is also offering
an analysis of the open-ended questions of the survey and the observations from the post-mortem
review to further determine PR enablers and barriers. Based on the findings, managerial and
theoretical implications will be provided.
194
CHAPTER FIVE: FINDINGS, CONCLUSIONS, and IMPLICATIONS
5.1. Introduction
The previous Chapter described how the data survey instrument was developed, conducted, and
how the results were analyzed for both validity and reliability. Based on the obtained results the
research hypotheses were tested (Spearman’s rho rank correlation coefficient) and showed that
12 out of the 15 hypotheses tested positive at α=0.1.
This Chapter 5 will interpret the results of both the FA results and the correlation analyses. In
addition, an analysis of the answers from the survey question on review frequency, observations
from the KSC post-mortem review attendance, and an account of the written open-ended
question answers from the survey will be utilized to further elaborate the results obtained from
the measured constructs and identify the PR barriers and enablers.
From the obtained findings, this research will then present 5 overall conclusions with managerial
and/or theoretical implications regarding project reviews as well as areas for future research
resulting from this analysis. Finally lessons learned during this research and a final conclusion
will be provided.
5.2. Findings and Conclusions
The following section describes in details the findings and 5 conclusions obtained from the
results presented in Chapter 4. For clarification purposes, a copy of Table 64 is given below.
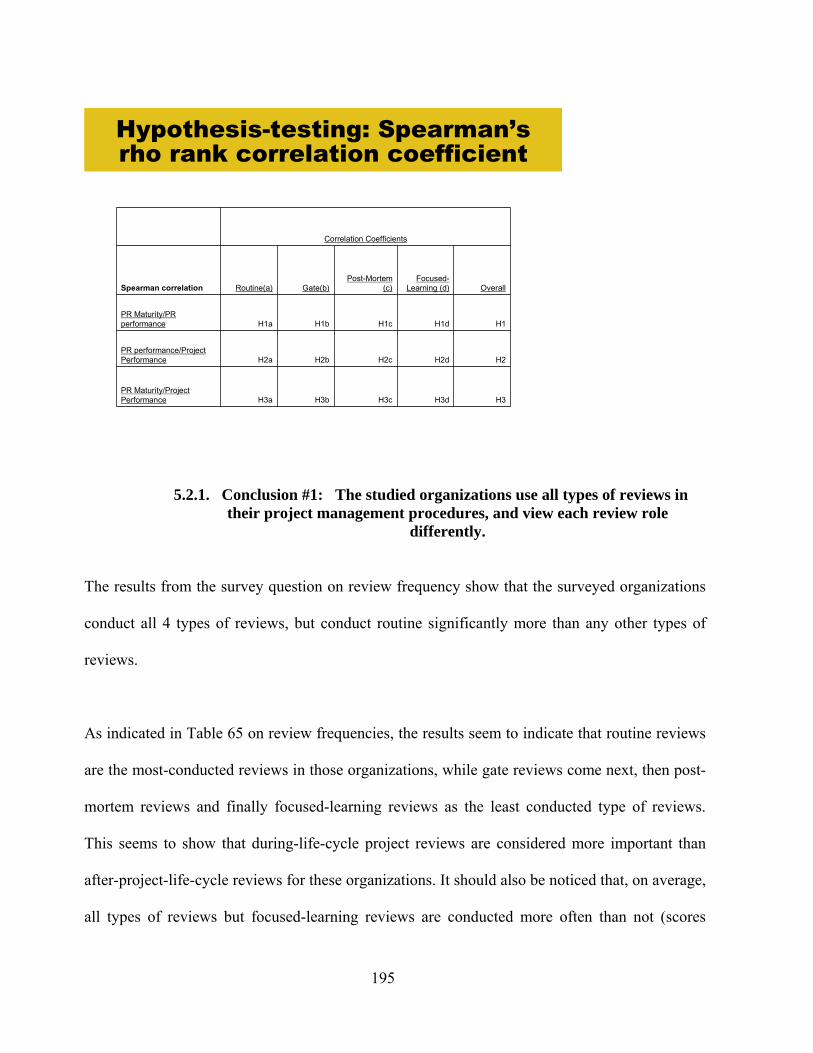
195
Hypothesis-testing: Spearman’srho rank correlation coefficient
Correlation Coefficients
Spearman correlation Routine(a) Gate(b)Post-Mortem
(c)Focused-
Learning (d) Overall
PR Maturity/PR performance H1a H1b H1c H1d H1
PR performance/Project Performance H2a H2b H2c H2d H2
PR Maturity/Project Performance H3a H3b H3c H3d H3
5.2.1. Conclusion #1: The studied organizations use all types of reviews in their project management procedures, and view each review role
differently.
The results from the survey question on review frequency show that the surveyed organizations
conduct all 4 types of reviews, but conduct routine significantly more than any other types of
reviews.
As indicated in Table 65 on review frequencies, the results seem to indicate that routine reviews
are the most-conducted reviews in those organizations, while gate reviews come next, then post-
mortem reviews and finally focused-learning reviews as the least conducted type of reviews.
This seems to show that during-life-cycle project reviews are considered more important than
after-project-life-cycle reviews for these organizations. It should also be noticed that, on average,
all types of reviews but focused-learning reviews are conducted more often than not (scores
196
above 3). Furthermore, after conducting non-parametric sum of the rank analysis as shown in
Chapter 4, Section 4.4, the results suggest that this research can only confirm that the difference
between routine and any other type of reviews is statistically significant. This suggests that the
respondents indicated that they conducted routine reviews the most, and although they also
conducted gate, post-mortem, and focused-learning reviews (in ascending order of frequency),
this research could not prove that the differences between these frequencies were statistically
significant. Therefore this research concludes that the surveyed organizations conduct all 4 types
of reviews, but conduct routine significantly more than any other types of reviews.
When analyzing the answers to the open-ended written questions in the survey as shown in Table
73 in Chapter 4, this research found that the respondents viewed each type of reviews very
differently.
a) Routine reviews:
Routine reviews are viewed as fundamental to PM to promote internal team communication
and project status and challenge identification. The common theme about how routine
reviews are used is as a means to keep the team and management up-to-date with project
current status and potential up-coming issues. As one of the respondents stated, they are “a
communal sharing of experience between members of the project, to allow them to
communicate status and control internally”. Overall, these reviews are held frequently within
the team, to check on project status, and to try to solve any foreseen issues internally with the
team members. They are viewed as fundamental to the overall project methodology and
treated as the first attempt to resolve any problems inside the team before greater issues arise.
These opinions are consistent with the results obtained in the correlation analysis where

197
project performance was both highly correlated to routine review PR performance and PR
maturity (H2a and H3a) as shown in Table 63 in Chapter 4.
b) Gate reviews:
Gate reviews are perceived as ready (or not)-to-proceed reviews. There were 7 non-
respondents for the questions pertaining to this type of review. These reviews are viewed as
“decision” reviews, where target schedules and milestones are checked to see if they are on
track. They are used to correct off-track projects. They also are used to reconnect with the
stakeholders’ expectations and also to gain management concurrence. They are utilized to
assess if a project status is par with the scheduled objectives and whether or not it is
appropriate to move on to the next step, and to provide formal deliverable documentation.
This research concludes that because the respondents view these reviews more like a
“checking” process than a learning experience, respondents do not perceive a strong
relationship between gate PR maturity and project performance as the correlation results in
Table 63 shows (H3b).
c) Post-mortem reviews:
Post-mortem reviews focus on lessons learned but can also be used as blame sessions. 9
respondents did not offer any comments for these reviews. Often the term used for these
reviews was “lessons learned”. They are viewed as an opportunity to focus on process issues
for future project. However, the words “scapegoating”, “complaining”, “blaming” were
mentioned in the answers suggesting that not all respondents viewed these reviews as an
opportunity to create knowledge but rather as an occasion to blame people. Furthermore, one
of the respondent specified that since there was no central repository to house lessons learned
during these reviews, it was like “throwing them in the garbage” after having documenting
198
them. Except for KSC, the respondents in the other participating organizations cited that
these reviews, when existent, only took place for “important” projects (money or man-hour
wise) or when a highly visible problem was identified. These findings seem to indicate that
the respondents did not feel their organizations viewed the results from these reviews (PR
performance as impact on project performance, knowledge on PM procedures, and
knowledge on project status) as useful at improving project performance as routine or gate
reviews’ finding as the statistical results of the correlation analysis shows in Table 63 in
Chapter 4 (H2c=21.4%).
d) Focused-learning reviews:
Focused-learning reviews are the least used and least influential on project performance
although they are perceived as potential brainstorming meetings to develop and learn long-
term organizational policies. 11 respondents did not choose to answer the questions. This
finding is also confirmed by the quantitative answers to the review frequency question as
shown in Table 64 in Chapter 4 where focused-learning reviews had the lowest mean (2.55).
They are viewed as brain-storming sessions, annual strategic planning sessions to 1) resolve
specific problems, and 2) gain knowledge on organizational long-term goals and directions.
As shown in Table 63 (H2d=10.5% and H3d=15.2%), the statistical results also parallel the
qualitative results, as the respondents view the relationship between project performance and
both PR maturity and PR performance of focused-learning reviews the weakest among all 4
types of reviews.
Table 74 below summarizes the results from the open-ended survey questions for each type
of reviews.

199
Table 74: Summarized Answers to the Survey Open-ended Questions Review Types Comments Routine • Used to promote communication within the team
• Used as a tool to internally control potential problems • Frequently held and viewed as fundamental to overall project
methodology Gate • Used to check if project deliverables are par with scheduled objectives
• Used to reconnect with project stakeholders • Used to formal document deliverables to gain management
concurrence • Ready to proceed reviews.
Post-mortem • Used to gather “lessons learned” to focus on process issues for future project
• Also viewed as a possible “blaming” experience • Not frequently used except for “important” projects
Focused-learning
• Least often used • Used as brainstorming session to resolve specific problems • Used as a means to develop and gain knowledge on long-term
organizational goals.
5.2.2. Conclusion #2: Some reviews are more related than others to project performance, although generally, review maturity and performance are
significantly relevant to project performance.
From the correlation analyses, this research showed that there is a statistically significant
correlation between project performance and overall PR maturity, project performance and
overall PR performance, and overall PR maturity and overall PR performance; Therefore,
reviews are important to project performance.
To further test the hypotheses in an ore stringent manner, the research also conducted the
correlation analyses at α=0.05.
Table 75 shows the results at α=0.05

200
Table 75: Spearman's Correlation
Hypothesis-testing: Spearman’s rho rank correlation coefficient (α ≤ 0.05)
Correlation Coefficients Degree of significance ≤ 0.05
Spearman correlation Routine (a) Gate (b)
Post-Mortem
(c)
Focused-Learning
(d) Overall Routine GatePost-
MortemFocused-Learning Overall
PR Maturity/PR performance 0.251 0.12 0.314 0.409 0.327 NA NA 0.05 0.01 0.05
PR performance/Project Performance 0.394 0.278 0.214 0.105 0.36 0.05 NA NA NA 0.05
PR Maturity/Project Performance 0.425 0.287 0.46 0.141 0.535 0.01 NA 0.01 NA 0.01
8 out 15 hypotheses are significant
Black font = Statistically significant correlationBlue font = Not-statistically significant correlation
Table 76 below also provides the p-values associated with the correlation coefficients.

201
Table 76: Correlation Coefficient P-Values
Correlation Coefficients P-values
Spearman correlation Routine(a) Gate(b)
Post-Mortem (c)
Focused-Learning
(d) Overall Routine GatePost-
MortemFocused-Learning Overall
PR Maturity/PR performance 0.251 0.12 0.314 0.409 0.327 0.083 0.257 0.04 0.01 0.06
PR performance/Project Performance 0.394 0.278 0.214 0.105 0.36 0.013 0.062 0.120 0.283 0.043
PR Maturity/Project Performance 0.425 0.287 0.46 0.141 0.535 0.008 0.056 0.004 0.221 0.002
Hypothesis-testing: Spearman’s rho rank correlation coefficient : p-values
The results indicate that project performance is significantly related to the overall maturity of
project reviews, and the overall project review performance at both α=0.05 and α=0.1,
suggesting that high PR maturity and successful PR performance are significantly positively
correlated to project performance. The overall research hypotheses have been tested successfully
(H1, H2, and H3). It should be noted that the relationship is stronger between PR maturity and
project performance (53.5%) versus PR Performance and project performance (36%), or PR
maturity and PR performance (32.7%). These findings suggest that organizational beliefs and
actions toward learning and reviews, along with knowledge transfer (PR maturity construct) are
more central concepts to project performance than the actual knowledge of project procedures
and how this knowledge impacts the project performance (PR performance). Therefore,
corporate, managerial buy-in to believe in learning from reviews and set aside the appropriate
resources for reviews is paramount.

202
With regard to each individual type of reviews, the correlation analyses indicate that some
review types are more related than others concerning project performance. Specifically, routine
and post-mortem reviews are viewed as having a greater relationship with project performance
than gate and focused-learning reviews.
First, the results of the correlation analysis at α=0.1 in Table 63 in Chapter 4 shows that the PR
maturity and PR performance of routine, gate and post-mortem reviews ( H2a, H2b, H2c, H3a,
H3b, and H3c) are statistically significantly positively related to project performance while
focused-learning are not at (H2d and H3d).
Second, the results also shows that the highest correlation coefficients between PR maturity and
project performance are for routine and post-mortem reviews (H3a=42.5% and H3c=46%), vs.
gate reviews (H3b=28.7%) or focused-learning reviews (H3d=15.2%).
Thirdly, at α = 0.05 (Table 75), neither maturity nor PR performance of gate reviews are
significantly related to project performance (H2b and H3b). This result indicates that gate
reviews are not specifically linked to project performance itself by the respondents but more as a
ready-to-proceed review as indicated in the previous section. Further investigations can be taken
to understand the value of the gate reviews.
203
Fourthly, although at α=0.05, post-mortem PR performance also becomes not-significantly
related to project performance (H2c), both PR maturity of routine and post-mortem reviews
remain significantly related to project performance (H3a and H3c).
Therefore this research concludes that routine and post-mortem reviews, especially when dealing
with their PR maturity (organizational beliefs towards learning and reviews, organizational
actions toward learning and reviews, as well as knowledge transfer), have a stronger relationship
with project performance than gate or focused-learning reviews.
It should also be noticed that the correlation coefficients between PR performance and project
performance are higher for routine and gate reviews (H2a=39.4% and H2b=27.8%), than those
of post-mortem (H2c=21.14%), and focused-learning reviews (H2d=10.5%) These findings
indicate that the respondents viewed routine and gate reviews as the review types where the
knowledge gained on PM procedures and the knowledge on the impact on the project
performance (PR performance) to be the most relevant/related to project performance. This may
result from the fact that post-mortem and focused-learning reviews are conducted post projects
and therefore are viewed as having little impact on project performance.
In addition, this research concludes that gate reviews are viewed as having little impact on
project performance (H2b, H3b) based on the results in Table 63. At α=0.05, neither gate PR
maturity or gate PR performance correlated with each other or with project performance in a
significant manner (H1b, H2b, and H3b). Based on these results and answers from the written
open-ended questions, this research hypothesizes that gate reviews are viewed more as stop-or-
204
go opportunity where projects are given either a red or green light to continue, rather than a tool
to improve project performance to better project delivery.
Finally, concerning focused-learning reviews, this research concludes that they are viewed as not
related to project performance (H2d and H3d), while project specific reviews are significantly
related to project performance (H2a, H3a, H2b, H3b, H2c, H3c). Even at α=0.1, focused-learning
PR maturity and PR performance and not significantly related to project performance (H2d and
H3d). The research concludes that these results indicate project-specific reviews (directly related
to an explicit project) correlate with project performance, while reviews across multiple projects
(focused-learning) are not viewed by the respondents as significantly linked to project
performance.
5.2.3. Conclusion #3: Organization culture (beliefs, expected actions, etc.) is not significantly relevant to project team members when assessing project
status or PM procedures during project life-cycle.
Organizational beliefs and actions toward learning and reviews (PR maturity construct) are
considered not specifically related to knowledge on PM procedures or knowledge on project
status (PR performance) for routine and gate reviews (H1a and H1b). This is especially true for
gate reviews, but also for routine reviews at α=0.05 as Table 75 indicates above, where both
H1a and H1b are not significant.
This research concludes that learning about a project status and challenges (such as routine and
gate reviews) during the project life-cycle is more linked to the project team beliefs and actions

205
versus the organizational culture and beliefs. Therefore, routine and gate review processes are
more dependent on the project team than organizational policies.
On the other hand, even at α=0.05, both post-mortem and focused-learning PR maturity and PR
performance are significantly positively correlated (H1c and H1d) unlike routine and gate
reviews. Organizational beliefs and actions toward learning and reviews (PR maturity
construct) are considered specifically related to knowledge on PM procedures or knowledge on
project status (PR performance) for post-mortem and focused-learning reviews. This research
concludes that post-mortem and focused-learning reviews are closely related to organizational
policies.
5.2.4. Conclusion #4: Post-mortem and focused-learning reviews are linked with higher levels of learning than routine and gate reviews.
With regard to PR maturity and PR performance, both post-mortem and focused-learning
reviews need a broader scope of factors to explain the constructs than those of routine and gate
reviews as shown in Tables 54 and 58 in Chapter 4.
After conducting the factor analyses for the PR maturity and PR performance constructs, this
research showed that for both PR maturity and PR performance, the routine and gate reviews
load on 2 factors, while post-mortem and focused-learning reviews load on 3 factors. This
conclusion parallels the assumption that higher levels of learning (PM managerial issues) are
handled during post-mortem and focused-learning reviews than during routine and gate reviews
(status, impact on project performance). Therefore, the underlying structures of post-mortem

206
and focused-learning reviews are more intricate than those of routine and gate reviews and
require more factors.
This research also concludes that the similarity of the factor structure between routine/gate
reviews and post-mortem/focused-learning reviews indicates that these two groups of reviews
are dependent on common factors. This conclusion can be explained by the fact that both
routine and gate reviews are conducted during the project life-cycle versus post-mortem and
focused-learning reviews, and/or that routine and gate review frequencies are higher than post-
mortem and focused-learning reviews.
5.2.5. Conclusion#5: Effective reviews need managerial support:
As specified in the previous Chapter, this research attended a post-mortem review at KSC for a
satellite launch mission. Tables 69, 70, and 71 in Chapter 4 provide a summary of the
observations. One of the purposes of the research was to identify the main enablers, barriers,
and best practices to conduct effective reviews. The identified results from the attended review
showed that the main enablers (fostering an atmosphere for further learning from past
experience, promoting the necessary resources to conduct reviews, etc.) and the main barriers
(lack of use of the review results, review sessions used as blaming arenas, etc.) are all under
managerial control and need managerial support/action.
Therefore this research concludes managerial and organizational support to conduct (effective)
reviews is essential.
207
The following section describes in greater details the findings that this research gathered during
the post-mortem review attendance.
a) Main enablers
• The use of a facilitator: This person made sure that the meeting was somewhat organized
with smooth transitions between the participants and helped clarified some unclear issues
to the participants.
• The right participants: All aspects of the project were represented.
• The genuine will to learn from past actions: The participants seemed genuinely eager to
learn from the past to improve the future.
• The PR logistics: Time (a 2-hour window) was set aside for the participants to meet.
b) Main barriers
• The “blame game”: during this phase, hostility between the participants was palpable,
defensive behaviors emerged and no solutions were reached.
• The lack of supplier/contractor/customer participation: By not having these key
stakeholders present during the process, the review lacked the opinions of “outsiders”
looking in, and only focused on internal actions.
• The uncertainty of the use of the review results: The opinion that the data from the
review will not be used in the future hinders its efficiency, and lowers the efforts to
retrospect.
• The PR logistics: The data did not seem to go deep enough to find the root causes of the
problems (lack of preparation for the review by the participant).
Table 77 summarizes the main enablers and barriers as witnessed by this research.
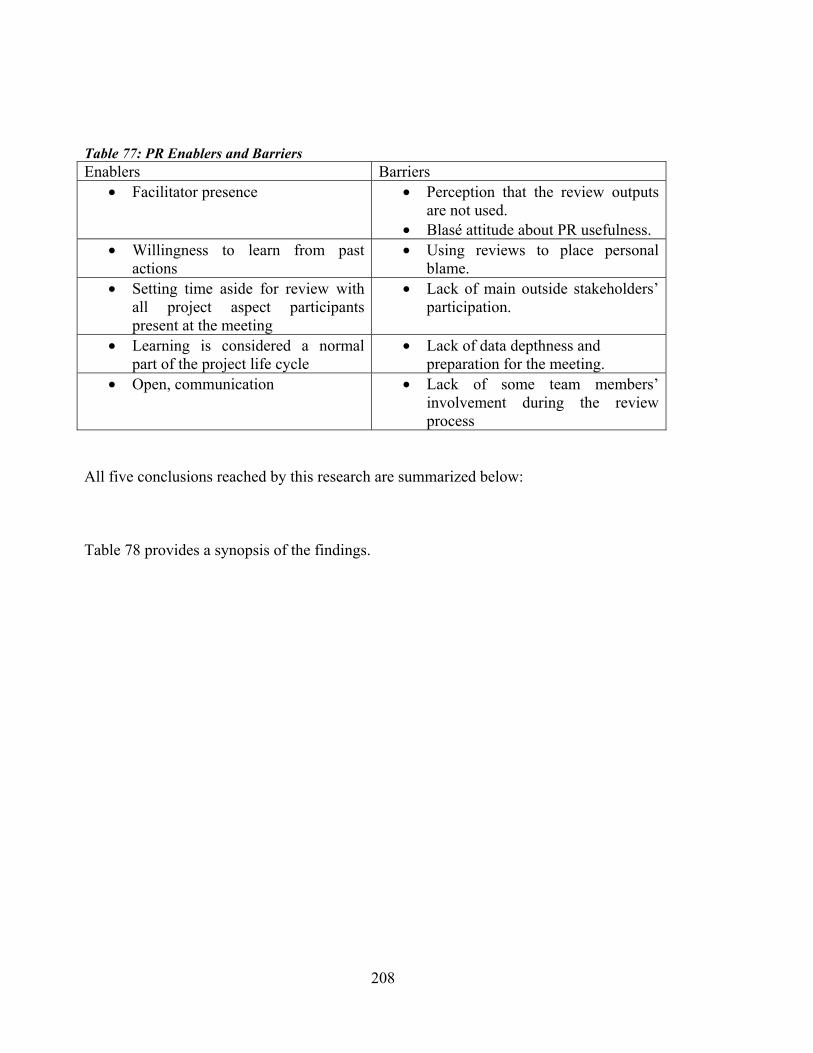
208
Table 77: PR Enablers and Barriers Enablers Barriers
• Facilitator presence • Perception that the review outputs are not used.
• Blasé attitude about PR usefulness. • Willingness to learn from past
actions • Using reviews to place personal
blame. • Setting time aside for review with
all project aspect participants present at the meeting
• Lack of main outside stakeholders’ participation.
• Learning is considered a normal part of the project life cycle
• Lack of data depthness and preparation for the meeting.
• Open, communication • Lack of some team members’ involvement during the review process
All five conclusions reached by this research are summarized below:
Table 78 provides a synopsis of the findings.
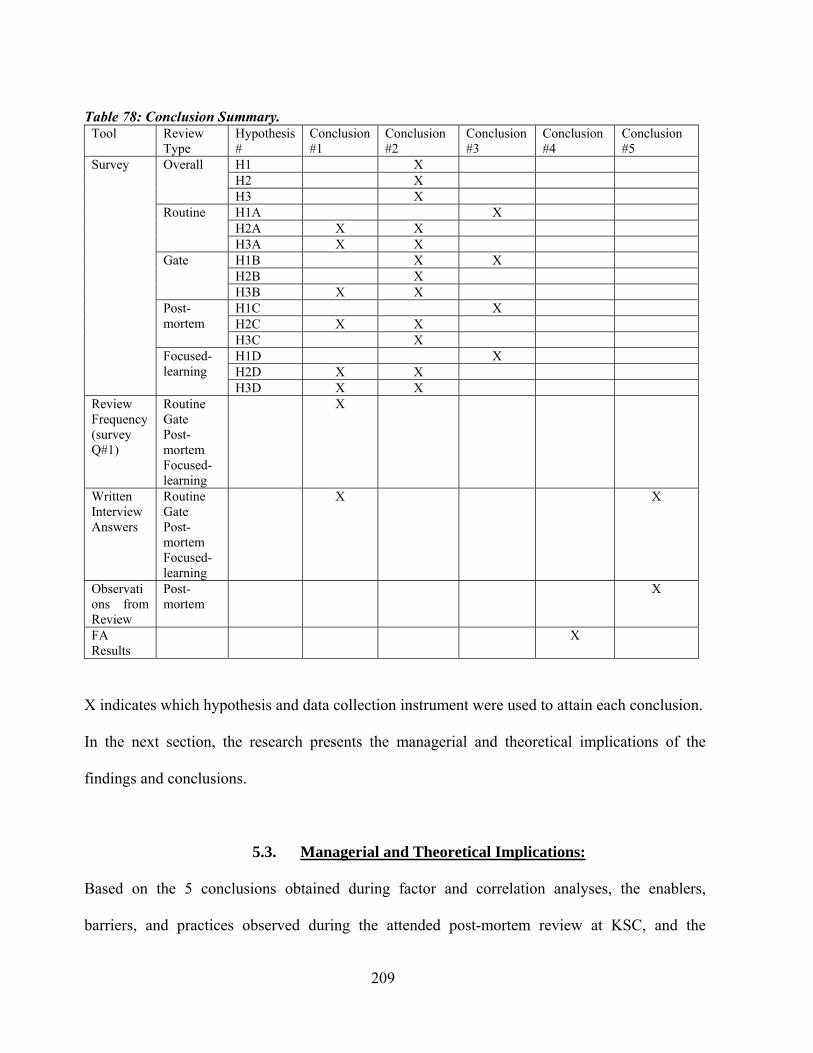
209
Table 78: Conclusion Summary. Tool Review
Type Hypothesis #
Conclusion#1
Conclusion#2
Conclusion#3
Conclusion#4
Conclusion #5
H1 X H2 X
Overall
H3 X H1A X H2A X X
Routine
H3A X X H1B X X H2B X
Gate
H3B X X H1C X H2C X X
Post-mortem
H3C X H1D X H2D X X
Survey
Focused- learning
H3D X X Review Frequency (survey Q#1)
Routine Gate Post-mortem Focused-learning
X
Written Interview Answers
Routine Gate Post-mortem Focused-learning
X X
Observations from Review
Post-mortem
X
FA Results
X
X indicates which hypothesis and data collection instrument were used to attain each conclusion.
In the next section, the research presents the managerial and theoretical implications of the
findings and conclusions.
5.3. Managerial and Theoretical Implications:
Based on the 5 conclusions obtained during factor and correlation analyses, the enablers,
barriers, and practices observed during the attended post-mortem review at KSC, and the

210
respondents’ answers to the written open-ended questions, this research has determined
managerial and theoretical implications for project reviews and future potential areas of research
in the subject.
First managerial implications will be discussed.
5.3.1. Managerial Implications:
This research shows that there is a significant positive relationship between the review process
(maturity level and performance) of an organization and its project performance. The
relationship is the strongest between PR maturity and project performance (53.5%) than PR
performance and project performance (36%). Therefore managers should promote the use of
effective reviews in order to improve project performance.
Furthermore, project performance is significantly related to the maturity of all types of reviews,
except focused-learning reviews. It is especially related to the PR maturity of routine and post-
mortem reviews. Similarly, project performance is significantly related to the PR performance of
all reviews, except focused-learning reviews (no statistically significance). Therefore this
research concludes that project performance is more directly linked to reviews of specific
projects (routine, gate and post-mortem) than focused-learning reviews which focus on the
findings of several projects. These findings suggest that project managers should place a higher
emphasis on routine, gate, and post-mortem reviews as tools to improve project performance. On
the other hands, the results of this research also show that the results for gate reviews are not as
statistically significant as those of routine and post-mortem review. These results lead this

211
research to conclude that routine and post-mortem reviews are more significant to project
performance than gate and focused-learning reviews. Therefore, project managers should
especially promote the use of routine reviews and post-mortem reviews to help improving
project performance.
In addition, since all types of reviews are conducted, managers should further analyze how gate
review outputs could be used as learning tools versus stop-and-go tool, and how focused-
learning reviews could be effectively used as a brainstorming tool to further organizational PM
development.
This research also provided a practical tool to measure PR maturity in the form of a survey,
providing a mean to create measurements for the maturity of specific reviews, as well as overall
review. With this survey, an organization can measure where it stands for each review, and
identify which area(s) of the PR processes, the organization should focus on to improve its PR
maturity, and therefore its project performance.
In addition, managers should ensure that the appropriate resources (time, data, team members)
are available to conduct reviews. It is also paramount that they encourage learning from past
action in a non-threatening environment with open communication.
Finally, managers should make certain that the information obtained from the review is actually
used to improve future project.

212
The next section will discuss theoretical implications and areas for future potential research.
5.3.2. Theoretical implications and Areas for Future Potential Research:
This research focused on project reviews and their relationships with project performance.
Although some limitations are due to the sample size and selection, this study is one of the first
to show a direct positive and significant relationship between project review and project
performance. The relationship implies that there is a close positive correlation between the PR
processes and project performance, and therefore additional research should be conducted on the
review processes to further investigate the relationship between the constructs, better define, and
refine the underlying factors. Some future research in this topic could include the following
topics:
• Using the same PR maturity and PR performance measurement tool, what are the
results over time (longitudinal case study analysis)?
• Using the same PR maturity and PR performance measurement tool, what are the
results over a different (larger) sample where Pearson’s correlation analysis can be
used?
• Using the results from this research, what type of further analysis could be conducted
in order to further study why PR maturity for gate and routine reviews (to a lesser
extent) is not significantly related to PR performance for routine reviews?
• Using the results from this analysis, what type of further analysis could be conducted
to further study why focused-learning reviews seem to be the least important type of
reviews with regard to project performance?
213
• Using the results from this research, what further analysis can be done do further
study the role of gate reviews?
• Using the 4 types of reviews as defined in this research, what type of further analysis
could be conducted to quantify overall PR maturity other than averaging (such as
regression analysis), and what type of further analysis could be performed to further
explain the routine, gate, post-mortem, and focused-learning structure?
The next section summarizes the overall steps this research went through and the overall results.
5.4. Lessons Learned during the Research Process:
The main lesson learned during this research is that this is an on-going ever-changing research
process.
First, although the overall area of the research was determined (project management models and
review processes), finding a specific topic was a difficult task; the topic was refined over the
course of the study, based on the literature review results, and the practicality of conducting the
research (such as access to potential sample, time constrains, etc.). This process of finally finding
a specific research area was the most frustrating aspect of the research as it often felt as two steps
forward, one step behind.
Secondly, the literature review has proven to be a highly time-consuming process. It was
important for this research to spend time to create an organized system to keep track of what was
read, learned, etc., so that the research could easily retrieve the necessary data when needed
214
without wasting time. Using electronic-based access via the internet to various repository
databases was a massive time-saving tool for this research.
Thirdly, this research found that the “research methodology” expected from graduate students is
an evolving process that needs to be experienced first-hand and arises from the completion of the
previous research processes. For example, the notion of research conceptualization and
operationalization (construct definitions with underlying measurable factors, hypothesis
definitions, and data collection instrument descriptions for further statistical analyses) started to
be meaningful to this research only after the understanding of the chosen research topic through
the literature review and what was expected from the research. This was a major step in this
research, and graduate students should be made clear that the research process is an on-going
one, where concepts are learned and understood one after another.
Fourthly, this research was confronted by the reality of the research area, i.e., what and how it
intended to do the research, and what it could do. This was especially apparent with the
administration of the survey and the number of respondents. Getting a large and randomized
sample of respondents was nearly impossible to obtain and therefore the results of this research
might not be generalized.
The next section summarizes the overall steps this research undertook and the overall results
obtained.
215
5.5. Conclusion:
This research focused on project reviews, and their relationship with project performance. Over a
period of 5 years, a literature review was conducted on the topics, gaps in the literature review
were identified, three main hypotheses (and 12 underlying hypotheses) were defined to be tested
based on a conceptual model conceptualizing the research assumptions, and data collection
instruments were developed to operationalize the research. This research used a survey
instrument to obtain measures for the project review maturity construct, project review
performance construct, and the project performance construct to analyze the relationship
between these three overall constructs.
After conducting exploratory factor analysis, the factors were modified to better reflect their
underlying relationships with their respective constructs. The project review maturity construct
showed that 2 or 3 factors can best explain its structure, depending on the type of reviews.
Organizational actions toward learning, organizational actions towards learning, and knowledge
sharing (for post-mortem and focused-learning reviews) were sufficient to best explicate the PR
maturity construct. With regard to the project review performance construct, it was also
explained by 2 to 3 factors depending on the type of reviews. Knowledge on PM procedures,
knowledge on project performance, and impact on project performance (for post-mortem and
focused-learning reviews) were factors found to best describe the PR performance construct.
With regard to the project performance construct, its structure was best explained by one-factor
structure. Reliability analysis was then conducted and confirmed that the newly found construct
structures were reliable and similar results would be obtained under similar conditions. Then,
correlation analysis showed that there is a significant positive relationship between overall PR

216
maturity, PR performance, and project performance, suggesting that academicians should
research this area in greater details to find out how PR processes impact project performance.
Furthermore, this research found that gate review PR maturity or PR performance were poorly
related to project performance, indicating that this review is more considered as a stop-or-go tool
than a learning opportunity to improve project performance. Additional research is needed to
ascertain the use and value of these reviews. Focused-learning reviews maturity and PR
performance were the least related to project performance, indicating that these high-level
learning reviews, although used for organizational PM procedure improvement, have limited
impact on project performance per se. This seems to suggest that hand-on reviews specific to a
project are more valued for project performance. Further research is needed to study how
focused-learning reviews could better impact project performance. Routine (informal, frequent
reviews) as well as post-mortem reviews seem to be viewed as the most helpful for project
performance. This research therefore concludes that reviews in general are significantly related
to project performance and should be conducted by organizations. This analysis also concluded
that managerial support to conduct reviews and use their findings is crucial for effective reviews.

217
APPENDIX A: SURVEY

218
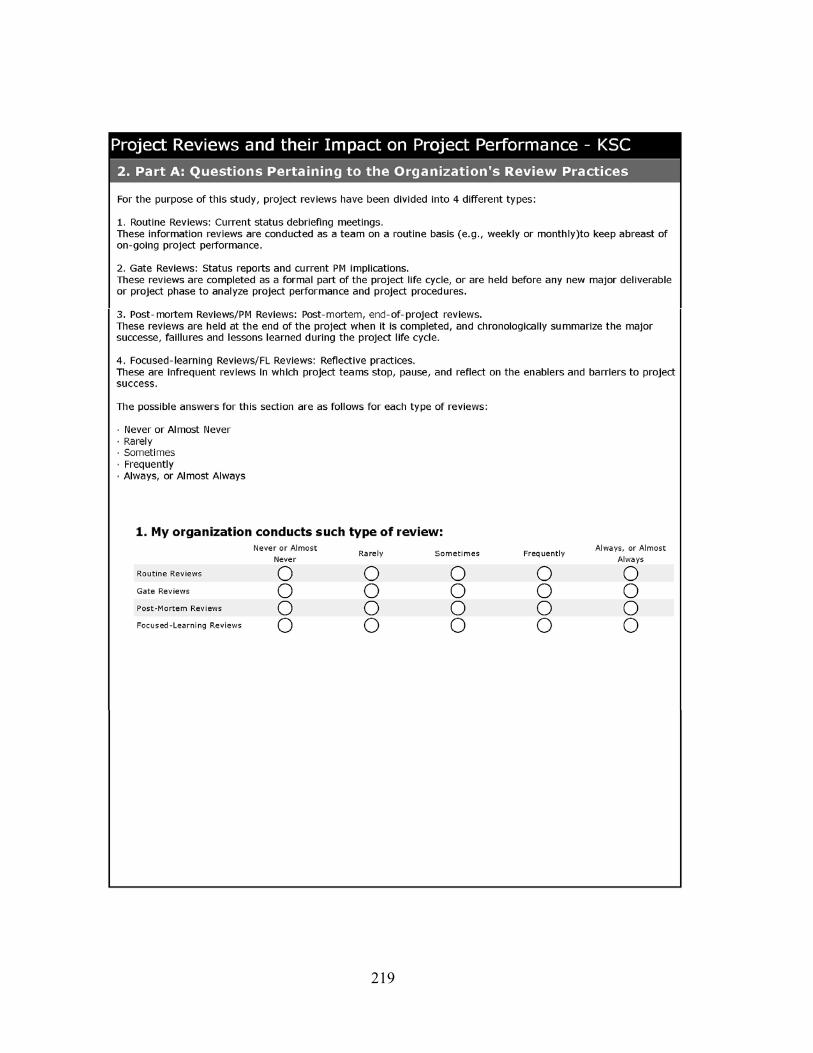
219

220
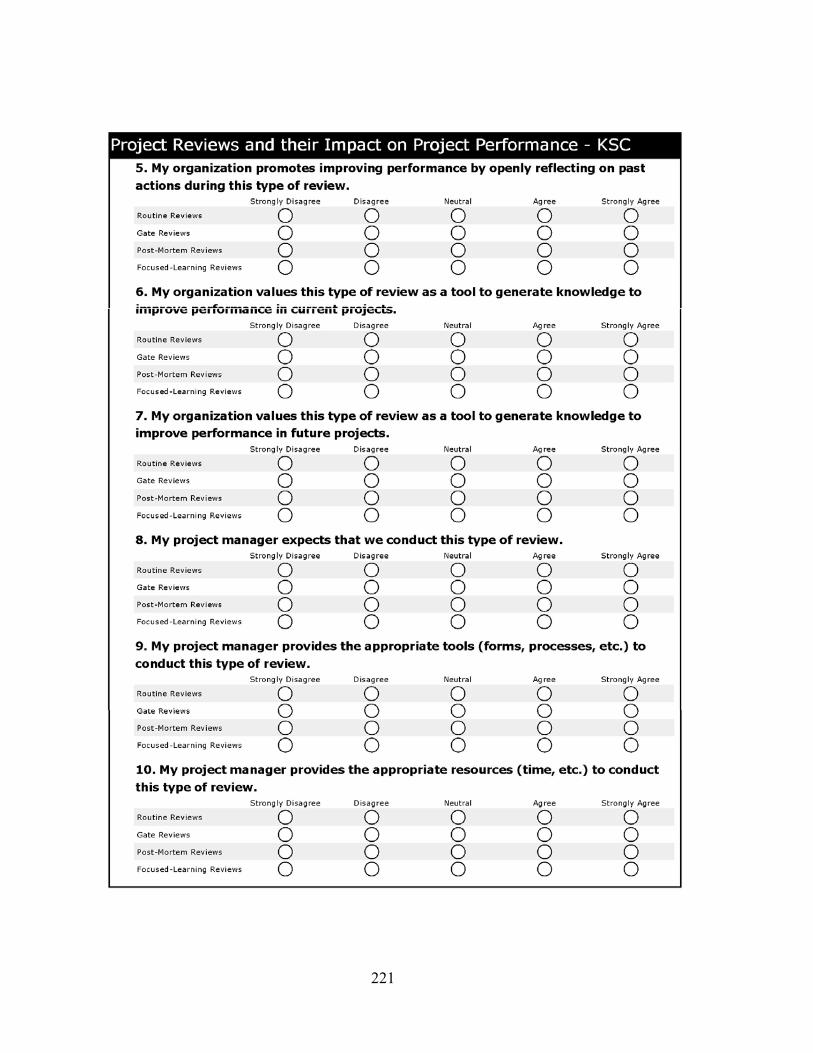
221

222
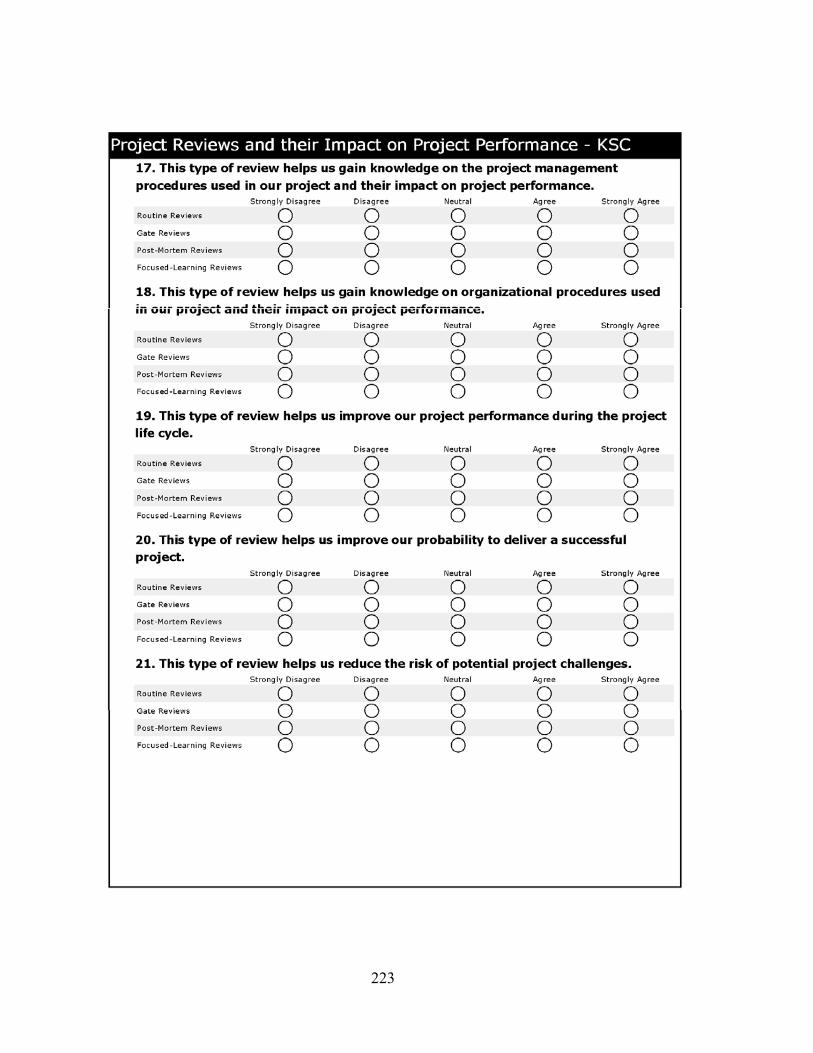
223
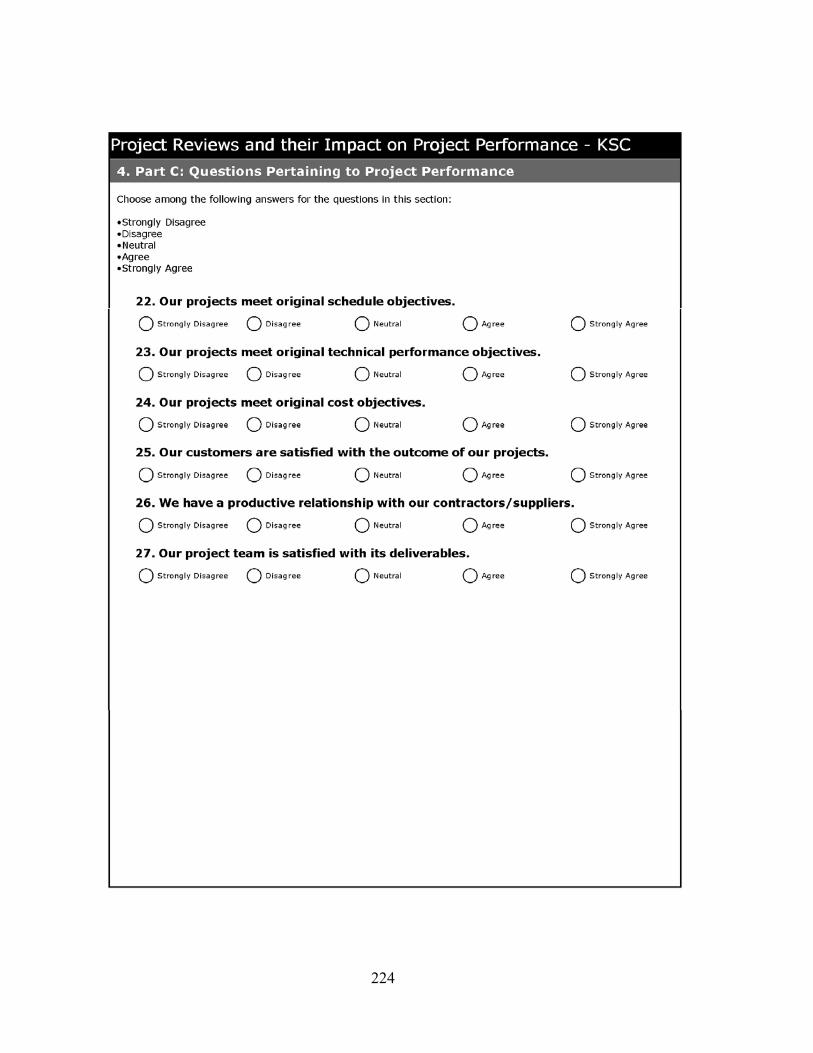
224
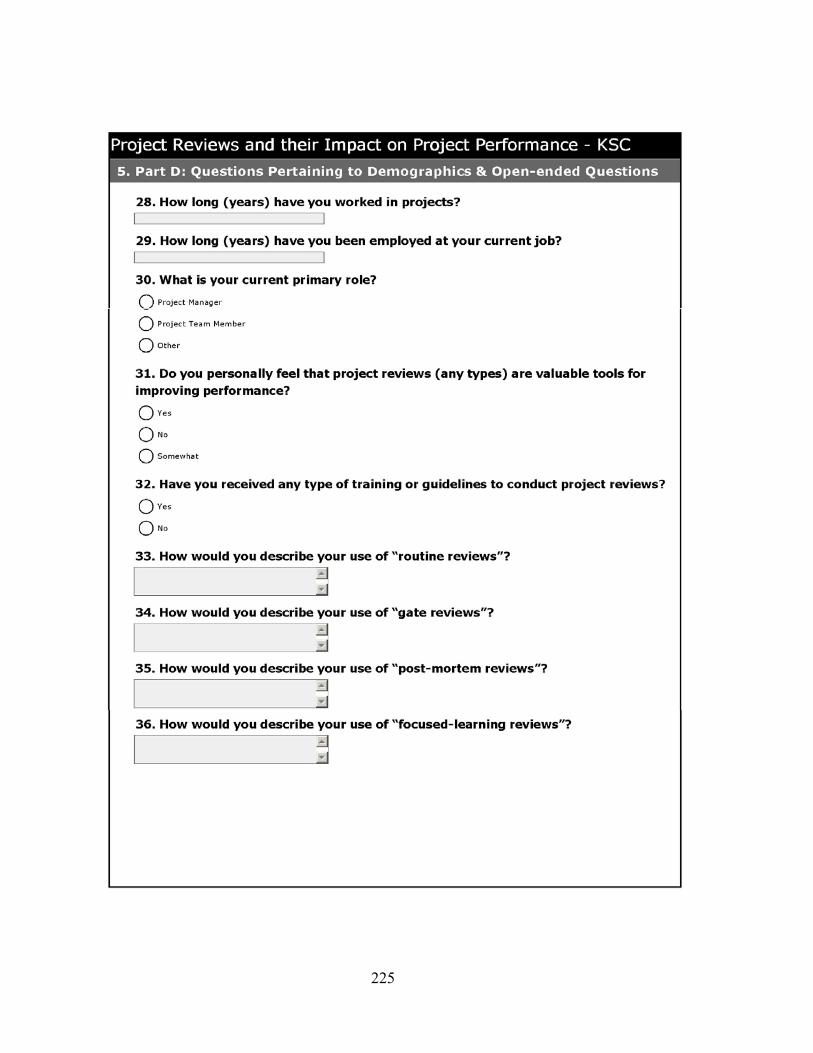
225

226
APPENDIX B: IRB HUMAN SUBJECTS PERMISSION LETTER

227

228
REFERENCES
Ali, I., Warne, L., Pascoe, C. (2001). Working and Learning Together: Social Learning in the Australian Defense Organization, Information Science Proceedings-Australia.
Alston, M., Bowles, W. (1998). Research for Social Workers. Allen and Unwin. ISBN:
1864485175. Andersen, E.S., Jessen, S.A. (2002). Project Maturity in Organizations, International Journal
of Project Management, 21, 457-461. Ayas, K. (1997). Integrating Corporate Learning with Project Management. International
Journal of Production Economics, 51, 59-67. Baskerville, R. (1999). Investigating Information Systems with Action Research,
Communications of the Association for Information Systems, 2(19). Bell Canada (1991). The Trillium Model:
http://www2.umassd.edu/swpi/BellCanada/trillium-html/trillium.html. Bollen, K.A. (1989). Structural equation with latent variables, Wiley, New York, p.206. Bourque, L.B., Clark, V. (1992). Processing Data: the Survey Example. Sage Publications.
ISBN: 0-8039-4741-0. Bredillet, C. (2003), Killing the False Gods of Project Management,
http://www.pmforum.org/library/papers/2002/falsegods_bredillet%20.pdf Busby, J. (1999a). The Effectiveness of Collective Retrospection as a mechanism of
Organizational Learning, The Journal of Applied Behavioral Science, 35( 1), 109-128. Busby, J. (1999b). Problems in error correction, Learning and Knowledge of Performance in
Design Organizations, IIE Transactions, 31, 49-59. Busby, J. (1999c). An Assessment of Post-Project Reviews, Project Management Journal,
30(3), 23-29. Carnegie Mellon University, Software Engineering Institute (CMU-SEI).
http://www.sei.cmu.edu/. Carr, S.C. (1992). A Primmer on the use of Q sort technique – Measurement and evaluation
in Counseling and Development, 25, 133-138.
229
Cooke-Davies, T., Arzymanow, A. (2002). The Maturity of Project Management in Different Industries. An Investigation into Variations between Project Management Models. International Journal of Project Management, 21(6), 471-478.
Crawford, L.H., Sompson, S., and Koll, W. (1999). Managing by Projects: A Public Sector
Approach, Proceedings for NORDNET'99: Managing Business by Projects, 608-626. Crosby, PB. (1979). Quality is Free. New York, NY. McGraw-Hill, Publishers. Cunningham, J.B. (1993). Action Research and Organizational Development, ISBN: 0-275-
94265-1. Decoster, J. (1998). Overview of Factor Analysis. http://www.stat-help.com/notes.html.
University of Alabama, Department of Psychology. De Vaus, D. (1995). Surveys in Social Research. Allen and Unwin. ISBN: 1863739394. De Weerd-Nederhof and P., Pacitti, B. (2002). Tools for the Improvement of
Organizational learning processes in innovation, Journal of Workplace Learning, 14(7/8), 320-331.
De Weerd-Nederhof and P., Pacitti, B. (2002). Tools for the Improvement of
Organizational learning processes in innovation, Journal of Workplace Learning, 14(7/8), 320-331.
Dingsoyr, T. (2005). Postmortem Reviews: Purpose and approaches in Software
Engineering, Information and Software Technology, 47(5), 293. Dinsmore, P. (1996). Toward Corporate Project Management: Beefing Up the Bottom Line
with MOBP, PM Network, (June), 10-13. Dooley, K., Subra, A., Anderson, J. (2001), Maturity and its Impact on New Product
Development Project Performance, Research Engineering Design, 13(1), 23-29. Friel, C. (2005). Notes on Factor Analysis. Criminal Justice Center, Sam Houston State
University. Frame, D. (1995). Managing Projects in Organizations, 2nd Ed., Jossey-Bass, Inc.,
Publishers, ISBN: 0-7879-01060-1. Gerbing, D., Hamilton, J. (1996). Viability of Exploratory Factor Analysis as a Precursor to
Confirmatory Factor Analysis. Structural Equation Modeling, 3, 62-72. Gaynor, G. (1996). Monitoring Projects – it’s more than Reading Reports, Research
Technology Management, 39(2), 45-47.
230
Girden, E. (2001). Evaluating Research Articles from Start to Finish. 2nd Ed., Sage Publication, Inc. ISBN: 0-7619-2214-8.
Gliner, J., Morgan, G. (2000). Research Methods in Applied Settings: an Integrated
Approach to Design and Analysis. Erlbaum. ISBN: 0-5853-3067-0. Goldenson, D., Gibson, D. (2003). Demonstrating the Impact and Benefits of CMMI: an
Update and Preliminary Results, http://www.sei.cmu.edu/sema/pdf/2003feb.pdf. Goldenson, D., Herbsleb, J. (1995). After the Appraisal: A Systematic Survey of Process
Improvement, its Benefits, and Factors that Influence Success, http://www.sei.cmu.edu/pub/documents/95.reports/pdf/tr009.95.pdf.
Herbsleb, J., Zubrow, D., Goldenson, D., Hayes, W., Paulk, M. (1997). Software Quality
and the Capability Maturity Model. Association for Computing Machinery. Communications of theACM, 40(6), 30-40.
Herbsleb,J. D., Goldenson, D. (1996), A Systematic Survey of CMM Experience and
Results. Proceedings of the International Conference on Software Engineering, Berlin, Germany in March 1996, 323-330.
Hillson, D. (2003). Assessing Organizational Project Management Capability, Journal of
Facilities Management, 2(3), 298-311. Hoffman, W. (2005). Strong Signals, PM Network, 19(8), 42-46. Huber, G.P. (1991). Organizational Learning: the Contributing Processes and the literarures,
Organizational Science, 2(1), 88-115. Huitt, W., (1999). Educational Psychology Interactive: Internal and external validity:
General issues, http://chiton.valdosta.edu/whuittt/col/intro/valdgn.html. Hurley, A., Scandura, T. A., Schriesheim, C. A., Brannick, M.T., et al. (1997). Exploratory
and Confirmatory Factor Analysis: Guidelines, Issues, and Alternatives. Journal of Organizational Behavior, 18(6), 667-684.
Hutchinson, A., Finnemore, M. (1999). Standardized Process Improvement for Construction
Enterprises, Total Quality Management, 10(4/5), 576-583. Iversen, J., Ngwenyama, O. (2006). Problems in Measuring Effectiveness in Software
Process Improvement: A Longitudinal Study of Organization Change at Danske Data. International Journal of Information Management 26, 30-43.
IT-Cortex s.a. (1998), The Bull Survey, http://www.it-
cortex.com/Stat_Failure_Cause.htm#The%20Bull%20Survey%20(1998).

231
Jachimowicz, V. (2003). Project Management Maturity Model by Kent Crawford, Project Management Journal, 34(1), 55-56.
Jedd, M. (2005). Organizational Maturity Assessments Light the Way to Optimized Project
Management, PM Network, 19(6), 62-66. Jiang, J., Klein, G., Hwang, H.G., Hung, S.Y. (2003), An Exploration of the relationship
between Software Development Process Maturity and Project Performance, Information and Management, Amsterdam, 41(3), 279-288.
Judgev, K. Thomas J. (2002). Project Management Maturity Models: The Silver Bullets of
Competitive Advantage?, Project Management Journal, 33(4), 4-14 Keegan, A. and Turner, J. R. (2001). Quantity versus Quality in Project-based Learning
Practices., Management Learning, 32(1), 77-98. Kendra, K., Taplin, L. (2004), Project Success: A Cultural Framework, Project Management
Journal, 35(1), 30-45. Kennedy, A. (1992). Post-Completion Auditing: A source of Strategic Direction,
Management Accounting, 70(5), 26-28. Kenny, J. (2003). Effective Project Management for Strategic Innovation and Change in an
Organizational Context, Project Management Journal, 34(1), 43. Kerzner, H., (2001). Strategic Planning for Project Management Using a Project
Management Maturity Model, John Wiley and Sons, Publishers, ISBN: 0-471-40039-4.
Kim, J., Mueller, C. (1978). Factor Analysis: Statistical Methods and Practical Issues. Sage
Publications. ISBN: 0-8039-1161-1. King, J. (2003). The Pros and Cons of CMM, Computerworld, 37(49), 50. Kline, P. (2002). An Easy Guide to Factor Analysis. Routledge. ISBN: 0-415-09490-9. Koners, U., Goffin, K. (2005). Learning from New Product Development Projects:
Aexploratory Study. Creative and Innovation Management, 14(4), 334-344. Kotnour, T., Vergopia, C. (2005). Learning-based Project Reviews: Observations and
Lessons Learned from Kennedy Space Center, EMJ, 17(4), 30-38. Kransdrorff, A. (1996). Viewpoint: Using the Benefits of Hindsight – The Role of Post-
project Analysis, Managerial Auditing Journal, 11(4), 42-46.

232
Krasner, H.,(1997), Accumulating the body of Evidence for the Payoff of Software Process Improvement, Krasner Consulting, http://www.cs.utexas.edu/~hkrasner/spi-roi.pdf.
Kwak, Y., Ibbs. W. (2000a). Assessing Project Management Maturity, Project Management
Journal, 31(1), 32-43 Kwak, Y., Ibbs. W. (2000b). Calculating Project Management's Return on Investment,
Project Management Journal, 31(2), 38-44. Kwak, Y., Ibbs. W. (2000). Project Management Process Maturity (PM)² Model, Journal of
Management in Engineering, 18(3), 150-155. Lawlis, P., Flowe, R., Thordahl, J. (1995). A correlationanal Study of the CMM and
Software Development Performance. http://www.stsc.hill.af.mil/crosstalk/1995/09/Correlat.asp.
Leedy, P. (1997). Practical Research: Planning and Design (6th Ed.). Prentice-Hall, Inc.
ISBN: 0-1324-1407-4. Love, P. and Irani, Z. and Edwards, D. (2003). Learning to Reduce Rework in Projects:
Analysis of Firm’s Organizational Learning and Quality Practices, Project Management Journal, 34(3), 13-25.
Martin, P. and Tate, K. (2002). Close Out, The Forgotten Phase, Chemical Engineering
Progress, 98(1), 76-79. McBride, T., Henderson-Sellers, B., Zowghi, D. (2004). Project Management Capability
Levels: an Empirical Study, Proceedings of the 11th Asia-Pacific Software Engineering Conference (APSEC'04), 30 nov-03 dec, 56-63.
McManus, J. and Wood-Harper, T. (2003). Information Systems Project Management –
The Price of Failure, Management Services, 47(5), 16-19. Newell, S. (2004). Enhancing Cross-Project Learning, Engineering Management Journal,
16(1), 12-20. Nunnaly, J. (1978). Psychometric Theory. McGraw-hill Office of Government Commerce (OGC) (1989). Projects in Controlled Environments
(PRINCE2), http://www.ogc.gov.uk/prince2. Pan, G., Flynn, D. (2002). ECIS 2002, June 6-8, Gdansk, Poland. Paulk, M. C., Curtis, B. , Chris, M.B., and Weber, C., Software Engineering Institute,
CMU/SEI-93-TR-24, DTIC Number ADA263403, February 1993. http://www.sei.cmu.edu/publications/documents/93.reports/93.tr.024.html
233
Pennypacker, J., Grant, K. (2003). Project Management Maturity: an Industry Benchmark,
Project Management Journal, 34(1), 4-11. Pillai, A.S., Joshi, A., Roa, K.S. (2002). Performance Measurement of RandD Projects in a
Multi-ProjectConcurrent Engineering Environment, International Journal of Project Management, 20(2), 168-177.
PM Solutions, Project Management Maturity Model,
http://www.pmsolutions.com/maturitymodel/index.htm PMProfessional (UK), http://www.pmprofessional.co.uk/index.htm. Project Management Institude (PMI). (2003). Organization Project Management Maturity
Model (OPM3), http://www.pmi.org/info/PP_OPM3.asp. Project Management Institude (PMI). (2004). A Guide to the Project Management Body of
Knownledge: Guide., 3rd Ed., PMI, Publishers, ISBN: 1-930699-45-X Skulmoski, G. (2001). Project Maturity and Competence Interface, Cost Engineering 43(6),
11-18. Standish Group (1995), The Chaos Report:
http://www.standishgroup.com/sample_research/chaos_1994_1.php. Stapleton, (1997). Basic Concepts and Procedures of Confirmatory Factor Analysis.
Southwest Education Research Association, Austin, 1997. Tellis, W. (1997). Introduction to case study: http://www.nova.edu/ssss/QR/QR3-
2/tellis1.html. Tukel, O., Rom, W.(2001). An Empirical Investigation of Project Evaluation Criteria,
International Journal of Operations and Production Management, 21(3), 400-416 Von Krogh, G. (1998). Care in Knowledge Creation. California Management Review, 40(3),
133- Von Zedtwitz, M. (2002). Organizational Learning through Post-project Reviews in RandD,
RandD Management, 32(3), 255-268. Von Zedtwitz, M. (2003). Post-Project Reviews in RandD, Research Technology
Management, 46(5), 43-49. Williams, T. (2003). Learning from Projects, Journal of the Operational Research Society,
54(5), 443-451.

234
Yin, R. (1992). The Case Study Method as a Tool for Doing Evaluation, Current Sociology, 40(1), 121-137.
Yin, R. (1994). Case Study Research: Design and Methods (2nd Ed.), Beverly Hills, CA:
Sage Publishing. Zubrow, D. (2003). CMMI Appraisal Results,
http://www.sei.cmu.edu/sema/pdf/2003feb.pdf.