project report shivram mukherjee (energy management), 2009 11
DESCRIPTION
TRANSCRIPT
1
DEVELOPING GHG ACCOUNTING FRAMEWORK & ASSESMENT OF
PROBABLE STRATEGIES TO MITIGATE CO2 EMISSION IN A CHEMICAL
INDUSTRY
Project Report Submitted to the University of Calcutta
In Partial Fulfillment for the Award of Master of Public Systems
Management (With Specialization in Energy Management)
By
SHIVRAM MUKHERJEE
ROLL NO: 107/MPS/090098
REGISTRATION NUMBER:-107-1121-0027-09
SESSION: 2009-2011
INDIAN INSTITUTE OF SOCIAL WELFARE AND BUSINESS MANAGEMENT
COLLEGE SQUARE WEST, KOLKATA 700 073
May, 2011

2
ACKNOWLEDGEMENT
At this outset, I would like to avail this opportunity to express my
thankfulness and gratitude towards Dr. K.M Agrawal, Head of the Department,
Masters in Public Systems Management, IISWBM, Kolkata
I would like to thank Dr.Sarbani Mitra, Coordinator, Environment
Management, IISWBM Kolkata for her constant guidance, encouragement and
giving me precious tips for completing my project work
I am also thankful to Mr. Arindam Dutta, Coordinator, Energy Management,
IISWBM, for his valuable inputs and guidance for the completion of the project
work on time.
I would also like to extend my heartfelt gratitude towards Mr. Rajib Kumar
Debnath, Director (Environment& Sustainability Services) and Deloitte
Touché Tohmatsu India Pvt. Ltd for providing me this opportunity to
complete my project & project work at this esteemed organization.
I am also thankful to my external guide Mr. Jaideep Singh Rathore & my
colleague Mr. Chandan Singh, Assistant Managers at Deloitte Touché
Tohmatsu India Pvt. Ltd. Bangalore, whose constant encouragement and
support helped me gain substantial knowledge in the area pertaining to my
project work.
Finally, I would like to thank my parents and all my friends without the
support, motivation and guidance of whom; I wouldn’t have been able to
complete the project work
3
INDUSTRY NAME AND BRIEF DESCRIPTION
� DELOITTE TOUCHE’ TOHMATSU INDIA PRIVATE LIMITED
Deloitte Centre, Anchorage II, 100/2 Richmond Road, Bangalore, Karnataka – 560025
� DELOITTE AS A GLOBAL FIRM
With over 130,000 employees in 150 countries Deloitte has an unparalleled breadth of
service offering, ensuring that it can help the clients with the range of challenges they
face. Deloitte is among the leading audit and consulting firm in major countries such as
USA, UK, Japan (under the brand name of Tohmatsu), France, but equally so in Latin
America, India and China. In India we have offices in 13 locations and over 5000 staff.
The service provided by Deloitte includes Consulting, Tax, Audit & Enterprise Risk
Services and Financial Advisory.
� DELOITTE GLOBAL – (ENVIRONMENT & SUSTAINABILITY SERVICES)
Deloitte’s Global Environment and Sustainability Services is a global business line of
more than 200 dedicated practitioners in more than 20 countries world-wide that are
closely interlinked with Deloitte assurance services, risk and management consulting
and corporate financial services. Deloitte has delivered services in this field since the Rio
Earth Summit in 1992 as such; the group has been involved with Sustainable
Development issues since the Earth Summit in 1992 and has been working with
industry, governments, and international organizations alike. As a participant in the
1992 Earth Summit (formally known as the United Nations Conference on Environment
and Development), Deloitte was among the first professional services organizations to
acknowledge the importance of sustainability. Since then, Deloitte practitioners have
continued to participate in relationships with organizations like the World Business
Council for Sustainable Development, the United Nations Global Compact, and the GRI.
Deloitte is a founder member of the World Business Council for Sustainable
Development (WBCSD) and the UN Global Compact and is a signatory of the World

4
Economic Forum Corporate Citizenship challenge. The Environment & Sustainability
Services forms a part of the consulting practice present in Deloitte.
� DELOITTE INDIA - ESS NETWORK & STRENGTH & STRENGTH
In India, the ESS team is represented by professionals having background in Basic Science,
Engineering, and Management with an in-depth experience in ESS related services. The ESS
network in India is spread across the cities of Kolkata, Gurgaon (NCR), Mumbai, Chennai,
Bangalore and Hyderabad, with approximate staff strength of 40. The Environment &
Sustainability is headquartered in Gurgaon.
Deloitte, a leader in the field of CSR is the Founder Member of World Business Council for
Sustainable Development (WBCSD) and UN Global Compact and a signatory to World
Economic Forum on Corporate Citizenship Challenge. It has chaired the Steering
Committee, which has played a prominent role in the development of the GRI Sustainability
Reporting Guidelines Played a significant role in the development of ISAE 3000.Largest
share of Assurance Services in the Top 50 Best Sustainability Reporting firms. Maximum
share of Reporters which have bagged International Awards on CSR.
� DELOITTE ENVIRONMENT & SUSTAINABILITY SERVICES - KEY AREAS OF
WORK
A. Corporate Sustainability Reporting (CSR)
B. GHG Accounting & Assurance
C. CDM (Clean Development Mechanism) and VCS (Voluntary Carbon) Advisory
Services
D. Quality, Social, Safety, Health and Environmental Management Systems as per ISO
9001/ISO-14001, ISO 18001 & SA 8000
E. Environmental & Social Due Diligence Review
F. Advisory Services on Renewable Energy Certificates(REC’s)
G. Advisory Services on LEED(Leadership in Energy & Environmental Design)
H. HS(Environment Health & Safety) Legislation Compliance Assessment and Review
and EHS & Social Accountability related Advisory services

5
EXECUTIVE SUMMARY
As we all know that Climate Change is a serious issue that has surrounded the world today
and with more and more issues relating to global warming, increase in the surface
temperature of the earth, melting of the glaciers, hence it has become a necessity to opt for
such a mechanism that would not only help to mitigate adverse effects of climate change,
but it would help to earn revenue in terms of carbon offsets, and also reduce GHG emission.
In recent years the voluntary carbon trading market has been plagued by a perceived lack
of credibility stemming from the absence of uniform quality control and assurance
standards.
The scope of this study extends over qualitative assessment of the climate change impacts
on the chemicals and fertilizer industry sectors, estimating the carbon footprint of Aquasub
Chemicals Limited (ACL) for a selected base year and outlining strategy for GHG abatement
for the broad categories of manufacture and production of fertilizers and inorganic
chemicals. Both the categories have been traditionally portrayed as major contributors to
the emission of greenhouse gases contributing to climate change.
Industrial Processes include the energy emissions and process emissions from the
manufacture of cement, limestone and dolomite calcinations, soda ash manufacture and
consumption, carbon dioxide manufacture and aluminium production. It is evident that the
contribution of this sector to global GHG emissions is considerably high.
ACL manufactures inorganic fertilizers including Urea and other Phosphatic fertilizers
which target the huge agricultural markets in India and other developing countries. The
agricultural sector is significantly vulnerable to the risk of climate change. Agricultural
production and yield in countries such as India and other developing countries are largely
dependent on climatic patterns and monsoons. Shifts in climatic patterns due to global
warming, uncertainty in monsoons and water availability, increased storm surges, floods,
droughts all attributable to climate change can reduce crop production and thus directly
affect fertilizer demand. Thus climate change has a potentially negative effect on the
fertilizer business of ACL. In addition, climate change regulations such as caps on the

6
emissions of GHGs or sectoral GHG benchmarking may also significantly affect the
organization’s profitability due to high GHG intensity of this business. The trends of
continual increase in fossil fuel prices, government policies on energy efficiency and fuel
switch, minimized ecological impact clearly signify the risk associated to climate change
and justify the development of an effective climate change mitigation strategy to tackle the
barriers portended.
Fig: - Representation of generic approach followed for the carbon footprint study
Specific methodology was followed during the completion of this assessment study:-
A. Identification of the GHG source/ sink/ reservoir
B. Defining Organizational and Operational Boundary
C. Layout of the data collection approach
D. Layout of the Calculation Methodology
E. Determination of carbon footprint
Site visit by consultants
Calculation of GHG inventory
Discussion with plant personnel
GHG mitigation opportunities identification
Prioritization of GHG abatement
measures
Finalising Carbon
footprint report
Submission of report
Kick off meeting for
idea & of work

7
Figure 1 Working Procedure followed during the project
The study clearly indicated the distinct scope of reducing overall GHG emissions of the
business operations of ACL. The scopes of reduction may first be identified on a macro
scale or the business unit level. Thereafter the scopes of reduction are diversified on an
installation wise basis or a product wise basis as may be deemed necessary. ACL should
explore the need to reach the goal of carbon neutrality (or net zero GHG emissions). This
should be an important strategic agenda for ACL in view of their global presence and future
plan for global expansion across diverse geographies. Greater investor interest, greater
customer acceptance, improved bottom line are the more obvious benefits of reaching the
goal of carbon neutrality.
However, like any other business initiative, each of these GHG abatement strategies which
have been recommended are subject to regulatory risks and risks of implementation
despite the possible strategic and/or financial attractiveness. ACL needs to perform an
holistic evaluation of the GHG abatement levers and align their implementations with the
growth plan of the organization to ensure the path towards ‘low’ or ‘no’ carbon is tread
upon.
Identification of GHG Source/Sink/Reservoir
Defining organization & operational boundary
Layout of data Collection Approach
Layout of calculation methodology
Determination of Carbon Footprint

8
INDEX
Serial Number Page Number
1. ACKNOWLEDGEMENT 2
2. INDUSTRY OVERVIEW 3
3. EXECUTIVE SUMMARY 5
4. ABBREVIATIONS 9
5. INTRODUCTION 10
6. OBJECTIVES & TARGETS 23
7. REVIEW OF LITERATURE 24
8. RESEARCH METHODOLOGY 31
9. DATA ANALYSIS/CASE STUDY 36
10. RESULTS & DISCUSSION 47
11. CONCLUSION 52
12. SCOPE AHEAD & REFERENCE 56-59

9
ABBREVIATIONS
GHG: - GREEN HOUSE GAS
WBCSD: - WORLD BUSINESS COUNCIL FOR SUSTAINABLE DEVELOPMENT
WRI: - WORLD RESOURCE INSTITUTE
SBU: - STRATEGIC BUSINESS UNIT
ACL: - AQUASUB CHEMICALS LIMITED
NPK: - NITROGEN-PHOSPHORUS-POTASSIUM
LABSA: - LINEAR ALKYL BENZENE SULPHONIC ACID
STPP: - SODIUM TRI POLY PHOSPHATE
DAP: - DI AMMONIUM PHOSPHATE
SSP: - SINGLE SUPER PHOSPHATE
GWP: -GLOBAL WARMING POTENTIAL IPCC: -INTERGOVERNMENTAL PANEL ON CLIMATE CHANGE CCS: - CARBON CAPTURE & STORAGE
10
INTRODUCTION
The world's climate has always varied naturally but compelling evidence from around the
world indicates that a new kind of climate change is now under way, foreshadowing drastic
impacts on economies and ecosystems. Levels of carbon dioxide (CO2) and other
'greenhouse gases' (GHGs) in the atmosphere have risen steeply during the industrial era
due to unplanned human activities like deforestation or heavy fossil fuel use, driven by
unrestrained economic and population growth. Climate change, popularly caused by ‘global
warming’, is a major concern for today’s international scientific community, policy makers
and business leaders all over the world. In the world of business, climate change has
developed from being a fringe concern, focusing on a company’s brand and Corporate
Social Responsibility, to an increasingly central topic for strategic deliberation and decision
making by investors and industrialists. At policy levels of visionary business leaders,
climate change has increasingly assumed an important political, economic and socio-
ecological dimension. This entails a broad international consensus to develop an integrated
approach to tackle the problem. Greenhouse gas accounting describes the way to inventory
and audit greenhouse gas (GHG) emissions. Guidance for accounting for GHG emissions
from organizations and emission reduction projects is provided by the World Resources
Institute (WRI) and World Business Council for Sustainable Development (WBCSD) GHG
Protocol.
For national GHG inventories, guidance is provided by the Intergovernmental Panel on
Climate Change (IPCC) methodology reports. The International Organization for
Standardization (ISO) also provides some general standards for- greenhouse gas emissions
at organization level (ISO 14064 - 1) and greenhouse gas emissions at project level (ISO
14064 - 2).Specifications to validate and verify relevant accountings are documented in
(ISO 14064 .
One of the most important and interesting steps was taken by FIFA during 2006/2010
World Cups at Germany & South Africa.
11
INITIATIVES BY FIFA (FE’DE’RATION INTERNATIONALE de FOOTBALL ASSOCIATION)
A major initiative was taken by FIFA was to ensure that the Soccer World Cups hosted in
Germany (2006) as well as in South Africa (2010) were environmentally sustainable and it
was ensured that GHG emissions from these two huge events were minimal.
A key overarching aim of Host City Cape Town’s Green Goal effort was to ensure that the
2010 FIFA World Cup was a low carbon event. This specifically relates to ensuring low
climate change impact through the reduction of GHG emissions. Where GHG emissions
cannot be avoided, they will be mitigated through a range of Green Goal 2010 carbon
mitigation projects. Hosting a low-carbon event, and reducing its carbon footprint, can be
achieved through integrating energy efficiency, waste reduction and avoidance, and water
conservation with all activities related to the event. The objective of the carbon mitigation
programme is to compensate for unavoidable GHG emissions, such as activities related to
transport (ground and air travel) and accommodation. Such compensation can be achieved
through the purchase of TRECs, or capital investment in climate protection projects.
Around 3.2 million home and foreign visitors attended the 64 World Cup matches. In
addition, more than 20,000 journalists and some 1,500 FIFA officials followed the matches.
The transport of visitors, journalists and honorary guests to the venues, and between the
stadiums, as well as the transport of supplies and services to stadiums, also involves
adverse effects on the environment. It was estimated that huge amount GHG emission
would take place. The reduction of traffic-related effects on the environment was an
important objective of sustainable development in Germany. This concerned the avoidance
of unnecessary traffic, the switching of private transport to (local) public transport systems
and the environmentally efficient development of transport through the further
12
development of Environmental objectives for the 2006 FIFA World Cup March 2003the
technical and organizational systems of all means of transport.. The realization of the 2006
Football World Cup in Germany with a neutral impact on the climate was thus a general,
quantifiable environmental objective where considerable amount of GHG emission were
reduced.
ENTERPRISE CARBON ACCOUNTING (ECA)
Corporate Carbon Footprint aims to be a rapid and cost effective process for businesses to
collect, summarize, and report enterprise and supply chain GHG inventories. ECA leverages
financial accounting principles, whilst utilizing a hybrid of input-output LCA (Life Cycle
Analysis) and process methodologies as appropriate. The evolution to ECA is necessary to
address the urgent need for a more comprehensive and scalable approach to carbon
accounting. While an emerging area, a number of new companies offer ECA solutions. ECA
is a critical part of broader Enterprise Sustainability Accounting. The Evolution of LCA to
ECA Process LCA Process LCA is the most popular method, currently, for conducting life-
cycle assessment, and is often referred to as the SETAC-EPA method because of the role
played by SETAC and EPA in this method’s development. The inputs and outputs of
multiple stages of a product’s life are investigated in turn, and the results are aggregated
into single metrics of impact such as eutrophication, toxicity, and greenhouse gas
emissions. Three tools exist on the market to assist researchers in conducting process LCA
(such as GaBi, Ecoinvent, and Umberto). These tools contain data from previous
researchers on the environmental impact of materials and processes that are then strung
together by the user to form a system.
Greenhouse gas inventories are a type of emission inventory that are developed for a
variety of reasons. Scientists use inventories of natural and anthropogenic (human-caused)
emissions as tools when developing atmospheric models. Policy makers use inventories to
develop strategies and policies for emissions reductions and to track the progress of those
policies. And, regulatory agencies and corporations rely on inventories to establish

13
compliance records with allowable emission rates. Businesses, the public, and other
interest groups use inventories to better understand the sources and trends in emissions.
Unlike some other air emission inventories, greenhouse gas inventories include not only
emissions from source categories, but also removals by carbon sinks. These removals are
typically referred to as carbon sequestration.
Greenhouse gas inventories typically use Global warming potential (GWP) values to
combine emissions of various greenhouse gases into a single weighted value of emissions.
All Annex I countries are required to report annual emissions and sinks of greenhouse
gases under the United Nations Framework Convention on Climate Change (UNFCCC).
National governments that are Parties to the UNFCCC and/or the Kyoto Protocol are
required to submit annual inventories of all anthropogenic greenhouse gas emissions from
sources and removals from sinks.
The Kyoto Protocol includes additional requirements for national inventory systems,
inventory reporting, and annual inventory review for determining compliance with Articles
5 and 8 of the Protocol. Project developers under the Clean Development Mechanism of the
Kyoto Protocol prepare inventories as part of their project baselines. Corporation and
other entities can prepare greenhouse gas inventories to track progress towards meeting
an emission reduction goal.
Scientific efforts aimed at understanding detail of total net carbon exchange. Example:
Project Vulcan - a comprehensive US inventory of fossil-fuel greenhouse gas emissions. ISO
14064The ISO 14064 standards (published in 2006 and early 2007) are the most recent
additions to the ISO 14000 series of International Standards for environmental
management. The ISO 14064 standards provide governments, businesses, regions and
other organizations with an integrated set of tools for programs aimed at measuring,
quantifying and reducing greenhouse gas emissions. These standards allow organizations
take part in emissions trading schemes using a globally recognized standard.

14
ECONOMIC INPUT-OUTPUT LCA
Input-Output LCA utilizes economic input-output tables and industry-level environmental
data to construct a database of environmental impacts per dollar sold by an industry. The
boundary problem of process LCA is solved in this method because the economic input-
output table captures the interrelations of all economic sectors; however, aggregated
industrial categories limit the specificity of the results. Input–output analysis is a very
powerful tool for the upfront screening of corporate carbon footprints, for informing
streamlined supply-chain GHG accounting and for setting priorities for more detailed
analyses
ENTERPRISE CARBON ACCOUNTING (ECA)
At its core, ECA is essentially a hybrid life-cycle assessment; however, rather than the
traditional bottom-up approach of life-cycle assessment, ECA links financial data directly to
LCA data to produce a snapshot of the companies’ operations. Rather than probing at areas
thought to be problematic, ECA quickly identifies problem areas in the supply chain so that
rapid action can be taken. This fundamental shift in thinking enables decision makers to
rapidly address critical areas within the enterprise and supply chain.
SOCIALISED SUPPLY CHAIN
Socialised supply chain accounting is the term generally applied to Enterprise Carbon
Accounting Solutions that provide a collaborative mechanism for supply chain participants
to engage, expose and determine supply chain emissions through the process of shared
knowledge.
The term "Socialised Supply Chain" was coined by the CEO of Nootrol, Mark Kearns to
describe a platform where supply chain participants exposed Process LCA and embedded
emissions. Hence it becomes a very important part of the project activity under
consideration. Moreover socialized supply chain has become very important in modeling of
ERP (Enterprise Resource Planning)
15
CARBON FOOTPRINT
The total set of greenhouse gas (GHG) emissions caused by an organization, event, product
or person. Greenhouse gases can be emitted through transport, land clearance, and the
production and consumption of food, fuels, manufactured goods, materials, wood, roads,
buildings, and services. For simplicity of reporting, it is often expressed in terms of the
amount of carbon dioxide, or its equivalent of other GHGs, emitted.
The concept name of the carbon footprint originates from ecological footprint discussion.
The carbon footprint is a subset of the ecological footprint and of the more comprehensive
Life Cycle Assessment (LCA). An individual's, nations, or organization's carbon footprint
can be measured by undertaking a GHG emissions assessment. Once the size of a carbon
footprint is known, a strategy can be devised to reduce it, e.g. by technological
developments, better process and product management, changed Green Public or Private
Procurement (GPP), carbon capture, consumption strategies, and others.
The mitigation of carbon footprints through the development of alternative projects, such
as solar or wind energy or reforestation, represents one way of reducing a carbon footprint
and is often known as Carbon offsetting. The main influences on carbon footprints include
population, economic output, and energy and carbon intensity of the economy. These
factors are the main targets of individuals and businesses in order to decrease carbon
footprints. Scholars suggest the most effective way to decrease a carbon footprint is to
either decrease the amount of energy needed for production or to decrease the dependence
on carbon emitting fuels. The ISO 14064 standards (published in 2006 and early 2007) are
the most recent additions to the ISO 14000 series of International Standards for
environmental management. The ISO 14064 standards provide governments, businesses,
regions and other organizations with an integrated set of tools for programs aimed at
measuring, quantifying and reducing greenhouse gas emissions. These standards allow
organizations take part in emissions trading schemes using a globally recognized standard.
16
ISO 14064
ISO 14064-1:2006 specifies principles and requirements at the organization level for
quantification and reporting of greenhouse gas (GHG) emissions and removals. It includes
requirements for the design, development, management, reporting and verification of an
organization's GHG inventory.
ISO 14064-2:2006 specifies principles and requirements and provides guidance at the
project level for quantification, monitoring and reporting of activities intended to cause
greenhouse gas (GHG) emission reductions or removal enhancements. It includes
requirements for planning a GHG project, identifying and selecting GHG sources, sinks and
reservoirs relevant to the project and baseline scenario, monitoring, quantifying,
documenting and reporting GHG project performance and managing data quality.
ISO 14064-3:2006 specifies principles and requirements and provides guidance for those
conducting or managing the validation and/or verification of greenhouse gas (GHG)
assertions.
It can be applied to organizational or GHG project quantification, including GHG
quantification, monitoring and reporting carried out in accordance with ISO 14064-1 or ISO
14064-2. ISO 14064-3:2006 specifies requirements for selecting GHG validators/verifiers,
establishing the level of assurance, objectives, criteria and scope, determining the
validation/verification approach, assessing GHG data, information, information systems
and controls, evaluating GHG assertions and preparing validation/verification statements.
The scope of this study extends over qualitative assessment of the climate change impacts
on the chemicals and fertilizer industry sectors, estimating the carbon footprint of
AQUASUB CHEMICALS LIMITED, for a selected base year and outlining strategy for GHG
abatement for the broad categories of manufacture and production of fertilizers and
inorganic chemicals. Both the categories have been traditionally portrayed as major
contributors to the emission of greenhouse gases contributing to climate change.

17
Fig1:- Exhibit showing contribution of GHG from 1978-2010
Industrial Processes include the energy emissions and process emissions from the
manufacture of cement, limestone and dolomite calcinations, soda ash manufacture and
consumption, carbon dioxide manufacture and aluminium production. It is evident that the
contribution of this sector to global GHG emissions is considerably high at nearly 17%
second largest contributor after power plants.
Contribution of carbon dioxide gas from the sector is alarmingly high at close to 20.6%
contribution1. Other greenhouse gases such as methane and nitrous oxides which are
usually released as process gases from chemical and fertilizer industries account minor
quantities toward global warming effect. Impact of Climate Change on the fertilizer and
chemical manufacturing business AQUASUB CHEMICALS LIMITED manufactures inorganic
fertilizers including Urea and other Phosphatic fertilizers which target the huge
agricultural markets in India and other developing countries. The agricultural sector is
significantly vulnerable to the risk of climate change. Agricultural production and yield in
countries such as India and other developing countries are largely dependent on climatic
patterns and monsoons.

18
Shifts in climatic patterns due to global warming, uncertainty in monsoons and water
availability, increased storm surges, floods, droughts all attributable to climate change can
reduce crop production and thus directly affect fertilizer demand. Thus climate change has
a potentially negative effect on the fertilizer business of AQUASUB CHEMICALS LIMITED. In
addition, climate change regulations such as caps on the emissions of GHGs or sectoral GHG
benchmarking may also significantly affect the organization’s profitability due to high GHG
intensity of this business.
The trends of continual increase in fossil fuel prices, government policies on energy
efficiency and fuel switch, minimized ecological impact clearly signify the risk associated to
climate change and justify the development of an effective climate change mitigation
strategy to tackle the barriers portended.
Policy and Regulatory Environment Much of the current policy focus in relation to the
Indian fertilizer and chemicals sectors is on the nature and impact of on-going fuel pricing,
subsidization reforms and energy efficiency improvement in the production processes.
Some relevant policies like Integrated Energy Policy, Electricity Act 2003, Natural Gas
Utilization Policy, and National Action Plan on Climate Change. However, like any other
business initiative, each of these GHG abatement levers are subject to regulatory risks and
risks of implementation despite the possible strategic and/or financial attractiveness. ACL
needs to perform an holistic evaluation of the GHG abatement levers and align their
implementations with the growth plan of the organization to ensure the path towards ‘low’
or ‘no’ carbon is tread upon.
Hence TQMS through the exercise of the assessment of the carbon footprint exercise wants
to play an active role of contributing towards an effective global strategy to combat climate
change by working in cohesion with local and international corporate bodies and the
Governments in creating the right policy, financial, regulatory, social and technological
environment to inventorize the Green House Gas emissions, to formulate a low carbon
growth trajectory and to adapt to the negative impacts of climate change.

19
Policies associated with GHG Accounting can be identified as follows:-
1. Electricity Act 2003
2. Energy Policy
3. Natural Gas Policy
4. National Action Plan For Climate Change
CARBON FOOTPRINT ESTIMATION AND DEVELOPMENT OF GHG STRATEGY
In this context it becomes all the more crucial for an entity like AQUASUB CHEMICALS
LIMITED having mainstream interest in the production and manufacture of chemicals and
fertilizer industry to orient its growth and sustenance strategies in line with low carbon
impact. AQUASUB CHEMICALS is one of the companies which have identified the need for
accounting its carbon footprint of its business operations which will help in understanding
the current state of its GHG liability. The report may be used by AQUASUB CHEMICALS
LIMITED to understand the size of their overall GHG inventory, the anticipated GHG risks
for the future and develop the future strategy for potential GHG mitigation which would
help the organization to reduce its carbon footprint in a progressive fashion over a period
of time.
Taking the lead in climate change mitigation activities will help the company to reduce its
GHG liability in the most economically efficient fashion and therefore gain significant
competitive advantage. By undertaking early actions large corporations can prepare
themselves well in advance to face climate regulations, enhance their corporate image to
their global stakeholders, increase valuation of the company and secure access to capital
and finally discover the financial gain from the unrealized assets in a trading environment.
The methodology for the assessment study consisted of specific steps which were
incorporated in consultation with top management of ACL.

20
The study had classified the operations of AQUASUB CHEMICALS LIMITED into two broad
Strategic Business Units (SBUs) namely Fertilizers and Chemicals. The Fertilizer SBU
consisted of a product mix including Urea and Phosphatic Fertilizers. The Chemicals SBU
unit consisted of a product mix including mainly Soda Ash, Cement etc. GHG emissions of
AQUASUB CHEMICALS LIMITED included the emissions from the production of all
inorganic chemicals and fertilizers by the individual production centers all over India and
abroad.
Now let’s get an idea about Green House Gas protocol:-
The Greenhouse Gas Protocol (GHG Protocol) is the most widely used international
accounting tool for government and business leaders to understand, quantify, and manage
greenhouse gas emissions. The GHG Protocol, a decade-long partnership between the
World Resources Institute and the World Business Council for Sustainable Development, is
working with businesses, governments, and environmental groups around the world to
build a new generation of credible and effective programs for tackling climate change. It
provides the accounting framework for nearly every GHG standard and program in the
world - from the International Standards Organization to The Climate Registry - as well as
hundreds of GHG inventories prepared by individual companies.
The GHG Protocol also offers developing countries an internationally accepted
management tool to help their businesses to compete in the global marketplace and their
governments to make informed decisions about climate change.
In 2006, the International Organization for Standardization (ISO) adopted the Corporate
Standard as the basis for its ISO 14064-I: Specification with Guidance at the Organization
Level for Quantification and Reporting of Greenhouse Gas Emissions and Removals. This
milestone highlighted the role of the GHG Protocol’s Corporate Standard as the
international standard for corporate and organizational GHG accounting and reporting.
ISO, WBCSD, and WRI signed a Memorandum of Understanding on December 3, 2007 to
jointly promote both global standards.
21
ESTABLISHING BASELINE PROTECTION
The past decade has been a time of great uncertainty for businesses seeking to incorporate
GHG issues into their corporate strategies. The international mechanism establishing
binding limits on GHG emissions – the Kyoto Protocol – entered into force in 2005, more
than seven years after it was negotiated, and its emission caps are set to expire in 2012. In
the United States, a patchwork of state and regional regulation has evolved in the absence
of a coordinated national GHG mitigation policy. The future of international climate change
policy post-2012 is unclear, and much of the world is not currently subject to GHG
regulation. As a result, many companies find themselves in an uncertain situation in which
they must make long-term investment decisions without knowing what GHG restrictions
they may face in the future.
In response, some GHG programs, such as the California Climate Action Registry, have
sought to establish and “protect” their participants’ baseline emissions. This refers to
developing and certifying inventories of participants’ GHG emissions and ensuring, insofar
as is possible, that any future regulatory programs take into account participants’ pre-
regulatory, voluntary efforts to reduce their emissions.
The concept of baseline protection has been recognized in legislation introduced before the
U.S. Congress, which has proposed considering “early action” in companies’ allocations of
GHG allowances, and has cited a range of GHG registries and reporting programs as
examples of what could contribute to proof of early action. A program design that
incorporates stringent quality assurance measures may strengthen participants’ claim to
credit for early action. When doing a baseline analysis, it is most effective to break out
energy usage by “end-use,” rather than only by sector. For example, if a city can determine
how much energy is used to provide lighting, refrigeration, cooking, electric motor power,
etc. the resulting data are much more useful than if broken out by sector -- residential,
commercial and/or industrial. Evaluating end-use information will better prepare cities to
identify which programs will have the most impact on their GHG emission reductions
22
PROVIDING INFORMATION TO STAKEHOLDERS
Finally, GHG program aims to provide information on corporate GHG emissions to external
stakeholders – such as investors (through programs such as the Carbon Disclosure
Project1), environmental groups, and researchers – on which to base decisions related to
investments, risk assessment, and policy and advocacy positions.
Designers of such programs should consider the most useful level of disaggregation of GHG
information to satisfy the targeted stakeholder groups. They should also ensure that their
accounting and calculation methodologies are sufficiently transparent and consistent and
that participants are able to provide additional context to their reported emission
information.
The strategy will provide the first formal stakeholder consultation of the project on the
road to developing such partnerships and will provide the context for defining the
frameworks of how such a national programme could be developed. The strategy will
provide a background of the internationally accepted GHGP tools and guidelines, including
the newly introduced/developed Scope 3 and life cycle analysis tools. By engaging with the
leading members of the Indian business community, the event will attempt to answer the
following broad questions.
1. What are the benefits of GHG accounting and inventorization?
2. Are the corporates aware of and are using the GHGP tools that exist or are being
developed internationally?
3. What are the experiences of corporates who have attempted to develop GHG
inventories in India and what are the challenges to GHG accounting and
inventorization?
4. What kind of support would be needed to improve GHG accounting? Is there a need
for a capacity building and awareness generation programme at the state/sector
level?

23
OBJECTIVES & TARGETS
The objective of the Project titled: - “DEVELOPMENT OF GHG STRATEGY IN A CHEMICAL
INDUSTRY” is primarily to reduce the Green House Gas emission to also to mitigate the
harmful effects of Climate Change. During the course of the dissertation one live project
was witnessed, where all the objectives were met.
1. To recommend GHG abatement strategies for mitigation of GHG emissions
2. To show the vulnerable areas in chemical industries and effects of climate change in
chemical industry.
3. To analyze and quantify the GHG emissions
4. To understand the policies that are being used to formulate the GHG Strategy
5. To show the GHG abatement strategy contributes towards Sustainable
Development.
6. To identify the benefits and Business goals for Carbon footprint estimation
7. To identify the scope of GHG emission to be included for GHG Accounting.

24
REVIEW OF LITERATURE
Céline Kauffmann and Cristina Tébar Less in their paper titled “TRANSITION TO A LOW-
CARBON ECONOMY: PUBLIC GOALS AND CORPORATE PRACTICES” (30th June -1st July 2010)
were of the opinion that policy frameworks, regulations and other drivers of corporate
action in support of a low-carbon economy and documents business practices in
addressing climate change, building on principles of responsible business conduct as
identified in the Guidelines for Multinational Enterprises. It is structured around three
broad areas of corporate action: accounting for greenhouse gas (GHG) emissions;
achieving reduction of GHG emissions; reaching out to suppliers, consumers and other
stakeholders.
The post 2012 international climate change architecture is still under discussion.
However, in the framework of the Copenhagen Accord, many governments have publically
pledged significant economy-wide GHG emission reductions and have started putting in
place policies to achieve emission reductions. Measures taken by governments to reach
emission targets vary in type (regulatory measures, taxes, emissions trading markets),
scope (sectors covered, types of emissions), and stringency. In particular, as this report
shows, policy measures directly aimed at framing corporate disclosure of GHG emissions,
emission reductions and the interface with consumers follow different approaches and are
at various stages of development in major OECD countries. Outside of the OECD they
remain largely non-existent.
A number of companies have realized the risks of inaction and have put climate change
strategies in place in spite of diverse and incomplete regulatory frameworks. Frontrunners
have started taking action as early as 1990, many in the early 2000s. Since 2005, with the
coming on stream of the European Union Emissions Trading Scheme and increased
attention of policy makers to climate change, mainstreaming of emission reduction in
business operations has become more widespread among companies. In particular,
evidence collected in support of this work through various sources, including a new survey
25
by OECD to companies, shows that an increasing number of companies is accounting GHG
emissions, establishing corporate plans to address climate change and looking beyond the
company’s boundaries to contribute to a low-carbon economy.
In addition to complying with current regulation and anticipating future policy
developments, companies have various other motivations to reduce GHG emissions.
Drivers include cutting energy costs, reducing dependence on fossil fuels and seizing new
business opportunities. Companies are also increasingly responsive to societal
expectations in relation to climate change. If direct pressure from investors, consumers and
employees does not appear to be a major driver, companies are mindful of preserving or
improving their reputation. Companies are also aware of the importance of contributing to
shaping the policy debate at international, national and regional levels.
Accounting GHG emissions is an essential step for companies to assess climate change-
related risks and understand their impacts on climate. The reporting of this information
can help policy makers in developing targeted climate change policies and monitoring
progress across industries. For consumers, commercial partners and financial institutions,
this information provides a basis to understand the company’s carbon footprint and its
performance in managing climate-change risks.
According to Christian Van Stolk, Myles Collins, Mengjie Wu, Abigail Brown in their report
titled “ACCOUNTING FOR SUSTAINABILITY PART III”(November 2006) pointed out some
themes on the approaches and initiatives taken by actors in specific countries based on the
examples identified. However, this report does not aim to give a comprehensive overview
of global accounting for sustainability initiatives and programmes, nor provide an
exhaustive overview of initiatives and measures taken in the countries selected. The
accounting for sustainability field is emergent and multidisciplinary, with different
perspectives, frameworks, and approaches. This report offers a flavour of some of these
global approaches with a focus on their implementation and impact. Specifically, the report
shows examples of initiatives that aim to internalize the external costs of economic activity
and how initiatives aim to change the behavior of decision-makers and consumers.

26
For Tata Steel, Asia’s first and India’s largest integrated private sector steel company,
reducing its Green House Gas (GHG) emissions through energy efficiency is a key element
of its primary business goal: the acceptability of its product in international markets. Each
year, in pursuit of this goal, the company launches several energy efficiency projects and
introduces less-GHG-intensive processes. The company is also actively pursuing GHG
trading markets as a means of further improving its GHG performance.
To succeed in these efforts and be eligible for emerging trading schemes, Tata Steel must
have an accurate GHG inventory that includes all processes and activities, allows for
meaningful benchmarking, measures improvements, and promotes credible reporting. Tata
Steel has developed the capacity to measure its progress in reducing GHG emissions. Tata
Steel’s managers have access to on-line information on energy usage, material usage, waste
and by-product generation. Using this data and the GHG Protocol calculation tools, Tata
Steel generates two key long-term, strategic performance indicators: specific energy
consumption (Giga calorie / tonne of crude steel) and GHG. Since the company adopted the
GHG Protocol Corporate Standard, tracking performance has become more structured and
streamlined. This system allows Tata Steel quick and easy access to its GHG inventory and
helps the company maximize process and material flow efficiencies.
According to CLIMATE MODELLING FORUM , A report published by MINISTRY OF
ENVIRONMENT & FOREST (MoEF), GOVERNMENT OF INDIA (September 2009) , The
international debate on climate change is influenced to a significant extent by studies that
estimate the GHG emissions trajectories of the major economies of the world. These studies
are based on detailed energy-economy models that project global and region or country-
wise GHG emissions. Until recently, most of these studies have been carried out in
developed countries, and have often applied assumptions and techniques that do not
necessarily reflect the ground realities in developing countries.
With a view to develop a fact-based perspective on climate change in India that clearly
reflects the realities of its economic growth, the policy and regulatory structures, and the
vulnerabilities of climate change, the Government of India, through the Ministry of
27
Environment & Forests, has supported a set of independent studies by leading economic
institutions. This initiative is aimed at better reflecting the policy and regulatory structure
in India, and its specific climate change vulnerabilities. The studies, which use distinct
methodologies, are based on the development of energy-economic and impact models that
enable an integrated assessment of India’s GHG emissions profile, mitigation options and
costs, as well as the economic and food security implications. Mitigation of GHG emissions
will, beyond a fairly modest level, involve appreciable economic costs to a society. On the
other hand, the adverse impacts of climate change would be felt in diverse sectors which
are at the core of livelihood concerns, especially of the poor – agriculture, water resources,
coastal resources, vector borne disease, “natural” calamities, etc.
According to the report published by THE ENERGY RESOURCE INSTITUTE (TERI), titled
“CLIMATE CHANGE MITIGATION MEASURES IN INDIA” (2008) India is the world’s fourth
largest economy and fifth largest greenhouse gas (GHG) emitter, accounting for about 5%
of global emissions. India’s emissions increased 65% between 1990 and 2005 and are
projected to grow another 70% by 2020. By other measures, India’s emissions are low
compared to those of other major economies. India accounts for only 2% of cumulative
energy-related emissions since 1850.
On a per capita basis, India’s emissions are 70% below the world average and 93% below
those of the United States. India remains home to the world’s largest number of poor
people, with nearly 35% living on less than a dollar a day. Its economy is growing rapidly,
however, with GDP rising about 8% a year over the past five years. As the economy has
grown, emissions intensity (GHGs per unit of GDP) has declined significantly. India’s GHG
intensity is currently 20% lower than the world average (and 15% and 40% lower than the
United States ’and China’s, respectively). Factors contributing to the decline in energy
intensity include improved energy efficiency, increased use of renewable and nuclear
power, expanded public transport, and energy pricing reform.
With rapid economic growth, rising income, and greater availability of goods and services,
energy demand rose 68% between 1990 and 2009, about 3.5% annually.3 The government
28
projects energy demand growth of 5.2% a year for the next 25 years, driven by annual GDP
growth rates of 8-10%. Coal accounts for 39% of total primary energy demand, followed by
biomass and waste (29%), oil (25%) and natural gas (5%). The high proportion of biomass
and waste reflects the fact that some 500 million people have no access to electricity or
other modern energy services. Coal is projected to remain the primary energy source, with
demand growing nearly three-fold by 2030.
As in many other countries, India has a number of policies that, while not driven by climate
concerns, contribute to climate mitigation by reducing or avoiding GHG emissions. (Specific
estimates of the emission impacts of the policies described below are in most cases not
available. However, a recent analysis by The Energy and Resources Institute (TERI)
concluded that in the absence of a number of energy policies that are currently being
implemented, CO2 emissions would be nearly 20% higher compared to business as usual
scenarios in both 2021 and 2031.).
Many of these policies are contained in the Five Year Plans developed by the Planning
Commission to guide economic policy in India (the 11th Five Year Plan covers 2007-
2012).9 Other policies are found in the Integrated Energy Policy approved by the Planning
Commission in 2006 with the broad objective of meeting energy demand “at the least cost
in a technically efficient, economically viable and environmentally sustainable manner.” In
June 2008, Prime Minister Singh released India’s first National Action Plan on Climate
Change outlining existing and future policies and programs addressing climate mitigation
and adaptation. The plan identifies eight core “national missions” running through 2017
and directs ministries to submit detailed implementation plans to the Prime Minister’s
Council on Climate Change by December 2008.
As per working paper titled “INCENTIVE-BASED APPROACHES FOR MITIGATING
GREENHOUSE GAS EMISSIONS” by Shreekant Gupta (October 2002), As a consequence of
the flexibility mechanisms incorporated in the Kyoto Protocol, incentive-based policies
such as emissions trading and the clean development mechanism are being widely
discussed in the context of greenhouse gas (GHG) abatement. This paper examines various

29
issues related to incentive-based approaches for India. Some of the specific questions it
addresses are: does India stand to gain or lose if emission trading is realized even if it
remains outside such an arrangement? Are there any other incentive-based approaches,
e.g., carbon taxes that India could adopt? In the ultimate analysis, however, market-based
instruments (MBIs) for GHG abatement in India cannot be viewed in isolation from an
overall incentive-based orientation towards environmental policy as well as broader
economic and legal reform that creates a suitable milieu for MBIs. Therefore, the paper
goes on to examine problems of implementing MBIs in general, particularly those related to
monitoring of emissions and of enforcement. Several specific solutions are also proposed.
MBIs can be broadly classified in two groups: price-based instruments and quantity-based
instruments. While all of these instruments can be used to address a wide range of
environmental problems, they are discussed below primarily in terms of their application
to greenhouse gas (GHG) abatement. Within the first group, one can further differentiate
between direct and indirect price-based instruments. The former induce generators of
pollution to reduce pollution by charging for the use environmental resources, e.g., air and
water. Indirect price-based instruments on the other hand, increase (decrease) the prices
of outputs and inputs that are complementary (substitutes) to the polluting activity. For
example, a tax on petrol (or a subsidy to mass transit) is an indirect price-based instrument
to address industrial air pollution.
According to the paper titled “IMPLICATIONS OF CO2 CAPTURE & STORAGE FOR GHG
INVENTORIES & ACCOUNTING” by William Kojo Agyemang-Bonsu (Ghana), A.M. Al-Ibrahim
(Saudi Arabia), Carlos Lopez (Cuba), Gregg Marland (United States), Huang Shenchu
(China), Oleg Tailakov (Russian Federation), the IPCC Guidelines and Good Practice
Guidance reports (GPG2000 and GPG-LULUCF) are used in preparing national inventories
under the UNFCCC.
These guidelines do not specifically address CO2 capture and storage, but the general
framework and concepts could be applied for this purpose. The IPCC guidelines give

30
guidance for reporting on annual emissions by gas and by sector. The amount of CO2
captured and stored can be measured, and could be reflected in the relevant sectors and
categories producing the emissions, or in new categories created specifically for CO2
capture, transportation and storage in the reporting framework. In the first option, CCS
would be treated as a mitigation measure and, for example, power plants with CO2 capture
or use of decarbonized fuels would have lower emissions factors (kgCO2/kg fuel used) than
conventional systems. In the second option, the captured and stored amounts would be
reported as removals (sinks) for CO2. In both options, emissions from fossil fuel use due to
the additional energy requirements in the capture, transportation and injection processes
would be covered by current methodologies.
Methodologies to estimate monitor and report physical leakage from storage options
would need to be developed. Some additional guidance specific to the systems would need
to be given for fugitive emissions from capture, transportation and injection processes.
Conceptually, a similar scheme could be used for mineral carbonation and industrial use of
CO2. However, detailed methodologies would need to be developed for the specific
processes. Quantified commitments, emission trading or other similar mechanisms need
clear rules and methodologies for accounting for emissions and removals. There are
several challenges for the accounting frameworks.
Firstly, there is a lack of knowledge about the rate of physical leakage from different
storage options including possibilities for accidental releases over a very long time period
(issues of permanence and liability). Secondly, there are the implications of the additional
energy requirements of the options; and the issues of liability and economic leakage where
CO2 capture and storage crosses the traditional accounting boundaries.
Information on pollutant emissions is usually compiled in ‘emission inventories’. Emissions
are listed according to categories such as pollutants, sectors, and source and compiled per
geographic area and time interval. Many different emission inventories have been prepared
for different purposes.

31
RESEARCH METHODOLOGY
The methodology for carbon footprint assessment has been undertaken from essential
components from WBCSD GHG Protocol and ISO 14064 Guidelines. Six essential broad
steps have been identified to arrive at the carbon footprint and ultimately the carbon assets
and liabilities of ACL.
1: Identification of GHG source, sink/ reservoir
A. Greenhouse Gas (GHG) – Six gases are identified as carbon dioxide (CO2), methane
(CH4), nitrous oxide (N2O), Hydroflourocarbons (HFCs), Perflourocarbons (PFCs)
and sulphur hexafluoride (SF6).
B. GHG source- Physical unit or process which releases a GHG into the atmosphere and
categorized as scope 1, 2 or 3 emission source.
C. GHG sink- Physical unit or process that absorbs a GHG from the atmosphere. Thus
process and units in ACL which are the potential GHG source and sink were
identified.
2: Defining Organizational & Operational Boundary
Business operations vary in their legal and organizational structures. In setting
organizational boundaries, a company selects an approach for consolidating GHG emissions
and then consistently applies the selected approach to define those businesses and
operations that constitute the company for the purpose of accounting and reporting GHG
emissions. Setting up Organizational boundary: For corporate reporting, two distinct
approaches are used to consolidate GHG emissions. They are Equity Share Approach &
Control Approach which has been defined below.
32
A. Equity share approach: A company accounts for GHG emissions from operations
according to its share of equity in the operation. The equity share reflects economic
interest, which is the extent of rights a company has to the risks and rewards
flowing from an operation.
B. Control approach: A company accounts for 100% of the GHG emissions from
operations over which it has control. It does not account for GHG emissions from
operations in which it owns an interest but has no control.
Now here control can be defined in two ways:
A. Financial Control: A company has financial control over the operation if it has the
ability to direct the financial and operating policies with a view to gaining economic
benefits from its activities. Financial control usually exists if the company has the
right to the majority of benefits of the operation, however these rights are conveyed.
A company is also considered to financially control an operation if it retains the
majority risks and rewards of ownership of the operation’s assets.
B. Operational Control: A company has operational control over an operation if it or
one of its subsidiaries has full authority to introduce and implement its operating
policies at the operation. Usually if the company or its subsidiaries is the operator of
a facility, it will have full authority to introduce and implement its operating
policies.
Determination of Operational Boundary for the purpose of Carbon Footprint Estimation:
After determination of organizational boundaries, the organization shall establish its
operational boundaries. The establishment of operational boundaries includes identifying
GHG emissions and removals associated with the organization’s operations, categorizing
GHG emissions and removals into direct, energy indirect and other indirect and choosing
33
which of the other indirect emissions will be quantified monitored and reported. It would
be implemented by:
A. Site visit to the different units of ACL
B. Identification & simplification of boundary into components for identifying GHG
emission sources (direct & indirect).
C. Study and analysis of each identified component such as Equipment’s, Energy
consumption & Materials consumed in the process
D. Quantification of the energy consumed during the whole operation procedure
3: Data Collection Approach
A. Collection and assimilation of data on the energy consumption of each component
(preferably equipment-wise) of the plant- past 1 year.
B. Collection and assimilation of data on the material flow in each section (preferably
equipment-wise) of the plant- past 1 year.
4: Layout of Calculation Methodology
A. Calculation of GHG emissions within each identified component of the unit based on
collected data (equipment wise)
B. Mass and Energy balance for entire process
C. Estimation of specific energy and mass consumption for each sub process
34
D. Estimation of emission factor for the process.
E. Estimation of total GHG emission.
F. Guidelines for monitoring GHG emission and development of strategy.
G. Guidance for setting up of GHG manual, GHG reduction target as per WBCSD
protocol/ ISO14064.
5. Determination of Carbon Footprint
This step consists of identification of areas of high emissions and suggestions for energy
consumption reduction in the same.
ACL is a major chemical producing company and hence a major GHG emitter. The annual
GHG emissions of ACL stand at around 2.44 million tCO2 per annum due to consumption of
fossil fuel and electricity. The main drivers for ACL for carbon footprint estimation were:
A. Carbon footprint will identify the energy intensive processes, equipments and
operations. Improvements in these processes, equipments and operations will lead
to lower energy and raw material consumption and hence increased level of
understanding of better cost cutting and revenue enhancement opportunities across
the organization's value chain.
B. This is especially true for energy intensive processes of soda ash, cement and
fertilizer manufacturing and power plant operations. Proper implementation of
energy efficiency/ GHG abatement measures to further upgrade processes and
equipments will generate cost savings from improved operational efficiencies and
reduced consumption.

35
C. There is opportunity to understand the current position in lieu of anticipated
emissions trading and GHG emissions regulations and reporting requirements, e.g.
Carbon Disclosure Project and Carbon Tax impositions thereby managing the
climate change risk effectively.
D. Better and effective management of stakeholder expectations can be done (e.g.,
meet expectations of customers, shareholders and financial institutions). A green
image of ACL will help in strengthening investor relationship.
E. Fortification of the reputation and brand image of ACL.
F. Improvement of the market positioning of ACL in terms of sustainability, brand,
products and services. In fact many institutional customers are more inclined to
purchase goods which are environment friendly.
Figure: - The brief methodology that was followed
Here maximum priority was given to operational boundary set up since the industry under
consideration was chemical industry and prioritizing the potential area was of maximum
importance. Data collection was taken as 3rd major priority since the analysis was based on
data collection and analysis had to be inclined towards estimation of carbon footprint of
AQUASUB CHEMICALS LIMITED.
INTRODUCTIONOPERATION BOUNDARY
SET UP
DATA COLLECTION
ANALYSISWAY
FORWARD
36
CASE STUDY: - GHG ACCOUNTING/CARBON FOOTPRINT
ESTIMATION OF AQUASUB CHEMICALS LIMITED, HALDIA,
WEST BENGAL.
BRIEF INTRODUCTION ABOUT THE ORGANISATION:-
The Aquasub Chemical Limited, also known as ACL, is the country’s largest producer of
inorganic chemicals. Over the last two years, the company has witnessed several
acquisitions and mergers which have catapulted it to become the world’s second largest
Soda-ash manufacturing company with a unique diverse portfolio of value creating assets
and brands. The company is the only soda-ash manufacturer to have a strong-hold in 4
continents. Although the mainstay of ACL is production of soda-ash, ACL also specializes in
the production of other inorganic chemicals such as sodium bicarbonate, nitrogenous and
phosphate fertilizers, sodium tri-poly phosphate, cement and packaged salt. Some of the
major achievements of ACL over the last year are. The chemicals’ business of ACL achieved
the highest sales ever, reflecting a growth of 4.42% as compared to the previous year. ACL
is the Indian market leader in edible salts and soda ash. The company acquired one of the
major soda-ash players in USA, General Chemical Industrial Products (GCIP), which
catapulted it to the position of the third largest soda-ash producer in the world along with
opening of new avenues for the group. ACL is the most energy efficient urea manufacturer
in India. The two main strategic business units (SBUs) of ACL include chemicals and
fertilizers. Fertilizers are manufactured in India while the company has chemical
manufacturing plants spread all over the globe.
BRIEF DESCRIPTION ABOUT THE ACL HALDIA PLANT:-
The Haldia plant is primarily involved in the manufacturing of fertilizers and chemicals.
The integrated manufacturing produces various chemicals such as sulphuric acid,
phosphoric acid and phosphatic fertilizers which include sodium tri-poly phosphate
(STPP), di-ammonium phosphate (DAP), Nitrogen-Phosphorus-Potassium (NPK)
complexes and single super phosphate (SSP) fertilizer. The plant is the largest producer of
37
STPP, a building component of detergents in India. The product mix and technology used
for manufacture of each product is as below:
A. Sulphuric Acid by Double Conversion Double Absorption Process
B. Phosphoric acid by Dihydrate Process
C. STPP by Wet process from soda ash
D. Single super phosphate by Total H2SiF6 recycles process
E. DAP/ NPK complexes
F. Linear Alkyl benzene sulphonic acid (LABSA)
ACL has a global visibility with various acquisitions and subsidiaries located across the
globe. One of them is Brunner Monde Group (U.K).
Brunner Monde Lostock & Winnington (U.K)
Brunner Monde is the only U.K. Producer of sodium carbonate (soda ash) and sodium
bicarbonate. It has soda ash plants at Lostock (Greater Manchester) and Winnington (North
London). The Winnington Plant is one of the most efficient power plants in Europe with a
combined thermal and electrical efficiency of 85% resulting in total CO2 emission
reduction from 900000 tonnes/year to 750000 tonnes/year. The power and steam to both
these plants are supplied by the combined heat and power (CHP) plant in Northwich,
Cheshire, London, is one of the largest such schemes in the UK. The CHP plant is owned and
operated by POWERGEN (now EON) is capable of supplying approximately 500 tonnes of
steam every hour and generating 130MW of electricity. Brunner Monde consumes only 25
MW of the generated 120 MW and the remainder is exported to National Grid.
Brunner Monde Delfzijl Plant (NETHERLANDS) The Delfzijl unit in North-east of Amsterdam Netherlands, has a capacity of 50,000
tonnes/year of sodium bicarbonate. The plant became operational in June 2008 and serves
the pharmaceuticals and food industries. The plant uses surplus carbon dioxide from the
soda ash plant as one of its raw materials – which improves the air quality, as well as
enhances the efficiency of the whole manufacturing complex.

38
General Chemical Industrial Products (USA)
General Chemical Industrial Products (GCIP) is one of the top five global producers of soda
ash. GCIP was acquired by Aquasub Chemicals in January 2008, making the company the
second largest soda ash producer in the world. GCIP mines the Green River basin in
Wyoming, USA, for naturally occurring deposits of trona (an ore containing soda ash). The
site is estimated to contain 134 billion tonnes of trona, enough to meet global soda ash
demand for hundreds of years at current levels of consumption. GCIP produces natural
soda ash, which requires much less energy, capital and raw materials than synthetic soda
ash production.
Relevant Standards for Carbon Footprint Assessment
DESCIPTION GHG PROTOCOL INITIATIVE ISO 14064
Salient Features
Developed for businesses through
an inclusive and transparent
multi stakeholder process
comprising of 350+ stakeholders
(incl. Businesses, NGOs,
governments and Inter
Government organizations.
Consists of a set of unambiguous
and verifiable requirements or
specifications to support
organizations and proponents of
GHG emission reduction projects.
Aims to achieve clarity and
consistency between those
reporting GHG emissions and
stakeholders.
Types of Standards Accounting and Reporting
Standard (Guide for companies to
use in quantifying and reporting
their GHG emissions) GHG
Protocol Project Quantification
Standard (Guide for quantifying
reductions from GHG mitigation
projects)
ISO 14064-1:2006,
Greenhouse gases –
Part 1, specifies requirements for
designing and developing
organization or entity-level
GHG inventories.
Part 2, details requirements for
quantifying, monitoring and
reporting emission reductions
and removal enhancements from
GHG projects.
Part 3, Guidance for conducting of
validation & verification.

39
BASE YEAR SELECTION:-
The process of planned abatement of GHG emissions starts off with identification of sources
and quantification of the emissions which can also be termed as inventorization. The GHG
inventory process is an exhaustive and comprehensive analysis of the existing activities
involved and their respective climate change implications (or GHG emissions). Companies
may need to track emissions over time as a requirement of a variety of business goals, such
as public reporting, establishing GHG targets, managing risks and opportunities and
addressing the needs of investors and other stakeholders. The preliminary use of the GHG
inventory is towards arriving at futuristic abatement, mitigation and management
strategies. A meaningful and consistent comparison of emissions over time requires that
companies set a performance datum with which to compare current emissions. This datum
is the base year. For consistent tracking of emissions over time, the base year emissions
may need to be recalculated as companies undergo significant structural changes such as
acquisitions, divestments, and mergers.
The selection of an appropriate base year is attributed to the availability of verifiable GHG
emissions and/or removals data for that year. The base year may either be a single year
data or a multi-year average or rolling average data. However, once a base year is selected,
the same should be documented with reasons responsible for its selection.
VALIDITY OF BASE YEAR & RECALCULATION:- The documentation of the base year selection process should also include the detailed
procedure to be followed by the company to allow the base year GHG inventory to remain
valid as a comparative tool. The base year inventory shall be recalculated if significant
changes occur to base year GHG emissions or removals as a result of changes to operational
boundaries, ownership and control of GHG sources/sinks transfers into/out of
organizational boundaries and changes to GHG quantification methodologies will result in
significant changes to GHG emissions or removals. However the base year GHG inventory
shall not be recalculated to account for changes in facility production levels.

40
DATA COLLECTION & PROCESSING METHODOLOGY:-
Data collection forms the corner-stone of GHG inventory process. In order to report
corporations total GHG emissions, the companies would be required to gather and collate
data from multiple sources. The data collection procedure should be enshrined with the
five fundamental principles of GHG accounting and reporting which are:
A. Relevance
B. Completeness
C. Consistency
D. Transparency
E. Accuracy
Following the process of setting up of the organizational and operational boundaries and
further identifying the scope of emissions, the data collection procedure begins. The data
collection approach may either be a centralized or a decentralized approach. The
centralized approach demands that the individual facilities report activity/fuel use data to
the corporate (central level) wherein emissions are calculated, whereas the decentralized
approach as the name suggests involves individual organizations to directly calculate their
emissions using approved methods and reporting the same to the central authority. In
order to maximize accuracy and minimize reporting burdens a combination of the two
approaches can also be selected. The collection of authentic data is one of the key
constraints in developing the GHG inventory. To ascertain the quality of data the following
data collection tools may be used:
A. Secure databases available over company intranet or internet, for direct entry by
facilities.
B. Spreadsheet templates filled/ mailed to the corporate office where data is further
processed
C. Paper reporting format
41
For arriving at the GHG emission inventory for ACL using a decentralized approach, the
data collection has been done using spreadsheets. A preliminary understanding of the
process flow diagrams has been used to develop customized data collection templates from
the plant facilities.
CALCULATION AND ANALYSIS OF CARBON FOOTPRINT OF ACL:-
The procedure followed for Carbon Footprint Estimation exercise has been adopted to
ensure maximum possible completeness transparency and conservativeness in terms of
identifying the sources of GHG emissions as well as the data collection and analysis
procedures.
Assumptions in the calculations
The relevant assumptions in the estimation of Carbon Footprint of ACL are as follows:
A. The study considers IPCC 2006 default values of emission factors and net calorific
values of fossil fuels in absence of locally measured or country specific values.
B. For inter-conversion of units of measurements, standard conversion factors have
been used.
C. For calculation of emissions due to transportation of products over rail, emission
factor for transportation of products by rail has been sourced from WBCSD.
D. For calculation of emissions due to transportation of products by road in diesel
trucks, a standard mileage value of 3 km/l has been assumed.
E. For calculation of emissions due to travel of employees by air, emission factor for
transportation of passengers by air has been sourced from WBCSD.

42
F. For calculation of emissions due to travel of employees by road, a standard mileage
value of 12km/l has been assumed.
G. Indirect emissions for the sake of calculation complication have been neglected,
though their effects have been duly considered.
Fossil Fuel Emission Factor(tCO2e/TJ) Net calorific value
Natural Gas(Gaseous) 56.1 0.048
Naptha 73.3 0.0445
Natural Gas(Liquid) 64.2 0.0442
LDO/HSD 74.1 0.043
Furnace Oil 77.4 0.0404
LPG 63.1 0.0473
Coal 96.1 0.0189
Pet Coke 97.5 0.032
Coking Coal 96.4 0.0282
Table 2:- List of IPCC factors for fossil fuels and emission factor of transportation used for
calculations
Mode of Transportation WBCSD Emission Factor
Emission factor of transportation by
Railway
0.02kg CO2/MT-km
Emission factor of air-travel of passengers Depends on the distance between source
and destination.
Table :- Emission Factor consideration as per WBCSD norms
43
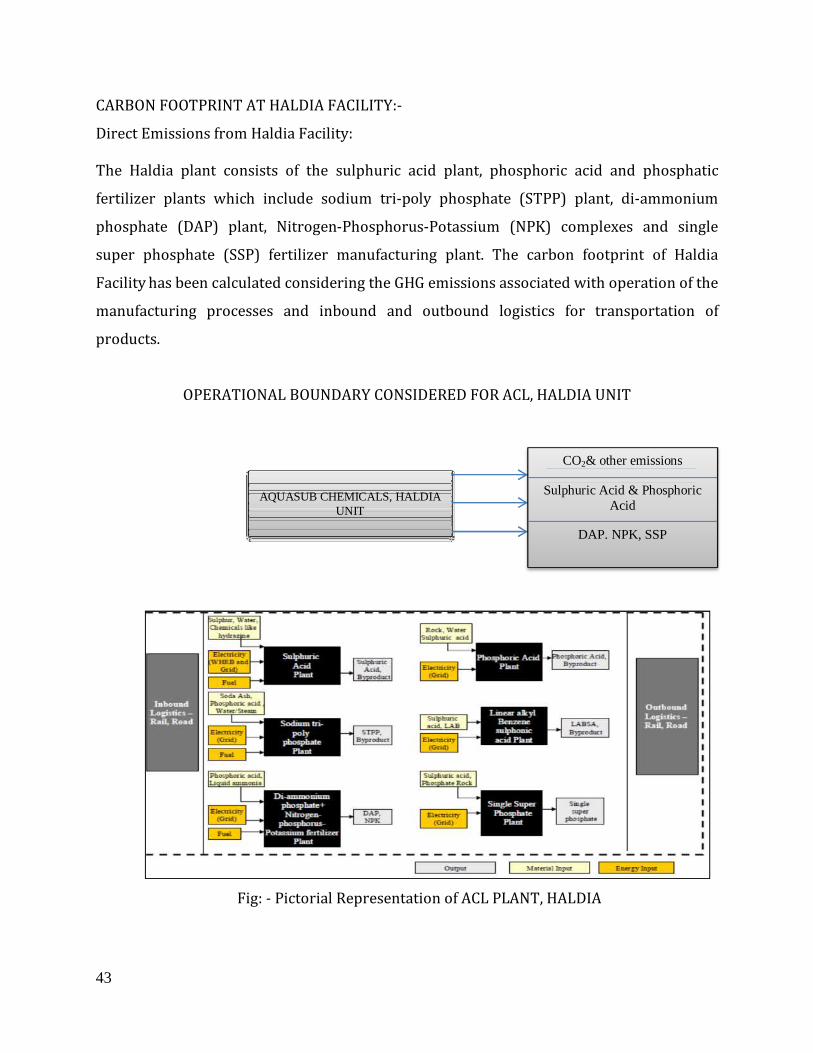
CARBON FOOTPRINT AT HALDIA FACILITY:-
Direct Emissions from Haldia Facility:
The Haldia plant consists of the sulphuric acid plant, phosphoric acid and phosphatic
fertilizer plants which include sodium tri-poly phosphate (STPP) plant, di-ammonium
phosphate (DAP) plant, Nitrogen-Phosphorus-Potassium (NPK) complexes and single
super phosphate (SSP) fertilizer manufacturing plant. The carbon footprint of Haldia
Facility has been calculated considering the GHG emissions associated with operation of the
manufacturing processes and inbound and outbound logistics for transportation of
products.
OPERATIONAL BOUNDARY CONSIDERED FOR ACL, HALDIA UNIT
Fig: - Pictorial Representation of ACL PLANT, HALDIA
AQUASUB CHEMICALS, HALDIA UNIT
CO2& other emissions
Sulphuric Acid & Phosphoric Acid
DAP. NPK, SSP

44
Name of Unit Emission due to Electricity
Consumption tCO2
Emission due to
direct fossil fuel
combustion tCO2
Emission due to
steam consumption
tCO2
Total
% of
total
emission
Direct Emission
Sulphuric Acid Plant 4699 2153 0 6852 10.9359
Phosphoric Acid
Plant 4320 0 0 4320 6.894791
STPP Plant 6105 14001 0 20106 32.0895
LABSA PLANT 597 0 0 597 0.952822
SSP Plant 2373 0 0 2373 3.787347
DAP+NPK Plant 19301 9106 0 28408 45.33963
TOTAL 37395 25260 0 62656 100
Table: GHG Inventory of the Haldia Facility-Direct Emissions
* Steam consumed in Haldia Plant is generated from Waste Heat Recovery Boilers, hence GHG emissions due
to steam consumption is zero.
Indirect Emissions from Haldia Facility:-
Indirect emissions are those where the GHG inventory is not effected directly like:-
A. Emissions due to business travel of employees by road
B. Emissions due to business travel of employees by air
C. Emissions due to inward and outward bound logistics by road
D. Emissions due to inward and outward bound logistics by rail
Parameters Tonnes of CO2
Indirect Emission (Road Travel) 19
Indirect Emission (Air Travel) 60
In Logistics 23
Out Logistics (Rail) 16652
Out Logistics (Road) 6655
Total 23408
Table: - GHG Inventory due to Logistics & Travel, Haldia-Indirect Emissions
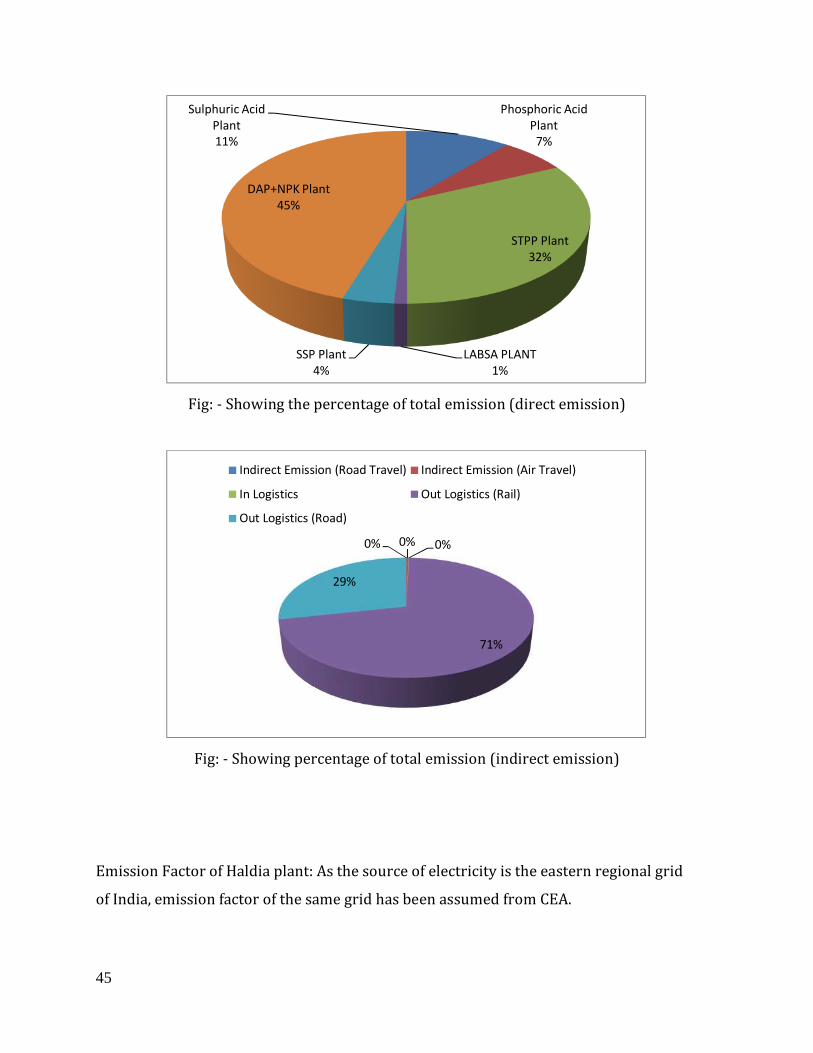
45
Fig: - Showing the percentage of total emission (direct emission)
Fig: - Showing percentage of total emission (indirect emission)
Emission Factor of Haldia plant: As the source of electricity is the eastern regional grid
of India, emission factor of the same grid has been assumed from CEA.
Sulphuric Acid
Plant
11%
Phosphoric Acid
Plant
7%
STPP Plant
32%
LABSA PLANT
1%
SSP Plant
4%
DAP+NPK Plant
45%
0% 0% 0%
71%
29%
Indirect Emission (Road Travel) Indirect Emission (Air Travel)
In Logistics Out Logistics (Rail)
Out Logistics (Road)

46
Name CO2 Emission Factor Source
Eastern Regional Grid (tCO2/MWh) 0.80 CEA Database
Table: - Electricity Emission Factor of Haldia Facility
Hence from the carbon footprint study at ACL Unit, Haldia, emission from (DAP +NPK)
plant is maximum in case of direct emissions while emissions from logistics freight by
Railways is maximum in case of indirect emission.
The footprint for ACL has been calculated based on the monitored plant data as provided
by ACL. In cases of unavailability of data there could be deviation leading to some
difference between the actual and the estimated emission calculations. The most
conservative estimate has been taken in such a case and standard values or IPCC default
values have been considered. The following parameters have been taken into consideration
while calculating the GHG inventory of the different chemical plants:
Emission Factors- The carbon percentage of the fuel in use are unavailable. So the
emission factors of Natural Gas, Naphtha, Pet Coke, LDO and Coal have been taken from the
IPCC 2006 guidelines.
Net Calorific Value of the fuel -In cases of unavailability of plant data the default Net
Calorific Value (from IPCC) values of the fuel into consideration has been taken. The Net
Calorific Value of Natural Gas, Naphtha, Pet Coke, LDO and coal have been taken from the
IPCC 2006 guidelines.
Density of the fuel -In cases where the density of the fuels is unavailable, it has been taken
from an authentic source or it has been calculated from the fundamentals. In Haldia the
density of Natural gas has been taken to be 0.667 kg/Sm3 (calculated).
Fossil fuel consumption –In case of unavailability of monthly data for fossil fuel
consumption, average hourly data (kg/hour) along with average operational hours for the
months (hour/month) have been used to calculate the fossil fuel consumption.
47
RESULTS & DISCUSSION
From the project activity, potential areas of increasing CO2 emissions were identified, both
for direct emissions and both for indirect emissions. Now the question arises, are there any
mitigatory measures? In this section we would discuss about the abatement measures and
necessary GHG strategy.
GHG Abatement Strategies in the Chemicals SBU of ACL
Short term Strategy:-
Energy efficiency improvement in production of chemicals such as sulphuric acid,
phosphoric acid and phosphatic fertilizers which include sodium tri-poly phosphate
(STPP), di-ammonium phosphate (DAP), Nitrogen-Phosphorus-Potassium (NPK)
complexes and single super phosphate (SSP) fertilizer. The plant is the largest producer of
STPP, a building component of detergents in India.
ACL may implement Nano-filtration (NF) technology for purification of brine used in the
soda ash plant. Due to unavailability of raw water, ACL presently uses sea water as source
of raw water. Owing to the high percentage of calcium and magnesium salts, ACL is
required to treat the raw sea water to remove salts. Thereafter, salt dissolves externally in
a static salt dissolver to increase the percentage of sodium chloride in sea-water. The NF
plant proves to be an effective technology for sea-water purification utilized for brine
preparation and purification. It is similar to a reverse osmosis plant consisting of:-
1. Conventional pretreatment unit
2. Nano Filtration membranes skid
Prior to passing through NF membranes skid, the sea water will pass through cartridge
filters to ensure that zero turbidity water enters the Nano filtration unit. The NF membrane
will remove the bivalent ions present in the seawater; Ca, Mg, SO4 while allowing maximum
chloride ions to pass through it.

48
Replacement of the 4-stage Calciner to a 6 stage Separate Line Calciner (SLC) coupled with
the use of high efficiency coolers will result in improvement in the thermal energy
efficiency and lead to reduction in overall GHG emissions. The presence of the additional
two stages will result in additional heat transfer to the kiln feed and reduce pre-heater
exhaust temperature. Coal combustion will also improve in the new SLC using the hot
tertiary air from the kiln hood. This will reduce the specific coal consumption, the quantity
of air requirement, the pre-heater gas volume and consequently the energy consumption of
the circulation system. The cumulative effect is a net reduction in emissions of GHGs to the
tune of 0.06tonne CO2/kg of clinker.
Proper redesigning of the grate system of the existing Cooler has the potential to increase
the cooler recuperation efficiency i.e. higher quantity of heat will be utilized in clinker
cooler. The technology involves retrofitting of the clinker cooler for effective trapping of
the heat in the clinker cooler. New clinker inlet distribution system is used to distribute the
clinker on the grate. Due to the benefits of the inlet grate system the proper cooling of inlet
will take place with additional benefit of high temperature tertiary air ducts. The
application of this technology at the cement plant will help to achieve a shift towards low
carbon path which can leverage financing through\ carbon revenue. Approximately 20
kCal/kg of clinker of thermal energy savings and is possible by application of this
technology.
The waste heat generated from the clinker-cooler exit-gas and pre-heater exit gas may
be captured in waste heat recovery boilers to generate steam. The steam can generate
power via a steam turbine using Rankine Cycle thus displacing the GHG intensive power
generation in the coal based captive power plant production facility. The effective
utilization of the waste gases which would otherwise have been vented into the
atmosphere for power generation is a major GHG abatement initiative that may be adopted
at the cement plant.

49
Fig: -Representative Diagram of utilization of clinker cooler gas for power
Generation
Injection of superheated steam into the compressor discharge upstream of combustion
chambers will increase the mass flow to the turbine section. This will result in increased
power output. The modification will result in added mass flow into the turbine without
considerable increase in compressor power consumption. This will result in lower specific
fuel consumption and an improved heat rate. Under usual conditions, turbine output
decreases with ambient temperature. Thus the steam injection modification can maintain
the higher output even at higher temperatures. The maximum steam injection possible for
power generation improvement is approximately 5% of compressor air flow for a typical
Frame V gas turbine that can be retrofitted with steam injection system19. Excess steam in
the fertilizer complex may cater to the superheated steam requirement of the steam
injection modification. As per estimates from BGGTS (joint venture between BHEL and GE)
a typical Frame V gas turbine having a steam injection

50
rate of approximately 5% compressor airflow may result in reduction of heat rate by
7.2% vis-à-vis an increase of 2-3MW in power generation.
Medium term abatement Strategies
From the viewpoint of an organization such as ACL, production of bio-fuels is an important
opportunity of reducing the overall GHG impact. The potential is considerable at close to
2.1 to 2.2 tonnes of carbon dioxide for every tonne of bio-diesel production. Bio-diesel
produced may be used in a number of ways to displace the consumption of GHG intensive
fossil based diesel oil. These include:
A. Substitution of diesel in vehicles used for company travel.
B. Substitution of diesel in transportation of raw materials and products
C. Sale of bio-diesel for road based or rail based transportation purposes
Based on the technology selection for bio-diesel production, the production costs may be
quite high. This is a crucial factor as in all likelihood, to remain competitive in the petro-
diesel dominated market in India; ACL may have to sell bio-diesel at prices comparable to
that of petro-diesel irrespective of the higher production costs. The role of carbon credits in
plugging the gap between the production costs and selling price of bio-diesel will be an
important factor determining the feasibility of the venture.
Utilization of the wind energy for power generation using a wind turbine holds significant
potential for GHG abatement that may be adopted in manufacturing facility. Clean
electricity may be generated with zero emissions by harnessing the wind power potential
of the site where the wind based power plant would be set up. As the plant is located on the
western coast of India, the wind patterns may be favorable for setting up a wind energy
based generation system.
Biomass based power generation refers to the process that generates energy in the form of
electricity or heat from a biomass source like bamboo, rice husk and other agro/forest
residues. Such technologies reduce fossil fuel consumption and decrease GHG emission
51
Long term abatement Strategies
Brunner Monde Lostock & Winnington (U.K) has been one of the most energy efficient
chemical plant in UK. Hence the energy efficiency measures and steps followed by the plant
could be implemented here in India as well. Brunner Monde’ Netherlands could also be an
ideal example while implementing energy efficiency measures
Tidal energy from the motion of ocean tides can be trapped and effectively utilized for
clean power generation. Tidal barrage systems are technically feasible, utilizing
conventional low head hydro turbines and dams/barrages. Adoption of renewable power
generation technology replacing the power generation from the existing coal based captive
power plant is a GHG abatement initiative resulting in GHG emission reductions to the tune
of 0.7 tCO2/MWh. Proximity of the plant location to the Arabian Sea will play a significant
role in working out the feasibility of harnessing the ocean waves to generate electricity and
displace fossil fuel based generation.
Geothermal energy i.e. the heat contained within the Earth that generates geological
phenomena on a planetary scale can be captured and utilized for power generation.
‘Geothermal energy’ is often used nowadays, however, to indicate that part of the Earth's
heat that can, or could, be recovered and exploited by man. The steam and water captured
beneath the earth’s surface is separated and electricity generation mainly takes place in
conventional steam turbines. Conventional steam turbines require fluids at temperatures
of at least 150 °C. The steam, direct from dry steam wells or, after separation, from wet
wells, is passed through a turbine and exhausted to the atmosphere. About 0.77
tCO2e/MWh of GHG abatement can be achieved through implementation of this measure
Soda ash production by calcination of trona ores is less GHG intensive as compared to the
production by Solvay process. Hence, a shift in the production from Solvay to natural trona
calcinations will result in reduction of carbon dioxide emissions capacities of soda ash after
due evaluation of the carbon liability of Solvay Process vis-à-vis trona calcination. This is
thus a very important consideration.

52
CONCLUSION
From the case study it was evident that chemical industry was one of the most vulnerable
industries and thereby made significant contributions as GHG emitter. It was also seen that
the share of indirect emissions were higher as compared to the direct emissions from the
chemical plant itself. Hence a short term, long term and long term GHG abatement strategy
was required so that GHG emission could be significantly reduced. For that more and more
emphasis was given on utilizing renewable energy sources which not only yielded clean
fuel but also saved national revenue. Now an obvious question that would arise as to why a
chemical industry requires knowing its carbon footprint estimates?
The exercise of carbon footprint will improve industry’s understanding of its emissions
profile and any potential GHG liability or “exposure.” A company’s GHG exposure is
increasingly becoming a management issue in light of heightened scrutiny by the insurance
industry, shareholders, and the emergence of environmental regulations/policies designed
to reduce GHG emissions.
Identification and quantification of the carbon assets and liabilities/risks of ACL which are
the two essential components for understanding climate change risk-return perspective of
ACL. Identification of potential opportunities of progressively reducing ACL’s present
carbon footprint through energy optimization, process modifications and improvements,
adoption of clean technologies (e.g. GHG capture and storage) and greening the supply
chain Identification of CDM/JI projects in different units and implementation of the same /
assessment of the CER/VER earning potential of the opportunities identified.
Let’s look what are the benefits of GHG Accounting/Carbon footprint analysis:-
A. Carbon footprint will identify the energy intensive processes, equipments and
operations. Improvements in these processes, equipments and operations will lead
to lower energy and raw material consumption and hence increased level of
53
understanding of better cost cutting and revenue enhancement opportunities across
the organization's value chain.
B. Proper implementation of energy efficiency/GHG abatement measures to further
upgrade processes and equipments will generate cost savings from improved
operational efficiencies and reduced consumption.
C. There is opportunity to understand the current position in lieu of anticipated
emissions trading and GHG emissions regulations and reporting requirements, e.g.
Carbon Disclosure Project and Carbon Tax impositions thereby managing the
climate change risk effectively.
D. Better and effective management of stakeholder expectations can be done (e.g.,
meet expectations of customers, shareholders and financial institutions). A green
image will help in strengthening investor relationship.
E. Fortification of the reputation and brand image improvement since this will add
some value to the overall goodwill of the industry/organization.
F. Improvement of the market positioning of ACL in terms of sustainability, brand,
products and services. In fact many institutional customers are more inclined to
purchase goods which are environment friendly.
G. Participating in GHG markets – GHG emission profile also helps in participating in
carbon trade. This includes supporting internal GHG trading programs, Participating
in external cap and trade allowance trading programs, Calculating carbon/GHG
taxes.
H. To facilitate development and implementation of GHG management strategies and
plans as devised by top management

54
Now an obvious question that arises is how does the project contribute towards
sustainable development? Well in brief, the quantification of GHG emission of an industry
itself is a giant step towards attaining sustainable development. To add to that if the
abatement/mitigation strategies that have been recommended are followed proactively
then quantifying GHG emission would definitely be a part of attaining Sustainable
Development by an industry/organization.
Let’s get a brief idea about the basic principles of GHG Accounting:-
As we all know that carbon footprint of a company can be measured by accounting for its
GHG emissions or by GHG accounting. To ensure that reported data, information & related
disclosures provide a faithful, true, fair account of GHG emissions, removals, emission
reductions, removal enhancements, GHG quantification, monitoring, reporting, validation,
verification shall be based on the following principles:-
A. Completeness: All GHG emissions and removals within the chosen boundaries are
included. Any GHG emissions or removals not quantified and/or monitored are
disclosed and explained/justified.
B. Consistency: Consistent methodologies are used to permit meaningful comparisons.
Any changes to the methodologies, procedures or any other relevant factors are
disclosed and explained/justified.
C. Accuracy: Sufficient accuracy is achieved to enable users to make decisions with
reasonable assurance as to the integrity of quantification & of reported information.
Uncertainties are reduced as far as practical.
D. Transparency: All relevant issues are documented and disclosed in a factual and
coherent manner (based on an audit trail that allows users to judge it’s reliability).
Any relevant assumptions made and appropriate references to the quantification
methodologies and data sources used are disclosed.

55
E. Relevance: GHG quantification, monitoring and reporting methodologies are
appropriately selected to reflect GHG emissions/ removals and to serve the
decision-making needs of users.
Fig: - It represents the principles of GHG Accounting
Finally let’s look into the scope of the emission inventory:-
Direct (Scope 1) Emissions from fuel oil use, naphtha use, diesel use, LPG use, natural gas
use, coal use, electricity consumption and other fuels etc.
Indirect (Scope 2) Emissions from all electricity purchased for use in office buildings and
townships.
Indirect (Scope 3) Emissions from air travel, business travel in rental cars/ taxis, rail travel,
transport of raw materials and products by road rail, business travel by employees etc.
Completeness
Consistency
Transparency
Accuracy
Relevance

56
SCOPE AHEAD
Now there are a lot of scopes for improvement pertaining to analyzing carbon footprint.
The Guidelines for Multinational Enterprises are recommendations from governments to
business on responsible business conduct. Though the Guidelines do not specifically
address climate change, many of their recommendations reflect governments and societies’
expectations on what constitutes responsible business conduct in addressing climate
change. The Guidelines thus have an important role to play in helping build international
consensus and spread knowledge about advanced management practices in support of a
low carbon economy. This overview highlights recommendations which are relevant to
business action to address climate change.
Enterprises should contribute to economic, social and environmental progress with a view
to achieving sustainable development, develop and apply effective self-regulatory practices
and management systems that foster a relationship of confidence and mutual trust
between enterprises and the societies in which they operate. Enterprises should, within the
framework of laws, regulation and administrative practices in the countries in which they
operate, and in consideration of relevant international agreements, principles, objectives,
and standards, take due account of the need to protect the environment, public health and
safety, and generally to conduct their activities in a manner contributing to the wider goals
of sustainable development.
Consistent with the scientific and technical understanding of the risks, where there are
threats of serious damage to the environment, taking also into account human health and
safety, not use the lack of full scientific certainty as a reason for postponing cost-effective
measures to prevent or minimize such damage.
Enterprises should ensure that timely, regular, reliable and relevant information is
disclosed regarding their activities and performance. This information should be disclosed
for the enterprise as a whole and, where appropriate along business lines or geographic
57
areas. Disclosure policies of enterprises should be tailored to the nature, size and location
of the enterprise with due regard taken of costs, business confidentiality and other
competitive concerns Enterprises are encouraged to communicate additional information
that could include: value statements or statements of business conduct intended for public
disclosure including information on the social, ethical and environmental policies of the
enterprise and other codes of conduct to which the company subscribes.
Enterprises should continually seek to improve corporate environmental performance, by
inter alia, such activities as: - development and provision of products and services that have
no undue environmental impacts, are safe in their intended use; are efficient in their
consumption of energy and natural resources; can be reused, recycled, or disposed of
safely; - promoting higher levels of awareness among customers of the environmental
implications of using the products and services of the enterprise.
When dealing with consumers, enterprises should act in accordance with fair business,
marketing and advertising practices and should take all reasonable steps to ensure the
safety and quality of the goods or services they provide. In particular, they should: - Ensure
that the goods or services they provide meet all agreed or legally required standards for
consumer health and safety, including health warnings and product safety and information
labels; - Provide accurate and clear information regarding their content, safe use,
maintenance, storage, and disposal sufficient to enable consumers to make informed
decisions; - Not make representations or omissions, not engage in any other practices that
are deceptive, misleading, fraudulent, or unfair.
Promoting a more systemic approach to climate change would not seek to reduce the
problem to marketing gimmicks, celebrity endorsements, technological quick-fixes, or neo-
colonial exploitation. Any individual, organization or government embracing this holistic
attitude would commit to doing everything they could to reduce their climate impact, but
would not offset responsibility for any of their remaining emissions. Rather they would
commit to demanding, adopting and supporting climate policies that reduce emissions at
source as opposed to offsets or trading. They would support stricter regulation and

58
oversight and penalties for polluters on community, local, national and international levels,
and they would commit to supporting communities adversely impacted by climate change
and so-called ‘climate-friendly’ projects. Finally they would endorse the notion that real
solutions to climate change require social change and they would count themselves to be a
part of that movement, spending time and energy towards achieving such change.
Fig: - Showing types of project and time needed to offset emissions
Use of Renewable Energy can be an ideal choice to reduce GHG Emission. As already
discussed, use of biomass, wind can be a good option to generate energy. In addition to that
it also gives an option to apply for TREC (Tradable Renewable Energy Certificate) which
can be traded and credits can be utilized in a positive way.
In fact, the speed with which we need to offset our emissions depends on two things:
First it depends on the impending nature of the climate crisis. Just how fast do we need to
reduce our emissions to stop global warming?
Second, it depends on the rate at which global carbon dioxide emissions continue to rise. If
emissions continue to go up, we need to offset even faster to meet reduction targets. Hence
the ideal solution regarding this issue would be to be categorizing the vulnerable areas and
then quantify the GHG emission and then depending upon the area where emission is
higher, suitable mitigating measure needs to be implemented, like opting for renewable
energy and ensuring that the methods/practices leads to sustainable development.

59
BIBLIOGRAPHY
Following journals/research helped to prepare this report:-
Babiker, M.H., J.M. Reilly, M. Mayer, R.S. Eckaus, I.S. Wing and R.C. Hyman (2001), ‘The MIT
Emissions
Prediction and Policy Analysis (EPPA) Model: Revisions, Sensitivities and Comparison of
Results’,
Report no. 71, MIT Joint Program on the Science and Policy of Global Change. Cambridge,
M.A. Burniaux, J.M., G. Nicoletti, and J.O. Martins (1992), ‘GREEN: A Global Model for
Quantifying the Cost of Policies to Curb CO2 Emissions’, OECD Economic Studies, no.19.
Paris.
Ghosh, Prodipto (1990). “Simulating Greenhouse Gases Emissions due to Energy Use by a
Computable General equilibrium Model of a National Economy”: Ph.D dissertation research,
Carnegie-Mellon University. Published by UMI, Ann Arbor, MI. Order No. DA9107559.
Robinson, Sherman et al (1999), ‘From Stylized to Applied Models : Building Multisector
CGE Models for Policy Analysis’, North American Journal of Economics and Finance, vol. 10,
no.2, 5-38. TERI (2006), National energy Map for India: Technology Vision 2030. The Energy
and Resources Institute (TERI), New Delhi.
Big Sky Carbon Sequestration Partnership and Brunner Monde Report (U.K) Durban 2010 FIFA World Cup Durban Carbon Footprint, Final Report. Future Work
Durban.
Following websites were referred while preparing this project:
http://www.marketwire.com/press-release/Greengold-Ray-Energies-Inc-923021.html
(Accessed on May 21st 2011)
http://www.global-greenhouse-warming.com/ISO-14064.html (Accessed on May 13th
2011)
http://www.climatevision.gov/sectors/cement/pdfs/44182.pdf (Accessed on May 12th
2011)
http://www.energyrating.gov.au/library/details200606-greening.htmt (Accessed on 2nd
May 2011)