project report selection of stocks using technical
TRANSCRIPT
1
Project report
On
Selection of Stocks using Technical Analysis Method
2
United International University
Project Report
On
SELECTION OF STOCKS USING TECHNICAL ANALYSIS METHOD
Submitted to:
Mosabbir Uddin Ahmad
Assistant Professor
School of Business and Economics
United International University
Submitted by:
Shamima Nasrin Usha
ID: 111 141 029
Course Title: Project
Corse Code: INT 4399
Program: BBA (Major in Finance)
Date of Submission:
18.7.2018
3
Letter of Transmittal
17 June, 2018 Mosabbir Uddin Ahmad Assistant Professor School of Business and Economics United International University
Subject: Submission of Project report on “Selection of Stocks using Technical Analysis
Method”.
Dear Sir,
With due respect, it is my great pleasure to submit my report on the topic as you have assigned
me to prepare my project paper. The report entitled “Selection of Stocks using Technical
Analysis Method”, which is a partial requirement for the completion of my BBA degree. Now I
am looking forward for your kind appraisal regarding this project report.
You would be very glad to hear that I have given my best effort to prepare this report. For
preparing this report, I have studied a lot of research papers, articles, blogs, stock trading
related web sites and gathered information on “Selection of Stocks using Technical Analysis
Method” in Bangladesh perspective. I have given my best efforts to prepare this project report
enough informative and practical which will be so interesting to a beginner in the stock market.
If there is any type of mistake or information gap is in this report then you kindly consider it as
my fault.
I have given my best efforts to avoid my lacking’s and weaknesses and I hope, my project report
will make you satisfy and I will be highly encouraged if you kindly accept this report. Your kind
advice will encourage me to do further research in future.
Thanking you.
Sincerely yours,
…………………………………….
Shamima Nasrin Usha
ID: 111 141 029
BBA (Finance)
United International University

4
Acknowledgement
Generally the success of a research report depends on the contribution of many people. Firstly,
I would like to reveal my gratefulness to the Almighty Allah to enabling me to complete this
repost on “Selection of Stocks using Technical Analysis Method”.
I take this opportunity to disclose my insightful thankfulness and deepest honors to my guide
Mosabbir Uddin Ahmad, (Assistant Professor, United International University) for his special
guideline, monitoring, constant encourage, and thoughtful advice throughout the course of this
project report. Without his guidance and cooperation it would be very hard for me to submit
this report.
I am thankful for the other members who helped me to complete this project report by
providing their valuable information in their respective fields. This report is not free from
limitations and errors. There might still be some minor typing mistakes, despite my utmost
care. I do apologize for this.
5
Executive Summary
Applied knowledge is so important for the hypothetical aptitude. Bearing this in mind, the topic
of this report is selected to acquire the real and practical knowledge. I gratefully admit my
indebt concepts, various data and information providers. I have selected the topic, “Selection of
Stocks using Technical Analysis Method”. In this report I have given a brief overview of Capital
market, the methods used in capital market, how Technical Analysis method works to select a
stock in Bangladeshi Capital market. Importance, effectiveness, usefulness, advantages,
disadvantages and challenges of Technical Analysis is discussed here. Here, I also have given a
brief overview of Security and Exchange Commission of Bangladesh. Here, I also discussed
about the indicators by which the method Technical Analysis works and help the investors to
select a stock trend, predicting the future price. The main objective of this report is to find out
the effective ways of technical analysis by which a trader can predict the stock price in this so
competitive stock market and can minimize their risk and can earn more profit.
I have accumulated all the collected data and information for analyzing this report. I have
gathered all the information from some primary and some secondary sources. After gathering
all information, there are some observations of my report given below:
Technical Analysis method was introduced into Capital Market not to control the price
but to predict the price movements.
This method significantly reduces the risk exposure in selecting stocks and thus
possibility of losses.
SEC and the related authorities should take initiative for facilitating investor learning this
Method along with fundamental analysis making stock selecting procedure more
accurately.
6
Contents
1. Introductions:……………………………………………………………………………………………………………11
1.1. Objective……………………………………………………………………………………………………….11
1.2. Methodology…………………………………………………………………………………………………11
1.3. Scope…………………………………………………………………………………………………………….12
1.4. Limitations…………………………………………………………………………………………………....12
2. Structure of Capital Market of Bangladesh………………………………………………………….…….14
3. Technical Analysis Method:……………………………………………………………………………………….17
3.1. Abstract……………………………………………………………………………………..………………….17
3.2. Introduction…………………………………………………………………………………………………..17
3.2.1. Definition of Technical Analysis…………………………………………..……………17
3.2.2. How Technical Analysis works……………………………………………………………18
3.2.3. Why Technical Analysis matters………………………………………………….…….18
3.3. Literature Review………………………………………………………………………………………….19
3.4. Methodology………………………………………………………………………….………………….…19
3.5. Technical VS Fundamental Analysis:…………………………………………………………..…20
3.5.1. Investors’ decision making tools………………………………………….……………20
3.5.2. Flowchart of Technical & Fundamental Analysis……………………..………..21
3.5.3. Fundamental Analysis:……………………………………………………………………...22
3.5.3.1. Earnings per share……………………………………………………….………….22
3.5.3.2. P/E Ratio…………………………………………………………………………….…..22
3.5.3.3. Return on Asset……………………………………………………………………...23
3.5.3.4. Return on Equity……………………………………………………………………..23
3.5.3.5. Debt/Equity Ratio…………………………………………………………………….23
3.5.3.6. Market Capitalization………………………………………………………………23
3.5.3.7. Price/Sales Ratio……………………………………………………………………..24
3.5.3.8. Price/Book Ratio……………………………………………………………………..24
7
3.5.4. Technical Analysis:………………………………………………………………………..24
3.5.4.1. Simple Moving Average………………………………………..…………….25
3.5.4.2. Exponential Moving Average……………………………..……………….25
3.5.4.3. Relative Strength Index…………………………….………………………..25
3.5.4.4. Moving Average Convergence Divergence………………..……….26
3.5.4.5. On balance volume……………………………………………..……………..26
3.6. Assumptions of Technical Analysis:……………………………………………………………27
3.6.1. Capital Market discounts everything……………………………………….…..27
3.6.2. Stock prices move in trends………………………………………………….……..28
3.6.3. History repeats itself……………………………………………………………………28
3.7. Advantages of Technical Analysis:………………………………………………….…………29
3.7.1. Trend Analysis……………………………………………………………………………..29
3.7.2. Prices move in trends…………………………………………………………………..30
3.7.3. Provide all current information……………………………………………………31
3.7.4. Entry/ Exit Point…………………………………………………………………………..32
3.7.5. Any time frame or market……………………………………………………………33
3.7.6. Provides entry signals…………………………………………………………………..33
3.7.7. Quick and less expensive………………………………………………………………33
3.7.8. History repeats…………………………………………………………………………….33
3.8. Challenges of Technical Analysis:……………………………………………………………..34
3.8.1. Challenges to Technical Analysis assumptions…………..………………..34
3.8.2. Challenges to technical trading rules……………………..……………………34
3.9. Other market indicators:………………………………………………..………………………..34
3.9.1. Dow Theory…………………………………………………..……………………………34
3.9.2. Bullish Market………………………………………………..…………………………..36
3.9.3. Bearish Market………………………………………………..………………………...36
3.10. Contrary opinion Theory in Technical Analysis…………..…………………………...37
3.10.1. Contrary Opinion………………………………………………….…………………….37

8
3.10.2. The basic principle of Contrary theory……………………………………….37
3.11. Effectiveness of Technical Analysis in Stock Market…………………..…………..38
3.12. Limitations of Technical Analysis…………………………………………………………….38
4. Basic principles of Technical Analysis:…………………………………………………………………41
4.1. Oscillators……………………………………………………………………………………………….41
4.2. Moving average………………………………………………………………………………………41
4.3. Support & Resistance lines………………………………………………………………………41
4.4. Simple trading line…………………………………………………………………………………..41
4.5. Keeping simple………………………………………………………………………………………..41
5. Price Charts:……………………………………………………………………………………………………….43
5.1. Line Chart……………………………………………………………………………………………….43
5.2. Bar Chart…………………………………………………………………………………………………44
5.3. Candlestick Chart…………………………………………………………………………………….45
5.4. Point and figure Chart……………………………………………………………………………..46
6. Chart Patterns:…………………………………………………………………………………………………….49
6.1. Support and Resistance…………………………………………………………………………….49
6.2. Continuation patterns……………………………………………………………………………….50
6.3. Mathematical Indicators…………………………………………………………………………...51
7. Indicators of Technical Analysis used in DSE:…………………………………………………………53
7.1. History of DSE…………………………………………………………………………………………….53
7.2. Formation of legal control………………………………………………………………………….53
7.3. Functions of DSE…………………………………………………………………………………………53
7.4. 4 main Technical Analysis indicators used by DSE:………………………………………53
7.4.1. MACD…………………………………………………………………………………………....54
7.4.2. RSI………………………………………………………………………………………………….54
7.4.3. MA………………………………………………………………………………………………….54
9
7.4.4. EMA…………………………………………………………………………………………………55
8. Recommendation and conclusion:…………………………………………………………………………….57
8.1. Overview of 10 different stocks analysis based on Technical analysis…………....57
8.2. Stock selection and preparing Portfolio along with outcome observation……...63
8.3. Earnings from Technical Analysis method VS real earnings……………………………..64
Conclusion………………………………………………………………………………………………………….…64
9. References………………………………………………………………………………………………………………….65

10
CHAPTER ONE
Introduction
11
1.1. Objective
Main focusing objective of this report is to find out the effectiveness and the usefulness
of Technical Analysis in Stock market.
There are some specific of this project report. They are,
Find out the overall scenario of the stock market of Bangladesh.
To show the importance of using Technical Analysis method for stock selection
Build awareness the investors about their investment
Make the investors educate, interested and make the market less risky for the
trades.
1.2. Methodology
This report has been prepared by the sources that I have collected from various
primary and secondary sources. The primary and the secondary sources are given
below:
Primary Sources:
Having a conversation with the SEC and the SEC professionals
Watching some documentation of stock trending on YouTube
Discussion with the Supervisor teacher
Group discussions with the classmates
Having a discussion with some real investors

12
Secondary Sources:
Related research papers
Topic related books
Various journals and articles
Various Stock market related websites
Newspaper and stock market related blogs
1.3. Scope
There are many scopes to study on Selection of Stocks using Technical Analysis
Method. The contribution of Security and Exchange commission, overall market
economic condition, growth of the economy, involvement of the investors in the
share market, etc. But in this report I have tried to find out the effectiveness,
usefulness and the rationality of using Technical analysis for predicting the stock
prices in the competitive share market. By this study one can get a clear concept
about the safe investing process through the Technical Analysis.
1.4. Limitations
Though I have given my best efforts to make this project paper more informative and
error free, but still there are some limitations.
This is a theory based descriptive report which consumes a lot of time.
More fund is needed to carry out this study.
Related information unavailability and accessibility.

13
CHAPTER TWO
Structure of capital market of Bangladesh
14
Capital Market:
The market where long term debt or equity backed securities are traded is called capital market
as well as called financial market. With capital market money is provided for a longer period
and that must be more than one year. The investor of capital market always makes long term
investment. In 1954 capital market starts its journey in Bangladesh through two segments those
are “Dhaka Stock Exchange” and “Chittagong Stock Exchange”. The securities market permits
sound listed companies to increase surplus capital rapidly. Vibrant and liquid securities market
lead to an upward sloping in savings through attractive offering and rewarding in terms of
higher yield.
Every capital market has to segment primary and secondary market. In the primary stock
market newly traded stocks are traded and in secondary market existing securities are traded.
Investment bankers are specialized in trading new securities in primary market. Equity markets,
bond markets and derivative markets are part of secondary market. It is a very encouraging
thing to see the Bangladeshi capital market is growing though at a slow motion and still at an
emerging stage. Later on the bubble and burst of the year 1996 and 2010, the stock market has
touched a more responsive, importance and consciousness which have guided to whatever
structure we have at present. This flow of knowledge for market further upgraded the
awareness and knowledge level of investors as well as traders.
Structure of Capital Market of Bangladesh
The capital market has two sections. They are,
Securities segments
Non securities segments
A securities segment is alienated into the securities markets for
The Primary issues
The secondary issues.
15
Securities segment:
The process a firm can distribute its securities in the primary market through the public offering
and after the securities are traded in the secondary market. Stock, bonds, preference shares,
debentures, treasury bonds, etc. are the principle instruments. There are two group of
securities segment in Bangladesh. They are:
1) Stock Exchange
2) Investment Corporation of Bangladesh (ICB)
Non Securities segment:
The non-securities section of the capital market provides long term loans both in local and
foreign currencies. This segment also covers merchant banking. The followings are the players
in this field:
1) Development Finance Institutions
2) Commercial & Specialized Banks.

16
CHAPTER THREE
Technical analysis Method

17
3.1. Abstract:
The most challenging thing for a stock investment manager facing is taking the right buying and
selling decision in the stock selection process. In the stock selection process, the investment
manager is competing with a huge number of competitors along with the competing
investments with a fixed capital. The goal of this selection process is to distribute all available
amount of capital across a waned sunset of the competitors competing investments with the
target of making more return. In the field of stock market the investors or traders basically
relies two most main frameworks or methods to guide their selection process, those methods
are namely Technical analysis and the other is Fundamental Analysis. This project paper is
basically focused on Technical analysis along with the use of technical indicators, price charts,
chart patterns of Technical Analysis and the implications on a neutral network that supports the
process of stock selection of Dhaka Security Exchange Commission. TA method can be
considered as the method of using the historical data, statistics, past prices to establish
“specific rules for buying and selling securities with the objective of maximizing profits and
minimizing risk of loss”.
3.2. Introduction:
3.2.1. Definition:
“Technical analysis is a trading tool employed to evaluate securities and identify trading
opportunities by analyzing statistics gathered from trading activity, such as price movement
and volume”. Technical analysts focus on price charts on price trends and various analytical
tools to measure a security’s strengths and weaknesses. The target of technical analysts is to
predict the future stock market behavior using past price performance where they like to use

18
behavioral economics and quantitative analysis. Mostly used technical analysis forms are the
price chart patterns and the technical indicators.
3.2.2. How technical analysis works:
To perform the technical analysis method, investors or the traders starts with technical analysis
charts that show the price, time period and trading volume history of a specific security or
index. As well as host of other statistical measures such as exponential moving average, simple
moving average, maximums and minimums, and percentage changes. Example- Dow Jones
Industrial Average.
In technical analysis charts are used to find out the price moving tendency and their changes in
these trends. There are some price trends and patterns, namely, rectangles, triangles, Bollinger
bands, inverted heads and shoulders, candlesticks, the MACD histogram, stochastics, and so
forth. For interpreting the trading data indicators and oscillators are also used.
3.2.3. Why technical analysis matters:
Future behavior of a stock can be predicted by using the past market trends of an individual
security, considering this belief the main concept of technical analysis is built.
If a trader can interpret a chart’s “message” and predict a stock’s movement correctly, he can
surely make a huge profit. Some particular technical analysis perspectives are argumentative, in
this scenario there is a belief that the securities or stocks and the market moves in trends which
can play for a longer time period and there is an argument that the market action can find out
the shifts in demand and supply relationships.
Most of the traders or investors tend to either technical or fundamental investors. Along with
this so many investors believe that the combine result of fundamental and technical analysis
may be the most effective way to determine the Exit and Entry points and taking the best
buying and selling decisions. And there are some people who believe that the rules, techniques,
tools and methods of technical analysis can lead them to become self-fulfilling and they find it
more important than any others methods. They still believe this technical analysis method is
the most effective way to know the stock market for individual investor.

19
3.3. Literature review:
Technical analysis method is used to find the predictable price patterns in stock prices. All over
the world the technical analysis method is the most spreading method for the analysts of stock
market for the understanding and forecasting the price and overall condition of a security or
stock. “Modern technical analysis dates from the work of Charles Dow, who in 1884 drew up an
average of the daily closing prices of 11 important stocks. Between 1900 and 1902, Dow wrote
a series of articles in the Wall Street Journal documenting stock price patterns and movements
he observed in the average. These articles were the first to describe systematic phenomena in
the stock markets”. Now in the present days, the technical analysis is composed with some
techniques which is classified in three primary categories, they are:
Pattern matching chart
Indicators and oscillators
Esoteric ways
3.4. Methodology:
The main purpose of this project report paper is to analyze the securities traded on the Dhaka
Security Exchange commission using the most popular technical tools. Namely, Moving
Average, for creating the trading system with higher efficiency rate than the simple buy and
hold strategy, and MACD. MACD is used to make the difference between the “fast” EMA and
the “slow” EMA in a series. These tools are used to identify the price trends and the support
and resistance level of a particular stocks price. And Relative Strength Index, by which it can be
determined either the stock is overbought or oversold. And often shows chart patterns.
20
3.5. Technical VS Fundamental Analysis
In the equity market, the process of stock selection for the buying decision is a complex task as there are many stocks available in the market for purchase. The two main decision making tools are used widely in this process are fundamental and technical analysis. Here, history of each of these tools and also the main components involved in each decision making tool is discussed. Fundamental analysis is involved in economy analysis, industry analysis and company analysis of the stock aimed for purchase. Technical analysis involves the place of several technical indicators like MACD, OBV, Moving average, RSI, EMA, etc. on the past stock market prices. The advantages and disadvantages of each of the tools are also discussed below.
3.5.1. Investors’ decision making tools:
The most commonly used analytical methods as decision making tools of stock selection are the fundamental and technical analysis all over the world. Fundamental analysts uses the information which is publicly available about the stock to analyze the stock in three forms with respect to the economy, its industry and the company. On the other hand Technical analysis places different types of technical indicators on the available past history of the stock prices, statistical analysis in order to make a right decision. The flowchart below explains the two tools of the decision making process in the stock market very easily and systematically.
21
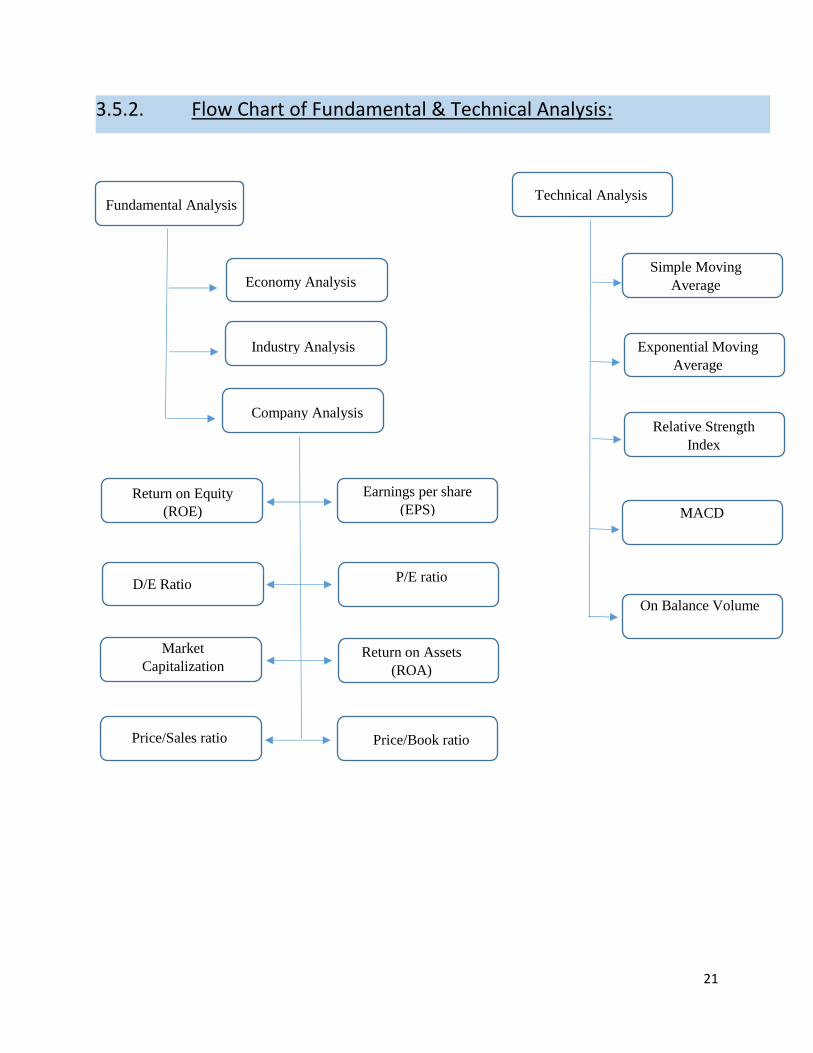
3.5.2. Flow Chart of Fundamental & Technical Analysis:
Economy Analysis
Industry Analysis
Company Analysis
Return on Equity
(ROE)
Earnings per share
(EPS)
D/E Ratio
Fundamental Analysis
P/E ratio
Market
Capitalization Return on Assets
(ROA)
Price/Sales ratio Price/Book ratio
Technical Analysis
Simple Moving
Average
Exponential Moving
Average
Relative Strength
Index
MACD
On Balance Volume
22
3.5.3. Fundamental analysis:
The starting of fundamental analysis is in the decade of 1930 when the Security and Exchange
Commission was started in according to the Security Exchange Act, 1934. This Security and
Exchange commission had the power to regulate the stock market and any kind of
manipulation, fraud and illegal issues which can drive the market in the wrong way was
severely penalized. The legal control was so strict. In the year 1934, the book Security Analysis
was published by Graham and Dodd at the Columbia University. In this book Graham and Dodd
emphasized that with a complete analysis of a certain company, good returns can be earned
and the worth of the security can be found. With this realization Graham and Dodd give a
proposal to owning socks for a long term time period basis. The fundamental analysis is the
combination of the economy analysis, industry analysis and company analysis. In fundamental
analysis the stock price is determined with the information which is publicly accessible and
available after observing the industry scenario and evaluating the company’s overall economic
conditions. The economic indicators such as inflation, interest rate, purchasing power, growth
rate, GDP, etc. are used for economy analysis.
The basic assumption behind analyzing the economy before buying a company’s stock was that if the economy was growing and powerful and the company would also do well and in the same way the share prices would increase. Here some of the important ratios calculated during company analysis which include:
3.5.3.1. Earnings per share (EPS): The formula of EPS is, EPS= The amount getting from subtracting dividends on preferred stock from net income is divided by no of outstanding shares. This ratio shows how much the value of the share had gone up or down over a given period of time. “Earnings per share serves as an indicator of a company's profitability. The EPS is an important fundamental used in valuing a company because it breaks down a firm's profits on a per share basis. This is especially important as the number of shares outstanding could change, and the total earnings of a company might not be a real measure of profitability for investors”.
3.5.3.2. P/E ratio: The formula of P/E s, P/E= Market price per share / EPS. This ratio showed how closely the stock price followed the EPS. If the price earnings ratio was high it
23
implied that the market participants were expecting the stock price to continue to increase. When the P/E ratio began to decline it implied that the stock prices would soon fall.
3.5.3.3. Return on asset (ROA): The formula of ROA is, ROA= (Net income + Interest expense) / Total assets. This ratio shows how well the company was using its tangible assets. “ROA is an indicator of how profitable a company is relative to its total assets. It gives a manager, investor or analyst an idea as to how efficient a company’s management is at using it its assets to generate earnings”. Higher ROA showed that the assets are efficiently used and the company is robust. A declining ROA showed that the company was not earning to its capacity and that the stock prices would eventually decline.
3.5.3.4. ROE:
Formula of ROE is, ROE= Net income divided by Shareholder’s equity. “This ratio shows that how well the shareholders’ money was utilized and how profitably that money was invested. The ROE is useful for comparing the profitability of a company to that of other firms in the same industry. It illustrates who effective the company is at turning the cash put into the business into greater gains and growth for the company and investors. The higher the ROE, the more efficient the company’s operations are making use of those funds”. A low ROE indicated that the shareholders’ money was not properly utilized.
3.5.3.5. Debt/Equity ratio: The formula of Debt / Equity ratio is, D/E= Total liability / Shareholder’s equity. “The D/E ratio indicates how much debt a company is using to finance its assets relative to the value of shareholders’ equity”. This ratio is a leverage measure in terms of the available capital vs the capital employed. “A high D/E ratio generally means that a company has been aggressive in financing its growth with debt. Aggressive leveraging practices are often associated with high levels of risk”. A low level of this ratio indicated that the credit available was not fully utilized.
3.5.3.6. Market capitalization:
The formula of market capitalization is, MC= No of shares* price per share. This is the measure of shares are traded in the market. Based on market capitalization stocks are categorized as, small cap, medium cap, large cap, and mega cap. Ranges of small-cap is $300million to $2bilion, medium-cup is $2billion to $10billion, large-cap is $10billion to $200bilion, and mega-cap is $200billion and greater.
24
3.5.3.7. Price/Sales ratio: The formula of P/S ratio is, P/S= Share price / Revenue over a 12 month time period. "The price-to-sales ratio is an indicator of the value placed on each dollar of a company’s sales or revenue.
3.5.3.8. Price/Book ratio: The formula of P/B is, P/B= Stock price / (Total asset – Intangible assets and liabilities). This ratio compared the share price with the stock’s intrinsic value and indicates overvaluation and undervaluation of the stock. The lower P/B ratio indicates the undervalued stock.
Fundamental analysis assumed that the current share price and the future share price depended on the intrinsic value of the share and the expected return. And the predicted price and performance of the share is determined by analyzing the company’s currently available public and accessible information.
3.5.4. Technical analysis: The founder of the Wall Street Journal, Charles H. Dow was regarded as the Father of Technical Analysis. Charles Dow started a newsletter which was called Customers’ Afternoon Letter in the decade of 1870 when the stock market was not a profitable, attractive and popular option for investment where the information about the security, stock and equity market was so limited. The method of technical analysis by Dow opened up the exclusive idea that if the traders or the investors could know about the stocks how they were performing in the current stock market, then the investor can predict the growth of the economy. In technical analysis the concept of Dow Theory is the cornerstone. Employing some technical tools and based on the past patterns of stock prices the technical analysts predict the future changes in the stock prices. In Technical Analysis the analysts and the investor using technical indicators could take decision if the stock was uptrend or downtrend. “The main theoretical underpinning of technical analysis was that at any given point in time, the stock prices reflected all the known factors influencing the demand and supply for any given market”. In the method of technical analysis a detailed analysis of the monthly, weekly, daily, hourly, minute basis price fluctuations which was done to predict the changes in security prices. Technical strategies placed mathematical calculations which were designed mainly to observe the activity of stock prices. Based on the buy and sell signal generated by the charts, computers
25
and manual calculations, stock decisions were taken. Some of the technical indicators employed included on balance volume (OBV), MA, MACD and RSI. The important technical indicators employed during technical analysis which include:
3.5.4.1. Simple moving average: “The technical indicator is used to predict the trends in the stock prices and the timing of the reversal. A simple moving average is an arithmetic moving average calculated by adding the closing price of the security for a month of time periods and then dividing this total by the number of time periods. A simple moving average line is projected over the price chart and when the simple moving average line went below the share price line it was an indicator that the share price would rise. A simple moving average smooths out volatility, and makes it easier to view the price trend of a security”. Pointing up simple moving average indicates the increasing price and pointing down indicates the decreasing price of a security. The longer moving average time period makes the simple moving average smoother and this smoothness increases with the length of time period. And the shorter moving average causes the volatile simple moving average but the reading is so close to source data.
3.5.4.2. Exponential moving average: “An exponential moving average is a type of moving average that is similar to a simple moving average, except that more weight is given to the latest data. It’s also known as the exponentially weighted moving average. This type of moving average reacts faster to recent price changes that a simple moving average”. This technical indicator is more powerful than the simple moving average. Exponential moving averages are mostly used joining the indicators with other indicators to make sure that the significant market moves and measures their market validity. In the stock market for the trader who trades intraday and the fast moving market, for them the Exponential Moving Average method is more applicable to take the right decision for choosing a stock.
3.5.4.3. Relative strength index: “The relative strength index is a momentum indicator developed by noted technical analyst Welles Wilder that compares the magnitude of recent gains and losses over a specific time period to measure speed and change the price movements of a security. This index is calculated using the formula, 100 – (100 / (1 + (Average of down closes for the day)))”. This calculated value of RSI would lie in the range between 0 and 100. If the value of RSI is large like 70 or above it indicates that the stock is overbought and if the value of the RSI is small like 30 or below it indicates that the stock is oversold.
26
3.5.4.4. Moving average convergence/ divergence: “This technical tool is a trend following momentum indicator that shows the relationship between two moving averages of price. MACD is a trading indicator used in technical analysis of stock prices, created by Gerald Appel in the late 1970s. It is supposed to reveal changes in the strength, direction, momentum, and duration of a trend in stock price. The MACD line is determined by subtracting the 26- day exponential average from the 12- day exponential moving average. The second line called the signal line is the 9- day exponential average line”. If the MACD line went above the signal line it means that it indicates an upward trend and when the MACD line went below the signal line it indicates a downward trend in the stock market while choosing a security. Moving average convergence divergence uses three different types of methods to be interpreted: 1) Crossovers 2) Divergence 3) Dramatic Rise.
3.5.4.5. On balance volume: “On balance volume is a momentum indicator that uses volume flow to predict changes in stock price. It is believed that, when volume increases sharply without a significant change in the stock’s price, the price will eventually goes upward, and vice versa. This indicator is calculated by adding the volumes on days the stock prices were rising and subtracting the volumes on days the stock prices were falling”. A downward OBV line indicates that the stock prices may fall and an upward OBV line indicates that stock prices may increase. Three rules are followed to calculate OBV. They are:
a. If the closing price of today is higher than yesterday then the present OBV will be the sum of previous OBV and today’s volume.
b. If the closing price of today is lower than yesterday then present OBV will be the subtraction of today’s volume from previous OBV.
c. if the closing price of today and yesterday is equal then the present OBV will be
equal to previous OBV
Fundamental analysis and technical analysis have always been used as the main decision making tools to transact in the stock market. Some investors use either of the two tools depending on the stock market scenario and some also use both the tools in combination. For a safe trading in the stock market there is no option but using this two methods. If an investor
27
wants to minimize the investment risk and wants to make money by predicting the price of the stock then the investor must go through this method.
3.6. Assumptions of Technical Analysis:
“Technical analysis is a method of evaluating securities that involves a statistical analysis of market activity, such as price and volume. Technical analysts do not attempt to measure a security’s intrinsic value, but they use charts and other tools to identify price patterns that can be used as a basis for investment and buying decisions”.
There are various forms of technical analysis, some are depends on the price chart patterns, some use indicators and oscillators, and combination of techniques are used by the investor mostly.
Technical analysis is formed based on some core assumptions by observing the condition where the stock market runs. These assumptions are the integral as well as are the central of technical analysis concept. The three basic assumptions of technical analysis:
I. The security market discounts everything. II. Stock prices move in trends.
III. History repeats itself.
3.6.1. The Security Market discounts everything: This first assumption of technical analysis seeks to incorporate all the fundamental, political, macro and micro economic data as well as the risk component of a stock into the current market price. Many stock market experts criticize technical analysis because this analysis only considers price movements and chart pattern and ignores the fundamental factors like the company’s overall conditions and the publicly available

28
information. The counter argument is based on the currently efficient market hypothesis, which states that a stock’s price already reflects everything that has or could affect a company – including the fundamental factors. Technical analysts believe that everything from a company’s fundamentals to broad market factors to market psychology are already priced into the stock. This removes the need to consider the factors separately before making an investment decision. The only thing remaining is the analysis of price movements, which technical analysts view as the product of supply and demand for a particular stock in the market.
3.6.2. Stock prices move in trends: Prices usually occur in trends, though some technical analysis theorists argue that prices are completed randomly. Randomness of price is specifically related to the efficient market hypothesis. This theory is based on the fact that markets are “efficient” and information dissemination occurs promptly across the market. The more efficient a market becomes, the faster information is dispersed to the market and as a consequence, the faster price changes to reflect this information. Technical analysts believe that prices move in short-, medium-, and long-term trend. In other words, a stock price is more likely to continue a past trend than move erratically. Most technical trading strategies are based on this assumption.
3.6.3. History repeats itself: The belief of technical analysts is, the history of the stock market repeats itself. Studying the history it is found that the set patterns of the market repeat themselves over a longer time period. To understand the market psychology price movement’s repetitive nature is used and based on investors fear or excitement emotions it becomes so predictable. In technical analysis price chart, chart patterns are used to analyze the emotions and follow price movements to understand the trends. Many forms of technical analysis is used more than 100 years still some investor believe because the price movement pattern are often repeats by themselves.

29
3.7. Advantages of Technical Analysis:
There are three types of technical analysis is existing in the market for taking the stock buying and holding decision. Among them the short term investors are interested to use technical analysis as they get the price chart, chart patterns and composition of information of share volume, time period, price trends and past price data statistics here. Here, some advantages of using technical analysis is given below:
3.7.1. Trend analysis: The most effective advantage of technical analysis is, it helps an investor predicting stock price trend of future market. In chart analysis the uptrend, downtrend, and sideways moves are found which makes the prediction easy. Here a Technical Analysis chart of ACI limited is given to understand the trend:
Fig: 4 month TA chart of ACI
This 4 months Technical Analysis chart shows some information about ACI’s current market information and its stock trends also. This analysis starts from the date 12th march 2018. From that day price fell down for next day and after that day price goes up slowly up to 22nd March, and it indicates Uptrend and from 22nd March price started to goes down slowly up to 30th March and it indicates the stocks downtrend and from 1st April price moves up very slowly and from 11th April to 17th April price remains almost same and it indicates sideways. And after that price falls rapidly and indicates the downtrend and keeps sideways for a few time then again indicates the downtrend. From this chart an investor can understand that this is a

30
down trending stock and price is decreasing and he must not select this stock to buy.
3.7.2. Prices move in trends: If the share prices move wildly and very frequently then it becomes hard to make profit and for wild movement occurrence overall price move in trends. This is also an advantage of technical analysis. Trend following methods is the most profitable trending strategy and here the investor can isolate trend along with find opportunities for entering with the right direction which capitalize the direction wise biased price movement. Trends happens on different “degrees”. Say for an example, in a weekly chart there may be an uptrend and short term time frame there may be a downtrend and traders make profit weather it is short term or long term. Using this tool of technical analysis makes the future market more realistic and predictable which can minimize his losses. A chart is given below where different types of trends are marked and there is also a brief description:
Fig: Prices moves in trends
Interpretation: This is a Candlestick chart of DESCO from January 2018 to July 2018. From this chart we will see different types of trend behavior of prices. All the trends are market in this chart. When the prices falls we call it downtrend and the point from where prices starts to increase we called this line uptrend. When the price shows downtrend that’s the high time to buy a share and when the price increases and
31
reach the resistance level then that’s wise to sell the share. The point from where price starts to decrees that point is called swing high and the point where the price starts to increase that point is called swing low. And the resistance level indicates that the prices of DESCO is not increasing than 44tk for the recent time frame on the other way support line indicates that the prices is not decreasing than 41tk for the recent time periods. This trend lines gives a clear idea about the specific share in the market and if an investor select a stock considering these trends he might not make a loss.
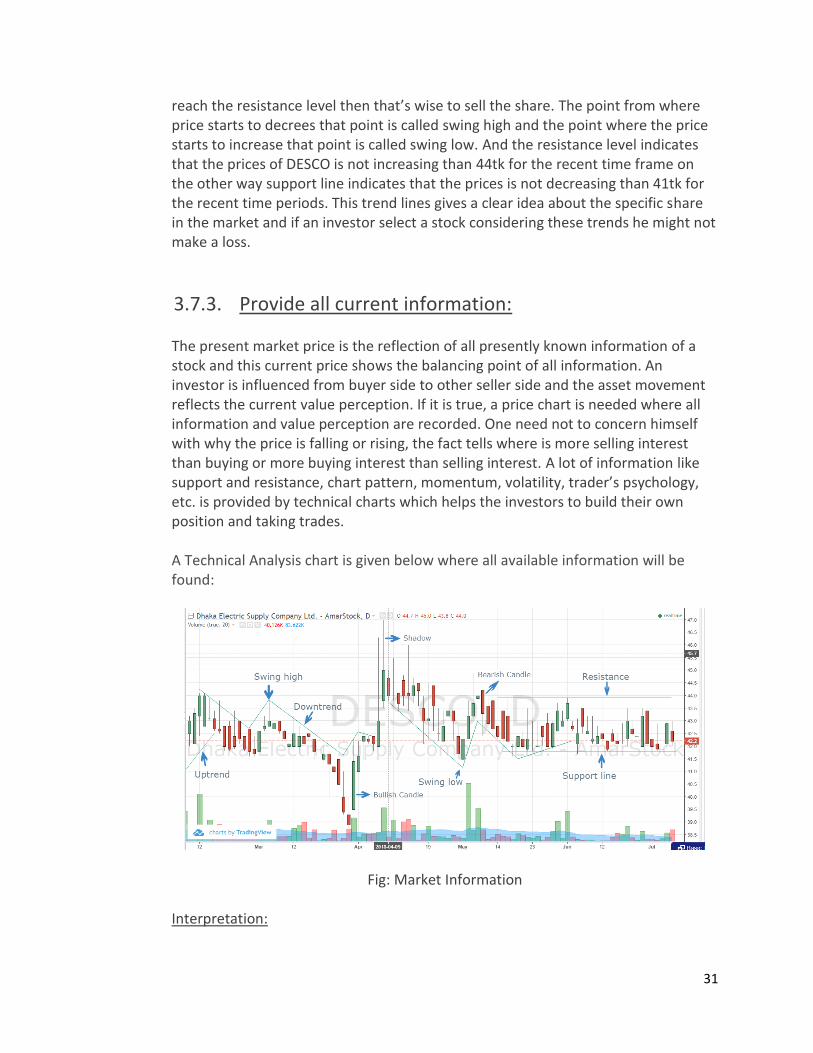
3.7.3. Provide all current information: The present market price is the reflection of all presently known information of a stock and this current price shows the balancing point of all information. An investor is influenced from buyer side to other seller side and the asset movement reflects the current value perception. If it is true, a price chart is needed where all information and value perception are recorded. One need not to concern himself with why the price is falling or rising, the fact tells where is more selling interest than buying or more buying interest than selling interest. A lot of information like support and resistance, chart pattern, momentum, volatility, trader’s psychology, etc. is provided by technical charts which helps the investors to build their own position and taking trades. A Technical Analysis chart is given below where all available information will be found:
Fig: Market Information
Interpretation:
32
This a Candlestick Chart of DESCO. Here analyzing this chart an investor can get all the available information about the DESCO’s market condition. Here the uptrend, downtrend, swing high, swing low, candle shadow, green bullish candle, red bearish candle, support and resistance level all the information is available and here there is two axis, one is y axis which indicates the price line and another is x axis which indicates the time period. If an investor choose any point of this chart can get all the information on that time. This helps an investor to select the stock. By using this chart an investor can get idea about all the stocks available in market.
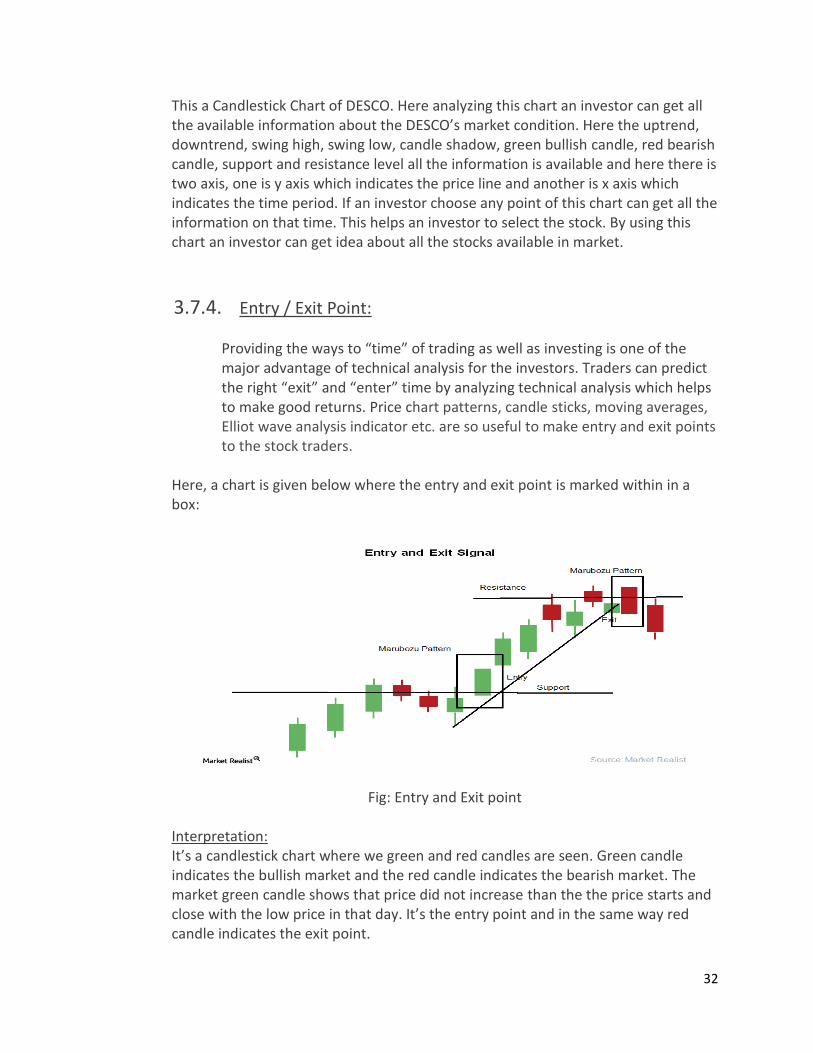
3.7.4. Entry / Exit Point: Providing the ways to “time” of trading as well as investing is one of the major advantage of technical analysis for the investors. Traders can predict the right “exit” and “enter” time by analyzing technical analysis which helps to make good returns. Price chart patterns, candle sticks, moving averages, Elliot wave analysis indicator etc. are so useful to make entry and exit points to the stock traders.
Here, a chart is given below where the entry and exit point is marked within in a box:
Fig: Entry and Exit point
Interpretation: It’s a candlestick chart where we green and red candles are seen. Green candle indicates the bullish market and the red candle indicates the bearish market. The market green candle shows that price did not increase than the the price starts and close with the low price in that day. It’s the entry point and in the same way red candle indicates the exit point.
33
3.7.5. Any time frame: Technical analysis is a large field where one can apply many concepts for multiplying markets, like stocks, forex, future, binary options etc. as well as CFDs, housing even for art prices. Market trading basically is based on human behavior patterns, price chart patterns across the market and it means one need not learn to analyze each and every stock market specifically. In case of little differences between stock analysis and highly leveraged forex market technical analysis knowledge gives better service in all market and in any time period it can be used whether it is daily or weekly basis chart or 60 seconds binary options trade.
3.7.6. Provides entry signals: Early signals and a picture of the investor’s psychology about their doing activities are given by technical analysis. The analysis of price and volume also indicates movement and activities of market makers in the particular related market. Providing entry signals is one of the main advantage of technical analysis when this comes to the trend reversal.
3.7.7. Quick and less expensive: In currency trading market fundamental analysis is more expensive than technical analysis as many company provide charting software for free. In technical analysis 1 min, 5 min, 15 min, 30 min, 1 hour, 4 hour, 1 day, 1 week, 1 month charts give the traders a very quick result. The formation of 1 min, 5 min chart is faster than the daily chart comparatively.
3.7.8. History repeats: Technical analysis is based on uncovering and finding patterns again and again and use them for trading though it doesn’t mean history exactly repeats. Say for example, a very common triangle chart pattern where the general structure always stays similar but every time it may be smaller or bigger than the previous triangle and may have different direction of breaking out. So, history repeats in a similar way but don’t shows the exact replica. As human psychology do not change more, continually rise and fall of stock prices are understood by the analysts as well as the investors fear and greed emotions for all time frame.

34
3.8. Challenges of Technical analysis:
3.8.1. Challenges to technical analysis assumptions: Support of technical analysis in empirical studies and efficient market’s empirical tests and technical analysis rules are unable to generate the excess returns. It is believed by EMH that in the price all the available information are seized where the new information causes price adjustment and the technical relationships are not repeating and prices do not move in trends is shown by EMH.
3.8.2. Challenges to technical trading rules:
The past prices may not repeat again. Patterns may not provide right prediction always. Successful rules and strategies may not provide successes always it also make
losses to the strategy followers. Strategies need a subjective judgement. Subjective strategies and decisions may changes over time because of market’s
volatile nature.
3.9. Others market environment indicators:
3.9.1. Dow Theory: “The Dow Theory is a theory which says the market is in an upward trend if one of its averages advances above a previous important high and is accompanied or followed by a similar advance in the other average”. Dow Theory’s 6 basic concepts are given below:
1. Market has three movements:
35
1. “The "main movement", primary movement or major trend may last from less than a year to several years. It can be bullish or bearish”.
2. “The "medium swing", secondary reaction or intermediate reaction may last from ten days to three months and generally retraces from 33% to 66% of the primary price change since the previous medium swing or start of the main movement”.
3. “The "short swing" or minor movement varies with opinion from hours to a month or more”.
2. The market tends have 3 phases:
Phase 1: “The accumulation phase is a period when investors "in the know" are actively buying and selling stock against the general opinion of the market. The stock price does not change much because these investors are in the minority demanding stock that the market at large is supplying”. Phase 2: “The market catches on to these astute investors and a rapid price change occurs. This occurs when trend followers and other technically oriented investors participate. This phase continues until rampant speculation occurs”. Phase 3: “In this phase the astute investors begin to distribute their holdings to the market”.
3. The stock market discount all news: “Stock prices quickly incorporate new information as soon as it becomes available. Once news is released, stock prices will change to reflect this new information. On this point, Dow Theory agrees with one of the premises of the efficient-market hypothesis”.
4. Stock market averages must confirm each other: “To Dow, a bull market in industrials could not occur unless the railway average rallied as well, usually first. According to this logic, if manufacturers' profits are rising, it follows that they are producing more. If they produce more, then they have to ship more goods to consumers. Hence, if an investor is looking for signs of health in manufacturers, he or she should look at the performance of the companies that ship their output to market, the railroads. The two averages should be moving in the same direction. When the performance of the averages diverge, it is a warning that change is in the air”.
5. Trends are confirmed by volume: “Dow believed that volume confirmed price
trends. When prices move on low volume, there could be many different

36
explanations. An overly aggressive seller could be present for example. But when price movements are accompanied by high volume, Dow believed this represented the "true" market view. If many participants are active in a particular security, and the price moves significantly in one direction, Dow maintained that this was the direction in which the market anticipated continued movement. To him, it was a signal that a trend is developing”.
6. Trends exist until definitive signals prove that they have ended: “Dow believed
that trends existed despite "market noise". Markets might temporarily move in the direction opposite to the trend, but they will soon resume the prior move. The trend should be given the benefit of the doubt during these reversals. Determining whether a reversal is the start of a new trend or a temporary movement in the current trend is not easy. Dow Theorists often disagree in this determination. Technical analysis tools attempt to clarify this but they can be interpreted differently by different investors”.
3.9.2. Bullish market: “A bullish market is a financial market of a group of securities in which prices are rising or are expected to rise. The term "bullish market" is most often used to refer to the stock market but can be applied to anything that is traded, such as bonds, currencies and commodities”.
Characteristics of Bullish market:
1. In the market when GDP is strong with low unemployment and rising corporate profits then in this strong or getting strengthening economy bullishness happens and bullish markets take place.
2. In the bullish market supply and demand fluctuates more because in this market investors wants to buy shares early and taking the advantage of rising prices they want to sell the shares when the price reach the high peak and wants to gain more profits though the higher and lower price level cannot be determined and its nature is temporal.
.
3.9.3. Bearish market: “A bear market is a condition in which securities prices fall and widespread pessimism causes the stock market's downward spiral to be self-sustaining. Investors anticipate losses as pessimism and selling increases”.
37
Bear market is the opposite of bull market and in this market rising prices are expected. But when the share prices falls this indicates the bear market. Causes of a bear market: There is no specific causes of bear market, but according to the market behavior it can be said weak or slowing economy will causes a bear market. Low employment and disposable income, decreasing business profits are sign of a weak market. Interventions of govt. like changing tax rate in federal funds lead a bearish market which drops the confidence of an investor.
3.10. Contrary opinion theory in technical analysis:
Contrary opinion theory is a unique way to predict future price movements by measuring the sentiment of market participants, this opinion allows a trader a deep insight about the markets future behavior and activities. In any trend based trading method this contrary opinion theory can be considered as a useful element.
3.10.1. Contrary opinion: In theory, “contrary opinion is generally listed as an element of technical analysis but in reality, it can be better described as a third technique: Psychological analysis. Contrary opinion theory is a simple concept that states that when all investors expect the market to go up, it will actually go down. Likewise, when everyone believes the market will go down, it will instead go back up”.
Contrary opinion theory determine future price trends by the market participant’s bullishness and bearishness analysis.
3.10.2. The basic principle of contrary opinion theory:
38
“The basic principle of contrary opinion is that when the vast majority of people agree on something, they’re usually wrong. According to contrary opinion theory, a trader should try to find out whether the majority of people in the current market are bullish or bearish, and then do the exact opposite”. To determine the market participant’s bearishness and bullishness in every week financial newsletter are polled. Since many traders follow the advice of these newsletters, this poll is a good indication for what most traders think about the market.
3.11. Effectiveness of TA in stock market: Using past prices and volume relationships price movements are predicted in technical analysis. For the future market this technical analysis strategies are mostly popular because here high leverage and liquidity, low brokerage costs allow quick trading and make profits or losses. The characteristics of security market is weak form of EMH, where the hypothesis states that expected return from technical analysis strategies cannot be larger than that which if from simple buy and hold strategy of equal risk. Although these effectiveness are controversy.
3.12. Limitations of technical analysis:
1. While using several technical indicators it tends to provide compounded signals in some cases if those are used in isolation. In that situation it can be seen that one indicator shows the buy signal on the other hand another indicator shows the sell signal. This scenario can make the traders confused. To overcome this type of issues the stock traders usually use the combination of several indicators, different types of patterns, volume signals, exponential moving averages and single moving averages to determine entry and exit signals of the share. This may be a great limitation as the traders may have taken the hassle of combining so many indicators and other stuffs.
2. In the stock selection process technical analysis is talking about nothing but probability. Sometimes it may happen that a possible entry or exit is determined for a pouch but the

39
signal cannot give guarantee a successful stock trade. This can causes the trade ending with a huge losses though the trading decision was taken through technical analysis. This is a major drawback of the technical analysis.
3. Biases view is also a big limitation of technical analysis. It may happen that two technical analysts have different and opposite views about the same stock even if they use the same technical indicators. Using the same indicator in different methods for the stock analysis could be different from one to another technical analysts. This type of scenario causes a big problem while trading the stocks because it creates confusions among the traders.
4. Sometimes it happens that the technical indicator signals generated and it takes a few times which tend to a lag and within this time a clear signal is created the price action which may be over already. It can create a huge loss to the trades as the fail to trade on time.
5. At this present time people are using technical analysis to minimize their risk while stock selection as more and more people are engaging in technical analysis they are usually ending up their analysis with the similar views. For this reason the value of those analysis is going to the decline. This makes the technical analysis less effective to the traders for their stock selection process and it hampers the whole trading system. It’s a big problem of technical indicators analysis.
6. As all of the people related to stock trading are using this technical analysis and randomly using this hypothesis is casting its reflection over the activities, performance and validity of the technical analysis. It makes the technical analysis less effective to the trades because it cannot generate something exclusive which can make difference or can distinguishing from others.
7. All the time using a single trading policy like technical analysis cannot work or perform in all cases and scenarios as the present stock trading market is tends to be very dynamic. Because of this extremely dynamic characteristics sometimes technical indicators cannot show the reliable results and fail to predict the price of the stock which can make the trading less risky. This is also a major limitations of stock trending.

40
CHAPTER FOUR Basic principles of technical analysis:
41
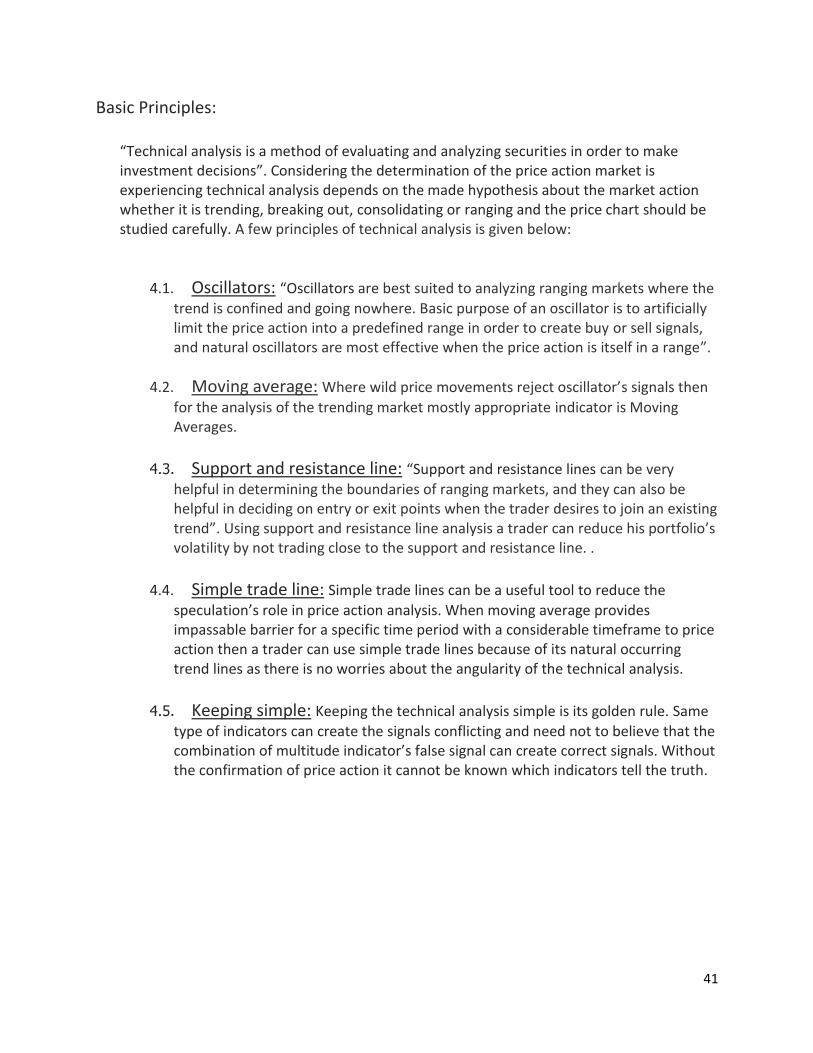
Basic Principles:
“Technical analysis is a method of evaluating and analyzing securities in order to make investment decisions”. Considering the determination of the price action market is experiencing technical analysis depends on the made hypothesis about the market action whether it is trending, breaking out, consolidating or ranging and the price chart should be studied carefully. A few principles of technical analysis is given below:
4.1. Oscillators: “Oscillators are best suited to analyzing ranging markets where the
trend is confined and going nowhere. Basic purpose of an oscillator is to artificially limit the price action into a predefined range in order to create buy or sell signals, and natural oscillators are most effective when the price action is itself in a range”.
4.2. Moving average: Where wild price movements reject oscillator’s signals then
for the analysis of the trending market mostly appropriate indicator is Moving Averages.
4.3. Support and resistance line: “Support and resistance lines can be very
helpful in determining the boundaries of ranging markets, and they can also be helpful in deciding on entry or exit points when the trader desires to join an existing trend”. Using support and resistance line analysis a trader can reduce his portfolio’s volatility by not trading close to the support and resistance line. .
4.4. Simple trade line: Simple trade lines can be a useful tool to reduce the
speculation’s role in price action analysis. When moving average provides impassable barrier for a specific time period with a considerable timeframe to price action then a trader can use simple trade lines because of its natural occurring trend lines as there is no worries about the angularity of the technical analysis.
4.5. Keeping simple: Keeping the technical analysis simple is its golden rule. Same
type of indicators can create the signals conflicting and need not to believe that the combination of multitude indicator’s false signal can create correct signals. Without the confirmation of price action it cannot be known which indicators tell the truth.

42
CHAPTER FIVE Price Charts
43
Price Chart
Technical Analysis’s price chart is a graphical presentation of price action of an asset and a decision making support tool. In technical analysis there are four types of charts are used. They are:
1. Line Chart 2. Bar Chart 3. Candlestick Chart 4. Point and figure Chart
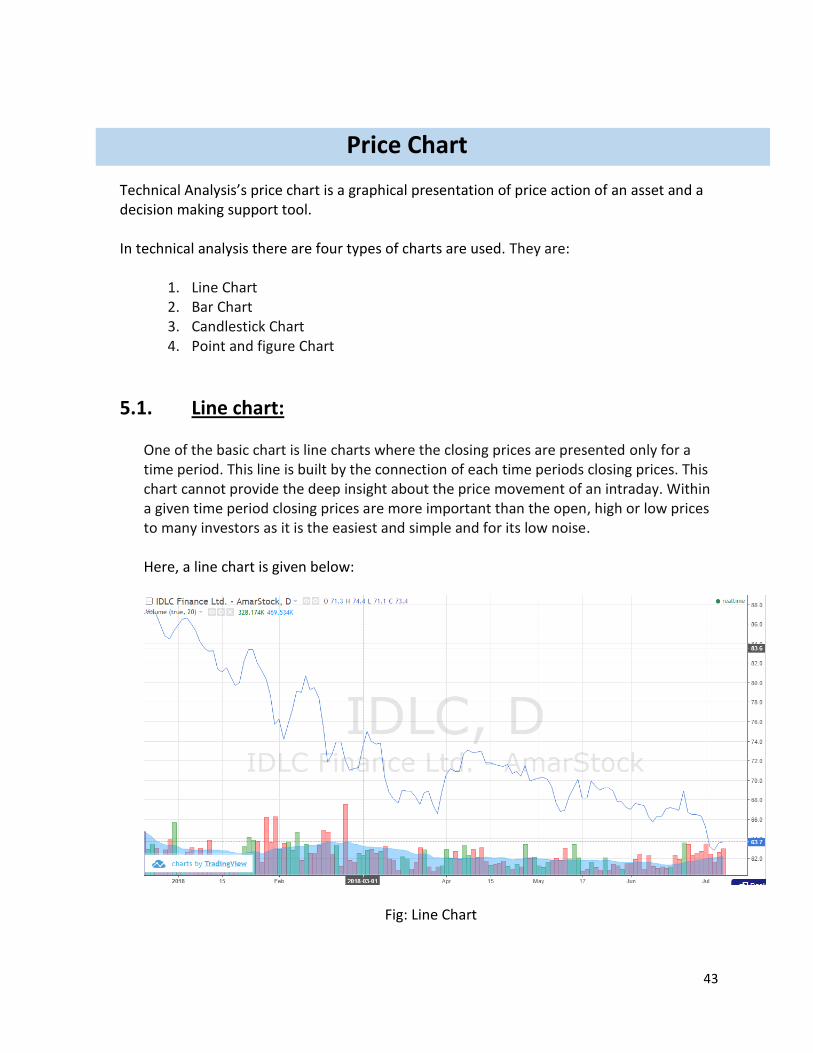
5.1. Line chart: One of the basic chart is line charts where the closing prices are presented only for a time period. This line is built by the connection of each time periods closing prices. This chart cannot provide the deep insight about the price movement of an intraday. Within a given time period closing prices are more important than the open, high or low prices to many investors as it is the easiest and simple and for its low noise.
Here, a line chart is given below:
Fig: Line Chart
44
Interpretation: This a line chart of IDLC finance. This chart is from January 2018 to July 2018. Line chart is the easiest chart where only closing prices are seen. In this chart there are 2 axis, one is X axis which presents the time period and another is Y axis which presents the prices. This line chart does not provide enough insight about the share as well as the market although some long term traders like to use it because it is the easiest to find the closing prices and they believe that this closing price is more important than the high, low or open prices in the time period and they are not interested in intraday movements. Though many long term investors are interested in line charts but this chart is not that much useful.
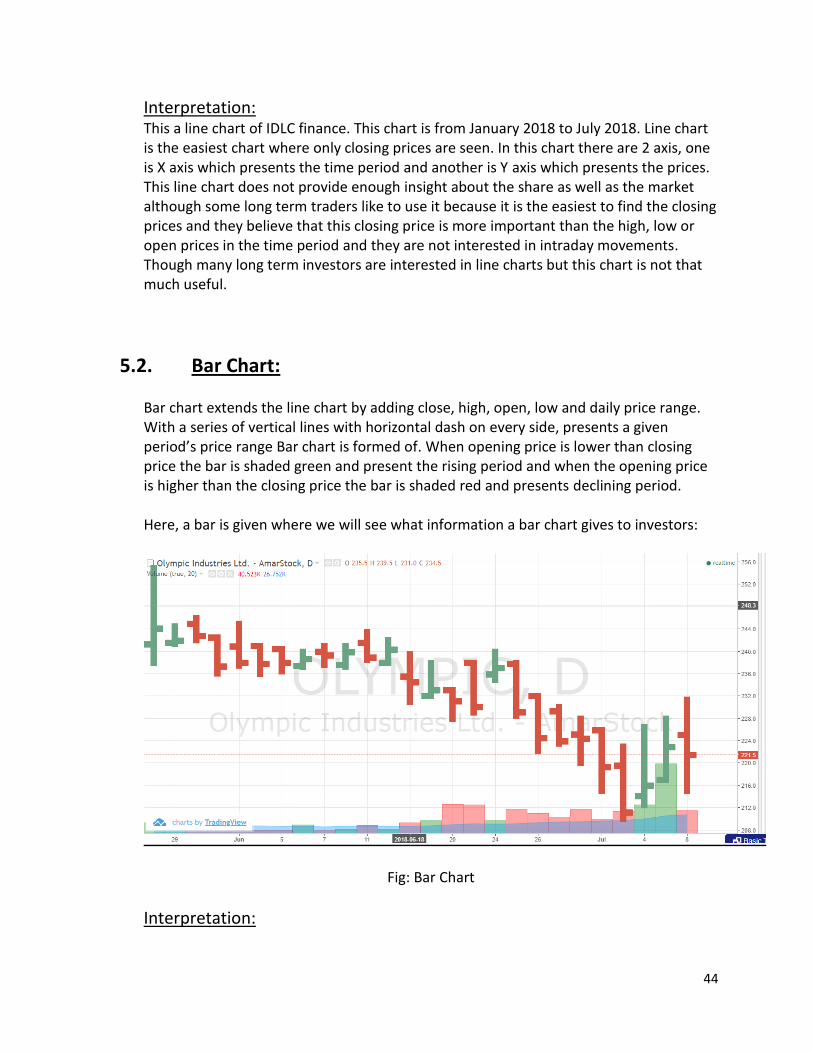
5.2. Bar Chart: Bar chart extends the line chart by adding close, high, open, low and daily price range. With a series of vertical lines with horizontal dash on every side, presents a given period’s price range Bar chart is formed of. When opening price is lower than closing price the bar is shaded green and present the rising period and when the opening price is higher than the closing price the bar is shaded red and presents declining period.
Here, a bar is given where we will see what information a bar chart gives to investors:
Fig: Bar Chart
Interpretation:
45
This is a Bar chart of Olympic. It is a 1 month bar chart and it starts from June 2018 to July 2018. Here the individual bars of this Bar chart gives some information about a specific day’s price movement, such as, bar chart is a vertical line. For a bar line, left tab= open, right tab= close, high point= high, low point= low. Here, the red bars are the bearish and the green bars are the bullish and every bar presents a single day. In this chart, we see in June 3 the opening price was 241.40tk, and in that day in any time price goes up to 245.40tk and for the sell pressure price goes down to 236.80tk in a certain time on that day and for this low price buy pressure increases and finally the closing price was 238tk. Here the difference between the opening and closing price is 3.40tk but in the day the total price movement was for 8.60tk. And in the same way we see a bulling bar for June 24, it presents that at the beginning of the day the opening price was 236tk, after that in any time price goes down to 234.40tk, then for buy pressure the share price goes up to 240.50tk and then the sell pressures increases and finally the share close with the price 237tk. And here the difference between opening and closing price is 1tk but the total price movement was for 6.10tk. By this Bar chart an investor can get the overall price scenario about the stock’s price in a specific day and this price movement helps them to take buying decision.
5.3. Candlestick Chart: Candlestick chart has thin vertical line like Bar chart that shows a price range for a time period having different color candles with tails based on the stock’s higher or lower ending. The body of the candles shows the difference between opening prices and closing prices. Declining periods have red candlestick body and rising periods have green candlestick body. When a day’s opening and closing prices remain same there is no wide candle body is required. A Japanese Candle stick chart is given below from where we will see what information this chart gives to the investors:
46
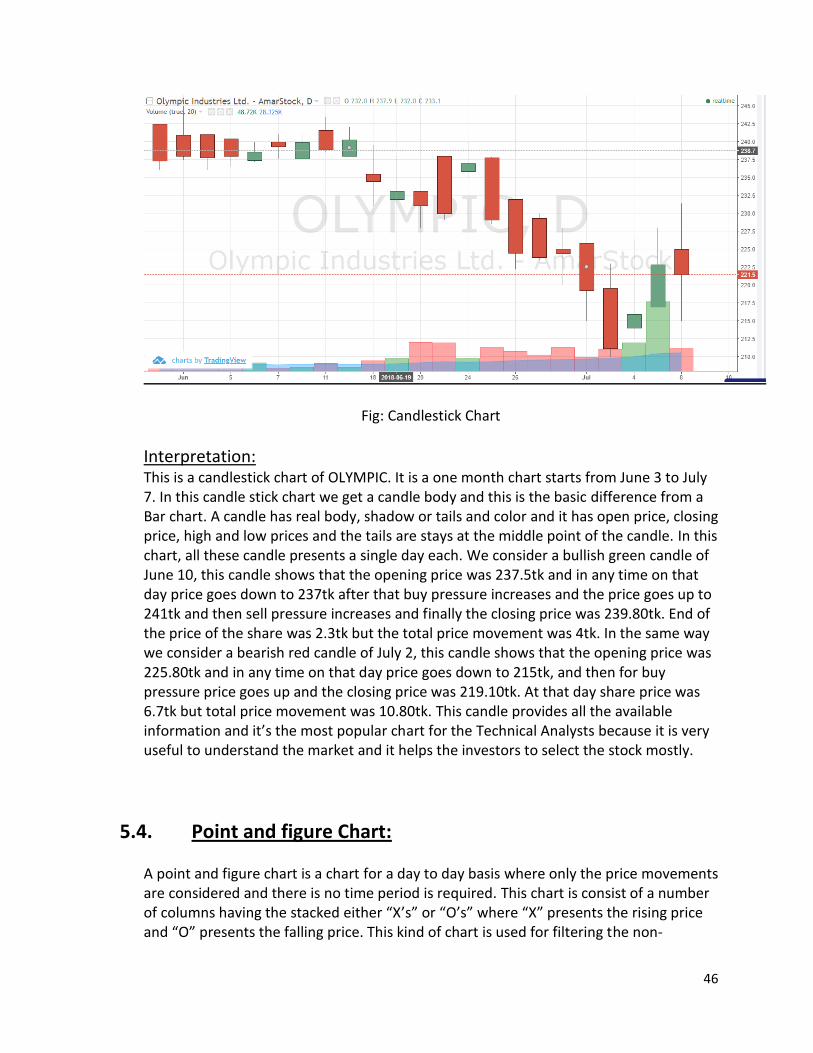
Fig: Candlestick Chart
Interpretation: This is a candlestick chart of OLYMPIC. It is a one month chart starts from June 3 to July 7. In this candle stick chart we get a candle body and this is the basic difference from a Bar chart. A candle has real body, shadow or tails and color and it has open price, closing price, high and low prices and the tails are stays at the middle point of the candle. In this chart, all these candle presents a single day each. We consider a bullish green candle of June 10, this candle shows that the opening price was 237.5tk and in any time on that day price goes down to 237tk after that buy pressure increases and the price goes up to 241tk and then sell pressure increases and finally the closing price was 239.80tk. End of the price of the share was 2.3tk but the total price movement was 4tk. In the same way we consider a bearish red candle of July 2, this candle shows that the opening price was 225.80tk and in any time on that day price goes down to 215tk, and then for buy pressure price goes up and the closing price was 219.10tk. At that day share price was 6.7tk but total price movement was 10.80tk. This candle provides all the available information and it’s the most popular chart for the Technical Analysts because it is very useful to understand the market and it helps the investors to select the stock mostly.
5.4. Point and figure Chart: A point and figure chart is a chart for a day to day basis where only the price movements are considered and there is no time period is required. This chart is consist of a number of columns having the stacked either “X’s” or “O’s” where “X” presents the rising price and “O” presents the falling price. This kind of chart is used for filtering the non-

47
significant movements of price and helps the trader to find out the complex support & resistance line. A point and figure chart is given below:
Fig: Point and figure chart
Interpretation: This point and figure chart is only the price chart here there is no time period. The beauty of Point & Figure charts is its simplicity. Here the “X” sign presents that the share price is increasing by $1 and the “O” sign presents that the share price is decreasing by $1. If the price increased by $2 then used 2 X, in the 1st line we see 5X that means price increased by $5 and in the 2nd line we see 6 O that means price decreased by $6. For making change in the direction here at least $3 price movement is required. By using this chart support and resistance can also be found.

48
CHAPTER SIX Chart Pattern
49
Chart Pattern “A chart pattern or price pattern is a pattern within a chart when prices are graphed. In stock and commodity markets trading, chart pattern studies play a large role during technical analysis. When data is plotted there is usually a pattern which naturally occurs and repeats over a period”.
6.1. Support and resistance: In technical analysis support & resistance concepts are highly discussed and useful two branches.
Considering demand support level is an expected downtrend of price level. When security prices falls then share demand increases and forms the support line. Similarly when the security prices rises then the share demand decreases and forms the resistance level. The identified support & resistance level gives potential and valuable entry or exit points of trading.
Here, a support and resistance chart of ACI ltd. has been given. This is a 6 months chart. From this chart price trends will be clear to understand and it will help the investor wheatear they will buy the share of ACI or not. Along with this chart an interpretation is given for better understand:
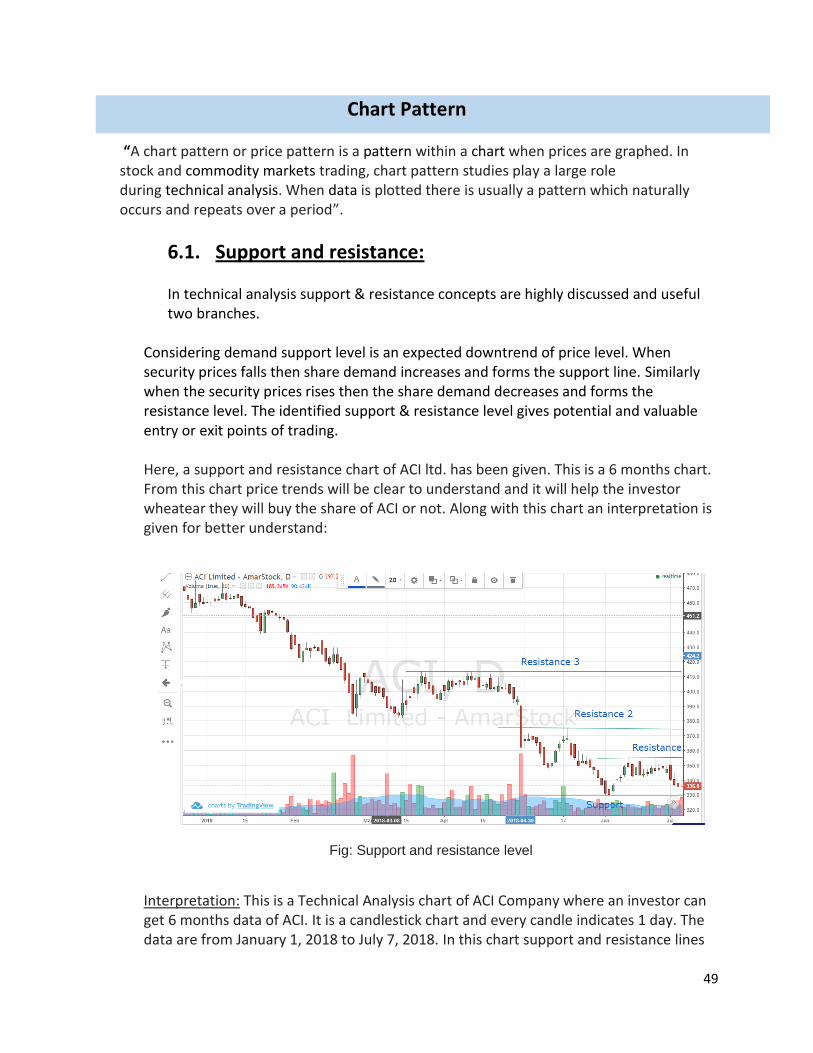
Fig: Support and resistance level
Interpretation: This is a Technical Analysis chart of ACI Company where an investor can get 6 months data of ACI. It is a candlestick chart and every candle indicates 1 day. The data are from January 1, 2018 to July 7, 2018. In this chart support and resistance lines
50
has been marked. This chart shows that ACI’s stock prices are down trending, it means price is decreasing. Sometimes it becomes a good decision to buy this type of share in decreasing prices. But investor should consider the support and resistance level if they want to gain money. Here I have drawn a support line for better understand. This support line shows that, price decreases up to tk. 330 in the last two months. So it can be said that there is less possibility to decrease prices and I have drawn 3 resistance lines, resistance line 1 indicates the very recent price and resistance line 2 indicated the last 2 months price resistance level and resistance level 3 indicates last 4 months price resistance level. An investor should consider the recent resistance level and he can consider resistance line for 2 months at most. Resistance line 1 show the price can increase up to 355 tk. & resistance line 2 shows price can increase up to 375 tk. & resistance line 3 shows price can increase up to 413 tk. So, if an investor buy a share at tk. 330 then he can sell that share at tk. 355 and if it further increase it will be up to tk. 355. There is very low possibility that price will increase more and if an investor wants to buy ACI’s share he should take decision considering support line. Considering resistance line might be a bad decision and it may causes loss cause price never increase after the resistance level if market it normal. So, before taking decision, an investor should observe the support and resistance to be gainer.
6.2. Continuation pattern: “A continuation pattern is a pattern which suggests that a trend in a security price series chart is expected to continue. There are several continuation patterns that technical analysts will identify as an indicator of an extended price trend”. For a 1 to 3 months existing trend most accurate continuation pattern can be found. Some continuation patterns are briefly discussed below:
Triangles: In triangle pattern support & resistance levels have opposite positive and negative slopes which join the convergence point. It can be systematic, descending or ascending and presents a small longer time period than pennants.
Pennants: Pennants are the just opposite of triangle having the shorter trade
lines.
Flags: A flag is represented by 2 short term parallel lines. Either the flag can be ascending or it can be descending showing the volatility happening within the price trend.

51
Rectangles: The most popular continuation pattern is rectangles which gives a pause in the series of price trend considering moving sideways. Two “0” sloping trade lines draw a rectangle pattern. At the support & resistance level sideways movement are identified.
6.3. Mathematical indicators: Objective view of the price movement activity is given by mathematical trading strategy. It helps to overview price trend and timing, curtail fear and get around overtrading and provide price movement signals in the market.
Mathematical indicators use some tools. They are:
Simple Moving Average Bollinger Bands Exponential moving average. Mike Trading Bands Stop and reverse. Dynamic and Volatility trail stop. Balance and Volume trend Relative strength index.

52
CHAPTER SEVEN Indicators of Technical Analysis used in DSE

53
7.1. History of DSE: In the necessity of stock and share transection East Pakistan Stock Exchange Association Ltd. was formed on 28th April 1954 which started its formal trading in the year 1956 and renamed as East Pakistan Stock Exchange Ltd on 23rd June 1962 and later it was again renamed as Dacca Stock Exchange Ltd. On 13th May 1964. After liberation war in the year 1976 it started their activities which was discontinued for 5 years and on 16 December 1986 it was started as DSE (Dhaka Stock Exchange).
7.2. Formation of legal control: Dhaka stock exchange is a Public Ltd. Company. All the functions of DSE are performed and managed by the Articles of Association rules and regulations of DSE with the Securities and Exchange Commission Act 1993.
7.3. Functions of DSE: The major functions of Dhaka Stock Exchange is listed below:
1. Trading settlement. 2. Preparing companies. 3. Provide screen based automated technology for the listed Securities trading. 4. Proving approval for transection and transferring share outside trading system. 5. Controlling the market administration. 6. Keep surveillance over the market. 7. Publishing the review in monthly basis. 8. Monitoring listed companies. 9. Preparing the grievance cell for the investors. 10. Ensuring the protection fund of investors. 11. Through online providing all price sensitive information on time about the listed
companies.
7.4. The main 4 technical analysis indicators used by DSE: Among all those listed functions DSE’s most important function is settlement of trading and stock selection. For this settlement of stock selection DSE uses some analyzing process. Those are named Technical Analysis and Fundamental Analysis. Among this 2 process Technical Analysis is most effective. DSE usually uses this Technical analysis for stock selection and DSE
54
uses more than 30 indicators of this Technical Analysis. Among those indicators here 2 most important indicators of Technical Analysis will be briefly discussed:
1. MACD 2. RSI 3. MA 4. EMA
7.4.1. MACD: MACD is defined as “it is a trend following trading indicator which is used in technical analysis of stock prices and shows the relationship between two moving averages of prices”. In stock price a trend’s changes in duration, strength, direction and momentum are shown by MACD. From the historical data and closing prices MACD is calculated and it is calculated by the subtraction of 26 day EMA from 12 day EMA. 9 day EMA of MACD is called “signal line” it works as sell and buy signal’s trigger point which is plotted on MACD’s top line.
MACD is the most popular, efficient and reliable technical indicator and it has trend-following and momentum forecasting abilities. For that reason DSE uses this tool to predict the stock prices. Using MACD both fresher and experienced trader makes the trading accessible and turns it to easier interpretation and confirmation. It helps the trader to take the most accurate trading decision. MACD is used in daily, weekly or monthly price charts.
7.4.2. RSI: RSI is a momentum indicator of technical analysis used in financial markets analysis which compares the expansion of present profits and losses over a timeframe to calculate the speed and changes of price movements of a bond. While trading the oversold or overbought conditions of a security RSI is used. RSI = [100 – 100/ (1+RS)]. RSI gives a relative evaluation of a security’s present price performance strength and weakness and it values the range from 0 to 100 where the default time frame of comparing up to down period is 14 trading days.
According to traditional interpretation and the uses of RSI where RSI values 70 or above indicates that the security is becoming overbought or overvalued which helps to reverse or correct the pullback and when the RSI values 30 or below it indicates that the security is becoming oversold or undervalued it also helps to change a trend and correct the upside price reversal. In this way the traders can predict the overall condition of the share in the present market for that reason DSE uses this technical indicator to take buying decision and select a share. If the trader wants to minimize more risks they can take the values of RSI more than 80 and on the other side less than 20.
7.4.3. MA: Moving average is a mostly used technical tool that helps smooth out price action. The direction and slope lines of moving average lines shows the relationship

55
between the historical data and the present data values and gives the information to the investors. Most of the trading concepts like support and resistance, convergence and divergence, confirmation, oversold and overbought and so others have their basic from moving average analysis.
DSE uses this moving average because of its flexibility and it allows others to analyze other moving averages and it helps to interpret the relationship of spot trends, forecasting the movement of price trades place and this moving average becomes the subset of technical analysis indicators.
7.4.4. EMA: EMA is as like as a simple moving average, except that in the latest data more weight is given. It is also called as exponentially weighted moving average. Exponential moving average reacts with the changing current prices faster than the simple moving average.
Now a figure will be shown where all the explained technical indicators are playing their roles:
Fig: Few Trend Indicators in several time period.
From this above figure it is seen that how the four indicators performs for a specific stock. Here in 1M time frame MACD is down, 5M time frame is down, 15M time frame MACD is up, 30M time frame MACD is up, 1H, 4H, 1D time frame MACD is down, weekly time frame MACD is up and MN time frame MACD is down. And the row summary of overall MACD in this row is 67% down. And the row summary of overall RSI in this row is 89% down. And here the row summary of overall MA and EMA in their row is 56% and 89% down respectively. And in the 1M time frame MACD, RSI, MA, EMA all are down and the column summary is 100% down, in the same way in 5M time frame MACD, RSI is down MA is up and EMA is down and the column summary is 75% down, in 15M and 30M time frame overall column summary is 50% up respectively, in 1H, 4H, D time frame column summary is 100%, 100% and 75% down respectively, and in weekly and monthly time frame 50%up and 75% down respectively. From this discussion and the roles of the indicator a trader can takes the trading decision and can choose the less risky stock. It helps in many way to select a stock trending.

56
CHAPTER EIGHT RECOMMENDATION AND CONCLUSION
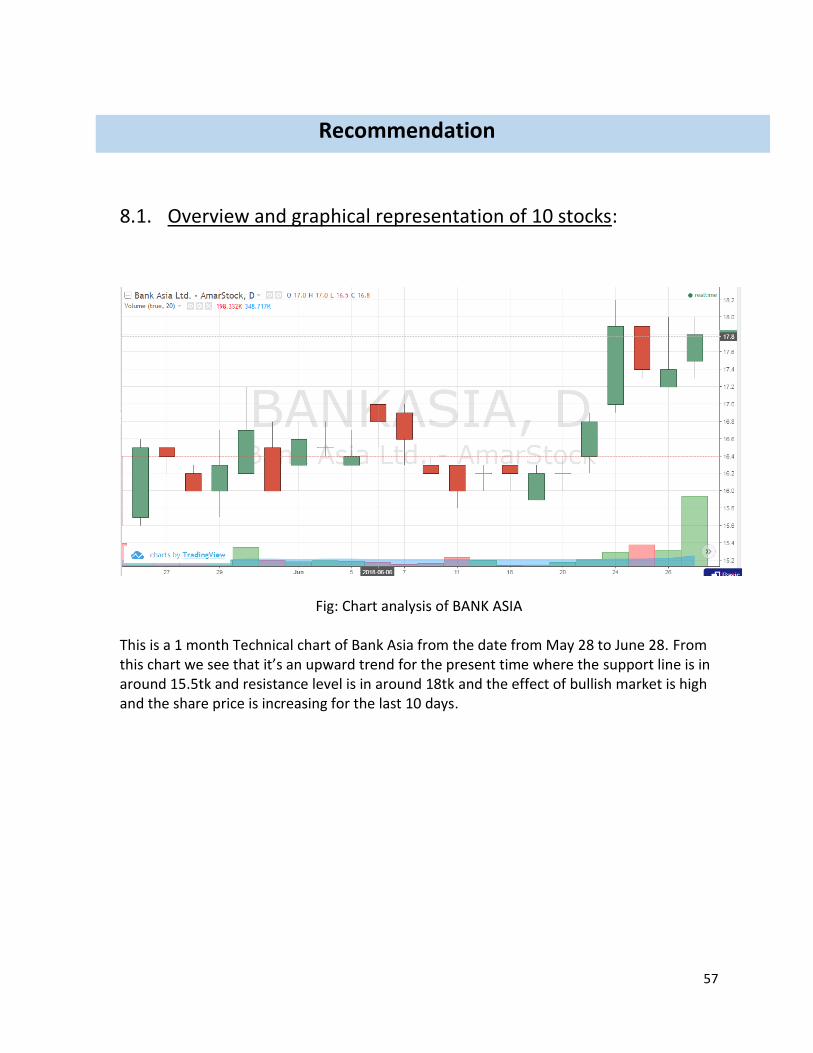
57
Recommendation
8.1. Overview and graphical representation of 10 stocks:
Fig: Chart analysis of BANK ASIA
This is a 1 month Technical chart of Bank Asia from the date from May 28 to June 28. From this chart we see that it’s an upward trend for the present time where the support line is in around 15.5tk and resistance level is in around 18tk and the effect of bullish market is high and the share price is increasing for the last 10 days.

58
Fig: Chart analysis of BRAC BANK This is a 1 month Technical chart of BRAC Bank from the date from May 28 to June 28. From this chart we see that it’s a downward trend for the present time where the support line is in around 71tk and resistance level is in around 80tk and here the effect of bearish market is high and the share price is declining.
Fig: Chart analysis of CITY BANK

59
This is a 1 month Technical chart of City Bank from the date from May 28 to June 28. From this chart we see that a very frequent upward and downward trend where support line is in around 32tk and the resistance level is in around 35tk and the market is so volatile where the both bull and bearish market is equal effective and share price is increasing abnormally in the last day 28th June.
Fig: Chart analysis of DHAKA BANK
This is a 1 month Technical chart of Dhaka Bank from the date from May 28 to June 28.From this chart we see a frequent downward trend where the support line is in around 14tk and the resistance level is in around 15tk and the bearish market is mostly happened and the share price is decreasing.
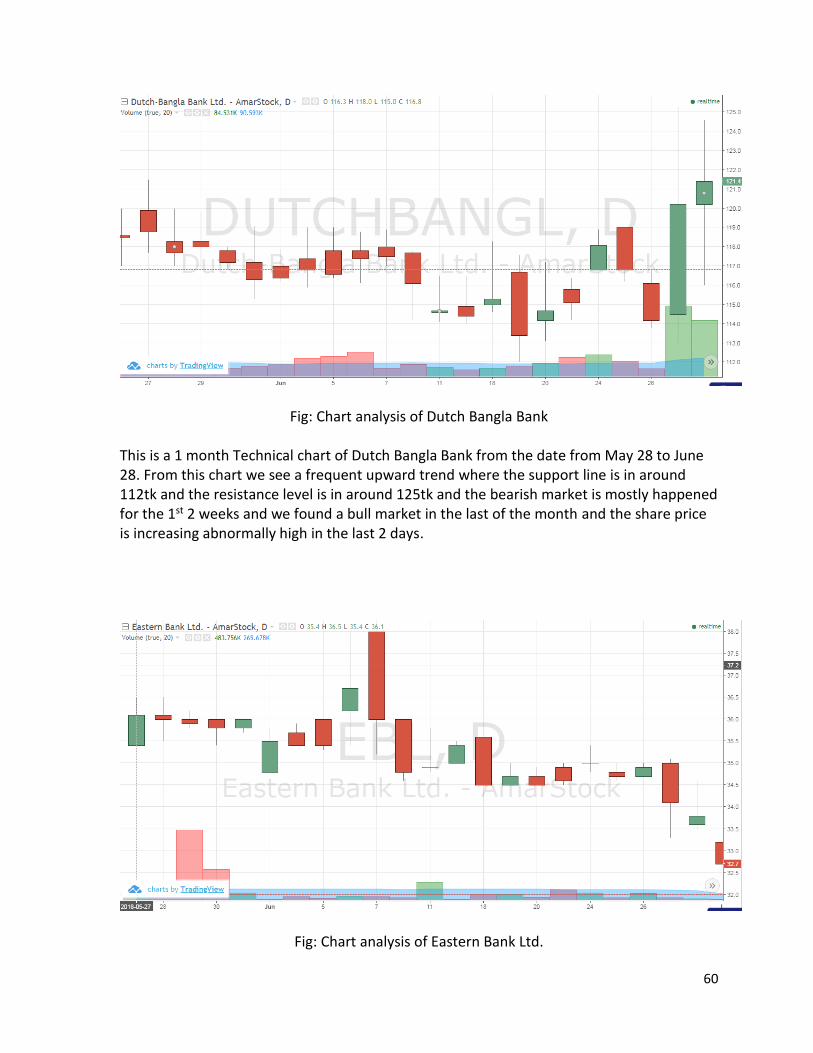
60
Fig: Chart analysis of Dutch Bangla Bank This is a 1 month Technical chart of Dutch Bangla Bank from the date from May 28 to June 28. From this chart we see a frequent upward trend where the support line is in around 112tk and the resistance level is in around 125tk and the bearish market is mostly happened for the 1st 2 weeks and we found a bull market in the last of the month and the share price is increasing abnormally high in the last 2 days.
Fig: Chart analysis of Eastern Bank Ltd.
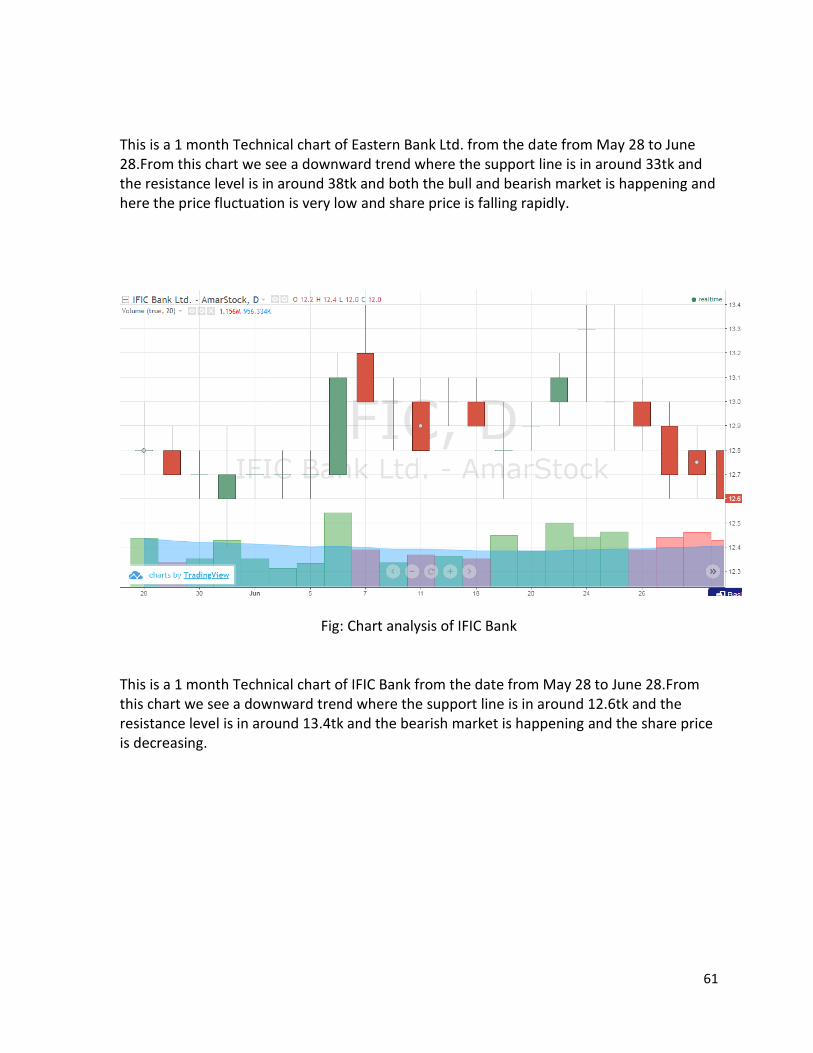
61
This is a 1 month Technical chart of Eastern Bank Ltd. from the date from May 28 to June 28.From this chart we see a downward trend where the support line is in around 33tk and the resistance level is in around 38tk and both the bull and bearish market is happening and here the price fluctuation is very low and share price is falling rapidly.
Fig: Chart analysis of IFIC Bank
This is a 1 month Technical chart of IFIC Bank from the date from May 28 to June 28.From this chart we see a downward trend where the support line is in around 12.6tk and the resistance level is in around 13.4tk and the bearish market is happening and the share price is decreasing.
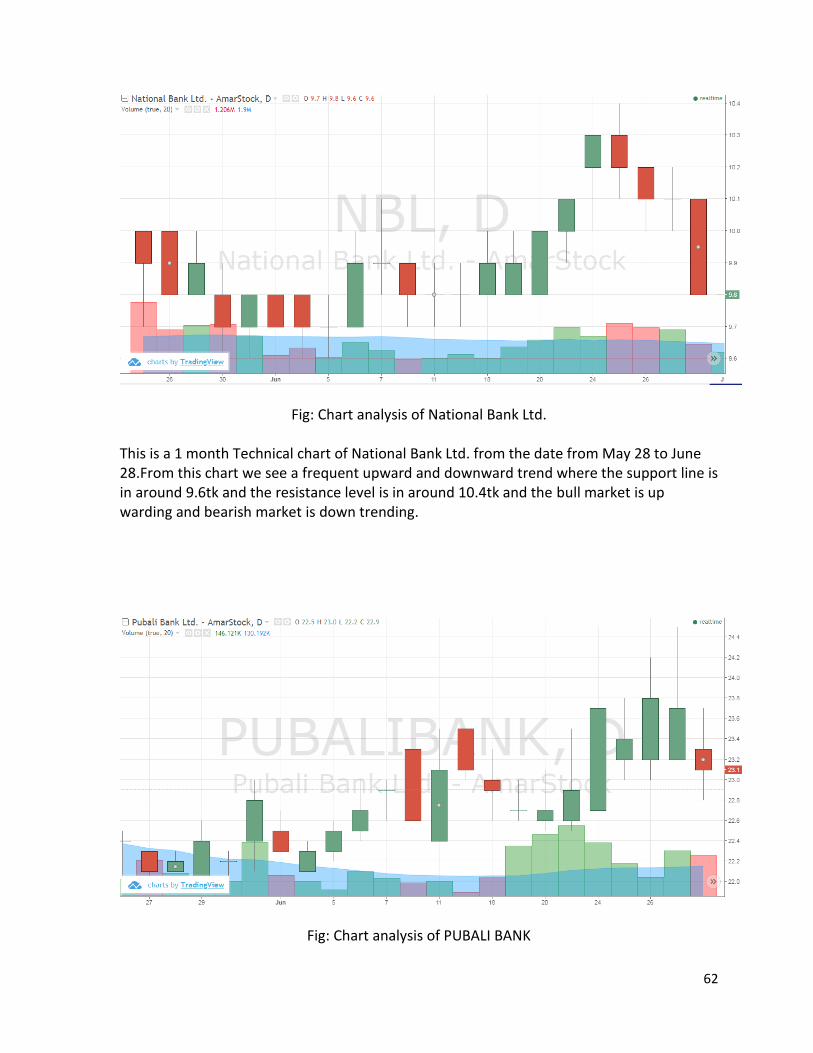
62
Fig: Chart analysis of National Bank Ltd.
This is a 1 month Technical chart of National Bank Ltd. from the date from May 28 to June 28.From this chart we see a frequent upward and downward trend where the support line is in around 9.6tk and the resistance level is in around 10.4tk and the bull market is up warding and bearish market is down trending.
Fig: Chart analysis of PUBALI BANK

63
This is a 1 month Technical chart of PUBALI BANK from the date from May 28 to June 28.From this chart we see a downward trend happening in the last week where the support line is in around 22.2tk and the resistance level is in around 24.4tk and the bull market is happening and the share price is decreasing.
Fig: Chart analysis of RUPALI BANK
This is a 1 month Technical chart of RUPALI BANK from the date from May 28 to June 28.From this chart we see a downward trend happening for the last 4 days where the support line is in around 35tk and the resistance level is in around 43.8tk and the bull market is happening and here the nature of share price is so volatile.
8.2. Stock Selection and making portfolio: Let, Investment amount = 10000 Tk. Duration = 7 days Expected Profit: Expected Selling price – Total investment = (101930 – 100000) = 1930 Taka
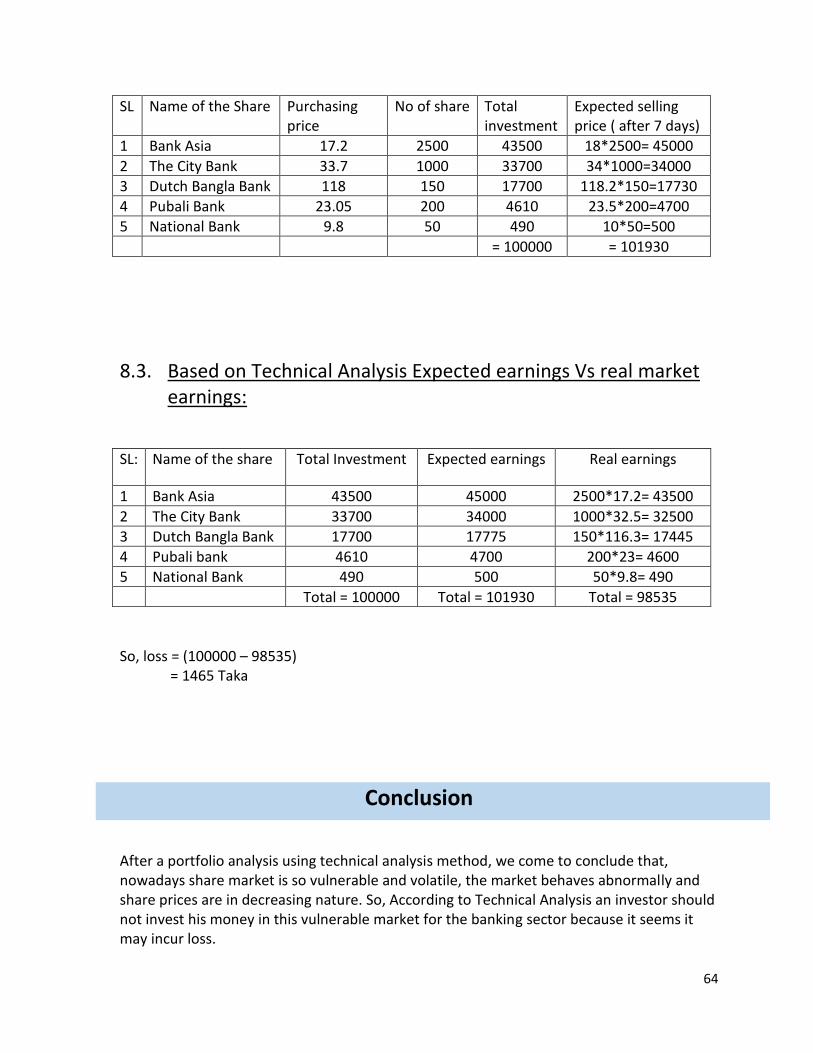
64
SL Name of the Share Purchasing price
No of share Total investment
Expected selling price ( after 7 days)
1 Bank Asia 17.2 2500 43500 18*2500= 45000
2 The City Bank 33.7 1000 33700 34*1000=34000
3 Dutch Bangla Bank 118 150 17700 118.2*150=17730
4 Pubali Bank 23.05 200 4610 23.5*200=4700
5 National Bank 9.8 50 490 10*50=500
= 100000 = 101930
8.3. Based on Technical Analysis Expected earnings Vs real market earnings:
SL: Name of the share Total Investment Expected earnings Real earnings
1 Bank Asia 43500 45000 2500*17.2= 43500
2 The City Bank 33700 34000 1000*32.5= 32500
3 Dutch Bangla Bank 17700 17775 150*116.3= 17445
4 Pubali bank 4610 4700 200*23= 4600
5 National Bank 490 500 50*9.8= 490
Total = 100000 Total = 101930 Total = 98535
So, loss = (100000 – 98535) = 1465 Taka
Conclusion After a portfolio analysis using technical analysis method, we come to conclude that, nowadays share market is so vulnerable and volatile, the market behaves abnormally and share prices are in decreasing nature. So, According to Technical Analysis an investor should not invest his money in this vulnerable market for the banking sector because it seems it may incur loss.
65
9. References 1. http://www.marhgfketrealist.com/2014/12/technical-analysis-bollinger-bands 2. Obamuyi, T. M. (2013). Factors influencing investment decisions in capital market: A
study of individual investors in Nigeria. Organizations and Markets in Emerging
Economies, 4(1), 141-161.
3. Suciu, T. (2013). Elements of stock market analysis. Bulletin of the Transylvania
University of Brasov, 6(2), 153-160.
4. Sureshkumar, K. K., & Elango, N. M. (2011). An efficient approach to forecast Indian
stock market price and their performance analysis. International Journal of Computer
Application, 34(5), 44-49.
5. Marketrealist.com. (2018). Market Realist. [Online] Available at:
https://marketrealist.com/2014/12/technical-analysis-bollinger-bands [Accessed 28 Jun.
2018].
6. Zielonka P. (2004): Technical Analysis as the representation of typical cognitive biases.
International Review of Financial Analysis, 2004, volume 1, p.217-225.
7. Advantages of Technical Analysis. (2018). Retrieved from
https://www.binaryoptions.net/advantages-of-technical-analysis/
8. Anon, (2018). [online] Available at: https://www.quora.com/What-are-the-disadvantages-
of-technical-analysis [Accessed 28 Jun. 2018].
9. Fama E. - French K. (1988): Permanent and temporary components of stock prices.
Journal of Political Economy. 1988, volume 2, p.246-273.
10. Gould, M. (2016). Fundamental vs. technical financial analysis. Research Starters
Business, 1-5.
11. Frankel J. - Froot K. (1990): The rationality of the foreign exchange rate: chartists,
fundamentalists, and trading in the foreign exchange rate American Economic Review,
1990, volume 80, p.181-185.
66
12. Bennet, E., Selvam, M., Indhumathi, G., Ramkumar, R. R., & Karpagam, V. (2011).
Factors influencing retail investor’s attitude towards investing in equity stocks: A study
in Tamil Nadu. Journal of Modern Accounting and Auditing, 7(3), 316-321. 13. Kaur, P., & Rajam, R. (2012). Investors' behavior of equity investment: Empirical study
of individual investors of North Central Mumbai. DYPDBM International Business
Management Research Journal, (12), 52-67
14. Hales, A. (2018). Technical Analysis. [online] Investopedia. Available at:
https://www.investopedia.com/exam-guide/cfa-level-1/equity-investments/technical-
analysis.asp [Accessed 28 Jun. 2018].
15. Lui, Y. H., & Mole, D. (1998). The use of fundamental and technical analyses by foreign
exchange dealers: Hong Kong evidence. Journal of International Money and Finance,
17(3), 535-545.
16. Antoniou А. - Ergul N. - Holmes P. - Priestley R. (1997): Technical analysis, trading
volume and market efficiency: evidence from an emerging market. Applied Financial
Economics, 1997, volume 4, p.361 – 365.
17. Gould, M. (2016). Fundamental vs. technical financial analysis. Research Starters
Business, 1-5.
18. Kumar, N., Mohapatra, S., & Sandhu, G. (2013). Importance of technical and
fundamental analysis and other strategic factors in the Indian stock market. Management
Review: An International Journal, 8(1), 38.
19. Wong W-K. - Manzur M. - Chew B-K. (2003): How rewarding is Technical analysis?
Evidence from Singapore stock market. Applied Financial Economics, 2003, volume 7,
p.543-551.
20. Tripathi, V. (2009). Investment strategies in the Indian stock market: A survey. Indian
Journal of Finance, 3(11), 3-10.
21. Technical Analysis - benefits. (2018). Retrieved from
http://www.referenceforbusiness.com/encyclopedia/Str-The/Technical-Analysis.html
22. Mitra, S. K. (2002). Profiting from technical analysis in Indian stock market. Finance
India, 16(1), 109-120.
23. Anon, (2018). Disadvantages of technical analysis. [online] Available at:
https://investlb.com/en/disadvantages-of-technical-analysis/ [Accessed 28 Jun. 2018].