project report (17mbapr407) on “a study on employee
TRANSCRIPT
Project Report (17MBAPR407)
On
“A STUDY ON EMPLOYEE PERCEPTION TOWARDS
ORGANIZATIONAL CULTURE W.R.T DOMINO’S AT JUBILANT
FOODWORKS LTD BANGALORE”
BY
Mr. MANOJ KUMAR J
USN: 1IA17MBA29
Submitted to
VISVESVARAYA TECHNOLOGICAL UNIVERSITY,
BELAGAVI
In partial fulfilment of the requirements for the award of the degree of
MASTER OF BUSINESS ADMINISTRATION
Under the Guidance of
INTERNAL GUIDE EXTERNAL GUIDE
Mrs. Monica M Mr. Mahadev
Assistant Professor HR Manager
Dept. of MBA, AIT Jubilant FoodworksLtd
Department of MBA
Acharya Institute of Technology
Acharya Dr. SarvepalliRadhakrishnan Road
Acharya PO, Soladevanahalli, Bangalore-560 107
March 2019

~ fUBIIANT FOOD WORKS
www.Jubilantfoodworks.com
~'1, Domino's Pizza www.dominos.co.in
~ 1 DUNKIN' ~
0 l DONUTS e-, www.dunkinindia .com
Date: 15th February 2019
To whom so ever it may concern
This is to certify that Mr. Manoj Kumar J (USN: 1IA17MBA29) student of
Acharya Institute of Technology, Bangalore affiliated to VTU has undergone a
project on "A Study on Employee Perception Towards Organizational Culture
w.r.t Dominos" at Jubilant Foodworks Ltd Bangalore. The project training
Programme was for six weeks i.e(3rd Jan 2019 to 16th Feb 2019). She has
undertaken the training as a part of her curriculum.
We wish her all the best in her future endeavors.
For Jubilant Foodworks Ltd
~~~ad~ l lY (l't ''* '( 8~- .--: , .. l~ an[}.3~ e .-. .
)
\ ., ~
,'A , · ,., secl Signatory Va; sha S Olety Human Resources
A Jubilant Bhartia Company
Jubilant FoodWorks Limited Corporate Office:
5th Floor, Tower-D, Plot No. 5,
Logix Techno Park, Sector-127, Noida-201 304, U.P., India
Tel : +91 120 4090500
Fax: +91 120 4090599
Jubilant FoodWorks Limited No. 1573, First Floor, Sector I (AGARA) HSR Layout, Bangalore-560 102 Ph: 080-25720347 /48

ACHARYA INSTITUTE OF TECHNOLOGY
(Affil iated to Visvesvaraya Technolog ical University, Belagavi, Approved by AICTE, New Delh i and Accredited by NBA and NAAC)
Date: 23/03/2019
CERTIFICATE
This is to certify that Mr. Manoj Kumar J bearing USN
lIAl 7MBA29 is a bonafide student of Master of Business Administration
course of the Institute 2017-19 batch, affiliated to Visvesvaraya
Technological University, Belagavi. Project rep011 on "A Study on
Employee Perception Towards Organizational Culture w.r.t Dominos at
Jubilant Foodworks Ltd, Bengaluru" is prepared by him under the
guidance of Prof. i\tlonica M in partial folfillment of the requirements for the
award of the degree of Master of Business Administration, Visvesvaraya
Technological University, Belagavi, Kamataka.
Signature of Internal Guide · Signature of ' 1[h Ji ~ a of the Depart. .• e~t
06psrtment of MBA ·· h I t·· ... "...-e,..h- ,.., •,..,, -.. ·.c. arya ns itute 01 s Li.i 10:...,~;
fi' ..;oldevanahlli, Bangalore-560 1 ;,. ..
W _-Signaturo P.f oQO~\r~ t1CW1R .-M,ademics
Dean.Academics ::HARYA INSTITUTE OF TECHMOL:'JGY
Be~igaluru-107, Acharya Dr. Sarvepall i Radhakri shnan Road, Soladevanahal li, Acharya PO , Bengaluru 560 107, Karnataka, Ind ia • www acharya.ac .in/ait • Ph +91 -80-225 555 55 Extn . • 2102 • Fax• +91-80-237 002 42 • E-ma il pri ncipala [email protected] .in

DECLARATION
I Manoj Kumar J, hereby declare that the Project report entitled ' 'A STUDY ON EMPLOYEE
PERCEPTION TOWARDS ORGANIZATIONAL CULTURE W.R.T DOMINO'S AT
JUBILANT FOODWORKS LTD BANGALORE" prepared by me under the guidance of Prof.
Monica M,faculty of M.B.A Department, AIT and external assistance by Mr. Mahadev,
Human Resource Manager at Jubilant Foodworks,I also declare that this Project work is
towards the partial fulfilment of the university Regulations for the award of degree of Master of
Business Administration by Visvesvaraya Technological University, Belagavi . I have undergone
a summer project for a period of Six weeks. I further declare that this Project is based on the
original study undertaken by me and has not been submitted for the award of any degree/diploma
from any other University / Institution.
Place: Bengaluru ~J·
Signature of the student
Date Old Of.t I 2019

ACKNOWLEDGEMENTS
I wish to express my sincere thanks to our respected Principal, Dr. Prakash M R, beloved Dean-
Academics, Dr. Devarajaiah R M, and deep sense of gratitude to Dr. M M Bagali, HOD,
Acharya Institute of Technology, Bengaluru for their kind support and encouragement in
completion of the Internship Report.
I would like to thank Prof. Monica M, Asst. Professor, Department of MBA, Acharya Institute
of Technology, Bengaluru and external guide Mr. Mahadev, HR Manager, Jubilant Foodworks
, Bengaluru, who gave me golden opportunity to do this wonderful Project in the esteemed
organization, which helped me to learn various concepts.
Finally, I express my sincere thanks to my Parents, Friends and all the Staff of MBA department
of AIT for their valuable suggestions in completing this Project Report.
Place: Bangalore Manoj Kumar J
Date:04/04/2019 USN: 1IA17MBA29

TABLE OF CONTENTS
CHAPTER
NO.
CHAPTERS PAGE
NO.
EXECUTIVE SUMMARY 1
1 INTRODUCTION
1.1 Introduction 2
1.2 Industry Profile 3-4
1.3 Company Profile 5-6
1.5 Vision, Mission and Quality Policy 7-8
1.6 Products and Service Profile 8-9
1.7 Area of Operation 9-10
1.8 Infrastructure Facility 10
1.9 Competitors Information 10-11
1.10 SWOT Analysis 11-12
1.11 Future growth and Prospects 12
1.12 Financial Statement 13-16
2 CONCEPTUAL BACKGROUND AND LITERATURE
REVIEW
2.1 Theoretical Background of the Study 17-18
1.4 Promoters 7

2.2 Literature Review 19-28
3 RESEARCH DESIGN
3.1 Statement of Problem 29
3.2 Need for the Study 29
3.3 Objective of the Study 29
3.4 Scope of the Study 30
3.5 Research Methodology 30
3.7 Limitations of the Study 31
4 ANALYSIS AND INTERPRETATION
5 FINDINGS, SUGGESTIONS AND CONCLUSION
BIBLIOGRAPHY
ANNEXURE
3.6 Hypothesis 30
Analysis and Interpretation of Data 32-57
5.1 Findings 58
5.2 Suggestions/ Recommendation 58
5.3 Conclusion 59

LIST OF TABLES
TABLE
NO.
TITLES PAGE
NO.
4.1 Table showing employees proud to be associated with jubilant food
works.
32
resources to complete their job effectively
4.3 Table showing there is a great respect while dealing with customers. 34
4.4 Table showing the employees generally aware of SOP/Policies/Process
within organization.
35
4.5 Table showing there will be great level of appreciation for your work
performance.
36
4.6 Table showing there is good team work in my section/Department. 37
4.7 Table showing the domino’s maintaining good discipline in work place. 38
4.8 Table showing the people in Domino’s mutually respect each other’s. 39
4.9 Table showing People at Domino’s are proactive and quickly adapt to
changes.
40
4.10 Table showing there is a high level of trust among everyone in the
organization.
41
4.11 Table showing the compensation provided by the Domino’s is
satisfying.
42
4.12 Table showing the training provided by the Domino’s is sufficient to
work effectively in workplace.
43
4.13 Table showing the benefits provided by the company are satisfying. 44
4.2 Table showing the employees in organization are getting enough 33

4.14 Table showing the policies and the organization structure / Hierarchy in
the organization has been clearly defined.
45
4.15 Table showing that, in the organization peoples are encouraged for
innovative approaches in problem solving.
46
4.16 Table showing that, in our organization the decisions are made by
keeping in mind that good of the employees and society.
47
4.17 Table showing top level management safeguards its employees at risky
situations.
48
4.18 Table showing People in our organization will give more ideas,
information, feedback on customers, products, services etc.
49
4.19 Table showing in our organization people take the initiatives and also
preventive actions on most of the organization matters.
50
4.20 Table showing in our organization people are given freedom to plan and
act in one’s own sphere.
51
4.21 Table showing mean and standard deviation of perception and
organizational culture factors.
52
4.22 Table showing Hypothesis test of the association between cultural
factors and perception are significant and positive.
53
4.23 Table showing Hypothesis test of the perception varies amongst males
and females.
56

LIST OF GRAPHS
GRAPH
NO.
TITLES PAGE
NO.
4.1.1 Graph showing employees proud to be associated with jubilant
foodworks.
32
4.2.1 Graph showing the employees in organization are getting enough
resources to complete their job effectively
33
4.3.1 Graph showing there is a great respect while dealing with customers. 34
4.4.1 Graph showing the employees generally aware of
SOP/Policies/Process within organization.
35
4.5.1 Graph showing there will be great level of appreciation for your work
performance.
36
4.6.1 Graph showing there is good team work in my section/Department. 37
4.7.1 Graph showing the domino’s maintaining good discipline in work
place.
38
4.8.1 Graph showing the people in Domino’s mutually respect each other’s. 39
4.9.1 Graph showing People at Domino’s are proactive and quickly adapt to
changes.
40
4.10.1 Graph showing there is a high level of trust among everyone in the
organization.
41
4.11.1 Graph showing the compensation provided by the Domino’s is
satisfying.
42
4.12.1 Graph showing the training provided by the Domino’s is sufficient to
work effectively in workplace.
43

4.13.1 Graph showing the benefits provided by the company are satisfying. 44
4.14.1 Graph showing the policies and the organization structure / Hierarchy
in the organization has been clearly defined.
45
4.15.1 Graph showing that, in the organization peoples are encouraged for
innovative approaches in problem solving.
46
4.16.1 Graph showing that, in our organization the decisions are made by
keeping in mind that good of the employees and society.
47
4.17.1 Graph showing top level management safeguards its employees at risky
situations.
48
4.18.1 Graph showing People in our organization will give more ideas,
information, feedback on customers, products, services etc.
49
4.19.1 Graph showing in our organization people take the initiatives and also
preventive actions on most of the organization matters.
50
4.20.1 Graph showing in our organization people are given freedom to plan
and act in one’s own sphere.
51

1
EXECUTIVE SUMMARY
Employee perception is a one of the important factors to be considered in any of the organization
and employee’s perception plays an important role in their working environment and impact on
their work and also on organizational goal. There is a procedure in which the employees of the
organization is encouraged to stay inorganization to a long period of time. There are various
factors which affect the employee’s perception.
Employees in today’s world are very different; they tend not to miss good opportunities. If they
are unhappy with their present job then they obviously tend to change to the next job which has
better prospect and future. Thus, it is the primary obligation to the management to perceive the
employee’s potential activities and a good management should know how to encourage, attract
employees in their organization.
The Particulars study talks about employee’s perception theoretically along with the new idea
and views that s trending now. It also deals with the identifying of the factors which affect the
employee perception in the organization i.e the organizational culture is the main thing with
affects perception of the employees majorly and for that many factors like Respect, Team work,
Discipline, Mutual Trust, Compensation, Training, Transparency, Encouragement, Safety,
Freedom etc. are taken into account.
The main aim of the research is to analyze perception relation with organization culture. The
survey conducted by gathering data from both the sources i.eprimary and secondary. The
primary data collected from undisguised Questionnaire and secondary data is collected from
journals, reports. The data gathered is analyzed using percentage analysis and statistical tools
such as descriptive frequency, correlation and T-test using SPSS 16.0. The finding shows the
employees are positive towards organization culture.

2
CHAPTER-1
1.1 INTERDUCTION ABOUT INTERNSHIP
Internship will supply realistic advantage to all the college students, in order to earn the work
experience on the chosen matter. Internship also presents how theoretical skills must observe on
the practical working fields. Internship is a very good platform to learn about how an
organization works and also it provides an opportunity to learn the work with the guidelines of
experts in Particulars work. It is a place where a new candidate can earn the knowledge about the
work in the organization and also raise the skills of individual. We had to complete our
internship in 6 weeks and have to gain overall organization working and have to make a research
on a Particulars topic. Internship also boosts our CV on work experience.
As an MBA student of HR Specialization my research is based on “Employee Perception
towards Organization Culture” at Jubilant Food Works.
1.2 TOPIC CHOSEN FOR STUDY:
“A STUDY ON EMPLOYEE PERCEPTION TOWARDS ORGANIZATIONAL
CULTURE W.R.T DOMINO’S AT JUBILANT FOODWORKS LTD BANGALORE”
This study is to find out whether employees in the organization are positive or negative about
organization culture. The executive organization culture will contain of values and beliefs of the
people in the organization which also supports the organizational goals. This will also have
impact on employee’s satisfaction. This research explains that if employees are committed and if
they are having same norms and values where every organization has, then they can increase
their performance towards achieving overall organizational goals.
The organizational culture plays an significant role in achieving the organization goal effectively
so if the employees in the organization are happy with the culture that has maintained in the
organization then the workers will work effectively if the employees are not satisfied with the
organizational culture then the organization can’t achieve its goal effectively so every
organization has to understand what the employees are feeling about the organizational culture
and the management should assess that weather the employees are happy and satisfied with the
culture or not.

3
INDUSTRY PROFILE AND COMPANY PROFILE
1.2 INDUSTRY PROFILE
The food industry has a varietytypes of fast-food stores in a food and beverage establishments
serving businesses. The fast food industry is the fastest growing industry now a days in India and
world, in India for Quick Service Restaurants there is market up to 10000 crores and still its
growing gradually.
DEMOGRAPHICS
Food franchises industry is popular industry because it’s served tasty food and people enjoy
eating out. According to National Restaurant Association report 90% people are going to enjoyed
restaurant and 50% of people say that restaurants are essential part of their presence. 80% of
consumers eat out with the family and an impressive at a friend's house eating, they prefer fast
food while they are in work and their leisure time more efficiently. Since the food industry so
saturated the demand is fierce competition. According to Indian statistical data there is an 34.52
percentage of people uses fast food.
GROWTH
The food industry is a lucrative restaurant franchise chain has been successful in channeling the
power of the. Entrepreneur magazine Franchise 500 strong franchise 2015 500 104-quick service
restaurants, and across all industry sectors in this group, the most financially sound franchises list
when combined with the largest industrial segments in the list and a list of retail accounts for 3%
of the full-service restaurant food sales, 1.8% more than 25 per cent of the food 500 franchise.
Food institute says that every year they’ll be spending $6 billion more eating out than older
generation and franchises that serve a natural, healthy and unprocessed option is likely to append
to millennial.
Add an element to the success of the right position of the food contract. Some of the U S site
Nerd Wallet currency awarded 2015 report affording advice to the city for the new dining room
is in high demand. Nerd wallet identified the best place to start your business in the belowCity’s,

4
1. cedar park in Texas
2. Franklin in Tennessee
3. Smyrna in Georgia
4. Round Rock in Texas
5. Frisco in Texas
6. Bangalore in India etc…
INDUSTRY CHARACTERISTICS
According to the National Restaurant Association says that a total of $783 billion sales in the fast
food restaurant industry in 2016 and it accounts an of47 percent of total food industry, 4% even
for the restaurant is supported by the continued success of the Restaurant Association, according
to the food industry is U S gross domestic product at 14.4 million people in this particular
industry. The Indian food industry is also have highest market share for fast foods and according
to the recent study in India we come to know that 34.52 percent of Indian people using Fast Food
in India.
BENEFITS
The food industry there are many benefits to owning a franchise is one of the biggest benefits to
reduce the risk of food franchise.
❖ It Saves time
❖ It Offers tasty and healthy options for the peoples
❖ Increases job opportunities for the people
❖ Causes overweightness
❖ Persuaded to labour issues

5
1.3 COMPANY PROFILE
Jubilant Foodworks(JBL) is the Indian company grounded in Noida city Uttar Pradesh, which is
holding Master Franchise for Domino’s Pizza in the 4 Asian countries like India, Srilanka, Nepal
and Bangladesh, and also Jubilant Foodworks holds the Master Franchise of Dunkin’ Donuts
only in India.
The Domino’s Pizza made the company as a market leader in the segment of Pizza with the
network of 1167 Pizza Restaurants around 269 cities in the India as per the new 2018 data.
This Jubilant Foodworks is the part of Jubilant Bhartia Group(JBG).
JUBILANT
BHARTIA
Jubilant
life sciences
Jubilant
Industries
Jubilant
Foodworks
Jubilant
Energy
Jubilant
Enpro
Jubilant
Motorworks
The Jubilant Foodworks Limited Formerly known as Domino’s Pizza Limited and it has changed
its name in 2009.
In Bangalore Jubilant Foodworks set up its Regional south office where it operates and control
all the stores in south India which consists of Karnataka, Andra Pradesh, Telangana, Tamil Nadu,
Kerala from one locationand also if any employee has to join Domino’s for Bangalore Location
then they have to come for interview in Regional office and have to attend the training in the
same location.

6
HISTORY
The Domino’s Pizza Indian Private Ltd was established on 26 March 1995 and began its
operations in 1996. Domino's Pizza India Private Ltd., change its name in 2009 as jubilant
Foodworks Limited.
The company established its first restaurant in January 1996 at New Delhi, India and it is the
first Domino's Pizza outlet. And on February 24, 2011, jubilant Foodworks also got the brand
American coffee house chain Dunkin' Donuts in the United States to operate the master franchise
of it in India with the agreement. Jubilant Foodworks in Connaught place in April 2012, New
Delhi, India opened the first Dunkin' Donuts stores. And in addition, jubilant Foodworks is the
"emerging food group of the year", in economic times by 2012.
GROWTH
In 1996 Opened initial Domino’s Pizza outlet at New Delhi, India.
In 2001 Reached its target of opening 100 outlets over the Country.
In 2009 The Domino’s Pizza Indian Private, the company changed its name to
Jubilant Foodworks limited.
In 2010 Company got listed in Indian stock exchange. [NSE code: JUBLFOOD]
[BSC code:533155]
In 2012 Reached 500 outlets across the country.
In 2014 Domino’s India became the largest business outside USA for Domino’s.
In 2016 Opened 1000 outlets across the country.

7
1.4 PROMOTERS
Number Name of the Promoters
1 Jubilant Consumer Private Limited
2 Hari Shankar Bhartia
3 Shyam Sunder Bhartia
4 KavitaBhartia
5 Jubilant Securities Private Limited
6 Jubilant Capital Private Limited
7 ShobhanaBhartia
8 JE Energy VenturesPrivate Limited
1.5 VISION, MISSION, AND QUALITY POLICY OF THE COMPANY
The Vision
To create sustainable value in social environmental spheres and enhance relationships with
the community, customers, employees and all other stakeholders.
The Mission
1. To maintain the high standards in international chain of pizza delivery and to provide the
experience of an outstanding products with excellent customer service.
2. Serving People, the best and best pizza in the world.
Quality Policy
• The Domino’s maintains a quality management team and the team makes sure to full fill
basic set for the operations of Domino’s.
• The Domino’s also having a relationship with some of the scientific communities to
provide best and safe food among the people.
• The HACCP (Hazard analysis and critical control point) is the system applied to use for
the Domino’s and this system ensures that the people are getting good food items with
high nutrition’s.

8
• Domino’s has introduced Antibiotic policy for all chicken and its products.
• And for the first time they are coming with the new technique for maintain the quality of
the pizzas i.e they are introducing a smart cameras to ensure the quality of the pizzas, the
system tells us the pizza is high quality or low so by using this system they are trying to
introduce the automated quality control system.
1.6 PRODUCTS AND SERVICES
Products
• Veg Pizza
• Non-Veg Pizza
• Pizza Mania
• Pizza Add-Ons
• Delicious Sides
• Speciality Chicken
• Refreshing Beverages

9
SERVICES
• Dining
• Fastest home delivery
Fastest Home Delivery: Domino’s provides 30 minutes Delivery Service to its customers
and by this unique facility Domino’s enjoys its competitive advantage over other competitors.
This 30-minute delivery is based on the following (Heightened Time Awareness-HTA)
• Order Taking - 1 minute
• Pizza Making - 1 minute
• Oven baking - 6 minutes
• Pizza Cutting - 15 seconds
Total= 8 minutes 15 seconds
Therefore, it takes 10 minutes to deliver Pizza to customer in the store and 30 minutes to deliver
the Pizza at the customer’s Residency. For Safe Delivery Person the allowed driving speed is 40
KMPH.
1.7 AREAS OF OPERATION
Domino’s restaurants are operated all over the world and with respect to India it operates all over
India with more than 1200 stores in 264 Indian cities and its Headquarters is located in Noida,
Utter Pradesh.
The Domino’s Pizza is into the business of Quick Service Restaurants and the cities which is are
mainly the Domino’s is operating are,
• Bangalore
• Hyderabad
• Mumbai
• Kolkata
• Chennai
• Delhi
• Ahmadabad and
• All over India.

10
1.8 INFRASTRUCTURE FACILITIES
OPEN KITCHEN:This is one ofmain infrastructure facility in the domino’s restaurants and this
gives lot of benefits to both the company and the customers and those benefits are,
1) By its Theatrics’ view customers can see the making pizza’s in the restaurants.
2) Confidence in hygiene and sanitations, i.e customers gets the confidence on the Domino’s
by seeing how they are hygiene in the work and the brand value of the company also
increases.
FLEXIBLE SEATING: This is another infrastructure facility provided by the dominos to its
customers who visits to the restaurant.
1) High stools for the youngsters.
2) Soft sitting for seniors.
3) Long table for families.
HERITAGE WALL: The walls in the stores are painted with attractive colours and also those
walls indicate more than 60 years old brand.
1.9 COMPETITORS INFORMATION
Pizza Hut: This is the most Important Competitors of Dominos Pizza around the world. This is
the one Competitor that directly competes with Dominos brand in the Quick Service Restaurant
industry. Pizza Hut is also a specialized in take-out and delivering of Pizza to the customer’s
location. In the year 2016 Pizza Hut has been selected as the best pizza in the world. It makes
same type of products which is producing by Domino’s Pizza.
McDonald’s: M C Donald’s is another largest Domino Pizza’s competitor. It started in the
year 1940; it was founded by two brothers. The McDonald’s opened its first barbeque food outlet
in California, US. McDonald’s hadbecome household name in most of the locations across the
world and its annual earnings 7.8 billon dollars per annum. It covers the 18% of market share in
fast food industry.
BURGER KING :Burger King fast-food joint around the world operated by the United States
based company on a chain of fast-food service food outlets. It has become private company in
2010 purchased by an investment company 3G capital and was owned by the company after it.

11
Burger King is planning a huge expansion of its burgers are loved by the people. Therefore,
Burger King rise has Domino's Pizza’s one of the competitors.
SUBWAY: Peter Buck and DeLucain established subway in 1965 and it is the one of the fast
food restaurant chain in the United States. It is used to provide customers with the brand is
famous for its long submarine sandwiches 6-inch feet. It is a brand worthy of fast-food
restaurants.
1.10 SWOT ANALYSIS
STRENGTHS
• Well-known brand image of Domino’s Pizza’s and its advertising strategies with the
taglines like “30 minutes Nahi to free”.
• An Extensive Network with 9000 and more franchise and also companiesoutlets spread
over more than 60 countries in the world.
• Fast service and Deep menu.
• Less cost alternatives.
• Healthier Alternatives.
• The Efficient Supply Chain.
WEAKNESS
• Difficulty in handling the operations.
• Quality control becomes too challenging.
• Reducing sales in mature market.
• High employee turnover.
• Lesser number of eaters.
OPPORTUNITIES
• Market Expansion.
• Health Conscious eatables.
12
• Increasing customers in urban areas.
THREATS
• Huge competition.
• Change in customer needs.
• Cost Factor.
1.11 FUTURE GROWTH AND PROSPECTS
1. Dominos is planning to open more than 150 outlets around Asia pacific region which is
including more than 15 outlets in Malaysiaat the year end.
2. Company is also planning for acquiring master franchise to open up its food chain
business in Hongkong, SriLanka and Bangladesh where it has still not yet haveits
presence.
3. The company also planning to use a Remote-control helicopter, the DomiCopter to
deliver Pizza. This DomiCopters are set to take the pizza delivery system to another level
and hits the world by storm.
4. For the first time they are coming with the new technique for maintain the quality of the
pizzas i.e they are introducing a smart camera to ensure the quality of the pizzas, the
system tells us the pizza is high quality or low so by using this system they are trying to
introduce the automated quality control system.
5. The organization is planning to decrease the timing of delivery from 30 minutes to 20
minutes and by this service differentiation strategy the company is going to achieve more
revenue and profit.
6. They are also planning to introduce new products for Indian market based on the culture
of India.

13
1.12 FINANCIAL STATEMENTS
THE PROFIT AND LOSS ACCOUNT
(Rupees in Lakhs)
Serial
Number Particulars
Year ended
March 31,2018
Year ended
March 31,2017
1 Income Revenue from Operations 2,98,044.06 2,54,606.98 Other Income 2,272.39 1,448.49 Total Income 3,00,316.45 2,56,055.47
2 Expenses
Consumed Cost of Raw materials 66,017.54 53,619.08
Purchase of traded goods 9,271.25 8,027.80
Change in inventory’s Raw material in
progress and traded goods -146.09 -49.42
Employee benefit expenses 60,410.54 58,453.82
Depreciation and amortization expenses 15,587.75 15,115.25
Rent 31,569.36 29,864.20 Other expenses 86,282.26 80,032.60 Total expense 2,68,992.61 2,45,063
3 Profit before the exceptional items
and tax 31,323.84 10,992.14
The Exceptional items - 1,217.00
4 Profit before the tax 31,323.84 9,775.14
5 Tax expenses Current tax 12,214.47 3,395.14 Deferred tax (credit) -153.11 -345.45 Total tax expenses 10,683.36 3,049.69
6 Profit for the year 20,640.48 6,725.45
7 Other comprehensive income
Items that are reclassified to profit or
loss 285.29 -60.58
Income tax relating to the items that are
not been reclassified to profit and loss
account
-98.54 -20.97
Total comprehensive income of the year
, net value of tax 20,827.23 6,643.90
8 Earing per equity share Basic (in rupees) 31.29 10.21 Diluted(in rupees) 31.29 10.20

14
BALANCE SHEET AS AT THE 31 MARCH 2018 (Rupees in lacks)
Serial
Number Particulars
Year ended
March 31,2018
Year ended
March 31,2017
1 Assets
Non-Current Assets
Equipment, Property and Plant 73,204.36 73,378.77
work-in-progressCapital 1,093.09 5,981.72
Investment Property 3.41 3.41
Other Intangible Assets 3,586.29 4,443.75
Intangible Assets which under development 180.78 -
Financial Assets 17,043.85 15,163.66
Assets for the current tax(net) 1,213.56 810.62
Other non-current assets 10,338.04 10,079.42
Total Non-current assets 1,06,663.38 1,09,861.35
Current Assets
Inventories 6,258.62 5,872.32
Financial Assets 43,872.42 17,474.51
Total Current Assets 50,131.04 23,346.83
Total Assets 1,56,794.42 1,33,208.18
2 Equity and Liabilities
Equity
Equity share capital 6,598.42 6,594.91
Other Equity 97,792.22 78,623.87
Total Equity 1,04,390.67 85,218.78
Liabilities
Non-current Liabilities
Security Deposits 50.00 36.50
Deferred Tax Liabilities (Net) 5,498.39 6,930.96
Total Non-current Liabilities 5,548.39 6,967.46
Current Liabilities
Financial Liabilities
1) Trade Payables 38,682.70 31,173.77
2) Other Payables 607.44 487.36
3) Other Financial Liabilities 2,643.04 3,495.70
Short Term Provisions 1,625.46 2,006.12
Other Current Liabilities 3,296.72 3,858.99
Total Current Liabilities 46,855.36 41,021.94
Total Equity and Liabilities 1,56,794.42 1,33,208.18

15
RATIO ANALYSIS
The analysis/Examination of financial statements with the help of Ratio’s is called as Ratio
analysis. This analysis tool is widely used tool for financial analysis of the data. This analysis
provides overall information about financial stability of the company.
1. Current Ratio: This Ratio measures the short-term financial position or in other words we
can say it measures the companies short term solvency.
The formula to calculate Current Ratio is,
Current ratio=Current Asset/Current Liability
Year Current Asset Current Liability
Current ratio
2017 23,346.83 41,021.94 0.57:1
2018 50,131.04 46,855.36 1.07:1
Analysis and Interpretation:In the year 2016-17 current ratio is 0.82 which is not a healthy
ratio for the firm and as the liquidity position of the firm is low. In the year 2017-18 the current
ratio increased to 1.07 it is a very good sign to the firm, where the liquidity position of the firm
increased to a good extent. The standard current ratio is 2:1 which says that current assets should
be always twice of current liability.
2. Net Profit Ratio: It indicates the effectiveness of the management. This Ratio majorly
indicates the overall measures of the firm’s productivity.
The formula to calculate this ratio is,
Net Profit Ratio=Net Profit After tax/Sales * 100
Year Net Profit After tax Sales Net Profit Ratio
2017 6,643.90 2,54,606.98 2.6
2018 20,827.23 2,98,044.06 6.98
16
Analysis and Interpretation:In the year 2016-17 the net profit ratio is 2.6, whereas the net
profit was increased to 6.98 in the year 2017-18. This shows the earning profit of the company
highly increasing.
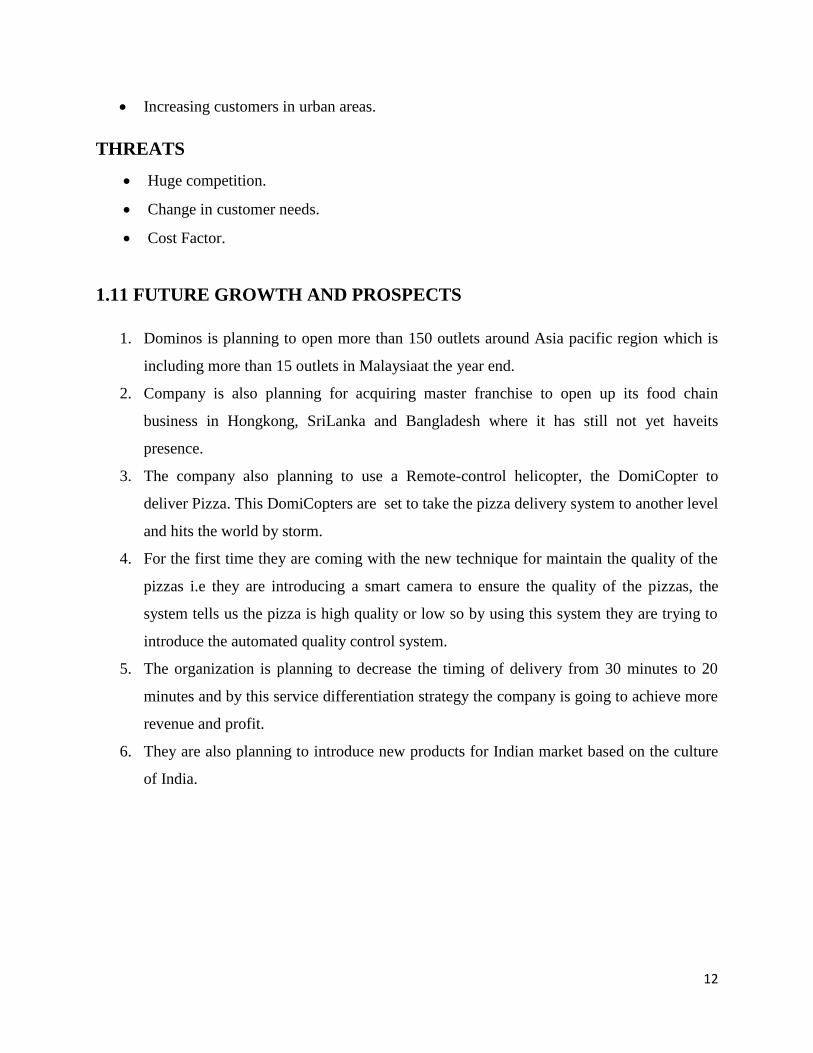
3. Fixed Assets Turnover Ratio:The particular Ratio analysis evaluates how well the
company is using its assets to yield income.
The formula to calculate this Ratio,
Fixed Assets Turnover Ratio=Net sales/Fixed assets
Year Sales Fixed assets Net Profit Ratio
2017 2,54,606.98 79363.9 3.21
2018 2,98,044.06 74297.55 4.01
Analysis and Interpretation: In the year 2016-17 the asset turnover ratio is 3.21 and it is goes
on increasing in the year 2017-18.In the year 2016-17 the usage of asset was less with the less
asset turnover ratio. In next year the assets turnover ratio keep increasing. Therefore, higher the
ratio is higher the utilisation of fixed assets, lower value the ratio indicates underutilisation of the
fixed assets.

17
CHAPTER 2
CONCEPTIONAL BACKGROUND AND LITERATUTE REVIEW
2.1 THEORITICAL BACKGROUND OF THE STUDY
The project report titled “A STUDY ON EMPLOYEE PERCEPTION TOWARDS
ORGANIZATIONAL CULTURE” most of the part undergoes for understanding the
representative recognition with respect to different authoritative angles and furthermore to think
about the level of worker fulfillment which depends on their discernment.
Perception of the employees plays a significant role in organization; the overall organization
depends on their employee’s performance so the perception of the employees has to be positive
towards the organization in terms of culture and other factors.
This specific venture helps in understanding what really representatives see about the
administration and furthermore relationship among the laborer’s and different elements affecting
worker recognition.
Observations change from one employee to another employee. The distinctive employees see the
diverse things about a similar circumstance. In case if we allocate more than what actually
resides more part to distinctive implications to what we really see. The implications can change
for someone in Particulars situations and one may change their point of view in different
situation and time.
Definition of the Perception:
“Observation is the way toward choosing, sorting out and deciphering or the joining intending to
occasions occurring in condition”.
-L.M PRASAD
As indicated by Mr. Joseph Reitz, “Observation incorporates each one of those procedures by
which an individual gets data about his condition – seeing, hearing, feeling, tasting and noticing.
The investigation of these unending procedures demonstrates that their working is influenced by

18
the three classes of factors that is the – the articles or occasions being seen, nature in which the
observation happens and individual doing”.
This present review will investigate the worker recognition.
The examination can be exceptionally utilized as a part of request to assess the impacts on
administrative and representative view of the worker connection to his atmosphere. In this both
quality and bearing of the union impacts will vary as indicated by the way of a union and
business reactions to it. The business and representative impression of the atmosphere
additionally contrast as indicated by the real quality of the union participation. The workers view
on atmosphere is additionally an unequivocally connected with the representative’s impression
of union adequacy.
Definition of Organizational Culture
“Organization culture encompasses values, behaviors that contribute to the unique Psychological
and Social environment of the Business”.
Cultural is based on attitudes, beliefs, customs, and sharing have been developed during this time
and are considered valid based on the written and unwritten rules.
The hierarchical culture is made out of few attributes which will go in the need from high to low.
Each association has a nearby unmistakable incentive for each of these attributes which
characterizes the associations novel culture. The qualities for examples,
1. Risk Orientation,
2. Precision Orientation,
3. Achievement Orientation,
4. Fairness Orientation,
5. collaboration Orientation,
6. Competitive Orientation etc,
These are the principle and essential qualities which will go under the authoritative social
review. Each of these attributes will reveals to us that how it will affect on the individual worker
in an association.

19
2.2 REVIEW OF LITERATURE
Author Title of the
article
Findings Gap
identification
Maheshari,&Vohra
(2015)
Identifying the
critical HR
practices and
policies
impacting
employee
perception
“When the economy improves,
almost in all the aspects of the
workplace improve. The employee’s
requirement also increases as per the
improving conditions of the
economy.What makes generally
employee’s want to come to work
every day is weather employee feels
appreciated by his or her company.
Understanding this we can increase
the satisfaction of the employee’s
and also reduce the employee
turnover in the company.
Author
considered but
not explainedhow
to improve the
economic
conditions of the
employee and
destressed the
compensation and
benefits factor.
Lee, E.M. Park
(2013)
Employees
perception of
CSR activities
The expanding rate of work,
accounts developing separation
between the esteem individuals and
make them to discriminate others
who have the same work type. Treat
your employee’s somewhat as
Entrepreneur. And assign specific
work for the individual employee
and also arrange hierarchical
manager.
The author
considered lees
number of
cultural factors
for his study.
Prottas, D.J (2013) Relationships The clear and standard ingredients of What author

20
among
employee
perception of
their managers
behavioral
integrity
a good strategic plan will always
include fully elaborated goals, a
prioritized list of changes with the
associated timeframes. The benefits
and the costs to manifest the goals
and an executable roadmap that
outlines a detail path to achieving
the strategy. The lees obvious
ingredients are those that make up a
plan digestible by a culture.
specified are all
may fall under an
umbrella of
organization
change
management and
it has not
included unity
amongst
leadership, Stake
holder
engagement.
Hu, Q., Diney
(2012)
Managing the
employees
compliance
with all
security
policies
The author states that “It is very
important that the President and
CEO of the company Walk around
and talks with the people. You set
the pace; you set the culture and
everything that falls into place”. It is
a matter of educating an each and
every employee. They can read a lot
of books about the leadership, what
works for other people could work
for them, what could not work for
them it may depend and establishing
the environment according the
perception of employees brings an
organization to achieve its goals
effectively.
Author not
specified specific
training programs
to increase the
positive
perception
towards
organizational
culture.
Hussain, T & Asif
(2012)
Is employee
turnover
intentionally
Every organization must have an
approach to draw in and hold the
individuals, or it will stop to exist. In
Author was
concentrated only
on individuals but

21
driven by
organizational
commitment
and perceived
organizational
support
the same time it must oblige
individuals conduct, or it won’t have
the capacity to complete anything.
Each difficulty with the enquiries
has to be handled with the specific
procedure and it should not include
any unfair activity in solving the
conflicts of the company. The open
door for the general population
asking is to, that they outline the
inquiries into something littler and
feasible.
the organization
like domino’s
can’t concentrate
on every
individual and if
something has to
be done than it
should take every
one in the
organization into
consideration.
Men, L. R. (2012) Employee
engagement
and
Perceived
organizational
reputation
According to the author, while
business has been attempting to
recover its balance, representative
fulfilment with the worklife adjusts
has been taking a major hit. It was
down 6 per cent broadly and 5 per
cent in the focal Indiana, as it
indicated by the working
environment elements. But luckily,
it’s not the main component being a
top working environment, to
discover that what is important to
most of the employees. So the author
trying to say the work life balance is
more important for the employee’s.
Author stressed
more on
perception on
work life balance
rather than
perception
towards
organizational
culture.
Ansari, N G
(2011)
Employees
perceptions on
HRM practices.
The author addresses that he come
up with the idea is to take those
certificate is being offered and
integrate that training into the
Author just said if
the training has
provided to the
employees then

22
traditional college degree training to
create a more thoroughly trained
workforce that cannot only operate
equipment, but diagnose production
problems and find out the ways to
reduce waste. Find faster
manufacturing times and the ways to
have greater output of higher quality
products. By proper training
provided before they enter into the
organization then those employees
will learn the organization culture
and adopt that to them after joining
the organization so there will be less
chances of dis-satisfaction due to
organization culture.
its enough to get
work from the
employees but
before that we
should
understand the
perception of
employees.
Yavuz, M, (2010) The effects of
perception on
organizational
culture and
justice
Addresses that the individual
sentiments towards a worker play a
particularly essential part in framing
work connections than it is normally
recognize. We always need to work
with individuals that make us feel
great to associate with them.
Associations have generally centered
around capabilities and thinking
capacity about their staff.
The author writes
that “Regardless
of how
experienced or
profitable
somebody is,
whether they are
mean to
individuals, they
are practically
pointless. I can’t
work with
somebody who is
not decent. He is
not stressed on

23
experience of
employees.
Schein, E H (2010) Organization
culture and
leadership.
The author said that the culture is
not only a handbook of the
guidelines, but a flesh and blood
policy that gets enacted to every day
to give a life. The commitment to
develop the organizational culture is
also a commitment for growth.
There is no such standing rule when
it comes to the organizations. In
each and every organization things
are changing every day. So the every
employee has to make sure that they
understood what it is going to mean
for their clients and provide
solutions for the same.
Author
considered
organizational
culture factors
and he left
considered
whether they are
satisfied with to
meet clients
everyday or not.
Kuvaas, B (2008) An exploration
howan
employee and
organization
relation affects
the linkage
between
perception of
HR practices.
The author addresses that when a
representative fell like they don’t
have a place, they won’t just fell
segregated and rejected but also their
headway and eventually their goals
also influenced. In some cases the
workers will feel distinctive, and this
condition influences the organization
negatively and this also leads to
more employee turnover in the
organization.
Author dint
provide proper
solution to the
problem but he
identified what is
the problem.
Bell, E E (2008) Discovering
employee
perception on
The organizational culture is
underlying belief, norms, values and
the assumptions that govern and
The author
suggests to use
effective

24
the work
environment.
determine the behaviors of managers
and the employees. The strategy and
the culture were to provide the
bestbuilding plan which is focusing
on the quality service. The strategy
and the culture could be combined to
make the new company work
effectively and efficiently this
combination plays an important role
while achieving the organizational
goal effectively and efficiently.
strategies but dint
involved the
works in
management
decision.
Wall, E A (2007) The effects of
physical
environment
and employees
behavior.
Adults with the special needs receive
job placements assistance and the
support to succeed and excel in their
job. The mission is to provide the
opportunities needed to facilitate
with each individuals achievement
to their maximum potential.
Author
emphasized more
on adults and
gave less
importance to
experienced
people.
Deymock, D,
McCarthy (2006)
Employee
perceptions
From the author research it shows
that the perceptions of inequity are
associated with the lower job
satisfaction, Performance,
Engagement and mental health as
well as the higher employee
turnover. I do believe that each and
every employee deserves fair
treatment and equal treatment,
because the perceptions of
unfairness can lead to the negative
changes in the attitude or behavior.
It is not just about money, it should
Author not
considered and
explained to
improve the
economic
conditions of the
employee and
destressed the
compensation and
benefits factor.

25
come from non-financial rewards. It
is very important to maintain a pulse
on employee’s feelings by holding
the focus groups or administering
surveys.
Ismail, M, (2005) Learning
creative climate
and
organizational
factors.
The author addresses that every
change is very much part of the life,
and a change in the workplace is
something which is we constantly
adopt to, because of some of the area
changes are totally beyond our
control, it will become critical that
we learn to embrace the change in a
healthy and proactive way. The
change in the business world is
obviously directed by many
variables like Globalization,
Technological advancement,
Economic shifts, Maturation of the
markets and the intense competition.
Author
considered
external factors to
organization for
his research and
he less
concentrated on
internal factors of
the organization.
Al-mailam, F F
(2004)
Employee
perception of
leadership
efficiency in
public.
Author suggests employer’s to be
aware of the physical sensations
such as teeth, racing heart,
irritability and trouble shooting. Get
a better understanding of employee’s
perception of the stressful situations.
It will always be an uncertainty
future of employee’s job so author
referred employers to look into
exercise or other relaxation
Stress is a huge
component and
employers have
to understand the
perception of the
employees and
they have to
handle the stress
in an efficient
way.

26
techniques such as yoga, meditation
and massage therapy. Stress is a
common factor among all
employees.
Connelly, C E &
Kevin (2003)
Predictors of
employee
perceptions of
knowledge
sharing culture.
According to this review tells that
the twenty-four per cent say’s that
the organization beat manager
values and their work, while another
14 per cent didn’t know about it. In
some of these occurrences the
workers discernment may be
founded on the reality.
Administrators regularly get
hindered in their everyday work, and
furthermore don’t generally take the
time or try to show gratefulness for
the commitments of their
persevering representatives.
Not emphasized
on the worker
participation in
management.
O’Toole, M (2002) The
relationship
between
employee
perception and
organization
culture.
The author addresses that the pay
which is paid to employee’s must be
based on the current job
descriptions, job specification and
internal pay equity issues addressed
through a job evaluation process,
such that the point factor analysis,
which will helps the employer to set
and defend pay which is based on
education, experience,
accountability for confidential
information, supervision, job
hazards and other factors common to
Identified why
employees are
dis-satisfied due
to pay or other
issues and author
dint say how to
solve those
problems in an
effective way.

27
jobs. Even employees are much
competitively paid in the labour
market; they may be able to dis-
satisfy when looking within their
own company.
Jo hatch & Schultz
(1997)
Relations
between
organization
culture.
As per the today’s innovative work
force, the days are simply paying to
the people for the 40 hours of the
work is rare. Employees are required
to understand there organizational
processes accurately. Identifying the
candidate’s strengths and
capabilities we should that is
employer should place the employee
to the position which he is fit and
placement of the employee plays an
important role in the organization,
the culture of the organization
should be rigid. Organizations can
recruit and hire the most talented
people however, if they are assigned
that the wrong roles, chances for
success are limited. The alignment
between employees, departments
and corporate strategy should be
properly aligned.
Stressed on what
employer has to
do to improve the
employee’s
perception and
dis stressed on
more elements of
organizational
culture.
Schein E H (1990) Organizational
culture
In every organization the owners or
the managers will be under the more
pressure from all the sides. Above of
them will be organizations of the
authority which have influence over
Author dint
involved what
about the people
who they hired,
lined up like a

28
them like banks, boards or family
members, below of them hide the
day-to-day uncertainties like
weather, recession and road
construction.
spear, ready to
thrust forward
into the pushback
marketplace in
organization.
Cangelosi V E
(1988)
Effect of open
versus closed
physical
environment on
employee
perception and
attitude.
The author mainly addresses that the
companies will provide flexible
schedule, child care services as more
women juggle between work and
family responsibilities, they are
eagerly looking for help from their
employers to find a balance
withtheir work life and personal life.
The wider variety of benefits helps
employers to attract and retain
employees, and also boosts workers’
productivity and mainly increases
morale of all the employees also and
this strengthens the company.
Author not
considered and
explained to
improve the
economic
conditions of the
employee and
destressed the
compensation and
benefits factor.

29
CHAPTER3
RESEARCH DESIGNN
3.1 PROBLEM STATEMENT
In every organization employeeare the main assets of the organization and if employees are
unhappy with the culture of the organization then that may lead to inconsistency in employee
performance and which also affects to achieve the organization goal effectively.
If employees are feeling negative about the organization culture and if they never share those
feeling with others then it will be a biggest problem for the company and they keep on carrying
that feeling with them that may leads to ineffective work from the employees and also increases
the employee turnover ratio.
3.2 NEED FOR THE STUDY
Understanding employee’s perception towards the organization is very important to any of the
organization and the organization like Domino’s has to study about the perception of the
employees because the organization is suffering from the problem of high rate of employee
turnover ratio which indirectly affects the organization growth and also increases the
Recruitment cost to the company and which will also consume valuable time of the company. So
this perception of the employees towards the organizational culture has to be studied.
3.3 OBJECTIVES OF THE STUDY
1. To understand the various cultural factors affecting the perception.
2. To assess the relationship between perception and factors of organization culture.
3. To analyse the gender on perception.
30
3.4 SCOPE OF THE STUDY
1. The study is done w.r.t two stores ofDomino’sand in a particular location in Bangaloreso
we can get more précised data and the accuracy if the research done in large scale.study
helps to understand how management can assess the effectiveness of motivational
practices in the organization
2. By taking more perceptional factors into consideration we can analyse organizational
culture and by this we can able to enhance the professional perception of the employees.
3. We can also include how to turn out the employee negative behaviour into positive by
assessing the perception of the employees towards the organizational culture.
4. The research is only for a period of 6 weeks and only for the Jubilant Foodworks
company and this can’t compare to other organization employee’s perception.
3.5 RESEARCH METHODOLOGY
Research Design
This Particulars study involves Descriptive research which involves in gathering of primary data.
Data sources and Sample Design
Primary Data: The data for the study is gathered through an undisguised Questionnaire.
Secondary Data: The secondary data is gathered from Journals, Articles, and Reports etc.
Sampling Design: The sample is chosen out of populationusing simple random sampling.
Sample Size: The sampling size is 30.
3.6 HYPOTHESIS
1. The association between cultural factors and perception are significant and positive.
2. The perception varies amongst males and females.

31
3.7 LIMITATIONS
• The research is only for a period of 6 weeks.
• The research is restricted for only for one company culture.
• Fear of the employees to provide the responses.
• Sample size is restricted to only 30 due to non-availability of permission to take up study
in other Business unites of the company.

32
CHAPTER 4
DATA ANALYSIS AND INTERPRETATION
Table 1 – Table showing employees proud to be associated with jubilant food works.
Particulars Respondents Percentage(%)
Strongly Disagree(1) 0 0
Disagree(2) 1 3
Neutral(3) 5 17
Agree(4) 6 20
Strongly Agree(5) 18 60
ANALYSIS: From the above table we can observe that 60% of employees are Strongly Agree,
20% percent of employees agree, 17% of people are Neutral in their response and 3% of people
Disagree about the Particulars research question.
INTERPRETATION: As per the analysis data we can say that the majority of the employees
are Proud to be associated with the company. They agree and happy to work at Jubilant
Foodworks ltd.
0
10
20
30
40
50
60
70
Strongly Disagree Disagree Neutral Agree Strongly Agree
4.1.1 Employees proud to be asssiated with Jubilant foodworks

33
Table 2 – Table showing the employees in organization are getting enough resources to
complete their job effectively.
Particulars Respondents Percentage(%)
Strongly Disagree(1) 0 0
Disagree(2) 1 3
Neutral(3) 3 10
Agree(4) 11 37
Strongly Agree(5) 15 50
ANALYSIS:From the above table we can observe that 50% of employees are Strongly Agree(5),
37% percent of employees agree, 10% of people are Neutral in their response and 3% of people
Disagree about the Particulars research question.
INTERPRETATION: As per the analysis data we can say that the majority of the employees
are accepting the employees in organization are getting enough resources to complete their job
effectively.The employees never wait for the resources because the resources are already
available prior to the Particulars work.
0
10
20
30
40
50
60
Strongly Disagree Disagree Neutral Agree Strongly Agree
4.2.1 The employees in organization are getting enough resources
to complete their job effectively.
34
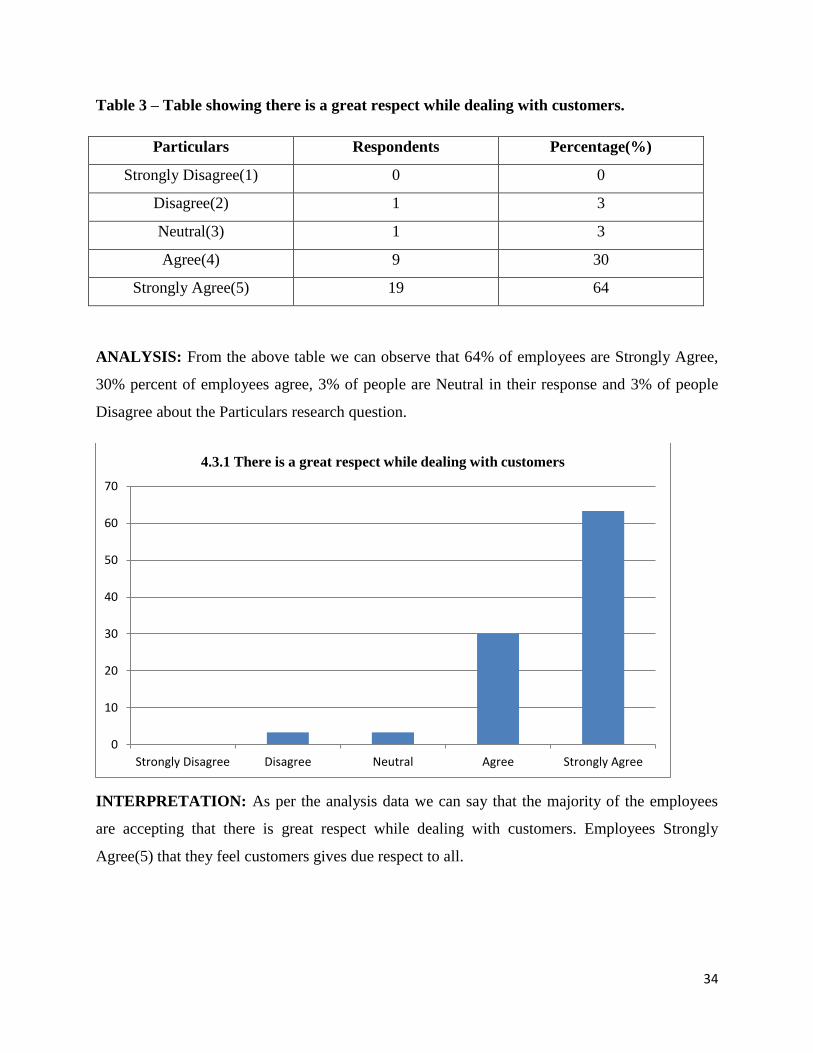
Table 3 – Table showing there is a great respect while dealing with customers.
Particulars Respondents Percentage(%)
Strongly Disagree(1) 0 0
Disagree(2) 1 3
Neutral(3) 1 3
Agree(4) 9 30
Strongly Agree(5) 19 64
ANALYSIS: From the above table we can observe that 64% of employees are Strongly Agree,
30% percent of employees agree, 3% of people are Neutral in their response and 3% of people
Disagree about the Particulars research question.
INTERPRETATION: As per the analysis data we can say that the majority of the employees
are accepting that there is great respect while dealing with customers. Employees Strongly
Agree(5) that they feel customers gives due respect to all.
0
10
20
30
40
50
60
70
Strongly Disagree Disagree Neutral Agree Strongly Agree
4.3.1 There is a great respect while dealing with customers

35
Table 4 –Table showing the employeesgenerally aware ofSOP/Policies/Process within
organization.
Particulars Respondents Percentage(%)
Strongly Disagree(1) 0 0
Disagree(2) 2 7
Neutral(3) 7 23
Agree(4) 10 33
Strongly Agree(5) 11 37
ANALYSIS: From the above table we can observe that 37% of employees are Strongly Agree,
33% percent of employees agree, 23% of people are Neutral in their response and 7% of people
Disagree about the Particulars research question.
INTERPRETATION: As per the analysis data we can say that the majority of the employees
are accepting that they are generally aware of happenings within department. It means that there
is coordination and sharing of information amongst employees and managers. This shows
openness and transparency in the system.
0
5
10
15
20
25
30
35
40
Strongly Disagree Disagree Neutral Agree Strongly Agree
4.4.1 The employees generally aware of SOP/Policies/process
within organization.

36
Table 5 – Table showing there will be great level of appreciation for your work
performance.
Particulars Respondents Percentage(%)
Strongly Disagree(1) 1 3
Disagree(2) 1 3
Neutral(3) 2 7
Agree(4) 14 47
Strongly Agree(5) 12 40
ANALYSIS: From the above table we can observe that 40% of employees are Strongly Agree,
47% percent of employees agree, 7% of people are Neutral in their response and 7% of people
Disagree about the Particulars research question.
INTERPRETATION: As per the analysis data we can say that the majority of the employees
are accepting that there will be great level of appreciation for your work performance. The
employee’s performance was recognized and appreciated by their immediate boss at workplace.
It means that there is a support and encouragement.
0
5
10
15
20
25
30
35
40
45
50
Strongly Disagree Disagree Neutral Agree Strongly Agree
4.5.1 There will be great level of appreciation for your work
performance.

37
Table 6 – Table showing there is good team work in my section/Department.
Particulars Respondents Percentage(%)
Strongly Disagree(1) 0 0
Disagree(2) 1 3
Neutral(3) 2 7
Agree(4) 9 30
Strongly Agree(5) 18 60
ANALYSIS: From the above table we can observe that 60% of employees are Strongly Agree,
30% percent of employees agree, 7% of people are Neutral in their response and 3% of people
Disagree about the Particulars research question.
INTERPRETATION: As per the analysis data we can say that the majority of the employees
are accepting that there is good team work in my section/Department. It shows the presence of
synergy amongst employees. Team work always helps to motivate to better performance and
coordination.
0
10
20
30
40
50
60
70
Strongly Disagree Disagree Neutral Agree Strongly Agree
4.6.1 There is good team work in my section/Department.

38
Table 7 – Table showing the domino’s maintaining good discipline in work place.
Particulars Respondents Percentage(%)
Strongly Disagree(1) 0 0
Disagree(2) 1 3
Neutral(3) 1 3
Agree(4) 3 10
Strongly Agree(5) 25 84
ANALYSIS:From the above table we can observe that 84% of employees are Strongly Agree,
10% percent of employees agree, 3% of people are Neutral in their response and 3% of people
Disagree about the Particulars research question.
INTERPRETATION: As per the analysis data we can say that the majority of the employees
are accepting that Domino’s maintaining good discipline in work place. It means the employees
follows the code of conduct, norms and abide to the organization value system. The employees
know the disciplinary system followed at organization.
0
10
20
30
40
50
60
70
80
90
Strongly Disagree Disagree Neutral Agree Strongly Agree
4.7.1 The domino’s maintaining good discipline in work place.
.

39
Table 8 – Table showing the people in Domino’s mutually respect each other’s.
Particulars Respondents Percentage(%)
Strongly Disagree(1) 0 0
Disagree(2) 1 3
Neutral(3) 1 3
Agree(4) 15 50
Strongly Agree(5) 13 44
ANALYSIS:From the above table we can observe that 44% of employees are Strongly Agree,
50% percent of employees agree, 3% of people are Neutral in their response and 3% of people
Disagree about the Particulars research question.
INTERPRETATION: As per the analysis data we can say that the majority of the employees
are accepting that the people in Domino’s mutually respect each other’s. This proves that is the
mutual respect amongst employees in Domino’s is high.
0
10
20
30
40
50
60
Strongly Disagree Disagree Neutral Agree Strongly Agree
4.8.1 The people in Domino’s mutually respect each other’s.

40
Table 9 – Table showing People at Domino’s are proactive and quickly adapt to changes.
Particulars Respondents Percentage(%)
Strongly Disagree(1) 0 0
Disagree(2) 2 7
Neutral(3) 4 13
Agree(4) 6 20
Strongly Agree(5) 18 60
ANALYSIS:From the above table we can observe that 60% of employees are Strongly Agree,
20% percent of employees agree, 13% of people are Neutral in their response and 7% of people
Disagree about the Particulars research question.
INTERPRETATION: As per the analysis data we can say that the majority of the employees
are accepting that the people at Domino’s are proactive and quickly adapt to changes. The
employee’s at Domino’s are able to quickly adapt to changes which is implemented at
workplace.
0
10
20
30
40
50
60
70
Strongly Disagree Disagree Neutral Agree Strongly Agree
4.9.1 People at Domino’s are proactive and quickly adapt to changes.

41
Table 10 – Table showing there is a high level of trust among everyone in the organization.
Particulars Respondents Percentage(%)
Strongly Disagree(1) 1 3
Disagree(2) 1 3
Neutral(3) 2 7
Agree(4) 11 37
Strongly Agree(5) 15 50
ANALYSIS:From the above table we can observe that 50% of employees are Strongly Agree,
37% percent of employees agree, 7% of people are Neutral in their response and 7% of people
Disagree about the Particulars research question.
INTERPRETATION: As per the analysis data we can say that the majority of the employees
are accepting that the people at Domino’s have high level of trust amongst everyone in the
organization. Employees are trustable and reliable at Domino’s.
0
10
20
30
40
50
60
Strongly Disagree Disagree Neutral Agree Strongly Agree
4.10.1 There is a high level of trust among everyone in the organization.

42
Table 11 – Table showing the compensation provided by the Domino’s is satisfying.
Particulars Respondents Percentage(%)
Highly Dis- Satisfied(1) 1 3
Dis-Satisfied(2) 3 10
Neutral(3) 4 13
Satisfied(4) 6 20
Highly Satisfied(5) 16 54
ANALYSIS:From the above table we can observe that 54% of employees are Highly Satisfied,
20% percent of employees are satisfied, 13% of people are Neutral in their response and 13% of
peoples are Dis-satisfied about the Particulars research question.
INTERPRETATION: As per the analysis data we can say that the majority of the employees
are accepting that the compensation provided by the Domino’s is satisfying. The Domino’s pay
package is comparatively high and satisfying.
0
10
20
30
40
50
60
Highly Dis-Satisfied
Dis-Satisfied Neutral Satisfied Highly Satisfied
4.11.1 The Compensation provided by the Domino’s is satisfying.

43
Table 12 – Table showing the training provided by the Domino’s is sufficient to work
effectively in workplace.
Particulars Respondents Percentage(%)
Strongly Disagree(1) 0 0
Disagree(2) 1 3
Neutral(3) 1 3
Agree(4) 13 43
Strongly Agree(5) 15 51
ANALYSIS:From the above table we can observe that 51% of employees are Strongly Agree,
43% percent of employees agree, 3% of people are Neutral in their response and 7% of people
Disagree about the Particulars research question.
INTERPRETATION: As per the analysis data we can say that the majority of the employees
are accepting that the training provided by the Domino’s is sufficient to work effectively in
workplace. At Domino’s, HR identifies training requirement and gives training accordingly. The
employees feel that training provided is according to expectation and sufficient to work
effectively at workplace.
0
10
20
30
40
50
60
Strongly Disagree Disagree Neutral Agree Strongly Agree
4.12.1 The training provided by the Domino’s is sufficient to work
effectively in workplace.

44
Table 13 – Table showing the benefits provided by the company are satisfying.
Particulars Respondents Percentage(%)
Highly Dis- Satisfied(1) 1 3
Dis-Satisfied(2) 1 3
Neutral(3) 1 3
Satisfied(4) 10 33
Highly satisfied(5) 17 58
ANALYSIS:From the above table we can observe that 58% of employees are Highly Satisfied,
33% percent of employees are satisfied, 3% of people are Neutral in their response and 7% of
peoples are Dis-Satisfied about the Particulars research question.
INTERPRETATION: As per the analysis data we can say that the majority of the employees
are accepting that the benefits provided by the company are satisfying. The benefits provided by
Domino’s are satisfying and according to the expectation of the employees.
0
10
20
30
40
50
60
Highly Dis-Satisfied
Dis-Satisfied Neutral Satisfied Highly Satisfied
4.13.1 The benefits provided by the company are satisfying.

45
Table 14 – Table showing the policies and the organization structure / Hierarchy in the
organization has been clearly defined.
Particulars Respondents Percentage(%)
Strongly Disagree(1) 0 0
Disagree(2) 1 3
Neutral(3) 2 7
Agree(4) 12 40
Strongly Agree(5) 15 50
ANALYSIS:From the above table we can observe that 50% of employees are Strongly Agree,
40% percent of employees agree, 7% of people are Neutral in their response and 3% of people
Disagree about the Particulars research question.
INTERPRETATION: As per the analysis data we can say that the majority of the employees
are accepting that the policies and the organization structure / Hierarchy in the organization have
been clearly defined.This shows openness and transparency in the system.
0
10
20
30
40
50
60
Strongly Disagree Disagree Neutral Agree Strongly Agree
4.14.1 The policies and the organization structure / Hierarchy in the
organization have been clearly defined.

46
Table 15 – Table showing that, in the organization peoples are encouraged for innovative
approaches in problem solving.
Particulars Respondents Percentage(%)
Strongly Disagree(1) 0 0
Disagree(2) 1 3
Neutral(3) 2 7
Agree(4) 8 27
Strongly Agree(5) 19 63
ANALYSIS:From the above table we can observe that 63% of employees are Strongly Agree,
27% percent of employees agree,7% of people are Neutral in their response and 3% of people
Disagree about the Particulars research question.
INTERPRETATION: As per the analysis data we can say that the majority of the employees
are accepting that in the organization peoples are encouraged for innovative approaches in
problem solving. This tells us that the management always encouraged to come up with
innovative approaches in problem solving.
0
10
20
30
40
50
60
70
Strongly Disagree Disagree Neutral Agree Strongly Agree
4.15.1 In the organization peoples are encouraged for innovative
approaches in problem solving.

47
Table 16 – Table showing that, in our organization the decisions are made by keeping in
mind that good of the employees and society.
Particulars Respondents Percentage(%)
Strongly Disagree(1) 0 0
Disagree(2) 1 3
Neutral(3) 1 3
Agree(4) 15 50
Strongly Agree(5) 13 44
ANALYSIS:From the above table we can observe that 43% of employees are Strongly Agree,
50% percent of employees agree, 3% of people are Neutral in their response and 3% of people
Disagree about the Particulars research question.
INTERPRETATION: As per the analysis data we can say that the majority of the employees
are accepting that in our organization the decisions are made by keeping in mind that good of the
employees and society. Organization always takes the decision in favor of employees this shows
the concern of employer on employees.
0
10
20
30
40
50
60
Strongly Disagree Disagree Neutral Agree Strongly Agree
4.16.1 In our organization the decisions are made by keeping in mind
that good of the employees and society.

48
Table 17 – Table showingtop level management safeguards its employees at risky
situations.
Particulars Respondents Percentage(%)
Strongly Disagree(1) 0 0
Disagree(2) 1 3
Neutral(3) 2 7
Agree(4) 6 20
Strongly Agree(5) 21 70
ANALYSIS:From the above table we can observe that 70% of employees are Strongly Agree,
20% percent of employees agree, 7% of people are Neutral in their response and 3% of people
Disagree about the Particulars research question.
INTERPRETATION: As per the analysis data we can say that the majority of the employees
are accepting that the top level management safeguards its employees at risky situations. This
shows the attitude of organization that it always helps to the employee if he is in any of office or
personal problem.
0
10
20
30
40
50
60
70
80
Strongly Disagree Disagree Neutral Agree Strongly Agree
4.17.1 Top level management safeguards its employees at risky
situations.

49
Table 18 – Table showing People in our organization will give more ideas, information,
feedback on customers, products, services etc.
Particulars Respondents Percentage(%)
Strongly Disagree(1) 0 0
Disagree(2) 1 3
Neutral(3) 2 7
Agree(4) 7 23
Strongly Agree(5) 20 67
ANALYSIS:From the above table we can observe that 67% of employees are Strongly Agree(5),
23% percent of employees agree, 7% of people are Neutral in their response and 3% of people
Disagree about the Particulars research question.
INTERPRETATION: As per the analysis data we can say that the majority of the employees
are accepting that the people in our organization will give more ideas, information, feedback on
customers, products, services etc. This tells us that the organization is not following democratic
leadership approach in the organization.
0
10
20
30
40
50
60
70
Strongly Disagree Disagree Neutral Agree Strongly Agree
4.18.1 People in our organization will give more ideas, information,
feedback on customers, products, services etc.

50
Table 19– Table showing in our organization people take the initiatives and also preventive
actions on most of the organization matters.
Particulars Respondents Percentage(%)
Strongly Disagree(1) 0 0
Disagree(2) 2 7
Neutral(3) 4 13
Agree(4) 9 30
Strongly Agree(5) 15 50
ANALYSIS:From the above table we can observe that 50% of employees are Strongly Agree,
30% percent of employees agree, 13% of people are Neutral in their response and 7% of people
Disagree about the Particulars research question.
INTERPRETATION: As per the analysis data we can say that the majority of the employees
are accepting that the people in our organization people take the initiatives and also preventive
actions on most of the organization matters. The employees themselves take the preventative
actions on the conflict.
0
10
20
30
40
50
60
Strongly Disagree Disagree Neutral Agree Strongly Agree
4.19.1 In our organization people take the initiatives and also preventive
actions on most of the organization matters.
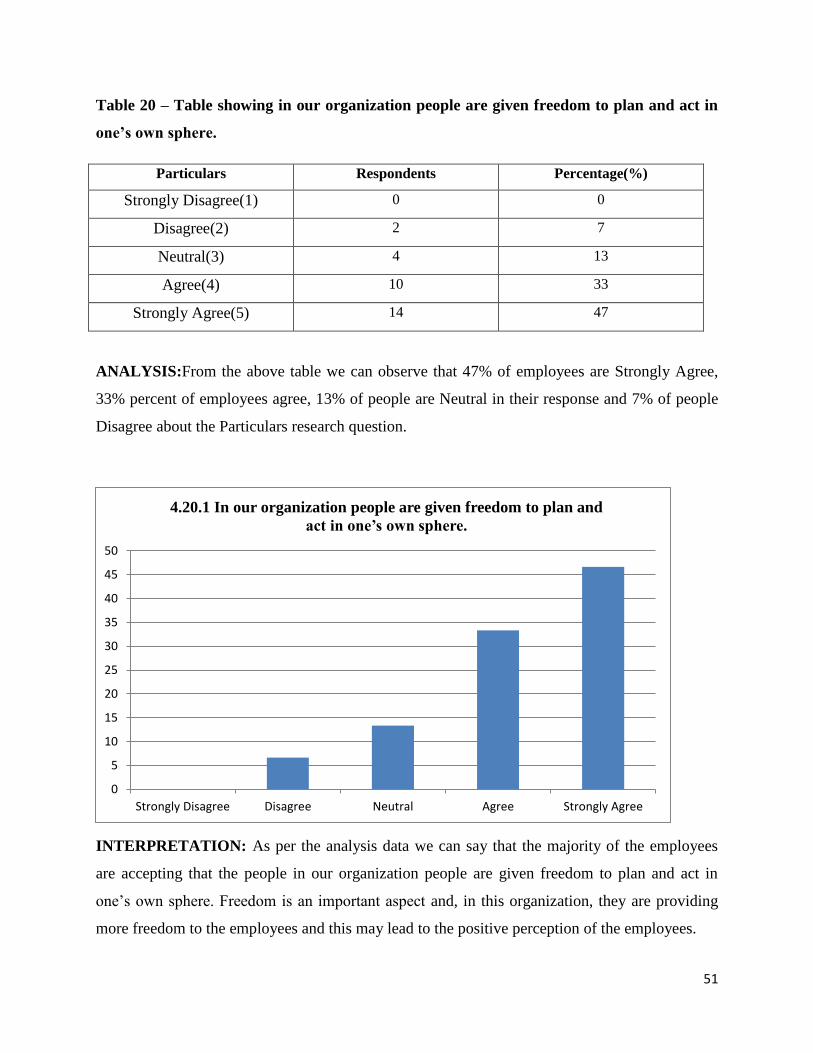
51
Table 20 – Table showing in our organization people are given freedom to plan and act in
one’s own sphere.
Particulars Respondents Percentage(%)
Strongly Disagree(1) 0 0
Disagree(2) 2 7
Neutral(3) 4 13
Agree(4) 10 33
Strongly Agree(5) 14 47
ANALYSIS:From the above table we can observe that 47% of employees are Strongly Agree,
33% percent of employees agree, 13% of people are Neutral in their response and 7% of people
Disagree about the Particulars research question.
INTERPRETATION: As per the analysis data we can say that the majority of the employees
are accepting that the people in our organization people are given freedom to plan and act in
one’s own sphere. Freedom is an important aspect and, in this organization, they are providing
more freedom to the employees and this may lead to the positive perception of the employees.
0
5
10
15
20
25
30
35
40
45
50
Strongly Disagree Disagree Neutral Agree Strongly Agree
4.20.1 In our organization people are given freedom to plan and
act in one’s own sphere.

52
OBJECTIVE 1: To understand the various cultural factors affecting the Perception.
MEAN AND STANDARD DEVIATION OF PERCEPTION AND
ORGANIZATIONAL CULTURE FACTORS
SL
NO
Factors of
organizational culture
Mean Standard Deviation
1
Respect
4.53
0.73
2
Team work
4.47
0.78
3
Discipline
4.73
0.69
4
Mutual Trust
4.26
0.98
5
Compensation
4.10
1.18
6
Training
4.40
0.72
7
Transparency
4.36
0.76
8
Encouragement
4.50
0.78
9
Safety
4.57
0.77
10
Freedom
4.20
0.92
4.21 Table showing mean and standard deviation of perception and organizational culture factors
Interpretation: Major contributor for developing positive perception organizational culture
is Discipline and Safety factors. The Mean value of Discipline factor is 4.73 this has highest
Mean value comparing to other factors Mean value and Safety factor has second highest Mean
value.
By this analysed data we can say that all the factors has the mean value more than 4 so by this
we can come to a conclusion that the employees are feeling happy and satisfied to the culture
that is maintain by the organization.

53
OBJECTIVE 2: To assess the relationship between perception and factors of
organization culture.
HYPOTHESIS
The association between cultural factors and perception are significant and positive.
SL
NO
Factors of
organizational
culture
Significance
value of
Correlation
with
Perception
Pearson
Correlation
Significance
1
Respect
0.000
0.697
Significant
2
Team work
0.002
0.543
Significant
3
Discipline
0.001
0.557
Significant
4
Mutual Trust
0.016
0.437
Significant
5
Compensation
0.002
0.553
Significant
6
Training
0.000
0.621
Significant
7
Transparency
0.027
0.404
Significant
8
Encouragement
0.000
0.624
Significant
9
Safety
0.006
0.489
Significant
10
Freedom
0.000
0.620
Significant
4.22 Table showingHypothesis test of the association between cultural factors and perception are
significant and positive.

54
Interpretation
1. Respect: Respect or treatment of staff is any very important factor of organizational culture
and this plays a major role in knowing the perception of the employee w.r.t how he perceives
that is in a positive manner or negative. By above analysis we found that the correlation
between perceptions of the employee’s w.r.t organizational culture Factor is highly correlated
and they are Significant because the correlation between those two are near to 100 percent to
each other so hypothesis H1 should be accepted because the relation is Significant in nature.
2. Team work: It shows the presence of synergy amongst employees. Team work always
helps to motivate to better performance and coordination.By above analysis we found that the
correlation between perceptions of the employee’s w.r.t organizational culture Factor is
highly correlated and they are Significant because the correlation between those two are near
to 100 percent to each other so hypothesis H1 should be accepted because the relation is
Significant in nature.
3. Discipline: It means the employees follows the code of conduct, norms and abide to the
organization value system. The employees know the disciplinary system followed at
organization and By above analysis we found that the correlation between perceptions of the
employee’s w.r.t organizational culture Factor is highly correlated and they are Significant
because the correlation between those two are near to 100 percent to each other so hypothesis
H1 should be accepted because the relation is Significant in nature.
4. Mutual Trust: It is the factor that should be positively present in any of the organization
and employees are trustable and reliable at Domino’s.By above analysis we found that
thecorrelation between perceptions of the employee’s w.r.t organizational culture Factor is
correlated and they are Significant because the correlation between those two are near to 100
percent to each other so hypothesis H1 should be accepted because the relation is Significant
in nature.
5. Compensation: This is also a cultural factor because every company follows different
pay scales to pay for the employees so every company have different culture in paying the
salary to the employees, we should take this factor also into consideration. By above analysis
we found that the correlation between perceptions of the employee’s w.r.t organizational
culture Factor is correlated and they are Significant because the correlation between those

55
two are near to 100 percent to each other so hypothesis H1 should be accepted because the
relation is Significant in nature.
6. Training: HR identifies training requirement and gives training accordingly. The
employees feel that training provided is according to expectation and sufficient to work
effectively at workplace. The correlation between perceptions of the employee’s w.r.t
organizational culture Factor is highly correlated and they are Significant because the
correlation between those two are near to 100 percent to each other so hypothesis H1 should
be accepted because the relation is Significant in nature.
7. Transparency: The transparency is also called as openness and this is also a factor
contributing to the culture of the organization. By above analysis we found that the
correlation between perceptions of the employee’s w.r.t organizational culture Factor is
highly correlated and they are Significant because the correlation between those two are near
to 100 percent to each other so hypothesis H1 should be accepted because the relation is
Significant in nature.
8. Encouragement: This is the main factor that holds the employees in the organization for
the longer time period. By above analysis we found that the correlation between perceptions
of the employee’s w.r.t organizational culture Factor is highly correlated and they are
Significant because the correlation between those two are near to 100 percent to each other
so hypothesis H1 should be accepted because the relation is Significant in nature.
9. Safety: The employer always has to keep safety of the employees and this this factor forms
the culture.By above analysis we found that the correlation between perceptions of the
employee’s w.r.t organizational culture Factor is correlated and they are Significant because
the correlation between those two are near to 100 percent to each other so hypothesis H1
should be accepted because the relation is Significant in nature.
10. Freedom: Freedom is an important aspect and, in this organization, they are providing
more freedom to the employees and this may lead to the positive perception of the
employees.The correlation between perceptions of the employee’s w.r.t organizational
culture Factor is highly correlated and they are Significant because the correlation between
those two are near to 100 percent to each other so hypothesis H1 should be accepted because
the relation is Significant in nature.

56
OBJECTIVE 3: To analyze the gender on perception.
HYPOTHESIS
The perception varies amongst males and females.
PERCEPTION OF EMPLOYEES BASED ON GENDER
Independent Sample T Test:
Group Statistics
Gender N
Respondents
Mean
Value
Standard Deviation Standard Error Mean
Perception
Male 18 4.2222 1.00326 .23647
Female 12 4.5833 .66856 .19300
Independent Samples Test
Levene's Test for Equality of Variances t-test for
Equality of
Means
F Sig. t
Perception
Equal variances assumed 3.935 .057 -1.092
Equal variances not assumed -1.183
4.23 Table showing Hypothesis test of the perception varies amongst males and females.

57
The variation amongst males and females are analyzed using independent sample t test. Above
Table depicts the Levene’s significant value. Significant value is 0.057 which is greater then to
0.05. It means there is no much variance difference w.r.t perception amongst males and females.
The magnitude of t value is less much less than zero so we can so we can say that there is no
much significant difference between male and female perception towards organizational culture.
Interpretation: According to the data availed by the questionnaire and after analyzing that
questionnaire we got the mean value of male employees has 4.22 for out of 5 and for female we
got 4.58 as mean value, this value indicate that the female employees have more positive
perception about the organization and they feel proud to work at Domino’s then the male
employees. This also proves that the male employees are also positive about the organization
while comparing to female employees. So, the perception of the male employees can to be
increased to better organizational growth by explaining the importance of organization culture
through training.

58
CHAPTER 5
FINDINGS, CONCLUSION AND SUGGESTIONS
5.1 FINDINGS
Based on the analyzed data we can say that the employees who are working in Domino’s have
positive perception on the organization culture of Domino’s and also we can say that by this
positive perception the employees are working effectively and the organization achieving its
goal efficiently. The correlation between the organizational culture factors and the perceptional
factor are highly correlated with each other, and also the Mean values of all the organizational
cultural factors like Respect, Team work, Discipline, Mutual trust, Compensation, Training,
Transparency, Encouragement, Safety and Freedom all this factorshave average Mean value
above 4.35 (Maximum Mean of 5) this shows the employees of the organization have positive
perception towards organization.
5.2 SUGGESTIONS
• In the organization i observed that the employee turnover in Domino’s is very high and i
suggest the company to work on that i.e the company has to make the strategies to control
the employee turnover.
• As per findings the company has to implement these strategies to resolve the problem of
employee turnover.
1. The organization has to use Lead policy of compensation.
2. Conduct exit interviews to know the problem and try to solve those problems and that
may decrease employee turnover.
3. In selection process select only the candidates who can work for long period.
• As per findings the Mean value for compensation, Mutual trust and Freedom factors have
4.10, 4.26 and 4.2 respectively so the company has to take care of all 3 factors into
consideration and try to solve problems regarding those factors.

59
5.3 CONCLUSION
The project is a unique experience and gave me a good opportunity to learn and explore myself
and also to understand a various practical aspects of human resource management. The Jubilant
Foodworks is a large organization and it is been in to the “quick service restaurant” business and
the employees are the main assets in this type of organizations. So the employees have to fell
positive about the organization and its culture. In initial stage of my internship i observed that the
employees working in Domino’s will not work for longer period of time due to this the
organization was conducting Selection process every week and hiring 80-100 employees every
week only for Bangalore location and every week 40-60 employees are quitting the organization.
So i thought to analyze what is the perception of the employees in the organization i.e whether
the employees felling positive or negative about the organization culture. So for this i have
researched about the topic called perception of the employees towards the organization culture
by using internet has my source, I came to know what is perception and organizational culture
and also identified the organizational culture factors for data collection.
Data has been collected using undisguised questionnaire from the employees who are working in
Domino’s. The data is analyzed and interpreted using bar graphs and using SPSS software I have
done what is the Mean, Standard Deviation and also correlation between all the organizational
culture factors with one perceptional factor.
After the results we came to the conclusion that the employees in the organization feeling
positive about the organization and by this we can come to the conclusion that the perception of
the employees towards organizational culture is positive and this is not affecting the employees
to leave the organization.

BIBILOGRAPHY
1. Maheshwari, S., & Vohra, V. (2015). Identifying critical HR practices impacting
employee perception and commitment during organizational change. Journal of
Organizational Change Management, 28(5), 872-894.
2. Lee, E. M., Park, S. Y., & Lee, H. J. (2013). Employee perception of CSR activities: Its
antecedents and consequences. Journal of business research, 66(10), 1716-1724.
3. Prottas, D. J. (2013). Relationships among employee perception of their manager’s
behavioral integrity, moral distress, and employee attitudes and well-being. Journal of
Business Ethics, 113(1), 51-60.
4. Hu, Q., Dinev, T., Hart, P., & Cooke, D. (2012). Managing employee compliance with
information security policies: The critical role of top management and organizational
culture. Decision Sciences, 43(4), 615-660.
5. Hussain, T., & Asif, S. (2012). Is employees’ turnover intention driven by organizational
commitment and perceived organizational support. Journal of quality and technology
management, 8(2), 1-10.
6. Men, L. R. (2012). CEO credibility, perceived organizational reputation, and employee
engagement. Public Relations Review, 38(1), 171-173.
7. Ansari, N. G. (2011). Employee Perception of HRM Practices: Impact on Commitment to
the Organization. South Asian Journal of Management, 18(3).
8. Yavuz, M. (2010). The effects of teachers perception of organizational justice and culture
on organizational commitment. African Journal of Business Management, 4(5), 695-701.
9. Schein, E. H. (2010). Organizational culture and leadership(Vol. 2). John Wiley & Sons.
10. Kuvaas, B. (2008). An exploration of how the employee–organization relationship affects
the linkage between perception of developmental human resource practices and employee
outcomes. Journal of Management Studies, 45(1), 1-25.
11. Bell, E. E. (2008). Exploring employee perception of the work environment along
generational lines. Performance Improvement, 47(9), 35-45.
12. Wall, E. A., & Berry, L. L. (2007). The combined effects of the physical environment
and employee behavior on customer perception of restaurant service quality. Cornell
hotel and restaurant administration quarterly, 48(1), 59-69.

13. Dymock, D., & McCarthy, C. (2006). Towards a learning organization? Employee
perceptions. The Learning Organization, 13(5), 525-537.
14. Ismail, M. (2005). Creative climate and learning organization factors: their contribution
towards innovation. Leadership & Organization Development Journal, 26(8), 639-654.
15. Al-Mailam, F. F. (2004). Transactional versus transformational style of leadership—
employee perception of leadership efficacy in public and private hospitals in
Kuwait. Quality Management in Healthcare, 13(4), 278-284.
16. Connelly, C. E., & Kevin Kelloway, E. (2003). Predictors of employees’ perceptions of
knowledge sharing cultures. Leadership & Organization Development Journal, 24(5),
294-301.
17. O'Toole, M. (2002). The relationship between employees' perceptions of safety and
organizational culture. Journal of safety research, 33(2), 231-243.
18. Jo Hatch, M., & Schultz, M. (1997). Relations between organizational culture, identity
and image. European Journal of marketing, 31(5/6), 356-365.
19. Schein, E. H. (1990). Organizational culture (Vol. 45, No. 2, p. 109). American
Psychological Association.
20. Cangelosi, V. E., & Lemoine, L. F. (1988). Effects of open versus closed physical
environment on employee perception and attitude. Social Behavior& Personality: an
international journal, 16(1).
Website: www.Jubilantfoodworks.com

ANNEXURE
Questionnaire to Asses Perception of Employees towards Organizational
Culture
DEMOGRAPHIC INFORMATION
Fill and tick the appropriate column
1. Name (optional):
2. Gender
a) Male b) Female c) Other
3. Marital status
a) Un-married b) Married c) Separated d) Widower
4. Age
a) Below 25 b) 26-30 c) 31-40 d) Above 40
5. Educational Qualification
a) 10th b) PUC/Diploma c) UG d) PG e) Professional
6. Experience
a) Below 1 Year b)1-5 Years c)5-10 Years d) Above 10 Years
QUESTIONNAIRE TO COLLECT OPINION OF EMPLOYEES
1. It is proud to be associated with the Domino’s Organization?
a) Strongly Agree(5) b) Agree(4) c) Neutral(3) d) Dis-agree(2) e) Strongly Dis-agree(1)
2. I am getting enough resources to complete my job effectively.
a) Strongly Agree(5) b) Agree(4) c) Neutral(3) d) Dis-agree(2) e) Strongly Dis-agree(1)
3. There is a great respect while dealing with customers.
a) Strongly Agree(5) b) Agree(4) c) Neutral(3) d) Dis-agree(2) e) Strongly Dis-agree(1)

4. I am generally aware of new SOP/Policies/Process within organization/department.
a) Strongly Agree(5) b) Agree(4) c) Neutral(3) d) Dis-agree(2) e) Strongly Dis-agree(1)
5. There will be great level of appreciation for your work performance.
a) Strongly Agree(5) b) Agree(4) c) Neutral(3) d) Dis-agree(2) e) Strongly Dis-agree(1)
6. There is good team work in my section/Department.
a) Strongly Agree(5) b) Agree(4) c) Neutral(3) d) Dis-agree(2) e) Strongly Dis-agree(1)
7. The domino’s maintaining good discipline in work place.
a) Strongly Agree(5) b) Agree(4) c) Neutral(3) d) Dis-agree(2) e) Strongly Dis-agree(1)
8. The people in Domino’s mutually respect each other’s.
a) Strongly Agree(5) b) Agree(4) c) Neutral(3) d) Dis-agree(2) e) Strongly Dis-agree(1)
9. People at Domino’s are proactive and quickly adapt to changes.
a) Strongly Agree(5) b) Agree(4) c) Neutral(3) d) Dis-agree(2) e) Strongly Dis-agree(1)
10. There is a high level of trust among everyone in the organization.
a) Strongly Agree(5) b) Agree(4) c) Neutral(3) d) Dis-agree(2) e) Strongly Dis-agree(1)
11. The compensation providing by the Domino’s is satisfying.
a) Highly satisfied(5) b) satisfied(4) c) Neutral(3) d) Dissatisfied(2 e) Highly Dissatisfied(1)
12. The training provided by the Domino’s is sufficient to work effectively in workplace.
a) Strongly Agree(5) b) Agree(4) c) Neutral(3) d) Dis-agree(2) e) Strongly Dis-agree(1)
13. The benefits provided by the company are satisfying.
a) Highly satisfied(5) b) satisfied(4) c) Neutral(3) d) Dissatisfied(2 e) Highly Dissatisfied(1)

14. The policies and the organization structure / Hierarchy in the organization have been clearly
defined.
a) Strongly Agree(5) b) Agree(4) c) Neutral(3) d) Dis-agree(2) e) Strongly Dis-agree(1)
15. In the organization peoples are encouraged for innovative approaches in problem solving.
a) Strongly Agree(5) b) Agree(4) c) Neutral(3) d) Dis-agree(2) e) Strongly Dis-agree(1)
16. In our organization the decisions are made by keeping in mind that good of the employees
and society.
a) Strongly Agree(5) b) Agree(4) c) Neutral(3) d) Dis-agree(2) e) Strongly Dis-agree(1)
17. Top level management safeguards its employees at risky situations.
a) Strongly Agree(5) b) Agree(4) c) Neutral(3) d) Dis-agree(2) e) Strongly Dis-agree(1)
18. People in our organization will give more ideas, information, feedback on customers,
products, services etc.
a) Strongly Agree(5) b) Agree(4) c) Neutral(3) d) Dis-agree(2) e) Strongly Dis-agree(1)
19. In our organization people take the initiatives and also preventive actions on most of the
organization matters.
a) Strongly Agree(5) b) Agree(4) c) Neutral(3) d) Dis-agree(2) e) Strongly Dis-agree(1)
20. In our organization people are given freedom to plan and act in one’s own sphere.
a) Strongly Agree(5) b) Agree(4) c) Neutral(3) d) Dis-agree(2) e) Strongly Dis-agree(1)

1+.. ACHARYA INSTITUTE OF TECHNOLOGY
DEPARTMENT OF MBA
PROJECT (17MBAPR407) -WEEKLY REPORT ACHARYA
NAME OF THE STUDENT: Manoj kumar J
INTERNAL GUIDE: Prof. Monica t/1 USN: lIAl 7MBA29
COMPANY NAME: Jubilant FoodWorks Ltd
WEEK WORK UNDERTAKEN
3rd Jan 2019 - 9th Industry Profile and Company Jan 2019 Profile
10th Jan2019 -Preparation of Research
17th Jan 2019 instrument for data collection
18th Jan 2019 -Data collection
25 th Jan 20 l!)
26th Jan 2019 - Analysis and finalization 2nd Feb 2019 of report
yd Feb 2019 - 9th
Findings and Suggestions Feb 2019
10th Feb 2019 -Conclusion and Final Report
16th Feb 2019
,', . \
CofE· al
EXTERNAL INTERNAL GUIDE GUIDE
SIGN TURE SIGNATURE
~
~
~
~ o/ ~
H Head /~
De , rv, ·. / /, c·har11a' .. , ',,,:1 of Tech no .OC 11
-. ""' 1 ~ J I , V I \. ~.- .,
_oldevanahili, Bangalore•560 10,