project proposal - world health organization
TRANSCRIPT

1
National Survey
Zimbabwe Non-Communicable Disease Risk
Factors - (ZiNCoDs)
Preliminary Report
2005
Using The WHO STEPwise Approach to Surveillance of
Non-Communicable Diseases (STEPS)
COLLABORATION OF
Ministry of Health & Child Welfare
University of Zimbabwe
World Health Organization United Nations Children’s Fund

Zimbabwe NCDs Risk factors Surveillance Report 2005
2
TABLE OF CONTENTS List of abbreviations .................................................................................................................................8 ACKNOWLEDGEMENTS......................................................................................................................9 AUTHORS .............................................................................................................................................10 Survey Team...........................................................................................................................................11 EXECUTIVE SUMMARY....................................................................................................................12 1.0: INTRODUCTION AND LITERATURE REVIEW .......................................................................14
1.1: Global perspective ................................................................................................................14 1.2 Developing countries ..................................................................................................................14 1.3 Sub-Saharan Africa....................................................................................................................14 1.4 Zimbabwe....................................................................................................................................14
1.4.1: Geographic location........................................................................................................14 1.4.2: Health services delivery..................................................................................................17 1.4.3: Disease Burden ...............................................................................................................17 1.4.4: Preliminary survey..........................................................................................................18
1.5: SIGNIFICANCE AND RATIONALE OF SURVEY ................................................................18 2.0: OBJECTIVES OF THE STUDY ...................................................................................................20
2.1: GENERAL OBJECTIVE ....................................................................................................20 2.2: SPECIFIC OBJECTIVES ...................................................................................................20
3.0: METHODOLOGY .....................................................................................................................21 3.1: Design .........................................................................................................................................21 3.2: WHO STEPwise Approach (STEPS) ......................................................................................21 3.3: Adaptation of survey methods and tools.............................................................................22 3.4: Conduct of the survey...........................................................................................................22
3.4.1: National Team ................................................................................................................22 3.4.2: Field Team......................................................................................................................22 3.4.3: Adaptation of survey tools and training manuals............................................................22 3.4.4: Training of Interviewers .................................................................................................22 3.4.5: Pilot test of field procedures ...........................................................................................23 3.4.6: Field Activities ...............................................................................................................23 3.4.7: Survey flow ....................................................................................................................24 3.4.8: Blood Sample Collection................................................................................................25
3.4.8.1: Materials-.......................................................................................................................25 3.4.8.2: Glucose: (dextrose monohydrate)- ................................................................................25 3.4.8.3: Venoject needles- ..........................................................................................................25 3.4.8.4: Venesection/venepuncture- ...........................................................................................25 3.4.8.5: Quality Control of blood Sample Collection-................................................................25
3.4.8.6: Transportation of samples- ................................................................................................26 3.4.8.7: Laboratory Procedures at the Central, Sample Receipt, Recording and Storage-..............26
3.4.8.8: Registration of Samples- ...............................................................................................26 3.4.8.9: Sample Processing and Analysis-......................................................................................26
3.5.0: Nutritional Survey (Food Frequency Questionnaire) And Fortification Rapid Assessment Tool.................................................................................................................................26 3.6.0: Measurements ....................................................................................................................27
3.6.1: Step 1: Questionnaire-based assessment:........................................................................27 3.6.2: Step 2: Physical measurements.......................................................................................27
3.6.2.1: Blood pressure ........................................................................................................27 3.6.2.2: Waist Circumference ..............................................................................................27 3.6.2.3: Hip measurement ....................................................................................................27 3.6.2.4: Height .....................................................................................................................27 3.6.2.5: Weight ....................................................................................................................27
3.6.3: Step 3: Biochemical assessment .....................................................................................27 3.6.3.1: Glucose Determination ...........................................................................................28 3.6.3.2: Serum Lipids...........................................................................................................28
3.6.3.2.1: Serum cholesterol Kit Ref 467825, Lot T501276 ..............................................28 3.6.3.2.2: Triglyceride Kit: Ref 445850, Lot T502091.......................................................28 3.6.3.2.3: HDL-cholesterol Kit, Ref 467820, Lot M504237. .............................................28
3.6.3.3: LDL-cholesterol......................................................................................................28 3.6.3.4: VLDL-Cholesterol..................................................................................................28
3.7.0: DEFINITIONS ..................................................................................................................29

Zimbabwe NCDs Risk factors Surveillance Report 2005
3
3.7.1: Overweight and Obesity .................................................................................................29 3.7.2: Central Obesity ...............................................................................................................29 3.7.3: Hypertension...................................................................................................................29 3.7.4: Diabetes and Impaired Glucose Tolerance .....................................................................29 3.7.5: Lipid Profiles ..................................................................................................................30
3.8: SAMPLING...........................................................................................................................31 3.8.1: Sample Size Determination ............................................................................................31
3.9: SAMPLING STRATEGY....................................................................................................31 3.9.1: Sampling of households..................................................................................................32 3.9.2: Sampling within households...........................................................................................32 3.9.3: Informed Consent .................................................................................................................33
4.0: DATA MANAGEMENT ................................................................................................................34 4.1: Training of data entry clerks .................................................................................................34 4.2: Data Entry for NCD, FRAT and FFQ questionnaires .........................................................34 4.3: Data Cleaning ........................................................................................................................34 4.4: Data Merging .........................................................................................................................34 4.5: Data Cleaning After Merging................................................................................................35
4.5.1: Objectives of cleaning: ...................................................................................................35 4.6: Data Analysis .........................................................................................................................35
5.0 RESULTS...................................................................................................................................36 5.1: Introduction ...........................................................................................................................36 5.2: - Response rate by province and rural/urban community.........................................................36 5.3: Demographic profile of respondents ....................................................................................38
5.3.1: Age Distribution .............................................................................................................38 5.3.2: Marital status ..................................................................................................................38 5.3.3: Educational status ...........................................................................................................38 5.3.4: Employment status .........................................................................................................38 5.3.5: Discussion of demographic profile .................................................................................38
5.4: Alcohol consumption Pattern ....................................................................................................40 5.4.1: Current alcohol consumption................................................................................................40
Overall ....................................................................................................................................................40 5.4.3: History of alcohol consumption......................................................................................43
5.5: Tobacco consumption ...............................................................................................................45 5.5.2: History of Tobacco consumption....................................................................................46
5.6: Discussion on alcohol consumption and tobacco use ..........................................................47 5.7.0: Physical Inactivity............................................................................................................49
5.7.1: Physical inactivity at work..............................................................................................49 5.7.2:- Physical inactivity at work (no vigorous activity)...............................................................51
5.7.3:- Sedentary traveling (transportation)...................................................................................53 5.7.4:- Sedentary leisure time ..........................................................................................................53 5.7.5: Discussion on physical inactivity ...........................................................................................55 5.8.0. History of Hypertension .........................................................................................................56
5.8.1: Discussion of hypertension...................................................................................................56 5.8.2: History of Diabetes mellitus .................................................................................................59
5.9.0: Physical measurements (STEP 2 OF STEPS)......................................................................61 5.9.1: Body Mass Index (BMI).......................................................................................................61 5.9.2: Overall distribution of overweight and obesity ....................................................................62 5.9.3: Overweight and obesity among males..................................................................................63 5.9.4: Overweight and obesity among females...............................................................................66
5.10.0: Waist Hip Ratio (WHR........................................................................................................67 5.11.0: Blood pressure............................................................................................................................69
5.11.1: Systolic blood pressure.........................................................................................................69 5.11.2: Diastolic blood pressure .....................................................................................................69 5.11.3: Prevalence of hypertension.................................................................................................71
5.11.3.1: For females ..................................................................................................................71 5.11.3.2:- .For males...................................................................................................................71
5.11.4: Discussion on prevalence of hypertension..........................................................................73 5.12.0: Biochemical measurements (STEP 3 of STEPS) ......................................................................75
5.12.1: Mean fasting blood sugar ...................................................................................................75 5.12.2: Prevalence of diabetes mellitus (both males and females) .................................................76

Zimbabwe NCDs Risk factors Surveillance Report 2005
4
5.12.3: Prevalence of Impaired Glucose Tolerance (IGT)..............................................................77 5.12.4: Lipid profiles for both males and females ..........................................................................81 5.12.5: Prevalence of hypercholesterolemia ...................................................................................82 5.12.6: Prevalence of abnormal LDL-Cholesterol and Triglycerides levels in both sexes .............83
6.0: DISCUSSION .................................................................................................................................87 6.1: Demographic profile ..................................................................................................................87 6.2: Lifestyle Factors .........................................................................................................................87 6.3: Anthropometric measurements ..................................................................................................87 6.5: Hypertension...............................................................................................................................87 6.6: Diabetes mellitus ........................................................................................................................88 6.7: Lipids ..........................................................................................................................................88
7.0: LIMITATIONS OF THE SURVEY...........................................................................................89 8.0: CONCLUSIONS ........................................................................................................................89 9.0: RECOMMENDATIONS............................................................................................................89 10.0: REFERENCES.......................................................................................................................90 APPENDIX: Zimbabwe Non-Communicable Disease Survey (ZiNCoDS) Questionnaire ..................92

Zimbabwe NCDs Risk factors Surveillance Report 2005
5
LIST OF TABLES Table 3.1: Body mass index was calculated as follows: weight in kg/height in square meters.29 Table 3.2: Definition of hypertension.....................................................................................................29 Table 3.3: Diabetes was defined as summarized in the table below. ................................................30 Table 3.4: Lipids profiles were defined as summarized in the table below. ..............................30 Table 3.5: Sample size estimates for different prevalences of diabetes mellitus and
hypertension..................................................................................................................................31 Table 3.6: Sampling strategy and study sites. ....................................................................................32 Table 5.1: - Distribution of respondents by province, rural/urban community and WHO STEPS.
........................................................................................................................................................37 Table 5.2: Distribution of respondents by age group and Province .................................................39 Table 5.3a: Prevalence of current alcohol consumption by province, age group and gender .......40 Table 5.3b:- Proportion of respondents who ever consumed alcohol by province, age group and
by gender .......................................................................................................................................43 Table 5.3c: Proportion of study participants ever consumed alcohol within past 12 months by
province, 44 age group and by gender......................................................................................................................44 Table 5.4a: Prevalence of tobacco use/consumption by province, age group and gender..............45 Table 5.4b: Proportion of respondents who are currently using tobacco products only (cigarettes,
cigars and pipes) by age and sex..................................................................................................46 Table 5.4c: - Proportion of respondents who reported use of tobacco products by province,
age group 47 and by gender........................................................................................................................................47 Table 5.5a): Percentage of respondents reporting physical inactivity during normal working
hours by province .........................................................................................................................50 and age group(work involving mostly sitting or standing with walking for no more than 10
minutes at a time) .........................................................................................................................50 Table 5.5b: Percentage of respondents reporting no vigorous physical activity at work by
province 51 and age group........................................................................................................................................51 Table 5.5c: Percentage of respondents reporting no vigorous physical activity at work (work
involving either sitting or standing with walking no more than 10 minutes at a time, no vigorous activity and less than 3 days of physical activity per week) by province and age group..............................................................................................................................................52
Table 5.5d: - Percentage of respondents reporting sedentary (walking or pedal cycling for less than 10 minutes) ...........................................................................................................................53
Traveling by province, sex and age group..........................................................................................53 Table 5.5e: Percentage of respondents reporting sedentary leisure time by province and age
group..............................................................................................................................................54 Table 5.6:- Reported Prevalence of hypertension by province, age group and gender ..................56 Table 5.7: Reported prevalence of diabetes by province, age group and gender............................59 Table 5 8a: Mean BMI by province, age group and gender .............................................................61 Table 5.8b: Overall Distribution of respondents on Overweight and obesity stratified by sex and
age group .......................................................................................................................................62 Table 5.8.c: Distribution of male respondents on Overweight and obesity stratified by province
and age group................................................................................................................................64 Table 5.8d: Distribution of female respondents on Overweight and obesity stratified by province
and age group................................................................................................................................65 Table 5.9: Central Obesity (WHR) by province, by age group and gender ....................................67 Table 5.10a: Mean systolic blood pressure by sex, age group and province ...................................68 Table 5.10b: Mean diastolic blood pressure by sex, age group and province .................................69 Table 5.10c: Prevalence of hypertension among females by age group and Province....................70 Table 5.10d: Prevalence of hypertension among males by age group and Province. .....................72 Table 5.11a: Mean fasting blood sugar by sex, age group and province .........................................75 Table 5.11b:- Prevalence of diabetes mellitus among males by age group and province ...............76 Table 5.11c: Prevalence of diabetes mellitus among Females by age group and province ............77 Table 5.11d: Prevalence of impaired glucose tolerance by age, sex and province ..........................78 Table 5.11e: - Mean Total cholesterol, HDL, LDL and Triglyceride among males by age group
and Province..................................................................................................................................79

Zimbabwe NCDs Risk factors Surveillance Report 2005
6
Table 5.11f: Mean Total cholesterol, HDL, LDL and Triglyceride among females by age group and Province..................................................................................................................................80
Table 5.11g: Prevalence of abnormal Cholesterol and HDL-Cholesterol among males by age group and province.......................................................................................................................82
Table 5.11h: Prevalence of abnormal cholesterol and HDL Cholesterol among females by age group and province.......................................................................................................................83
Table 5.11i: Prevalence of abnormal H-LDL-C and H-Triglycerides levels among males by age group and Province. .....................................................................................................................85
Table 5.11j:- Prevalence of abnormal lipids levels among females by age group and Province....86

Zimbabwe NCDs Risk factors Surveillance Report 2005
7
LIST OF FIGURES Figure1: Map of Africa showing the location of Zimbabwe and the bordering countries......................15 Figure 2: Map of Zimbabwe showing the 10 political administrative provinces ...................................16 Figure 5.1: - Response rate based on STEP 1 versus the intended sample size. ....................................36 Figure 5.2:- Prevalence of alcohol consumption by age group and province........................................41 Figure 5.3: - Prevalence of smoking by province and age group...........................................................45 Figure 5.4: Reported prevalence of hypertension by province and age group ......................................57 Figure 5.5:- Reported prevalence of diabetes mellitus...........................................................................60

Zimbabwe NCDs Risk factors Surveillance Report 2005
8
List of abbreviations MOHCW Ministry of Health and Child Welfare UNICEF United Na WHO World Health Organization MPH Master in Public Health PhD Doctor of Philosophy HIV Human-Immuno Deficiency Virus AIDS Acquired –Immuno-deficiency Syndrome NCDs Non-Communicable Diseases CVDs Cardiovascular Diseases BMI Body Mass Index FRAT Fortification Rapid Assessment Tool FFQ Food Frequency Questionnaire HDL-C High Density Lipoprotein-Cholesterol LDL-C Low Density Lipoprotein-Cholesterol VLDL-C Very Low Density Lipoprotein-Cholesterol QA/QC Quality Assuarance/ Quality Control PPS Probability Proportion to Size SI Systematic Interval GTT Glucose Tolerance Test

Zimbabwe NCDs Risk factors Surveillance Report 2005
9
ACKNOWLEDGEMENTS The Ministry of Health and Child Welfare, the World Health Organization, United Nations Children’s Fund, provided the funding for this survey. Consultants for this exercise were from the University of Zimbabwe, Ministry of Health and Child Welfare and United Nations Children’s Fund. The Ministry of Health and Child Welfare released personnel to serve as supervisors, team leaders, nutritionists, interviewers, laboratory scientists and drivers. We would like to thank the Ministry of Health Staff at the institutions where the survey was conducted for facilitating the identification of respondents and making available physical facilities for the survey and upkeep of staff. We would like to thank the provincial, district and municipal administrative personnel including counselors, chiefs, headmen and all those who made it possible to penetrate into their communities. Last but by no means last we are most grateful to the respondents who kindly donated their time to respond to questionnaires and undergo the procedures necessary to conduct the survey.

Zimbabwe NCDs Risk factors Surveillance Report 2005
10
AUTHORS Professor James G Hakim-MB, MMed, MScClinEpi, FRCP (Lond & Edin)-Clinician Department of Medicine & Clinical Epidemiology Resource & Training Centre College of Health Sciences University of Zimbabwe P O Box A178, Avondale, Harare Phone: 263-4-791631, Fax: 263-4-791995 E-mail: [email protected] Mrs. Nokuthula Mujuru- BSc, MPH-National Survey Coordinator Coordinator Non-Communicable Disease Non-Communicable Disease Control Unit Department of Epidemiology Ministry of Health and Child Welfare PO Box CY 1122, Causeway, Harare Tel: 263-4-798537 Fax: 263-4-793634 Email: [email protected] Professor Simbarashe Rusakaniko-BSc, Dip Med Stats, Msc Med Stats, PhD- Consultant Biostatistician Department of Community Medicine & Clinical Epidemiology Resource & Training Centre College of Health Sciences University of Zimbabwe P O Box A178, Avondale, Harare Phone: 263-4-791631, Fax: 263-4-791995 E-mail: [email protected] Professor ZAR Gomo, BSc, MSc, PhD-Laboratory Consultant Department of Chemical Pathology College of Health Sciences University of Zimbabwe P O Box A178, Avondale, Harare Phone: 263-4-791631, Fax: 263-4-791995 E-mail: [email protected] or [email protected]

Zimbabwe NCDs Risk factors Surveillance Report 2005
11
Survey Team

Zimbabwe NCDs Risk factors Surveillance Report 2005
12
EXECUTIVE SUMMARY Introduction and Background Zimbabwe like most countries in sub-Saharan Africa is gripped by the HIV/AIDS epidemic in particular but generally has a heavy burden of infectious diseases, perinatal and nutritional disorders. It is less well recognized that non-communicable diseases such as hypertension, diabetes, cancers, injuries and their risk factors are important contributors to mortality and morbidity in the country. The WHO has made a commitment to place NCDs firmly on the health agenda of developing countries through various pronouncements such as the statement of the WHO Director General in May 2000. The Zimbabwe national non-communicable disease survey was carried out in 3 of the 10 provinces of Zimbabwe. The survey was conducted in May and June 2005 with a team comprising representatives from the Ministry of Health and Child Welfare and the University of Zimbabwe. The need for the collection of high quality targeted data for planning has been recognized for both planning and surveillance purposes. Design A multistage sampling strategy with 3 stages consisting of province, district and health centre was employed. The World Health Organization STEPwise Approach (STEPS) was used as the design basis for the survey. The 3 randomly selected provinces for the survey were Mashonaland Central, Midlands and Matebeleland South. In each Province four districts were chosen and four health centres were surveyed per district. The survey comprised of individuals aged 25 years and over. Methodology Three survey teams were formed consisting of individuals from the Provincial Medical Directorates, Ministry of Health and Child Welfare and the University of Zimbabwe College of Health sciences. The three Steps of the WHO STEPwise approach were sequentially implemented after adaptation of the questionnaire and training of the team. In addition to the core and expanded modules, some items of the optional module were selected for each of the 3 steps. Biochemical analysis was performed centrally at the University of Zimbabwe, department of chemical pathology. Data entry and analysis was performed at Clinical Epidemiology Resource and Training Centre of the University of Zimbabwe. Results The survey was carried out on 3,081 respondents consisting of 1,189 from Midlands, 944 from Mashonaland Central and 948 from Matebeleland South. The majority of the respondents were female (75%). The level of education was high with 85.7% of respondents having attained at least primary education. Unemployment was generally high ranging from 18.5% to 54% in various provinces depending on the urban rural mix of the province. Current alcohol consumption was 58% in males and 13.5% in females considering all provinces. Similarly the use of any tobacco product was commonest in males with 33.4% admitting to the habit while only 5% of the older women admitted to the habit. Most of the tobacco products used were smoked substances such as cigarettes, cigars and tobacco-in-pipe. The items of the questionnaire which sought to determine the level of physical inactivity in this community was felt to be insensitive to the lifestyle of the population surveyed. Indeed the analysis showed that there was a high level of physical inactivity at work,

Zimbabwe NCDs Risk factors Surveillance Report 2005
13
transport and leisure which was clearly not to be expected in a predominantly rural and low income population. Overweight and obesity were more prevalent in females with obesity grade 2 being observed in 6 times as many females as males. Severe obesity was noted in 1.2% of females and none in males. Central obesity defined by standard male and female waist to hip ratio criteria was found in 9.5% males and 23.4% females. A history of hypertension and survey detected hypertension increased with age. In the 25-34 year old age group a history of hypertension was given in 7.9% of respondents which rose to 30.9% in the 65 years and over age group. Hypertension was diagnosed using various cutoffs, but when using the cutoff of systolic blood pressure of 140 mmHg or higher and or a diastolic blood pressure of 90 mmHg or higher we noted hypertension 23.2% of males and 29% of females. Of all respondents 2.9% males and 2.3% females were known to have diabetes mellitus. By oral glucose tolerance test (OGTT) a further 1.3% of male and female respondents were diagnosed to be diabetic. Hypercholestrolaemia using a high cutoff level of >6.5 mmol/l was noted in 3.2% males and 4.7% females. Moderate elevations of triglycerides were noted in 5.2% males and 4.2% females. Protective levels of HDL-cholestorol described as serum cholesterol >0.9 mmol/l was found in 13.7% males and 11.5% females. Conclusions There is a high prevalence of modifiable risk factors of non-communicable diseases in Zimbabwe. Alcohol consumption and tobacco consumption is high especially among males. Other lifestyle factors such as overweight and central obesity were noted to be high especially in females. The prevalence of both diagnosed and undiagnosed hypertension and diabetes mellitus was found to be high. In this survey the prevalence of abnormal lipids was noted to be significant. Recommendations Given the emerging database of a significant prevalence of non-communicable diseases risk factors in Zimbabwe a national policy framework needs to be developed to address preventive, control and palliative needs of non-communicable diseases in the country. Tools are now available to collect important risk factors of non-communicable diseases such as was used in this survey and strategies need to be put in place to conduct surveillance of these risk factors in a standardized manner.

Zimbabwe NCDs Risk factors Surveillance Report 2005
14
1.0: INTRODUCTION AND LITERATURE REVIEW 1.1: Global perspective Non-Communicable diseases (NCDs) and Mental Health are the leading causes of death worldwide, causing 60% of the global deaths and 46% of the global burden of disease (Nigel U, 2001a, WHO 2001, Murray CJL, et al., 1996). NCDs include cardiovascular disease (CVD), such as stroke, and heart attacks, diabetes, chronic lung disease, cancer, diseases of bones and joints and mental illness (Nigel U, 2001a). The biggest single killer is coronary heart disease, followed by other CVDs, cancer and chronic lung disease. Diabetes is a major contributor to deaths from CVDs, but also causes its own unique complications. Common risk factors of these NCDs include smoking, physical inactivity, obesity and diets high in saturated fat and sodium and low in fruit and vegetables intake (Nigel U, 2001a).
The emergence of NCDs as the predominant health problem in wealthy countries accompanied economic development and hence they have been referred to as diseases of the affluent (Nigel U, 2001). This is a misleading notion, which suggests that there is no problem in developing countries, which are resource constrained. The second school of thought classifies NCDs as diseases of urbanization. Studies have indicated that urbanization was directly associated with increase in NCDs Nigel U, 2001a, WHO 2000, Nigel U 2001b, Fourie J, et al, 1995). 1.2 Developing countries Many developing countries are affected by a double burden of disease; the combination of long established infectious diseases, with a rapidly growing new epidemic of chronic NCDs (WHO 2000). Until recently, risk factors such as raised blood pressure, cholesterol, tobacco use, excess alcohol consumption, obesity, and the diseases linked to them were associated with developed countries. In the World Health Report of 2002 it was shown that even in the poorest regions of the world, these common risk factors are now causing a rising burden of serious disease and untimely deaths ( WHO 2003). In Tanzania studies have indicated that in the adult population the probability of death from non-communicable diseases is higher than in developed countries Nigel U, 2001a, Setel P, et al, 2000) 1.3 Sub-Saharan Africa The burden of non-communicable diseases in the Sub-Saharan Africa countries is already substantial. They bore more than 40% of the total global burden of diseases in 1990 and patients with these conditions make significant demands on health care resources Nigel U, 2001b, Murray CJL 1996). Data from some African countries suggests that predominantly in urban settings, the prevalence of diabetes and hypertension has increased markedly over the past ten years Nigel U, 2001b). In South African townships about 8% of the populations have diabetes and between 20-33% have hypertension using the cut-of point > 160/95mmHg (Fourie J, at al, 1995). 1.4 Zimbabwe 1.4.1: Geographic location Zimbabwe lies north of the Capricorn between the Limpopo and the Zambezi rivers. It is a landlocked country, which is in the southern part of the African continent sharing
Formatted

Zimbabwe NCDs Risk factors Surveillance Report 2005
15
borders with Mozambique in the east, South Africa in the south, Botswana in the west and Zambia in the north and northwest (Figure 1).
Figure1: Map of Africa showing the location of Zimbabwe and the bordering countries.

Zimbabwe NCDs Risk factors Surveillance Report 2005
16
Figure 2: Map of Zimbabwe showing the 10 political administrative provinces Zimbabwe is divided into ten administrative provinces, two being urban and eight predominantly rural. Health administration in the two urban provinces falls under city medical directors while in the predominantly rural provinces this falls under provincial medical directors.

Zimbabwe NCDs Risk factors Surveillance Report 2005
17
1.4.2: Health services delivery Zimbabwe has a comprehensive health delivery system consisting of government and for profit and not-for-profit private institutions. In addition there is a strong traditional health system which a variety of approaches. The Ministry of Health and Child Welfare operates through a referral system with rural health clinics at the primary level progressing through district/rural/mission hospitals to provincial hospitals and finally referral hospitals at the top. Harare and Bulawayo have municipal health structures that work in conjunction with the MOH and CW structures. There is a total of 1106 health facilities in the country; governmental institutions (371), rural council (391), mission hospitals (88), municipal institutions (107), armed forces facilities (20) and private health facilities (135). 1.4.3: Disease Burden The burden of disease in Zimbabwe over the past twenty years has been dominated by the raging epidemic of HIV/AIDS. Meanwhile HIV/AIDS is the leading health concern in the country other infectious diseases, perinatal and nutritional disorders are of major importance. The increasing burden of non-communicable disease in Zimbabwe like the pattern in most developing countries adds to the continuing burden of infectious diseases, perinatal and nutritional disorders. This is a major setback for health systems that are already overburdened and under-funded (Murray and Lopez, 1997b). As in most developing countries, a comprehensive description of the magnitude of the burden of CVDs in Zimbabwe is complicated by a lack of accurate and reliable data. The available data suggest an increasing prevalence of CVD in Zimbabwe. In a survey of admissions to the medical wards at United Bulawayo Hospitals 5 of the top 10 diseases were non-communicable diseases with three of these being CVDs (Mudiayi et al, 1997). In a review of available surveillance data for Harare it was shown that persons aged 45-64 experience a relatively high mortality from hypertensive sequelae, but there was a low mortality from ischaemic heart disease (Razum, 1997). Clinical studies suggest that there is a high prevalence of hypertension and its sequalae in Zimbabwe (Matenga et al, 1986). In 100 consecutive cases of stroke studied, 53% were hypertensives, 50% of whom had defaulted treatment while the other 50% were newly diagnosed. In a study of hypertension awareness in communities with different levels of socio-economic development only 26% of hypertensives were aware of their elevated blood pressure status (Matenga et al, 1997). In another study, 66% of patients in a geriatric unit had a diagnosis of hypertension (Wilson and Nhiwatiwa, 1992). In the pilot study among factory workers, hypertension emerged as the most common CVD risk factor with a prevalence of 22% using a cut-off level of 140 and/or 90 mmHg or 14% using a higher cut-off level of 160 and/or 95 mmHg. Although the general impression is that lipid disorders are uncommon among black Zimbabweans (Castle, 1982), there is an indication that subgroups such as diabetics may have significantly elevated serum total cholesterol, LDL-cholesterol and triglyceride levels (Gomo ZAR, personal communication). Nonetheless, in the survey
Formatted
Formatted

Zimbabwe NCDs Risk factors Surveillance Report 2005
18
among factory workers the lipid profile was generally favourable with low levels of total cholesterol, LDL-cholesterol and triglycerides and protective levels of HDL-cholesterol. 1.4.4: Preliminary survey A pilot survey was carried out on a randomly selected group of factory workers in Chitungwiza, an industrial town just outside the city of Harare to determine the prevalence of diabetes and cardiovascular risk factors including (diabetes, hypertension, obesity and lipid profile). For each subject socio-demographic information was obtained, blood pressure and anthropometric measurements were made and a glucose tolerance test was performed. The study sample consisted of a total of 731 subjects (546 men and 185 women) with a mean (SD) age of 33.7 (9.7) and 33.2 (8.1) years respectively. Most subjects had a modest level of education and income was low. Hypertension emerged as the most common CVD with a prevalence of 22% using a cut-off level of 140/90 mmHg or 14% using a higher cut-off level 160/95 mmHg. Hypertension was significantly associated with several socio-demographic and biochemical variables in men, but only varied with age in women. Using body mass index 60% of women were overweight compared to 16% of men. Obesity (BMI >30) was found in 15% of women. The prevalence of diabetes was 1.8% in men and 1.6% in women. Total cholesterol and triglycerides levels were low suggesting that hyperlipidemia is not a significant risk factor in this population. Cigarette smoking was entirely in males (30% vs. 0%) and only a small proportion of women drank alcohol (6.5% women vs 64% men). This pilot study was in a selected group of relatively healthy, young factory workers. The findings cannot, therefore be extrapolated to the whole population of Zimbabwe. From these preliminary findings it was recommended that a national survey be undertaken to take into account the socio-economic and demographic diversity of the population of Zimbabwe in order to gain a better understanding of the distribution and determinants of diabetes and cardiovascular disease risk factors in Zimbabwe. This will help in planning better strategies for intervention in this emerging epidemic. 1.5: SIGNIFICANCE AND RATIONALE OF SURVEY In most developing countries including Zimbabwe diabetes and cardiovascular diseases in concert with other non-communicable diseases have not been addressed under specific control programmes such as those that exist for several infectious and communicable diseases. In the National Health Strategy for Zimbabwe, 1997-2007 this anomaly has been high-lighted. It was noted that hypertension accounted for more than 40% of total chronic repeat visits to out-patient departments in 2004 in Zimbabwe and that death from all types of cardiovascular diseases occupied the fourth place in the top 10 causes of hospital mortality in the age group five years and above. The strategic document identifies cardiovascular conditions as one of the 10 conditions needing priority action. Furthermore, there is emphasis on the education of individuals, families and communities about the risk factors of non-communicable conditions such as alcohol, smoking, excessive weight gain, etc.
Formatted

Zimbabwe NCDs Risk factors Surveillance Report 2005
19
Therefore, NCDs are now increasingly being prioritized and well collected systematic nation-wide data is required to determine the right balance of resource allocation between prevention and care. The World Health Organization has developed a standardized approach (the Stepwise approach) to enable comparisons of data across regions over time, preparing the first ever risk status for major NCDs. The risk factors surveillance approach has been sited as the most efficient mean of providing evidence based data to plan for control and reduction of the impact of these conditions (Jadue L, et al, 2000 In view of the burden of NCDs highlighted above there is need to have a systematic nation-wide data to determine the magnitude of the problem of NCDs so as to inform policy and resource allocation between prevention and care using the WHO criteria.

Zimbabwe NCDs Risk factors Surveillance Report 2005
20
2.0: OBJECTIVES OF THE STUDY 2.1: GENERAL OBJECTIVE To assess the risk factors of selected NCDs in the adult population of Zimbabwe using the WHO STEPwise approach to non-communicable diseases surveillance. 2.2: SPECIFIC OBJECTIVES 2.2.1 To assess the distribution of life-style factors (physical activity, tobacco and
alcohol use), and anthropometric measurements (body mass index and central obesity) which may impact on diabetes and cardiovascular risk factors.
2.2.2 To identify dietary practices that are risk factors for selected NCDs. 2.2.3 To determine the prevalence and determinants of hypertension 2.2.4 To determine the prevalence and determinants of diabetes. 2.2.5 To determine the prevalence and determinants of serum lipid profile

Zimbabwe NCDs Risk factors Surveillance Report 2005
21
3.0: METHODOLOGY 3.1: Design A cross-sectional survey was conducted on a sample of adult Zimbabwean population aged 25 years and above, residing in three randomly selected provinces out of the ten provinces of Zimbabwe. The selected provinces were Mashonaland Central, Midlands and Matebeleland South. The survey was conducted from May to June 2005.
3.2: WHO STEPwise Approach (STEPS) STEPS is a sequential process starting with gathering information on key risk factors by the use of questionnaires (Step 1), then moving to simple physical measurement (Step 2) and only then recommending the collection of blood samples for biochemical assessment (Step 3). (Bonita R, et al, 2002). In addition to the three steps used in risk
Key
Rural Setting Only
Urban Setting Only
Both urban and rural setting

Zimbabwe NCDs Risk factors Surveillance Report 2005
22
factor assessment the conceptual framework of STEPS also includes three modules in the assessment of each risk factor, namely core, expanded and optional. 3.3: Adaptation of survey methods and tools In this survey all the core and selected expanded and optional variables were collected. In addition a food frequency questionnaire and a UNICEF developed questionnaire, the Fortification Rapid Assessment Tool (FRAT) were administered to elicit relevant dietary information. 3.4: Conduct of the survey 3.4.1: National Team The national team consisted of representatives from the Ministry of Health and Child Welfare (1) and the University of Zimbabwe (3). The members of the team jointly developed the proposal, conducted adaptation of the survey instruments, approached stakeholders and carried out training of the survey team. The MOH&CW representative provided co-ordination of all survey activities. The University of Zimbabwe representatives provided survey design, clinical, statistical, data management and laboratory expertise. 3.4.2: Field Team Three teams selected from each of the three survey provinces carried out the survey. Each team comprised of 12 members with the following composition; 1 supervisor, 1 team leader, 7 interviewers (5 senior nurses, 2 nutritionists), 1 laboratory scientist and 2 drivers. 3.4.3: Adaptation of survey tools and training manuals An adaptation workshop was held in June 2004. The objectives of this workshop were; (a) adopt the WHO STEPwise approach and training manuals (b) map out fieldwork activities (c) identify field team members (d) define the age population profile of the selected study sites (e) translate the tools into Shona and Ndebele (the two main vernacular languages in the survey area). 3.4.4: Training of Interviewers A 5-day training workshop was held in May 2005. The objectives of the training workshop were; (a) how to gain entry into the study areas and households (b) how to conduct interviews (c) how to observe research ethics (d) how to administer questionnaires and complete laboratory forms (e) how to collect, store and transport blood samples (f) how to accurately keep records of laboratory forms and questionnaires (g) how to ensure quality control of all field processes including questionnaires, laboratory forms and specimens. Interviewers participated in mock interviews and practiced taking both physical measurements and collection of blood samples. Team supervisors were further trained on; (a) checking and correcting interview data (b) editing completed questionnaires (c) complete registration of samples before transportation (d) problem solving in the field (e) field sampling procedures and calculation of sampling intervals.
Formatted
Formatted
Formatted
Formatted

Zimbabwe NCDs Risk factors Surveillance Report 2005
23
3.4.5: Pilot test of field procedures A one day field pilot survey was conducted in both a rural and urban setting with the following objectives; (a) to assess the applicability of the questionnaires to the local communities (b) to assess reactions of the respondents to the research procedures (c) to assess whether the instructions in the field manual were relevant and straightforward (d) to estimate time needed to administer each questionnaire (e) to assess the sequencing/flow of questions (f) to check the content validity of the questions after translation. This exercise identified issues which enabled revision of critical steps in the survey procedure including changes of items in the questionnaire. 3.4.6: Field Activities Deployment of teams-Immediately after training, interviewers were divided into 3 teams of 12 each including a supervisor and a team leader. Each team was provided with a field kit that contained: a carrier bag, letters to the relevant authorities ( PMDs, Counselors, local leaders), letter to refer those with abnormal results, questionnaires (NCDs, FRAT & FFQ), consent form, forms ( registration checklist, blood collection list, households individual listing, individual household summary sheet, recruitment forms), team field log book, operational manual, pens, pencils, clipboards, notebooks, maps, somatometer for measuring height, scales for weight, tapes for girth, sphygmomanometers, blood specimen collection equipment (needles, disposal bags, syringes, swabs, tourniquets, test tubes, test tube rack, sharp containers, gloves, pipettes, cooler box, glucose powder packed in 75grams sachets, water, disposable tumblers, juice drink and bread. Each member of the research team had a Project bag and introductory letter. Each questionnaire was given a unique identifier, which appeared on the corresponding laboratory form, consent form and blood specimen tube and blood sample forms sent to the laboratory. Each Team leader/interviewer was given a unique code. Each team had 2 vehicles and drivers. One vehicle was to transport the blood specimen form the study site to the hospital laboratory and at times to the central laboratory. Team leaders were responsible for all the sampling procedures, checking completeness of questionnaires, consent forms, laboratory forms, samples collected, checking on the adequacy of samples and general entry approach to the household and community. Supervisors were responsible for the following; (a) overall coordination of their teams (b) ensure team leaders were carrying out field activities properly (c) collecting questionnaires, consent forms, laboratory forms, from the teams (d) collating all materials collected (e) logistical support to research teams. The majority of local interviewers were deployed to work in their respective districts because they were familiar with geography of the area as and the local community. This would also somewhat address the issue of accommodation of the field team.
Formatted
Formatted
Formatted

Zimbabwe NCDs Risk factors Surveillance Report 2005
24
3.4.7: Survey flow The flow of events during the collection of anthropometric data, oral glucose tolerance test performance and blood collection is shown below.
Registration (2 team)
Blood Pressure (2 team)
Fasting Blood (3 team)
Glucose Load (1 team)
Height and Weight (2 team)
Waist and Hip (2 team)
Questionnaires Demography and health History (2 team)
Dietary Data (2 team)
Two-hour Blood (3 team)
Registration Check (Check survey form)
Laboratory team (2-4 team)

Zimbabwe NCDs Risk factors Surveillance Report 2005
25
3.4.8: Blood Sample Collection 3.4.8.1: Materials- Tubes-Blood collection tubes (BD Vacutainer tubes), for glucose and lipids were obtained from BD, Belliver Industrial Estate, Plymouth PL6 7BP, UK. BD Plain tubes i.e. containing no anticoagulant were used to collect blood samples for the analysis of cholesterol, triglyceride, and HDL-cholesterol. BD Fluoride tubes were used to collect blood samples for the analysis of glucose. 3.4.8.2: Glucose: (dextrose monohydrate)- Glucose for glucose load was weighed on Mettler PB 3000 analytical balance (Mettler PB 3000, Mettler Instruments AG, CH-8606 Greifensee-Zurich Switzerland). Sachets of 75 g each were prepared for oral glucose tolerance test performance in the field. 3.4.8.3: Venoject needles- Multi sample, 21g needles (Terumo, Europe N.V. 3001 Leuven, Belgium) were used to collect blood samples from each participant.
3.4.8.4: Venesection/venepuncture- Blood samples were collected from participants by registered nurses and before blood sample collection the following were checked that 1) the participant had fasted for 10-12 hours 2) all the tubes had been labeled with the participant’s NCD number; 3) the venoject needles were not broken to show the participant that the needle being used had not been used before, 4) 75g glucose powder, was dissolved in 300ml of water, in a disposable glass; 5) a watch to check the specific time between glucose load and collection of blood after 2 hours was put in place. Fasting blood samples were collected in a fluoride tube for glucose and plain tube for lipids determinations. Immediately following collection of fasting blood sample each participant was given the glucose load. Timing was then started and another blood sample was collected after 2 hours for glucose measurement only. The team medical laboratory scientists were tasked to ensure compliance with the procedure outlined. The medical scientist checked the samples for haemolysis and clots in the fluoride tube. Samples were stored in a cooler box with a temperature controlled at around 25 degrees. The team leader further checked that the specimen details and information on the laboratory form concurred in regard to labeling, quantity and quality of sample. If satisfied the samples details were then entered in the register. The team leader would then ensure that samples were securely packed. Samples were then transported in the company of the medical laboratory scientist to the nearest hospital laboratory for separation and dispatch to the Department of Chemical Pathology at the College of Health Sciences, University of Zimbabwe. 3.4.8.5: Quality Control of blood Sample Collection- The medical laboratory scientist in conjunction with the phlebotomists (nurses) and the team leader checked that the procedures for collection of blood samples from subjects were followed as mentioned above. The bleeding nurse also ensured that each participant was in a sitting comfortable position with the hand resting on a couch before and during collection of blood. After collecting of blood the phlebotomist would carefully removed the tube and place another tube for the next sample. After taking the required samples the nurse carefully removed the venoject needle form the participant. Because the venoject blood collecting method uses the presence of a
Formatted
Formatted
Formatted
Formatted
Formatted

Zimbabwe NCDs Risk factors Surveillance Report 2005
26
vacuum in the tubes, this allows blood to flow direct into the tube minimizing haemolysis. The blood samples were stored around 25 degrees. Blood sample separation-At the provincial hospital laboratory blood samples were centrifuged at 3000 rpm for 5 minutes. Plasma for glucose and serum for lipids determination were separated and stored at –20 degrees. 3.4.8.6: Transportation of samples- Manual registration of samples was performed by the team leader and medical laboratory scientist. Blood samples were kept at 20-250C prior to transportation and during transit to the provincial hospital laboratory. Plasma and serum samples were transmitted to the central laboratory from time to time at the discretion of the field team. Transportation time from the hospital laboratory to the central laboratory was approximately 5 hours. 3.4.8.7: Laboratory Procedures at the Central, Sample Receipt, Recording and Storage- On receipt of samples, the laboratory team checked and documented the following on the laboratory form- (a) date and time of receipt (b) temperature in the boxes in which the samples were packed in (c) quality and quantity of sample (d) that information accompanying the samples tallies with the labeling of the samples. Samples were registered in the laboratory logbook, then the samples were aliquoted and stored at -20C. 3.4.8.8: Registration of Samples- Each sample was registered by name of respondent, province, district and health centre. Laboratory and NCD codes were then allocated. Samples were stored in the freezer in a predetermined order to allow for easy retrieval. 3.4.8.9: Sample Processing and Analysis- Sample logging-in, separation and storage were done by 3 MSc students under the supervision of two-clinical scientist in the department of Chemical Pathology. All laboratory determinations were performed by two Chemical Pathology lecturers/clinical scientists and 1 medical laboratory scientist working. During field work samples batched and sample analyses were performed in at the end of the field survey from July to September 2005. 3.5.0: Nutritional Survey (Food Frequency Questionnaire) And Fortification
Rapid Assessment Tool A food frequency questionnaire and a fortification rapid assessment tool were administered to obtain information related to dietary patterns and food consumption patterns for potential food vehicles for fortification respectively. Analysis of this data will be performed and reported separately.
Formatted
Formatted
Formatted
Formatted

Zimbabwe NCDs Risk factors Surveillance Report 2005
27
3.6.0: Measurements 3.6.1: Step 1: Questionnaire-based assessment: The pre-coded questionnaire consisted of the core (age, sex and education in years and current exposure to tobacco and alcohol diet and physical activity), expanded (rural/urban setting, occupation, average household income) and optional (marital status, medical and health history, past history of smoking and alcohol consumption) variables. The medical and health history component included questions on medication, cigarette use, diabetes, hypertension and other cardiovascular conditions. 3.6.2: Step 2: Physical measurements Physical assessment included blood pressure, height, weight, waist and hip circumference measurements. 3.6.2.1: Blood pressure Blood pressure measurements were using a sphygmomanometer and standardized according to recommendations of the American Heart Association [AHA, 1980]. Disappearance of Korotkoff sounds (phase V) was used to register diastolic blood pressure. Two readings were made 2 minutes apart. If the difference was 10mmHg or more between the two readings a third reading was obtained. The final reading was the average of the two readings or the nearest two readings if a third was obtained. 3.6.2.2: Waist Circumference The waist circumference was measured using a tape-measure. Measurement was made in the mid-axillary line midway between the last rib and the superior iliac crest. Duplicate measurements were made to the nearest 0.1 cm. 3.6.2.3: Hip measurement The measurement was made using a tape-measure placed horizontally at the point of maximum circumference over the buttocks. Duplicate measurements were made to the nearest 0.1 cm. 3.6.2.4: Height Height was measured with the subject standing upright against a wall on which was affixed a height measuring device. Measurements were made with the subject barefoot, standing with the back against the wall and head in the Frankfort position with heels together. The subject was asked to stretch to the fullest and then exhale. When appropriately positioned, they were asked to exhale and a mark was made to mark the height, then measurements taken to the nearest 0.1 cm. 3.6.2.5: Weight Weight measurements were taken on a pre-calibrated electronic weighing scale. The scale was calibrated daily using a known weight. Subject was weighed dressed in light clothing and barefoot. Measurements were made to the nearest 0.1 kg. 3.6.3: Step 3: Biochemical assessment At the home visit respondents were asked to fast overnight (12 hours), i.e. not to consume any food except for clear water and to report to the survey clinic the following day. At the clinic, blood was drawn for glucose (fasting and post-prandial) and lipid profiles (total cholesterol, triglyceride and high density lipoprotein cholesterol (HDL-C). Biochemical measurements were centralized at the University
Formatted
Formatted
Formatted
Formatted
Formatted
Formatted
Formatted
Formatted
Zimbabwe NCDs Risk factors Surveillance Report 2005
28
of Zimbabwe, department of Chemical Pathology. Standard methods (as described below) with appropriate QA/QC were used. Field measures to guarantee QA/QC were established (see quality control section) 3.6.3.1: Glucose Determination Glucose levels were determined on plasma samples which were obtained in a fasting and two hour post glucose load states, using the Synchron CX5 Systems Chemistry analyzer, (Beckman Coulter Inc. Fullerton, CA 92834-3100). Glucose reagent kit Ref 442640, Lot T410262 was used. The glucose assay was standardized by use of synchron AS Multi-calibrators and internal quality control of the assay was assessed by running Beckman coulter; normal and abnormal controls together with the analysis of the participants samples. For external quality controls the laboratory participates in the UK-NEQUAS scheme, which compares the laboratory’s performance in relationship to other international laboratories 3.6.3.2: Serum Lipids 3.6.3.2.1: Serum cholesterol Kit Ref 467825, Lot T501276 Serum cholesterol was measured using the Synchron CX5 Systems Chemistry analyzer, (Beckman Coulter Inc. Fullerton, CA 92834-3100). The internal quality control of the cholesterol assay was determined by the use Beckman Coulter Decision Comprehensive Chemistry Control Serum levels 1,2,and 3, normal and abnormal controls. Beckman Coulter, synchron multi-calibrator standards were used. and quality controls using Beckman Culter normal and abnormal controls. 3.6.3.2.2: Triglyceride Kit: Ref 445850, Lot T502091. The glycerol blanked (TG-B) method was used to determine serum triglyceride the Synchron CX5 Systems Chemistry analyzer, (Beckman Coulter Inc. Fullerton, CA 92834-3100). The triglyceride assay was standardized by use of a synchron multi-calibrator and Beckman Coulter Decision Comprehensive Chemistry Control Serum levels 1,2,and 3, normal and abnormal controls. 3.6.3.2.3: HDL-cholesterol Kit, Ref 467820, Lot M504237. Beckman Coulter, Synchron Systems, HDL–cholesterol Reagent kit no.467820 was used to determine HDL-c. The HDL-c assay was standardized by the HDL-c calibrator Cat # 467850. 3.6.3.3: LDL-cholesterol LDL-c was obtained by calculation using the following formula (LDL-c = Total Cholesterol (HDL-c – Triglyceride)/2 mmol (Friedwald WT, et al, 1972) 3.6.3.4: VLDL-Cholesterol VLDL-c was obtained by calculation as follows VLDL-c = Total cholesterol – (LDL-c + HDL-c).
Formatted
Formatted
Formatted
Formatted
Zimbabwe NCDs Risk factors Surveillance Report 2005
29
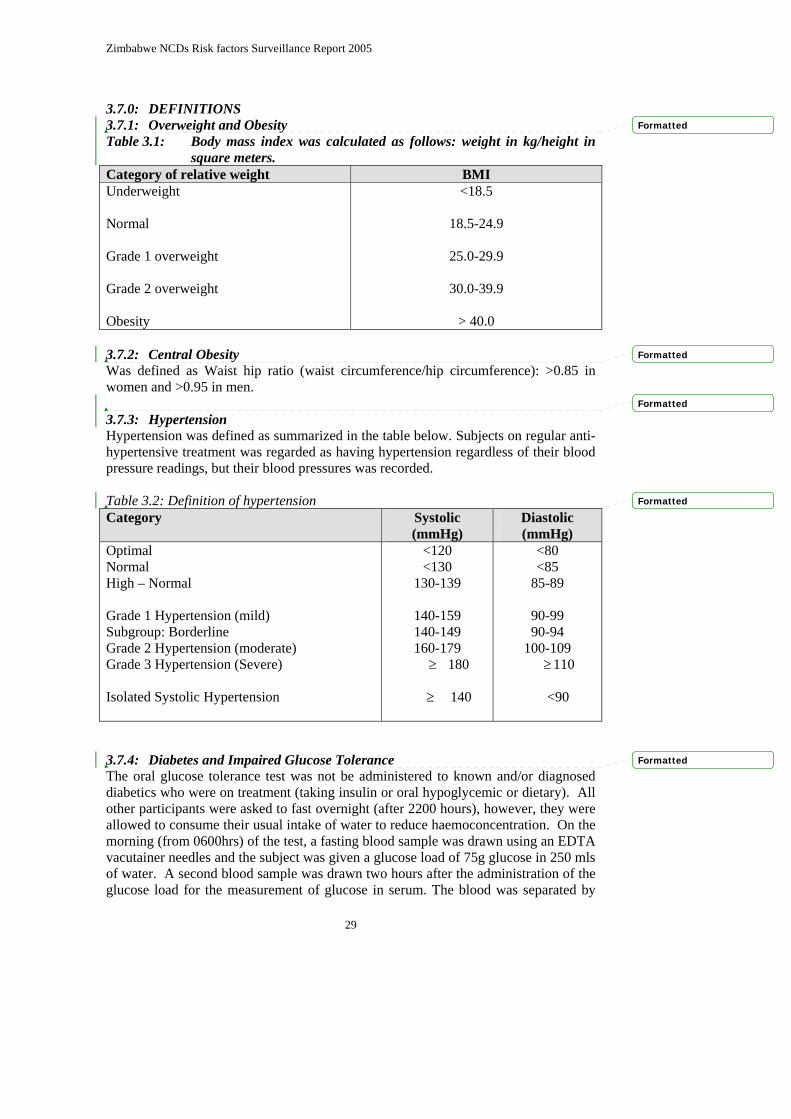
3.7.0: DEFINITIONS 3.7.1: Overweight and Obesity Table 3.1: Body mass index was calculated as follows: weight in kg/height in
square meters. Category of relative weight BMI Underweight Normal Grade 1 overweight Grade 2 overweight Obesity
<18.5
18.5-24.9
25.0-29.9
30.0-39.9
> 40.0 3.7.2: Central Obesity Was defined as Waist hip ratio (waist circumference/hip circumference): >0.85 in women and >0.95 in men. 3.7.3: Hypertension Hypertension was defined as summarized in the table below. Subjects on regular anti-hypertensive treatment was regarded as having hypertension regardless of their blood pressure readings, but their blood pressures was recorded. Table 3.2: Definition of hypertension Category Systolic
(mmHg) Diastolic (mmHg)
Optimal Normal High – Normal Grade 1 Hypertension (mild) Subgroup: Borderline Grade 2 Hypertension (moderate) Grade 3 Hypertension (Severe) Isolated Systolic Hypertension
<120 <130
130-139
140-159 140-149 160-179 ≥ 180
≥ 140
<80 <85
85-89
90-99 90-94
100-109 ≥110
<90
3.7.4: Diabetes and Impaired Glucose Tolerance The oral glucose tolerance test was not be administered to known and/or diagnosed diabetics who were on treatment (taking insulin or oral hypoglycemic or dietary). All other participants were asked to fast overnight (after 2200 hours), however, they were allowed to consume their usual intake of water to reduce haemoconcentration. On the morning (from 0600hrs) of the test, a fasting blood sample was drawn using an EDTA vacutainer needles and the subject was given a glucose load of 75g glucose in 250 mls of water. A second blood sample was drawn two hours after the administration of the glucose load for the measurement of glucose in serum. The blood was separated by
Formatted
Formatted
Formatted
Formatted
Formatted

Zimbabwe NCDs Risk factors Surveillance Report 2005
30
centrifugation within 1 hour. The diagnosis of diabetes was according to the WHO guidelines [1999] as follows: Table 3.3: Diabetes was defined as summarized in the table below. Diabetes diagnostic criteria (WHO standard Glucose level (mmol/L) Diabetes Fasting Post-prandial (GTT) Oral Impaired Glucose Tolerance Fasting Post-prandial
>7.0 >11.1
<7.8 7.8-11.1
3.7.5: Lipid Profiles Table 3.4: Lipids profiles were defined as summarized in the table below. Profile Levels(mmol/L) Total Cholestrol Level A Hypercholestolaemia Level B Hypercholestrolaemia Low HDL Cholesterol LDL Cholesterol High LDL-Cholesterol Borderline High-risk LDL-Cholesterol Triglycerides High triglycerides Borderline triglycerides
<5.2 mmol/l >6.5mmol/l
<0.9 mmol/l
>4.1 >3.4-4.0
>4.5 2.3-4.4
Formatted
Formatted

Zimbabwe NCDs Risk factors Surveillance Report 2005
31
3.8: SAMPLING 3.8.1: Sample Size Determination Epi Info version 6 was used for sample size determination. According to the 2002 national census the total Zimbabwean population aged 25 years and older was estimated to be 3.9 million. The sample size determination was based on estimates of the prevalence of diabetes and hypertension as reported in previous publications. (references) Sensitivity analysis of the various sample size estimations using the two conditions is summarized below: Table 3.5: Sample size estimates for different prevalences of diabetes mellitus
and hypertension Outcome Prevalence Estimates Sample Size
Diabetes mellitus Hypertension
4.0 - 4.8%
12.0 – 15.0%
2 304
451 The bigger sample size of 2,304 was used in this survey to achieve a power of 80% and a confidence level of 95%. Adjusting for a non-response rate of 20% (refusals, non-availability at selected households and defaulters from stages two and three), a sample size of 3000 was estimated for the survey. 3.9: SAMPLING STRATEGY Zimbabwe is divided into 10 provinces including the cities of Harare and Bulawayo considered as provinces. The provinces are further divided to give 60 districts. The Health delivery system in each province is under the control of a Provincial Medical Director except in Harare and Bulawayo where this function falls under the Medical Director of the City Health Department. The 2002 population census estimates the population of Zimbabwe to be 11.6 million. The population of Zimbabwe is socio-economically and demographically diverse. But, in general most epidemiological and sociological surveys have grouped individuals into urban, rural, farming and mining communities. The sampling strategy employed was a multistage sampling with 3 stages. Sampling was by a modification of the probability proportion to size (PPS) cluster sampling technique.
Formatted
Formatted
Formatted

Zimbabwe NCDs Risk factors Surveillance Report 2005
32
Table 3.6: Sampling strategy and study sites. Province Districts Health Centers Popln 25+ Sample Size Proportion Midlands Kwekwe urban 121134 443 0.40 Gweru Urban 103643 379 0.34 Zvishavane 46937 172 0.15 Chirumanzi 33125 121 0.11 304839 1115 0.37 Mash Central Bindura Urban 57264 210 0.23 Centenary 33005 121 0.13 Guruve 63924 234 0.26 Mazoe 93717 343 0.38 247910 907 0.30 Mat South Bulilimamangwe 172788 632 0.65 Umzingwane 19972 73 0.07 Insiza 29431 108 0.11 Gwanda Urban 4577 17 0.02 Gwanda Rural 40833 149 0.15 267601 979 0.33 Total survey population 820350 3000 1 The first stage was a random selection of three provinces from the ten provinces of Zimbabwe (see map of Zimbabwe). Within each selected province four districts were randomly selected. Within each selected district a total of four health centres were randomly selected. Communities within the catchment areas of the selected health centres were included in the sampling frame of the survey. The major divisions of the Zimbabwean community are into urban and rural communities and the main occupations groups are farming and mining. The sampling strategy ensured that there was a balance between urban and rural communities. An attempt was made to ensure that in both urban and rural communities, farming and mining communities were represented in sampled districts. Within each community a ward (rural and urban communities), a farm or a mine was selected. These were selected within the catchment area of a health centre, which was then used as the operation point for the research team. 3.9.1: Sampling of households The sampling of households in each selected ward was based on the systematic interval that was defined by the team leader based on the required sample size and the population size of the catchment area. On entering the selected ward the research team went to the furthest north-west point where there was an outstanding feature e.g. a prominent landmark like a river, a dip tank, a school, business centre, borehole etc. as their starting point. From that starting point a household was randomly selected going in an easterly direction. From that household, households were systematically sampled using a defined systematic interval (SI). The team leader defined the SI by SI = population size in the catchment area/ required sample size for the area. 3.9.2: Sampling within households After identifying the household, the head of the household or a representative described the household composition in order for the interviewer to identify the key
Formatted
Formatted
Formatted
Formatted

Zimbabwe NCDs Risk factors Surveillance Report 2005
33
person for the interview. 3.9.3: Informed Consent The research team obtained two copies of the written informed consent forms. One of the copies remained with the respondent and the research team kept the other. Step 1 and FRAT questionnaires were then administered at the household. Interviews were conducted in a manner that ensured confidentiality and privacy. Each respondent was allocated a temporary unique identifier and requested to report to the health centre for step 2 and 3 of the survey on the following day. Respondents were asked not to consume any food or drink except water for duration of 10 to 12 hours. In practice respondents were told not to eat anything following their last meal of the day (usually 7-8pm) until they report to the health centre at 6am the following day. Respondents known to be diabetic were not asked to starve because they did not undergo GTT. The sample, questionnaire and laboratory form belonging to one respondent were labeled with unique codes bearing the same identification number. Where the respondent was not at home, a note was left to request them to visit the health centre on the following day. For those who were unable to participate on the day of visit, the research team made an appointment to re-visit them at a more convenient time.
Formatted

Zimbabwe NCDs Risk factors Surveillance Report 2005
34
4.0: DATA MANAGEMENT 4.1: Training of data entry clerks Five data entry clerks were recruited and trained for one week. The selection of data entry clerks was based on their performance during previous research carried out by the MOH&CW. The training of the data entry clerks involved the following:
Familiarization with the NCD, FRAT and FFQ questionnaires. Familiarization with the data entry template. Development of codes for open-ended questions. Statistical package (EPI Info 6). Development of a data entry template using EPI6. Development of check files for each template Trial runs (mock runs) to check whether template was complete and user
friendly for data entry. Double entry (what it involves and how to do it and why it should be done). Pre-primary data cleaning (check whether denominators are tallying) of the
data entry template was done. 4.2: Data Entry for NCD, FRAT and FFQ questionnaires The questionnaires were sequentially numbered and were then divided among the five data entry clerks. Each one of the data entry clerks had a unique identifier for quality control purposes. Hence, the data was entered into five separate files using the statistical package EPI Info version 6.0. The data entry clerks inter-changed their files for double entry and validation of the data. Preliminary data cleaning was done for each of the five files. The five files were then merged to give a single file. The merged file was then transferred to STATA Version 7.0 using Stat Transfer version 5.0. 4.3: Data Cleaning A data-cleaning workshop was held with the core research team members. The objectives of the workshop were:
1. To check all data entry errors. 2. To assess any inconsistencies in data filling. 3. To assess any inconsistencies in data entry. 4. To assess completeness of the data entered.
4.4: Data Merging There were two datasets (NCD questionnaire dataset and laboratory dataset) after the data entry process. The two files were merged by joining corresponding observations from the NCD questionnaire dataset with those from the laboratory dataset into single observations using a unique identifier. The ID number was chosen as the unique identifier since it appeared in both data sets. The main aim of merging was to combine the two datasets containing information on behaviour of individuals and the NCD laboratory parameters. When the two data sets were merged, a new merge variable was created. The merge variable took values 1, 2 and 3. The values taken were interpreted as below:

Zimbabwe NCDs Risk factors Surveillance Report 2005
35
Merge variable==1 Observation appeared in the NCD questionnaire data set but a
corresponding observation was not in the laboratory data set Merge variable==2 Observation appeared in the laboratory data set but a
corresponding observation did not appear in the questionnaire data set
Merge variable==3 Observation appeared in both data sets and reflects a complete merge of the two data sets.
4.5: Data Cleaning After Merging Data cleaning involved identifying the observations where the merge variable values were either 1 or 2. Merge status for each observation was also changed after effecting any corrections. The other two unique variables that were used in the cleaning were Province, district and health centre since they also appeared in both data sets. 4.5.1: Objectives of cleaning:
1. Match common variables in both data sets and identify inconsistencies in other matching variables e.g. province, district and health centre.
2. To check for any data entry errors. 4.6: Data Analysis This preliminary stage of the survey report employed simple descriptive statistics with means, proportions and frequency distributions. 95% CI were used as a measure of precision on the estimated population parameters. In the next report further analysis will be performed as follows. T-tests will be used to compare continuous data such as systolic Blood Pressure, LDL-C HDL-C, and triglycerides between groups. Chi-square tests will be used to assess relationships between variables and analysis of variance (ANOVA) for continuous variables for comparisons across more than two groups. In situations where the normality assumptions are not met, the non-parametric equivalents of the above tests will be used (Fisher’s exact test, Kruskal Wallis test, etc). Logistic regression analysis will be employed to assess predictors of diabetes and hypertension in each particular group controlling for potential confounders.
Formatted

Zimbabwe NCDs Risk factors Surveillance Report 2005
36
5.0 RESULTS 5.1: Introduction The survey fieldwork was conducted in the months of May to July 2005 simultaneously in all the three selected provinces of Mashonaland Central, Midlands and Matebeleland South, in an adult population aged 25 years and above. A total of 3,081 respondents were surveyed and the distribution of respondents by province is summarized in Figure 1. Overall the response rate was 102% based on STEP 1 of STEPS. Response rates from Midlands and Mashonaland Central provinces were more than the targeted sample size, whilst Matebeleland South had less than the targeted sample size as indicated in Figure 1. Figure 5.1: - Response rate based on STEP 1 versus the intended sample size.
0
500
1000
1500
2000
2500
3000
3500
Tota
l sam
ple
size
Province
TargetedActual
Targeted 1115 907 979 3000
Actual 1189 944 948 3081
Midlands Mash Central Mat South Total
5.2: - Response rate by province and rural/urban community Assessment of response rate by province and by rural/urban community was also done and Table 4.1 summarizes the results.

37
Table 5.1: - Distribution of respondents by province, rural/urban community and WHO STEPS.
NCDs steps Midlands Mash Central Mat South Total Urban Rural Total Urban Rural Total Urban Rural Total Urban Rural Total STEP1 724 465 1189 256 688 944 185 763 948 1165 1916 3081 STEP 2* 423(58.4) 382(82.2) 805(67.7) 182(71.1) 572(83.1) 754(79.9) 182(98.4) 721(94.5) 903(95) 787(67.6) 1675(87.4) 2462(80) STEP 3* 373(51.5) 313(67.3) 686(57.7) 161(62.9) 514(74.7) 675(71.5) 170(91.9) 652(85.5) 822(86.7) 704(60.4) 1479(77.2) 2221(72.1)
Note* All the percentages of STEPS 2 and 3 are calculated based on STEP 1. Table 5.1 shows that from the targeted sample size, in STEP 1 the STEP 2 and 3 response rate was above 80% for STEP 2 and above 70% for STEP 3. Of note is the response rate in Midlands, which was lower than the other two provinces in both STEP 2 and 3. This notable difference was due to the fact that Midlands had more respondents sampled from the urban communities. A higher proportion of urban respondents was formally employed and therefore did not complete STEP 2 and 3 due to conflict with work schedules.

38
5.3: Demographic profile of respondents The demographic characteristics of respondents are summarized in Table 5.2. The majority of respondents were married (67.4%), followed by the widowed (20.1%). There was a 1:3 male to female sex distribution of respondents. This distribution pattern was similar across all the provinces. 5.3.1: Age Distribution Age was indicated in 97.8% of respondents. Over 50% of respondents in Midlands and Mashonaland Central were aged 44 years or less. However in Matebeleland South 62.8% or respondents were aged 45 years and higher. 5.3.2: Marital status Across all the 3 provinces the majority of respondents were married, which is in keeping with the cutoff age of the survey being 25 years. 5.3.3: Educational status The level of education of the survey population was high with 85.7% having achieved at least primary level education. There were differences in the educational levels across the three provinces partly due to the urban rural mix of the survey respondents. 5.3.4: Employment status Unemployment was high in this survey, the average unemployment rate stood at of 40.8 %. This trend was similar for Midlands and Matebeleland South, while Midlands had an unemployment rate less than 20%. This was probably partly accounted for by the rural urban mix of the survey respondents. 5.3.5: Discussion of demographic profile The sex distribution is inline with the population profile of Zimbabwe were majority are women and it is also worth noting that most women were found at home unlike men who do day to day activities outside the home, hence difficult o reach. The age distribution was inline with the 2002 National Census population pyramid with the majority of respondents being in the younger age group. There was a notable difference in the population distribution of Mat South, where majority where in the older age group, which has potential impact of the prevalence of NCDs. One of the reasons is migration where most of the younger generation has moved to neighboring countries (South Africa and Botswana) in search of employment. The educational level, which was found to be different across the provinces is supported by the fact that most respondents from Midlands who were urban based and were working were more educated since most of them were employed. High unemployment rates might lead to sedentary lifestyle, which is a risk factor for NCDs.
Formatted
Formatted
Formatted
Formatted
Formatted

39
Table 5.2: Distribution of respondents by age group and Province Characteristics Midlands
N = 1189
Mash Central N = 944
Mat South N = 948
Total N = 3081
Sex Male Female Age group 25-34 35-44 45-54 55-64 65 + Marital Status Single Married Divorced Widowed Separation Cohabiting Level of education None Primary Secondary Tertiary Occupation Informal Formal skilled Housewife Not employed Student
371(31.2) 818(68.8) N=1160 445(38.4) 302(26.0) 209(18.0) 112(9.7) 92(7.9) N=1184 79(6.7) 864(73) 42(3.6) 186(15.7) 12(1.0) 1(0.1) N=1185 97(8.2) 423(35.7) 602(50.8) 63(5.3) N=1181 271(22.9) 184(15.6) 499(42.3) 219(18.5) 8(0.7)
191(20.2) 757(79.8) N=920 317(34.5) 207(22.5) 162(17.6) 117(12.7) 117(12.7) N=943 46(4.9) 651(69.0) 53(5.2) 185(19.6) 8(0.9) 0(0.) N=944 165(17.5) 427(45.2) 338(35.8) 14(1.5) N=944 70(7.4) 56(5.9) 294(31.1) 524(55.5) 0(0.0)
191(20.2) 757(79.8) N=932 165(17.7) 182(19.5) 216(23.2) 154(16.5) 215(23.1) N=947 64(6.8) 557(58.8) 57(6.0) 247(26.1) 13(1.4) 9(0.9) N=948 177(18.7) 506(53.4) 237(25.0) 28(2.9) N=947 50(5.3) 57(6.0) 329(34.7) 511(54.0) 0(0)
769(25.0) 2 312(75.0) N=3012 927(30.8) 691(22.9) 587(19.5) 383(12.7) 424(14.1) N=3074 189(6.2) 2 072(67.4) 152(4.9) 618(20.1) 33(1.1) 10(0.3) N=3077 439(14.3) 1 356(44.1) 1 177(38.2) 105(3.4) N=3072 391(12.7) 297(9.7) 1 122(36.5) 1 254(40.8) 8(0.3)
Formatted

40
5.4: Alcohol consumption Pattern Alcohol consumption was divided into current and history of alcohol consumption. The details of each are summarized in the sections below. 5.4.1: Current alcohol consumption On the question of current alcohol consumption, 97% of the total answered this question. The prevalence of alcohol consumption by province, age group and gender is summarized in Table 4.4. The prevalence of alcohol consumption increased with age across all the three provinces, with the exception of Mashonaland Central, where alcohol consumption peaked at the 45-54 year age group (see figure 5.2). In terms of sex distribution, males were four times more likely to consume alcohol as compared to females. Table 5.3a: Prevalence of current alcohol consumption by province, age group and gender Midlands
N = 1160
Mash Central N = 920
Mat South N = 932
Total N = 3 012
Age group 25-34 35-44 45-54 55-64 65 + Overall Sex Males Females
N*
445 302 209 112 92 1 160 N* 371 818
% 29.0 33.4 35.4 34.8 47.8 33.4 % 65.8 18.6
N*
317 207 162 117 117 920 N*
207 737
% 14.5 17.9 22.2 17.1 20.5 17.7 % 45.9 10.0
N*
165 182 216 154 215 932 N*
191 757
% 11.5 18.1 19.4 20.8 28.8 20.2 % 56.0 11.5
N* 927 691 587 383 424 3 012 N 769 2 312
% 20.9 24.8 25.9 23.8 30.7 24.5 % 58.0 13.5
* Total number within age group or sex
Formatted
Formatted

41
Figure 5.2:- Prevalence of alcohol consumption by age group and province
0
10
20
30
40
50
60
25-34 35-44 45-54 55-64 65+
Age group
Prev
alen
ce
MidlandsMash CentralMat SouthNational


43
5.4.3: History of alcohol consumption History of alcohol consumption showed that males were more likely to report ever having consumed alcohol across all the 3 provinces as compared to their female counterpart (table 5.3a). Overall Midlands had the highest proportion of male participants who reported ever-consumed alcohol. Of note is the fact that the peak age of alcohol consumption among males was 45-54 year age group in all the 3 provinces with the exception of Midlands, which peaked at 55-64 year age group. On the history of ever-consumed alcohol in the past 12 months, both sexes across all the age groups and provinces had a higher reporting of consuming alcohol. Of not is the fact that over 50% of both sexes reported high consumption with the exception of Mash Central age group 65+ females and Mat South age group 45-54 females where only 22.2% and 16% reported alcohol consumption respectively. Table 5.3b:- Proportion of respondents who ever consumed alcohol by province, age group and by gender
* indicates the total number of respondents within age group and sex ** indicates the proportion who consumes alcohol within age group and sex
Province Sex 25-34 N*
n(%)**
35-44 N*
n(%)**
45-54 N*
n(%)**
55-64 N*
n(%)**
65+ N*
n(%)**
Overall N*
n(%)** Male 129
78(60.4) 84
60(71.4) 66
45(68.2) 36
28(77.8) 49
29(59.2) 364
240(65.9) Midlands
Female 316 51(16.1)
218 41(18.8)
143 29(20.3)
76 11(14.5)
43 15(34.9)
796 147(18.5)
Male 60 26(43.3)
41 19(46.3)
37 23(62.2)
23 10(43.5)
43 15(34.9)
204 93(45.6)
Mash Central
Female 257 20(7.8)
166 18(10.8)
125 13(10.4)
94 10(10.6)
74 9(12.2)
716 70(9.8)
Male 27 11(40.7)
29 19(65.5)
38 27(71.1)
35 16(45.7)
61 33(54.1)
190 106(55.8)
Mat South
Female 138 8(5.8)
153 14(9.2)
178 15(8.4)
119 16(13.5)
154 29(18.8)
742 82(11.1)
Male 216 115(53.2)
154 98(63.6)
141 95(67.4)
94 54(57.5)
153 77(50.3)
758 439(57.9)
Total
Female 711 79(11.1)
537 73(13.6)
446 57(12.8)
298 37(12.8)
271 53(19.6)
2254 299(13.3)
Formatted
Formatted

44
Table 5.3c: Proportion of study participants ever consumed alcohol within past 12 months by province, age group and by gender
Province Sex 25-34 N*
N (%)**
35-44 N*
N (%)**
45-54 N*
N (%)**
55-64 N*
N (%)**
65+ N*
N (%)**
Overall N*
N (%)** Male 78
66(84.6) 60
42(70.0) 45
36(80.9) 28
25(89.3) 29
25(86.2) 240
194(80.8) Midlands
Female 51 28(54.9)
41 27(65.9)
29 21(72.4)
11 4(36.3)
15 9(60.0)
147 89(60.5)
Male 26 26(100)
19 17(89.5)
23 16(69.6)
10 10(100)
15 11(73.3)
93 80(86.0)
Mash Central
Female 20 13(65.0)
18 12(66.7)
13 9(69.2)
10 7(70.0)
9 2(22.2)
70 43(61.4)
Male 11 10(90.9)
19 17(89.5)
27 24(88.9)
16 14(87.5)
33 26(78.8)
106 91(85.9)
Mat South
Female 8 7(87.5)
14 8(57.1)
15 9(16.0)
16 11(68.8)
29 19(65.5)
82 54(65.9)
Male 115 102(88.7)
98 76(77.6)
95 76(80.0)
54 49(90.7)
77 62(80.5)
439 365(83.1)
Total
Female 79 48(60.8)
73 47(64.4)
57 39(68.4)
37 22(59.5)
53 30(56.6)
299 186(66.2)
Formatted

45
5.5: Tobacco consumption A total of 3003(97.5%) people responded to the question on tobacco consumption. The rate of current tobacco consumption increased with age across all the provinces, with highest tobacco consumption being noted in Midlands among the 65 + year age group (figure 5.3). In terms of sex distribution, males were 6 times more likely to consume tobacco products as compared to females. Table 5.4a: Prevalence of tobacco use/consumption by province, age group and gender.
Midlands N = 1 160
Mash Central N = 920
Mat South N = 923
Total N = 3003
Age group 25-34 35-44 45-54 55-64 65+ Overall Sex Males Females
N*
445 302 209 112 92
1 160
N* 371 818
(%) 9.0 10.9 16.3 25.0 32.6
14.2
% 34.5 5.5
N*
317 207 162 117 117
920
N*
207 737
% 4.1 10.6 11.1 13.7 15.4
(9.5)
% 30.9 3.8
N*
165 182 216 154 215
923
N* 191 757
% 4.9 9.3 11.1 11.7 17.2
(11.2)
% 34.0 5.6
N 927 691 587 383 424 3 012 N*
769 2 312
% 6.6 10.4 13.0 16.2 20.1
11.8
% 33.4 5.0
* Total number within age group or sex Figure 5.3: - Prevalence of smoking by province and age group
0
5
10
15
20
25
30
35
25-34 35-44 45-54 55-64 65+
Age group
Prev
alen
ce(%
) MidlandsMash CentralMat SouthNational
Formatted

46
The distribution of current smokers was significantly different between males and females across all the age group with males being about 4 times more likely to be current smokers of tobacco only when compared to females. Table 5.4b: Proportion of respondents who are currently using tobacco products only (cigarettes, cigars and pipes) by age and sex
5.5.2: History of Tobacco consumption Generally the history of tobacco consumption increased with age across all the 3 provinces. Of note is the fact that males where more likely to report history of tobacco consumption when compared to females. Overall males were 6 times more likely to use tobacco products than females.
Smoking status Sex 25-34 N*
n(%)**
35-44 N*
n(%)**
45-54 N*
n(%)**
55-64 N*
n(%)**
65+ N*
n(%)**
Overall N*
n(%)** Male 56
48(85.7) 55
48(87.3) 55
44(80.0) 40
31(77.5) 56
30(65.2) 252
201(79.8) Currently smoke tobacco products only Female 5
2(40.0) 17
4(23.5) 19
5(26.3) 22
6(27.3) 39
12(30.8) 102
29(28.4)
Formatted
Formatted

47
Table 5.4c: - Proportion of respondents who reported use of tobacco products by province, age group and by gender
Province Sex 25-34
N* n(%)**
35-44 N*
n(%)**
45-54 N*
n(%)**
55-64 N*
n(%)**
65+ N*
n(%)**
Overall N*
n(%)** Male 129
38(29.5) 84
23(27.4) 66
26(39.4) 36
19(52.8) 49
20(40.8) 364
126(34.6) Midlands
Female 316 2(0.6)
216 10(4.6)
143 8(5.6)
76 9(11.8)
43 10(23.3)
796 39(4.9)
Male 60 11(18.3)
41 17(41.5)
37 14(37.8)
23 9(39.1)
43 11(25.6)
204 62(30.4)
Mash Central
Female 275 2(0.8)
166 5(3.0)
125 4(3.2)
94 7(7.50
74 7(9.5)
716 25(3.5)
Male 27 7(25.9)
29 15(51.7)
38 16(42.1)
35 12(34.3)
61 15(24.6)
190 65(34.2)
Mat South
Female 138 1(0.7)
153 2(1.3)
178 8(4.5)
119 6(5.0)
154 22(14.3)
742 39(5.3)
Male 216 56(25.9)
154 55(35.7)
141 56(39.7)
94 40(42.6)
153 46(30.1)
758 253(33.4)
Total
Female 711 5(0.7)
537 17(3.2)
446 20(4.5)
289 22(7.6)
271 39(14.4)
2254 103(4.6)
5.6: Discussion on alcohol consumption and tobacco use This study has shown that alcohol and tobacco consumption is very high among the study sample. Of note is the fact that males where outstanding in terms of both tobacco and alcohol consumption. It is known that those who consume alcohol are likely to be smokers. This relationship was demonstrated in this study. The prevalence of tobacco use of 11.8% is inline with the national prevalence of the ZDHS 2002.
Formatted


49
5.7.0: Physical Inactivity Physical inactivity was assessed in three categories, at work, during transportation and at leisure time. Physical inactivity at work was defined in three categories, firstly as work involving mostly sitting or standing with walking for no more than 10 minutes at a time, secondly work that does not involve vigorous activities like heavy lifting, digging or construction work for at least 10 minutes at a time and thirdly in term of number of days per week one does vigorous activities as part of one’s work. While physical inactivity on transportation was defined by walking or cycling for no more than 10 minutes continuously to get to and from places. On leisure it was defined as recreation or sport or leisure time which involve mostly sitting, reclining or standing with no physical activity lasting more than 10 minutes at a time and whether during leisure time one does not do any vigorous activities like running, or strenuous sports, weight lifting for at least 10 minutes at a time. 5.7.1: Physical inactivity at work. Generally the prevalence of physical inactivity during normal working hours was high (50%) in all the age groups, see Table 5.5a.Of note is the fact that Matebeleland South province reported the highest prevalence of physical inactivity during normal working hours (above 70%) in all age groups and both sexes as compared to other provinces. The distribution of physical inactivity was not significantly different among females and males in all the provinces.
Formatted

50
Table 5.5a): Percentage of respondents reporting physical inactivity during normal working hours by province and age group(work involving mostly sitting or standing with walking for no more than 10 minutes at a time)
Province Sex 25-34 N*
%(95%CI)
35-44 N*
%(95%CI)
45-54 N*
%(95%CI)
55-64 N*
%(95%CI)
65+ N*
%(95%CI)
Overall N*
%(95%CI) Male 129
45.0(36.2-53.7) 84
50.0(39.1-60.9) 65
56.9(44.6-69.3) 36
41.7(24.7-58.6) 49
38.8(24.6-52.9) 363
47.1(41.9-52.3) Midlands
Female 316 46.8(41.3-52.4)
218 48.2(41.5-54.9)
142 41.6(33.4-49.8)
76 40.8(29.5-52.1)
43 41.9(26.5-57.2)
795 45.4(41.9-48.9)
Male 60 50.0(37.0-63.0)
41 41.5(25.7-57.2)
37 43.2(26.5-60.0)
23 43.5(21.6-65.4)
43 58.1(42.8-73.5)
204 48.0(41.1-55.0)
Mash Central
Female 257 60.7(54.7-66.7)
166 41.0(33.4-48.5)
125 41.6(32.8-50.4)
94 42.6(32.4-52.7)
74 62.2(50.8-73.5)
716 50.6(46.9-54.2)
Male 27 81.5(65.8-97.1)
29 72.4(55.1-89.7)
37 81.1(67.8-94.3)
35 77.1(62.5-91.8)
61 72.1(60.6-83.7)
189 76.2(70.1-82.3)
Mat South
Female 137 79.6(72.7-86.4)
153 74.5(67.5-81.5)
178 74.7(68.3-81.2)
119 73.1(65.0-81.2)
154 76.6(69.9-83.4)
741 75.7(72.6-78.8)
Male 216 50.9(44.2-57.6)
154 52.7(44.0-59.9)
139 59.7(51.5-68.0)
94 55.3(45.1-65.6)
153 57.5(49.6-65.4)
756 54.6(51.1-58.2)
Total
Female 710 58.2(54.5-61.8)
537 53.5(49.2-57.7)
445 54.8(50.2-59.5)
289 54.7(48.9-60.4)
271 62.2(61.5-72.8)
2252 57.0(55.0-59.1)
Formatted

51
5.7.2:- Physical inactivity at work (no vigorous activity) Percentage of respondents reporting no vigorous physical activity during working hours was more than 30% in all the provinces. How ever Mashonaland Central province, among the females, reported the highest (above 50%) rate of physical inactivity across all age groups. Of note physical inactivity was more prevalent in the 65 + age group, this is supported by the fact that the older one becomes the less vigorous activities one engages in. Table 5.5b: Percentage of respondents reporting no vigorous physical activity at work by province
and age group
Province Sex 25-34 N*
%(95%CI)
35-44 N*
%(95%CI)
45-54 N*
%(95%CI)
55-64 N*
%(95%CI)
65+ N*
%(95%CI)
Overall N*
%(95%CI) Male 127
37.8(29.2-46.3) 84
33.3(23.0-43.6) 65
35.4(23.4-47.3) 36
27.8(12.4-43.1) 49
26.5(13.7-39.3) 361
33.8(28.9-38.7) Midlands
Female 316 55.7(50.2-61.2)
218 40.4(33.8-46.9)
141 36.2(28.1-44.2)
76 26.3(16.2-36.4)
42 47.6(31.9-63.4)
793 44.8(41.3-48.2)
Male 60 41.7(28.8-54.5)
41 41.5(25.7-57.2)
37 51.4(34.5-68.2)
23 43.5(21.6-65.4)
43 72.1(58.1-86.1)
204 50.0(43.1-56.9)
Mash Central
Female 257 69.3(63.6-74.9)
166 53.0(45.3-60.7)
125 60.1(51.3-68.7)
94 55.3(45.1-65.6)
74 64.9(53.7-76.0)
716 61.6(58.0-65.2)
Male 27 25.9(8.3-43.6)
29 24.1(7.6-40.7)
36 27.8(12.4-43.1)
35 28.6(12.8-44.3)
59 47.5(43.3-60.6)
186 33.3(26.5-40.2)
Mat South
Female 136 41.9(33.5-50.3)
153 37.3(29.5-45.0)
178 36.0(28.8-43.1)
119 42.2(37.1-55.3)
151 64.9(57.2-72.6)
737 44.9(41.3-48.5)
Male 214 37.4(30.8-43.9)
154 33.8(26.2-41.3)
138 37.7(29.5-45.1)
94 31.9(22.3-41.5)
151 47.7(39.6-55.7)
751 38.1(34.6-41.6)
Total
Female 709 58.0(54.3-61.6)
537 43.4(39.2-47.6)
444 42.8(38.2-47.4)
289 43.9(38.2-49.7)
267 67.2(56.3-68.0)
Formatted
Formatted

52
(work involving either sitting or standing with walking no more than 10 minutes at a time, no vigorous activity and less than 3 days of physical activity per week) by province and age group.
Province 25-34 N*
%(95%CI)
35-44 N*
%(95%CI)
45-54 N*
%(95%CI)
55-64 N*
%(95%CI)
65+ N*
%(95%CI)
Overall N*
%(95%CI) Midlands 284
72.5(67.3-77.8)
312 70.4(64.2-
76.6)
154 67.5(60.1-
75.0)
94 73.4(64.3-
82.5)
65 60.0(47.8-
72.2)
810 70.1(67.0-
73.3) Mash Central
316 87.0(83.3-
90.8)
206 71.8(65.7-
78.0)
162 75.3(68.6-
82.0)
115 76.5(68.7-
94.4)
117 81.2(74.0-
88.4)
916 79.5(76.9-
82.1) Mat South 162
90.1(85.5-94.8)
182 84.1(78.7-
89.4)
213 85.9(81.2-
90.6)
154 84.4(78.6-
90.2)
209 91.9(88.1-
95.6)
920 87.4(85.2-
89.5)
Total 762 82.3(79.6-
85.0)
601 75.0(71.6-
76.5)
539 77.3(73.7-
80.9)
363 79.1(74.5-
82.3)
391 83.4(79.7-
82.1)
2 646 79.3(77.8-
80.1) Overall the prevalence of physical inactivity was 79.3%. The prevalence of physical inactivity ranged from 60% to 92%, with Mat South reporting the highest prevalence throughout the age groups.

53
5.7.3:- Sedentary traveling (transportation) A total of 3006 (97.6%) responded to this question. Generally females were more likely to report sedentary traveling in all the provinces, across all age groups and sexes. Infact females were twice as much more likely to report sedentary traveling as compared to males and there was an increasing trend with age. Table 5.5d: - Percentage of respondents reporting sedentary (walking or pedal cycling for less than 10 minutes) Traveling by province, sex and age group
Province Sex 25-34 N*
%**(95%CI)
35-44 N*
%(95%CI)
45-54 N*
%(95%CI)
55-64 N*
%(95%CI)
65+ N*
%(95%CI)
Overall N*
%(95%CI) Male 129
9.3(4.2-14.4) 84
11.9(4.8-19.7) 66
7.6(1.0-14.1) 36
8.3(0.0-17.8 49
6.1(0.0-13.1) 364
9.1(6.1-12.0) Midlands
Female 316 13.7(9.8-17.4)
218 13.8(9.2-18.4)
142 7.7(3.3-12.2)
76 14.5(6.4-22.6)
43 23.1(10.1-36.4)
794 13.2(10.9-15.6)
Male 60 10.0(2.1-17.8)
41 22.0(8.7-35.2)
37 10.8(0.3-21.3)
23 13.0(0.0-27.9)
43 9.3(0.3-18.3)
204 12.7(8.1-17.4)
Mash Central
Female 257 16.0(11.4-20.5)
166 16.3(10.6-21.9)
125 19.2(12.2-26.2)
94 22.3(13.8-30.9)
74 25.7(15.5-35.9)
716 18.4(15.6-21.3)
Male 27 11.1(0.0-23.8)
29 10.3(0.0-22.1)
38 18.4(5.5-31.3)
35 20.0(6.1-33.9)
61 37.7(25.2-50.2)
190 22.6(16.6-28.6)
Mat South
Female 136 33.1(25.1-41.1)
152 30.3(22.9-37.6)
178 32.0(25.1-38.9)
119 27.7(19.6-35.9)
153 52.3(44.3-60.3)
738 35.4(31.9-38.8)
Male 216 9.7(5.7-13.7)
154 14.3(8.7-19.9)
141 11.3(6.0-16.6)
94 13.8(6.7-20.9)
153 19.6(13.2-26.0)
758 13.5(11.0-15.9)
Total
Female 708 18.2(15.4-21.1)
536 19.2(15.9-22.6)
445 20.7(16.9-24.5)
289 22.5(17.6-27.3)
270 40.4(34.5-46.3)
2248 22.2(20.4-23.9)
** Percent inactive or reporting sedentary traveling 5.7.4:- Sedentary leisure time Sedentary leisure time is summarized in Table 5.5d, as a combination of either recreation, sport or leisure time involving mostly sitting or reclining or standing with no physical activity lasting more than 10 minutes at a time or no vigorous activity such as running or strenuous
Formatted

54
sports, weight lifting for at least 10 minutes at a time. The proportion of respondents reporting sedentary leisure time ranged from 91% to 99%. Overall 96.7% of the respondents reported sedentary leisure time. Table 5.5e: Percentage of respondents reporting sedentary leisure time by province and age group
Province 25-34 N*
%(95%CI)
35-44 N*
%(95%CI)
45-54 N*
%(95%CI)
55-64 N*
%(95%CI)
65+ N*
%(95%CI)
Overall N*
%(95%CI) Midlands 444
97.7(96.4-99.1) 300
95.0(92.5-97.5) 208
95.7(92.9-98.5) 111
97.3(94.2-100) 92
98.9(96.8-101.1) 1 155
96.7(95.7-97.7) Mash Central 316
99.4(98.8-102.2) 204
98.0(96.1-100.0) 159
97.8(95.0-100.0) 117
98.3(95.9-100.7) 113
99.1(97.4-100.9) 909
98.6(97.8-99.3) Mat South 160
97.5(95.1-99.9) 179
91.6(87.5-95.7) 207
94.7(91.6-97.8) 146
94.5(90.8-98.3) 206
96.1(93.5-98.8) 898
94.9(93.4-96.3) Total 920
98.3(97.4-99.1) 683
95.0(93.4-96.7) 574
95.8(94.2-97.5) 374
96.5(94.7-98.4) 411
97.6(96.1-99.1) 2962
96.7(96.1-97.4)
Formatted

55
Physical inactivity is prevalent in this study population and this is true across all the various areas of physical activity (work, transportation and leisure). On work differences across provinces were noted in Mat South province, this is due to the fact that there were more population from the rural areas with sedentary type of jobs. On transportation it is worth noting that females reported a higher sedentary traveling lifestyle as compared to males. Since most females were employed as housewives, they were less likely to cycle or pedal within the home. Organized sport and other leisure activities in the manner inquired in the questionnaire is not undertaken by the communities we surveyed as a habit, hence this item drew response which indicated a high level of inactivity during leisure time.

56
5.8.0. History of Hypertension The prevalence of reported hypertension was estimated at 17.9%. Overall the prevalence of hypertension increased with age group from 7.9% in the youngest age group to 30.9% in the 65 years and older age group. After adjusting for age the prevalence of reported hypertension was found to be higher among females as compared to males across all the provinces. With respect to different provinces, highest prevalence was found in Matebeleland South (20.2%) and the lowest in Mashonaland Central 15.1%. Age adjusted reported hypertension by provinces showed Midlands to have a higher prevalence, see Figure 5.3. 5.8.1: Discussion of hypertension There was a higher proportion of respondents from the urban communities in Midlands which could have given them a better access to diagnosis of hypertension compared to rural communities and hence high reported prevalence of hypertension. Table 5.6:- Reported Prevalence of hypertension by province, age group and gender Midlands
N = 1155
Mash Central N = 920
Mat South N = 928
Total N = 3 003
Age group 25-34 35-44 45-54 55-64 65 + Overall Sex Males Females
N* 444 299 209 111 92
1 155
363 792
% 8.1
16.7 27.8 34.2 34.6
18.4
11.9 21.3
N* 317 207 162 117 117
920
204 716
% 7.9 11.1 16.1 23.1 34.5
15.1
9.8 16.6
N*
163 182 214 154 215
928
189 739
% 7.4 15.4 18.7 28.6 29.3
20.2
13.2 21.9
N* 924 688 585 282 424
3 003
756 2 247
% 7.9 14.6 21.2 28.5 30.9
17.9
11.6 20.0
* Total number within age group or sex
Formatted
Formatted

57
Figure 5.4: Reported prevalence of hypertension by province and age group
0
5
10
15
20
25
30
35
40
45
25-34 35-44 45-54 55-64 65+Age Group
Pre
vale
nce
(%)
MidlandsMash CentralMat SouthNational

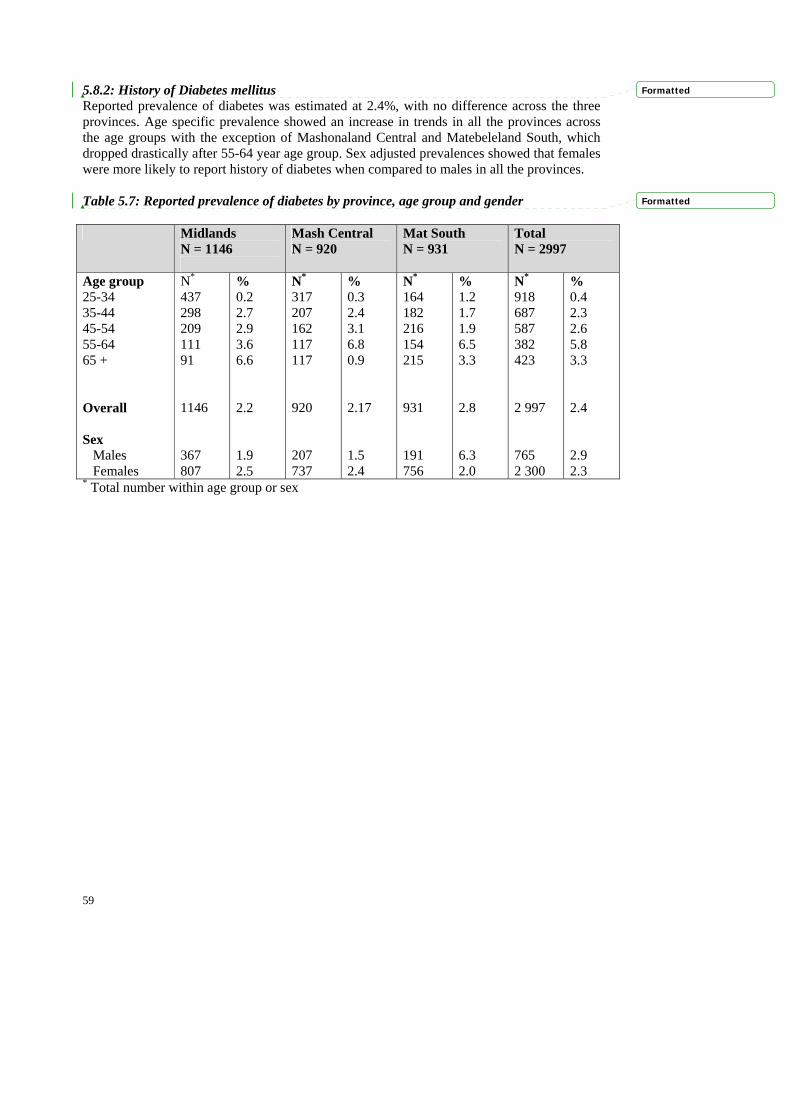
59
5.8.2: History of Diabetes mellitus Reported prevalence of diabetes was estimated at 2.4%, with no difference across the three provinces. Age specific prevalence showed an increase in trends in all the provinces across the age groups with the exception of Mashonaland Central and Matebeleland South, which dropped drastically after 55-64 year age group. Sex adjusted prevalences showed that females were more likely to report history of diabetes when compared to males in all the provinces. Table 5.7: Reported prevalence of diabetes by province, age group and gender Midlands
N = 1146
Mash Central N = 920
Mat South N = 931
Total N = 2997
Age group 25-34 35-44 45-54 55-64 65 + Overall Sex Males Females
N*
437 298 209 111 91 1146 367 807
% 0.2 2.7 2.9 3.6 6.6 2.2 1.9 2.5
N* 317 207 162 117 117 920 207 737
% 0.3 2.4 3.1 6.8 0.9 2.17 1.5 2.4
N*
164 182 216 154 215 931 191 756
% 1.2 1.7 1.9 6.5 3.3 2.8 6.3 2.0
N* 918 687 587 382 423 2 997 765 2 300
% 0.4 2.3 2.6 5.8 3.3 2.4 2.9 2.3
* Total number within age group or sex
Formatted
Formatted

60
Figure 5.5:- Reported prevalence of diabetes mellitus
0
1
2
3
4
5
6
7
8
25-34 35-44 45-54 55-64 65+Age Group
Prev
alen
ce (%
)
MidlandsMash CentralMat SouthNational

61
5.9.0: Physical measurements (STEP 2 OF STEPS) 5.9.1: Body Mass Index (BMI) The mean BMI was 21.7% for males and 25.1% for females across all the three provinces. The mean BMI was within normal range, except for female in Midlands, who were slightly overweight. Table 5 8a: Mean BMI by province, age group and gender
Province Sex 25-34 N*
Mean(95%CI)
35-44 N*
Mean(95%CI)
45-54 N*
Mean(95%CI)
55-64 N*
Mean(95%CI)
65+ N*
Mean(95%CI)
Overall N*
Mean (95%CI) Male 76
21.9(21.1-22.6) 46
22.8(21.7-23.9) 52
23.6(22.3-24.8) 28
22.4(20.8-24.0) 44
21.8(20.7-22.9) 249
22.4(21.9-22.9) Midlands
Female 163 25.1(24.3-25.8)
150 27.1(26.2-28.0)
110 28.2(27.2-29.3)
68 27.6(26.2-29.0)
39 25.2(23.5-26.9)
549 26.5(26.1-27.0)
Male 33 20.2(19.7-20.8)
23 20.0(18.7-21.3)
35 21.8(20.2-23.3)
20 21.8(19.7-24.0)
35 21.7(20.6-22.8)
148 21.1(20.5-21.7)
Mash Central
Female 177 24.2(23.5-24.9)
142 24.7(23.9-25.5)
106 25.5(24.4-26.6)
87 24.3(23.1-25.4)
66 22.2(21.1-23.2)
597 24.3(23.9-24.7)
Male 24 21.7(20.3-23.1)
28 21.3(20.1-22.5)
33 20.9(19.7-22.1)
33 22.3(20.6-23.9)
59 20.7(19.7-21.7)
178 21.2(20.7-21.8)
Mat South
Female 125 23.7(22.9-24.5)
144 24.8(24.0-25.6)
168 25.9(24.9-26.8)
116 25.5(24.5-26.5)
147 23.9(23.0-24.7)
715 24.7(24.3-25.1)
Male 133 21.4(20.9-22.0)
97 21.7(21.0-22.4)
120 22.3(21.5-23.1)
81 22.2(21.2-23.2)
138 21.3(20.7-21.9)
575 21.7(21.4-22.0)
Total
Female 465 24.4(23.9-24.8)
436 25.6(25.1-26.0)
384 26.4(25.8-27.0)
271 25.6(25.0-26.3)
252 23.6(23.0-24.3)
1861 25.1(24.9-25.4)
N* Indicates total number within age group p and sex
Formatted
Formatted
Formatted

62
Table 5.8b: Overall Distribution of respondents on Overweight and obesity stratified by sex and age group Province Category of relative
weight 25-34
%
35-44
%
45-54
%
55-64
%
65+
%
Overall
% N=133 N=97 N=120 N=81 N=138 N=569
Underweight (<18.5)
8.3 12.4 16.7 21.0 20.3 15.5
Normal (18.5-24.9) 82.0 65.0 58.3 59.3 63.0 66.3
Grade 1 overweight (25.0-29.9)
6.8 21.7 20.0 12.4 13.0 14.4
Grade 2 overweight (30.0-39.9)
3.0 1.0 5.0 7.4 3.6 3.9
Males
Obesity (> 40.0) 0.0 0.0 0.0 0.0 0.0 0.0
N=465 N=436 N=384 N=271 N=252 N=1808
Underweight (<18.5)
7.3 4.4 6.0 6.6 12.3 6.9
Normal (18.5-24.9) 55.9 49.8 40.0 46.5 56.4 49.8
Grade 1 overweight (25.0-29.9)
22.4 25.9 26.8 23.3 19.4 23.9
Grade 2 overweight (30.0-39.9)
13.8 18.8 24.5 22.5 11.1 18.2
Females
Obesity (> 40.0) 0.7 1.2 2.3 1.1 0.8 1.2
5.9.2: Overall distribution of overweight and obesity Overall, the prevalence of Grade 1 overweight was estimated to be 14.5% in the males and 23.9% among females. Of note is the fact that Grade 2 overweight in females (18.2%) was six times that of males (3.9%). Age –specific prevalence showed that overweight peaked among males at 35-44 year age group (21.7%), while in female it peaked at 45 to 54 year age group (26.8%). Interesting to note is the fact that no obesity prevalence was noted in males, while 1.2% prevalence was noted among females.
Formatted

63
5.9.3: Overweight and obesity among males The definition of overweight and obesity were based on body mass index (BMI) greater or equal to 25 and greater than 40 respectively. Overall the grade 1 overweight was 19.1%, 8.9% and 11.3% for Midlands, Mashonaland Central and Matebeleland South provinces respectively. Age specific prevalence of overweight peaked at the age group of 35-44 in Midlands, 45-54 in Mashonaland Central and 55-64 in Matebeleland South province. Grade 2 overweight, was more prevalent in the age group 55 to 64 in Mashonaland Central and Matebeleland South provinces, while in Midlands it was highest in the 45-54 age group. Of note is the fact that none of the three provinces reported obesity.
Formatted

64
Table 5.8.c: Distribution of male respondents on Overweight and obesity stratified by province and age group Province Category of Relative
Weight 25-34
% 35-44
% 45-54
% 55-64
% 65+ %
Overall %
N=76 N=46 N=52 N=28 N=44 N=246 Underweight (<18.5) 4.0 4.4 7.7 21.4 15.9 8.9
Normal (18.5-24.9) 82.9 60.9 55.8 57.1 65.9 67.1
Grade 1 overweight (25.0-29.9)
9.2 32.6 30.8 17.9 13.6 19.9
Grade 2 overweight (30.0-39.9)
4.0 2.2 5.8 3.6 4.6 4.1
Midlands
Obesity (> 40.0) 0.0 0.0 0.0 0.0 0.0 0.0
N=33 N=23 N=35 N=20 N=35 N=146 Underweight (<18.5)
15.2 21.8 25.7 25.0 8.6 18.5
Normal (18.5-24.9) 84.9 69.6 51.4 65.0 77.1 69.9
Grade 1 overweight (25.0-29.9)
0.0 8.7 20.0 0.0 11.4 8.9
Grade 2 overweight (30.0-39.9)
0.0 0.0 2.9 10.0 2.9 2.7
Mash Central
Obesity (> 40.0) 0.0 0.0 0.0 0.0 0.0 0.0
N=24 N=28 N=33 N=33 N=59 N=177 Underweight (<18.5)
12.5 17.9 21.1 18.2 30.5 22.0
Normal (18.5-24.9) 75.0 67.9 69.7 57.6 52.5 62.2
Grade 1 overweight (25.0-29.9)
8.3 14.3 3.0 15.2 13.6 11.3
Grade 2 overweight (30.0-39.9)
4.2 0.0 6.1 9.1 3.4 4.5
Mat South
Obesity (> 40.0) 0.0 0.0 0.0 0.0 0.0 0.0
Formatted

65
Table 5.8d: Distribution of female respondents on Overweight and obesity stratified by province and age group Province Category of Relative
Weight 25-34
% 35-44
% 45-54
% 55-64
% 65+ %
Overall %
N=163 N=150 N=110 N=68 N=39 N=530 Underweight (<18.5)
6.8 2.7 1.8 1.5 7.7 4.0
Normal (18.5-24.9) 51.5 33.3 32.7 36.8 46.2 41.3
Grade 1 overweight (25.0-29.9)
22.7 29.3 26.4 25.0 25.6 25.9
Grade 2 overweight (30.0-39.9)
18.4 28.0 37.3 36.8 20.5 27.6
Midlands
Obesity (> 40.0) 0.6 2.7 1.8 0.0 0.0 1.3
N=177 N=142 N=106 N=87 N=66 N=578 Underweight (<18.5)
7.3 4.2 8.5 12.6 15.2 8.5
Normal (18.5-24.9) 55.9 57.0 46.2 49.4 60.6 54.0
Grade 1 overweight (25.0-29.9)
25.4 25.4 26.4 19.5 18.2 23.9
Grade 2 overweight (30.0-39.9)
10.7 12.7 16.0 18.4 6.1 12.8
Mash Central
Obesity (> 40.0) 0.6 0.7 2.8 0.0 0.0 0.9
N=125 N=144 N=168 N=116 N=147 N=700 Underweight (<18.5)
8.0 6.3 7.1 5.2 12.2 7.9
Normal (18.5-24.9) 61.6 55.6 41.7 50.0 57.1 52.7
Grade 1 overweight (25.0-29.9)
17.6 22.9 27.4 25.0 18.4 22.4
Grade 2 overweight (30.0-39.9)
12.0 15.3 21.4 17.2 10.9 15.6
Mat South
Obesity (> 40.0) 0.8 0.0 2.4 2.6 1.4 1.4
Formatted

66
5.9.4: Overweight and obesity among females The definition of overweight and obesity were based on body mass index (BMI) greater or equal to 25 and greater than 40 respectively. Province specific prevalence of grade 1 overweight stood at 25.9%, 23.9% and 22.9% in Midlands, Mashonaland Central and Matebeleland South provinces respectively. Age specific prevalence of overweight peaked at the age group of 35-44 in Midlands, 45-54 in Mashonaland Central and Matebeleland South province. Grade 2 overweight was more prevalent in the age group 55 to 64 in Mashonaland Central, 45-54 in Matebeleland South provinces and Midlands. Obesity was noted in all the three provinces.
Formatted

67
Table 5.9: Central Obesity (WHR) by province, by age group and gender Province Sex 25-34
N* %
35-44 N* %
45-54 N* %
55-64 N* %
65+ N* %
Overall N*
% (95% CI) Male (>0.95) 76
6.6 45
11.1 52 9.6
29 6.9
44 13.6
246 9.4
Midlands
Female (>0.85) 154 19.5
151 24.5
112 33.0
69 30.4
39 30.7
525 26.1
Male (>0.95) 33 12.1
24 12.5
35 8.6
20 20.0
35 8.6
147 11.6
Mash Central
Female (>0.85) 160 10.0
139 13.0
108 20.4
90 22.2
66 25.8
563 16.5
Male (>0.95) 22 0.0
28 7.1
31 6.5
35 11.4
58 10.3
174 8.1
Mat South
Female (>0.85) 117 16.2
139 27.3
167 22.2
115 30.4
151 37.8
689 27.0
Male (>0.95) 131 6.9
97 10.3
118 8.5
84 11.9
137 11.0
567 9.5
Total
Female (>0.85) 431 15.1
429 21.7
387 24.8
274 27.7
256 33.6
1777 23.4
5.10.0: Waist Hip Ratio (WHR Overall the prevalence of central obesity as defined by WHR was 23.4% for females and 9.5% for males. In all the provinces central obesity was more prevalent in females as compared to males across all age groups.
Formatted

68
Table 5.10a: Mean systolic blood pressure by sex, age group and province Province Sex 25-34
N* Mean(95%CI)
35-44 N*
Mean(95%CI)
45-54 N*
Mean(95%CI)
55-64 N*
Mean(95%CI)
65+ N*
Mean(95%CI)
Overall N*
Mean (95%CI) Male 77
118.3(115.5-121.2) 46
124.7(120.0-129.5) 52
130.2(123.9-136.7) 29
139.7(127.4-151.9) 45
150.8(141.7-159.8) 249
130.4(127.3-133.5) Midlands
Female 164 118.2(115.9-120.4)
152 129.1(125.9-132.3)
110 139.5(134.9-144.0)
69 150.6(142.8-158.5)
39 155.3(146.3-164.2)
534 132.6(130.4-134.7)
Male 33 125.4(121.0-129.8)
24 120.3(114.3-126.4))
35 127.6(118.4-136.8)
20 145.7(132.6-158.8)
35 152.6(144.5-160.8)
147 134.3(130.3-138.4)
Mash Central
Female 178 119.3(117.1-121.6)
144 126.7(122.9-130.5)
108 141.4(136.9-145.8)
90 150.5(144.6-156.6)
66 152.4(146.3-158.6)
586 133.7(131.6-135.8)
Male 24 117.7(113.0-122.4)
28 120.3(111.1-129.4)
32 123.5(113.7-133.3)
35 133.5(123.6-134.3)
59 139.8(131.6-148.0)
178 129.6(125.4-133.7)
Mat South
Female 125 113.5(110.9-116.1)
145 122.6(118.8-126.3)
170 132.7(128.2-137.2)
116 145.7(140.2-151.2)
153 151.0(146.1-155.9)
709 133.3(131.1-135.5)
Male 134 120.0(117.8-122.1)
98 122.4(118.8-126.0)
119 127.7(123.1-132.3)
84 138.5(132.0-145.0)
139 146.6(141.6-151.6)
574 131.1(129.0-133.30)
Total
Female 467 117.4(116.0-118.7)
441 126.2(124.1-128.3)
388 137.0(134.3-139.7)
275 148.5(144.9-152.1)
258 152.0(148.5-155.3)
1829 133.2(132.0-134.50)
N* Indicates total number within age group and sex
Formatted

69
5.11.0: Blood pressure 5.11.1: Systolic blood pressure Overall the mean systolic blood pressure rises with age from a mean in males of 120mmHg to 146.6mmHg and in females from 117mmHg to 152mmHg. This pattern was observed across all the three provinces, see Table 5.10a. Table 5.10b: Mean diastolic blood pressure by sex, age group and province
Province Sex 25-34 N*
Mean(95%CI)
35-44 N*
Mean95%CI)
45-54 N*
Mean95%CI)
55-64 N*
Mean95%CI)
65+ N*
Mean95%CI)
Overall N*
Mean 95%CI) Male 77
74.7(72.4-77.0) 46
80.0(75.7-84.4) 52
81.3(77.5-85.2) 29
82.6(75.5-89.7) 45
88.2(83.3-93.1) 249
80.4(78.6-82.3) Midlands
Female 164 74.7(72.5-76.8)
152 81.7(79.7-83.7)
110 86.5(84.0-89.0)
69 88.3(84.5-92.1)
39 90.0(86.0-94.0)
543 82.0(80.7-83.2)
Male 33 81.4(77.4-85.4)
24 78.3(73.8-82.7)
35 82.7(78.2-87.3)
20 87.6(80.9-94.2)
35 89.9(85.9-93.9)
147 84.1(82.0-86.1)
Mash Central
Female 178 79.9(79.3-81.5)
144 83.0(80.6-85.3)
108 90.4(87.7-93.1)
90 90.8(87.8-93.7)
66 92.0(89.1-95.0)
586 85.6(84.5-86.7)
Male 24 73.1(67.4-78.7)
28 77.5(72.5-82.5)
32 83.0(74.7-91.4)
35 84.9(77.8-92.1)
59 83.5(78.1-88.9)
178 81.4(78.5-84.3)
Mat South
Female 125 74.4(72.7-76.2)
145 81.4(78.8-84.0)
170 85.9(83.2-88.5)
116 91.5(88.2-94.7)
153 85.6(83.2-88.1)
709 83.8(82.6-85.0)
Male 134 76.1(74.1-78.0)
98 78.9(76.2-81.5)
119 82.2(79.2-85.2)
84 84.8(80.7-88.8)
139 86.7(83.7-89.6)
574 81.7(80.3-83.0)
Total
Female 467 76.6(75.5-77.7)
441 82.0(80.7-83.3)
388 87.3(85.8-88.8)
275 90.5(88.5-92.4)
258 87.8(86.2-89.7)
1829 83.9(83.2-84.5)
5.11.2: Diastolic blood pressure Overall the mean diastolic blood pressure was 81.7mmHg for males and 83.9mmHg for females. Generally the mean diastolic blood pressure increased with age in both sexes. The pattern of higher mean diastolic blood pressure in females was maintained across provinces and in all age groups from the 35-44 year age group and above.
Formatted
Formatted

70
Table 5.10c: Prevalence of hypertension among females by age group and Province.
Province Category of hypertension 25-34 %
35-44 %
45-54 %
55-64 %
65+ %
Overall %
N=164 N=152 N=110 N=69 N=39 N=534 Level A hypertension (SBP>160& DBP>95)
1.8(0.4-5.3) 8.6(4.6-16.2) 18.2(11.5-26.7) 27.5(17.5-39.6) 35.9(21.2-52.8) 12.9(10.1-15.8)
Level B hypertension (SBP >140 & DBP>90)
6.1(3.0-10.9)
30.3(23.1-38.2)
43.6(34.2-53.4)
50.7(38.4-63.4)
61.5(44.6-76.6)
30.5(26.6-34.4)
Level C hypertension (SBP>170 & DBP>100)
1.8(0.4-5.3)
5.3(2.3-10.1)
10.9(5.8-18.3)
26.1(16.3-38.1)
25.6(38.0-42.1)
9.6(7.0-12.1)
Midlands
Severe hypertension (SBP>180 & DBP>110)
0.6(0.0-3.4)
1.3(0.1-4.7)
4.5(1.5-10.3)
13.0(6.1-23.3)
7.7(1.6-20.9)
3.7(2.1-5.4)
N=178 N=144 N=108 N=90 N=66 N=586 Level A hypertension (SBP>160& DBP>95)
1.7(0.3-4.8) 7.6(3.9-13.3) 19.4(12.5-28.2) 27.8(18.9-38.2) 30.3(19.6-42.9) 13.7(10.9-16.4)
Level B hypertension (SBP >140 & DBP>90)
6.7(3.5-11.5)
20.8(14.5-28.4) 49.1(39.3-58.9) 51.1(40.3-61.8) 54.5(41.8-66.9) 30.2(26.5-33.9)
Level C hypertension (SBP>170 & DBP>100)
1.1(0.1-4.0)
4.9(2.0-9.8)
11.1(5.9-18.6)
18.9(11.4-28.5)
15.2(7.5-26.1)
8.2(6.0-10.4)
Mash Central
Severe hypertension (SBP>180 & DBP>110)
0.6(0.0-3.1)
2.8(0.8-7.0)
6.5(2.6-12.9)
6.7(2.5-13.9)
4.5(0.9-12.7)
3.6(2.1-5.1)
N=125 N=145 N=170 N=116 N=153 N=709 Level A hypertension (SBP>160& DBP>95)
0.8(0.0-4.4) 7.6(3.8-13.2) 14.7(9.7-20.9) 25.0(17.4-33.9) 19.0(13.1-26.1) 13.4(10.9-15.9)
Level B hypertension (SBP >140 & DBP>90)
2.4(0.5-6.9)
16.6(10.9-23.6)
27.6(21.1-35.0)
47.4(38.1-56.9)
40.5(32.7-48.7)
26.9(23.7-30.2)
Level C hypertension (SBP>170 & DBP>100)
0.8(0.0-4.4)
4.1(1.5-8.8)
10.0(5.9-15.5)
18.1(11.6-26.3)
13.1(8.2-19.5)
9.2(7.0-11.3)
Mat South
Severe hypertension (SBP>180 & DBP>110)
0.0(0.0-2.9)
2.8(0.8-6.9)
5.9(2.9-10.6)
10.3(5.5-17.4)
3.9(1.5-8.4)
4.5(3.0-6.0)
N=467 N=441 N=338 N=275 N=258 N=1829 Level A hypertension (SBP>160& DBP>95)
1.5(0.6-3.1)
7.9(5.6-10.9)
17.0(13.4-21.1)
26.5(21.4-32.2)
24.4(19.3-30.1)
13.3(11.8-14.9)
Level B hypertension (SBP >140 & DBP>90)
5.4(3.5-7.8) 22.7(18.8-26.9) 38.1933.3-43.2) 49.5(43.4-55.5) 47.3(41.1-53.6) 29.0(27.0-31.1)
Level C hypertension (SBP>170 & DBP>100)
1.3(0.5-2.8)
4.8(3.0-7.2)
10.6(7.7-14.1)
20.4(15.8-25.6)
15.5(11.3-20.5)
9.0(7.7-10.3)
Total
Severe hypertension (SBP>180 & DBP>110)
0.4(0.1-1.5)
2.3(1.1-4.1)
5.7(3.6-8.5)
9.8(6.6-14.0)
4.7(2.4-8.0)
4.0(3.1-4.9)
Formatted

71
5.11.3: Prevalence of hypertension 5.11.3.1: For females Prevalence of Hypertension as defined by the lower level (systolic > or = 140 and or diastolic > or = 90mmHg), level B rises rapidly from 5.4% to 49.5% from the younger to the older age group. A similar rapid rise is observed for the higher Level A (systolic>160mmHg and /or diastolic of >95mmHg), from 1.5% to 24.4% from the younger to the older age group. Severe hypertension rises to a peak in the 55-64 year age group with the prevalence of 9.8% and appears to fall in the 60 + year age group with the prevalence of 4.7%, see Table 5.10c. Of note it is important to note the very high prevalence of Level B across all the provinces. 5.11.3.2:- .For males A similar pattern was also observed among males, see Table 5.10d below.
Formatted
Formatted
Formatted
Formatted
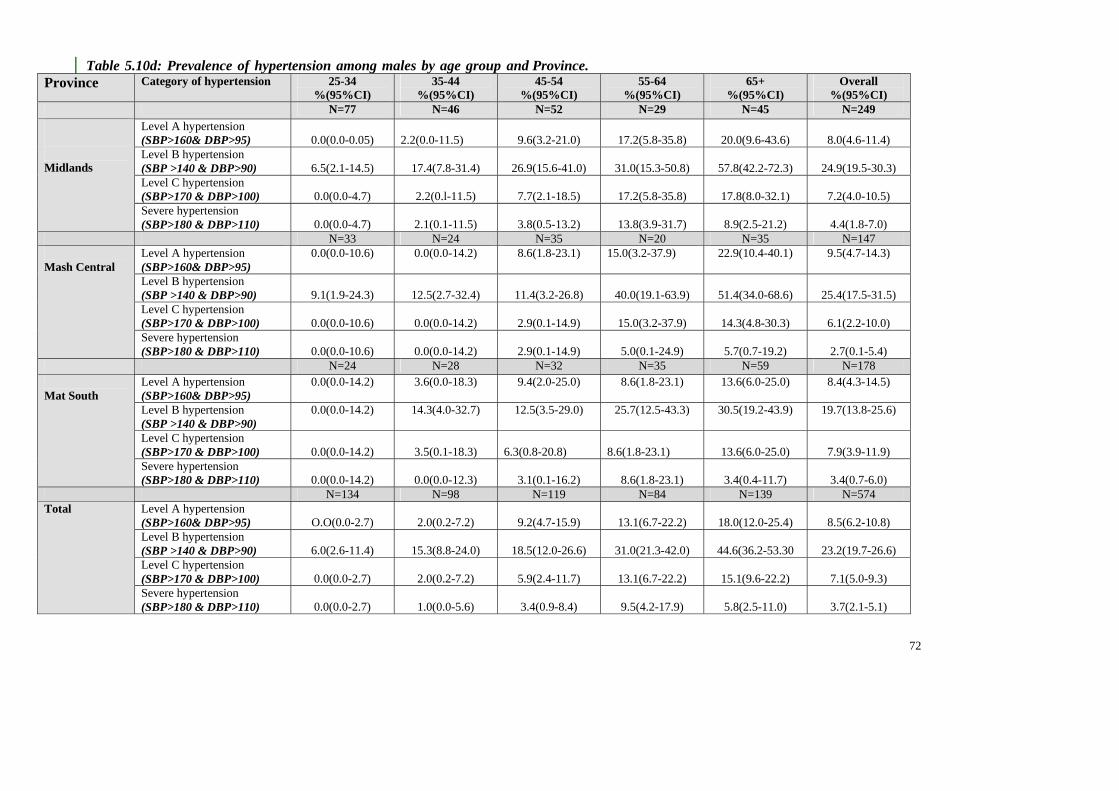
72
Table 5.10d: Prevalence of hypertension among males by age group and Province. Province Category of hypertension 25-34
%(95%CI) 35-44
%(95%CI) 45-54
%(95%CI) 55-64
%(95%CI) 65+
%(95%CI) Overall
%(95%CI) N=77 N=46 N=52 N=29 N=45 N=249
Level A hypertension (SBP>160& DBP>95)
0.0(0.0-0.05)
2.2(0.0-11.5)
9.6(3.2-21.0)
17.2(5.8-35.8)
20.0(9.6-43.6)
8.0(4.6-11.4)
Level B hypertension (SBP >140 & DBP>90)
6.5(2.1-14.5)
17.4(7.8-31.4)
26.9(15.6-41.0)
31.0(15.3-50.8)
57.8(42.2-72.3)
24.9(19.5-30.3)
Level C hypertension (SBP>170 & DBP>100)
0.0(0.0-4.7)
2.2(0.l-11.5)
7.7(2.1-18.5)
17.2(5.8-35.8)
17.8(8.0-32.1)
7.2(4.0-10.5)
Midlands
Severe hypertension (SBP>180 & DBP>110)
0.0(0.0-4.7)
2.1(0.1-11.5)
3.8(0.5-13.2)
13.8(3.9-31.7)
8.9(2.5-21.2)
4.4(1.8-7.0)
N=33 N=24 N=35 N=20 N=35 N=147 Level A hypertension (SBP>160& DBP>95)
0.0(0.0-10.6) 0.0(0.0-14.2) 8.6(1.8-23.1) 15.0(3.2-37.9) 22.9(10.4-40.1) 9.5(4.7-14.3)
Level B hypertension (SBP >140 & DBP>90)
9.1(1.9-24.3)
12.5(2.7-32.4)
11.4(3.2-26.8)
40.0(19.1-63.9)
51.4(34.0-68.6)
25.4(17.5-31.5)
Level C hypertension (SBP>170 & DBP>100)
0.0(0.0-10.6)
0.0(0.0-14.2)
2.9(0.1-14.9)
15.0(3.2-37.9)
14.3(4.8-30.3)
6.1(2.2-10.0)
Mash Central
Severe hypertension (SBP>180 & DBP>110)
0.0(0.0-10.6)
0.0(0.0-14.2)
2.9(0.1-14.9)
5.0(0.1-24.9)
5.7(0.7-19.2)
2.7(0.1-5.4)
N=24 N=28 N=32 N=35 N=59 N=178 Level A hypertension (SBP>160& DBP>95)
0.0(0.0-14.2) 3.6(0.0-18.3) 9.4(2.0-25.0) 8.6(1.8-23.1) 13.6(6.0-25.0) 8.4(4.3-14.5)
Level B hypertension (SBP >140 & DBP>90)
0.0(0.0-14.2) 14.3(4.0-32.7) 12.5(3.5-29.0) 25.7(12.5-43.3) 30.5(19.2-43.9) 19.7(13.8-25.6)
Level C hypertension (SBP>170 & DBP>100)
0.0(0.0-14.2)
3.5(0.1-18.3)
6.3(0.8-20.8)
8.6(1.8-23.1)
13.6(6.0-25.0)
7.9(3.9-11.9)
Mat South
Severe hypertension (SBP>180 & DBP>110)
0.0(0.0-14.2)
0.0(0.0-12.3)
3.1(0.1-16.2)
8.6(1.8-23.1)
3.4(0.4-11.7)
3.4(0.7-6.0)
N=134 N=98 N=119 N=84 N=139 N=574 Level A hypertension (SBP>160& DBP>95)
O.O(0.0-2.7)
2.0(0.2-7.2)
9.2(4.7-15.9)
13.1(6.7-22.2)
18.0(12.0-25.4)
8.5(6.2-10.8)
Level B hypertension (SBP >140 & DBP>90)
6.0(2.6-11.4)
15.3(8.8-24.0)
18.5(12.0-26.6)
31.0(21.3-42.0)
44.6(36.2-53.30
23.2(19.7-26.6)
Level C hypertension (SBP>170 & DBP>100)
0.0(0.0-2.7)
2.0(0.2-7.2)
5.9(2.4-11.7)
13.1(6.7-22.2)
15.1(9.6-22.2)
7.1(5.0-9.3)
Total
Severe hypertension (SBP>180 & DBP>110)
0.0(0.0-2.7)
1.0(0.0-5.6)
3.4(0.9-8.4)
9.5(4.2-17.9)
5.8(2.5-11.0)
3.7(2.1-5.1)

73
5.11.4: Discussion on prevalence of hypertension In general the prevalence of hypertension using lower or high cut-off point is high in the study population. There is a high prevalence of severe undiagnosed hypertension, with a prevalence of 4.0% for females and 3.7% for males. Considering undiagnosed severe hypertension the prevalence becomes significantly higher in the 45 -54 year age group and above.
Formatted


75
5.12.0: Biochemical measurements (STEP 3 of STEPS) A total of 1837 (60%) had biochemical measurements (glucose and lipids) done. Table 5.11a: Mean fasting blood sugar by sex, age group and province
Province Sex 25-34 N*
Mean (95%CI)
35-44 N*
Mean (95%CI)
45-54 N*
Mean (95%CI)
55-64 N*
Mean (95%CI))
65+ N*
Mean ((95%CI)
Overall N*
Mean ((95%CI) Male 51
4.9(4.5-5.3) 35
4.7(4.3-5.2) 42
5.0(4.6-5.4) 25
5.5(4.9-6.2) 37
5.8(5.1-6.5) 190
5.2(4.9-5.4) Midlands
Female 128 4.7(4.5-5.0)
122 5.2(4.7-5.6)
82 5.4(4.7-6.2)
51 5.2(5.0-5.5)
28 5.7(5.1-6.3)
411 5.1(4.9-5.3)
Male 29 4.8(4.4-5.2)
21 4.1(3.8-4.4)
24 5.0(4.4-5.5)
18 4.9(4.3-5.5)
25 4.1(3.7-4.5)
117 4.6(4.4-4.8)
Mash Central
Female 139 4.9(4.6-5.3)
104 4.7(4.5-5.0)
84 4.5(4.3-4.7)
60 4.5(4.2-4.9)
50 4.9(4.4-5.4)
437 4.7(4.6-4.9)
Male 19 5.6(5.0-6.1)
21 7.4(6.0-8.7)
24 6.1(3.8-8.4)
27 6.6(5.3-7.9)
46 5.5(5.2-5.9)
137 6.1(5.6-6.6)
Mat South
Female 104 5.7(5.4-6.1)
105 5.7(5.5-6.0)
142 5.8(5.4-6.1)
89 6.0(5.5-6.5)
115 5.7(5.4-6.1)
545 5.8(5.6-5.9)
Male 99 5.0(4.8-5.2)
77 5.3(4.8-5.8)
90 5.3(4.7-5.9)
70 5.8(5.2-6.4)
108 5.3(5.0-5.6)
444 5.3(5.1-5.5)
Total
Female 371 5.1(4.9-5.3)
331 5.2(5.0-5.4)
298 5.3(5.1-5.6)
200 5.4(5.1-5.6)
193 5.5(5.3-5.8)
1393 5.3(5.2-5.4)
National 470 5.1(4.9-5.2)
408 5.2(5.0-5.4)
388 5.3(5.1-5.5)
270 5.5(5.2-5.7)
301 5.4(5.2-5.6)
1837 5.3(5.2-5.4)
5.12.1: Mean fasting blood sugar Overall the mean fasting blood sugar levels was not different in all provinces, with the exception of Matebeleland South province, which showed high mean blood sugar levels and it was not different across all the age groups.
Formatted
Formatted

76
Table 5.11b:- Prevalence of diabetes mellitus among males by age group and province Province Sex 25-34
N* % (95% CI)
35-44 N*
% (95% CI)
45-54 N*
% 95% CI)
55-64 N*
% (95% CI)
65+ N*
% (95% CI)
Overall N*
% (95% CI) Fasting (>7.0) 51
3.9(0.5-13.5) 35
5.7(0.7-19.2) 42
2.4(0.1-12.6) 25
16.0(4.5-35.1) 37
10.8(3.0-25.4) 193
6.7(3.6-11.2) Midlands
Fasting >7.8 and 2HPP>=11.1)
50 0.0(0.0-7.1)
31 0.0(0.0-11.2)
39 2.6(0.1-13.5)
21 0.0(0.0-16.1)
34 5.9(0.7-19.7)
178 1.7(0.3-4.8)
Fasting (>7.0) 29 10.3(2.2-27.4)
21 0.0(0.0-16.1)
24 12.5(2.7-32.4)
18 5.6(0.1-27.3)
25 4.0(0.1-20.4)
119 6.7(2.9-12.8)
Mash Central
Fasting >7.8 and 2HPP>=11.1)
26 0.0(0.0-13.2)
17 0.0(0.0-19.5)
19 0.0(0.0-17.6)
13 0.0(0.0-24.7)
21 0.0(0.0-16.1)
98 0.0(0.0-3.7)
Fasting (>7.0) 19 10.5(1.3-33.1)
21 33.3(14.6-57.0)
24 8.3(1.0-27.0)
27 22.2(8.6-42.3)
46 13.0(4.9-26.3)
138 16.6(10.9-24.0)
Mat South
Fasting >7.8 and 2HPP>=11.1)
15 0.0(0.0-21.8)
20 5.0(0.1-24.9)
21 4.8(0.1-23.8)
26 15.4(4.4-34.9)
43 0.0(0.0-8.2)
126 4.8(1.8-10.2)
Fasting (>7.0) 99 7.1(2.9-14.0)
77 11.7(5.5-21.0)
90 6.7(2.5-13.9)
70 15.7(8.1-26.4)
108 10.2(5.2-17.5)
450 9.8(7.2-12.9)
Total
Fasting >7.8 and 2HPP>=11.1)
91 0.0(0.0-4.0)
68 1.5(0.0-7.9)
79 2.5(0.3-8.8)
60 6.7(1.8-16.2)
98 2.0(0.2-7.2)
402 2.2(1.0-4.2)
N* Indicates total number within age group 5.12.2: Prevalence of diabetes mellitus (both males and females) Prevalence of diabetes was defined using two cut-off point, a fasting greater than 7.0 and fasting of >7.8 and two-hour post-prandial glucose. Generally defining diabetes using a fasting blood sugar of >=7.0mmols/L gives a higher prevalence of diabetes compared to the use of the oral glucose tolerance test ( fasting .=7.8 and 2HPP>=11.1) in both sexes, see Tables 5.11a and 5.11b.
Formatted

77
Table 5.11c: Prevalence of diabetes mellitus among Females by age group and province
Province Sex 25-34 N*
% (95% CI)
35-44 N*
% (95% CI)
45-54 N*
% 95% CI)
55-64 N*
% (95% CI)
65+ N*
% (95% CI)
Overall N*
% (95% CI) Fasting (>7.0) 128
4.7(1.7-9.9) 122
7.4(3.4-13.5) 82
11.0(5.1-19.8) 51
5.9(1.2-16.2) 28
17.9(6.1-36.9) 428
7.5(5.2-10.4) Midlands
Fasting >7.8 and OGTT>11.1)
116 0.9(0.0-4.7)
112 0.9(0.0-4.9)
77 1.3(0.0-7.0)
47 0.0(0.0-7.5)
25 0.0(0.0-13.7)
394 0.8(0.2-2.2
Fasting (>7.0) 139 5.0(2.0-10.1)
104 3.8(1.1-9.6)
84 0.0(0.0-4.3)
60 5.0(1.0-13.9)
50 4.0(0.5-13.7)
450 3.6(2.0-5.7)
Mash Central
Fasting >7.8 and OGTT>11.1)
114 1.8(0.2-6.2)
89 1.1(0.0-6.1)
74 0.0(0.0-4.9)
51 2.0(0.0-10.4)
45 2.2(0.1-11.8)
382 1.3(0.4-3.0)
Fasting (>7.0) 104 15.4(9.1-23.8)
105 18.1(11.3-26.8)
132 14.4(8.9-21.6)
89 24.7(16.2-35.0)
115 18.3(11.7-26.5)
554 17.7(14.6-21.1)
Mat South
Fasting >7.8 and OGTT>11.1)
90 1.1(0.0-6.0)
92 3.3(0.7-9.2)
114 0.9(0.0-4.8)
77 2.6(0.3-9.1)
106 1.9(0.2-6.6)
488 1.8(0.8-3.5)
Fasting (>7.0) 371 7.8(5.3-11.0)
331 9.7(6.7-13.4)
298 9.4(6.3-18.3)
200 14.0(9.5-19.6)
193 14.5(9.9-20.3)
1432 10.2(8.7-11.9)
Total
Fasting >7.8 and OGTT>11.1)
320 1.3(0.3-3.2)
293 1.7(0.6-3.9)
265 0.8(0.1-2.7)
175 1.7(0.4-4.9)
176 1.7(0.4-4.9)
1264 1.3(0.8-2.1)
5.12.3: Prevalence of Impaired Glucose Tolerance (IGT) The overall prevalence of IGT ranged from 1.6% to 9.4% among females and 4.0% to 8.0% in males, see Tables 5.11d. It is worth noting that the prevalence in Matebeleland province is exaggerated.
Formatted
Formatted
Formatted

78
Table 5.11d: Prevalence of impaired glucose tolerance by age, sex and province
Province Sex 25-34 N*
% (95% CI)
35-44 N*
% (95% CI)
45-54 N*
% 95% CI)
55-64 N*
% (95% CI)
65+ N*
% (95% CI)
Overall N*
% (95% CI) Male 50
6.0(1.3-16.5) 31
3.2(0.1-16.7) 39
2.6(0.1-13.50 21
9.5(1.2-30.4) 34
0.0(0.0-10.3) 175
4.0(1.6-8.7) Midlands
Female 116 3.4(0.9-8.6)
112 2.7(0.6-7.6)
77 2.6(0.3-9.1)
47 4.3(5.1-14.5)
25 12.0(2.5-31.2)
377 3.7(2.0-6.2)
Male 26 7.7(1.0-25.1)
17 0.0(0.0-19.5)
19 10.5(13.0-33.1)
13 0.0(0.0-24.7)
21 0.0(0.0-16.1)
96 4.2(1.1-10.3)
Mash Central
Female 114 2.6(0.5-7.5)
89 1.1(0.0-6.1)
74 1.4(0.0-7.3)
51 2.0(0.1-10.4)
45 0.0(0.0-7.9)
373 1.6(0.6-3.5)
Male 15 6.7(0.2-32.0)
20 1.0(0.1-24.9)
21 4.8(0.1-23.8)
26 0.0(0.0-13.2)
43 16.3(6.8-30.7)
125 8.0(3.9-14.2)
Mat South
Female 90 11.1(5.5-19.5)
92 9.8(4.6-17.8)
114 7.0(3.1-13.6)
77 6.5(2.1-14.5)
106 12.3(6.7-20.1)
479 9.4(6.9-12.4)
Male 91 6.6(2.5-13.8)
68 2.9(0.4-10.2)
79 5.1(1.4-12.5)
60 3.3(0.4-11.5)
98 7.1(2.9-14.2)
396 5.3(3.3-8.0)
Total
Female 320 5.3(3.1-8.4)
293 4.4(2.4-7.5)
265 4.2(2.1-7.3)
175 4.6(2.0-8.8)
176 9.1(5.3-14.3)
1229 5.2(4.1-6.7)
Formatted
Formatted
Formatted
Formatted

79
Table 5.11e: - Mean Total cholesterol, HDL, LDL and Triglyceride among males by age group and Province. Province Lipid profiles 25-34
Mean (95%CI) 35-44
Mean (95%CI) 45-54
Mean (95%CI) 55-64
Mean (95%CI) 65+
Mean (95%CI) Overall
Mean (95%CI) N=60 N=34 N=53 N=25 N=36 N=208
Total Cholesterol 60 3.7(3.5-4.0)
34 3.9(3.6-4.3)
53 4.2(4.0-4.5)
25 4.6(4.0-5.1)
4.3(4.0-4.7)
4.1(4.0-4.2)
HDL Cholesterol 1.3(1.2-1.4)
1.3(1.1-1.4)
1.3(1.2-1.4)
1.5(1.3-1.6)
1.4(1.2-1.5)
1.3(1.2-1.4)
LDL Cholesterol 2.0(1.8-2.2)
2.1(1.9-2.4)
2.4(2.2-2.7)
2.5(2.1-2.9)
2.4(2.0-2.7)
2.3(2.1-2.4)
Midlands
Triglyceride 1.1(0.9-1.2)
1.5(1.1-1.8)
1.2(1.0-1.4)
1.3(1.0-1.6)
1.3(1.0-1.6)
1.2(1.1-1.3)
N=31 N=24 N=31 N=19 N=29 N=135 Total Cholesterol
4.2(3.7-4.7)
3.8(3.4-4.2)
4.1(3.8-4.4)
4.4(4.0-4.9)
4.2(3.8-4.7)
4.2(4.0-4.3) HDL Cholesterol 31
1.4(1.2-1.6)
1.2(1.1-1.4)
1.3(1.2-1.5)
1.3(1.1-1.5)
1.2(1.0-1.4)
1.3(1.2-1.4) LDL Cholesterol
2.4(2.0-2.9)
2.1(1.9-2.4)
2.2(2.0-2.5)
2.6(2.3-3.0)
2.6(2.2-2.9)
2.4(2.2-2.6)
Mash Central
Triglyceride 0.9(0.7-1.0) 1.0(0.8-1.2) 1.1(0.9-1.4) 1.1(0.9-1.4) 1.1(0.8-1.3) 1.0(0.9-1.1)
N=21 N=23 N=32 N=32 N=54 N=162 Total Cholesterol
4.2(3.7-4.7)
4.5(4.0-5.1)
4.4(4.0-4.8)
4.6(4.1-5.1)
4.9(4.6-5.3)
4.6(4.4-4.8) HDL Cholesterol
1.5(1.3-1.8)
1.5(1.2-1.7)
1.5(1.3-1.7)
1.5(1.3-1.7)
1.6(1.5-1.8)
1.5(1.4-1.6) LDL Cholesterol
2.2(1.8-2.6)
2.6(2.1-3.0)
2.4(2.1-2.7)
2.6(2.2-3.0)
2.8(2.5-3.1)
2.6(2.4-2.7)
Mat South
Triglyceride 1.1(0.9-1.4) 1.1(0.9-1.3) 1.1(0.9-1.2) 1.0(0.8-1.2) 1.3(1.1-1.5) 1.2(1.1-1.3)
N=112 N=81 N=116 N=76 N=119 N=504 Total Cholesterol
3.9(3.7-4.2)
4.1(3.8-4.3)
4.2(4.1-4.4)
4.6(4.3-4.8)
4.6(4.4-6.0)
4.3(4.2-4.4) HDL Cholesterol
1.3(1.2-1.4)
1.3(1.2-1.4)
1.4(1.3-1.5)
1.4(1.3-1.5)
1.4(1.3-1.5)
1.4(1.3-1.5) LDL Cholesterol
2.1(2.0-2.3)
2.3(2.1-2.4)
2.4(2.2-2.5)
2.6(2.4-2.8)
2.6(2.4-2.8)
2.4(2.3-2.5)
Total
Triglyceride 1.0(0.9-1.1)
1.2(1.0-1.4)
1.2(1.0-1.3)
1.2(1.0-1.3)
1.2(1.1-1.4)
1.2(1.1-1.3)
Formatted

80
Table 5.11f: Mean Total cholesterol, HDL, LDL and Triglyceride among females by age group and Province. Province Lipid profiles 25-34
Mean (95%CI) 35-44
Mean (95%CI) 45-54
Mean (95%CI) 55-64
Mean (95%CI) 65+
Mean (95%CI) Overall
Mean (95%CI) N=145 N=132 N=97 N=55 N=31 N=460
Total Cholesterol 3.9(3.7-4.1)
4.1(3.9-4.3)
4.5(4.3-4.7)
4.5(4.2-4.9)
4.8(4.5-5.2)
4.2(4.1-4.3)
HDL Cholesterol 145 1.2(1.1-1.3)
1.3(1.2-1.4)
1.5(1.4-1.6)
1.3(1.2-1.5)
1.5(1.3-1.7)
1.3(1.2-1.4)
LDL Cholesterol 2.3(2.1-2.4)
2.4(2.2-2.6)
2.5(2.3-2.7)
2.6(2.2-2.9)
2.6(2.4-2.9)
2.4(2.3-2.5)
Midlands
Triglyceride 1.0(0.9-1.1)
1.0(0.9-1.1)
1.3(1.1-1.4)
1.3(1.1-1.5)
1.4(1.1-1.8)
1.1(1.0-1.2)
N=164 N=120 N=101 N=75 N=64 N=524
Total Cholesterol 4.2(4.0-4.3)
4.0(3.8-4.2)
4.4(4.1-4.6)
4.1(3.9-4.3)
4.3(4.1-4.6)
4.2(4.1-4.3)
HDL Cholesterol 1.3(1.2-1.4)
1.2(1.1-1.3)
1.3(1.2-1.4)
1.3(1.2-1.4)
1.4(1.2-1.5)
1.3(1.2-1.4)
LDL Cholesterol 2.3(2.2-2.5)
2.3(2.2-2.5)
2.6(2.4-2.8)
2.3(2.1-2.5)
2.5(2.3-2.7)
2.4(2.3-2.5)
Mash Central
Triglyceride 1.1(1.0-1.2) 1.0(0.9-1.1) 1.0(0.9-1.1) 1.1(1.0-1.2) 1.0(0.9-1.2) 1.0(0.9-1.1)
N=114 N=131 N=152 N=106 N=141 N=644 Total Cholesterol
4.4(4.2-4.6)
4.6(4.4-4.8)
4.4(4.2-4.6)
4.6(4.4-4.9)
4.7(4.5-5.0)
4.6(4.5-4.7) HDL Cholesterol
1.4(1.3-1.5)
1.5(1.4-1.6)
1.4(1.3-1.5)
1.5(1.4-1.6)
1.6(1.5-1.7)
1.5(1.4-1.6) LDL Cholesterol
2.5(2.3-2.7)
2.5(2.3-2.7)
2.5(2.3-2.6)
2.7(2.5-2.8)
2.6(2.4-2.8)
2.5(2.4-2.6)
Mat South
Triglyceride 1.1(1.0-1.2) 1.2(1.0-1.3) 1.1(1.0-1.2) 1.1(1.0-1.2) 1.2(1.1-1.4) 1.1(1.0-1.2)
N=423 N=383 N=350 N=236 N=236 N=1628 Total Cholesterol
4.1(4.0-4.2)
4.2(4.1-4.4)
4.4(4.3-4.5)
4.4(4.3-4.6)
4.6(4.5-4.7)
4.3(4.2-4.4) HDL Cholesterol
1.3(1.2-1.5)
1.4(1.3-1.5)
1.4(1.3-1.5)
1.4(1.3-1.5)
1.5(1.4-1.6)
1.4(1.3-1.5) LDL Cholesterol
2.3(2.2-2.4)
2.4(2.3-2.5)
2.5(2.4-2.6)
2.5(2.4-2.7)
2.6(2.5-2.7)
2.5(2.4-2.6)
Total
Triglyceride 1.0(0.9-1.1)
1.0(0.9-1.1)
1.1(1.0-1.2)
1.1(1.0-1.2)
1.2(1.1-1.3)
1.1(1.0-1.2)
Formatted
Formatted

81
5.12.4: Lipid profiles for both males and females In considering total cholesterol, HDL-C and Triglycerides, only Total Cholesterol showed a rising trends with age, for both males and females, see Table 5.11e and f
Formatted

82
Table 5.11g: Prevalence of abnormal Cholesterol and HDL-Cholesterol among males by age group and province
Province Abnormal Lipid levels Total cholesterol (TCL)
25-34 % (95% CI)
35-44 % (95% CI)
45-54 % 95% CI)
55-64 % (95% CI)
65+ % (95% CI)
Overall % (95% CI)
N=60 N=34 N=53 N=25 N=36 N=208 Level A (TCL>=6.5 )
0.0(0.0-6.0)
0.0(0.0-10.3)
1.9(0.0-10.1)
8.0(1.0-26.0)
0.0(0.0-9.7)
1.4(0.3-4.2)
Level B (TCL>=5.2)
10.0(3.8-20.5)
8.8(1.9-23.7)
13.2(5.5-23.3)
28.0(12.1-49.4)
30.6(16.3-48.1)
16.3(11.6-22.1)
Midlands
HDL cholesterol (<=0.9) 11.7(4.8-22.6)
17.6(6.8-34.5)
17.0(8.1-29.8)
0.0(0.0-13.7)
2.8(0.1-14.5)
11.1(7.1-16.1)
N=31 N=24 N=31 N=19 N=29 N=134 Level A (TCL>=6.5 )
3.2(0.1-16.7)
0.0(0.0-14.2)
3.2(0.1-16.7)
5.3(0.1-26.0)
3.4(0.1-17.8)
3.0(0.8-7.5)
Level B (TCL>=5.2) 22.6(9.6-41.1)
12.5(2.7-32.4)
9.7(2.0-25.8)
15.8(3.4-39.6)
20.7(8.0-39.7)
16.4(10.6-23.8)
Mash Central
HDL cholesterol (<=0.9)
25.8(11.9-44.6)
20.8(7.1-42.2)
16.1(5.5-33.7)
21.1(6.1-45.6)
24.1(10.3-43.5)
21.6(15.0-29.6)
N=21 N=23
N=32 N=32 N=54 N=162
Level A (TCL>=6.5 )
0.0(0.0-16.1)
8.7(1.0-28.0)
3.1(7.1-16.2)
9.4(2.0-25.0)
5.6(1.2-15.4)
5.6(2.7-10.3)
Mat South
Level B (TCL>=5.2)
14.3(3.0-36.3)
26.1(10.2-48.4)
15.6(5.3-32.8)
25.0(11.5-43.4)
44.4(13.9-58.6)
28.4(21.6-36.0)
HDL cholesterol (<=0.9)
9.5(11.7-30.4)
13.0(2.8-33.6)
15.6(5.3-32.7)
9.4(2.0-25.0)
7.5(2.1-18.2)
10.6(6.3-16.4)
N=112 N=81 N=116 N=76 N=119 N=504 Level A (TCL>=6.5 )
0.9(0.0-4.9)
2.5(0.3-8.6)
2.6(0.5-7.4)
7.9(3.0-16.4)
3.4(0.9-8.4)
3.2(1.8-5.1)
Level B (TCL>=5.2)
14.3(8.4-22.2)
14.8(7.9-24.4)
12.9(7.4-20.4)
23.7(14.7-34.8)
34.5(26.7-43.7)
20.2(16.8-24.0)
Total
HDL cholesterol (<=0.9) 15.2(9.1-23.2)
17.3(9.8-27.3)
16.4(10.2-24.4)
9.2(3.8-18.1)
10.2(5.4-17.1)
13.7(10.8-17.0)
5.12.5: Prevalence of hypercholesterolemia Using a high total cholesterol level of greater or equal to 6.5mmol/L to define hypercholesterolemia, the prevalence was 3.2% in males and 4.7% among females, when using a lower cut-off point of 5.2 mmol/L the prevalence was 20.2% in males and 21.3% among females.
Formatted
Formatted
Formatted

83
Table 5.11h: Prevalence of abnormal cholesterol and HDL Cholesterol among females by age group and province Province Abnormal Lipid levels
Total cholesterol (TCL) 25-34
% (95% CI) 35-44
% (95% CI) 45-54
% 95% CI) 55-64
% (95% CI) 65+
% (95% CI) Overall
% (95% CI) N=145 N=132 N=97 N=55 N=31 N=460
Level A (TCL>=6.5 )
1.4(0.2-4.9)
2.3(0.5-6.5)
2.1(0.3-7.3)
5.5(1.1-15.1)
3.2(0.1-16.7)
2.4(1.2-4.2)
Level B (TCL>=5.2)
11.7(7.0-18.1)
18.2(12.0-25.8)
23.7(15.7-33.4)
21.8(11.8-35.0)
41.9(24.5-60.9)
19.3(15.8-23.3)
Midlands
HDLC- (<=0.9) 14.5(9.2-21.3)
18.2(12.0-25.8)
4.2(1.1-10.3)
16.4(7.8-28.8)
6.5(0.8-21.4)
13.1(10.1-16.5)
N=164 N=120 N=101 N=75 N=64 N=524
Level A (TCL>=6.5 )
1.8(.04-5.3)
3.3(0.9-8.3)
5.0(1.6-11.1)
1.3(0.0-7.2)
1.6(0.0-8.4)
2.7(1.5-4.4)
Level B (TCL>=5.2) 14.6(9.6-21.0)
8.3(4.1-14.8)
19.8(12.5-28.9)
17.3(9.6-27.8)
17.2(8.9-28.7)
14.9(11.9-18.2)
Mash Central
HDL-C (<=0.9)
11.0(6.6-16.8) 16.7(10.5-24.6) 12.9(7.0-21.0) 18.4(10.5-29.0) 10.9(4.5-25.2) 13.7(10.9-17.0)
N=114 N=131 N=152 N=106 N=141 N=644
Level A (TCL>=6.5 )
7.9(3.7-14.5) 7.6(3.7-13.6) 3.9(1.5-8.4) 8.5(4.0-15.5) 12.1(7.2-18.6) 7.9(6.0-10.3) Mat South
Level B (TCL>=5.2)
22.8(15.5-31.6) 27.5(20.0-36.0) 23.0(16.6-30.5) 30.2(21.7-39.9) 36.2(28.3-44.7) 28.0(24.5-31.6)
HDL-C (<=0.9)
9.7(5.0-16.8) 7.6(3.7-13.6) 7.9(4.2-18.5) 6.7(2.7-13.3) 10.6(6.1-16.9) 8.6(6.5-11.0)
N=423 N=383 N=350 N=236 N=236 N=1628
Level A (TCL>=6.5 )
3.3(1.8-5.5)
4.4(2.6-7.0) 3.7(2.0-6.3) 5.5(3.0-9.2) 8.1(4.9-12.3)
4.7(3.7-5.8)
Level B (TCL>=5.2)
15.8(12.5-19.7) 18.3(14.5-22.5) 22.3(18.0-27.0) 24.2(18.8-30.1) 31.8(25.9-38.1) 21.3(19.3-23.4)
Total
HDL-C (<=0.9) 11.8(8.9-15.3) 14.1(10.8-18.0) 8.3(5.7-11.7) 12.7(8.7-17.6) 10.2(6.6-14.8) 11.5(10.0-13.2)
5.12.6: Prevalence of abnormal LDL-Cholesterol and Triglycerides levels in both sexes Generally there is a trend of rising high LDL-Cholesterol among males and females, but there are several odd prevalences in various age groups and prevalences, Table 5.11i and j. In general for both males and females, there were few respondents with high triglycerides as defined by a
Formatted
Formatted
Formatted

84
level of >=4.1mmolL. When considering borderline Trigylcerides elevations of between 2.3mmol/L and 4.49mmol/L, the prevalence was 5.2% for males and 4.2mmol/L for females.
Formatted

85
Table 5.11i: Prevalence of abnormal H-LDL-C and H-Triglycerides levels among males by age group and Province. Province Category of lipids 25-34
%(95%CI) 35-44
%(95%CI) 45-54
%(95%CI) 55-64
%(95%CI) 65+
%(95%CI) Overall
%(95%CI) N=60 N=34 N=53 N=25 N=36 N=204
High LDL Cholesterol (>=4.1) 0.0(0.0-6.0) 0.0(0.0-10.9) 3.8(0.5-13.2) 8.0(1.0-26.0) 5.7(0.7-19.2) 2.9(1.1-6.3)
Borderline LDL Cholesterol (3.4-4.09)
5.0(1.0-13.9) 3.1(0.1-16.2) 5.8(1.2-15.9) 8.0(1.0-26.0) 17.1(6.6-33.6) 7.4(4.2-11.8)
High Triglyceride (>=4.5) 0.0(0.0-6.0) 2.9(0.1-15.3) 0.0(0.0-6.7) 0.0(0.0-13.7) 0.0(0.0-9.7) 0.5(0.0-2.6)
Midlands
Borderline Triglyceride (2.3-4.49)
1.7(0.0-8.9) 11.8(3.3-27.5) 3.8(0.5-13.0) 8.0(1.0-26.0) 13.9(4.7-29.5) 6.7(3.7-11.0)
N=31 N=24 N=31 N=19 N=29 N=134 High LDL Cholesterol (>=4.1) 6.5(0.8-21.4) 0.0(0.0-14.2) 3.2(0.1-16.7) 5.3(0.1-26.0) 3.4(0.1-17.8) 3.7(1.2-8.5)
Borderline LDL Cholesterol (3.4-4.09)
19.4(7.5-37.5) 8.3(1.0-27.0) 3.2(0.1-16.7) 5.3(0.1-26.0) 17.2(5.8-35.8) 11.2(6.4-17.8)
High Triglyceride (>=4.5) 0.0(0.0-11.2) 0.0(0.0-14.2) 0.0(0.0-11.2) 0.0(0.0-17.6) 0.0(0.0-11.9) 0.0(0.0-2.7)
Mash Central
Borderline Triglyceride (2.3-4.49)
0.0(0.0-11.2) 0.0(0.0-14.2) 6.5(0.8-21.4) 5.3(0.1-26.0) 3.4(0.1-17.8) 3.0(0.8-7.5)
N=21 N=23 N=32 N=32 N=53 N=162 High LDL Cholesterol (>=4.1) 0.0(0.0-16.1) 4.3(0.1-21.9) 3.1(0.1-16.2) 9.4(2.0-25.0) 9.4(3.1-20.7) 6.2(3.0-11.1)
Borderline LDL Cholesterol (3.4-4.09)
14.3(3.0-36.3) 17.4(5.0-38.8) 9.4(2.0-25.0) 6.3(0.1-20.8) 20.7(10.8-34.1) 14.3(9.3-20.7)
High Triglyceride (>=4.5) 0.0(0.0-16.1) 0.0(0.0-14.8) 0.0(0.0-10.90) 0.0(0.0-10.9) 0.0(0.0-6.6) 0.0(0.0-2.3)
Mat South
Borderline Triglyceride (2.3-4.49)
0.0(0.0-16.1) 4.3(0.1-21.9) 0.0(0.0-10.9) 6.3(0.8-20.1) 9.3(3.1-20.3) 4.9(2.2-9.5)
N=112 N=81 N=116 N=76 N=119 N=504 High LDL Cholesterol (>=4.1) 1.8(0.2-6.3) 1.3(0.0-6.9) 3.5(1.0-8.7) 7.9(3.0-16.4) 6.8(3.0-13.0) 4.2(2.6-6.4)
Borderline LDL Cholesterol (3.4-4.09)
10.7(5.7-18.0) 8.9(3.6-17.4) 6.1(2.5-12.1) 6.6(2.2-14.7) 18.8(12.2-27.2) 10.6(8.1-13.7)
High Triglyceride (>=4.5) 0.0(0.0-3.2) 1.2(0.0-6.7) 0.0(0.0-3.1) 0.0(0.0-4.7) 0.0(0.0-3.1) 0.2(0.0-1.1)
Total
Borderline Triglyceride (2.3-4.49)
0.9(0.0-4.9) 36.2(2.0-13.8) 3.4(0.9-8.6) 6.6(2.2-14.7) 9.2(4.7-15.9) 5.2(3.4-7.5)
Formatted
Formatted

86
Table 5.11j:- Prevalence of abnormal lipids levels among females by age group and Province. Province Category of hypertension 25-34
%(95%CI) 35-44
%(95%CI) 45-54
%(95%CI) 55-64
%(95%CI) 65+
%(95%CI) Overall
%(95%CI) N=145 N=132 N=96 N=55 N=31 N=476
High LDL Cholesterol (>=4.1) 4.2(1.5-8.8) 5.3(2.2-10.7) 6.1(2.3013.1) 9.3(3.1-20.3) 3.3(0.1-17.2) 5.5(3.6-8.0)
Borderline LDL Cholesterol (3.4-4.09)
5.6(2.4-10.7) 5.3(2.2-10.7) 8.3(3.7-15.8) 3.7(0.5-12.7) 13.3(3.8-30.7) 6.4(4.3-9.0)
High Triglyceride (>=4.5) 0.0(0.0-2.5) 0.0(0.0-2.8) 0.0(0.0-3.7) 18.2(0.0-9.7) 0.0(0.0-11.2) 0.2(0.0-1.2)
Midlands
Borderline Triglyceride (2.3-4.49)
1.4(0.2-4.9) 2.3(0.5-6.5) 8.2(3.6-15.6) 18.2(0.0-9.7) 12.9(3.6-29.8) 3.8(2.3-5.9)
N=164 N=120 N=101 N=75 N=64 N=540 High LDL Cholesterol (>=4.1) 3.7(1.4-7.8) 4.2(1.4-9.5) 5.9(2.2-12.5) 4.0(0.8-11.2) 4.7(1.0-13.1) 4.5(2.9-6.6)
Borderline LDL Cholesterol (3.4-4.09)
6.8(3.4-11.7) 4.2(1.4-9.5) 11.9(6.3-19.8) 9.3(3.8-18.3) 10.9(4.5-21.2) 8.3(6.2-11.0)
High Triglyceride (>=4.5) 0.0(0.0-2.2) 0.8(0.0-4.6) 0.0(0.0-3.6) 0.0(0.0-4.8) 0.0(0.0-5.6) 0.2(0.0-1.0)
Mash Central
Borderline Triglyceride (2.3-4.49)
4.9(2.1-9.4) 4.2(1.4-9.5) 0.0(0.0-3.6) 5.3(1.5-13.1) 3.1(0.4-10.8) 3.5(2.1-5.4)
N=114 N=131 N=152 N=106 N=141 N=659 High LDL Cholesterol (>=4.1) 8.0(3.7-14.6) 6.9(3.2-12.6) 5.4(2.3-10.3) 7.6(3.3-14.5) 10.9(6.2-17.3) 7.7(5.8-10.0)
Borderline LDL Cholesterol (3.4-4.09)
6.2(2.5-12.3) 11.5(6.6-18.2) 8.1(4.2-13.6) 13.3(7.5-21.4) 11.6(6.8-18.1) 9.8(7.7=12.4s)
High Triglyceride (>=4.5) 0.0(0.0-3.2) 0.0(0.0-2.8) 0.7(0.0-3.6) 0.0(0.0-3.4) 0.7(0.0-3.9) 0.3(0.0-1.1)
Mat South
Borderline Triglyceride (2.3-4.49)
4.4(1.4-9.4) 5.3(2.2-10.7) 6.6(3.2-11.8) 4.7(1.5-10.7) 5.0(2.0-10.0) 5.2(3.6-7.1)
N=421 N=383 N=350 N=236 N=236 N=1675 High LDL Cholesterol (>=4.1) 5.0(3.1-7.5) 5.5(3.4-8.3) 5.8(3.6-8.8) 6.8(4.0-10.9) 8.2(5.0-12.5) 6.0(4.9-7.3)
Borderline LDL Cholesterol (3.4-4.09)
6.2(4.1-8.9) 7.1(4.7-10.1) 9.2(6.4-12.8) 9.8(6.3-14.4) 11.6(7.8-16.5) 8.4(7.1-9.8)
High Triglyceride (>=4.5) 0.0(0.0-0.9) 0.3(0.0-1.4) 0.3(0.0-1.6) 0.4(0.0-2.3) 10.4(0.0-2.3) 0.2(0.1-0.6)
Total
Borderline Triglyceride (2.3-4.49)
3.5(2.0-5.8) 3.9(2.2-6.4) 5.1(3.1-8.0) 4.2(2.1-7.7) 5.5(3.0-9.2) 4.2(3.3-5.3)
Formatted

87
6.0: DISCUSSION Zimbabwe national non-communicable disease risk factor survey was carried out in 3 of the 10 provinces of Zimbabwe namely Mashonaland Central, Midlands and Matebeleland South. The field survey was conducted in May and June 2005 and biochemical samples were run in the months of July and August 2005. Data entry for Step 1 and Step 2 data was carried out as soon as data became available to the data management team. Step 3 data became available in October and data entry was carried out when data quality checks were completed in November. Report writing started in September and a preliminary report became available in December 2005. A total of 3,081 respondents were included in the survey against an estimated sample size of 3,000. The response rate for Step 1 was 80% for and for Step 2 70% taking Step 1 accrual as being 100%. 6.1: Demographic profile The preponderant proportion of respondents was young in Midlands and Mashonaland with more than 50% being 44 years old or younger. In Matebeleland, however over 62.5% were aged 45 years and or higher. This was probably related to differences in sampling strategy rather than any real difference in the age structure of the provinces. Because of the specific lower cut-off age of 25 years, most respondents were married. Significantly there were 20.1% who were widowed. Further analysis of this is necessary to determine if there are characteristics of this group which may indicate issue related to prevalent conditions such as HIV/AIDS. The level of education of respondents was high with 85.7% having achieved at lease a primary level of education. This is consistent with the high literacy in Zimbabwe, with a literacy rate of 90% in men and 80% in women. Unemployment was high in this survey. Variation in the unemployment levels among provinces was probably a reflection of the rural urban mix of the survey respondents. 6.2: Lifestyle Factors Alcohol consumption was a male preserve in keeping with common local knowledge. Overall up to 57.9% or male respondents reported ever consuming alcohol compared to only 13.3% of female respondents admitting to the habit. Increasing age was also a determinant of a higher proportion of current alcohol consumption. Alcohol consumption appeared higher in Midlands province compared to the other provinces. Current tobacco consumption increased with age and was highest in the 65+ age group, especially in Midlands province. Similar to alcohol consumption males were the predominant users of tobacco products. Physical inactivity was reported to be high at work, transportation and leisure in all provinces. The items of the questionnaire on physical inactivity were probably not adequately adopted to suit lifestyles of the survey communities. 6.3: Anthropometric measurements High grades of obesity as measured by BMI were more prevalent in females. The prevalence of grade 2 obesity was 6 times more in females than in males. Severe obesity with a BMI of >40 was only noted in females with a prevalence of 1.2%. Central obesity as assessed by Waist/Hip ratio was more prevalent among females across all age groups and in all provinces. 6.4: Dietary factors, FRAT and Food Frequency Distribution. Analysis will be presented in a later report. 6.5: Hypertension A history of hypertension increased with increasing age in all provinces and was highest

88
among females. Prevalence of hypertension was generally high in the survey respondents irrespective of whether a high or lower cutoff level was used. The prevalence of hypertension rose with age and was more common in females. There is a high prevalence of severe undiagnosed hypertension in both males and females. 6.6: Diabetes mellitus A history of diabetes mellitus was obtained in 2.4% of the survey respondents. Presence of diabetes increased with age. Using a fasting blood glucose definition of diabetes mellitus with a cutoff level of > 7mmol/l gave a higher prevalence of diabetes compared to the use of the oral glucose tolerance test. Diabetes prevalence figures by fasting blood glucose averaged 10.2% while OGTT gave a prevalence of 1.3%. The prevalence of diabetes mellitus if we consider those with a history and those diagnosed with the condition on GTT was 3.7% on average. Matebeleland South province appeared to have a higher prevalence of diabetes diagnosed by fasting blood glucose. Further analysis of this data is required to determine its validity. 6.7: Lipids Hypercholesterolaemia using a high cutoff level of >6.5 mmol/l was noted in 1.4% to 5.6% of respondents. An abnormally high prevalence was noted when using a lower cut off point of 5.2 mmol/l. These data need further review as previous studies have noted lower levels of cholesterol in this population. Protective levels of HDL cholesterol defined as >0.9 mmol/l was noted in 13.7% among males and in 11.5% of female respondents. Borderline elevated triglyceride levels were noted in 10.6% of respondents overall.

89
7.0: LIMITATIONS OF THE SURVEY Conducting a survey and putting in place a strategy for regular surveys as part of surveillance is expensive and resource intensive. It therefore took long to plan and execute this survey with several changes in design framework and definitions, which appear to occur frequently in this field. Designing a community-based survey such as this one is fraught with difficulties in ensuring representativeness of the sample chosen. In this survey there was a preponderance of female respondents because of the pattern of employment of males and females which also influences urban rural migration. 8.0: CONCLUSIONS There is a high prevalence of modifiable risk factors of non-communicable diseases in Zimbabwe. Alcohol consumption and tobacco consumption is high especially among males across all provinces. Other lifestyle factors such as overweight and central obesity were noted to be generally high especially among females. The prevalence of both diagnosed and undiagnosed hypertension and diabetes mellitus was found to be high. In this survey the prevalence of abnormal lipids was noted to be significant. In this survey provincial differences in the prevalence and pattern of various risk factors was noted. It is therefore important to identify reasons for such differences so as to develop generalizable principles for the implementation of national intervention strategies. 9.0: RECOMMENDATIONS Given the emerging database of a significant prevalence of non-communicable diseases risk factors in Zimbabwe a national policy framework needs to be developed to address preventive, control and palliative needs of non-communicable diseases in the country. Tools are now available to collect important risk factors of non-communicable diseases such as was used in this survey and strategies need to be put in place to conduct surveillance of these risk factors in a standardized manner.

90
10.0: REFERENCES American Heart Association. Recommendations for Human Blood Pressure Determination for Sphygmomanometers. Dallas:AHA, 1980. Castle WM. Coronary heart disease risk factors in black and white men in Zimbabwe and the effect of living standards. S Afr Med J 1982; 61:926-9. Central Statistical Office. Annual Report 1992 Gomo et al. Prevalence of hypertension in three different geographic areas. (in press, 1999). Gomo et al. Risk factors for CVD in three geographic areas with different degrees of urbanization (in press, 1999). Matenga JA, Allain TJ, Wilson AO, Adamchek DJ, Senzanje B, Mushangi E and GomoZ. Hypertension management in Zimbabwe-awareness, treatment and blood pressure control. S Afr Med J 1997; 87(10): 1371-3. Matenga J, Kitai I, Levy L. Strokes among black people in Harare, Zimbabwe: results of computed tomography and associated risk factors. Br Med J 1986; 292:1649-51. Mudiayi TK, Onyanga-Omara A and Gelman ML. Trends of morbidity in general medicine at united Bulawayo Hospitals, Bulawayo, Zimbabwe. C Afr J Med. 1997; 43(8): 213-4. Murray CDL and Lopez AD. Global mortality, disability and the contribution of risk factors: Global burden of disease study. Lancet 1997a; 349: 1436-42. Murray CJL and Lopez AD. Mortality by cause for eight regions of the world: Global burden of disease study. Lancet 1997b; 349: 1269-76. Murray CDL and Lopez AD. Alternative projections of mortality and disability by cause, 1990-2020: Global burden of disease study. Lancet 1997c; 349:1498-504. Razum O. Monitoring cardiovascular diseases in Zimbabwe: a review of needs and options. C Afr J Med, 1997; 42(4): 120-4. Steyn K, Jooste Pl, Bourne L, Fourie J, Badenhorst CJ, Bourne DE, Langenhoven ML, Lombardo CJ, Turter H, Katzenellenbogen J, Marias M and Oelofse A. Risk factors for coronary heart disease in the black population of the cape Peninsula. The Brisk study. S Afr Med J, 1991;79:480-5. Wilson and Nhiwatiwa, 1992. Does Zimbabwe need geriatric services? Central Afrcian Journal Medince, 1992; 38: 14-6. Nigel U. Taking poverty to heart Non Communicable diseases and the poor. University of

91
Newcastle, Department of Diabetes and Epidemiology & Public Health. March 2001a Insight Health Issue Number 1. Murray CJL, Lopez AD, eds. The Global Burden of Disease: A Comprehensive Assessment of Mortality and Disability From Diseases, Injuries and Risk Factors in 1990 and projected to 2020. Cambridge, Mass: Harvard University Press: 1996. Global Burden of Disease and Injury Series: Volume 1. World Health Organization. World Health Organization Afro region on Non-Communicable Diseases. Regional Strategy for 2000 to 2010. Fact Sheet 28th August-2 September 2000. Nigel U et al. Theme Papers. Non-Communicable diseases in Sub-Saharan Africa: Where do they feature in health research agenda? Policy and Practice. Bulletin of the World Health Organization. Volume 79. Number 10. Geneva 2001b. World Health Organization. New WHO Surveillance tool by WHO. The Surf Report 1. May 2003. Geneva. Setel P et al. Cause-specific adult mortality: evidence from community based surveillance-selected sites, Tanzania, 1992-1998. Morbidity and Mortality Weekly Report, 2000, Volume 49; 416-419. Fourie J, Steyn K, EDS. Chronic diseases of lifestyle in South Africa. Review of research and identification of essential health research priorities. Cape Town, Medical School Research Council, 1995. Jadue L. et al. Risk factors for non-communicable diseases: methods and global results of the CARMEN program basal survey. Bonita R, de Courten M, Dwyer T, Jamrozik K, Winkelmann R. Surveillance of risk factors for noncommunicable disease: The WHO STEPwise approach. Geneva, World Health Ogranization, 2002. Bonita R, de Courten M, Dwyer T, Jamrozik K, Winkelmann T. Surveillance of risk factors for noncommunicable diseases: The WHO STEPwise approach. Summary. Geneva, World Health Organization. 2001. World Health Organization. Global strategy for the prevention and control of noncommunicable diseases. Report by the Director General. A53/4. Fifty-third World Health Assembley, May 2000. WHO, Geneva.2000.

92
APPENDIX: Zimbabwe Non-Communicable Disease Survey (ZiNCoDS) Questionnaire
93
Zimbabwe Non-Communicable Disease Survey (ZiNCoDS) – 2005 Demography and Health History Questionnaire Questionnaire checked in the field by: Name.…………………………… Signature ……..……… Date………..……. Team Leader Name.…………………………… Signature ……..……… Date………..……. Provincial Supervisor
Respondent Id Number

94
Province
Midlands Mashonaland Central Matebeleland South
11. Kwekwe 12. Gweru 13. Zvishavane 14. Chirumanzi 21. Bindura 22. Mazowe 23. Guruve 24. Centenary 31. Bulilima 32. Gwanda 33. Insiza 34. Umzingwane
Community
1. Urban 2. Rural
Health Centre 111. Zhombe Hospital 112. Mbizvo II Clinic 113. Silobela Clinic 114. Munyati Clinic 121. Mkoba Poly 122. Monomotapa 123. Ivene 124. Mkoba I 131. Shabane Mine Hospital 132. Vukuzenzele 133. Mabasa 134. Matenda 141. Holy Cross Hospital 142. St. Theressa Hospital 143. Hama Clinic 144. Chzhou 211. Manhenga 212. Chipadze clinic 213. Chiwaridzo clinic 214. Trojan mine clinic 221. St Alberts Mission 222. Chawarura Rural HC 223. Muzarabani Rural clinic 224. David Nelson clinic 231. Chitsungo Mission H 232. Mushumbi Pools RHC 233. Bepura RHC 234. Shinje RHC 241. Rosa rural hospital 242. Nyakudya 243. Bare clinic 244.Howard hospital 311. Plumtree Hospital 312. Dombodema RHC 313. Dingumuzi Clinic 314. Figtree Clinic 321. Manama Hospital 322. Buvume Clinic 323. Jahunda Clinic 324. Vumbachikwe Clinic 331. Shangani Hospital 332. Avica Hospital 333. Insiza RHC 334. Shangani Mine Clinic 341. Esigodini Hospital 342. Esibomvu Clinic 343. Nhangano Clinic 344. Mzingwane Clinic
D D M M Y Y Date of interview 0 5

95
DEMOGRAPHIC DATA
1. Surname _____________________ (Zita remhuri)
Other names_______________________ (mamwe mazita)
3. Sex (Male-1, Female-2)
For Females Only (Age 25 – 50 years), 3a. When was your last LMP ( Makagumisira rinhi kutevera/kugeza?) D D M M Y Y
2. Residential address (kwamunogara) ______________________________ ______________________________ ______________________________ ______________________________
3b. Are you pregnant Mune pamuviri here? 1. Yes 2. No
D D M M Y Y 3b. Date of birth (zuva ramakaberekwa)
Age (makore) if is unknown code 99
4.What is your marital status? (Makaroorwa/makaroora)
1. Single (handina kuroora/rwa) 2. Married (ndakaroora/rwa 3. Divorced (takarambana) 4. Widowed (ndirishirikadzi/ndakafirwa) 5. Separation (takambosiyana parizvino) 6. Cohabiting (tirikungogarisana)
5. What is the highest level of education attained (Makadzidza kusvika papi?)
1. Never 2. Primary 3. Secondary 4. Tertiary

96
6. What is your main occupation (Munoita basa rei?) Specify______________________
1. Informal 2. Formal skilled 3. Housewife 4. Not employed 5. Student 6. Others (If 3, 4 and 5 Go to Q8)
7. What is your monthly Income? (Munowana /munotambira marii pamwedzi?)
8. Additional/Other sources of income $________________ per____________ Imarii yamunowana nedzimwe nzira pamwedzi?
Tobacco Use
9. Do you currently smoke or use any tobacco products, such as cigarettes, cigars, pipes, snuff, chew tobacco? Munoputa fodya here?
1. Yes 2. No (Go to Q13)
10. If yes, Do you currently smoke tobacco products only? such as cigarettes, cigars or pipes and not snuff or chew tobacco Munoputa fodya chete here?
1. Yes 2. No
11. How old were you when you first started smoking or using tobacco regularly? Makatanga kuputa fodya zuva nezuva muine makore Mangani?
Code 99 if doesn’t remember
12. On average, how many of the following do you smoke each day? Munoputa fodya ngani pazuva dzemhando idzi? (Code 99 for don’t know) Go to 14 (skip 13a and 13b)
1. Manufactured cigarettes Dzemidzanga 2. Hand-rolled cigarettes Chimonera 3. Pipe fillings of tobacco Chikwepa
EXPANDED: TOBACCO USE 13a. If not currently a smoker-In the past, did you ever smoke regularly? Munguva yapfuura maimboputa fodya mazuva ose here?
1. Yes 2. No (Go to Q16)
13b. If yes How old were you when you stopped smoking regularly? Maiva nemakore mangani pamakagumisira kuputa mazuva ose?
Code 99 if doesn’t remember
$...............................

97
14. Do you currently use any smokeless tobacco such as (snuff, chewing tobacco) Parizvino munoputa fodya imwe isiri yomudzanga here sezvakaita bute, yekutsenga?
1. Yes 2. No (Go to Q16)
15. On average, how many times a day do you use….. (record for each type) Pazuva munoputa kangani? Other specify________________________ (code 99 for don’t know)
1. Snuff, by mount 2. Snuff, by nose 3. Chewing tobacco 4. Others

98
ALCOHOL CONSUMPTION ( SECTION A) In this section we shall ask you questions about alcohol consumption. (Muchikamu chino tichakubvunzai nezve kumwa doro/hwahwa) 16a. Have you ever consumed a drink that contains alcohol such as beer, wine, spirit, fermented cider, etc? Makambonwa zvinodhaka zvakaita sedoro, waini, tototo here?
1. Yes 2. No (Go to Q19)
16b. Have you consumed alcohol within the past 12 months? Makambonwa zvinodhaka pamwedzi gumi nemiviri yapfuura?
1. Yes 2. No (Go to Q19)
17. In the past 12 months, how frequently have you had at least one drink? (Read responses) Mumwedzi gumi nemiviri yapfuura , kangani kamakambonwa zvinodhaka kamwechete kana kupfuura?
1. 5 or more days per week 2. 1 – 4 days/week 3. 1-3 days/month 4. Les than once month
18. During each day of the past 7 days, how many standard drinks of any alcoholic drink did you have each day? Pamazuva manomwe apfuura makanwa doro rakawanda zvakadiii pazuva roga roga? (code 99 for don’t know)
1. Monday 2. Tuesday 3. Wednesday 4. Thursday 5. Friday 6. Saturday 7. Sunday
DIET
In this section we are going to ask you questions about fruits and vegetables that you usually eat. Muchikamu chino tichakubvunzai pamusoro pemichero nemirivo yamunowanzodya 19a. In a typical week, how many days do you eat fruit? Munodya michero mazuva mangani pasvondo?
Number of days
19b. How often do you eat fruits per day? Munodya michero kangani pazuva?
Number of servings

99
20a. In a typical week, on how many days do you eat vegetables? Munodya muriwo mazuva mangani pasvondo?
Number of days
20b. How often do you eat vegetables per day? Munodya muriwo kangani pazuva?
Number of servings
EXPANDED: DIET 21. Are your meals usually prepared at home? Kudya kwenyu kunobikwa pamba penyu here?
1.Yes 2. No
22. What type of oils or fat is most often used for meal preparation in your household? Munonyanyoshandisa mhando ipi yemafuta pakubika? (code 99 for don’t know)
1. Vegetable oil 2. Lard 3. Butter 4. Margarine 5. Peanut butter 6. None in particular 7. None used 8. Other Specify_________________
PHYSICAL ACTIVITY
I am going to ask you about the time you spend doing different types of physical activity. Please answer these questions even if you do not consider yourself to be an active person. Think first about the time you spend doing work. Think of work as the things that you have to do such as paid or unpaid work, household chores, digging, harvesting food, fishing or hunting for food, seeking employment. Iyezvino tavekuzokubvunzai mashandisire amunoita nguva yenyu kana muchiita basa. 23. Does your work involve mostly sitting or standing, with walking for no more that 10 minutes at a time? Basa ramunoita rinonyanyoitwa makagara here kana kumira pasina kufamba famba kwemaminitsi asinga pfuuri gumi panguva yega yega?
1. Yes 2. No
24. Does your work involve vigorous activity, like (heavy lifting, digging or construction work) for at least 10 minutes at a time? Munoita basa rakaomarara here rakafanana nukusimudza zvinorema, kuchera kana kuvaka kwemaminitsi gumi kana kupfuura panguva yoga yoga?
1. Yes 2. No
25a. In a typical week, on how many days do you do vigorous activities as part of your work? Mazuva mangani pasvondo amunoita basa rakaomarara?
Days a week

100
25b. On a typical day on which you do vigorous activity, how much time do you spend doing such work? Munotora nguva yakadini kuita basa irori rakaoma Pazuva?
In hours
26. How long is your typical working day? Munoshanda nguva yakareba sei pazuva?
Number of hours
Other than activities that you have already mentioned, I would like to ask you about the way you travel to and from places. For example to work, for shopping, to the field, to market, to church, funerals, gatherings. 27. Do you walk or use a bicycle (pedal cycle) for at least 10 minutes continuously to get to and from places? Pakufamba kunodarika maminitsi gumi munofamba here kana munochovha bhasikoro?
1. Yes 2. No (Go to 29)
28a. In a typical week, on how many days do you walk or cycle for at least 10 minutes to get to and from places? Pasvondo mazuva mangani amunofamba kana kuchovha bhasikoro kwemaminitsi gumi kan kupfuuura?
Days a week
28b. How much time would you spend walking or cycling for any journey on a travel on a typical day. Pazuva munotora nguva yakadini muchifamba kana kuchovha bhasikoro?
In hours and minutes HH MM
The next questions ask about activities you do in your leisure time. Think about activities you do for recreation, fitness or sports. Do not include the physical activities you do at work or for travel mentioned already. Panguva ino toda kukuvhunzai kuti munoshandisa nguva yenyu yokutandara muchiita chii? 29. Does your recreation, sport or leisure time involve mostly sitting, reclining, or standing, with no physical activity lasting more than 10 minutes at a time? Nguva yenyu yokutandara munoipedza makagara kana kumira musina zvamunoita kwemaminitsi anoita gumi here?
1. Yes 2. No
30. In your leisure time , do you do any vigorous activities like running or strenuous sports, weight lifting for at least 10 minutes at a time? Panguva yenyu yokutandara, munoita mabasa mamwe akaita se kumhanya, kudzvura, kusimudza zvinorema kwemaminitsi anopfuura gumi here?
1.Yes 2. No (Go to 32a)
31a. If yes In a typical week, on how many days do you do vigorous activities as part of your leisure time. Mazuva mangani pasvondo amunoita mabasa akaomarara
Days a week

101
panguva yenyu yekuzorora
31b. How much time do you spend doing this (vigorous activities) on a typical day? Munozviita kwenguva yakareba zvakadini pazuva?
In hours and minutes HH MM
32a. In your leisure time, do you do any moderate activities such as brisk walking, cycling for at least 10 minutes at a time? Panguva yenyu yekuzorora, munoita mabasa akareruka kudai sekufamba nekukurumidza, kuchovha bhasikoro kwemaminitsi anodarika gumi here?
1. Yes 2. No (Go to Q34)
33a. If yes In a typical week, on how many days do you do moderate activities as part of leisure time? Mazuva mangani pasvondo amunoita mabasa akareruka aya?
Days a week
33b. How much time do you spend doing this(moderate activities) on a typical day? Munotora nguva yakadini kuita mabasa iwawa pazuva?.
In hours and minutes HH MM
The following question is about sitting or reclining. Think back over the past 7 days, to the time spent at work, at home, in leisure, including time spent sitting at a desk, visiting friends, reading, or watching television, but do not include time spent sleeping. Iye zvino tava kuda kukubvunzai nezvamunoita makazorora. 34. Over the past 7 days, how much time did you spend sitting or reclining on a typical day? Pamazuva manomwe apfuura, makapedza nguva yakadini makagara muchizorora pasina zvamuri kuita?
In hours and minutes HH MM
EXPANDED: HISTORY OF HIGH BLOOD PRESSURE Now we are going to ask you questions about your history of blood pressure. Tave kukubvunzai nezveblood pressure yenyu?
35. When was your blood pressure last measured by a health professional? Makapedzisira rinhi kutorwa BP yenyu kuchipatara kana kwachiremba?
1. Within past 12 months 2. 1-5 years ago 3. Not within past 5 years 4. Never had my blood pressure checked before

102
36. During the past 12 months have you been told by a doctor or other health worker that you have elevated blood pressure or hypertension? Mumwedzi gumi nemiviri yapfuura, makambotaurirwa here kuti BP yenyu yakakwira nachiremba kana mukoti here?
1. Yes 2. No (Go to Q40)

103
Now we are going to ask you questions about treatments for high blood pressure prescribed by a doctor or other health worker Iyezvino tave kukubvunzai nekurapwa kweBP yenyu. 37a. Have you been taking any drugs in past 2 weeks Pamasvondo maviri apfuura mange muri kutora mushonga we BP here?
1. Yes 2. No
37b. Have you been on any special prescribed diet including salt reduction? Murikudya zvekudya zvamakanzi munofanira kudya here kusanganisira kudya munyu mushoma?
1. Yes 2. No
37c. Were you given advice or treatment to lose weight? MakaYambirwa kuti mudzikisa uremu hwenyu here?
1. Yes 2. No
37d. Were you given advice to stop smoking? MakaYambirwa kuti murege kuputa fodya?
1. Yes 2. No
37e. Were you given advice to start or do more exercise? Makayambirwa kuita ma exercise?
1. Yes 2. No
38. During the past 12 months have you consulted traditional healer for elevated blood pressure or hypertension? Pamwedzi gumi nemiviri yapfuura makamboedza here kunobvunzira nezve BP yenyu kuna chiremba wechivanhu kanamupositori.
1. Yes 2. No
39. Are you currently taking any herbal or traditional remedy for your high blood pressure? Muri kunwa mushonga yechivhanu ye BP here?
1. Yes 2. No
EXPANDED: HISTORY OF DIABETES Now we are going to ask you questions about your history of diabetes. Iye zvino tave kuda kukuvhunzai maererano nezve chirwere chesugar 40. Have you had your blood sugar measured in the past 12 months? Ropa renyu rakamboongororwa chirwere chesugar mumwedzi gumi yapfuura?
1. Yes 2. No
41. Have you ever been diagnosed by a doctor or other health worker that you have diabetes? Makambobata chirwere che sugar ku clinic kana nachiremba here?
1. Yes 2. No (Go to Q45)
Are you currently receiving any of the following treatments for diabetes prescribed by a doctor or other health worker?
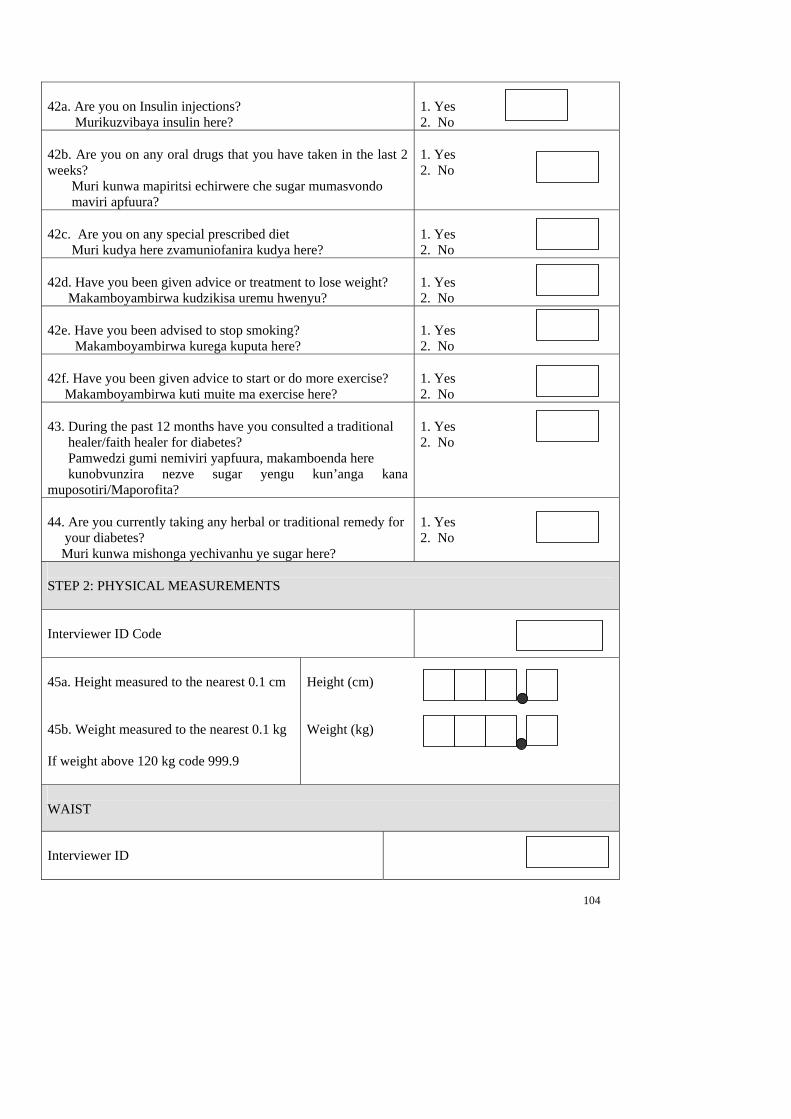
104
42a. Are you on Insulin injections? Murikuzvibaya insulin here?
1. Yes 2. No
42b. Are you on any oral drugs that you have taken in the last 2 weeks? Muri kunwa mapiritsi echirwere che sugar mumasvondo maviri apfuura?
1. Yes 2. No
42c. Are you on any special prescribed diet Muri kudya here zvamuniofanira kudya here?
1. Yes 2. No
42d. Have you been given advice or treatment to lose weight? Makamboyambirwa kudzikisa uremu hwenyu?
1. Yes 2. No
42e. Have you been advised to stop smoking? Makamboyambirwa kurega kuputa here?
1. Yes 2. No
42f. Have you been given advice to start or do more exercise? Makamboyambirwa kuti muite ma exercise here?
1. Yes 2. No
43. During the past 12 months have you consulted a traditional healer/faith healer for diabetes? Pamwedzi gumi nemiviri yapfuura, makamboenda here kunobvunzira nezve sugar yengu kun’anga kana muposotiri/Maporofita?
1. Yes 2. No
44. Are you currently taking any herbal or traditional remedy for your diabetes? Muri kunwa mishonga yechivanhu ye sugar here?
1. Yes 2. No
STEP 2: PHYSICAL MEASUREMENTS
Interviewer ID Code
45a. Height measured to the nearest 0.1 cm 45b. Weight measured to the nearest 0.1 kg If weight above 120 kg code 999.9
Height (cm) Weight (kg)
WAIST
Interviewer ID

105
46. (For women) Are you pregnant?
1. Yes (Don’t measure waist and HIP circumference go to Q49) 2. No
47. Waist circumference (to nearest 0.1 cm)
In centimetres
SELECTED EXPANDED ITEMS
48. Hip circumference (to nearest 0.1 cm)
In centimetres
Blood Pressure (Readings to be 5 minutes apart) Interviewer Code
49a. Mid-Upper arm circumference 49b. Cuff size used
1. Small 2. Normal 3. Large
50a. Reading 1 Systolic BP 50b Diastolic BP
51a. Reading 2 Systolic BP 51b Diastolic BP
52a. Reading 3 Systolic BP 52b Diastolic BP

106
52c. Average reading: Systolic BP 52d Diastolic BP
To be filled by data entry clerks
BLOOD GLUCOSE
Interviewer’s ID Code
53. During the last 12 hours have you had anything to eat or drink, other than water?
1. Yes 2. No If yes obtain only one sample for blood sugar ( Random blood sugar)
54a. Time fasting Blood glucose specimen taken
H H M M
54b. Time post glucose load blood specimen taken
H H M M
54c. Time interval between fasting and post load blood glucose specimens collection (To be calculated by data entry clerks)
BLOOD LIPIDS – FASTING / RANDOM: If pregnant Do not collect blood sample for Lipids
Interviewer ID Code
55. Blood specimen taken for Lipids (Cholesterol, Triglycerides, etc.)
1. Yes 2. No
THANK YOU FOR PARTICIPATING IN THIS STUDY