project management
DESCRIPTION
GLE project managementTRANSCRIPT
PowerPoint Presentation by Charlie CookPowerPoint Presentation by Charlie Cook
THE MANAGERIAL PROCESSTHE MANAGERIAL PROCESS
Pr ojec t ManagementPr ojec t Management
Clifford F. Gray
Eric W. Larson
Clifford F. Gray
Eric W. Larson
Progress and Performance Progress and Performance Measurement and EvaluationMeasurement and Evaluation
Chapter 13
Project Monitoring System for Control Project Monitoring System for Control Project Monitoring System for Control Project Monitoring System for Control
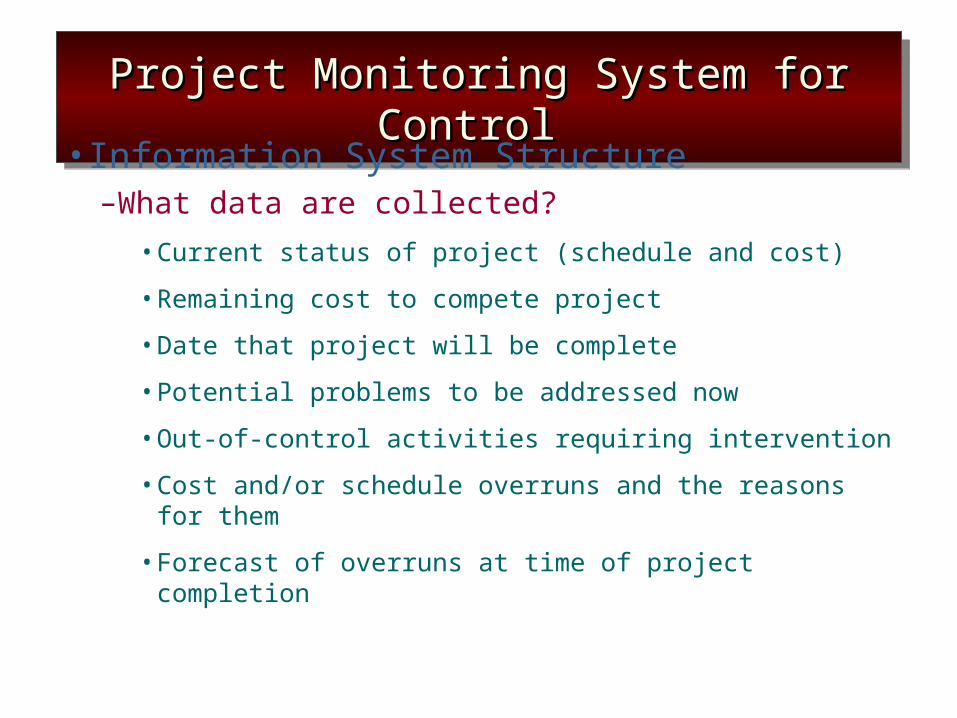
• Information System Structure–What data are collected?
•Current status of project (schedule and cost)
•Remaining cost to compete project
•Date that project will be complete
•Potential problems to be addressed now
•Out-of-control activities requiring intervention
•Cost and/or schedule overruns and the reasons for them
•Forecast of overruns at time of project completion
Project Monitoring System… (cont’d)Project Monitoring System… (cont’d)Project Monitoring System… (cont’d)Project Monitoring System… (cont’d)
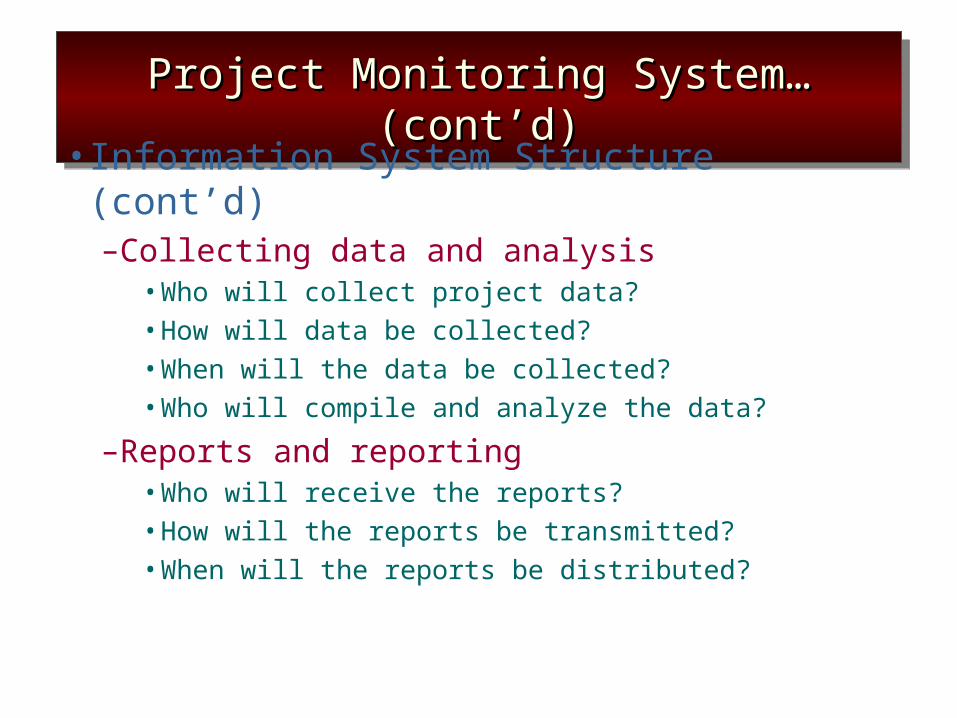
• Information System Structure (cont’d)–Collecting data and analysis
•Who will collect project data?•How will data be collected?•When will the data be collected?•Who will compile and analyze the data?
–Reports and reporting•Who will receive the reports?•How will the reports be transmitted?•When will the reports be distributed?
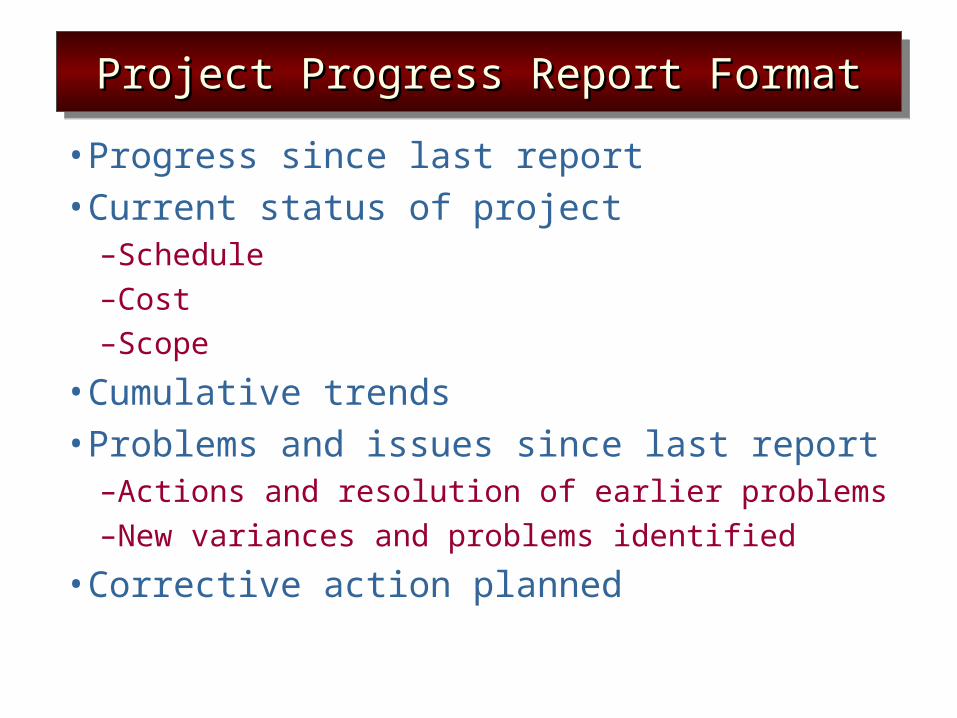
Project Progress Report FormatProject Progress Report FormatProject Progress Report FormatProject Progress Report Format
• Progress since last report• Current status of project
–Schedule–Cost–Scope
• Cumulative trends• Problems and issues since last report
–Actions and resolution of earlier problems–New variances and problems identified
• Corrective action planned
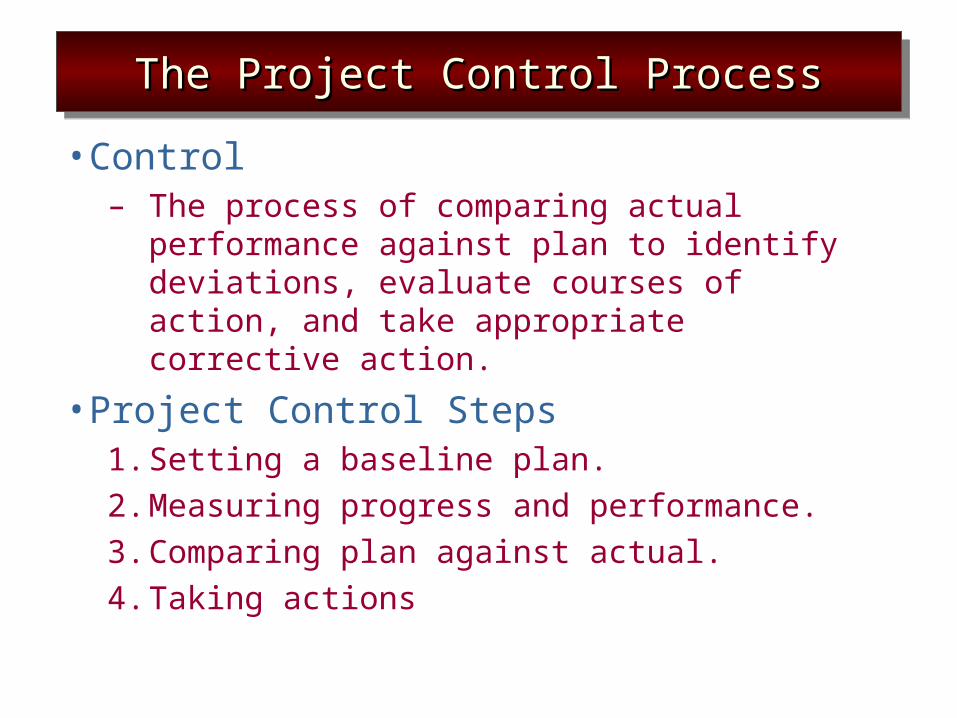
The Project Control ProcessThe Project Control ProcessThe Project Control ProcessThe Project Control Process
• Control– The process of comparing actual performance
against plan to identify deviations, evaluate courses of action, and take appropriate corrective action.
• Project Control Steps1. Setting a baseline plan.
2. Measuring progress and performance.
3. Comparing plan against actual.
4. Taking actions
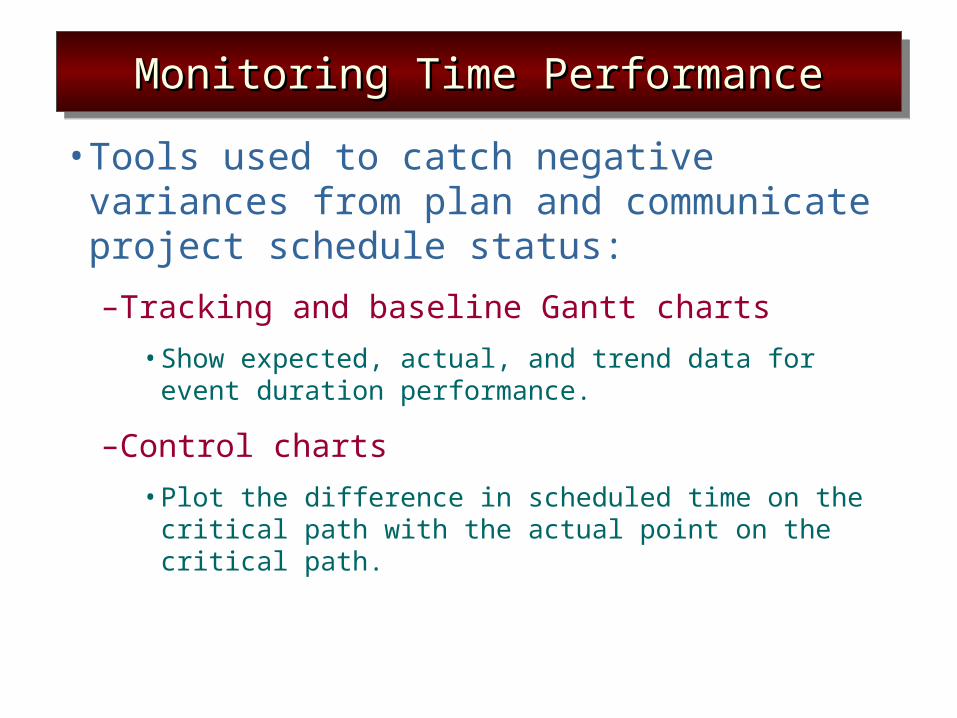
Monitoring Time PerformanceMonitoring Time PerformanceMonitoring Time PerformanceMonitoring Time Performance
• Tools used to catch negative variances from plan and communicate project schedule status:
–Tracking and baseline Gantt charts
•Show expected, actual, and trend data for event duration performance.
–Control charts
•Plot the difference in scheduled time on the critical path with the actual point on the critical path.
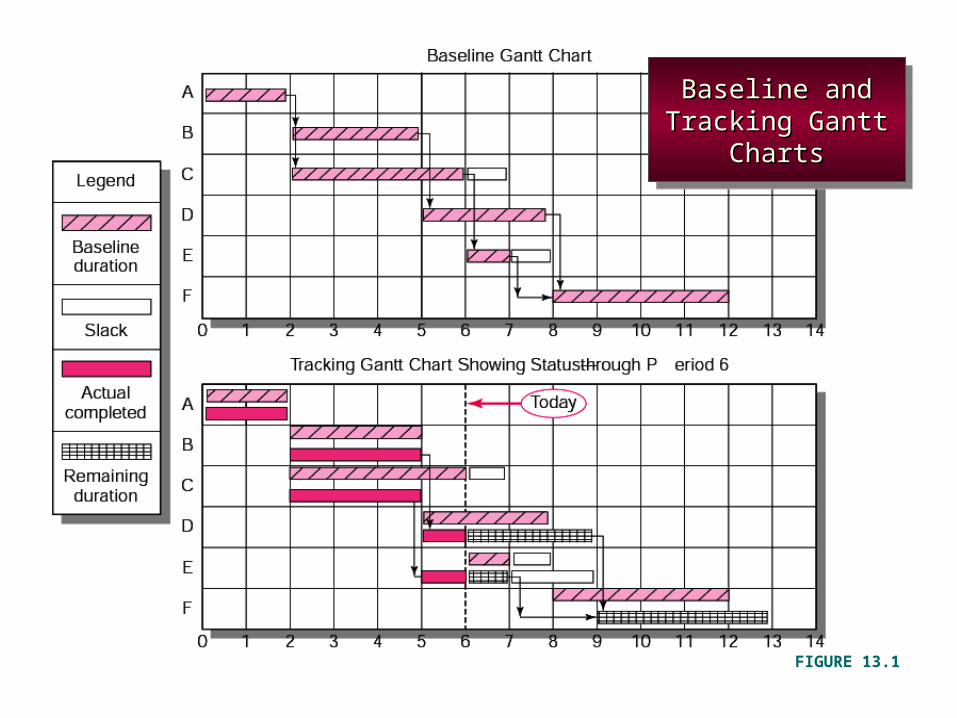
Baseline and Baseline and Tracking Gantt Tracking Gantt
ChartsCharts
Baseline and Baseline and Tracking Gantt Tracking Gantt
ChartsCharts
FIGURE 13.1

Project Schedule Control ChartProject Schedule Control ChartProject Schedule Control ChartProject Schedule Control Chart
FIGURE 13.2
Disparity Among Monitoring SystemsDisparity Among Monitoring SystemsDisparity Among Monitoring SystemsDisparity Among Monitoring Systems
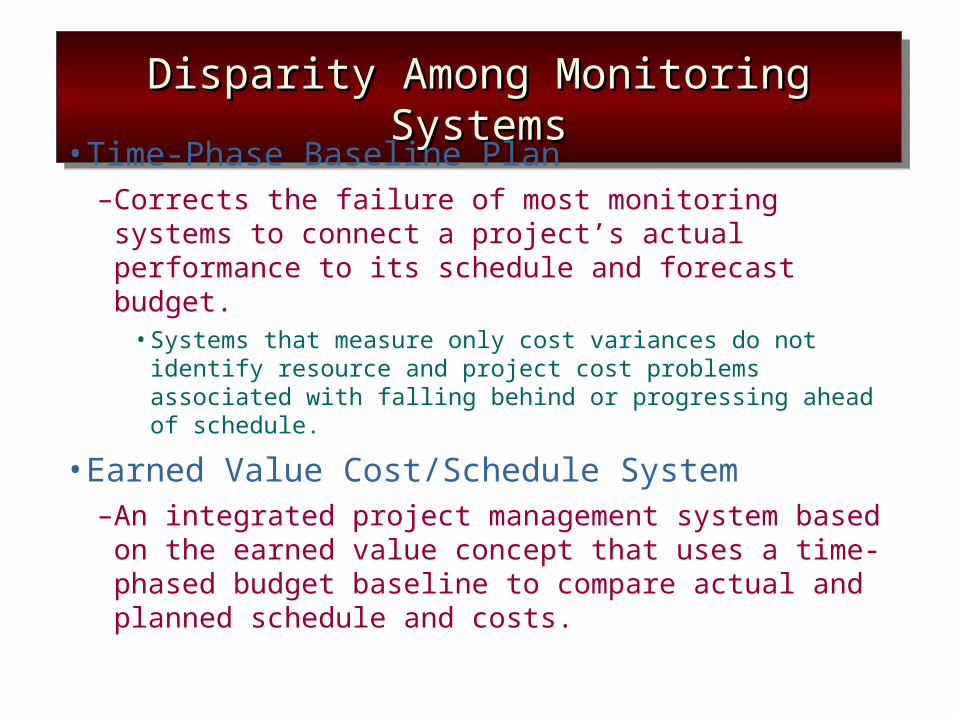
• Time-Phase Baseline Plan–Corrects the failure of most monitoring systems to
connect a project’s actual performance to its schedule and forecast budget.
•Systems that measure only cost variances do not identify resource and project cost problems associated with falling behind or progressing ahead of schedule.
• Earned Value Cost/Schedule System–An integrated project management system based on
the earned value concept that uses a time-phased budget baseline to compare actual and planned schedule and costs.
Glossary of TermsGlossary of TermsGlossary of TermsGlossary of Terms
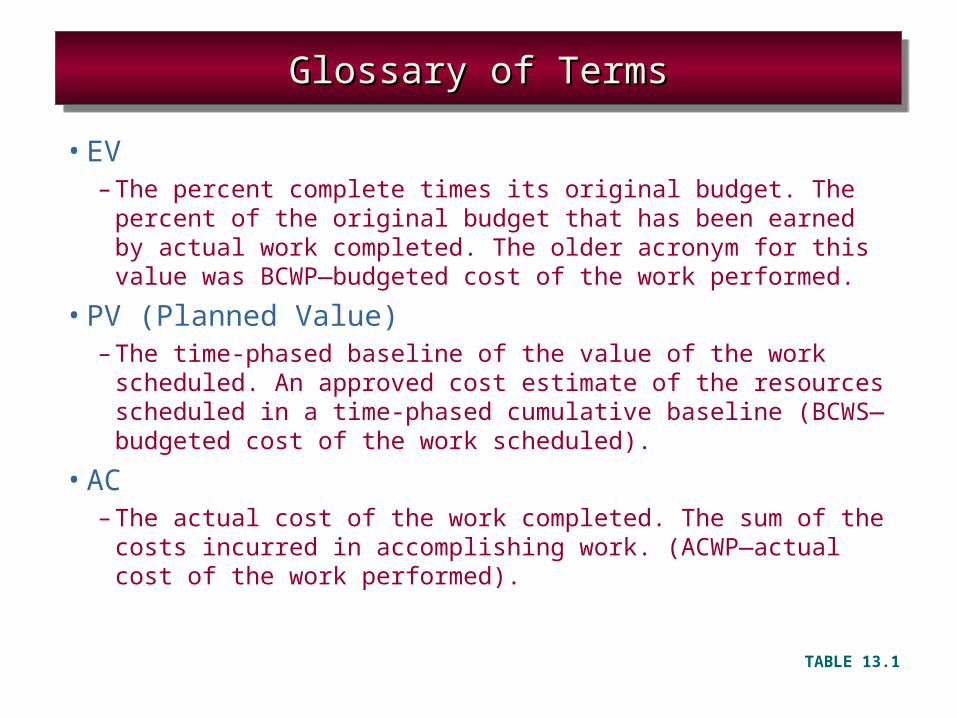
• EV– The percent complete times its original budget. The percent of
the original budget that has been earned by actual work completed. The older acronym for this value was BCWP—budgeted cost of the work performed.
• PV (Planned Value)– The time-phased baseline of the value of the work scheduled. An
approved cost estimate of the resources scheduled in a time-phased cumulative baseline (BCWS—budgeted cost of the work scheduled).
• AC– The actual cost of the work completed. The sum of the costs
incurred in accomplishing work. (ACWP—actual cost of the work performed).
TABLE 13.1
Glossary of TermsGlossary of TermsGlossary of TermsGlossary of Terms
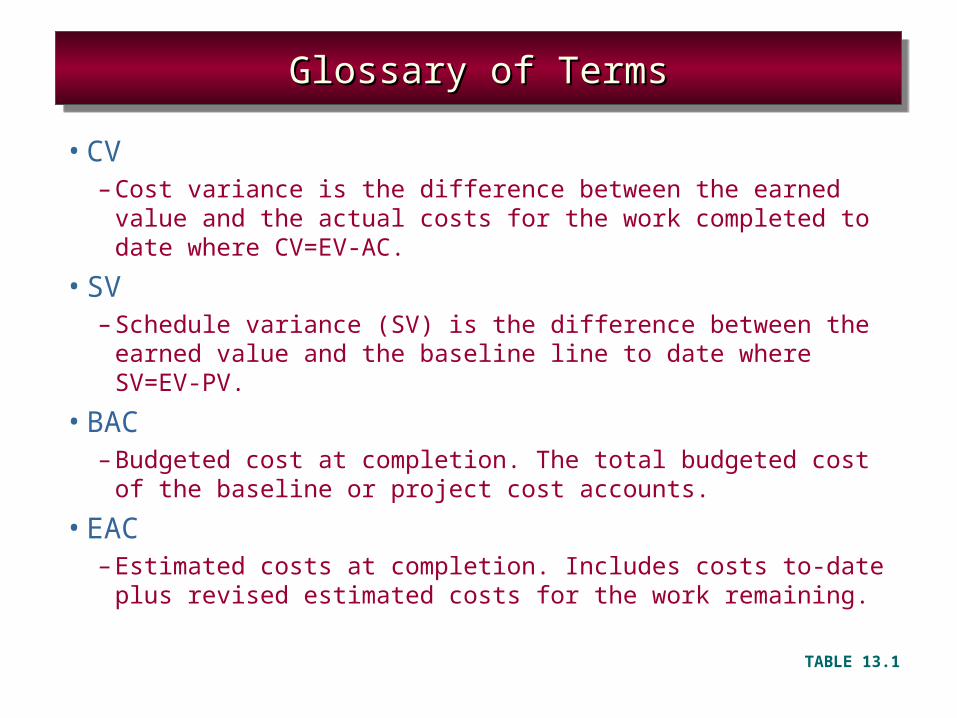
• CV– Cost variance is the difference between the earned value and the
actual costs for the work completed to date where CV=EV-AC.
• SV– Schedule variance (SV) is the difference between the earned
value and the baseline line to date where SV=EV-PV.
• BAC– Budgeted cost at completion. The total budgeted cost of the
baseline or project cost accounts.
• EAC– Estimated costs at completion. Includes costs to-date plus
revised estimated costs for the work remaining.
TABLE 13.1
Glossary of TermsGlossary of TermsGlossary of TermsGlossary of Terms
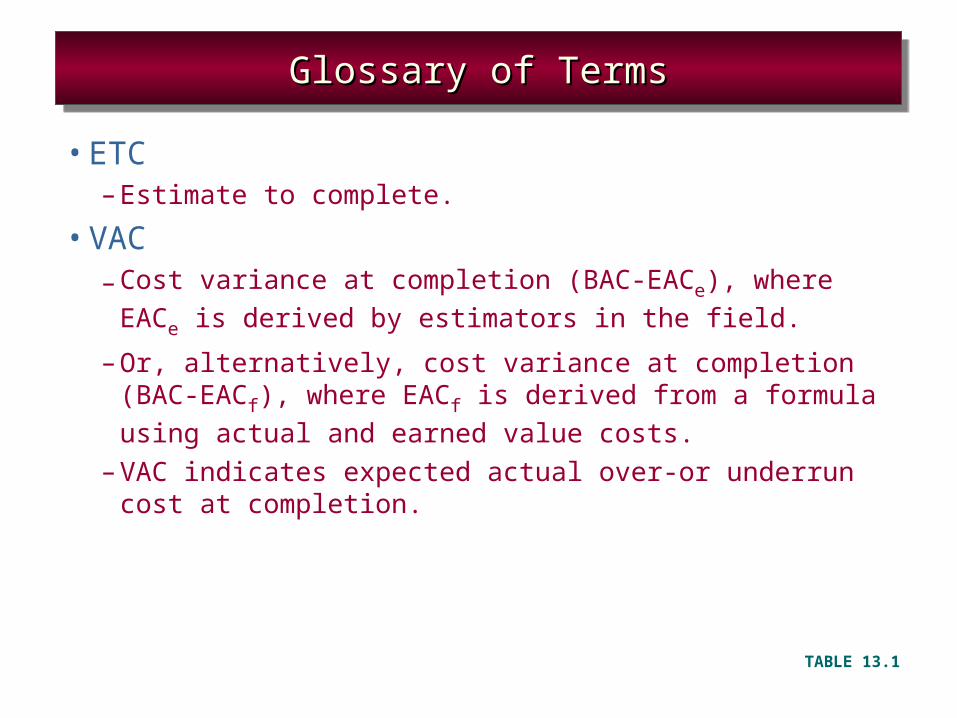
• ETC– Estimate to complete.
• VAC– Cost variance at completion (BAC-EACe), where EACe is derived
by estimators in the field.
– Or, alternatively, cost variance at completion (BAC-EACf), where
EACf is derived from a formula using actual and earned value
costs.– VAC indicates expected actual over-or underrun cost at
completion.
TABLE 13.1
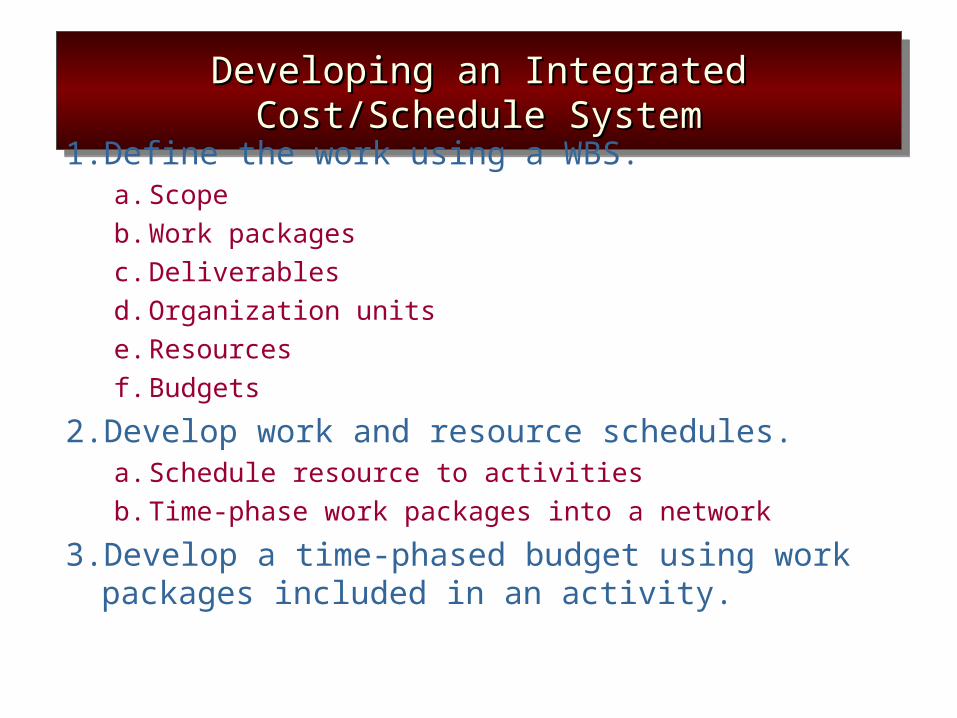
Developing an Integrated Cost/Schedule SystemDeveloping an Integrated Cost/Schedule SystemDeveloping an Integrated Cost/Schedule SystemDeveloping an Integrated Cost/Schedule System
1. Define the work using a WBS.a. Scope
b. Work packages
c. Deliverables
d. Organization units
e. Resources
f. Budgets
2. Develop work and resource schedules.a. Schedule resource to activities
b. Time-phase work packages into a network
3. Develop a time-phased budget using work packages included in an activity.
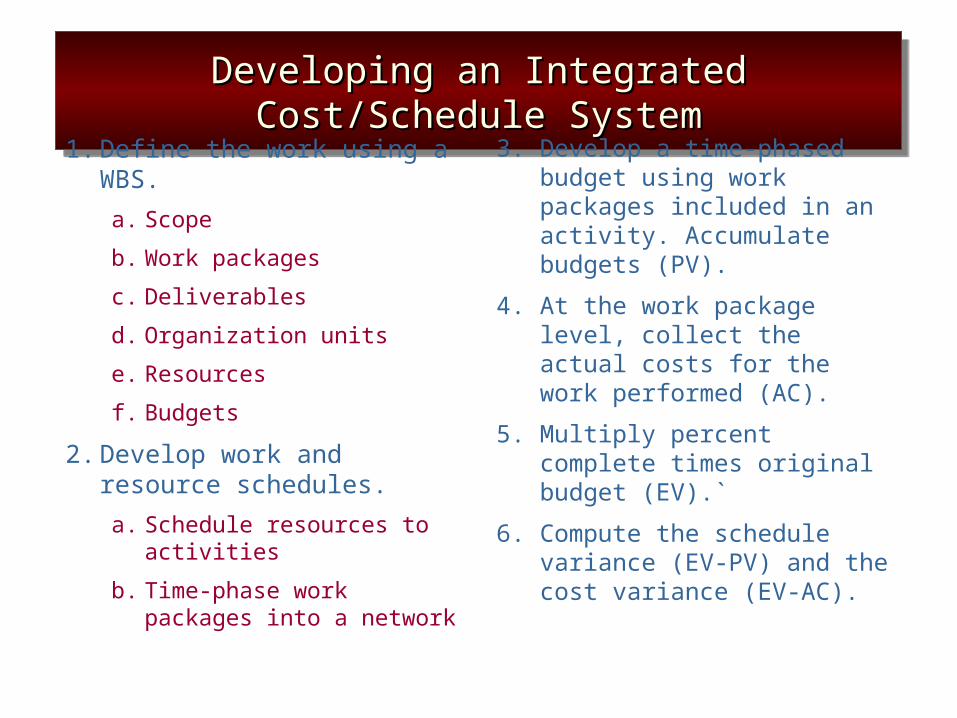
Developing an Integrated Cost/Schedule SystemDeveloping an Integrated Cost/Schedule SystemDeveloping an Integrated Cost/Schedule SystemDeveloping an Integrated Cost/Schedule System
1. Define the work using a WBS.
a. Scope
b. Work packages
c. Deliverables
d. Organization units
e. Resources
f. Budgets
2. Develop work and resource schedules.
a. Schedule resources to activities
b. Time-phase work packages into a network
3. Develop a time-phased budget using work packages included in an activity. Accumulate budgets (PV).
4. At the work package level, collect the actual costs for the work performed (AC).
5. Multiply percent complete times original budget (EV).`
6. Compute the schedule variance (EV-PV) and the cost variance (EV-AC).

Project Management System OverviewProject Management System OverviewProject Management System OverviewProject Management System Overview
FIGURE 13.3
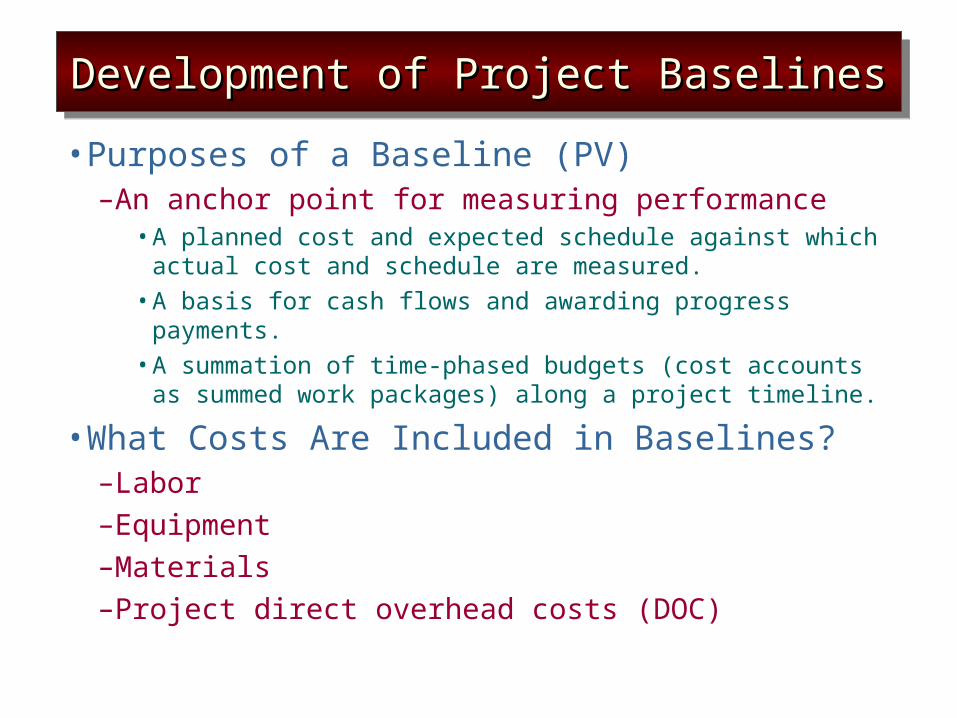
Development of Project BaselinesDevelopment of Project BaselinesDevelopment of Project BaselinesDevelopment of Project Baselines
• Purposes of a Baseline (PV)–An anchor point for measuring performance
•A planned cost and expected schedule against which actual cost and schedule are measured.
•A basis for cash flows and awarding progress payments.
•A summation of time-phased budgets (cost accounts as summed work packages) along a project timeline.
• What Costs Are Included in Baselines?–Labor–Equipment–Materials–Project direct overhead costs (DOC)
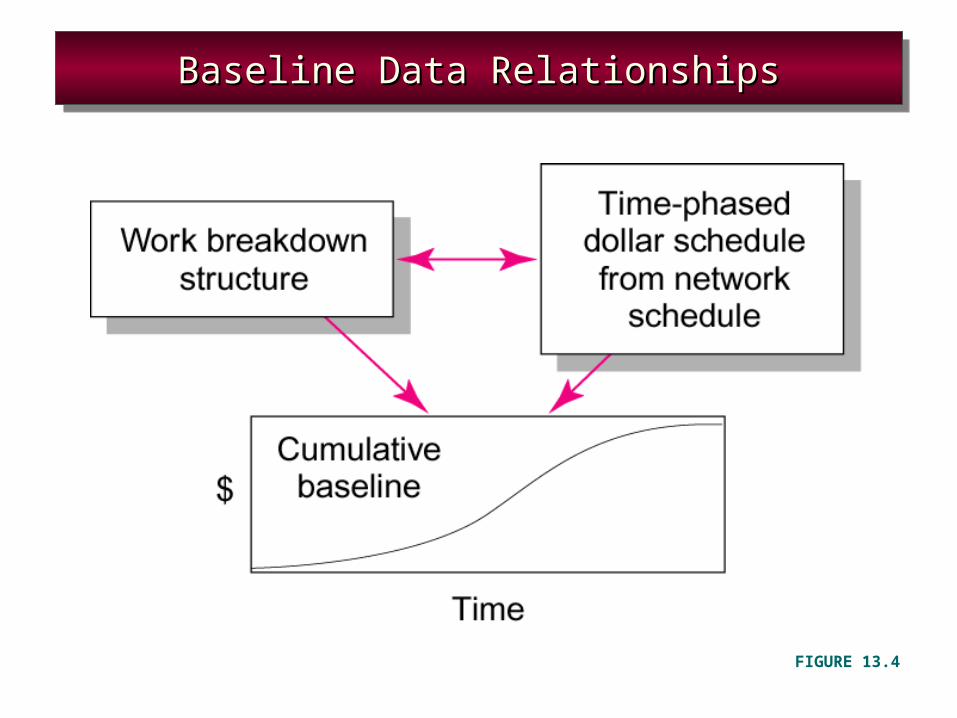
Baseline Data RelationshipsBaseline Data RelationshipsBaseline Data RelationshipsBaseline Data Relationships
FIGURE 13.4

Development of Project Baselines (cont’d)Development of Project Baselines (cont’d)Development of Project Baselines (cont’d)Development of Project Baselines (cont’d)
• Rules for Placing Costs in Baselines–Costs are placed exactly as they are expected to be
“earned” in order to track them to their point of origin.–Percent Complete Rule
•Costs are periodically assigned to a baseline as units of work are completed over the duration of a work package.
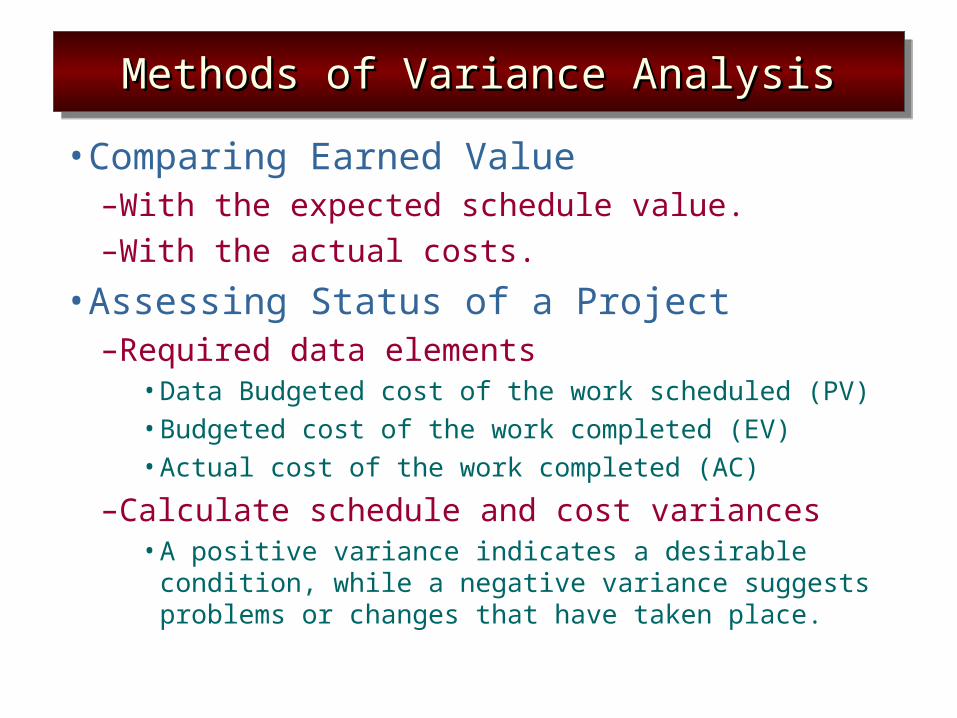
Methods of Variance AnalysisMethods of Variance AnalysisMethods of Variance AnalysisMethods of Variance Analysis
• Comparing Earned Value–With the expected schedule value.–With the actual costs.
• Assessing Status of a Project–Required data elements
•Data Budgeted cost of the work scheduled (PV)•Budgeted cost of the work completed (EV)•Actual cost of the work completed (AC)
–Calculate schedule and cost variances•A positive variance indicates a desirable condition,
while a negative variance suggests problems or changes that have taken place.
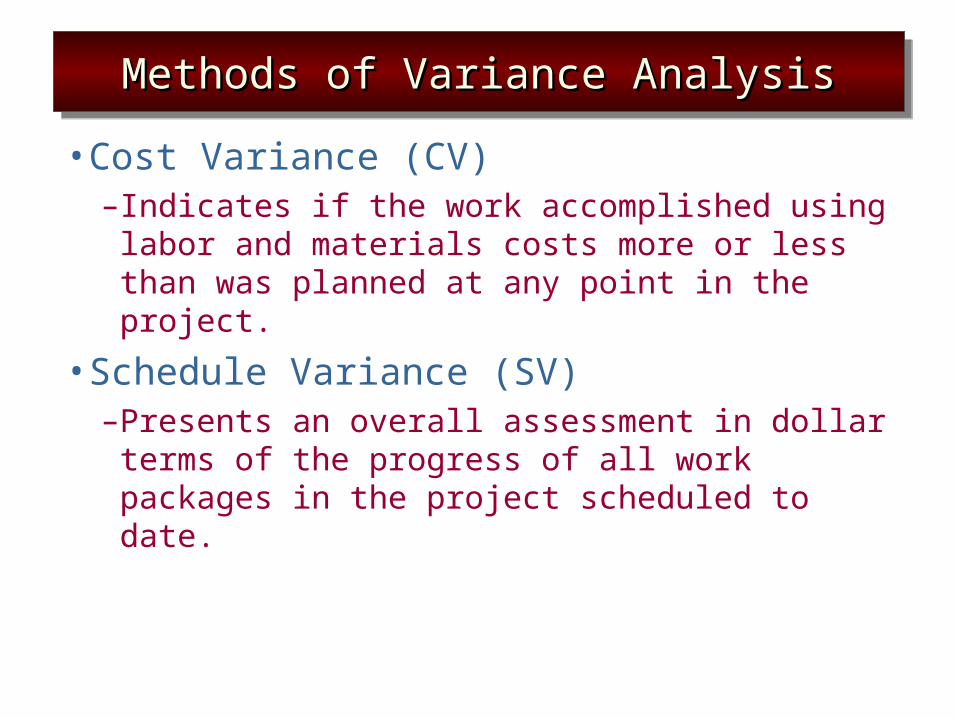
Methods of Variance AnalysisMethods of Variance AnalysisMethods of Variance AnalysisMethods of Variance Analysis
• Cost Variance (CV)–Indicates if the work accomplished using labor and
materials costs more or less than was planned at any point in the project.
• Schedule Variance (SV)–Presents an overall assessment in dollar terms of the
progress of all work packages in the project scheduled to date.
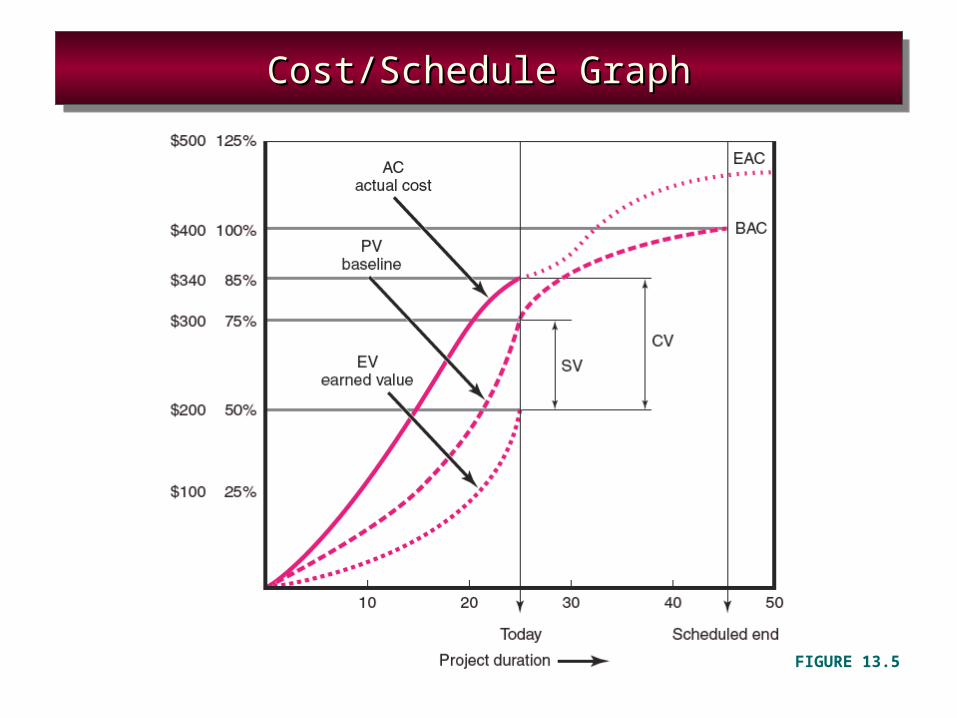
Cost/Schedule GraphCost/Schedule GraphCost/Schedule GraphCost/Schedule Graph
FIGURE 13.5
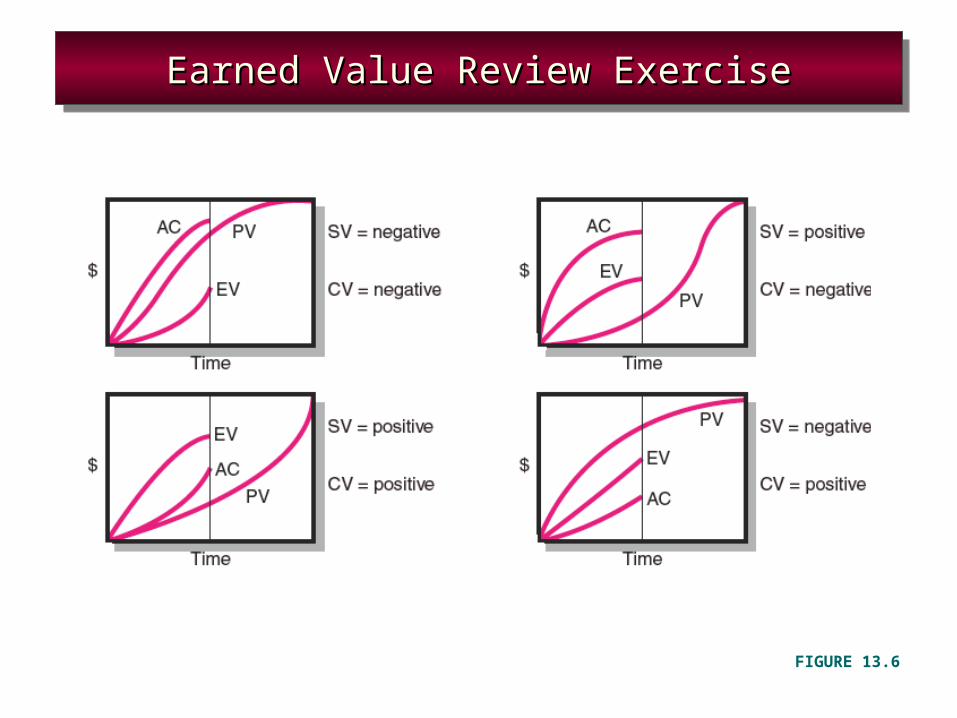
Earned Value Review ExerciseEarned Value Review ExerciseEarned Value Review ExerciseEarned Value Review Exercise
FIGURE 13.6
Developing A Status Report:Developing A Status Report:A Hypothetical ExampleA Hypothetical Example
Developing A Status Report:Developing A Status Report:A Hypothetical ExampleA Hypothetical Example
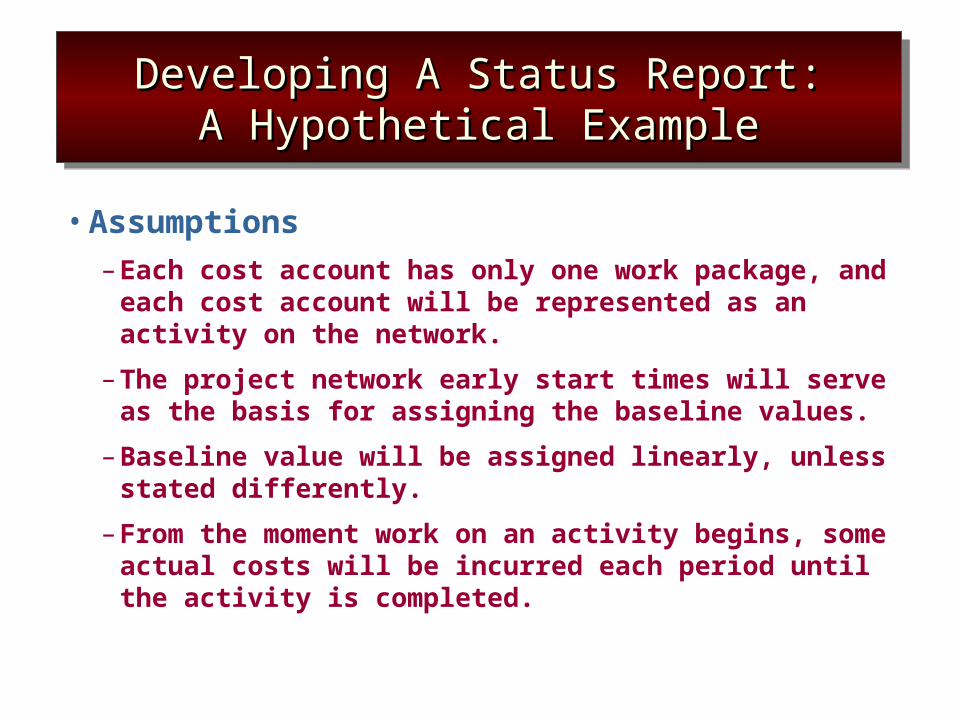
• Assumptions
– Each cost account has only one work package, and each cost account will be represented as an activity on the network.
– The project network early start times will serve as the basis for assigning the baseline values.
– Baseline value will be assigned linearly, unless stated differently.
– From the moment work on an activity begins, some actual costs will be incurred each period until the activity is completed.
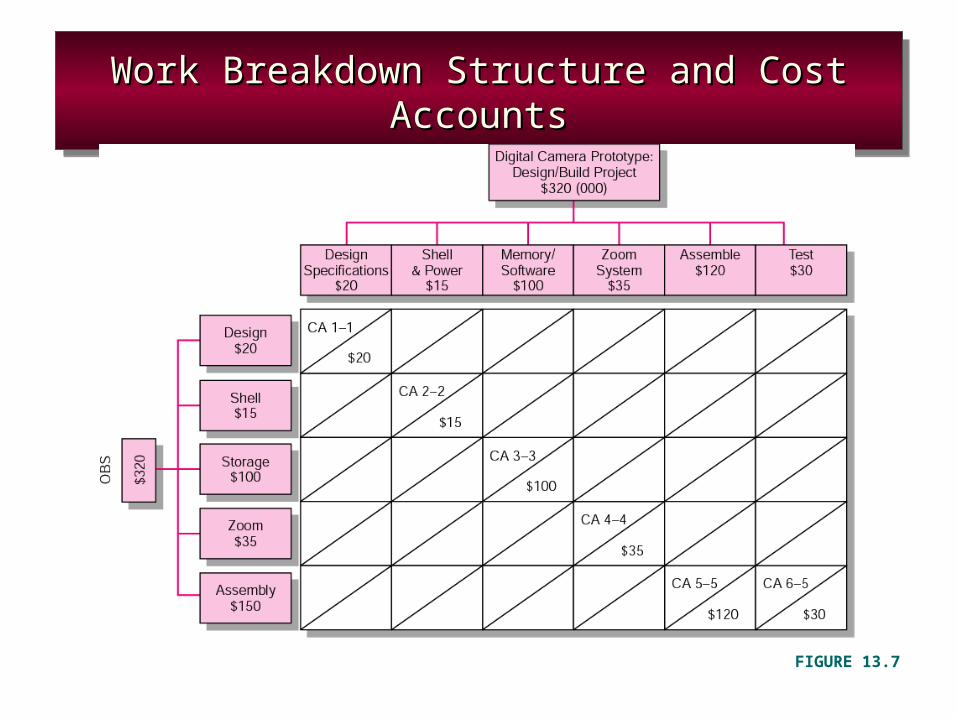
Work Breakdown Structure and Cost AccountsWork Breakdown Structure and Cost AccountsWork Breakdown Structure and Cost AccountsWork Breakdown Structure and Cost Accounts
FIGURE 13.7
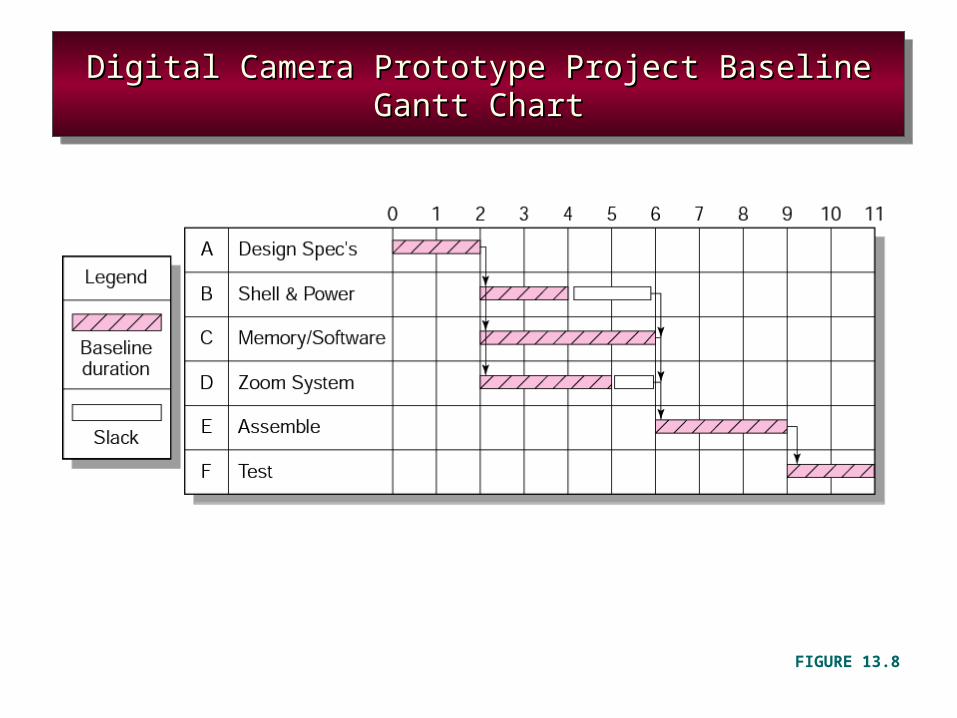
Digital Camera Prototype Project Baseline Gantt ChartDigital Camera Prototype Project Baseline Gantt ChartDigital Camera Prototype Project Baseline Gantt ChartDigital Camera Prototype Project Baseline Gantt Chart
FIGURE 13.8
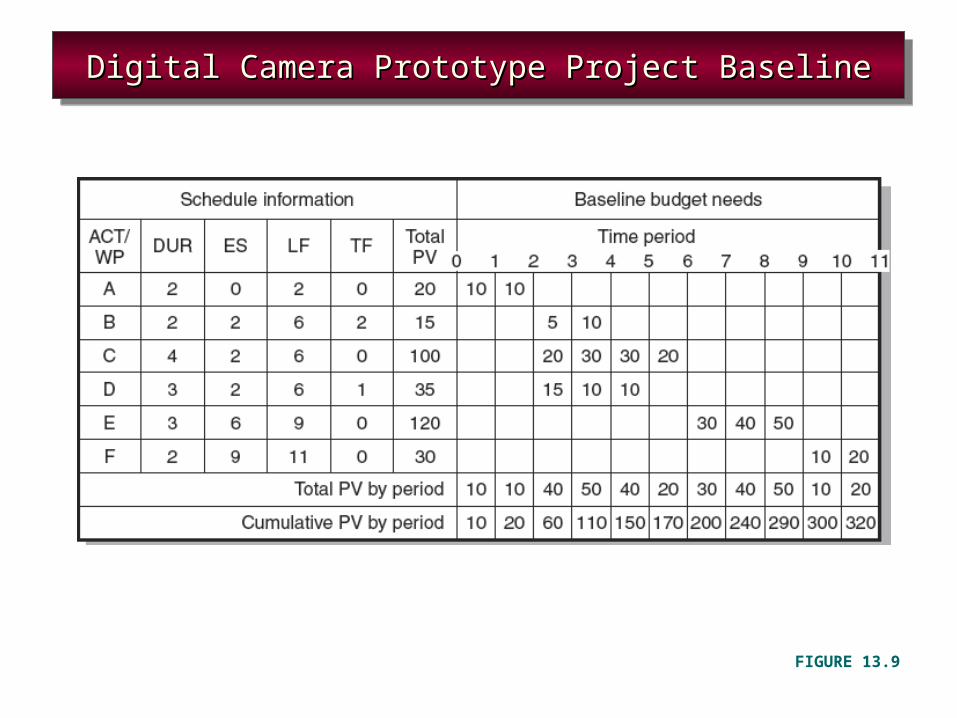
Digital Camera Prototype Project BaselineDigital Camera Prototype Project BaselineDigital Camera Prototype Project BaselineDigital Camera Prototype Project Baseline
FIGURE 13.9
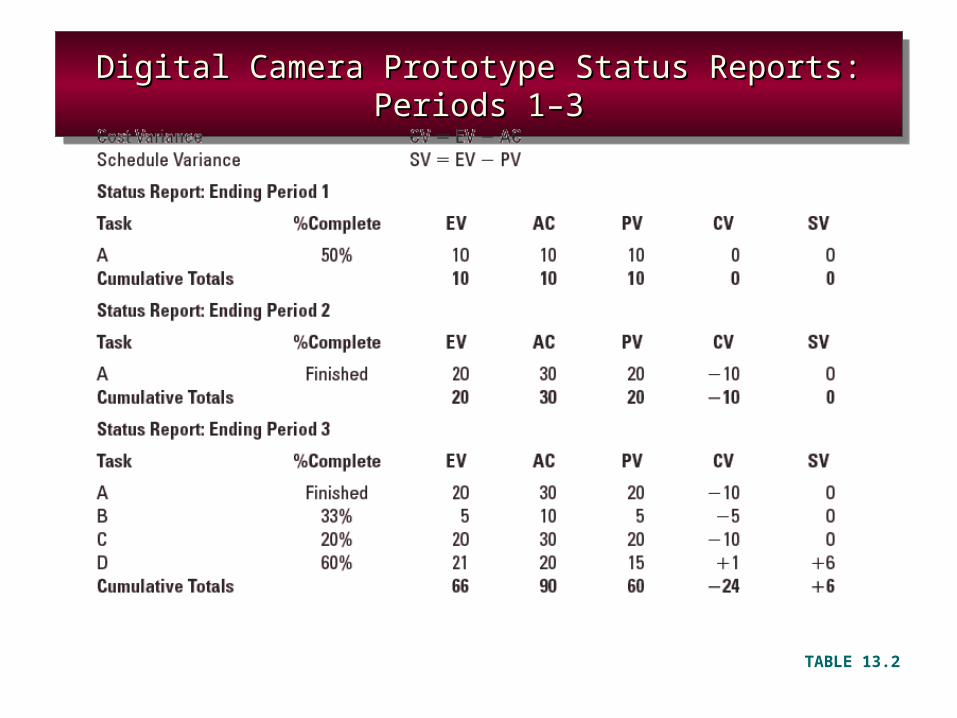
Digital Camera Prototype Status Reports: Periods 1Digital Camera Prototype Status Reports: Periods 1–3–3Digital Camera Prototype Status Reports: Periods 1Digital Camera Prototype Status Reports: Periods 1–3–3
TABLE 13.2
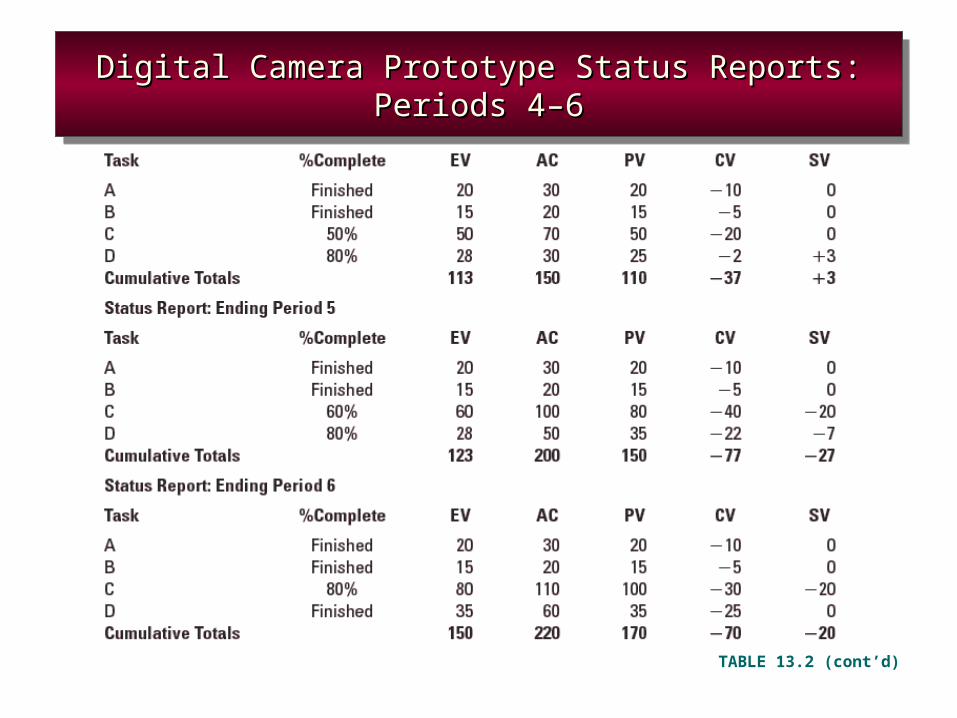
Digital Camera Prototype Status Reports: Periods 4Digital Camera Prototype Status Reports: Periods 4–6–6Digital Camera Prototype Status Reports: Periods 4Digital Camera Prototype Status Reports: Periods 4–6–6
TABLE 13.2 (cont’d)
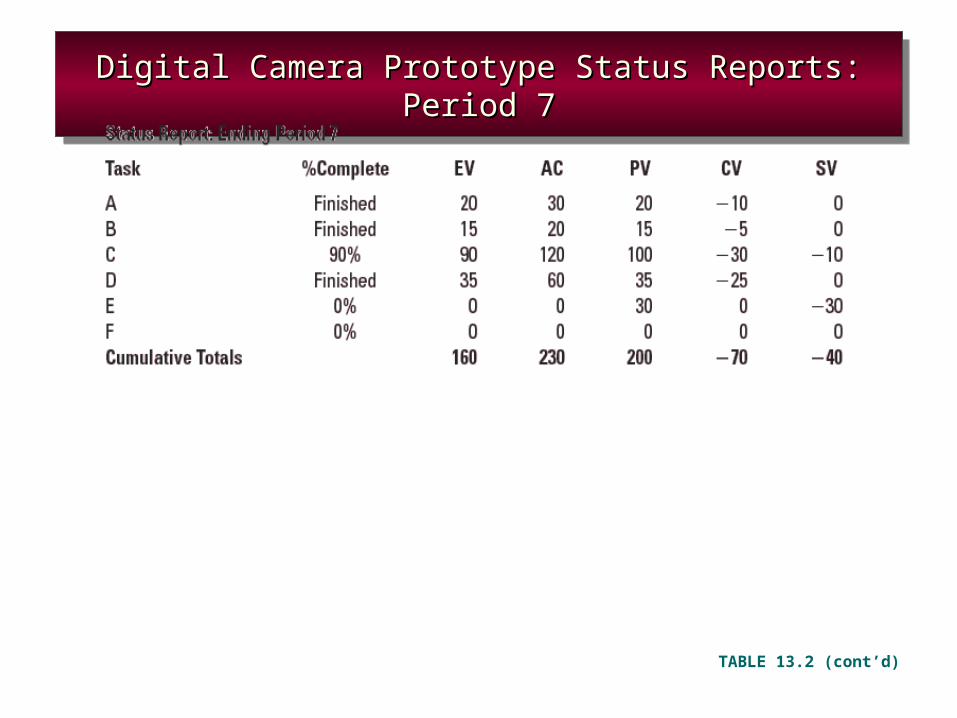
Digital Camera Prototype Status Reports: Period 7Digital Camera Prototype Status Reports: Period 7Digital Camera Prototype Status Reports: Period 7Digital Camera Prototype Status Reports: Period 7
TABLE 13.2 (cont’d)
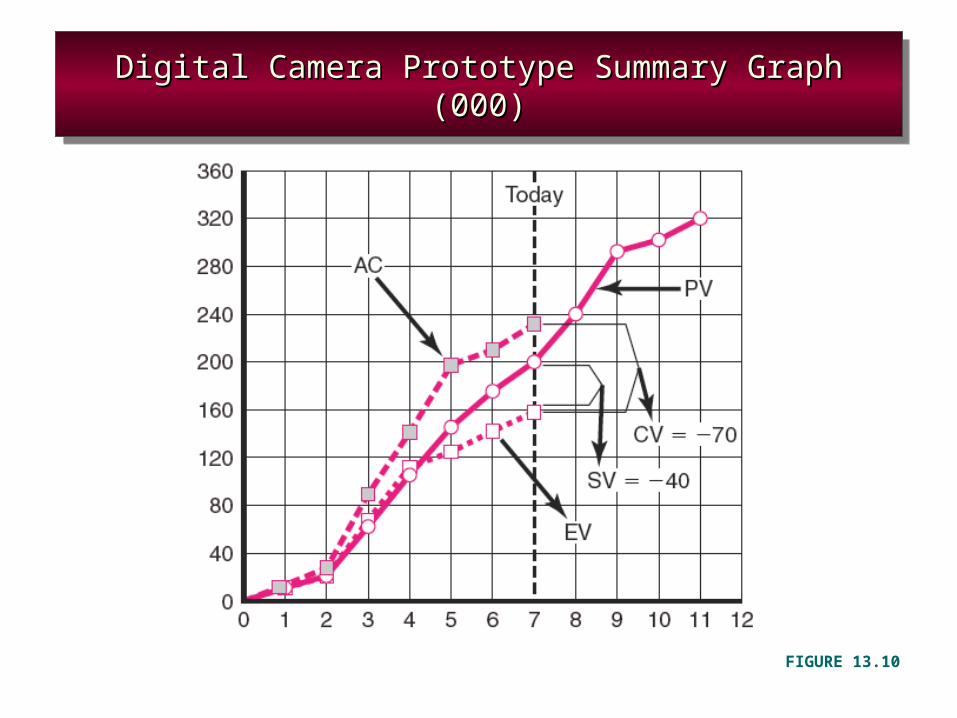
Digital Camera Prototype Summary Graph (000)Digital Camera Prototype Summary Graph (000)Digital Camera Prototype Summary Graph (000)Digital Camera Prototype Summary Graph (000)
FIGURE 13.10
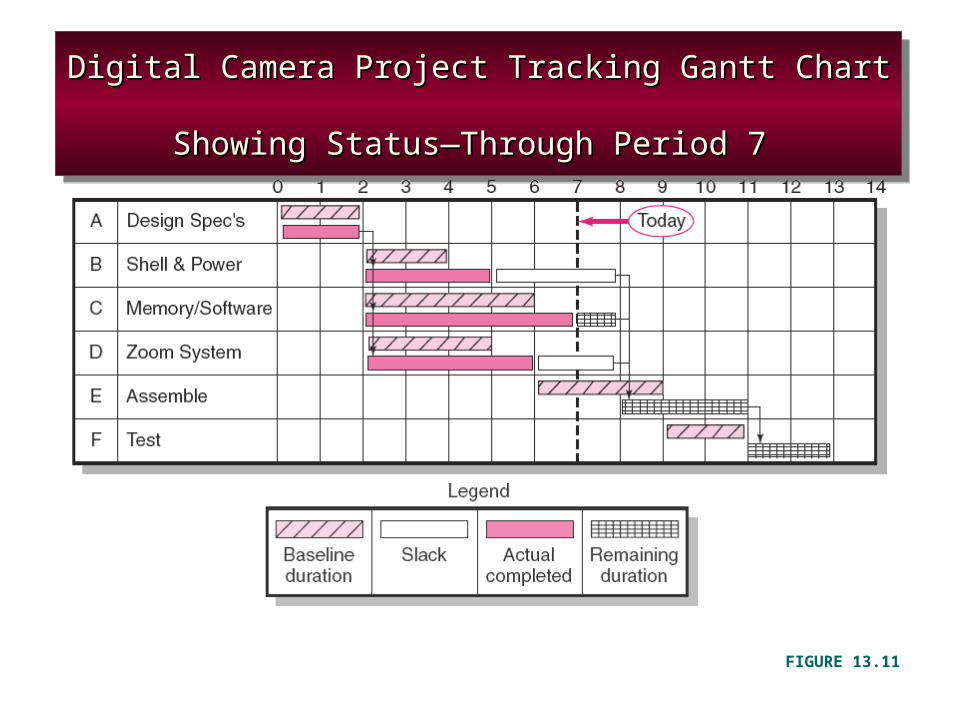
Digital Camera Project Tracking Gantt Chart Digital Camera Project Tracking Gantt Chart Showing StatusShowing Status—Through Period 7—Through Period 7
Digital Camera Project Tracking Gantt Chart Digital Camera Project Tracking Gantt Chart Showing StatusShowing Status—Through Period 7—Through Period 7
FIGURE 13.11
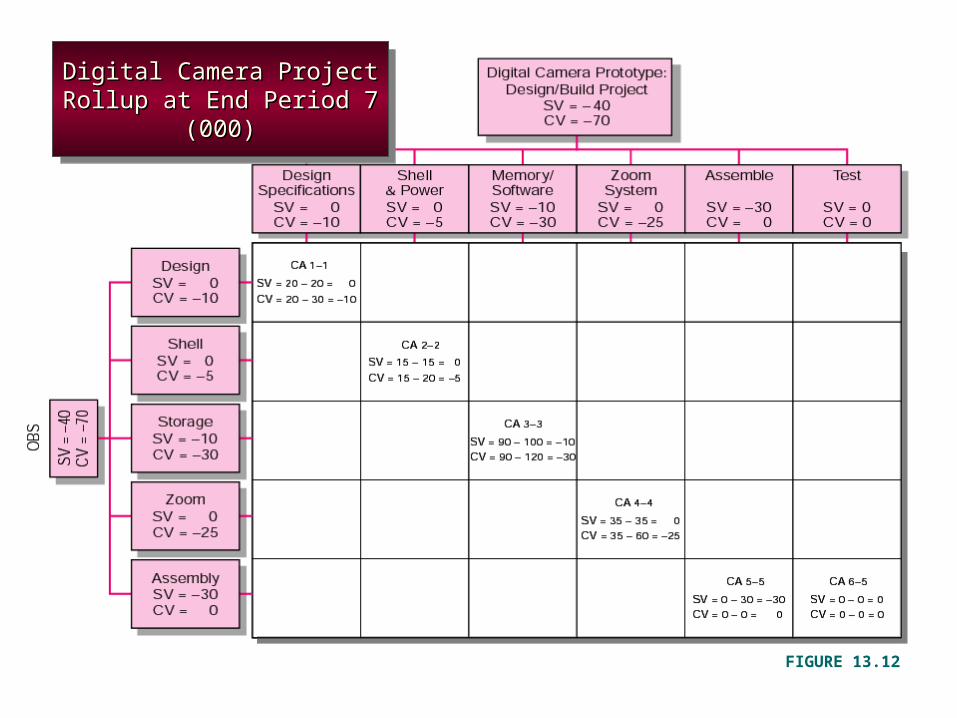
Digital Camera Project Rollup Digital Camera Project Rollup at End Period 7 (000)at End Period 7 (000)
Digital Camera Project Rollup Digital Camera Project Rollup at End Period 7 (000)at End Period 7 (000)
FIGURE 13.12
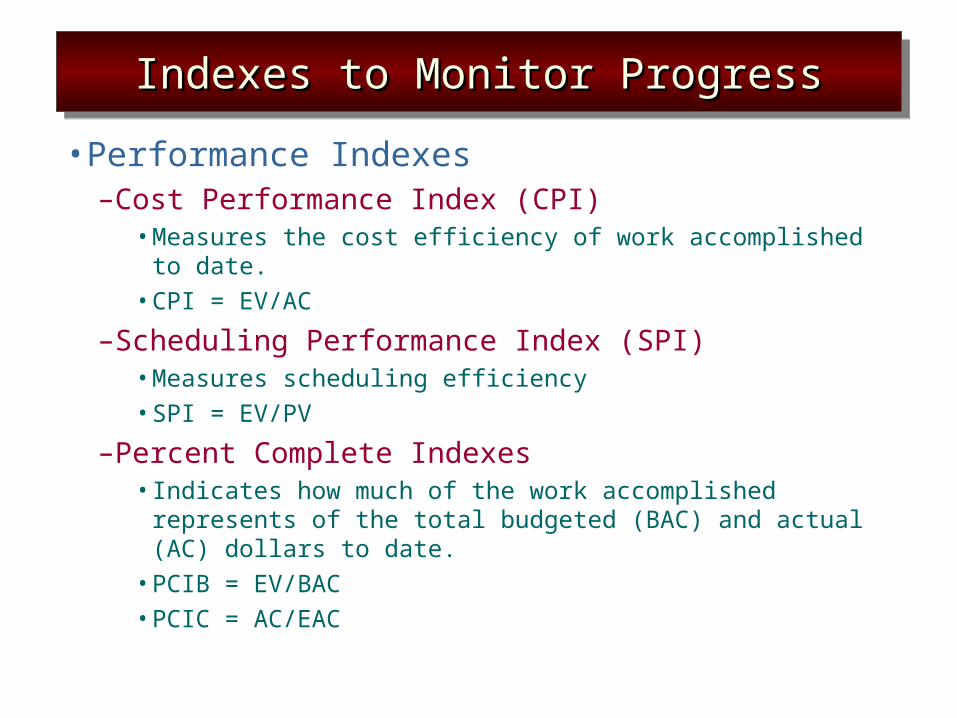
Indexes to Monitor ProgressIndexes to Monitor ProgressIndexes to Monitor ProgressIndexes to Monitor Progress
• Performance Indexes–Cost Performance Index (CPI)
•Measures the cost efficiency of work accomplished to date.
•CPI = EV/AC
–Scheduling Performance Index (SPI)•Measures scheduling efficiency•SPI = EV/PV
–Percent Complete Indexes• Indicates how much of the work accomplished represents
of the total budgeted (BAC) and actual (AC) dollars to date.
•PCIB = EV/BAC •PCIC = AC/EAC
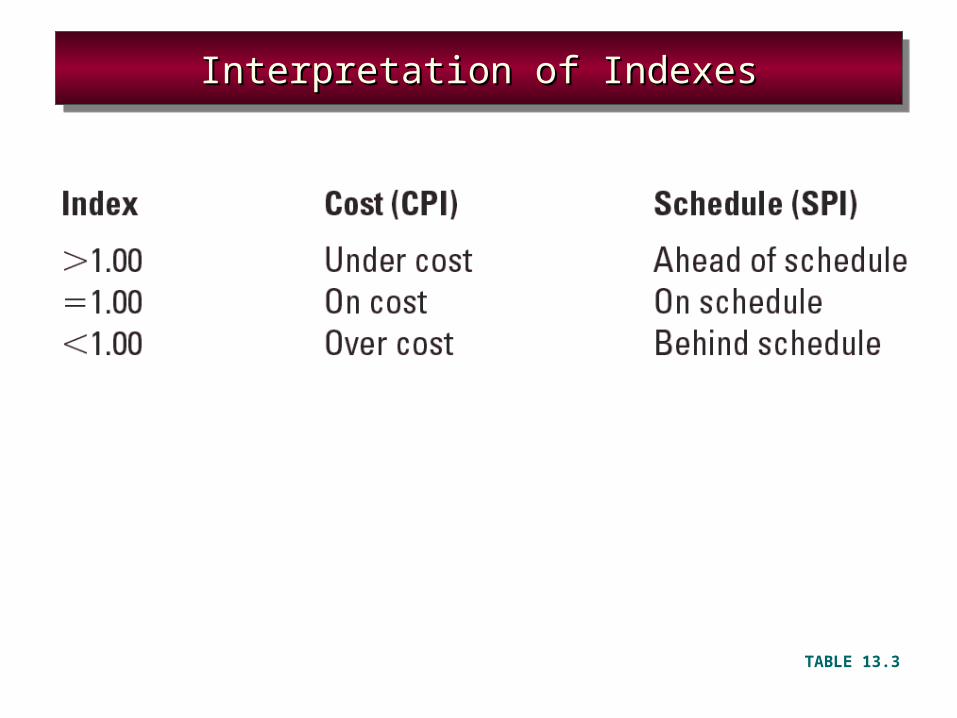
Interpretation of IndexesInterpretation of IndexesInterpretation of IndexesInterpretation of Indexes
TABLE 13.3
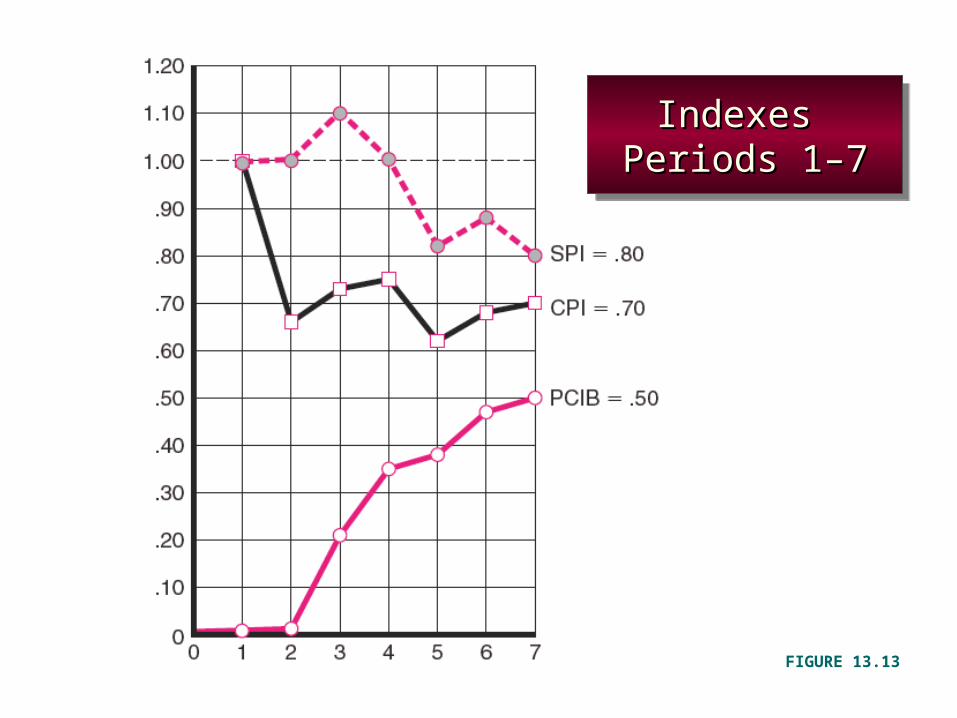
Indexes Indexes Periods 1Periods 1–7–7
Indexes Indexes Periods 1Periods 1–7–7
FIGURE 13.13
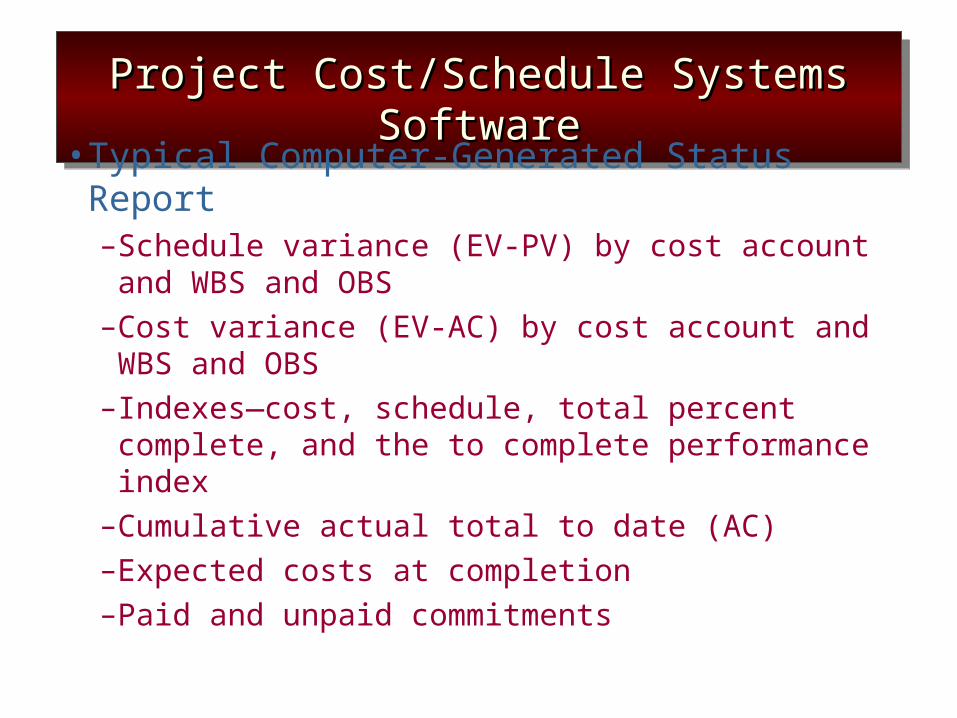
Project Cost/Schedule Systems SoftwareProject Cost/Schedule Systems SoftwareProject Cost/Schedule Systems SoftwareProject Cost/Schedule Systems Software
• Typical Computer-Generated Status Report–Schedule variance (EV-PV) by cost account and WBS
and OBS–Cost variance (EV-AC) by cost account and WBS and
OBS–Indexes—cost, schedule, total percent complete, and
the to complete performance index–Cumulative actual total to date (AC)–Expected costs at completion–Paid and unpaid commitments
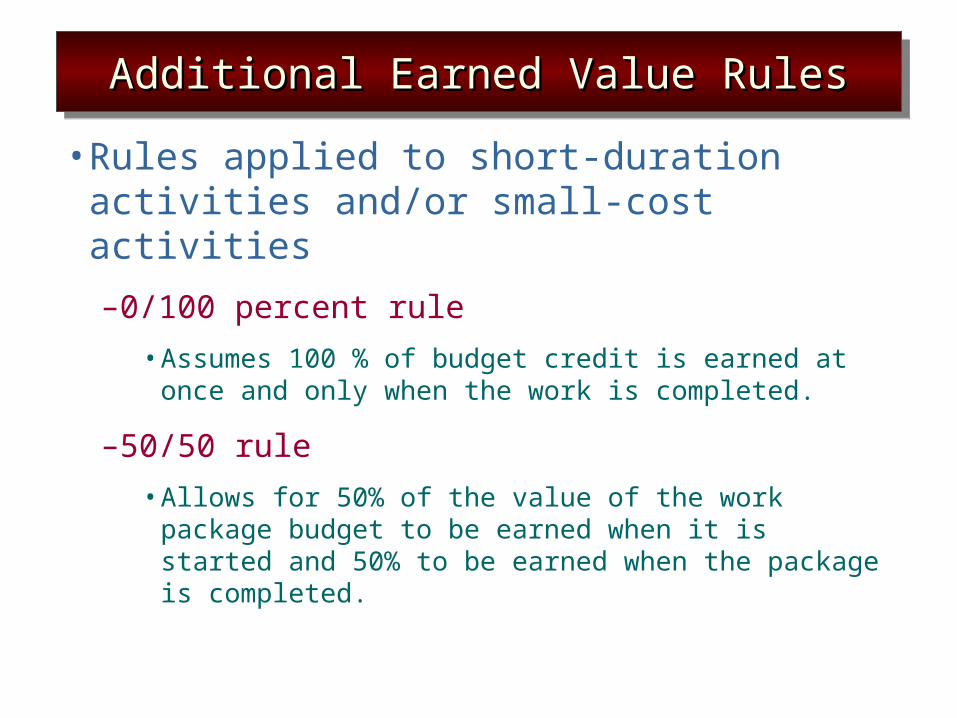
Additional Earned Value RulesAdditional Earned Value RulesAdditional Earned Value RulesAdditional Earned Value Rules
• Rules applied to short-duration activities and/or small-cost activities
–0/100 percent rule
•Assumes 100 % of budget credit is earned at once and only when the work is completed.
–50/50 rule
•Allows for 50% of the value of the work package budget to be earned when it is started and 50% to be earned when the package is completed.
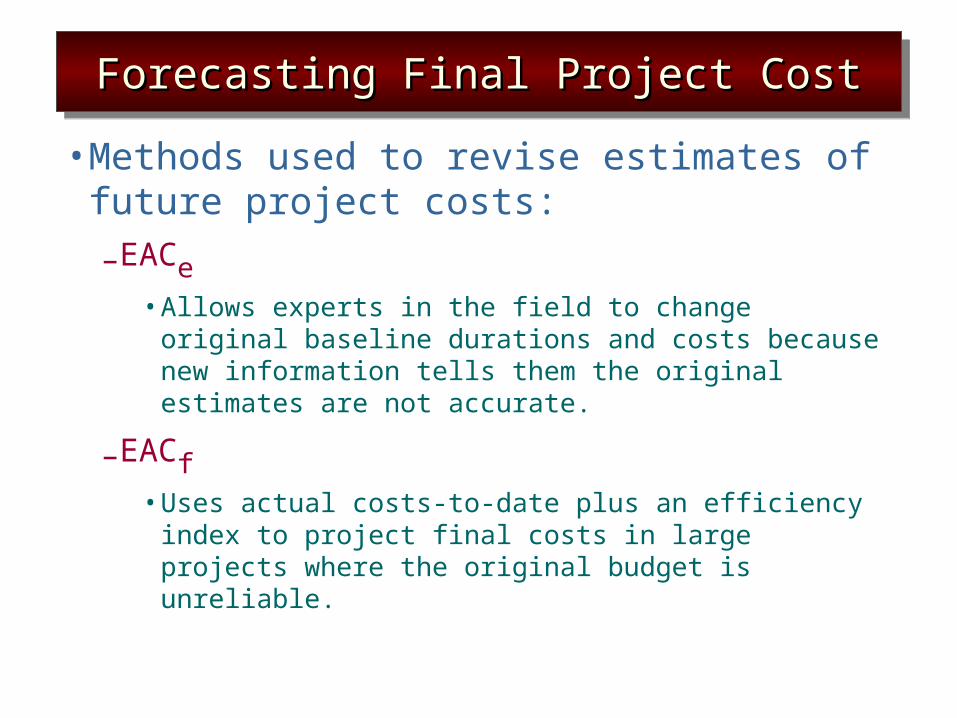
Forecasting Final Project CostForecasting Final Project CostForecasting Final Project CostForecasting Final Project Cost
• Methods used to revise estimates of future project costs:
–EACe•Allows experts in the field to change original baseline
durations and costs because new information tells them the original estimates are not accurate.
–EACf•Uses actual costs-to-date plus an efficiency index to
project final costs in large projects where the original budget is unreliable.
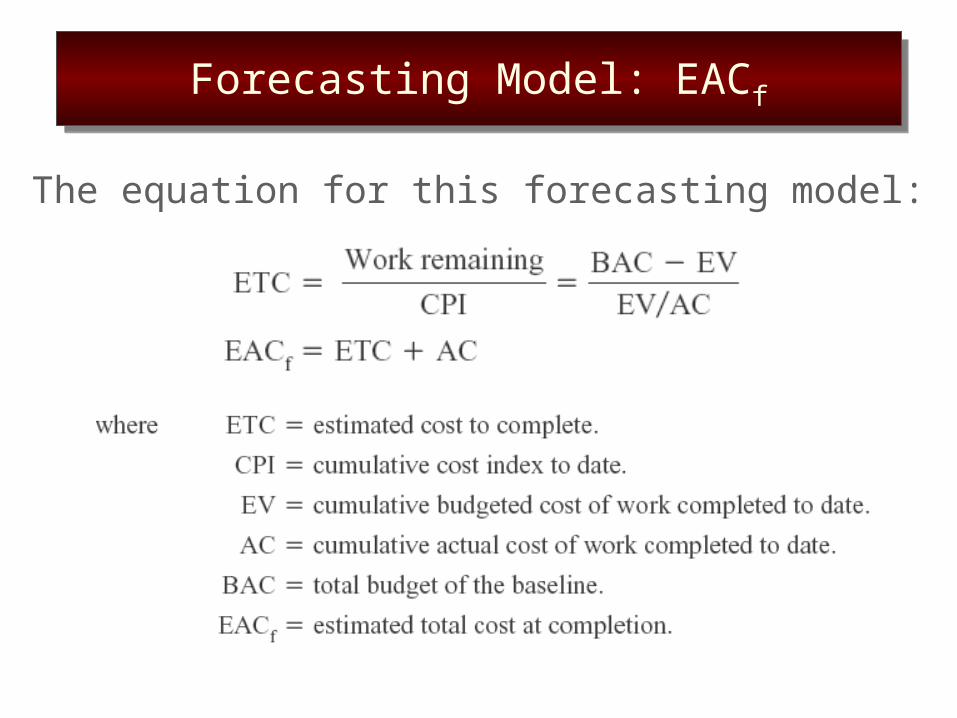
Forecasting Model: EACfForecasting Model: EACf
The equation for this forecasting model:

Other Control IssuesOther Control IssuesOther Control IssuesOther Control Issues
Issues In Maintaining Control Of ProjectsIssues In Maintaining Control Of ProjectsIssues In Maintaining Control Of ProjectsIssues In Maintaining Control Of Projects
Baseline ChangesBaseline ChangesBaseline ChangesBaseline Changes
Contingency ReserveContingency ReserveContingency ReserveContingency Reserve
Costs and Problems of Data AcquisitionCosts and Problems of Data AcquisitionCosts and Problems of Data AcquisitionCosts and Problems of Data Acquisition
Scope CreepScope CreepScope CreepScope Creep
Managing the Portfolio of ProjectsManaging the Portfolio of ProjectsManaging the Portfolio of ProjectsManaging the Portfolio of Projects
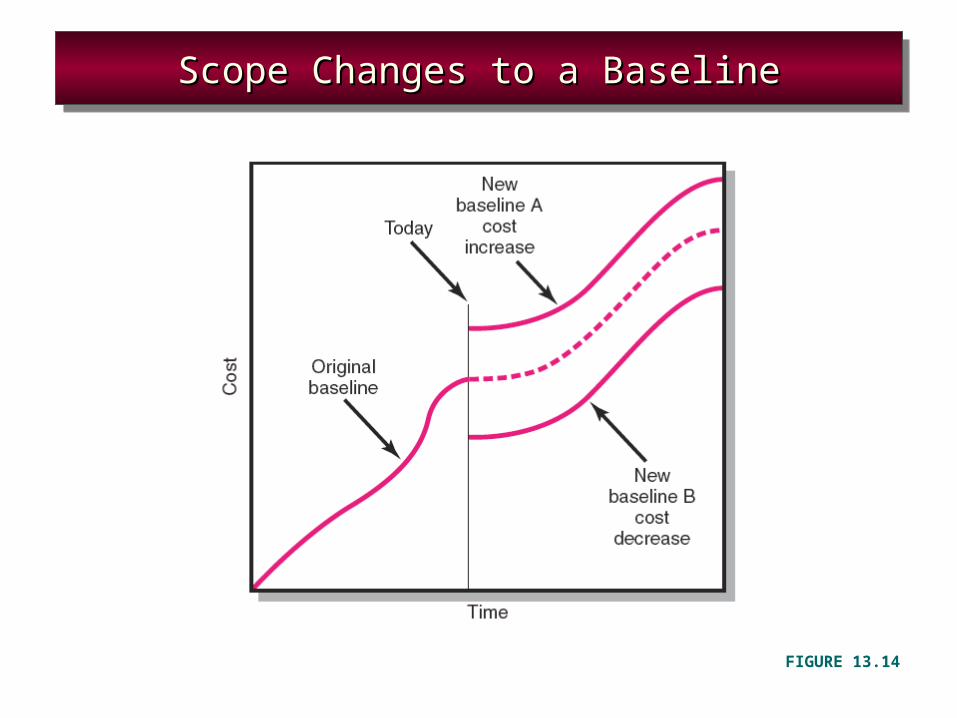
Scope Changes to a BaselineScope Changes to a BaselineScope Changes to a BaselineScope Changes to a Baseline
FIGURE 13.14
Key TermsKey TermsKey TermsKey Terms
Baseline budget
Cost performance index (CPI)
Cost variance (CV)
Earned value
Schedule variance (SV)
Time phasing
Variance at completion (VAC)
Estimate at completion (EAC)