project concept note - world bankdocuments.worldbank.org/.../414380cha0… · web view ·...
TRANSCRIPT

Document ofThe World Bank
FOR OFFICIAL USE ONLY
Report No: 41438–CH
PROJECT APPRAISAL DOCUMENT
PURCHASE OF CERTIFIED CO2 EMISSION REDUCTIONS
BY THE NETHERLANDS CLEAN DEVELOPMENT FACILITY
FOR THE
CHINA
HUIZHOU COMBINED CYCLE GAS TURBINE THERMAL POWER PROJECT
November 19, 2007
Transport, Energy and Mining Sector UnitSustainable Development DepartmentEast Asia and Pacific Region
This document has a restricted distribution and may be used by recipients only in the performance of their official duties. Its contents may not otherwise be disclosed without World Bank authorization.

CURRENCY EQUIVALENTS(Exchange Rate Effective November 2, 2007)
Currency Unit = Renminbi (RMB) Yuan (Y)Y 1.0 = US$0.13
US$ 1.0 = Y 7.44
FISCAL YEARJanuary 1 – December 31
ABBREVIATIONS AND ACRONYMS
CBM Coal Bed Methane MP Monitoring PlanCCGT Combined Cycle Gas Turbine MOF Ministry Of FinanceCDM Clean Development Mechanism MVA Megavolt AmpereCO2 Carbon Dioxide MWh Megawatt-hourCER Certified Emission Reduction NOx Nitrogen OxideCNOOC China National Offshore Oil Corporation NPV Net Present ValueCPS Country Partnership Strategy NCDMF Netherlands Clean Development Mechanism DNA Designated National Authority FacilityEIRR Economic Internal Rate of Return OECD Organization for Economic EMP Environmental Management Plan Cooperation and DevelopmentEPB Environmental Protection Bureau O&M Operational and MaintenanceER Emission Reduction OSHA Occupational Safety and Health ActERPA Emission Reduction Purchase Agreement PAD Project Appraisal DocumentESW Economic and Sector Work PDD Project Design DocumentETDZ Economic and Technical Development Zone PID Project Information DocumentFIRR Financial Internal Rate of Return PIN Project Idea NoteGDP Gross Domestic Product PM10 Particulate Matter (particles of 10 GoC Government of China micrometres or less)GHG Greenhouse Gas PRC People’s Republic of ChinaGHLPCL Guangdong Huizhou LNG Power Co. Ltd. SO2 Sulphur DioxideGNP Gross National Product SCPG Southern China Power GridGPPG Guangdong Provincial Power Grid SEPA State Environmental Protection AgencyGPGC Guangdong Power Grid Company TA Technical AssistanceGW Gigawatt tce Tons of Coal EquivalentGWh Gigawatt-hour tCO2e Tons of Carbon Dioxide EquivalentIEA International Energy Agency TWh Terawatt-hourISO International Organization for TSP Total Suspended Particulate
Standardization UNFCCC United Nations Framework Convention on KP Kyoto Protocol Climate ChangeLNG Liquefied Natural Gas VAT Value Added Tax
WHO World Health Organization
Vice President: James AdamsCountry Director: David Dollar
Sector Director: Christian DelvoieSector Manager: Junhui Wu

Task Team Leader: Ranjit Lamech

CHINA
CHINA: Huizhou Combined Cycle Gas Turbine Thermal Power Project
CONTENTSPage
A. STRATEGIC CONTEXT AND RATIONALE......................................................................1
1. Country and Sector Issues................................................................................................1
2. Rationale for Bank Involvement......................................................................................2
3. Higher Level Objectives to Which the Project Contributes..........................................3
B. PROJECT DESCRIPTION.....................................................................................................3
1. Lending Instrument...........................................................................................................3
2. Project Development Objective and Key Indicators......................................................3
3. Project Components..........................................................................................................4
4. Lessons Learned and Reflected in the Project Design...................................................5
5. Alternatives Considered and Reasons for Rejection......................................................5
C. IMPLEMENTATION..............................................................................................................5
1. Institutional and Implementation Arrangements...........................................................5
2. Monitoring and Evaluation of Outcomes/Results...........................................................7
3. Sustainability......................................................................................................................7
4. Critical Risks and Possible Controversial Aspects.........................................................8
5. Loan/Credit Conditions and Covenants..........................................................................8
D. APPRAISAL SUMMARY......................................................................................................9
1. Economic and Financial Analyses....................................................................................9
2. Technical...........................................................................................................................10
3. Fiduciary: N/A................................................................................................................10
4. Social.................................................................................................................................10
5. Environment.....................................................................................................................10
6. Safeguard Policies Triggered..........................................................................................11
7. Policy Exceptions and Readiness....................................................................................13
Annex 1: Country and Sector or Program Background................................................................14
Annex 2: Major Related Projects Financed by the Bank and/or other Agencies.........................20

Annex 3: Detailed Project Description.........................................................................................22
Annex 5: Implementation Arrangements......................................................................................27
Annex 6: Economic and Financial Analysis.................................................................................28
Annex 7: Safeguard Policy Issues................................................................................................35
Annex 8: Project Processing.........................................................................................................46
Annex 9: Documents in the Project File.......................................................................................47
Annex 10: Project Design Document...........................................................................................49
Annex 11: Statement of Loans and Credits................................................................................108
Annex 12: Country at a Glance..................................................................................................112
Annex 13: Map...........................................................................................................................114
IBRD 35775

CHINA
HUIZHOU COMBINED CYCLE GAS TURBINE THERMAL POWER PROJECT
PROJECT APPRAISAL DOCUMENT
EAST ASIA AND PACIFICEASTE
Date: November 19, 2007Country Director: David Dollar Sector Manager: Junhui WuProject ID: P108516Financing Instrument: Carbon Finance
Team Leader: Ranjit Lamech Sector: Power Themes: Climate Change (P)Environmental screening category: B - partial assessment
Project Financing Data Loan Loan Credit Grant Other: Carbon Finance Total Project Cost (US$m.): 497.41 Co-financing (US$m.): 497.41 Total Bank Financing (US$m.): $ 0.00
Financing Plan (US$ m.)Source Local Foreign Total
Equity:China National Offshore Oil Corporation Ltd. (CNOOC)Guangdong Yudean GroupGuangdong Electricity Development Co, Ltd.
IBRD/IDAOthers:
China Industrial and Commercial Bank (long-term loan)
43.5241.0439.79
0.00
373.06
0.00
43.5241.0439.79
0.00
373.06
Borrower: Not ApplicableResponsible Agency: Guangdong Huizhou LNG Power Company Limited (GHLPCL)Project implementation period: 2008-2012Expected effectiveness date: January 1, 2008Expected closing date: December 31, 2012Does the project depart from the CAS in content or other significant respects? Ref. PAD A.3
Yes No
Does the project require any exceptions from Bank policies? Have these been approved by Bank management? Is approval for any policy exception sought from the Board?
Yes NoNANA
Does the project include any critical risks rated “substantial” or “high”? Ref. PAD C.4
Yes No
Does the project meet the Regional criteria for readiness for implementation? Yes No

Project Development Objective Ref. PAD B.2.
The objective of the project is to encourage the development of clean power generation options in China by purchasing Certified Emission Reductions (CERs) resulting from the generation of electricity by a gas-fired Combined Cycle Gas Turbine (CCGT) power plant.
Description of the Guangdong Huizhou Gas-fired CCGT Power Plant Ref. PAD B.3.
The Huizhou Gas-fired CCGT Power Plant is described in more detail in Annex 3. The proposed project was approved as a CDM project by the National Development and Reform Commission (NDRC) of the People’s Republic of China on December 13, 2006 – after around four years of review and preparation. The Huizhou Gas-fired CCGT Power Plant consists of three combined cycle units. At International Standards Organization (ISO) conditions, the total installed capacity is 1,170 MW (3 x 390 MW). The expected annual electricity output is 3,674 GWh. The electricity generated by the plant is delivered to the Southern China Power Grid (SCPG) which relies mostly on coal-fired power plants. The natural gas is supplied from a re-gasification terminal located near Shenzhen which receives the Liquefied Natural Gas (LNG) from Australia, under a take-or-pay agreement with the Guangdong Dapeng LNG Co. Ltd.
Which safeguard policies are triggered, if any? Ref. PAD D.4.5.6.OP 4.01 – Environmental Assessment, OP 4.04 – Natural Habitats, OP 4.12 – Involuntary ResettlementSignificant, non-standard conditions, if any, for:
Board presentation: None Loan/credit effectiveness: None
Covenants applicable to project implementation: Submission of a Thermal Plume Report by GHLPCL to the Bank by March 15, 2008 but in any case no later than August 31, 2008, in the form and substance satisfactory to the Bank will be a condition for Sale and Purchase of Certified Emission Reductions (CERs) in the ERPA.

A. STRATEGIC CONTEXT AND RATIONALE
1. Country and Sector Issues
1. Growing Energy Demand. China is the world’s second largest energy user and emitter of greenhouse gases (GHGs). Energy consumption in the country has increased, on average, at a rate of 5.8 percent per annum since 1990 reflecting the rapid growth of its economy. It rose from 990 million tons of coal equivalent (tce) in 1990 to 2,460 million tce in 2006.1 The growth rate is more than three times faster than the world’s average annual growth2 and shows no sign of slowing down.
2. Predominance of Coal in China’s Energy Mix. China’s rising energy demand has been met largely by domestic coal – which accounted for 69.4 percent of primary energy consumption in 2006. Coal consumption increased from 1.06 billion tons in 1990 to 2.39 billion tons in 2006 1
Even with an aggressive fuel diversification policy; coal is expected to remain the dominant energy source for the foreseeable future. All projections show that coal will still account for 60 percent or more of China’s primary energy consumption in 2020.3 Coal has also been the predominant source of electricity generation in China. In 2006, it accounted for 76.7 percent of the electricity generated in the country, while gas accounted for 3.5 percent only.1
3. Significant Environmental Consequences. The rapid expansion of the power generation system and its primary reliance on coal has contributed to China’s severe air pollution. In particular, the combustion of bituminous coal is causing serious atmospheric pollution from air-borne particulates, emissions of sulfur dioxide (SO2) and carbon dioxide (CO2). Currently, China’s emissions of SO2 and CO2 are respectively the highest and second highest in the world — with economic losses from pollution conservatively estimated at between 3 and 7 percent of GDP. As China is projected to have the largest absolute growth in CO2 emissions between now and the year 2020, its effort to curb emissions of GHGs is paramount to the Climate Change Agenda. Nitrogen oxides (NOx), other harmful pollutants released by coal-fired power plants, contribute to ground level ozone (smog), acid rain, poor surface water quality, and climate change.
4. The Alarming Situation in Guangdong. In 2006, coal accounted for 77 percent of electricity generated in Guangdong.4 Although there is a national policy on emissions of air pollutants for thermal power plants as well as a bilateral agreement between Hong Kong and Guangdong province on the reduction of SO2 and other air pollutant emissions, the additional generation capacity in Guangdong province remains almost exclusively dependent on coal-fired units. Installed capacity of thermal power plants in Guangdong province increased by 10.75 GW from 24.43 GW in 2002 to 40.62 GW in 2006, most of which are coal-fired power plants. In addition, Guangdong is one of the most affected provinces from pollution of acid rain. Around 60 percent of the total SO2 emissions in Guangdong province come from coal-fired power plants.1 China Statistic Year Book 2007.2 IEA, World Energy Outlook 2006.3 Sustainable Energy in China: The Closing Window of Opportunity, Noureddine Berrah, Fei Feng, Roland
Priddle, and Leiping Wang, World Bank, 2007. 4 2006 China Power Industry Statistic.
1

5. Government Strategy. The Chinese authorities are fully aware of the need to address environmental problems, and current policies focus on environmentally sustainable economic development. To this end, efforts are being made to promote efficient use of energy and cleaner energy resources. Energy efficiency is a cornerstone of the country’s energy strategy and policy during the 11th Five Year Plan (2006-10). The government is also taking aggressive actions to diversify energy sources, including an accelerated nuclear power program, an ambitious gas penetration target, and significant hydropower and renewable energy development plans. However, gas penetration has been a lot slower than planned in the mid-1990s and increased from 1.9 percent in 1995 to 3.5 percent in 2006. It therefore seems unlikely that China can achieve the targeted 6 percent share of gas in commercial primary energy consumption by 2010.
6. The Huizhou Gas-fired Combined Cycle Gas Turbine (CCGT) Power Plant is a pilot project linked to the China’s first Liquefied Natural Gas (LNG) import terminal.5 It was intended to pilot commercial demonstration of large-scale CCGT plants to support the use of cleaner and high efficiency electricity generation facilities fueled by imported gas.
2. Rationale for Bank Involvement
7. The proposed project directly supports a key pillar of the Bank’s new Country Partnership Strategy (CPS) for China (2006–10), namely managing resource scarcity and environmental challenges (Pillar 3). 8. Bank Role in Expanding Gas Utilization. The proposed project is an extension of the Bank’s support to the government’s strategy to adopt cleaner energy technologies. Since the mid-1990s the Bank has supported the government’s efforts to create a policy environment conducive to the development of the gas sub-sector. These efforts have led to a significant development of the gas sector for power and urban energy. However, the share of gas remains low as coal and other energy forms continued to increase rapidly. The dramatic increase of gas price in recent years has reduced the financial attractiveness of gas projects, especially natural gas-based power generation. The Bank has also worked with the Government to devise policies to put the development of the energy sector on a sustainable track. The further diversification of the electricity generation mix and the utilization of Clean Development Mechanism (CDM) revenues to promote cleaner power generation technologies have been identified as two major strategies to achieve sustainable development of the energy sector. Bank involvement in the proposed project will improve the financial viability of the pilot LNG based CCGT power plant and promote further deployment of gas-based power generation.
9. Bank Role in Promoting Carbon Reduction in China. The Bank, as trustee of various Carbon Funds, is a world leader in mitigating climate change via market-based emission reduction purchase transactions through the CDM. China has a strong interest in benefiting from
5 In 1998, the GoC approved the concept of demonstration of importing LNG in Guangdong province, and required that an integrated proposal be prepared to cover LNG terminal, pipelines, and sub-projects using LNG. The preliminary study of Huizhou Gas-fired CCGT Power Plant was carried out in 1993, prior to the planning of the Guangdong LNG Terminal Project. The Huizhou Gas-fired CCGT Power Plant was considered as a sub-project in the integrated proposal. The integrated project proposal - Guangdong LNG Terminal Project was approved by the GoC in 1999.
2

carbon finance, as it has ratified the Kyoto Protocol under the United Nations Framework Convention on Climate Change (UNFCCC). The objective of the UNFCCC is to stabilize GHG concentrations in the atmosphere at a level that would prevent dangerous anthropogenic interference with the climate system. Carbon financing, by providing credits that “buy down” the cost of investments in technologies to reduce carbon emissions, is critical for encouraging public/private enterprises to invest in lower carbon and/or more energy efficient technologies. The energy savings benefits alone for such projects generally do not provide financial rates of return expected by most investors.
10. The Bank approved the Project Idea Note (PIN) for the proposed project and signed a Letter of Intent to purchase Certified Emission Reductions (CERs). The carbon finance revenue will be used to overcome the strong financial barrier to the operation of a gas fired power plant in China.
3. Higher Level Objectives to Which the Project Contributes
11. The higher level objectives of the project are (1) to support China’s participation in global efforts to address climate change through CDM projects and (2) to contribute to China’s sustainable development. The project contributes to these objectives by promoting increased efficiency in power generation and significant reductions in emissions of environment pollutants.
B. PROJECT DESCRIPTION
1. Lending Instrument
12. The Bank is not providing lending to the project, but as the trustee of the Netherlands Clean Development Mechanism Facility (NCDMF), it intends to purchase part of the CERs stemming from the operation of the Huizhou Gas-fired CCGT Power Plant from 2008 to 2012. The exact amount of CERs eligible for purchase and the price of CERs will be defined in an Emission Reduction Purchase Agreement (ERPA) to be negotiated and signed between the Guangdong Huizhou LNG Power Company Limited (GHLPCL, the plant owner) and the Bank on behalf of the NCDMF. ERPA payments will be made annually based on verification of actual CERs by a Designated Operational Entity (DOE), an independent technical expert, accredited by the Executive Board which supervises the CDM for UNFCCC Parties.
2. Project Development Objective and Key Indicators
13. The objective of the project is to encourage the development of clean power generation options in China by purchasing CERs resulting from the generation of electricity by a gas-fired CCGT power plant.
14. The key indicator is the annual delivery of CERs verified by the DOE according to annual measurements of actual emission reductions relative to an agreed baseline.
3

3. Project Components
15. The CERs will be generated by the operation of the Huizhou Gas-fired CCGT Power Plant, which is described in more detail in Annex 3. The proposed project was approved as a CDM project by the National Development and Reform Commission (NDRC) of the People’s Republic of China on December 13, 2006 — after around four years of review and preparation. The Huizhou Gas-fired CCGT Power Plant consists of three combined cycle units. At International Standards Organization (ISO)6 conditions, the total installed capacity is 1,170 MW (3 x 390 MW). Based on gas availability, the latest estimates of annual electricity generation is 3,674 GWh. The electricity generated by the plant is delivered to the Southern China Power Grid (SCPG) which relies mostly on coal-fired power plants. The natural gas is supplied from a re-gasification terminal located near Shenzhen which receives the LNG from Australia, under a take-or-pay agreement with the Guangdong Dapeng LNG Co. Ltd.
16. The plant is located in the Daya Bay Economic and Technical Development Zone (ETDZ) in Huizhou City, about 214 km from Guangzhou, Guangdong province (see map attached to the PAD in Annex 13). All three units are operating satisfactorily and are supplying electricity to the SCPG. Full load operation of each unit has been achieved. The operation of the entire plant at a full load is expected by the end of 2007. The plant owner plans to install a second (Phase II) gas-fired CCGT power plant with identical capacity at the same location in the next few years.
17. CO2 Emission Reduction Estimation. Electricity to be generated by the plant is expected to displace power generation from the SCPG where more than 50 percent of the power comes from coal fired power plants. The NCDMF intends to purchase an annual amount of 950,000 tCO2e emission reductions, with a total purchased amount of 4,750,000 tCO2e during the five-year transaction period (2008-12) (Table 1).
Table 1: Estimated Emission Reductions from the Proposed CDM ProjectEstimated Annual ER Year CO2 Emission Reduction (tCO2e)
Estimated Annual ER form 2008 to 2012
2008 950,0002009 950,0002010 950,0002011 950,0002012 950,000
Total 4,750,000Annual average over period 950,000
18. The Huizhou Gas-fired CCGT Power Plant will assist in (i) meeting rising power demand in Guangdong province; (ii) easing the acute shortage of peak regulating capacity in Guangdong power system; (iii) replacing some small coal-fired thermal power plants; (iv) balancing power demand in Huizhou to reduce power transmission to Huizhou; (v) supporting the sustainability of the Guangdong LNG Terminal Project; and (vi) significantly reducing environmental pollution, as the plant generates no SO2 emissions and very limited NOx and CO2 emissions.
6 15 ºC, sea level.
4

4. Lessons Learned and Reflected in the Project Design 19. Additionality of the CDM project has to be carefully established for CDM revenue eligibility. The Huizhou Gas-fired CCGT Power Plant is expected to result in a reduction in anthropogenic emissions of GHGs that are additional to any that would occur in the absence of the plant. This additionality7 claim was examined with available documentary evidence to ensure that the plant was financed with consideration of CDM revenues. This evidence was collected and verified by the DOE in their validation report.
20. Environmental and social issues need to be assessed and an effective monitoring program implemented to manage any identified risks. The Bank completed the environmental and social due diligence during the project preparation stage. A detailed Due Diligence Report with detailed Environmental Management Plan (EMP) has been prepared to complement measures adopted during the construction and early operation of the plant and will be implemented by the plant owner. Key issues such as thermal plume from the condenser cooling water discharge will be monitored to ensure that the design values are achieved.
5. Alternatives Considered and Reasons for Rejection
21. During the development of the Huizhou Gas-fired CCGT Power Plant, the plant owner considered the option of maintaining the status quo of supplying power with a new sub-critical coal-fired power plant. This alternative was rejected because the use of potential CDM revenues would make the plant financially more attractive and avoid building a low thermal efficiency and polluting coal-fired plant. In addition, this project was intended to test the CCGT technology before further deploying it in Guangdong province and China.
C. IMPLEMENTATION
1. Institutional and Implementation Arrangements
22. The project will be implemented as per the ERPA to be signed between the project owner and the World Bank, as the trustee of the NCDMF. The draft legal agreement is circulated with the PAD and would be signed as soon as the proposed CDM project is approved by Bank management. A Monitoring Plan (MP) will be agreed between parties to the ERPA. The ERPA and the MP define the quantity, price, delivery schedule and other conditions for CERs to be purchased by the NCDMF, as well as monitoring and verification systems and methods. The ERPA will be a performance-based contract, under which the transaction of CERs is contingent on compliance with the Bank’s safeguard polices and delivery.
23. Eligibility of ERs for purchase by the NCDMF will be verified and certified by the DOE, the independent third party verifier. Annual verification and certification of ERs generated by the 7 According to requirements of the applicable assessment methodology under the CDM, project proponent is
required to demonstrate that the GHG reductions from the project activity are additional to those that would have occurred in absence of the project activity. Further details on the assessment of additionality and the relevant methodologies used are available in the Project Design Document (PDD) for the Huizhou Gas-fired CCGT Power Project, Version September 18, 2007.
5

Huizhou power plant will be coordinated by the NCDMF, which will ultimately purchase the CERs according to the agreed ERPA. As per the requirement of the Kyoto Protocol, the GoC will operate a registry to manage the transfer of CERs generated by the project.
24. The plant owner is the Guangdong Huizhou LNG Power Company Limited (GHLPCL), whose sponsors include China National Offshore Oil Corporation (CNOOC), Guangdong Yudean Group Co. Ltd, and Guangdong Electric Power Development Co. Ltd. The GHLPCL will be responsible for implementation of the CDM project, including the following provisions under the ERPA:
a. Maintain and operate the Project in accordance with sound business practices, proper due diligence and high efficiency;
b. Undertake all reasonable efforts, including project documentation, to ensure eligibility of ERs under Art. 12 of the Kyoto Protocol;
c. Undertake all actions agreed in the MP to comply with the Bank’s safeguard policies; andd. Notify the Bank of anything that may have an impact on the project or its capacity to
deliver ERs, including delays, material adverse changes and force majeure.
Specifically, in relation to CERs, the GHLPCL will:
a. Monitor the emissions and other relevant parameters as defined in the MP following the defined methodology;
b. Organize periodic auditing of the project and verification that emission reductions have been achieved in compliance with relevant project criteria, including the preparation of required reports;
c. Prepare annual reports that should include: information on overall project performance, emission reductions generated and verified and comparison with targets, observations regarding MP baseline scenario indicators, information on adjustment of Key MP assumptions, and calculation methods and other amendments of the MP; and
d. Ensure certification of verified emission reductions.
25. The Ministry of Finance, the Guangdong Provincial Government, and the Huizhou Municipal Government will oversee the implementation of the CDM project implemented by the GHLPCL and support it in fulfilling its responsibility as described above. They will also exercise government functions in monitoring the implementation of environmental and social activities to ensure compliance with applicable domestic laws and regulations.
26. Payment and Flow of Funds. The expected flow of funds will be confirmed in the ERPA. After the ERPA becomes effective, NCDMF will only disburse against delivery of certified CERs. The involvement of the NCDMF with the project will expire after CERs up to the total contract amount have been delivered, unless the parties agree to extend the ERPA. In the event that the project sponsors fail to deliver the quantity of CERs for any given calendar year as set forth in the ERPA, they will be required to make-up the shortfall over the course of the following calendar year or another period agreed upon.
2. Monitoring and Evaluation of Outcomes/Results
6

27. Carbon finance projects are initially evaluated on the basis of an ex-ante analysis of the emissions baseline (conventional generation and emissions that would have occurred in the absence of the project) and determination of project additionality. Project performance — and payment for CERs — is then monitored in accordance with the requirements of the MP incorporated in the schedule of the ERPA and evaluated on the basis of achieving the expected CERs. Monitoring and evaluation of CERs are implicit in the project as a function of electricity generation as it occurs, with payment based on megawatt hours (MWh) of net generation sold to the grid.
28. To satisfy the requirements of the UNFCCC and the Kyoto Protocol, the DOE (fully independent third party) has been recruited to (a) provide validation of the baseline; and (b) provide validation of the project design, the project-specific baseline study (test of additionality against the sector-wide baseline), and the monitoring plan. The DOE will also undertake periodic verification and certifications of the ERs generated by the Huizhou CCGT power plant and issue a Verification and Certification Report. This will be forwarded to The Executive Board which is then expected to review the report and to issue the CERs. The report will cover the following items:
a. The amount of CERs the projects have generated in the relevant period;b. Other matters as may be required by the UNFCCC or Kyoto Protocol; andc. Verification of compliance with the Bank Safeguard Policies.
29. The validator will present a PDD, along with a description of the methodology chosen to measure the CERs and to demonstrate additionality, to the Executive Board of CDM, for its approval and registry under international rules. This approach ensures the creation of an environmental commodity that is recognized by existing laws of China and conforms in due course to the relevant international agreements.
3. Sustainability
30. Construction of the Huizhou Gas-fired CCGT Power Plant has already been completed, and is now operating satisfactorily. The HGLPCL’s commitment to and ownership of the CDM project is therefore well established. The plant is being operated based on industry standards and procedures, by well-trained engineers and technicians.
31. After the plant has demonstrated that a gas-fired CCGT power plant can be operated successfully in conjunction with stable LNG supply, the potential for replication in Guangdong province is very high. The GHLPCL is already considering an increase of the installed capacity at the site. 32. From a technical/engineering perspective there are no issues regarding sustainability. The operational risks have been mitigated by means of a long-term gas purchase agreement and an Electrical Power Purchase and Supply Contract with dispatch and financial terms adjusted annually, according to Chinese practices, to achieve an acceptable financial return for the project sponsor.
7

4. Critical Risks and Possible Controversial Aspects
33. All three units of the plant have been commissioned and are operating satisfactorily. The technology is mature, the equipment suppliers are well established manufacturers, the fuel supply and power purchase agreements are in place and the staff benefited from comprehensive training and capacity building program to safely manage the power plant. So, technical, market, policy, and social risks are negligible. However, the risk of the project is rated as moderate because of the financial and environmental risks:
Table 2: Critical Risk Matrix
Risks Risk Mitigation MeasuresRisk
Rating with Mitigation
Financial riskThe financial situation of the company could deteriorate if gas prices rise significantly.
Gas prices are currently very high and the price paid by the HGLPCL is at the ceiling level of the take or pay contract. The CDM revenues will significantly improve the financial situation of the plant. The provincial government committed to adjust power sales price to reflect gas price increases.
M
Safeguards Risk
The safeguards due diligence have been carried out without Bank involvement and might not be in conformance with the country’s rules and regulation.
The Bank undertook a comprehensive and thorough review of environmental and social due diligence carried out for the Huizhou Gas-fired CCGT Power Plant and connected facilities. The results showed that the due diligence is in general in conformance with the country’s rules and regulations.
A supplemental EA report, as part of the due diligence report, to clarify the environmental assessment and social safeguards review has been prepared to improve documentation. The report was disclosed in the InfoShop on November 16, 2007.
A complementary monitoring program for thermal plume have been prepared to confirm the conclusion of the EIA prepared by the sponsors and approved by Chinese environmental authorities. The monitoring program is expected to be conducted when the arrangements for full load operation are reached. A final report satisfactory to the Bank and approved by the concerned local EPB and commitment to implement any necessary remedial measures will be submitted to the Bank no later than March 15, 2008.
M
Overall risk rating M
5. Loan/Credit Conditions and Covenants
34. No Bank lending is involved. The Bank, as the Trustee of the NCDMF, will negotiate the ERPA with the GHLPCL to secure implementation of the MP satisfactory to the Bank.
35. Submission of a Thermal Plume Modeling and Monitoring Report by GHLPCL to the Bank by March 15, 2008, but in any case no later than August 31, 2008, in the form and substance satisfactory to the Bank will be a condition for Sale and Purchase of CERs in the ERPA.
8

D. APPRAISAL SUMMARY
1. Economic and Financial Analyses
36. CDM revenues are important for the Huizhou Gas-fired CCGT Power Plant to provide additional revenues necessary to meet an acceptable financial rate-of-return for the private sponsors of the project. Without these CDM revenues the sponsors will not be able to meet the cash-flow and returns that formed the basis on which the project was developed and financed.
37. Economic Analysis. A cost/benefit analysis was carried out by the Bank during the due diligence of the carbon finance transaction to assess, ex post, the economic viability of the proposed CDM project. The analysis included the economic costs considered in the analysis include the annual investment cost during the construction of the plant and the annual operation costs. All costs are net of taxes and duties. The economic benefits of the project include the returns for electricity sales, valued at total sale price, as a proxy of consumers’ willingness to pay and based on 3,764 GWh (which is low by international standards) and the associated global and environmental benefits due to avoided pollutant emissions. The economic internal rate of return (EIRR), estimated at 12.66 percent, exceeds the social discount rate of 12 percent usually considered in Bank-financed energy projects and the 10 percent discount rate issued by Chinese authorities for evaluation of projects, to reflect the lower opportunity cost of capital in recent years. A detailed description is provided in Annex 6.
38. Financial Analysis. A financial analysis was undertaken based upon the latest cost estimates and financial information obtained during the due diligence of the carbon finance transaction. The latest analysis indicated that the investment Financial Internal Rate of Return (FIRR) would be reduced to 5.31 percent without CDM revenues. The project would achieve an FIRR of 6.02 percent with consideration of additional CDM revenues, which is, however, still lower than the benchmark of 8 percent8 that is assumed for a typical medium- to large-scale enterprise in China. The loan agreement signed between the Guangdong Yudean Group and the China Industrial and Commercial Bank in May 2005 included the CDM cash flows in the future project’s revenue.
39. The need for CDM revenues for the proposed project was confirmed by an assessment of additionality under the CDM procedures, which demonstrated that the Huizhou Gas-fired CCGT Power Plant is unlikely to be financially attractive and is not a common practice within the regional boundary where it operates. Furthermore, the draft Validation Report issued on September 7, 2007, prepared by the DOE, confirmed that the project is “additional,” i.e., that the project would not be feasible without consideration of the additional CDM revenues.
8 State Power Corporation of China. “Interim Rules on Economic Assessment of Electrical Engineering Retrofit Projects.” Beijing: China Electric Power Press, 2003.
9

2. Technical
40. The Huizhou power plant is a newly constructed gas-fired combined cycle power generation plant. It has three units and each unit consists of an advanced (i.e., F Class) gas turbine, matching triple pressure heat recovery steam generator, a steam turbine and a generator. Key components of the combined cycle units (including gas turbines, steam turbines, generators, and their associated control and monitoring systems) were produced through a joint manufacturing agreement between Mitsubishi Heavy Industry of Japan and Donfang Steam Turbine Works of China. Mitsubishi assumed the full responsibility for the quality and performance of the units. Mitsubishi also provided extensive training for the operational staff of the plant. The World Bank technical review confirmed that the plant is being operated and maintained in line with appropriate industry standards.
41. The Huizhou power plant is the first CCGT power plant designed and constructed in China. Since the adopted CCGT technology is mature and was secured by a joint manufacturing agreement with Japan Mitsubishi Heavy Industries, the technical risk is considered to be minimal.
3. Fiduciary: N/A
4. Social
42. The construction of the CCGT power plant and the connected facilities, including transmission lines, the LNG terminal and pipelines involved land acquisition, which included 90.25 ha of permanent land acquisition and 102.6 ha of temporary land occupation. Over 90 percent of permanently acquired land area was state owned, and all temporarily occupied land is collectively owned. The World Bank due diligence review concluded that the land acquisition for the CCGT power plant and connected facilities followed the relevant national laws and regulations. Land acquisition for the Huizhou CCGT power plant site and LNG Terminal site was completed in the 1990s, and the transfer of land use rights from local governments to the project sponsors was done according to the country’s rules and regulations. Land acquisitions for the 220kV transmission lines and LNG pipelines, was completed in early 2005. Compensations of affected people and collectives followed all relevant national laws and local regulations. Extensive consultations were carried out and compensation has been paid directly to the affected villages and individuals. No outstanding issues or disputes were reported to Bank missions by affected communities.
5. Environment
43. Construction of the Huizhou Gas-fired CCGT Power Plant has already been completed. All Chinese Environmental Assessment requirements were properly satisfied for the construction and operation of the power plant. The World Bank’s role is limited to purchasing Certified Emission Reduction credits generated during the operation of the Huizhou Gas-fired CCGT Power Plant. The power plant is being operated and maintained in line with appropriate industry standards.
10

44. The main environmental issues associated with the operation of the Huizhou CCGT power plant include dispersion of the cooling water discharge into the Daya Bay, NOx emissions and associated impacts on air quality, and noise (gas turbine operation). Impacts of NOx emissions and noise are readily managed as described in the EMP and monitoring efforts to date indicate no issue of standards violations. The key issue requiring further verification was the impact of the cooling water discharge (thermal plume) on the natural habitat areas or “core zones” in Daya Bay. The original EIA for the Huizhou CCGT power plant confirmed that the thermal plume had no impact on the core zones. However, there were small changes made to both the Huizhou CCGT plant design and operating parameters so it was deemed necessary to repeat the modeling of the thermal plume and verify the results with field monitoring to provide definitive proof that no impacts would result. Since the cooling water discharge at its closest point is about 8.5 km from the nearest core zone border and the design and operational changes were small, it is highly unlikely that the “no impact” conclusion of the original EIA would change. But the monitoring and modeling program should further reinforce this conclusion. As a consequence, the World Bank requested and GHLPCL agreed to: (a) repeat the thermal plume modeling effort with actual design/operating parameters and the plant operating at full load; (b) implement a monitoring program9 to verify the model results; and (c) implement any recommended mitigation measures should the study results indicate a violation of Chinese standards and/or impacts of the thermal plume upon the core zones. The completion of these activities will be a condition for Sale and Purchase of CERs in the ERPA.
45. Construction of the CCGT power plant followed Chinese Government Environment Impact Assessment (EIA) procedures: a full EIA was prepared and approved by the State Environmental Protection Agency (SEPA) in 2001. A due diligence review of connected facilities, including transmission lines, gas pipelines, and the LNG Terminal concluded that these off-site facilities also prepared EA documents that were approved by the particular local environmental authorities having the assigned responsibility. Annex 7, Table 2 presents details of the EA approvals for both the CCGT power plant and off-site facilities. EIA documents for the CCGT power plant, the LNG Terminal, and the gas pipeline were all of high quality and consistent with the Bank good practice. In fact, although the LNG Terminal and gas pipeline were not constructed under a Bank/IFC project, it was the desire of the project sponsors to prepare the EIA in accordance with best international practice. Therefore they took it upon themselves to adopt IFC/Bank EA requirements to assure internationally recognized standard and quality of their EA document.
6. Safeguard Policies Triggered
46. In accordance with the World Bank EA Safeguard Policy (OP/BP/GP 4.01) the project has been assigned “Category B” because environmental issues associated with the operation of the Huizhou Gas-fired CCGT Power Plant were limited and easily mitigated. The environmental and social impacts were addressed above and more details are in Annex 7. Other safeguard issues are addressed below.
9 A thermal plume monitoring program acceptable to the World Bank was prepared by South China Sea Institute of Oceanology (Chinese Academy of Sciences).
11

Safeguard Policies Triggered by the Project Yes NoEnvironmental Assessment (OP/BP 4.01) XNatural Habitats (OP/BP 4.04) XPest Management (OP 4.09) XPhysical Cultural Resources (OP/BP 4.11) XInvoluntary Resettlement (OP/BP 4.12) XIndigenous Peoples (OP/BP 4.10) XForests (OP/BP 4.36) XSafety of Dams (OP/BP 4.37) XProjects in Disputed Areas (OP/BP 7.60)1/ XProjects on International Waterways (OP/BP 7.50) XNote: 1/ By supporting the proposed project, the Bank does not intend to prejudice the final determination of the parties’ claims on the disputed areas.
47. Natural Habitats. The EIA indicated there were five endangered species located in the Daya Bay, namely: white dolphin, sea turtle, coral reefs, sea horse, and lancelet. The white dolphin disappeared from the Daya Bay at about the time a nuclear power plant became operational (early 1990s) and now are found in the Pearl River Delta approximately 150 km away from the plant site (near Hong Kong). The migratory patterns, feeding and breeding areas of the remaining endangered and protected species, namely, the sea turtle, defined coral reefs, sea horse, and lancelet are all confined to core zones discussed above. The modeling/monitoring study will determine if the thermal discharges from CCGT Power Plant will result in any measurable impacts on these species. As indicated above, the sponsor has agreed to implement any recommended mitigation if required.
48. The nearest beach/tourism areas are approximately 12 km and 4 km away from to the CCGT Power Plant and commercial fishing activities, respectively, and all are located close to the shore line.
49. Institutional Capacity for Safeguard Policies. The process of land use right transfer for the Huizhou CCGT power plant and land acquisition for the LNG Terminal and gas pipelines and transmission lines was handled by local land resources bureaus of the relevant districts and municipalities. The project sponsors and the plant owner have limited experience with the World Bank safeguard policies, but have expressed their strong commitment to making sure all safeguards policies are complied with.
50. The GHLPCL maintains a Business Department that includes an Environment, Health and Safety Division reporting to the Director of Production. There are ten technical staff and twelve people performing environmental monitoring. The CCGT Power Plant has ISO 9001, 14001, and OSHA 18001 certification. Most of the monitoring is confined to source monitoring of stack emissions, and effluent discharge analysis (chemical oxygen demand-COD, residual chlorine, temperature rise across the steam condenser). The environmental monitoring laboratory was found neat, clean and primarily set up for traditional “wet analysis.” The laboratory has the adequate equipment and capacity to perform the normal monitoring associated with discharges from the gas-fired power generation facility.
51. Ambient air quality monitoring is the responsibility of the Daya Bay Environmental Protection Bureau (EPB). There are two stations continuously monitoring air quality currently
12

operating in the approximate vicinity of the CCGT plant and a third is planned to start operation in near future. The first monitoring station is approximately 7 kilometers from the CCGT Power Plant and has been operating since 2003. This older station monitors only the standard regulated pollutants. The second one is a new air quality monitoring station that was put into operation at the beginning of October 2007. This new station is approximately one kilometer from the CCGT Power Plant. It is state-of-the-art, monitoring a variety of organic chemicals in addition to the standard regulated pollutants (SO2, NOx, and PM10).
52. The LNG Terminal has a special unit responsible for health, safety and environment. The care and attention to these issues are considered as the highest priority. The Emergency Response Plan first involves LNG Terminal staff then successively police, fire departments, and municipal emergency units. Training and emergency exercises are held periodically. The exercises are staged in order of complexity from simulating a small simple event that can be resolved by the LNG Terminal staff themselves to simulating a major catastrophic event requiring coordination between LNG Terminal staff, local police and fire departments and local emergency units. This last year, the Safety and Security Department conducted two full-scale exercises for the terminal and two for the pipelines. Pipeline emergencies are the responsibility of the local governments. However, the exercises involve both the LNG Terminal staff and the local government staff since coordination is critical.
53. Disclosure of Information. As required by the Bank, the Due Diligence Report, including the Supplemental EA Report was disclosed in the Infoshop on November 16, 2007.
7. Policy Exceptions and Readiness
54. No policy exceptions are being requested.
13

Annex 1: Country and Sector or Program Background
CHINA: Huizhou Combined Cycle Gas Turbine Thermal Power Project
Energy Sector Overview
1. Energy Production. China has made remarkable progress in developing its energy resources during the last two decades and is now the second largest producer of commercial energy in the world. In 2006, the total commercial energy production reached 2.21 billion tce, an increase of 7.4 percent over that of 2005 (Table 1). Coal production reached 2.37 billion tons (Table 2), crude oil production stood at 185 million tons; natural gas production amounted to 59.5 billion m3 and hydro and nuclear power generation reached 491 TWh. In 2006, coal accounted for 76.7 percent of electricity generated in the country. Even with an aggressive fuel diversification policy, coal is expected to remain the dominant energy source for the foreseeable future.
Table 1: Total Production of Energy and Its Composition 10
YearTotal Energy Production (million tce)
As Percentage of Total Energy Production (%)
Coal Crude Oil Natural GasHydro-power,
Nuclear Power, Wind Power
1990 1,039.22 74.2 19.0 2.0 4.82000 1,289.78 72.0 18.1 2.8 7.22001 1,374.45 71.8 17.0 2.9 8.22002 1,438.10 72.3 16.6 3.0 8.12003 1,638.42 75.1 14.8 2.8 7.32004 1,873.41 76.0 13.4 2.9 7.72005 2,058.76 76.5 12.6 3.2 7.72006 2,210.56 76.7 11.9 3.5 7.9
Table 2: Coal Balance Sheet (million tons) 12
Year 1990 1995 2000 2003 2004 2005 2006Total Coal Production 1,079.88 1,360.73 1,299.21 1,722.00 1,992.32 2,204.73 2,373.00
Total Coal Consumption 1,055.23 1,376.77 1,320.00 1,692.32 1,935.96 2,167.22 2,392.17
2. Energy Consumption. China is also the world’s second largest energy user. Energy consumption in the country, on average, has increased at 5.8 percent annually since 1990—a rate more than three times faster than the world’s average annual growth11 and showing no sign of slowing down. In 2006, China’s total final consumption of commercial energy use was estimated to be about 2.46 billion tce, an increase of 9.6 percent over that of 2005 (Table 3). Coal is the most dominant source of commercial energy, accounting for about 69.4 percent of the total. Oil accounts for 20.4 percent of the total, with an import of 195 million tons of crude oil. Natural gas accounts for 3.0 percent, hydropower nuclear and wind make up the balance (7.2 percent). All
10 China Statistic Year Book 2007.11 IEA, World Energy Outlook 2006.
14

projections show that coal will still account for 60 percent or more of China’s primary energy consumption in 2020.12
Table 3: Total Consumption of Energy and Its Composition 12
YearTotal Energy Consumption (million tce)
As Percentage of Total Energy Consumption (%)
Coal Crude Oil Natural GasHydro-power,
Nuclear Power, Wind Power
1990 987.03 76.2 16.6 2.1 5.12000 1,385.53 67.8 23.2 2.4 6.72001 1,431.99 66.7 22.9 2.6 7.92002 1,517.97 66.3 23.4 2.6 7.72003 1,749.90 68.4 22.2 2.6 6.82004 2,032.27 68.0 22.3 2.6 7.12005 2,246.82 69.1 21.0 2.8 7.12006 2,462.7 69.4 20.4 3.0 7.2
3. GHG Emission. China is also the second largest greenhouse gas (GHG) emitter in the world, mainly due to its enormous fossil fuel (primarily coal) consumption. The total energy consumption and total GHG emissions from energy consumption surged to about 2.4 billion tons coal equivalent (tce) and around 850 million tons of CO2 emissions,13 respectively in 2006. Supplying China’s ever growing energy needs with fossil fuels, especially coal, will most likely result in unacceptable environmental damages, both locally and globally, and escalate energy security concerns.
Energy Sector Issues in China
4. Growing Demand. The ultimate soundness of an energy sector is measured by its ability to supply energy reliably and efficiently to all consumers in an environmentally sustainable way. China has been extremely successful in the past two decades in increasing its energy supply to meet the need of a fast growing economy, at an average of 9.7 percent annually. However, China faces many great challenges in the next 20 years in order to supply the energy needed to quadruple its GDP and build a “well off” society by 2020.
5. Based on the various forecasts, primary energy demand in 2020 will vary between 2.5 billion tce and 3.2 billion tce, the high or low figure depends on many factors, but primarily on whether effective energy conservation policies and measures can be implemented. In view of the energy resources available in China, coal is expected to continue the dominance of energy composition. The extent of coal’s dominance largely depends on how successfully China can exploit and utilize clean energy resources, such as hydropower, renewable, natural gas and coal bed methane (CBM).
6. In addition to build the needed capacity for coal, oil and gas exploration and production as well as for power generation, a mess network of railway system, power transmission system and oil and gas transmission system has to be developed to deliver the energy in the west region to 12 Sustainable Energy in China: The Closing Window of Opportunity, Noureddine Berrah, Fei Feng, Roland
Priddle, and Leiping Wang, World Bank, 2007.13 Assuming a carbon intensity of 2.3 ton CO2e/ton raw steel production based on the analysis in “China
Sustainable Energy Scenarios in 2020” — Energy Research Institute of China, 2003.
15

the economic centers in the east and south coastal regions. Associated with the construction of physical infrastructures is the huge finance requirement.
7. Energy Security. China’s two decades of rapid economic growth have fueled a demand for energy that has outstripped domestic sources of supply. It has become the second largest energy consumer and its reliance on energy imports is likely to increase significantly during the next 20 years. China became a net oil importer in 1993, and is now the second largest petroleum consumer in the world. It is projected that China will need to import some 60 percent of its oil and at least 30 percent of its natural gas by 2020. China is forced to look abroad and take steps today in order to supply the energy resources it needs to sustain economic growth. This brings out the issue of energy security—obtaining secure access to a reliable and affordable source of energy. A comprehensive energy strategy that addresses both demand and supply issues is required to manage the rising energy insecurity effectively.
8. Energy Efficiency. Although energy consumption in China has increased at a rate of only about half as fast as overall economic growth during the last two decades, energy use in many applications remains far less efficient than in more developed industrial economies. The unit energy consumption in most standard industrial processes still remains 20–100 percent higher than in developed countries. Residential buildings in China are estimated to consume 50–100 percent more energy for space heating as compared with similar buildings in a similarly cold climate in Western Europe or North America, yet they provide far less comfort.
9. The need to improve the efficiency of energy use in parallel with development of additional energy supply has been a cornerstone of China’s energy policy for more than 15 years. Although substantial success has been achieved, it is widely recognized both inside and outside of China that far greater improvements in the efficiency of energy use are critical to the country’s economic and environmental future. All recent macroeconomic forecasting work on China has shown that continued rapid economic growth is not physically, financially or environmentally sustainable without dramatic further improvements in energy efficiency.
10. Environmental Impact. Few countries are as dependent on coal as China. The increased generation of coal-based energy is both a corollary of economic growth and a major source of pollution. In particular, the combustion of bituminous coal is causing serious atmospheric pollution from air-borne particulates, emissions of SO2 and CO2. SO2, through its transformation into sulfate small particles, is identified as one of the most serious pollutants impacting buildings, cultural heritage, and crop production. Particulates have also serious and extensive impacts on human health. Rising coal consumption in China has contributed to increasingly serious environmental ramifications, both at the local and global levels. According to a report by the World Health Organization, seven of the world’s ten most polluted cities are in China. The country’s heavy use of unwashed coal leads to large emissions of sulfur dioxide and particulate matter. Currently, China’s emissions of SO2 and CO2 are respectively the highest and second highest in the world. Economic losses from pollution are conservatively estimated to be at between 3 and 7 percent of GDP. As China is projected to have the largest absolute growth in CO2 emissions between now and the year 2020, its effort to curb emissions of GHGs is paramount to the Climate Change Agenda. If the business continues as usual, both the SO2 and CO2 emitted will more than double the current levels by 2020. In addition, coal production is also causing serious degradation of land and damaging underground water system that supports
16

agricultural production and people’s living in many areas. NOx are other harmful pollutants generated from the coal power plants. NOx contributes to ground level ozone (smog), acid rain, poor surface water quality, and climate change.
Similar Concerns are more Alarming in Guangdong Province 11. Coal accounted for higher proportion of electricity generated in Guangdong than its average share of electricity generated in China (see Table 4 below). Although there is a national policy on emissions of air pollutants for thermal power plants as well as a bilateral agreement between Hong Kong and Guangdong province on the reduction of SO2 and other air pollutants emissions, the additional generation capacity in Guangdong province remains almost exclusively dependent on coal-fired units. Installed capacity of thermal power plants in Guangdong province increased by 10.75 GW from 24.43 GW in 2002 to 40.62 GW in 2006, most of it coal-fired power plants. Guangdong is one of the provinces with serious pollution of acid rain. Around 60 percent of the total SO2 emissions in Guangdong province come from coal-fired power plants.
12. Guangdong is facing a number of challenges in its power system, including (1) power shortage; (2) unbalanced energy structure and distribution; (3) lack of peak regulating capacity; (4) insufficient power generation projects; and (5) serious environment impacts.
Table 4: Generation of Electricity in Guangdong by Fuel Type (Percent) 14
1996 1997 1998 1999 2000 2001 2002 2003 2004 2005 2006Thermal power 72.6 71.7 73.4 77.9 77.6 76.2 76.5 75.6 81.1 77.4 77.0Hydro power 12.8 14.4 13.1 9.7 11.5 13.3 10.5 7.9 5.3 9.1
(including pumped storage)
10.3(including pumped storage)
Nuclear power 13.3 12.6 12.5 12.4 10.9 10.5 13.0 15.3 13.6 13.4 12.6Pumped storage 1.2 1.3 0.9 0.0 0.0 0.0 0.0 1.2 0.0
Wind power 0.0 0.0 0.1 0.0 0.0 0.0 0.0 0.1 0.0 0.1 0.1
Government Strategy
13. China has been actively participated in international efforts to address global challenges, such as, climate change and degradation of land and biodiversity. China played an important role during the negotiation of the UNFCCC. On behalf of the Government, the Premier Minister signed the UNFCCC during the UN Conference on Environment and Developing in 1992 and China was one of the first countries to ratify the Convention in 1993. China ratified the Kyoto Protocol in 2002. More significantly, China agreed to develop CDM projects with the NCF in December 2006.
14. Since the mid-1980s, the GOC has gradually moved from a centrally controlled electricity industry to a market oriented industry. Major specific steps in the 1990s include:
14 2006 China Power Industry Statistics
17

a. In 199, the Electricity Law broke the monopoly of state utilities in the generation segment by allowing non utility and private sector ownership of power generation assets, recognized electricity as a commodity and established the principle of separation of government and enterprise functions;
b. In 1996, the State Council abolished the Ministry of Electric Power and transferred the governmental (regulatory) functions to the State Electricity Regulatory Commission; and
c. In 1998, the State Council required the separation of generation from the transmission network; redefined the legal status of regional groups and established provincial companies.
15. The policy document 2002 State Council Document No. 5 is a major step forward, and specifically outlines a long-term vision to expand competition starting with generation focusing on regional markets, and moving to wholesale with access of large consumers to generators by 2005. The document also requests that the SETC ensure fair competition in the competitive segments of the industry and protection of consumers from monopoly abuses in the noncompetitive segments.
16. In addition, the most recent and significant regulation Provisional Regulation on the Operation and Management of Clean Development Mechanism Projects (the Regulation) was made available on June 11, 2004. The Regulation provides that the priority of CDM projects in China is to increase energy efficiency, develop new and renewable energies, and utilize methane. To oversee the operation of CDM projects in China, the National Council for CDM Project has been established with the following main agencies: the NDRC, Ministry of Science and Technology, Ministry of Foreign Affairs, SEPA, MOF, and Ministry of Agriculture.
17. The Chinese authorities are fully aware of the need to address environmental problems, and its recent policy calls for economic development proceeding in tandem with environmental protection. To this end, efforts are being made to promote efficient use of energy and cleaner energy resources. Energy efficiency is a cornerstone of the country’s energy strategy and policy during the 11th Five Year Plan (2006-11). The government is also taking aggressive actions to diversify energy sources, including an accelerated nuclear power program, an ambitious gas penetration target, and a significant hydropower and renewable energy development plan. However, gas penetration has been a lot slower than planned in the mid-1990s. It is very unlikely that the country achieves the target of 6 percent share of the commercial primary energy consumption by 2010.
18. The proposed project, through the implementation of a CCGT power plant using natural gas transported in the form of LNG, is perfectly aligned with the government’s objective of enhancing the supply of cleaner energy resources and efficiency of energy use, as well as its strategy of increasing gas penetration. The CCGT gas-fired power plant will help to (i) meet the requirement of quickly increased power demand in the Guangdong province; (ii) ease the acute shortage of peak regulating capacity in Guangdong power system; (iii) replace some small coal-fired thermal power plants; (iv) balance power demand in Huizhou to reduce power transmission to Huizhou; (v) strongly support the sustainability of the Guangdong LNG Terminal and pipeline project; and (vi) significantly reduce environmental pollution, as the plant entails no SO2
emissions and very limited NOx and CO2 emissions.
18

The Netherlands Clean Development Mechanism Facility (NCDMF)
19. The World Bank announced an agreement with The Netherlands in May 2002, establishing a facility to purchase greenhouse gas emission reduction credits. The Facility supports projects in developing countries that generate potential credits under the CDM established by the Kyoto Protocol to the United Nations Framework Convention on Climate Change. The Fund has a total capital of US$264.7 million. For purchase of CERs after commissioning of power generation, the Bank will make annual payments from the NCDMF to the GHLPCL during the credit period according to the ERPA agreed between the two parties.
Location of the Huizhou Gas-fired CCGT Power Plant and Connected Facilities
20. The Huizhou Gas-fired CCGT Power Plant has a total land area of 41.5 ha, which is located along the coast in Daya Bay ETSZ in Huizhou Municipality, about 214 km from Guangzhou, Guangdong province. About three quarters of the site is land area and one quarter is sea area, and most of the land area is composed of construction areas acquired in the early 1990s.
21. In addition to the power plant, two 220kV transmission lines were constructed, with a combined length of 40 kilometers, located in both Daya Bay District and Huiyang District in Huizhou Municipality.
22. The related Dapeng LNG Terminal with 39 ha of land areas is located in Dapeng Town, Longgang District, Shenzhen Municipality, Guangdong province. The LNG pipeline connecting the JNG Terminal and Huizhou Gas-fired CCGT Power Plant has a total length of 47 kilometers. The pipeline passes through Longgang District under Shenzhen Municipality, and the Daya Bay District under the Huizhou Municipality. Majority of the land acquired during the construction of the terminal (39 ha) and the pipeline were woodland, in addition to a limited amount of farmland. Limited amount of permanent land acquisition and temporary land occupation was required during the construction of the gas pipelines and transmission lines.
19

Annex 2: Major Related Projects Financed by the Bank and/or other Agencies
CHINA: Huizhou Combined Cycle Gas Turbine Thermal Power Project
I. Bank-Financed Projects in Power Sector in China:
Sector Issue Project Name OED Rating
Latest Supervision (PSR) Ratings (Bank-Financed
Project Only)
Impl. Progress (IP)
Devel. Objective
(DO)
Ongoing ProjectsTransport and energy bottlenecks Third Inland Waterways S SOverall efficiency of the power sector in Jiangsu
Yixing Pumped Storage Project S S
Universal electricity access ESW: ESMAP China Universal Access to Electric Power
NA NA
Dispatch of the provincial grid ESW: CN-Generation Pricing, Trading & Dispatch
NA NA
Peaking capacity and load following capability and power quality
China Tongbai Pumped Storage S S
Greenhouse emission Carbon Offset: CN-PCF Jincheng Coal Bed Methane Project
NA NA
Electric power generation capacity and energy efficiency
Hubei Hydropower Development in Poor Areas Project
S S
Access for poor regions of southern China with clean electricity
Fourth Inland Waterways Project S S
Completed Projects in the past five yearsRegulatory capacity of the State Electricity Regulatory Commission
ESW: Accounting Regulation in China’s Power Sector
NA
Regulatory and supervision capacity of State Electricity Regulatory Commission
TA: Support to the State Electricity Regulatory Commission
NA
Regulatory and supervision capacity of State Electricity Regulatory Commission
TA: Advice on Power and Gas Reform and Regulatory Issues
NA
Inadequacy of the prevalent pricing policy to meet the requirement of competitive markets
TA: Advising Government Agencies on Energy Pricing
NA
Pipeline ProjectsSO2 emissions in the heat andpower sector; and capacity of monitoring and enforcement of SO2 emissions reduction program
Shandong Flue Gas Desulfurization
Inland waterway transport capacity and service levels for primary andsecondary industries; and clean renewable electricity generation
Jiangxi Shihutang Navigation and Hydropower Complex Project
Coal-based thermal power efficiencyGEF China Thermal Power Efficiency Project
Hydropower development; GHG emissionCarbon Offset: Yunnan Whitewaters Hydro Project
IP/DO Ratings: HS (Highly Satisfactory), S (Satisfactory), U (Unsatisfactory), HU (Highly Unsatisfactory), NA (Not Applicable)
20

II. CDM Projects Registered with CCGT Technology:
Registered Title Host Parties Other Parties Methodology Reductions
(tCO2e)
17 Mar 07
Blastfurnace Off Gas (BOG) and Coke Oven Gas (COG) Utilization for Combined Cycle Power CDM Project in Jinan Iron & Steel Works
China United Kingdom of Great Britain and Northern Ireland
ACM0004 ver. 2 2,089,883
26 May 07
119.8 MW Natural Gas based Combined Cycle Power Plant, at Tanjavur, Tamilnadu by M/s Aban Power Company Limited
India AM0029 181,153
22 Jun 07Energas Varadero Conversion from Open Cycle to Combined Cycle Project
Cuba Canada ACM0007 ver. 1 342,235
11 Aug 07
1147.5 MW Natural gas based grid connected Combined cycle power generation project
India AM0029 3,189,704
15 Oct 07
Waste gases utilization for Combined Cycle Power Plant in Handan Iron & Steel Group Co., Ltd
China Sweden Netherlands
ACM0004 ver. 2 665,545
Requesting Registration
155 MW Gas based combined cycle power project at Hazira India AM0029 ver.
1
Requesting Registration
Henan Zhengzhou Grid Connected Natural Gas Combined Cycle Power Plant
ChinaUnited Kingdom of Great Britain and Northern Ireland
ACM0002 ver. 6 AM0029
21

Annex 3: Detailed Project Description
CHINA: Huizhou Combined Cycle Gas Turbine Thermal Power Project
1. The CERs will be generated by the operation of the Huizhou Gas-fired CCGT Power Plant. The proposed project was approved as a CDM project by China NDRC on December 13, 2006, after more than four years of preparation. As a trustee of the NCDMF, the World Bank, as the Trustee of NCDMF, intends to purchase partial CERs to be created by the plant for a period of five years (2008 to 2012). The purchase amount and price will be defined in an ERPA to be reached through negotiation between the World Bank and GHLPCL. The plant was financed by the project sponsors: CNOOC, Guangdong Yudean Group Co. Ltd, and Guangdong Electric Power Development Co. Ltd. The World Bank’s role in the carbon reduction project is limited to purchasing partial emission reduction assets created by the power plant.
Plant Site Selection
2. The Huizhou Gas-fired CCGT Power Plant is located in the Daya Bay Economic and Technical Development Zone, Huizhou City, about 214 km from Guanzhou, Guangdong province. The key factors for deciding the plant sitting were: proximity to natural gas mainlines, high voltage transmission and fast growing load center, and availability of land and cooling water. The plant site is accessible by highway, railroad and sea transport.
Description of Huizhou Gas-fired CCGT Power Plant
3. Construction of the plant has been completed. Its construction commenced in September 2004. The first two units of the power plant were commissioned in September and December 2006 respectively, followed by the commissioning of the last unit in May 2007. The last unit is currently under one-year test operation. All three units are operating satisfactorily and are supplying electricity to the SCPG, which rely mostly on coal-fired power plants. Full load operation of each unit has been achieved. The operation of the entire plant at a full load is expected by the end of 2007. The salient features of the plant are as follows.
4. Plant Configuration. The plant consists of three combined cycle units. They are identical and in a standard Mitsubishi arrangement. Each unit consists of one gas turbine, a heat recovery steam generator (HRSG), a steam turbine, and a common generator. The single shaft machine consists of inline gas turbine and steam turbine, directly coupled with a matching generator. At ISO conditions, the total installed capacity of the three modules is 1,170 MW (3 x 390 MW).
a. Gas Turbine. The combustion turbines are F-class, a widely used technology for large combined cycle plants. The M-701 F heavy duty gas turbine consists of a compressor, combustion chamber and the turbine proper. The natural gas is mixed with compress air and burnt in the combustion chamber. This process produces turbine inlet temperature of 1,400ºC and turbine outlet exhaust gas temperature of 599 ºC.
b. Heat Recovery System Generators (HRSGs). The HRSGs are unfired, triple-pressure steam boilers designed to use the maximum exhaust temperature and gas flow of the connected gas turbines. At a full ISO rated output, 599ºC exhaust gas is ducted from the gas turbine to the HRSG, to produce about 277 t/h high pressure superheat steam flow,
22

about 41 t/h medium pressure reheat steam flow, and about 49 t/h low pressure steam flow. Remaining exhaust gas is released through an 80 m stack connected to each unit. The exhaust temperature is less than 86ºC. A bypass exhaust between the gas turbines and HRSGs enable the gas turbine to maintain full load in the event of a trip or shut down of the condensing turbine.
c. Steam Turbines. The steam turbines of double cylinder, reheat, condensing type are designed to operate with steam at HP-9.98 MPa, 538ºC; MP- 3.35 MPa, 566ºC; and LP- 0.428 MPa, 568ºC. To allow the plant use for peaking, medium- and base-load operation, the HRSG send steam turbines are designed for sliding pressure operation over a wide range to respond to load variation of the gas turbines.
d. Generators. The rated capacity of each generator is 409.7 MW. The generators are cooled by hydrogen and their electrical output is at 20 kV.
e. Static Frequency Converters. The plant includes two static frequency converters to start the three combined cycle units. The static frequency converters are used to accelerate the speed of the 37.5 m long single shaft to about 2000 rpm. The gas turbine then takes over to accelerate the speed of the shaft to 3000 rpm to allow the synchronization and the loading of the generator. The operation is reliable and satisfactory.
f. Central Control System. A microprocessor-based distributed control system is installed in a Central Control Room to monitor and operate all three combined cycle units. Plant-specific equipment status and operating parameters are displayed on consoles and provide real-time information to the operators.
g. Make-up Water System. The HRSG make-up water, service water and portable water are supplied by the municipal water supply system. The amount is modest (0.0372 m3/sec) and the municipal system has no problems meeting these needs. A water treatment plant at the site processes the industrial quality water to meet the requirements of HRSGs.
h. Cooling Water System. The condensing steam turbines of the three units were designed based on a once-through condenser cooling water system, drawing sea water from the Daya Bay and discharging it back. The intake and outlet structures and circulating pump house are located on the bank of the Daya Bay. The cooling water intake is near the Bay bank. The cooling water discharge outlet is 825 meter away from the Bay bank and 6.5 meter deep in the sea. The cooling water flow is about 23.2 m3/sec.
5. Key components of the combined cycle units (including gas turbines, steam turbines, generators, HRSGs and their associated control and monitoring systems) were produced through a joint manufacturing agreement between Mitsubishi Heavy Industry of Japan and Dongfang Steam Turbine Works of China. Mitsubishi assumed the full responsibility for the quality and performance of the units. Mitsubishi also provided extensive training for the operational staff of the CCGT Power Plant. The HRSGs were produced by the Hangzhou Boiler Group, a recognized manufacturer of such equipment of China.
6. Thermal Efficiency. The average thermal efficiency of the plant could reach 56.6 percent due to the following properties:
23

a. The plant has a single shaft configuration which is more efficient than the multi shaft configuration due to lesser length of steam cycle piping and lesser number of major operating equipments.
b. The gas turbine inlet temperature reaches 1,400 ºC, which significantly increases the thermal efficiency.
7. Table 1 below summarizes the key technical parameters of the power plant.
Table 1: Key Technical Parameters of the Huizhou Gas-Fired Power Plant
No. Item Key Technical Parameters1 CCTG capacity 3X390MW, 20kV2 HRSG (NG-M701F-R) Unfired; HP: 277.67t/h/10.36MPa; MP: 41.09t/h/3.63 MPa;
LP: 49.01t/h/0.474MPa3 Hours for electricity generation 3,500 h5 Auxiliary Power Consumption 2.4%6 Gas consumption 0.171m3/kWh (standard coal equivalent 218g/kWh)8 Thermal efficiency 56.6%9 Fresh Water 0.0372 m3/sec; 133.9 m3/h; 468,650 m3/y10 Cooling water 23.2 m3/sec
8. Transmission Lines. The power produced by the plant is sent to the interconnected SCPG through three 480 MVA step-up transformers to the nearby existing 220-kV substations. The plant is connected to the Fengtian and Qiuchang 220kV substations by one 12.7 km and the other 26.2 km double circuit overhead lines respectively. The two double circuit 220kV transmission lines were constructed by the Huizhou Electric Power Company in early 2005 and commissioned in June 2006. The GHLPCL and Guangdong Power Grid Company (GPGC) signed a one-year Electrical Power Purchase and Supply Contract in August 2006. The terms of the contract will be annually reviewed to achieve an acceptable financial return for the project sponsor.
9. Natural Gas Supply and Receiving System. The gas is supplied via a 47 km pipeline from the LNG re-gasification terminal located near Shenzhen. The LNG Terminal will annually import about 3.7 million tons of LNG from Australia over the next 25 years and mainly supply gas to Shenzhen, Dongguan, Guangzhou, Foshan, Hong Kong and five power plants. A natural gas receiving and reducing station, with its own separately fenced compound, is located at the northwest corner of the plant site. Natural gas for the gas turbines is delivered to the station at a pressure of 38 bars and reduced to about 34 bars. The calorific value of the gas is 41.4 MJ/m 3. The three combined cycle modules would produce about 3,674 GWh of electricity requiring about 505,749 tons 15 (equivalent to 697.4 million m3 of natural gas) of LNG per annum.
10. A long-term (25 years) gas sales contract was signed on April 30, 2004, between the seller, Guangdong Dapeng LNG Co. Ltd., and the sponsors of CCGT power plant: CNOOC, Guangdong Yudean Group, and Guangdong Electric Power Development Co. Ltd. The supply contract includes take-or-pay and adjustment of gas price clauses. The gas price is adjusted
15 A metric ton is equivalent to 48,700 cubic feet of natural gas. One cubic meter of NG is equivalent to 35.315 cubic feet NG.
24

annually to reflect changes in LNG price, LNG transportation cost, and unit terminal and trunk line fee. The contract was transferred to the GHLPCL, a subsidiary of the Guangdong Electric Power Development Co, after its creation.
Initial Operation Results of Huizhou Gas-fired CCGT Power Plant
11. The key operational indicators since commissioning are listed in Table 2 below. The availability is high for a first year of operation.
Table 2: Initial Operation Results of the Huizhou Gas-Fired CCGT Power Plant
Unit 1 Unit 2 Unit 3Total operating time (hours) 4,122
(Sept. 2006-Sept. 2007)
2,026(Dec. 2006-Sept. 2007)
657(Jun. –Sept. 2007)
Total power generated (GWh) 1,236 576 182
Heat rate (KJ/kWh) 6,735 6,743 6,750
Fuel consumption Gas: (m3/kWh) Standard coal equivalent: (g/kWh)
0.1801229.8
0.1803230.1
0.1805230.4
Average auxiliary power consumption (%) 3.3 3.15 3.1
Forced outage rate (%) 0.25 NA NA
Availability rate (%) 89.47 84.71 65.17
25

Annex 4: Project Costs
CHINA: Huizhou Combined Cycle Gas Turbine Thermal Power Project
Estimate of Project Costs (Excluding connected facilities):
Project Cost By Component and/or ActivityRMB
millionUS$
millionHuizhou Gas-fired CCGT Power Plant
Civil works 678.50 91.20
Power plant equipment 2,242.20 301.37
Installation 271.19 36.45
Others (Environment protection, designing and supervision) 508.80 68.39
Total Project Costs 3,700.69 497.41
26

Annex 5: Implementation Arrangements
CHINA: Huizhou Combined Cycle Gas Turbine Thermal Power Project
1. The detailed implementation arrangements will be presented in the NCDMF ERPA to be signed between GHLPCL and International Bank for Reconstruction and Development, as trustee of the NCDMF.
2. The parties involved in the project activities and their roles in the implementation of the project are listed below:
a. GHLPCL is the power plant owner. The construction of the power plant has been completed. All three CCGT units have been commissioned. Pending the registration, verification,16 and certification by the UNFCCC, the CERs will be under the ownership of GHLPCL.
b. NCDMF: This trust fund is maintained and operated by the World Bank in its capacity as the trustee on behalf of the State of the Netherlands. The Letter of Approval (LOA) from the State of the Netherlands has been issued and delivered to the Trustee.
c. NDRC as the Designated National Authority (DNA) of the Host Country has reviewed and approved the draft PDD. The Letter of Approval has been issued, accordingly.
d. Ministry of Finance, Guangdong Provincial Government, and Huizhou Municipal Government will oversee the implementation of the CDM project implemented by the GHLPCL. They will also exercise government functions in monitoring the implementation of environmental and social activities to ensure compliance with applicable domestic laws and regulations.
Payment and Flow of Funds
3. After the ERPA becomes effective, the NCDMF will make payment against delivery ofCERs. The involvement of the NCDMF with the project will expire after CERs up to the total contract amount of 4.75 million tCO2e have been delivered, unless the parties agree to extend the ERPA. In the event that the project sponsors fail to deliver the quantity of CERs for any given calendar year as set forth in the ERPA, they will be required to make-up the shortfall over the course of the following calendar year or another period agreed upon.
4. Since the monitoring of the thermal plume has yet to be undertaken, submission of a Thermal Plume Report by GHLPCL to the Bank by March 15, 2008, but in any case no later than August 31, 2008, in the form and substance satisfactory to the Bank will be a condition for Sale and Purchase of CERs in the ERPA.
16 Verification will be undertaken by the Designated Operational Entity (DOE) prior to the request for certification from the UNFCCC.
27

Annex 6: Economic and Financial Analysis
CHINA: Huizhou Combined Cycle Gas Turbine Thermal Power Project
Economic Analysis
1. The Huizhou Gas-fired CCGT Power Plant with capacity of 1,170 MW (3*390MW) is located in Daya Bay Economic and Technical Development Zone, Huizhou City of Guangdong Province. The plant is connected to the GPPG, which is a part of larger SCPG. The economic analysis was carried out to verify the economic viability of the proposed project in the boundary of GPPG. As the construction of the plant has been completed with three units already commissioned in September 2006, December 2006, and June 2007 respectively. This ex post economic analysis has been carried out based on the latest cost estimate and information made available to the Oct. 2007 mission.
2. The incremental benefits of this transaction include the local environmental benefits from the reduction in SO2, NOx, and TSP emissions. The global environmental benefit from the CO2
emission reduction is the major part of the total environmental benefits. The Project also provides the much needed electricity to support rapid economic development and poverty reduction in the Guangdong province and the Southern Region. The project delivers cleaner electricity by substituting power generated from the SCPG which is dominated by coal-fired power plants.
3. Economic Cost. Economic costs considered in the analysis consist of (a) the yearly investment cost during the construction period from 2004 to 2007, and (b) annual operation and maintenance (O&M) cost. All cost is updated based on the latest estimates and expressed in 2006 RMB. Taxes, duties, and any transfer payments were excluded in the economic costs.
4. Benefits. The main economic benefits of the Huizhou CCGT power plant arise from: a) electricity sales to the grid; and (b) environmental benefits because of the “clean” energy provided by the project, including reducing the air pollution from SO2 emissions, particulates, NOx and CO2 emissions.
5. The key common financial assumptions in estimating the economic benefits of the Huizhou power plant are summarized below:
Annual Electricity generation: 3,674 GWh17 (2011–27); Annual Electricity sales: 3,586 GWh (2011–27); Plant Use Rate: 2.4 percent; WTP in Guangdong Power Grid: 0.530 Yuan/KWh, including 17 percent Value Added
Tax (VAT) for electricity and heavy oil). Energy prices are based on the adjusted electricity tariff of RMB 0.530/kWh (inclusive of VAT) for the first year of commercial operation approved by the provincial price bureau;
17 This is based on the latest estimate by the company in October 2007. Annual power generation of the plant is calculated based on the contracted amount of natural gas supply. Annual gas supply is calculated to be 505,749 tons from 2011–27, generating 3,674 GWh of electricity annually. From 2007 to 2011, gas supply will gradually increase from 308,682 tons to 505,749 tons, increasing the annual amount of electricity generation from 2,242.6 GWh to 3,674 GWh.
28

Capital cost of Huizhou power plant: 3,700.69 million RMB; and Fuel price: 1.65 Yuan/Nm3 (including 13 percent VAT).
6. The carbon emission reductions were valued at a recent market price of US$12 per tCO2e. The price is consistent with the experience of Carbon Finance Unit’s (CFU) recent transactions. The assumptions for emission factors and the value per ton of avoided emissions, as well as the resulting total emissions avoided used in the economic analyses are as follows:
EmissionEmission per GWh of Electricity Generated
(kg/GWh)
Total Emission Avoided
(ton)
Value for Emission Avoided (US$/ton)
TSP 150.7 10,131 7,436SO2 3,021.3 222,343 197NOx 1,372.0 44,904 197CO2 674,800 21,917,683 12
7. The analysis showed that the EIRR of the project is 12.66 percent. The EIRR exceed the social discount rate of 12 percent usually considered in the Bank financed energy projects and previous Chinese guidelines for evaluation of projects, confirming, as expected, the economic viability of the project. A lower social discount rate of 10 percent was retained in the recently revised guidelines for evaluation of projects in China. The lower discount rate of 10 percent increases the robustness of the conclusion that the project’s investment is economically sound and desirable. The NPV of this project is RMB 105.59 million and RMB 501.05 million with the discount rates of 12 percent and 10 percent, respectively. The estimated annual CO2 emission reductions are 1,077,785 tons.18 The detailed analysis of the EIRR estimate for this project is shown in Table 1 and 2 below.
Table 1: Cost-benefit Analysis (2006 RMB, million Yuan) (NPV@12%)
Year Incremental cost Incremental Benefit Net Benefit
Investment O&M Cost Subtotal
Energy Supply Benefit
Local Benefit
CO2 Benefit
Total Benefit
2004 520.21 0 520.21 0 0 0 0 -520.212005 803.10 0 803.10 0 0 0 0 -803.102006 967.84 0 967.84 0 0 0 0 -967.842007 441.36 902.43 1,343.79 991.52 28.88 57.44 1,077.84 -265.952008 0 1,123.94 1,123.94 1,337.67 38.96 77.49 1,454.12 330.172009 0 1,250.70 1,250.70 1,535.74 44.73 88.97 1,669.44 418.742010 0 1,261.77 1,261.77 1,553.04 45.23 89.97 1,688.24 426.472011 0 1,307.51 1,307.51 1,624.35 47.31 94.09 1,765.74 458.242012 0 1,307.51 1,307.51 1,624.35 47.31 94.09 1,765.74 458.242013 0 1,307.51 1,307.51 1,624.35 47.31 94.09 1,765.74 458.242014 0 1,307.51 1,307.51 1,624.35 47.31 94.09 1,765.74 458.242015 0 1,307.51 1,307.51 1624.35 47.31 94.09 1,765.74 458.242016 0 1,307.51 1,307.51 1,624.35 47.31 94.09 1,765.74 458.24
18 The figure is slightly lower than the ex-ante estimate of 1,096,728 tons in the PDD. This is because the projected annual electricity generation decreases based upon the latest estimate of gas supply in the supply clause of the LNG sales and purchase contract.
29

Year Incremental cost Incremental Benefit Net Benefit
Investment O&M Cost Subtotal
Energy Supply Benefit
Local Benefit
CO2 Benefit
Total Benefit
2017 0 1,307.51 1,307.51 1,624.35 47.31 94.09 1,765.74 458.242018 0 1,307.51 1,307.51 1,624.35 47.31 94.09 1,765.74 458.242019 0 1,307.51 1,307.51 1,624.35 47.31 94.09 1,765.74 458.242020 0 1,307.51 1,307.51 1,624.35 47.31 94.09 1,765.74 458.242021 0 1,307.51 1,307.51 1,624.35 47.31 94.09 1,765.74 458.242022 0 1,307.51 1,307.51 1,624.35 47.31 94.09 1,765.74 458.242023 0 1,307.51 1,307.51 1,624.35 47.31 94.09 1,765.74 458.242024 0 1,307.51 1,307.51 1,624.35 47.31 94.09 1,765.74 458.242025 0 1,307.51 1,307.51 1,624.35 47.31 94.09 1,765.74 458.242026 0 1,307.51 1,307.51 1,624.35 47.31 94.09 1,765.74 458.242027 0 1,307.51 1,307.51 1,624.35 47.31 94.09 1,765.74 458.24
Total 2,732.51 26,766.51 29,499.02 33,031.92 962.07 1,913.40 35,907.22 6,408.36PV@12% 2,074.07 6,626.57 8,700.64 8,101.04 235.94 469.26 8,806.23NPV@12% 105.59
EIRR (Economic Internal Rate of Return): 12.66%
Table 2: Cost-benefit Analysis (2006 RMB, million Yuan) (NPV@10%)
Year Incremental cost Incremental Benefit Net Benefit
Investment O&M Cost SubtotalEnergy Supply Benefit
Local Benefit
CO2 Benefit
Total Benefit
2004 520.21 0 520.21 0 0 0 0 -520.212005 803.10 0 803.10 0 0 0 0 -803.102006 967.84 0 967.84 0 0 0 0 -967.842007 441.36 902.43 1,343.79 991.52 28.88 57.44 1,077.84 -265.952008 0 1,123.94 1,123.94 1,337.67 38.96 77.49 1,454.12 330.172009 0 1,250.70 1,250.70 1,535.74 44.73 88.97 1,669.44 418.742010 0 1,261.77 1,261.77 1,553.04 45.23 89.97 1,688.24 426.472011 0 1,307.51 1,307.51 1,624.35 47.31 94.09 1,765.74 458.242012 0 1,307.51 1,307.51 1,624.35 47.31 94.09 1,765.74 458.242013 0 1,307.51 1,307.51 1,624.35 47.31 94.09 1,765.74 458.242014 0 1,307.51 1,307.51 1,624.35 47.31 94.09 1,765.74 458.242015 0 1,307.51 1,307.51 1624.35 47.31 94.09 1,765.74 458.242016 0 1,307.51 1,307.51 1,624.35 47.31 94.09 1,765.74 458.242017 0 1,307.51 1,307.51 1,624.35 47.31 94.09 1,765.74 458.242018 0 1,307.51 1,307.51 1,624.35 47.31 94.09 1,765.74 458.242019 0 1,307.51 1,307.51 1,624.35 47.31 94.09 1,765.74 458.242020 0 1,307.51 1,307.51 1,624.35 47.31 94.09 1,765.74 458.242021 0 1,307.51 1,307.51 1,624.35 47.31 94.09 1,765.74 458.242022 0 1,307.51 1,307.51 1,624.35 47.31 94.09 1,765.74 458.242023 0 1,307.51 1,307.51 1,624.35 47.31 94.09 1,765.74 458.242024 0 1,307.51 1,307.51 1,624.35 47.31 94.09 1,765.74 458.242025 0 1,307.51 1,307.51 1,624.35 47.31 94.09 1,765.74 458.242026 0 1,307.51 1,307.51 1,624.35 47.31 94.09 1,765.74 458.242027 0 1,307.51 1,307.51 1,624.35 47.31 94.09 1,765.74 458.24Total 2,732.51 26,766.51 29,499.02 33,031.92 962.07 1,913.40 35,907.22 6,408.36PV@10% 2,165.24 8,049.85 10,215.08 9,857.99 287.11 571.03 10,716.13NPV@10% 501.59EIRR (Economic Internal Rate of Return): 12.66%
8. The economic analysis demonstrated that based on a base case with above basic assumptions, the project is marginally economically viable. The sensitivity analysis shows that
30

the EIRR will decrease to (i) 9.5 percent if gas price increases by 10 percent, (ii) 10.61 percent if investment cost increases by 10 percent, and (iii) 6.36 percent if annual electricity generation decreases by 10 percent.
Financial Analysis
9. Financial Analysis is undertaken based upon the latest cost estimates and financial information, including electricity generation, O&M costs, gas price, depreciation, debt repayment, and tariff. Based on the financial internal rate of return of eight percent19 benchmark which is widely applied in China in making investment decision of a new power plant, the project is not financially viable thus needs carbon finance to overcome the financial barrier.
Financing Structure
10. Project financing is derived from both debt and equity financing. The total investment amount is estimated to be RMB 3700.69 million, with 25 percent equity financing and 75 percent domestic debt financing. The three equity investors are CNOOC (35 percent), Guangdong Yudean Group (33 percent), and Guangdong Electric Power Development Co, Ltd. (32 percent), with equity investment of RMB 925.17 million in total. The China Industrial and Commercial Bank (CICB) provide a 15 years loan for RMB 2,775.52 million with 5.76 percent annual interest rate. A detailed project financing structure is shown in Table 3 below:
Table 3: Financing Structure for Huizhou Gas-fired CCGT Power Plant
Source Contribution(million RMB) Percentage
LoansChina Industrial and Commercial Bank 2,775.52 75.00
Subtotal 2,775.52 75.00Equity CapitalChina National Offshore Oil Corporation (CNOOC) 323.81 8.75Guangdong Yudean Group 305.30 8.25Guangdong Electricity Development Co, Ltd 296.06 8.00
Subtotal 925.17 25.00Total 3,700.69 100.00
Investment Analysis
11. The total project cost at the construction stage was estimated to be RMB 3,700.69 million including the interest expenses. The funds were drawn during four years in annual proportions of 18.6 percent, 28.5 percent, 36.2 percent, and 16.7 percent, respectively. Table 4 below demonstrates the yearly fund disbursement and the sources of fund disbursement.
19 State Power Corporation of China. “Interim Rules on Economic Assessment of Electrical Engineering Retrofit Projects.” Beijing: China Electric Power Press, 2003.
31
Table 4: Fund Allocation and the Sources of Fund Disbursement (Million RMB)
No. ItemConstruction Phase
Total2004 2005 2006 2007
1 Capital Investment 688.33 1,054.70 1,339.65 618.02 3,700.701.1 Fixed Asset Investment20 688.33 1044.23 1271.10 595.62 3599.281.2 Interests during construction phase 0 10.47 68.55 22.40 101.422 Source of Capital 688.33 1,054.70 1,339.65 618.02 3,700.702.1 Equity 462.58 462.59 0 0 955.972.2 Loan financing 225.75 592.11 1,339.65 618.02 2,775.522.2.1 Long-term loan 225.75 592.11 1,339.65 618.02 2,775.52
Financial Model and Important Assumptions
12. All the costs and revenues detailed in the financial analysis are expressed in 2006 price, excluding any inflationary element. The major assumptions parameters are outlined and discussed as follows:
a. Tariff: The tariff is defined as RMB 530/MWh (including VAT) based upon the Electrical Power Purchase and Supply Contract signed between Guangdong Huizhou LNG Power Company and the Guangdong Electricity Grid Company in December, 2006. This tariff was approved by the provincial price bureau.
b. Electricity volume: Annual electricity generation from the project is calculated to be 3,674 GWh for the period from 2011–27. Assuming self-consumption of 2.4 percent; the actual electricity volume supplied to the grid is projected to be 3,586 GWh.
c. Natural Gas Price: RMB 1.65/m3, including VAT. This price is adjusted based on the pricing clause in the LNG sales and purchase contract, with a correlation to the price fluctuation of crude oil.
d. O&M expenses: The plant started construction on September 2004, with the first unit starting operation on September 2006 after a construction period of 24 months. The second and third units were put into operation on December 2006 and June 2007, respectively. The full capacity of the three units will be realized from the fifth year since commencement of construction. The calculation period for the projection is 24 years, including 4 years of construction and 20 years of operation. Key parameters in the O&M expenses are described in the calculation.
e. Tax: City construction tax and education tax is charged at 5 percent and 3 percent, respectively. In terms of income tax, the general income tax rate of 33 percent is applied.
FIRR and NPV Analysis
13. Based on the above assumptions, the Table 5 below summarized the project FIRR and NPV with and without carbon revenue. The proposed project shows a forecast project IRR of 5.31 percent without carbon revenue, lower than the industry benchmark FIRR of 8 percent. The project IRR goes up to 6.02 percent with carbon revenue as an additional revenue stream,
20 Taxes during the construction phase are included as part of the fixed asset investment, given they are not refundable.
32

however, still lower than the industry benchmark FIRR of 8 percent. In the calculation of the project IRR, only CER income for a five-year period from 2008 to 2012 is included.
Table 5: Comparison of Financial Indicators with and without Carbon Revenue
Items Unit Without Carbon IncomeWith Carbon
Income(2008–12)
Benchmark21
FIRR on total investment % 5.31 6.02 8
NPV@ 7% WACC Million RMB -444.18 -255.23
14. The project entity started consideration of the potential CDM benefit as early as November 2003, when the project entity conducted a case study for a natural gas-fired power generation22 with the consideration of the potential revenue from CDM.
15. To meet the high investment cost of the CCGT power plant, the project entity has to seek additional financial support from commercial banks. China Industrial and Commercial Bank (CICB)23 agreed to extend a loan to the project entity only on the understanding that the project risks would be partially compensated by the potential CDM revenue.
Sensitivity Analysis
16. A sensitivity analysis was conducted to assess the impact of adverse change in three key variables: (1) total investment; (2) gas price; and (3) annual electricity generation. The tariff is not considered in the sensitivity analysis because the tariff is regulated by the government. Assuming the above three variables vary in the range of -10 to +10 percent, the FIRR of the proposed project (with and without carbon revenues) varies to different extent, as shown in the Table 6 and 7 below.
Table 6: Sensitivity Analysis (FIRR with Carbon Revenue)Variables -10% -5% 0 5% 10%
1. Gas price 8.12 7.1 6.02 4.89 3.672. Total investment 7.44 6.7 6.02 5.39 4.83. Annual electricity generation 2.14 4.19 6.02 7.7 9.25
Table 7: Sensitivity Analysis (FIRR without Carbon Revenue)Change in variables -10% -5% 0 5% 10%
1. Gas price 7.41 6.39 5.31 4.17 2.952. Total investment 7.26 6.26 5.31 4.42 3.563. Annual electricity generation 1.42 3.48 5.31 6.99 8.55
21 State Power Corporation of China. “Interim Rules on Economic Assessment of Electrical Engineering Retrofit Projects.” Beijing: China Electric Power Press, 2003.
22 “Case Study of Clean Development Mechanism Project of Zhuhai Power Plant Project Phase II,” Energy Research Institute of the NDRC & Global Climate Change Institute, Tsinghua University, November 2003.
23 “Supplementary statement on loan evaluation report of Guangdong Huizhou LNG project,” China Industrial and Commercial Bank, Guangdong Branch, January 23, 2006.
33

17. The above sensitivity analysis showed that the FIRR with carbon revenue will increase to (a) 9.25 percent if annual electricity generation increases by 10 percent; (b) 8.12 percent if gas price decreases by 10 percent, and (c) 7.44 percent if total investment decreases by 10 percent.
34

Annex 7: Safeguard Policy Issues
CHINA: Huizhou Combined Cycle Gas Turbine Thermal Power Project
Environment
1. The key safeguard issues identified with the project are indicated below and subsequently discussed in detail:
Modeling of the thermal plume from the cooling water discharge Natural habitats in Daya Bay Water quality category modifications for the Daya Bay Ambient air quality (NOx) Due diligence for connected facilities, and Environmental Management Plan (EMP).
Thermal Plume Modeling and Monitoring Program
2. An update of the thermal plume modeling effort performed as part of the EIA and a monitoring program to verify the updated model results was deemed necessary by the World Bank project team because Daya Bay is host to a number of endangered/protected species and the plant design and operating conditions assumed in the original EIA modeling effort changed. Furthermore, the results of the model were never verified with actual measurements.
3. The original modeling efforts included in the CCGT power plant EIA concluded that the thermal plume produced by the cooling water discharge would not have a significant environmental impact on the areas where these endangered/protected species are located. However, as indicated above, results of the thermal plume dispersion model were never verified.
4. The sponsor agreed to repeat the thermal plume modeling effort with actual design/operating parameters and the plant operating at full load, and implement a monitoring program to verify the model results. If necessary, the sponsor agreed to implement any recommended mitigation measures should the study results indicate a violation of Chinese standards and/or impacts of the thermal plume upon the core zones.
5. The monitoring program prepared by the South China Sea Institute of Oceanology (Chinese Academy of Sciences) briefly indicated below was considered satisfactory by the Project team.
6. The program consists of three types of measurements:
Four fixed locations for continuous monitoring of temperature over the complete tidal cycle (26 hours).
Twenty fixed points that will be sampled sequentially, during the monitoring period. Five fixed level stations for measurement of vertical temperature profiles.
35

7. The measurements will be made at full load under conditions that match as closely as possible the conditions/parameters utilized in the updated modeling effort. Since several of these aspects have changed from the data utilized in the original model runs for the EIA (cooling water discharge pipeline length, cooling water flow rate etc.)
8. A report will be prepared by the sponsor comparing the monitoring and modeling effort. Specifically, comparisons will be made between: (a) results of the monitoring program; (b) results of the EIA modeling; (c) results of the current modeling effort indicating whether or not the CCGT power plant operation complies with Chinese standards for thermal discharges in the Daya Bay; and (d) any influence of the thermal plume on the five core zones (protected areas) established for the Daya Bay (see “Natural Habitats” discussion below). If the report concludes noncompliance of the cooling water discharge with Chinese standards, or significant impacts on the core zones, mitigating recommendation(s) are also to be provided in the report.
9. The sponsor agreed to send the report to the World Bank for comments and acceptance. After the World Bank provides acceptance, the report is to be reviewed and approved by the Daya Bay EPB and the documented Daya Bay EPB’s approval will be included in the Project File. Submission of a Thermal Plume Report by GHLPCL to the Bank by March 15, 2008, but in any case no later than August 31, 2008, in the form and substance satisfactory to the Bank will be a condition for Sale and Purchase of CERs in the ERPA.
Natural Habitats in the Daya Bay
10. Five endangered species were identified in the EIA. The Project team learned that the white dolphin disappeared from the Daya Bay at about the time a nuclear power plant became operational (early 1990s) and now are found in the Pearl River Delta approximately 150 km away from the plant site (near Hong Kong). The migratory patterns, feeding and breeding areas of the remaining endangered and protected species, namely, the sea turtle, defined coral reefs, sea horse and lancelet are all confined to five core zones in the Daya Bay whose boundaries are legally defined to protect them.
11. The location of the CCGT cooling water discharge outlet is, at its’ closest point, over 10 km from the nearest core zone. The modeling effort previously discussed will establish whether or not the cooling water discharge will be significant in any of the core zones and result in any possible impacts to the species inhabiting these protected areas.
Water Quality Category Modifications for the Daya Bay
12. In 1983, the Guangdong EPB declared the entire Daya Bay as a Natural Resource Protection Area. The declaration was based upon a recommendation of the Provincial Oceanic and Fisheries Administration.
13. In 1991, the State Planning Commission (SPC) established a small parcel of land (about 10 km2) in the Daya Bay watershed as an ETDZ. In 1993, the SPC further expanded the ETDZ to about 265 km2. Establishing this ETDZ followed the national regulations and procedures in effect at the time.
36

14. In 1999, in accordance with the State Environmental Protection Law and the Marine Environmental Law, the Guangdong Provincial Government assigned jurisdiction of a 2.5 km width along the Daya Bay shoreline to the Guangdong Provincial EPB (GPEPB).
15. In 2002, the Guangdong Provincial Government divided the Daya Bay into nine zones: (a) two test zones that were permitted to accommodate economic development; (b) two buffer zones which allowed for limited economic activities (e.g., tourism, fishing, etc.); and (c) five core or environmentally protected zones where no industrial discharges other than research activities were permitted. Consistent with this authority, the GPEPB modified the water quality Category designation from II to III in a section of the Northern Test Zone to allow for industrial activities in the ETDZ as defined by the SPC. The cooling water discharge outlet of the Huizhou CCGT power plant is situated in the Northern Test Zone.
16. Based upon this information the Project team concluded that the changes in water quality category assignments were conducted in accordance with all Chinese laws and regulations in effect at the time and that all institutions involved acted within their legal authority.
Ambient Air Quality
17. The Huizhou Gas-Fired CCGT Power Plant utilizes the most modern burner designs for the suppression of NOx emissions and releases them through a high (80 meter) stack.
18. Two air quality monitoring stations currently operational in the approximate vicinity of the CCGT power plant are operated and maintained by the Daya Bay EPB. One of the monitoring stations was recently put into operation (beginning of October 2007). This station is approximately one kilometer from the CCGT plant. The other monitoring station is approximately 7 kilometers from the CCGT plant and has been operating since 2003. The new station is state-of-the-art, monitoring a variety of organic chemicals in addition to the standard regulated pollutants (SO2, NOx, and PM10). The older station monitors only the standard regulated pollutants. A third station planned by the Daya Bay EPB is to be located 6 km from the CCGT power plant and is expected to be in operation in near future. Air quality data collected by the Daya Bay EPB is freely exchanged with the Huizhou CCGT power plant operating units.
19. Within the limited time of operation of the new station, the highest recorded level of NOx was indicated to be 10 ppb or approximately 0.02 mg/Nm3; well within the maximum hourly standard of 0.12 mg/Nm3. The older station has been operating both before and after the initial start-up of the first CCGT unit. Air quality results for NOx provided by the Daya Bay EPB are presented in the Table 1 below. No discernable pattern or trends in long term (daily average) values of NOx are evident.
37

Table 1: Ambient Measurements of Air Quality (mg NOx/nM3) in the Daya Bay ETDZ
Year First Quarter
Second Quarter
Third Quarter
Fourth Quarter
Annual Daily Average
Chinese Standard
2003 0.013 0.008 0.014 0.018 0.013+ 0.042004 0.008 0.009 0.011 0.010 0.00952005 0.010 0.015 0.015 0.010 0.01252006 0.011 0.016 0.013 0.017 0.014+
Due Diligence for Connected Facilities
20. The off-site facilities associated with the CCGT power plant include the gas pipeline and LNG Terminal, and the power transmission lines. It was determined that the non-cooling water supply was from the general municipal system, and the plant only utilizes a very small amount of this flow (about 1-2 percent). A summary of the EA aspects for both the three units of the CCGT power plant and the connected facilities are presented in the Table 2 below and are included in the Due Diligence Report.
38

Table 2: A Summary of EA Preparation, Approval and Acceptance for the Huizhou Gas-fired CCGT Power Plant
Environmental Assessment Trial Period Acceptance
Project Element
Project Descriptio
nDocument Type Consultation
Date(s)
Disclosure Dateand Location
Approval Date and Authorit
y
Construction Start
Date
Approval Date
Authority
Approval Date
Authority
LNG Plant-Unit 1
Huizhou LNG Power
Plant24
Full EIA
Title: EIA of Guangdong Huizhou LNG Power Plant Phase I Project (3×390MW)Date:2001.5Located: Huizhou LNG Power Plant 2000.3
EIA disclosure has been required by SEPA since 2004. As the EIA for phase I LNG power plant was finished in May 2001, disclosure was not required.
October, 2001/SEPA
9/2004 8/2006 Guangdong EPB
The environmental acceptance for the three units is currently going on. It is expected to be approved by SEPA in November 2007.
SEPA
LNG Plant-Unit 2
October, 2001//SEPA
9/2004 1/2007 Guangdong EPB
SEPA
LNG Plant-Unit 3
October, 2001/SEPA
9/2004 6/2007 Guangdong EPB
SEPA
Fresh Water Supply
Not Available
Not Available Not Available Not Available
Not Available
Not Available
Not Available
Not Available
Not Available
Transmission Lines
The voltage grade of the transmissio
n line is 220kV.
EA tableTitle:EA table of 220 KV Transmission line from Huizhou LNG power plant to Fengtian Date: 2007.4Located:the Huizhou LNG Power Plant
Public consultation is not required for EA table in China.
Approval process for EA table is simplified by local EPB. Disclosure was not required by Huizhou EPB.
April 2007
/Huizhou EPA
2005 Approval process for EA table is
simplified by local EPB.
Approval process for EA table is
simplified by local
EPB.
Not applicable
Huizhou EPA
24 Huizhou LNG Power Plant is a Chinese name for the plant. It refers to the Huizhou Gas-fired CCGT Power Plant that is used in the PAD.
39

40
Environmental Assessment Trial Period Acceptance
Project Element
Project Descriptio
nDocument Type Consultation
Date(s)
Disclosure Dateand Location
Approval Date and Authorit
y
Construction Start
Date
Approval Date
Authority
Approval Date
Authority
Gas Supply Pipeline
The length of gas supply
pipeline from
Dapeng to Huizhou
LNG power plant is 47
km.
EIATitle: EIA of Guangdong LNG Terminal and Gas Supply Pipeline projectDate:Not availableLocated: In the Dapeng LNG Company
Not available Not applicable
April 2003/ SEPA
November 2004
June 2006
Guangdong EPA
January 2007
SEPA
LNG Terminal
LNG Terminal is located at
the Northwestern corner of
Huizhou LNG power
plant.
April 2003/ SEPA
November 2004
June 2006
Guangdong EPA
Re-gasifica-
tion Plant
The re-gasification Plant is located in Shenzhen at Chentoujiao, Dapeng Bay, comprising a total area of 40 hectares.
April 2003/ SEPA
December 2003
June 2006
Guangdong EPA

Environmental Management Plan (EMP)
21. The sponsor prepared and agreed to implement the EMP presented in the Table 3-5 below. The project team considers this EMP to be consistent with the World Bank requirements.
Table 3: Mitigation Plan (Operation Phase)
Issue Mitigating Measure
Cost of Mitigation
Responsibility
Air PollutionNitrogen oxide emissions
The advance low NOx burner has been adopted in the CCGT power plant, which is the part of the gas turbine.
US$9,800,000 GHLPCL Operations Division
Air quality (NOx)
Dispersion through 80 meter stack Included in plant construction cost
-
Noise Integrated control has been adopted for the noise control of the CCGT power plant. Noise source was controlled in the first place. Noise reducing requirements were put forward to the manufacturers in the equipment bidding, and effective noise isolation, noise elimination, sound absorption and vibration isolation measures have been taken to control the noise within specified standards. Meanwhile, the GHLPCL plants many trees around it to reduce the noise to escape outside
US$760,000 (some additional costs are included
in the project construction cost)
GHLPCL Operations Division
Water PollutionCooling Water Discharge
The water outlet is 825 m from the shore and effluent is discharged through a submerged pipe
US$720,000 GHLPCL Operations Division
Residual chlorine discharge
Less toxic, easier to manage, and less hazardous hypochlorite is used rather than liquid chlorine
Included in the project cost
GHLPCL Operations Division
Chemical(acidic and basic)
A set of treatment system of industrial wastewater has been established
US$1,030,000 GHLPCL Operations Division
Oily wastewater
Oil water separator installed
Domestic sewage
Primary treatment in the septic tank in each area before sending to sewage treatment plant
Solid WastesIndustrial It is regularly collected and sent to the
municipal disposal site for incineration US$40,000 Daya Bay
Municipality Environment and
Sanitation CompanyDomestic Included in the municipal waste treatment
systemUS$220,000
41

Table 4: Monitoring Plan
What parameter is to be monitored?
Whereis the
parameter to be monitored?
Howis the
parameter to be monitored/
type of monitoring equipment?
Whenis the parameter to be monitored-
frequency of measurement or
continuous?
Monitoring Cost
What is the cost of
equipment or contractor charges to perform
monitoring
Responsibility
Air PollutionNitrogen oxide emissions
In the chimney stack
CEM Continuous US$200,000 GHLPCL Production and Operation Division Environmental Monitoring Unit
Air quality (NOx) Two locations in the Daya Bay District. One additional location is planned
Automatic sampling and analysis
Continuous - Daya Bay Environmental Protection Bureau
Noise Fence line of the CCGT power plant
Noise monitoring device
Every four hours US$650 GHLPCL Production and Operation Division Environmental Monitoring Unit
Water PollutionCooling Water Discharge
Temperature
Discharge outlet
Electronic temperature sensor
Continuous Minor GHLPCL Production and Operation Division Environmental Monitoring Unit
Thermal plume area and position
Around cooling water discharge outlet
Retained South China Sea Institute of Oceanology prepared monitoring plan.
Once every one or two years (to be decided after results of first program are obtained)
US$20,000 (each time)
South China Sea Institute of Oceanology
Residual chlorine in discharge
Discharge outlet
Colorimetry Once every ten days
Minor GHLPCL Production and Operation Division Environmental Monitoring Unit
42

What parameter is to be monitored?
Whereis the
parameter to be monitored?
Howis the
parameter to be monitored/
type of monitoring equipment?
Whenis the parameter to be monitored-
frequency of measurement or
continuous?
Monitoring Cost
What is the cost of
equipment or contractor charges to perform
monitoring
Responsibility
Chemical (acidic and basic) wastewaterCOD,pH, Suspended Solids, Oil
At the treatment plant effluent
ORION Model 710A6
Once every ten days
US$5,900 GHLPCL Production and Operation Division Environmental Monitoring Unit
Oily wastewaterOil/grease
Chinainvent Instrument Company Model: Oil 460
Once every ten days
US$18, 000 GHLPCL Production and Operation Division Environmental Monitoring Unit
Domestic sewagepH BOD5
Suspended Solids
At the sewage plant effluent
ORION Model 230A
Once every ten days
US$5,900 GHLPCL Production and Operation Division Environmental Monitoring Unit
Solid WastesIndustrial At litter yard Visual Every 4-5 days Minor GHLPCL
Production and Operation Division Environmental Monitoring Unit
Domestic
Table 5: Institutional Arrangements
Management Activity Responsibility FrequencyEnvironmental Data Collection Production and Operation
Division, Technical Support Unit (Environmental Monitoring)
See Table 4 (Monitoring Plan) above
Environmental Data Analysis Production and Operation Division, Technical Support Unit (Environmental Monitoring)
Monthly
Report Preparation (Including Data Analysis and Recommendations)
Production and Operation Division, Technical Support Unit (Environmental Monitoring)
Monthly
Report Recipients Vice Manager, GHLPCL MonthlyManagement Action As needed
43

Social
22. Overview. The Huizhou Gas-fired CCGT Power Plant and the supporting connected facilities including the two transmission lines and the LNG Terminal and pipelines required land acquisition and resettlement. According to the staff from the CCGT power plant and the Guangdong Dapeng LNG Co. Ltd., the construction of these facilities involved permanent acquisition of 90.25 ha of land areas, with 90 percent of them as state owned land areas. In addition, about 102.6 ha of land areas were occupied temporarily and all of them were collectively owned rural lands (Table 6 below).
Table 6: Scope of Land Acquisition Impacts for Huizhou CCGT Thermal Power Project and Connected Facilities (ha)
FacilityPermanent
Land Acquisition
Types of Acquired
Land Areas
Total Amount of Temporary
Land
Demolitions of Building
and Facilities
Number of Villages Affected
Huizhou Gas-fired CCGT Power Plant
41.50 State owned 0.00 None None
220kV Transmission lines
1.11 Collective 38.90 None 9 villages
LNG Terminal 40.00 State owned 0.00 None NoneLNG Pipelines 7.64 Collective 63.70 None 16 villages
Total 90.25 102.60
23. For the Huizhou Gas-fired CCGT Power Plant site, land use rights for 41 ha were transferred by the Daya Bay District to Guangdong Dapeng LNG Company Limited in 2004. Prior to the transfer, the land was held by 20 different land users bought from local villages in early 1990s. They were sold back to the local government in 2003 based on market prices. 24. As for affected villages, Bogang Village was the previous owner of the site prior to 1990s and most of their farmland areas were acquired in 2003 due to the construction of a large petrochemical complex. The compensation rates followed the decree issued by the Huizhou Daya Bay ETDZ in 2001, which were set at 16 times the annual average output value with RMB 17,000 per mu for paddy, RMB 12,285 per mu for dry, and RMB 6,000 per mu for woodland. These compensation rates are consistent with the PRC Land Administration Law and local implementation regulations. Economic rehabilitation assistance included provision of development land and allocation of jobs. All the affected villagers were relocated in a resettlement community equipped with full urban amenities such as school building, roads, infrastructure facilities and bus services. According to local government officials, the resettlement program of the petrochemical complex was considered as quite successful and no problems were reported.
25. For LNG Terminal, most of the site is woodland, which had been acquired by Shenzhen Municipality in 1998. The land use right of the site (40 ha) had been transferred to Guangdong Dapeng LNG Co. Ltd. in 2004 prior to the construction.
44

26. For LNG pipeline connecting the LNG Terminal and Huizhou Gas-fired CCGT Power Plant and 220kV transmission lines, about 9 ha of permanent land acquisition and 103 ha of temporary land occupation were involved. All of them belong to village collectives and most of them are wood land and fruit gardens. The land acquisition and compensation were handled by local land resources bureaus with compensations paid directly to the affected villages and individuals. Following national law and local regulations, similar compensation rates were provided for the affected individuals and villages along the alignment. No remaining problems are reported.
27. Conclusion. The World Bank due diligence review concluded that the land acquisition for the CCGT power plant and connected facilities followed the relevant national laws and regulations. Land acquisition for the Huizhou Gas-fired CCGT Power Plant site and LNG Terminal site was completed in the 1990s, and the transfer of land use rights from local governments to the project sponsors was done according to the country’s rules and regulations. Land acquisitions for the 220kV transmission lines and LNG pipelines, was completed in early 2005. Compensations of affected people and collectives followed all relevant national laws and local regulations. Extensive consultations were carried out and compensation has been paid directly to the affected villages and individuals. No outstanding issues or disputes were reported to Bank missions by affected communities.
45

Annex 8: Project Processing
CHINA: Huizhou Combined Cycle Gas Turbine Thermal Power Project
Project Schedule Planned ActualCFD Approval December 1, 2006Preliminary Safeguard review August 2, 2007PIN Approval September 25, 2006PCN review September 21, 2007 September 25, 2007Safeguard review November 16, 2007 November 15, 2007Due Diligence Report to Infoshop November 2007 November 16, 2007PID to Infoshop November 2007 November 28, 2007 ISDS to Infoshop November 2007 December 5, 2007 Decision meeting November 2007 December 10, 2007 Begin appraisal November 2007 October 2007 Negotiation December 2007 November 2007 Country Director’s approval December 2007Sign ERPA December 21, 2007Planned effectiveness Date of registrationPlanned closing date December 31, 2014
Bank staff and consultants who worked on the project included:
Name Title UnitRanjit Lamech Task Team Leader EASTENat Pinnoi Carbon Finance Deal Manager ENVCFNoureddine Berrah Project Advisor EASTEWeigong Cao Power Engineer EASTEBernard Baratz Environmental Specialist EASTEYouxuan Zhu Social Specialist EASTENeeraj Prasad Carbon Finance Coordinator, EAP Region EASOPZijun Li Carbon Finance Specialist ENVCFQing Wang Environmental Specialist EASREDefne Gencer Operations Specialist EASTECristina Hernandez Program Assistant EASTE
46

Annex 9: Documents in the Project File
CHINA: Huizhou Combined Cycle Gas Turbine Thermal Power Project
Project Processing Documents
1. Project Idea Note (PIN);2. Project Concept Memorandum (PCM);3. Signed Letter of Intent (LOI), Guangdong Huizhou LNG Power Company Limited and
the Bank;4. PCN Safeguard Screening;5. Project Identification Document (PID);6. Integrated Safeguard Data Sheet (ISDS);7. Project Design Document (PDD);8. Due Diligence Report (DDR); 9. Letter of Approval (LOA) from the State of the Netherlands to the Trustee; and 10. Emission Reduction Purchase Agreement (ERPA).
Environmental:
1. Supplemental Environmental Assessment Report;2. Environmental Impact Assessment, South China Sea Institute of Oceanology, Chinese
Academy of Sciences; 3. Environmental Monitoring Plan (EMP);4. Environmental Assessment Table;5. The June 2002 “Functional Zoning of Daya Bay Aquatic Resources Natural Protection
Area” issued by Guangdong EPB;6. NDRC approval of EIA;7. Letter of approval of EIA for LNG Terminal and Gas Supply Pipeline, State EPA;8. Letter of Preliminary Review on EIA for Huizhou — Fengtian transmission line,
Huizhou EPB;9. Thermal Plume Monitoring Plan, South China Sea Institute of Oceanology, Chinese
Academy of Sciences;10. Thermal Plume Monitoring Report (due by March 15, 2007);11. Copy of approval of the Thermal Plume Monitoring Report (due by March 15, 2007);12. 2007 Regular monitoring plan of Daya Bay area;13. Letter of Endorsement to water quality change in offshore area of Northern experimental
zone, Guangdong Provincial EPB;14. Survey Report on Environmental Quality of Huizhou Daya Bay Economic and industrial
development zone, Huizhou Daya Bay EPB; and15. 2007 Monitoring report on SO2 and NOx of the Huizhou LNG plant, Day Bay EPB.
47

Social:
1. Guangdong Provincial Land Resources Department, 2006, No. 149 Decree: Decree on Implement Guangdong Provincial Land Acquisition Compensation;
2. Shenzhen Municipal Government, 2003, Land Acquisition Method and Compensation Rates in Shenzhen;
3. Huizhou Daya Bay Economic Technology Development District Management Committee, 2001, No. 10 Decree: China Ocean Shell Petrochemical Project Land Acquisition and Compensation Method;
4. Huizhou Daya Bay Economic Technical Development District Management Committee in 2002 through No. 37 Decree titled Daya Bay Economic Technical Development District Compensation for Land Acquisition and Attachments;
5. Huizhou Municipal Government, 2002, Method on Readjustment of Idled Land in Huizhou Cit;
6. Copy of Construction Land Use Agreement between Huizhou LNG Power Plant and Huizhou Daya Bay Petrochemical Industrial District Corporation in 2004;
7. Copy of Land Pre-appraisal Note by Guangdong Provincial Land Resources Department for the Huizhou LNG Power Plant (Phase I);
8. Sample compensation agreements between Daya Bay Land Resources Bureaus and affected people for both 220kV transmission line component and LNG pipeline components; and
9. A description of Yudean’s community support, as part of its Corporate Social Responsibility Program for 2002–07.
Other:
1. Project Feasibility Study 2002, Guangdong Provincial Electric Power Design Institute;2. Letter of Approval of Feasibility Study, NDRC;3. Power Purchase Agreement (PPA), Guangdong Provincial Power Grid and Guangdong
Huizhou LNG Power Company Limited;4. Financial Analysis 2003 and 2004, Guangdong Electric Power Design Institute; and5. Standard Operation Procedures of the Huizhou Gas-fired CCGT Power Plant.
48

Annex 10: Project Design Document
CHINA: Huizhou Combined Cycle Gas Turbine Thermal Power Project
49

PROJECT DESIGN DOCUMENT FORM (CDM PDD) - Version 03.1
CDM – Executive Board
CLEAN DEVELOPMENT MECHANISM PROJECT DESIGN DOCUMENT FORM (CDM-PDD)
Version 03 - in effect as of: 28 July 2006
CONTENTS
A. General description of project activity
B. Application of a baseline and monitoring methodology
C. Duration of the project activity / crediting period
D. Environmental impacts
E. Stakeholders’ comments
ANNEXES
Annex 1: Contact information on participants in the project activity
Annex 2: Information regarding public funding
Annex 3: Baseline information
Annex 4: Monitoring plan
50

PROJECT DESIGN DOCUMENT FORM (CDM PDD) - Version 03.1
CDM – Executive Board
SECTION A. General description of project activity
A.1 Title of the project activity: >>Guangdong Huizhou LNG Power Generation Project.Version 03Completed on 09/11/2007
A.2. Description of the project activity:>>
Huizhou LNG Power Generation Project (HLPGP) has constructed a highly efficient Natural Gas (NG) fired Combined-Cycle Gas Turbine (CCGT) power plant. The proposed project has a capacity of 1083.09 MW (3×361.03 MW) with annual output of 3703.5 GWh. All three units are now in operation. The proposed project will have an annual consumption of 506,100 tons of Liquefied Natural Gas (LNG), which will be regasified at the LNG terminal and transport to the power station via pipeline.
Electricity to be generated by HLPGP will be subsequently supplied to the Guangdong Provincial Power Grid (GPPG), which is a part of the Southern China Power Grid (SCPG), consequently displacing power generation from the Southern China Power Grid (SCPG) where more than 50 percent of the power comes from coal fired power plants. The estimated annual greenhouse gas (GHG) emission reductions will be 1,096,728 tCO2e.
By using LNG and CCGT, the HLPGP will offer the least environmental damaging form of fossil-fuelled electricity generation, produce positive environmental and economic benefits and contribute to the local sustainable development. The specific sustainable development benefits of the proposed project include:
Consistence with China’s national energy policy aiming at optimization of energy structure, improvement of energy security and diversification of energy mix.
Supply of less GHG-intensive electricity to the Guangdong Provincial Power Grid (GPPG) which is a part of the SCPG.
Improvement of reliability of power supply in GPPG. Successful demonstration to other planned or scheduled NG CCGT plants in
Guangdong and other provinces of China. Promote and strengthen technology and knowledge transfer of CCGT.
A.3. Project participants:>>
Name of Party involved (*)
((host) indicates a host Party)
Private and/or public entity(ies)
project participants (*)(as applicable)
Kindly indicate ifthe Party involved
wishes to beconsidered as
project participant(Yes/No)
51

PROJECT DESIGN DOCUMENT FORM (CDM PDD) - Version 03.1
CDM – Executive Board
P.R. China (Host)Guangdong Huizhou LNG Power Co., Ltd. No
The Netherlands
The International Bank for Reconstruction and Development (IBRD) as trustee of the Netherlands Clean Development Mechanism Facility
Yes
A.4. Technical description of the project activity:
A.4.1. Location of the project activity:>>
A.4.1.1. Host Party(ies): >>P.R. China
A.4.1.2. Region/State/Province etc.: >>Guangdong Province.
A.4.1.3. City/Town/Community etc:>>Daya Bay Economic and Technical Development Zone, Huizhou City.
A.4.1.4. Detail of physical location, including information allowing the unique identification of this project activity (maximum one page):>>The proposed project is located in the Daya Bay Economic and Technical Development Zone, Huizhou City, Guangdong Province. The position is longitude 114°36′16″degrees east and latitude 22°45′34″ degrees north. The project site is 214 km away from Guangzhou and 48 km from Huizhou and 4 km east of Huiyang Town. The map below shows the location of the proposed project.
52

PROJECT DESIGN DOCUMENT FORM (CDM PDD) - Version 03.1
CDM – Executive Board
A.4.2. Category(ies) of project activity:>>\Sectoral Scope: 1 Energy Industry: non-renewable resources
A.4.3. Technology to be employed by the project activity: >>
LNG is natural gas that has been processed to remove impurities and heavy hydrocarbons and then compressed to liquid. LNG is about 1/600th the volume of natural gas at Standard Temperature and Pressure (STP), making it more convenient to transport by vessel. The LNG is liquefied (-163℃) and imported from Australia’s Northwest shelf gas development project by LNG tankers. In receiving terminal, the imported LNG is be heated to convert it to its initial gaseous form and supplied to the users in Pearl River Delta region and Hong Kong (including the proposed CCGT power plant). A LNG terminal is in operation near Shenzhen to receive the LNG from Australia and the first shipment has landed in China in June 28, 2006.
The CCGT process includes two parts: the first phase of the process takes place in the gas turbine which burns natural gas to rotate a coupled AC generator to generate electricity. After the fuel is burnt and passes through the gas turbine, the second phase will utilises the additional heat remaining in the exhausted gas through a heat recovery steam to produce steam to power a steam turbine. These “combined cycle” will result in cycle thermal efficiencies of over 50 percent since they’re used with the most recent gas turbine technology.
53
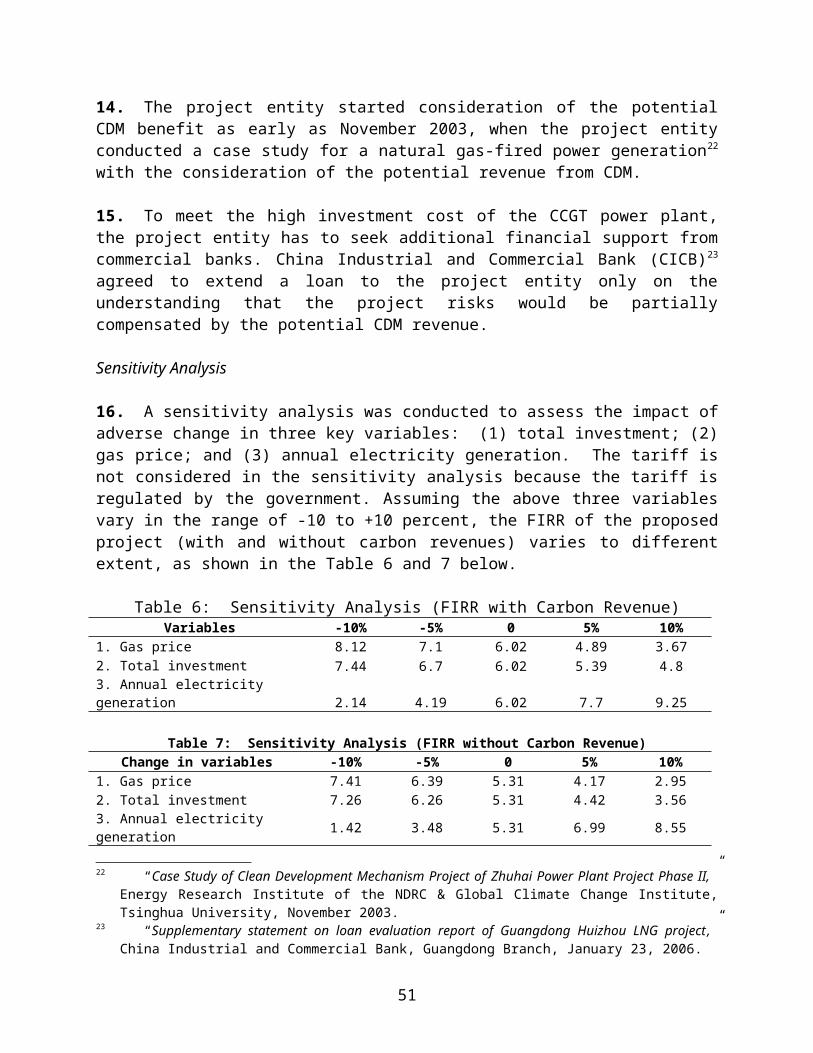
PROJECT DESIGN DOCUMENT FORM (CDM PDD) - Version 03.1
CDM – Executive Board
The gas turbines and steam turbines in the HLPGP are produced jointly by Dongfang Steam Turbine Works (DSTW) and MITSUBISHI Heavy Industries. These gas turbines are the domestic made F-class gas turbine in China by local turbine manufacturers, which is first-of-kind technology introduced by domestic companies. The heat recovery boilers are produced by Hangzhou Boiler Group, Therefore, the successful implementation the proposed project will greatly contribute to transfer of advanced clean power generation technology to China.
A.4.4 Estimated amount of emission reductions over the chosen crediting period: >>The HLPGP is estimated to reduce 1,096,728 tCO2e annually. The renewable crediting period is selected for the proposed project. The first crediting period is of 7 years and this may be renewed for a maximum of two further periods of 7 years each. The total emission reduction of the project will be 7,677,096 tCO2e during the first crediting period.
Years Annual estimation of emission reductions
in tonnes of CO2 e2008 1,096,7282009 1,096,7282010 1,096,7282011 1,096,7282012 1,096,7282013 1,096,7282014 1,096,728
Total estimated reductions(tonnes of CO2e)
7,677,096
Total number of crediting years 7Annual average over the crediting period of estimated reductions (tonnes of CO2e)
1,096,728
A.4.5. Public funding of the project activity:>>No public funding is involved in this project activity.
54

PROJECT DESIGN DOCUMENT FORM (CDM PDD) - Version 03.1
CDM – Executive Board
SECTION B. Application of a baseline and monitoring methodology
B.1. Title and reference of the approved baseline and monitoring methodology applied to the project activity: >>Version 01.1 of AM0029: “Baseline Methodology for Grid Connected Electricity Generation Plants using Natural Gas” (referred as The Methodology). More information about The Methodology can be found on the website:http://cdm.unfccc.int/methodologies/PAmethodologies/approved.html
The AM0029 also uses the version 06 of ACM0002: “Consolidated Methodology for Grid-connected Electricity Generation from Renewable Sources” and Version 03 of “Tool for the Demonstration and Assessment of Additionality.”
B.2 Justification of the choice of the methodology and why it is applicable to the project activity:>>
The version 01.1 of AM0029: “Baseline Methodology for Grid Connected Electricity Generation Plants using Natural Gas” is applicable under the following conditions:
The project activity is the construction and operation of a new natural gas fired grid-connected electricity generation plant.
The geographical/physical boundaries of the baseline grid can be clearly identified and information pertaining to the grid and estimating baseline emissions is publicly available.
Natural gas is sufficiently available in the region or country, e.g., future natural gas based power capacity additions, comparable in size to the project activity, are not constrained by the use of natural gas in the project activity.
The Methodology is applicable for the proposed project for the following reasons: The proposed project is a new natural gas fired electricity generation plant. The
electricity generated by the proposed project will be sold to the Guangdong Provincial Power Grid (GPPG), which is part of the SCPG. The primary fuel in the proposed project is LNG imported from Australia.
The power grid (the SCPG) which the proposed project is to be connected to is clearly identified and information on the characteristics of this grid is publicly available.
The LNG used in the proposed project only accounts for 14 percent of the total annual LNG imported from Australia. The terminal will annually import about 3.7 million tons of LNG from Australia’s Northwest Shelf gas development project over the next 25 years and mainly supply gas to Shenzhen, Dongguan, Guangzhou, Foshan and Hong Kong and five power plants. The second phase of the LNG terminal is expected to raise the capacity of the LNG import to 6.2 million tons a year. Therefore, the additional natural gas based power capacity would not be constrained by the use of the natural gas
55

PROJECT DESIGN DOCUMENT FORM (CDM PDD) - Version 03.1
CDM – Executive Board
in the project activity. All current gas users also signed take-or-pay (ToP) long-term contracts with the Guangdong Dapeng LNG, operator of the LNG project, which has contracted all LNG demand. Such long-term contract along the LNG chain makes sure that there is no supply constraint, thus no possible leakage. Additionally, in the LNG supply contract, there is a clause to ensure that the LNG will be supplied preferentially to household user once there is supply constrain. Such clause also makes sure that the proposed project will not lead to fuel switch activity, thus no possible leakage.
Based on the aforementioned information, the Methodology is applicable to the proposed project.
B.3. Description of the sources and gases included in the project boundary >>According to the version 01.1 of AM0029, in the calculation of project emissions, only CO2 emissions from fossil fuel combustion at the project plant are considered. In the calculation of baseline emission, only CO2 emissions from fossil fuel combustion in power plants in the baseline are considered.
The GHGs included in or excluded from the project boundary are listed as follows:
Source Gas Included? Justification/Explanation
Baseline Power generation in baseline
CO2 Yes Main emission source
CH4 No Excluded for simplification. This is conservative
N2O No Excluded for simplification. This is conservative
Project Activity
On-site fuel combustion due to the project activity
CO2 Yes Main emission sourceCH4 No Excluded for simplification.
N2O No Excluded for simplification.
The project boundary of the proposed project includes the HLPGP project site and all power plants connected physically to the baseline grid. According to ACM0002, the baseline grid is defined as the Southern China Power Grid. Guangdong provincial grid is an integral part of the SCPG.
B.4. Description of how the baseline scenario is identified and description of the identified baseline scenario: >>According to the version 01.1 of AM0029, the following steps are used to define the baseline scenario:
Step 1: Identification of alternatives to the project activity consistent with current laws and regulations
56

PROJECT DESIGN DOCUMENT FORM (CDM PDD) - Version 03.1
CDM – Executive Board
Sub-step 1a. Define alternatives to the project activity
In this step, all possible realistic and credible alternatives that provide outputs or services comparable with the proposed CDM project are identified. The options should also be in compliance with all applicable legal and regulatory requirements. The existing and planned generation technologies within SCPG are listed as follows:
Alternatives Output and Service Plausibility
Natural Gas power generation using combined cycle gas turbine (CCGT) without CDM.
Generation, full-year peak regulation capacity
Plausible for higher capacities. Meets all eligibility conditions.
Natural Gas power generation using single Gas Turbine technology
Generation, full-year peak regulating capacity
Not Plausible. It is not widely used in SCPG because the thermal efficiency is lower than that of the CCGT.
Light Oil based power plants using CCGT
Generation, full-year peak regulating capacity
Plausible
Coal based power plant with Sub-critical boilers
Generation, full-year peak regulating capacity
Plausible
Coal based power plant with Supercritical boilers
Generation, full-year peak regulating capacity
Plausible
Wind Generation Not plausible. It will not deliver outputs and services for peak load.
Nuclear Generation Not plausible. It will not deliver outputs and services for peak load.
HydroRun-of-river
Generation Not plausible. It will not deliver outputs and services comparable to the project activity with full-year peak regulation capacity.
HydroDaily regulating
Generation, Daily peak regulating capacity
Not plausible. It will not deliver outputs and services comparable to the project activity with full-year peak regulation capacity.
57

PROJECT DESIGN DOCUMENT FORM (CDM PDD) - Version 03.1
CDM – Executive Board
HydroMonthly regulating
Generation, monthly peak regulating capacity
Not plausible. It will not deliver outputs and services comparable to the project activity with full-year peak regulation capacity.
HydroSeasonal regulating
Generation, seasonal peak regulating capacity
Not plausible. It will not deliver outputs and services comparable to the project activity with full-year peak regulation capacity.
HydroYearly regulating
Generation, partly peak regulation capacity
Not plausible. Given the construction period of hydro project with yearly or multi-yearly regulating capacity is almost 8-12 years in Yunnan province. The long construction period of hydro power makes it impossible to supply peak regulation capacity to meet the peak load of GPPG within 3-5 years.
HydroMulti year regulating
Generation, full-year peak regulating capacity
Not plausible. Given the construction period of hydro project with yearly or multi-year regulating capacity is almost 8-12 years in Yunnan province. The long construction period of hydro power makes it impossible to supply peak regulation capacity to meet the peak load of GPPG within 3-5 years.
Import Import from Three Gorgers Not plausible. It will not deliver outputs and services comparable to the project activity with full-year peak regulation capacity.
According to AM0029, the selected alternatives need not consist solely of power plants of the same capacity, load factor and operational characteristics. It could be several smaller plants, or the share of a larger plant. Thus, from the above analysis, following are the plausible baseline alternatives:
58

PROJECT DESIGN DOCUMENT FORM (CDM PDD) - Version 03.1
CDM – Executive Board
Fuel Technology Output and ServiceNatural Gas CCGT Generation, full-year peak regulation
capacityLight Oil CCGT Generation, full-year peak regulating
capacityCoal Sub critical Generation, full-year peak regulating
capacityCoal Supercritical Generation, full-year peak regulating
capacity
The efficiency and technical life time of the previous technologies are listed in the next step.
Step 2: Identify the economically most attractive baseline scenario alternative.According to the version 01.1 of AM0029, the economically most attractive baseline scenario alternative is identified using levelised cost as a financial indicator. The basic levelised cost methodology used in this PDD is based on Annex 10 of “Projected Costs of Generation Electricity” published by IEA. The formula applied to calculate the levelised electricity generation cost (EGC) is the following:
(1)
With:EGC: Average lifetime levelised electricity generation cost per kWh.It: Capital expenditure in the year t.Mt: Operation and maintenance expenditures in the year t.Ft: Fuel expenditure in the year t.Et: Electricity generation in the year t.r: Discount rate.
The relevant assumptions and parameters are listed as following:
Table 1 Parameters for Coal-fired, NG and oil-fired CCGTItem Unit 300MW
Coal-fired sub-critical
600MWCoal-fired supercritical
600MWCoal-fired sub-critical
180 MW Oil fired CCGT
300 MW NG CCGT
Investment Cost RMB/kW 4515 4074 3938 3137 3106Material Expenditure
RMB/MWh 6 5 5 15 8
Other O&M Expenditure
RMB/MWh 12 10 10 18 12
59

PROJECT DESIGN DOCUMENT FORM (CDM PDD) - Version 03.1
CDM – Executive Board
Water Expenditure RMB/MWh 1 1 1 1 1Annual wage Million
RMB6.2 10.3 10.3 6 6
Power generation coal consumption (PGCC)
gce/kWh 320 299 31225 22526 0.1815(m3/kWh)
Annual generating hours
h 5000 5000 5000 3500 3500
Source: Design reference cost index for thermal power transmit electricity and transformer electricity projects (2004), 2005 April, China Electrical Power Press.
Table 4 Fuel expenditure for different technologies:Fuel Fuel Cost SourceCoal 192.64 RMB/tce
(including desulphurization cost)National Economic Operation Analysis of Coal Enterprises
of from Jan. to May, 2004 http://www.chinacoal.gov.cn/jingjiyunxing/node_4623.htm
NG 1.55 RMB/Nm3 Huizhou LNG Project’s Feasibility Study dated May 2004Fuel oil 2100 RMB/t “Notice of electricity price of oil-fire power plants floating
with price of fuel oil” issued by the Guangdong Province Price Supervision Bureau on July. 2003.http://www.lawon.cn/law/viewDetail.jsp?id=72965
Table 5 Construction period and technical lifetimeTechnology Construction Life time300MW coal fired plant 3 years 20 Years600 MW coal fired plant subcritical
4 years 20 Years
600 MW coal fired plant supercritical
4 years 20 Years
CCGT (oil fired) 2 years 20 YearsNG CCGT 3 year 20 Years
Source: Design reference cost index for thermal power transmit electricity and transformer electricity projects (2004), 2005 April, China Electrical Power Press.
Based on the above parameters and levelised cost calculation formula, the levelised cost of corresponding generation technology can be calculated and listed in the following table.
25 Operation data of 600 MW units national competition in 200626 “Notice of electricity price of oil-fire power plants floating with price of fuel oil”issued by Guangdong Province Price Supervision Bureau on July. 2003.
60
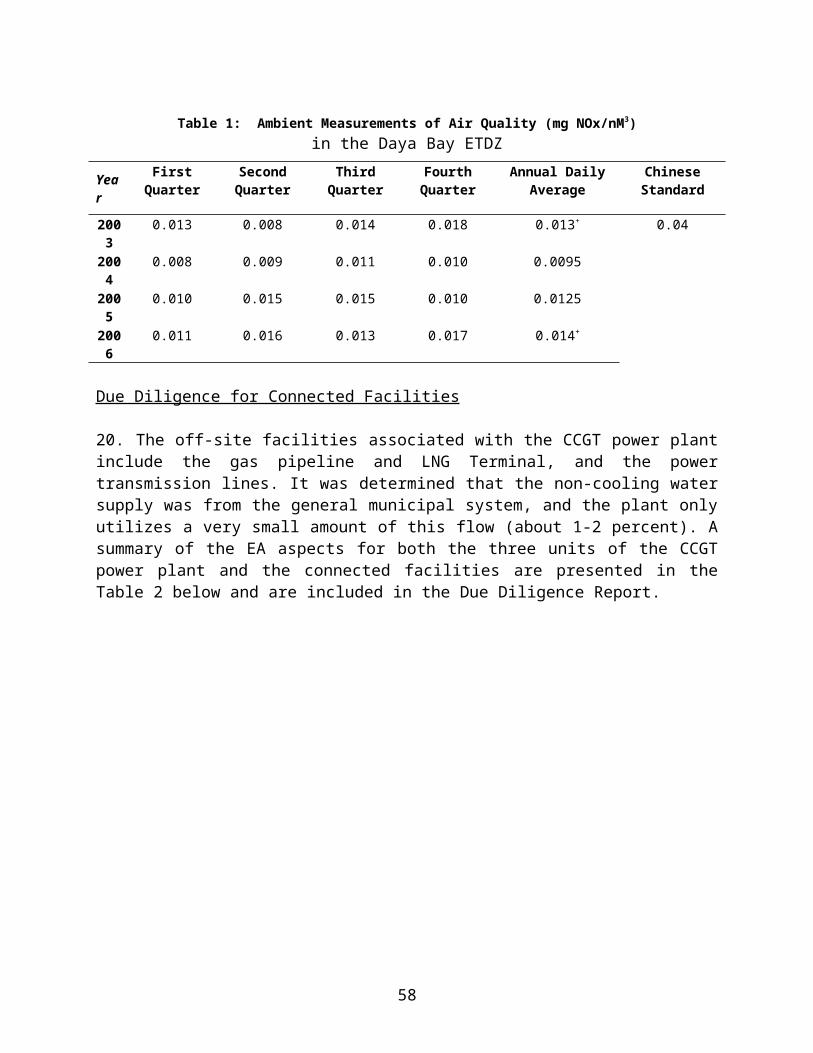
PROJECT DESIGN DOCUMENT FORM (CDM PDD) - Version 03.1
CDM – Executive Board
Table 6 Result and sensitive analysis of Levelised costFuel Levelised
CostLoad Factor Fuel Cost
RMB/kWh +10% -10% +10% -10%300 MW Subcritical 0.2427 0.2280 0.260
70.2489
0.2365
600 MW Supercritical
0.2195 0.2063 0.2358
0.2253
0.2138
600 MW Subcritical 0.2173 0.2045 0.2330
0.2233
0.2113
CCGT with fuel oil 0.6366 0.6248 0.6510
0.6838
0.5893
CCGT with LNG 0.4324 0.4206 0.4469
0.4605
0.4043
According to the version 01.1 of AM0029, the baseline alternatives with the best financial indicator, i.e., the lowest levelised cost, can be pre-selected as the most plausible scenario. Then the 600 MW subcritical coal-fired power plant has the lowest levelised cost, then the most plausible scenario. The sensitive analysis in the previous table confirms and supports that the 600 MW subcritical coal-fired power plant is always the least levelised cost alternatives within reasonable variations in the critical assumptions.
B.5. Description of how the anthropogenic emissions of GHG by sources are reduced below those that would have occurred in the absence of the registered CDM project activity (assessment and demonstration of additionality):>>According to the version 01.1 of AM0029, the project proponent is required to demonstrate that the GHG reductions from the project activity are additional to those that would have occurred in absence of the project activity. The assessment of additionality demonstrates that the proposed CDM project activity is unlikely to be financially attractive and is not common practice in the relevant sector by applying two specified steps of the “Tool for the demonstration and assessment of additionality” version 3.0:
Step 1: Benchmark investment analysis.
For determining the financial attractiveness of the proposed project activity, project proponent has taken into consideration all the financial parameters relevant to the project activity and has also conducted sensitivity analysis to reflect the impacts of probable realistic variations of key parameters.
61

PROJECT DESIGN DOCUMENT FORM (CDM PDD) - Version 03.1
CDM – Executive Board
Sub-step 1a. Apply Benchmark Analysis
According to the “Interim Rules on Economic Assessment of Electrical Engineering Retrofit Projects,”27 the Financial benchmark rate of return (after tax) of Chinese Power Industries is 8 percent of the total investment IRR. This benchmark is widely used for power project investments in China and all the power projects in China are considered viable by the government only if the guaranteed returns of minimum 8 percent on the capital are ensured. In line with that, the feasibility study of the proposed project and the benchmark investment analysis in this PDD adopt 8 percent as benchmark FIRR.
Sub-step 1b. Calculation and comparison of financial indicators.
Table 7. summarizes the data used in the calculation of the project IRR. Table 7 Main parameters for calculation of financial indicators
Basic Parameters Value UnitData
SourceInstalled capacity 1083.09 MW FSElectricity generation 3703.5 GWh FS
Fixed assets3,600,170,000 RMB FS
Electricity tariff (Excluding VAT) 418.63 RMB/MW FSAuxiliary electricity consumption rate 2.40% FSPower generation gas consumption 0.1797 m3/kWh FSWater expenditure 0.28 RMB/MWh FSMaterial expenditure 3.21 RMB/MWh FSOverhaul of equipment 3.35% FSPersons 165 Persons FSAnnual average wage 60000 RMB/Year FSWelfare 55% FSOperating management expenditure 11.62 RMB/MWh FSGas price (Including VAT)28 1.55 RMB / m3 FSInsurance 0.25% FSDepreciation period 15 Years FSFixed assets residue 5% FSIncome tax 33% FS
27 State Power Corporation of China. Interim Rules on Economic Assessment of Electrical Engineering Retrofit Projects. Beijing: China Electric Power Press, 2003. 28 The gas price is subject to adjustment based on the pricing clause in the LNG sales and purchase contract, with a correlation to the price fluctuation of crude oil. Currently, the gas price has risen to 1.65 Yuan/m3. Based on the latest data, the present IRR of this project is 2.62 percent according to the newest Financial Assessment made in July 2007
62

PROJECT DESIGN DOCUMENT FORM (CDM PDD) - Version 03.1
CDM – Executive Board
Construction tax 5% FSEducation surcharge 3% FSPublic accumulation fund 10% FSPublic commonweal fund 5% FSOperation period 20 Years FSCERs price 9.5
EUR/tCO2e
All IRR calculations reported in this section are based on data in the feasibility study29 unless otherwise noted. All financial data used to calculate the Financial Internal Rate of Return (FIRR) of the project activity with and without CDM revenues have been provided to the DOE together with the copy of the actual purchasing contracts and invoices.
The financial indicators (FIRR) with and without income from CERs sales are summarized in Table 8. Without income from CERs sales, the FIRR of the proposed project is 6.12 percent, which is much lower than the benchmark FIRR of 8 percent. As a result, the proposed project is financially unattractive because of its low profitability. With income from CERs sales, the FIRR of the proposed project is slightly higher than the 8 percent benchmark. In the calculation of the FIRR, the CER revenues for the three crediting periods of 19 years have been included.
Table 8 Comparison of financial indicators with and without income from CERsItems Unit Without income
from CERsBenchmark With income
from CERSFIRR on total investment % 6.12 8 8.18
As early as November 2003, the potential benefit of the CDM was considered by the project entity in a case study for a natural gas-fired power generation.30 Specifically for the HLPGP, the potential benefits of the CDM, on February 17, 2004, the project entity had commissioned a project feasibility study31 to take the potential CDM revenue into account. According to the Shareholders Meeting Minutes dated May 26, 2004, to ensure financial viability of the project, the shareholders were also actively seeking potential revenue from participating in CDM even when the Kyoto Protocol was not yet in force and no relevant methodology was available.
It has been demonstrated in the feasibility study in May 2004 that without the CDM revenue, the Internal Rate of Return (IRR) of the project would be 6 percent, which was 2 percent lower than the industry benchmark of 8 percent.32 With the CDM revenue, the IRR would be 8.18 percent, barely surpassing the industry benchmark.29 Refer to Feasibility Study dated May 2004.30 “Case Study of Clean Development Mechanism Project of Zhuhai Power Plant Project Phase II,” Energy Research Institute of the NDRC & Global Climate Change Institute, Tsinghua University, November 2003.31 Refer to Feasibility Study dated May 2004 dated May 2004.32 State Power Corporation of China. “Interim Rules on Economic Assessment of Electrical Engineering Retrofit Projects.” Beijing: China Electric Power Press, 2003.
63
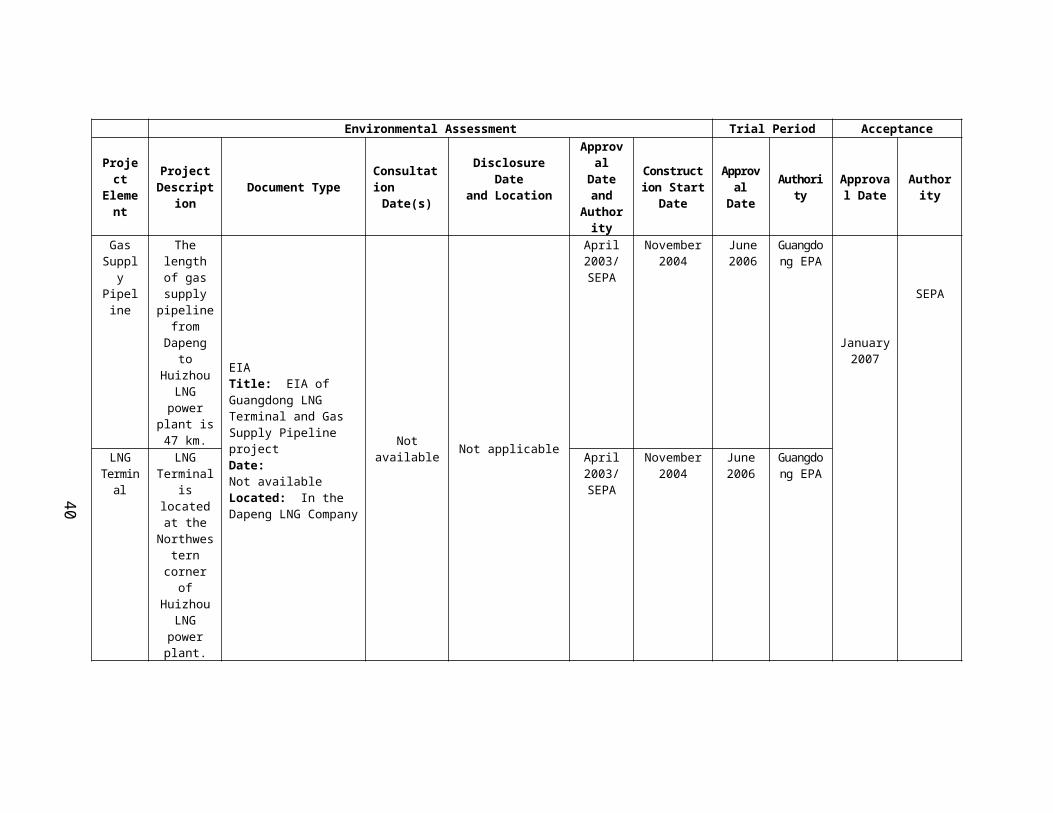
PROJECT DESIGN DOCUMENT FORM (CDM PDD) - Version 03.1
CDM – Executive Board
To meet the high investment cost of the LNG power plant, the project entity has to seek additional financial support from commercial banks. China Industrial and Commercial Bank (CICB)33 has agreed to extend a loan to the project entity only on the understanding that the project risks would be partially compensated by the potential CDM revenue.
Sub-step 1c. Sensitivity analysis.Three factors are considered in the following sensitivity analysis:1) Total investment.2) Gas price.3) Annual electricity generation.
The tariff is not considered in the sensitivity analysis because the tariff is regulated by the government. Assuming the above three factors vary in the range of -10 to +10%, the FIRR of the proposed project (without income from CERs sales) varies to different extent, as shown in Figure 1.
Sensitivity Analysis
0.00
0.01
0.02
0.03
0.04
0.05
0.06
0.07
0.08
0.09
-15% -10% -5% 0% 5% 10% 15%Rate of Varition
IRR
(%) -
Gas Price
Total Investment
Annual Electricity Generation
Figure 1: Sensitivity analysis of the Project
The change of gas price is one of the most important factors affecting the financial attractiveness of the proposed project. The impacts of the annual electricity generation and total investment are less significant. It is clear that with reasonable variations in the critical assumptions, annual electricity generation, investment and gas price, the FIRR of proposed project is always lower than the investment benchmark. Therefore, without revenues from the sale of CERs; the project lacks financial attractiveness.
As per the “Tool for the demonstration and assessment of additionality (Version 03),” since the above sensitivity analysis concluded that the proposed CDM project activity is unlikely to be financially attractive, we now proceed to Common practice analysis. 33“Supplementary statement on loan evaluation report of Guangdong Huizhou LNG project”, China Industrial and Commercial Bank, Guangdong Branch, January 23, 2006
64

PROJECT DESIGN DOCUMENT FORM (CDM PDD) - Version 03.1
CDM – Executive Board
Step 2: Common practice analysis.
Sub-step 2a. Analyze other activities similar to the proposed project activity.
Step 4 of the latest “Tool for the demonstration and assessment of additionality (Version 03)” prescribes that activities similar to the proposed project activity should be considered for the common practice analysis. Similar project activities include:
Those activities that are implemented previously or currently underway Projects in the same region and/or rely on a broadly similar technology; Projects are of similar scale; Projects take place in a comparable environment with respect to regulatory framework,
investment climate, access to technology, access to financing, etc.
During 2002-2005, there was no gas-fired electricity generating capacity in SCPG. It is clear that gas-based power plant is not a common practice within the project boundary. The HLPGP is one of the first LNG CCGT power plants in SCPG. Other three similar projects: Shenzhen Qianwan LNG power plant, Shenzhen Dongbu LNG power plant and Zhujiang LNG power plant are all in the process of applying as CDM projects.
Sub-step 2b. Discuss any similar options that accruing.
NG fired power stations are not widely available in SCPG, the grid boundary in the PDD. The reasons for low penetration of similar activities are explained in the investment analysis section. Also, low penetration of LNG based power generation in the country is due to inadequate gas supply as well as pipeline infrastructure. Thus, the proposed project is additional.
Step 3: Impact of CDM registration.
According to the Additionality Step 3 of the latest AM0029, an analysis of impact of CDM registration is stated as follows:
Besides greenhouse gas emissions reduction, the following positive impacts of the approval and registration of the proposed project activity were anticipated at the beginning of the project activity:
CDM revenue is important for the project’s sustainability by greatly improving the financial performance of the proposed project and overcoming the investment benchmark. The project owner would be more confident in successful implementation of the proposed project.
As China aims to diversify its energy sources away from carbon intensive sources such as coal and fuel oil to a cleaner fuel such as natural gas, the registration of the proposed project activity will be an important catalyst to encourage other prospective developers to
65

PROJECT DESIGN DOCUMENT FORM (CDM PDD) - Version 03.1
CDM – Executive Board
invest in natural gas fired combined cycle power plants, which would lead to further reduction in GHG emissions.
The additionality analysis of the proposed project has clearly demonstrated that the proposed project is additional, according to the version 01.1 of AM0029 and Tool for the demonstration and assessment of additionality version 3.0.
B.6. Emission reductions:
B.6.1. Explanation of methodological choices:
Step 1 Calculate Baseline Emission
Sub-step 1a Calculate Baseline Emission Factor (EFBL,CO2)According to the version 01.1 of AM0029, the baseline emission factor EFBL,CO2, is the lowest emission factor among the following three options:
Option 1. The build margin (EFBL,BM), calculated according to ACM0002; andOption 2. The combined margin (EFBL,CM), calculated according to ACM0002, using a 50/50 OM/BM weight, then EFBL,CM=0.5EFBL,BM+0.5EFBL,OM, where EFBL,OM is the operational margin calculated according to ACM0002.Option 3. The emission factor of the technology (and fuel) identified as the most likely baseline scenario under Section B 4, step 2 “Identification of the baseline scenario” and calculated as follows:
(1)
Where,COEFBL is the fuel emission coefficient (tCO2e/GJ), based on national average fuel data, if available, otherwise IPCC defaults can be used.
ηBL is the energy efficiency of the technology, as estimated in the baseline scenario analysis above.
As described in Section B4, the 600 MW subcritical coal-fired plant has been identified as the most likely baseline, then emission coefficients of coal can be calculated as follows:
(2)Where:COEFCoal: is the emission coefficient of coal in tCO2/tce.NCVCoal: is the net calorific value of coal (GJ/tce), value from China Energy Statistics Yearbook 2004 has been adopted.EFCO2,Gas,y: is the CO2 emission factor per unit of energy of coal in year y (tCO2/GJ), which is determined by IPCC default value.
66

PROJECT DESIGN DOCUMENT FORM (CDM PDD) - Version 03.1
CDM – Executive Board
OXIDCoal: is the oxidation factor of coal, the IPCC default value will be used.
Then the formula (1) can be translated into the following one:
(3)Where:COEFCoal: is the emission coefficient of coal in tCO2/tce.PGCCBL: is the power generation coal consumption of the most likely baseline technology identified in previous step, 600 MW subcritical coal-fired plant in the PDD, in tce/MWh.rselfuse: is the rate of power generation self-consumed by the power plant.
Sub-step 1a1: Calculate the Operating Margin emission factor (EFBL,OM)
According to ACM0002, version 06, four alternatives could be used to calculate the OM:a) Simple OMb) Simple adjusted OM, orc) Dispatch Data Analysis OM, ord) Average OM.
Dispatch data analysis should be the first methodological choice. Where this option is not selected project participants shall justify why and may use the simple OM, the simple adjusted OM or the averageemission rate method taking into account the provisions outlined hereafter.
The Simple OM method (a) can only be used where low-cost/must run resources constitute less than50 percent of total grid generation in: 1) average of the five most recent years; or 2) based on long-term normal for hydroelectricity production.
The average emission rate method (d) can only be used where low-cost/must run resources constitute more than 50 percent of total grid generation and detailed data to apply option (b) is not available, and where detailed data to apply option (c) above is unavailable.
The Simple OM, simple-adjusted OM, and average OM emission factors can be calculated using either ofthe two following data vintages for years(s) y:
(ex-ante) the full generation-weighted average for the most recent 3 years for which data are available at the time of PDD submission, if or,
the year in which project generation occurs, if EFOM,y is updated based on ex-post monitoring.
For The Project, the simple Operating Margin emission factor was chosen based on the following two reasons:
67

PROJECT DESIGN DOCUMENT FORM (CDM PDD) - Version 03.1
CDM – Executive Board
1. In China, the State Grid Corporation run the interregional dispatch system and each regional grid corporation run the intraregional dispatch system. The dispatch information is regarded as business secrets and not available to the public.
2. For the most recent 5 years (2001–2005), the low-cost/must run resources constitute less than 50 percent of total: 33.72 percent, 32.98 percent, 30.59 percent, 29.71 percent, and 30.41 percent for 2001, 2002, 2003, 2004, and 2005.34
As a result, the simple OM method can be used.
The OM in this PDD is calculated ex-ante based on the most recent 3 years data.
The Simple OM emission factor is calculated as the generation-weighted average emissions per electricity unit (tCO2/MWh) of all generating sources serving the system, not including low-operating cost and must-run power plants:
(4)
Where,
Fi,j,y is the amount of fuel i consumed (ton for solid and liquid fuel, m3 for gas fuel) by relevant power sources j in years y,
j refers to the power sources delivering electricity to the grid, not including low-operating cost and must-run power plants, and including imports to the grid.
COEFi,j,y is the CO2 emission coefficient of fuel i (tCO2/t for solid and liquid fuel, tCO2/m3 for gas fuel), taking into account the carbon content of the fuels used by relevant power sources j and the percent oxidation of the fuel in years y, and
GENj,y is the electricity (MWh) delivered to the grid by source j.
The fuel consumption data for generation is extracted from energy balance table in China Energy Statistical Yearbook. The generation data is extracted from China Electric Power Yearbook. In the China Electric Power Year Book and other data resources, only generation data by fuel type is available. The generation from source j can be translated into electricity delivered to the grid by source j by excluding the plant self consumption part (please see B.6.2)
Sub-step 1a2. Calculate the Build Margin emission factor (EFBL,BM)
According to ACM0002, the BM is calculated as the generation-weighted average emission factor of a sample of power plants m, as follows:
(5)
34 As defined in the methodology ACM0002 version 06, the low operating cost and must run resources include hydro, nuclear, wind, biomass generation.
68

PROJECT DESIGN DOCUMENT FORM (CDM PDD) - Version 03.1
CDM – Executive Board
Where
Fi,m,y is the amount of fuel i (tce) consumed by plant m in year y.
COEFi,m,y is the CO2 emission coefficient (tCO2/tce) of fuel i, taking into account the carbon content of the fuels used by plant m and the percent oxidation of the fuel in year y.
GENm,y is the electricity (MWh) delivered to the grid by plant m, equals to generation minus plant self consumption:
Project participants shall choose the sample of power plants m between one of the following two options. The choice among the two options should be specified in the PDD, and cannot be changed during the crediting period.
Option 1. Calculate the Build Margin emission factor EFBL,BM ex-post based on the most recent information available on plants already built for sample group m at the time of PDD submission. The sample group m consists of either the five power plants that have been built most recently, or the power plant capacity additions in the electricity system that comprise 20% of the system generation (in MWh) and that have been built most recently. Project participants should use from these two options that sample group that comprises the larger annual generation.
Option 2. For the first crediting period, the Build Margin emission factor EFBL,BM must be updated annually ex-post for the year in which actual project generation and associated emissions reductions occur. For subsequent crediting periods, EFBL,BM should be calculated ex-ante, as described in option 1 above. The sample group m consists of either the five power plants that have been built most recently, or the power plant capacity additions in the electricity system that comprise 20 percent of the system generation (in MWh) and that have been built most recently. Project participants should use from these two options that sample group that comprises the larger annual generation.
In this PDD, the BM is determined ex-post based on option 1.
A direct application of this approach is difficult in China. The Executive Board (EB) has provided guidance on this matter with respect to the application of the AMS-1.D and AM0005 methodologies for projects in China on 7 October 2005 in response to a request for clarification by DNV on this matter. The EB accepted the use of capacity additions to identify the share of thermal power plants in additions to the grid instead of using power generation.
The calculation of the published BM Emission Factor is based on this approach and is described below:
First,we calculate the share of the CO2 emission factors of the solid fuel, liquid fuel and gas fuel in total emissions respectively by using the latest energy balance data available.
Second, the calculated shares are the weights. Using the emission factor for advanced efficient technology we calculate the BM emission factor for thermal power;
69

PROJECT DESIGN DOCUMENT FORM (CDM PDD) - Version 03.1
CDM – Executive Board
Third, use the BM emission factor to multiply the emission factor of the thermal power with the share of the thermal power in 20% of the newly-added capacity of the power grid.
Detailed steps and formulas are as below:. First, we calculate the share of CO2 emissions of the solid, liquid and gas fuel in total emissions respectively .
(6)
(7)
(8)
with: Fi,j,y the amount of the fuel i consumed in y year of j province (measured in tce; COEFi,j,y the emission factor of fuel i ( measured in tCO2/tce) while taking into
account the carbon content and oxidation rate of the fuel i consumed in y year; COAL,OIL and GAS subscripts standing for the solid fuel, liquid fuel and gas fuel
Second, we calculate the emission factor of the thermal power
(9)
While EFCoal,Adv, EFOil,Adv and EFGas,Adv represent the emission factors of advanced coal-fired , oil-fired and gas-fired power generation technology, see detailed parameter and calculation in Annex 2.
Third, we calculate BM of the power grid
(10)
While CAPTotal represents the total newly-added capacity and CAPThermal represents newly-added thermal power capacity.
The detailed information of BM and OM calculation is listed in Annex 3 of this PDD.
70

PROJECT DESIGN DOCUMENT FORM (CDM PDD) - Version 03.1
CDM – Executive Board
Sub-step 1a3: Calculate the Combine Margin emission factor (EFBL,CM)The combined margin (EFBL,CM) is calculated according to ACM0002, using a 50/50 OM/BM weight:
(11)
Sub-step 1a4: Calculate the Baseline Emission Factor (EFBL,CO2)Then the baseline emission factor can be calculated as follows:
(12)
Sub-step 1b Calculate Baseline Emission (BEy)
Once the baseline emission factor is determined, the baseline emissions can be calculated by multiplying the electricity generated in the project plant (EGy) with the baseline emission factor EFBL,CO2:
(13)
Step 2 Calculate Project Emission (PEy)
According to the Methodology, the project activity is on-site combustion of natural gas to generate electricity, then the CO2 emissions from electricity generation are calculated as follows:
(14)WhereFCLNG,y: is the total volume of LNG combusted in the project plant (tons) in year y.FCDiesel,y: is the total volume of diesel combusted in the project plant (tons) for start-up fuel in year y. In the proposed project activity, the diesel consumption for start up is zero. COEFLNG,y: is the CO2 emission coefficient (tCO2/tons) in year y for LNG.COEFDiesel,y: is the CO2 emission coefficient (tCO2/tons) in year y for diesel.
The emission coefficients of LNG and diesel are calculated as follows:
(15)(16)
Where:NCVLNG,y: is the net calorific value of LNG (GJ/ton), which is determined from the fuel supplier.NCVDiesel,y: is the net calorific value of diesel (GJ/ton), which is determined from the most recent “Chinese Energy Statistics Yearbook” available when the verification begins.EFCO2,Gas,y: is the CO2 emission factor per unit of energy of LNG in year y (tCO2/GJ), which is determined from the fuel supplier.
71

PROJECT DESIGN DOCUMENT FORM (CDM PDD) - Version 03.1
CDM – Executive Board
EFCO2,Diesel,y: is the CO2 emission factor per unit of energy of diesel in year y (tCO2/GJ), the IPCC default value will be used.OXIDGas: is the oxidation factor of LNG, the IPCC default value will be used.OXIDDiesel: is the oxidation factor of diesel, the IPCC default value will be used.
Step 3 Calculate Leakage (LEy)
According to the Methodology, the following leakage emission sources are considered:
Fugitive CH4 emissions associated with fuel extraction, processing, liquefaction, transportation, regasification, and distribution of natural gas used in the project plant and fossil fuels used in the grid in the absence of the project activity.
In the case LNG is used in the project plant: CO2 emission from fuel combustion/electricity consumption associated with the liquefaction, transportation, re-gasification and compression into a natural gas transmission or distribution system.
Thus, the leakage can be calculated based on following steps:
Sub step 3a Calculate the Upstream fugitive CH4 emission factor (EFBL,upstream,CH4)
According to the Methodology, the emission factor for upstream fugitive CH4 emissions occurring in the absence of the project activity should be consistent with the baseline emission factor (EFBL,CO2) in step 1 of this section. As described in Section B 6.3, the BM will be selected as the baseline emission factor, then the corresponding upstream fugitive CH4 emission factor can be calculated as follows:
(17)
Where:EFBL,upstream,CH4: is the emission factor for upstream fugitive methane emissions occurring in the absence of the project activity in tCH4/MWh.FFCoal: Total quantity of coal type fuel combusted (tons raw coal) in power plants included in the build margin.FFGas: Total quantity of gas type fuel combusted (GJ) in power plants included in the build margin.FFDiesel: Total quantity of diesel type fuel combusted (GJ) in power plants included in the build margin.EFCoal,upstream,CH4: Emission factor for upstream fugitive methane emissions from production of coal in tCH4/t coal. The Methodology suggested two default fugitive CH4 associated with different source: underground mining and surface mining. Because 95 percent of the coal production in China are produced by underground mining, so the default value for underground mining 13.4 tCH4/kt coal is used in this PDD.
72

PROJECT DESIGN DOCUMENT FORM (CDM PDD) - Version 03.1
CDM – Executive Board
EFGas,upstream,CH4: Emission factor for upstream fugitive methane emissions from production of gas in tCH4/GJ. The Methodology suggested several default fugitive CH4 associated with different regions. In this PDD, the default value for other oil exporting countries/rest of world is adopted, which is higher than the value for USA and Canada, resulting in an upward estimate of the leakage. Thus it is conservative. The project might adopt the lower default value for USA and Canada because the new gas terminal and transmission and distribution network of this project is construed and operated by advance technology.EFOil,upstream,CH4: Emission factor for upstream fugitive methane emissions from production of oil in tCH4/GJ. The default value suggested in the Methodology is used in this PDD.GENy: Electricity generation in the plants included in the build margin in MWh/a.
For the BM is calculated based on a conservative way, we also use the following formula to estimate the upstream fugitive methane emissions as follows:
(18)
Where,λCoa,BMl: is the share of coal-fired generation in BM generation.PGCCAdv: is the power supply coal consumption of the most advance coal-fired generation technology within the grid boundary, which is estimated as 343.33 gce/kWh in this PDD.NCVCoal: is the net caloric value of standard coal equivalent in GJ/tce.NCVRawcoal: is the net caloric value of raw coal which is used for power generation in GJ/tce.
Sub step 3b Calculate Fugitive Methane Emissions (LECH4,y)
To estimated the fugitive methane emissions, one can multiply the quantity of LNG consumed by the project in year y with an emission factor for fugitive CH4 emissions (EFGas,upstream,CH4) for LNG consumption and subtract the emissions occurring from fossil fuels used in the absence of the project activity, as follows:
(19)Where:LECH4,y: Leakage emissions due to fugitive upstream CH4 emissions in the year y in tCO2e.FCLNG,y: Total volume of LNG combusted in the project plant (tons) in year y.NCVLNG,y: Net calorific value of LNG (GJ/ton), which is determined from the fuel supplier.EFGas,upstream,CH4: Emission factor for upstream fugitive methane emissions from production of gas in tCH4/GJ. The Methodology suggested several default fugitive CH4 associated with different regions. In this PDD, the default value for other oil exporting countries/rest of world is adopted.EGy: Electricity generation in the project plant during year y in MWh.EFBL,upstream,CH4: is the emission factor determined in sub step 3a for upstream fugitive methane emissions occurring in the absence of the project activity in tCH4/MWh.
73

PROJECT DESIGN DOCUMENT FORM (CDM PDD) - Version 03.1
CDM – Executive Board
GWPCH4: Global warming potential of methane valid for the relevant commitment period.
Sub step 3c Calculate CO2 emissions from LNG (LELNG,CO2,y)
CO2 emission from LNG combustion/electricity consumption associated with the liquefaction, transportation, re-gasification and compression of LNG into a natural gas transmission or distribution system is estimated by multiplying the quantity of natural gas combusted in the project with an appropriate emission factor, as follows:
(20)Where,LELNG,CO2,y: Leakage emissions due to LNG combustion/electricity consumption associated with the liquefaction, transportation, re-gasification and compression of LNG into a natural gas transmission or distribution system in tCO2e.FCLNG,y: Total volume of LNG combusted in the project plant (tons) in year y.NCVLNG,y: Net calorific value of LNG (GJ/ton), which is determined from the fuel supplier.EFCO2,upstream,LNG: Emission factor for upstream CO2 emission due to LNG combustion/electricity consumption associated with the liquefaction, transportation, re-gasification and compression of LNG into a natural gas transmission or distribution system in tCO2/GJ. Because such data is unavailable in this project, the default value of 6 tCO2/TJ suggested in the Methodology is adopted as a rough approximation.
Sub step 3d Calculate Leakage (LEy)
Thus the leakage can be calculated as follows:
(21)Where:LEy: leakage emission during the year y in tCO2e.LECH4,y: leakage emission due to fugitive upstream CH4 emissions in year y in tCO2e.LELNG,CO2,y: leakage emission due to fossil fuel combustion/electricity consumption associated with the liquefaction, transportation, re-gasification and compression of LNG into a natural gas transmission or distribution system during the year y in tCO2e.
Step 4 Calculate Emission Reduction (ERy)
The emission reduction of the proposed project can be calculated as follows:
(22)Where:ERy: emission reduction in year y in tCO2e.BEy: emission in the baseline scenario in year y in tCO2e.PEy: emission in the project scenario in year y in tCO2e.LEy: emission in the year y in tCO2e.
74

PROJECT DESIGN DOCUMENT FORM (CDM PDD) - Version 03.1
CDM – Executive Board
B.6.2. Data and parameters that are available at validation:
Data / Parameter: EFBL,BM
Data unit: tCO2/MWhDescription: The build margin emission factor calculated according to ACM0002Source of data used: CalculatedValue applied: 0.6748 tCO2/MWhJustification of the choice of data or description of measurement methods and procedures actually applied :
This data is calculated based on version 06 of ACM0002, relevant steps and parameters used for calculation are listed in Annex 3 of this PDD.
Any comment:
Data / Parameter: EFBL,OM
Data unit: tCO2/MWhDescription: The operational margin emission factor calculated according to
ACM0002Source of data used: CalculatedValue applied: 1.0119 tCO2/MWhJustification of the choice of data or description of measurement methods and procedures actually applied :
This data is calculated based on version 06 of ACM0002, relevant steps and parameters used for calculation are listed in Annex 3 of this PDD.
Any comment:
Data / Parameter: PGCCBL
Data unit: tce/MWhDescription: Power generation coal consumption per MWh generated by the most
likely baseline technology identified in Section B5.Source of data used: Operation data of 600 MW units national competition in 2006Value applied: 0.312Justification of the choice of data or description of measurement methods and
This data is based on identification of most likely baseline scenario in section B5.
75
PROJECT DESIGN DOCUMENT FORM (CDM PDD) - Version 03.1
CDM – Executive Board
procedures actually applied :Any comment:
Data / Parameter: rselfuse
Data unit: %Description: Self usage rate of the power plant using the most likely baseline
technology identified in Section B5.Source of data used: “Operation data of 600 MW units national competition in 2006”Value applied: 5.02%Justification of the choice of data or description of measurement methods and procedures actually applied :
This data is based on identification of most likely baseline scenario in section B5.
Any comment:
Data / Parameter: Fi,y
Data unit: t/m3
Description: Amount of fuel i consumed in year(s) y for generationSource of data used: China Energy Statistical YearbookValue applied: See Annex 3Justification of the choice of data or description of measurement methods and procedures actually applied :
Since the detailed fuel consumption data by power plants are not publicly available, therefore the aggregated data by fuel types are used instead.
Any comment:
Data / Parameter: GENi,y
Data unit: MWhDescription: Electricity (MWh) delivered to the grid excluding low operation
cost/must run power plants in year ySource of data used: China Electric Power YearbookValue applied: See Annex 3Justification of the choice of data or description of measurement methods and
Since the detailed generation data by power plants are not publicly available, therefore the aggregated data by fuel types are used instead.
76

PROJECT DESIGN DOCUMENT FORM (CDM PDD) - Version 03.1
CDM – Executive Board
procedures actually applied :Any comment:
Data / Parameter: NCVi
Data unit: GJ/t(ce)Description: Net caloric value of fuel iSource of data used: China Energy Statistics Yearbook 2004, p535.Value applied: See Annex 3Justification of the choice of data or description of measurement methods and procedures actually applied :
This data comes from an official statistics.
Any comment:
Data / Parameter: OXIDi
Data unit:Description: The oxidation factor of fuel iSource of data used: IPCC default value in revised 2006 IPCC Guideline for National
Greenhouse Gas Inventories.Value applied: See Annex 3Justification of the choice of data or description of measurement methods and procedures actually applied :
This data is based on IPCC default value because the national specific value is unavailable.
Any comment:
Data / Parameter: EFCO2,i
Data unit: tCO2/GJDescription: The emission factor of fuel iSource of data used: IPCC default value in revised 2006 IPCC Guideline for National
Greenhouse Gas Inventories.Value applied: See Annex 3Justification of the choice of data or description of measurement methods and
This data is based on IPCC default value because the national specific value is unavailable.
77

PROJECT DESIGN DOCUMENT FORM (CDM PDD) - Version 03.1
CDM – Executive Board
procedures actually applied :Any comment:
Data / Parameter: COEFi
Data unit: tCO2/t (m3)Description: CO2 emission coefficient of fuel iSource of data used: CalculatedValue applied: See Annex 3Justification of the choice of data or description of measurement methods and procedures actually applied :
Calculated according to the formula suggested by ACM0002.
Any comment:
Data / Parameter: PGCCAdv
Data unit: kgce/MWhDescription: Fuel consumption per kWh electricity delivered of best available
technologies in China
Source of data used: Expert estimated and relevant statisticsValue applied: 343.33 Justification of the choice of data or description of measurement methods and procedures actually applied :
According to EB guidance, the efficiency level of the best technology commercially available in the provincial/regional or national grid of China can be used as a conservative proxy for each fuel type in estimating the fuel consumption to estimate the build margin (BM).
Any comment:
Data / Parameter: ei
Data unit: %Description: Delivered generation efficiency the best commercially available
technology fuelled by fuel type i in BM generation mix.Source of data used: Estimated and published by China DNA Value applied: See Annex 3Justification of the choice of data or description of measurement
Since the detailed information regarding fuel consumption and emission data of individual power plant is not publicly available, the values of the best commercially available technology are therefore adopted as the conservative proxy to calculate BM emission factor.
78

PROJECT DESIGN DOCUMENT FORM (CDM PDD) - Version 03.1
CDM – Executive Board
methods and procedures actually applied :Any comment:
Data / Parameter: λi,BM
Data unit: %Description: Share of generation by fuel type i in BM generation mix.Source of data used: China Electric Power Yearbook Value applied: See Annex 3Justification of the choice of data or description of measurement methods and procedures actually applied :
Since the detailed information regarding construction and generation of individual power plant is not publicly available, the aggregated data of installed capacity by fuel types are used to identify and represent the build margin, which can be estimated as follows:
Any comment:
Data / Parameter: EFCoal,upstream,CH4
Data unit: t CH4/kt coalDescription: Fugitive CH4 upstream emission of coal miningSource of data used: IPCC default valueValue applied: 13.4Justification of the choice of data or description of measurement methods and procedures actually applied :
Since 95% of the coal production in China are produced by underground mining, so the default value for underground mining 13.4 tCH4/kt coal is used.
Any comment:
Data / Parameter: EFGas,upstream,CH4
Data unit: t CH4/PJDescription: Fugitive CH4 upstream emission of natural gas productionSource of data used: IPCC default valueValue applied: 296Justification of the choice of data or description of measurement methods and procedures actually
No country specific value, therefore IPCC default value is adopted
79

PROJECT DESIGN DOCUMENT FORM (CDM PDD) - Version 03.1
CDM – Executive Board
applied :Any comment:
Data / Parameter: EFCO2,upstream,LNG
Data unit: t CO2e/TJDescription: Emission factor for upstream CO2 emission due to energy consumption
associated with LNG processSource of data used: IPCC default valueValue applied: 6Justification of the choice of data or description of measurement methods and procedures actually applied :
Since there is no country or local specific value available, the IPCC default value recommended by the methodology AM0029 is adopted.
Any comment:
Data / Parameter: EFBL,upstream,CH4
Data unit: T CH4/MWhDescription: Fugitive CH4 upstream emission associated with per electricity generatedSource of data used: Calculated according to formula (13) presented aboveValue applied: 0.00426Justification of the choice of data or description of measurement methods and procedures actually applied :
To be conservative, only fugitive CH4 emission by coal mining which will be avoided by the proposed project is considered.
Any comment:
B.6.3 Ex-ante calculation of emission reductions:
According to the Methodology and calculation steps described in section B 6.1, the emission reductions can be ex-ante calculated as follows:
Step 1 Calculated baseline emissionsSub-step 1a Calculate baseline emission factor (EFBL,CO2)
EFBL,BM=0.6748 tCO2/MWh, see also Section B.6.2EFBL,OM=1.0119 tCO2/MWh, see also Section B.6.2EFBL,CM=0.5×EFBL,BM +0.5×EFBL,OM=0.843 tCO2/MWh
=2.769×0.312/(1-5.02%)=0.910 tCO2/MWh.
80
PROJECT DESIGN DOCUMENT FORM (CDM PDD) - Version 03.1
CDM – Executive Board
Then =0.6748 tCO2/MWh. The build margin (Option 1) is selected as the baseline emission factor.
Sub-step 1b Calculate baseline emissions (BEy)
BEy=EGy×EFBL,CO2=3703514×0.6748=2,499,131 tCO2
Step 2 Calculate Project Emission (PEy)
=49.39×56100/1000=2.771 tCO2/t=506100×2.771=1,402,403 tCO2
Step 3 Calculate Leakage (LEy)
0.6622×343.33×13.4×29.27/20.91/106=0.00426t CH4/MWh
= [506100×49.39×296/106-3703514×0.00426] ×21= -175,939 tCO2
=506100×49.39×6/1000=149,978 tCO2
=149,978-175,939=-25,961 tCO2, then 0 tCO2,
Step 4 Calculate Emission Reduction
=2,499,131-1,402,403=1,096,728 tCO2
B.6.4 Summary of the ex-ante estimation of emission reductions:
Year Estimation ofproject activity
emissions(tonnes of CO2e)
Estimation ofbaseline
emissions(tonnes of CO2e)
Estimation ofleakage
(tonnes of CO2e)
Estimation ofoverall emission
reductions(tonnes of CO2e)
2008 1,402,403 2,499,131 0 1,096,7282009 1,402,403 2,499,131 0 1,096,7282010 1,402,403 2,499,131 0 1,096,7282011 1,402,403 2,499,131 0 1,096,7282012 1,402,403 2,499,131 0 1,096,7282013 1,402,403 2,499,131 0 1,096,7282014 1,051802 1,874,348 0 1,096,728
81

PROJECT DESIGN DOCUMENT FORM (CDM PDD) - Version 03.1
CDM – Executive Board
Total(tonnes of CO2e)
9,466,220 17,493,918 0 7,677,096
B.7 Application of the monitoring methodology and description of the monitoring plan:
B.7.1 Data and parameters monitored:A. Monitoring parameters for the Build margin emission factor:A1.Data / Parameter: Build Margin emission factor (EF BL,CO2,y)Data unit: t CO2/ MWhDescription: Build Margin emission factor of the grid in tonnes of CO2 per MWh.Source of data to be used:
NDRC of China will update the BM every year, which has been thoroughly checked and has been compiled in the best possible manner and therefore is considered to be a reliable data resource.Such data if available in a timely manner, shall be used. Otherwise, this parameter shall be calculated based on the procedures described in section B.6.1 and the relevant parameters should be monitored ex-post.
Value of data applied for the purpose of calculating expected emission reductions in section B.5
0.6748 t/MWh.
Description of measurement methods and procedures to be applied:
The real BM will be determined ex-post.
QA/QC procedures to be applied:
The uncertainty level of this data is low. This is calculated based on data collectedfrom official/ reliable data sources. No additional QA/QC procedures mayneed to be planned.
Any comment: Data will be recorded as per Monitoring Plan. Data will be archivedelectronically/ paper as available. Archived data will be stored as perMonitoring Plan.
Data / Parameter: Fi,j,y
Data unit: Mt, Mm3
Description: the amount of fuel i (in a mass or volume unit) consumed by relevant powersources j in year(s) y
Source of data used: China Energy Statistical YearbookValue of data applied See Annex 3 for details
82

PROJECT DESIGN DOCUMENT FORM (CDM PDD) - Version 03.1
CDM – Executive Board
for the purpose of calculating expected emission reductions in section B.5Description of measurement methods and procedures to be applied:
Official statistical data
QA/QC procedures to be applied:
Official data, no QA/QC needed.
Any comment:
Data / Parameter: NCVi
Data unit: TJ/ mass or volume unit of a fuelDescription: the net calorific value (energy content) per mass or volume unit of a fuel
iSource of data used: China Energy Statistical YearbookDescription of measurement methods and procedures to be applied:
See Annex 3 for details
QA/QC procedures to be applied:
National and official data
Value of data applied for the purpose of calculating expected emission reductions in section B.5
Official data, no QA/QC needed.
Any comment:
Data / Parameter: OXIDi
Data unit: %Description: the oxidation factor of the fuel iSource of data used: 2006 IPCC Guidelines for National Greenhouse Gas InventoriesValue of data applied for the purpose of calculating expected emission reductions in section B.5
see Annex3 for details
Description of measurement methods and
National data not available, so IPCC default values are used.
83

PROJECT DESIGN DOCUMENT FORM (CDM PDD) - Version 03.1
CDM – Executive Board
procedures to be applied:QA/QC procedures to be applied:
IPCC data, no QA/QC needed
Any comment:
Data / Parameter: EFCO2,i
Data unit: tCO2e/TJDescription: the CO2 emission factor per unit of energy of the fuel iSource of data used: 2006 IPCC Guidelines for National Greenhouse Gas InventoriesValue of data applied for the purpose of calculating expected emission reductions in section B.5
see Annex 3 for details
Description of measurement methods and procedures to be applied:
National data not available, so IPCC default values are used.
QA/QC procedures to be applied:
IPCC data, no QA/QC needed
Any comment:
Data / Parameter: Gj,y
Data unit: MWhDescription: the amount of electricity generation by source j in year ySource of data used: China Electric Power Yearbook Value of data applied for the purpose of calculating expected emission reductions in section B.5
See Annex 3 for details
Description of measurement methods and procedures to be applied:
Official statistical data
QA/QC procedures to be applied:
Official data, no QA/QC needed.
Any comment:
Data / Parameter: ej,y
Data unit: %
84

PROJECT DESIGN DOCUMENT FORM (CDM PDD) - Version 03.1
CDM – Executive Board
Description: station service power consumption rate of source j in year ySource of data used: China Energy Statistical YearbookValue of data applied for the purpose of calculating expected emission reductions in section B.5
See Annex 3 for details
Description of measurement methods and procedures to be applied:
Official statistical data
QA/QC procedures to be applied:
Official data, no other QA/QC needed.
Any comment:
Data / Parameter: EEcoal,adv
Data unit: %Description: Efficiency of most advanced coal-fired power technology that is
commercially availableSource of data used: Notice on the determination of emission factors of regional power grids
by Chinese CDM DNA or other official statistics data.Value of data
applied for the purpose of calculating expected emission reductions in section B.5
36.53
Description of measurement methods and procedures to be applied:
Official statistics of state power authority
QA/QC procedures to be applied:
Official data, no other QA/QC needed.
Any comment:
Data / Parameter: EEoil,adv
Data unit: %Description: Efficiency of most advanced oil-fired power technology that is
commercially availableSource of data used: Notice on the determination of emission factors of regional power grids
by Chinese CDM DNA or other official statistics data.Value of data applied 45.87
85

PROJECT DESIGN DOCUMENT FORM (CDM PDD) - Version 03.1
CDM – Executive Board
for the purpose of calculating expected emission reductions in section B.5Description of measurement methods and procedures to be applied:
Official statistics of state power authority
QA/QC procedures to be applied:
Official data, no QA/QC needed.
Any comment:
Data / Parameter: EEgas,adv
Data unit: %Description: Efficiency of most advanced gas-fired power technology that is
commercially availableSource of data used: Notice on the determination of emission factors of regional power grids
by Chinese CDM DNA or other official dataValue of data applied for the purpose of calculating expected emission reductions in section B.5
45.87
Description of measurement methods and procedures to be applied:
Official statistics of state power authority
QA/QC procedures to be applied:
Official data, no QA/QC needed.
Any comment:
Data / Parameter: CAP,j,y
Data unit: MWDescription: Installed capacity of source j in year y in SCPGSource of data used: China Energy Statistical Yearbook or other official statistical dataValue of data
applied for the purpose of calculating expected emission reductions in section B.5
See Annex 3 for details
Description of Official statistical data
86

PROJECT DESIGN DOCUMENT FORM (CDM PDD) - Version 03.1
CDM – Executive Board
measurement methods and procedures to be applied:QA/QC procedures to be applied:
Official data, no QA/QC needed.
Any comment:
B Monitoring parameters for project activity and Leakages
Data / Parameter: FCLNG,y
Data unit: tDescription: Annual quantity of LNG consumed in project activitySource of data to be used:
LNG flow meter reading at project boundary
Value of data applied for the purpose of calculating expected emission reductions in section B.5
506100
Description of measurement methods and procedures to be applied:
The LNG flow rate will be monitored through an ultrasonic flow meter continuously both by supplier and project owner. The LNG consumption will be aggregated automatically and recorded daily. These flow meters have an accuracy of 0.5% and will be calibrated in-site every month.
QA/QC procedures to be applied:
The total LNG consumption will be monitored both at supplier and project end for cross-verification.Natural gas supply metering to the project will be subject to regular (in accordance with stipulation of the meter supplier) maintenance and testing to ensure accuracy. The readings will be double checked by the gas supply company. The power plant will use the gas turbine generator control system to measure the gas fuel flow for cross-verification.
Any comment:
Data / Parameter: NCVf,y
Data unit: GJ/tDescription: Net Calorific Value of LNGSource of data to be used:
Supplier-provided data
Value of data applied for the purpose of calculating expected emission reductions in section B.5
49.39
87

PROJECT DESIGN DOCUMENT FORM (CDM PDD) - Version 03.1
CDM – Executive Board
Description of measurement methods and procedures to be applied:
The data used for ex-ante estimation is the country specific value from Chinese Energy Statistical Yearbook. The supplier-provided data will be used instead of country specific value once the project is put into operation. Data will be archived for 2 years following the end of the crediting period by means of electronic and paper backup.
QA/QC procedures to be applied:
No additional QA/QC procedures need to be planned.
Any comment:
Data / Parameter: EFCO2,LNG,y
Data unit: tCO2/GJDescription: Emission factor for LNG consumed in the project activity
Source of data to be used:
IPCC default value
Value of data applied for the purpose of calculating expected emission reductions in section B.5
0.0561
Description of measurement methods and procedures to be applied:
The IPCC default value
QA/QC procedures to be applied:
No additional QA/QC procedures need to be planned.
Any comment:
Data / Parameter: FCDiesel,y
Data unit: tDescription: Annual quantity of Diesel as startup fuel consumed in project activitySource of data to be used:
Diesel flow meter reading for startup usage
Value of data applied for the purpose of calculating expected emission reductions in section B.5
0
Description of measurement methods and
The diesel used for startup fuel will be recorded daily.
88

PROJECT DESIGN DOCUMENT FORM (CDM PDD) - Version 03.1
CDM – Executive Board
procedures to be applied:QA/QC procedures to be applied:
No additional QA/QC procedures need to be planned.
Any comment:
Data / Parameter: NCVDiesel,y
Data unit: GJ/tDescription: Net Calorific Value of DieselSource of data to be used:
Country specific
Value of data applied for the purpose of calculating expected emission reductions in section B.5
42.65
Description of measurement methods and procedures to be applied:
The NCV of diesel available at Chinese Energy Statistical Yearbook (annually published) will be used country specific value.
QA/QC procedures to be applied:
No additional QA/QC procedures may need to be planned.
Any comment: Supplier-provided data will be used if available.
Data / Parameter: EFCO2,Diesel,y
Data unit: tCO2/GJDescription: Emission factor for diesel consumed as startup fuel in the project activity
Source of data to be used:
IPCC default value
Value of data applied for the purpose of calculating expected emission reductions in section B.5
0.0741
Description of measurement methods and procedures to be applied:
The IPCC default value
QA/QC procedures No additional QA/QC procedures need to be planned.
89

PROJECT DESIGN DOCUMENT FORM (CDM PDD) - Version 03.1
CDM – Executive Board
to be applied:Any comment:
Data / Parameter: EGy
Data unit: MWhDescription: Electricity supplied to the grid by the project
Source of data to be used:
Electricity meter reading at project boundary
Value of data applied for the purpose of calculating expected emission reductions in section B.5
3703514
Description of measurement methods and procedures to be applied:
The readings of electricity meter will be hourly measured and monthly recorded. Data will be archived for 2 years following the end of the crediting period by means of electronic and paper backup. The metering equipments are ZMQ202C.6r4af6 with an accuracy of 0.2s.
QA/QC procedures to be applied:
The electricity output from each turbine will be monitored and recorded at the on-site control centre using a computer system. The project operator is responsible for recording this set of data. The electricity meters shall be calibrated once half a year by Guangdong Electric Power Science Institution according to the national calibration criterion “JJG 596-1999” and “JJG 307-2006.”Electricity sales invoices will also be obtained for double check.
Any comment: Electricity supplied by the project activity to the grid. Double check by receipt of sales.
B.7.2 Description of the monitoring plan:
The following steps will be taken to ensure accurate and consistent data is collected for monitoring and verification purposes:
Operational and Management Structure
A CDM workgroup will be established to carry out the monitoring activity of the proposed project and other relevant tasks. The organization of the CDM workgroup is shown in the following chart. The monitoring staff is responsible for recording and archiving the monitoring data in line with the monitoring manual. The verification staff is responsible for rechecking the data and completing verification report for DOE.
90

PROJECT DESIGN DOCUMENT FORM (CDM PDD) - Version 03.1
CDM – Executive Board
Formulate CDM Monitoring Manual
A monitoring manual will be formulated as guidance for regular monitoring activity. The manual will cover the following contents:
1. Parameter to be monitored 2. Recording Frequency 3. Recording Format4. Archive 5. Meter Calibration
Natural gas is supplied by Guangdong Dapeng Bay LNG through its pipeline from LNG terminal up to the power plant. Guangdong Dapeng Bay LNG has the necessary pressure regulation, conditioning and metering station at their gas supply terminal near power plant to ensure proper monitoring and quantification of gas intake in the power plant. LNG used in the gas turbine will be measured in the supplier’s terminal near power plant through a Daniel® Ultrasonic Flow Mete. Two ultrasonic flow meters will be installed in the supply terminal near power plant, one is master meter and another is for backup. These flow meters has an accuracy of 0.5% and will be calibrated in-site every month.
The power plant will use the gas turbine generator control system to monitor the accurate gas fuel flow and such data will be recorded daily for cross-verification with the data from gas supplier.The gas supplier will prepare a daily report to the power plant which includes the daily gas used and it relevant NCV.
Training Procedure
Specific training sessions regarding the operation and maintenance of measurement equipments will be organized to strengthen capacity of monitoring staff by equipment suppliers and Dapeng Bay LNG terminal. All the staff mentioned above will also participate training session on general operation and management issues in the context of the proposed project.
Emergency Preparedness for Unintended Emissions
91

PROJECT DESIGN DOCUMENT FORM (CDM PDD) - Version 03.1
CDM – Executive Board
The emergency plan for LNG leakage and fire has been prepared in line with “Safety Production Law of the People's Republic of China” and “Fire Prevention and Control of the People's Republic of China” to minimum damages as well as LNG emissions in the case of emergency. The plan has taken into effect since May 2006 and is available to be presented to DOE upon request.
B.8 Date of completion of the application of the baseline study and monitoring methodology and the name of the responsible person(s)/entity(ies)
The application of the baseline and monitoring methodology was completed on 29 Jan. 2006 by Global Climate Change Institute (GCCI) of Tsinghua University and Upper Horn Investments Ltd., Guangdong Yudean Group Co., Ltd.
The persons involved in baseline study are listed as follows:
Dr. Xiaohua ZHANG, Global Climate Change Institute, Tsinghua University.Address: Room C501, Energy Science Building, Tsinghua University, 100084, Beijing,
ChinaTelephone: +8610-62772757Email: [email protected]。(Not the project participants listed in Annex 1)
Dr. Fei TENG, Global Climate Change Institute, Tsinghua University.Address: Room C402, Energy Science Building, Tsinghua University, 100084, Beijing,
ChinaTelephone: +8610-62784805Email: [email protected](Not the project participants listed in Annex 1)
Ms. Qing TONG, Global Climate Change Institute, Tsinghua University.Address: Room C402, Energy Science Building, Tsinghua University, 100084, Beijing,
ChinaTelephone: +8610-62772753Email: [email protected](Not the project participants listed in Annex 1)
Mr. Hui Wang, Upper Horn Investments Ltd..Address: Room 4801,48/F Office Tower, Convention Plaza, 1 Harbour Road, Wanchai,
Hong KongTelephone: +8620-8513 8203Email: [email protected] .
92

PROJECT DESIGN DOCUMENT FORM (CDM PDD) - Version 03.1
CDM – Executive Board
SECTION C. Duration of the project activity / crediting period
C.1 Duration of the project activity:
C.1.1. Starting date of the project activity: >>23/09/2004
C.1.2. Expected operational lifetime of the project activity:>>20C.2 Choice of the crediting period and related information:
C.2.1. Renewable crediting period
C.2.1.1. Starting date of the first crediting period: >>01/01/2008
C.2.1.2. Length of the first crediting period:>>7 years
C.2.2. Fixed crediting period:
C.2.2.1. Starting date:>>Not applicable.
C.2.2.2. Length: >>Not applicable.
93

PROJECT DESIGN DOCUMENT FORM (CDM PDD) - Version 03.1
CDM – Executive Board
SECTION D. Environmental impacts>>D.1. Documentation on the analysis of the environmental impacts, including transboundary impacts: >>
The Environmental Assessment Report of the proposed project has been approved by the State Environmental Protection Administration of China.
The main environmental protection objectives of the proposed project are: marine environment, air environment, sound environment, and terrestrial and marine environment.
The impacts on the marine environment: During the construction period, the use and release of water will have temporary impacts on the marine environment, which will disappear after the completion of the construction. During the operation period, the waste water will be treated and reused, and only small amount (about 43m3/d) will be released, which will not have large effect on the marine environment.
The impacts on the air environment: Since the proposed project is a NG power plant, there will be no SO2 emissions. The NOx emissions of the proposed project will meet the requirement of China Air Environment Standard (GB3095-1996), which will not have large effect on the marine environment.
The impacts on the sound environment: The noise source during the construction and operation period of the proposed project will meet the requirement of Environmental Noise Standard (GB3096-93).
The impacts on the terrestrial and marine environment: The proposed project will not have large effect on the terrestrial environment. The water pump will lead to some amount of fish loss and the cooling water release will lead to slight temperature increase of the sea. If strict control measure was taken, the impacts on marine environment would be minimized.
In conclusion, the proposed project has no significant impacts on the environment.
D.2. If environmental impacts are considered significant by the project participants or the host Party, please provide conclusions and all references to support documentation of an environmental impact assessment undertaken in accordance with the procedures as required by the host Party:>>Not applicable, since the construction and operation of the proposed project have no significant environmental impacts.
94

PROJECT DESIGN DOCUMENT FORM (CDM PDD) - Version 03.1
CDM – Executive Board
SECTION E. Stakeholders’ comments>>
E.1. Brief description how comments by local stakeholders have been invited and compiled:>>The stakeholder comments were acquired through questionnaire investigation during the period of environment impact assessment for the proposed project. Totally 200 questionnaires were delivered, and 178 were received.
E.2. Summary of the comments received:>>No opposite comment was received. The summary of the comments is as follows:
Most people know the proposed project, and more than 92 percent people agree with the proposed project, while the remaining people have no comments on construction of the proposed project. To conclude, the public think that the construction of the proposed project is in line with the sustainable development strategy of China, while reasonable measures should be taken to protect the local environment, and economic compensate and career opportunities should be provided to the local residents. The detailed information could be found on the EIA report of the proposed project.35
E.3. Report on how due account was taken of any comments received:>>
There is no negative comment on development of the proposed project, therefore no adjustment on design, construction and operation of the proposed project was needed.
35 Chapter 12, EIA report of Guangdong Huizhou LNG Generation Project, May 1st ,2001.
95

PROJECT DESIGN DOCUMENT FORM (CDM PDD) - Version 03
CDM – Executive Board
Annex 1
CONTACT INFORMATION ON PARTICIPANTS IN THE PROJECT ACTIVITY
Organization: GuangDong Huizhou LNG Power Co.,LtdStreet/P.O.Box: Petrochemical Industrial Park of Daya Bay E & T Development Zone,
Huizhou, PRCBuilding: Huizhou LNG Power Plant administration buildingCity: HuizhouState/Region: Daya BayPostfix/ZIP: 516082Country: ChinaTelephone: +86752-5587058FAX: +86752-5587059E-Mail: [email protected]: http://www.lngphz.cnRepresented by: Huang ZhangxunTitle: Manager of Production and Business DepartmentSalutation: Mr.Last Name: HuangMiddle Name: /First Name: ZhangxunDepartment: /Mobile: +86-13927370891Direct FAX: +86752-5587059Direct tel: +86752-5587058Personal E-Mail: [email protected]
Organization: International Bank for Reconstruction and Development (IBRD) as a Trustee of the Netherlands Clean Development Mechanism Facility
Street/P.O.Box: 1818H StCity: Washington, DC
State/Region: District of ColumbiaPostfix/ZIP: 20433
Country: USATelephone: 202-458-1873
96

PROJECT DESIGN DOCUMENT FORM (CDM PDD) - Version 03
CDM – Executive Board
FAX: 202-522-7432E-Mail: [email protected] URL: www.carbonfinance.org
Represented by: Ms. Joelle ChassardTitle: Manager
Salutation: Ms.Last Name: Joelle
Middle Name:First Name: ChassardDepartment: Environment Department
Mobile:Direct FAX: 202-522-7432Direct tel: 202-458-1873
Personal E-Mail:
Organization: DNA of the Netherlands (VROM)Street/P.O.Box: Rijnstraat 8 30945Building:City: The HagueState/Region:Postfix/ZIP: 2500 GX Country: The NetherlandsTelephone: +310703393456FAX: +310703391306E-Mail: [email protected]:Represented by: Title: Director for International Environmental AffairsSalutation:Last Name: De JongeMiddle Name:First Name: Lex Department: International Environmental AffairsMobile:Direct FAX:Direct tel:Personal E-Mail: [email protected]
97

PROJECT DESIGN DOCUMENT FORM (CDM PDD) - Version 03
CDM – Executive Board
Annex 2
INFORMATION REGARDING PUBLIC FUNDING
There is no public fund involved in the proposed project.
98

PROJECT DESIGN DOCUMENT FORM (CDM PDD) - Version 03
CDM – Executive Board
Annex 3
BASELINE INFORMATION
Table A 3-1 Calculate the OM of Southern China Grid in 2003
Fuel Type Unit NCV Unit for NCV
EF(tC/TJ) OXID Guang
dongGuangxi
Guizhou yunnan CO2
Emission
A B C D E F GJ=(D+E+F+G)*A*B*C*4
4/12Raw Coal Mt 20908 MJ/t 25.8 1 44.9179 8.318
4 21.691
1 14.0527 175993455.05 Clean Coal Mt 26344 MJ/t 25.8 1 0.0005 1246.07 Other washed Mt 8363 MJ/t 25.8 1 0.3638 0.2037 448971.84 Coke
Mt 28435 MJ/t 25.8 1 0.005
13449.76 Coke Oven Gas Gm3 17354 kJ/m3 12.1 1 0.004 2968.31 Other Coal Gas Gm3 16970 kJ/m3 12.1 1 0.321 1.127 335797.81 Crude Oil Mt 41816 MJ/t 20.0 1 0.0685 210055.71 Gasoline Mt 43070 MJ/t 18.9 1 0.0002 596.95 Diesel Mt 42652 MJ/t 20.2 1 0.319 0.0076 1031759.27 Fuel Oil Mt 41816 MJ/t 21.1 1 6.2722 0.003 20301304.48 LPG Mt 50179 MJ/t 17.2 1 0.00 Refinery Gas Mt 46055 MJ/t 18.2 1 0.0285 87592.00 Natural Gas Mm3 38931 kJ/m3 15.3 1 0.00 Other petroleum products Mt 41816 MJ/t 20.0 1 0.1135 319357.98 Total a 198746555.
23Generation GWh b 143351 1707 43295 19055 222780
100

PROJECT DESIGN DOCUMENT FORM (CDM PDD) - Version 03
CDM – Executive Board
9Self Consumption rate c 5.50% 8.43
% 7.40% 8.01%Electricity delivered to Grid GWh d=b*(1-
c) 135467 15639 40091 17529 208726
The Calculation of OM:a : The total emissions of SCPG: 198746555.23 tCO2d: The electricity delivered to SCPG by thermal power plants: 208726 GWhe: The net import from CCPG to SCPG is 11100 MWh in 2003f: the average emission factor of CCPG is 0.7843 tCO2/MWhOM=(a+e*f)/(d+e/1000)*10-6=0.9522Data Sources:China Energy Statistical Yearbook 2004, China Statistics Press, 2005.China Electric Power Yearbook 2004, China Electric Power Press, 20042006 IPCC Guidelines for National Greenhouse Gas Inventories: Volume 2 Energy.
Table A 3-2 Calculate the OM of Southern China Grid in 2004
Fuel Type Unit NCVUnit for
NCVEF
(tC/TJ) OXID Guangdong
Guangxi
Guizhou
Yunnan
CO2 Emission
A B C D E F GJ=(D+E+F+G)*A*B*C*44
/12
Raw Coal Mt 20908 MJ/t 25.8 1 60.1770 13.05 26.439
2 17.512
8 231767573.55 Clean Coal Mt 26344 MJ/t 25.8 1 0.0021 5233.50 Other washed Mt 8363 MJ/t 25.8 1 0.00 Coke Mt 28435 MJ/t 25.8 1 0.00 Coke Oven Gas Gm3 17354 kJ/m3
12.1 1 0.00 Other Coal Gas Gm3 16970 kJ/m3
12.1 1 0.258 59831.38
101

PROJECT DESIGN DOCUMENT FORM (CDM PDD) - Version 03
CDM – Executive Board
Crude Oil Mt 41816 MJ/t 20.0 1 0.1689 517932.98 Gasoline Mt 43070 MJ/t 18.9 1 0.00 Diesel Mt 42652 MJ/t 20.2 1 0.4888 0.0183 1601975.28 Fuel Oil Mt 41816 MJ/t 21.1 1 9.5771 30983494.25 LPG Mt 50179 MJ/t 17.2 1 0.00 Refinery Gas Mt 46055 MJ/t 18.2 1 0.286 87899.34 Natural Gas Gm3 38931 kJ/m3 15.3 1 0.048 104833.40 Other petroleum products
Mt 41816 MJ/t 20.0 1 0.0166 46707.86
Total a 265175481.54
Generation GWh b 169389 20143 49720 24320 263572Self Consumption rate
c 5.42% 8.33% 7.06% 7.56%
Electricity delivered to Grid
GWh d=b*(1-c) 160208 18465 46210 22481 247364
The Calculation of OM:a : The total emissions of SCPG: 265175481.54 tCO2d: The electricity delivered to SCPG by thermal power plants: 247364 GWhe: The net import from CCPG to SCPG is 10951240 MWh in 2003f: the average emission factor of CCPG is 0.8274 tCO2/MWhOM=(a+e*f)/(d+e/1000)*10-6=1.0616Data Sources:China Energy Statistical Yearbook 2005, China Statistics Press, 2006.China Electric Power Yearbook 2005, China Electric Power Press, 20052006 IPCC Guidelines for National Greenhouse Gas Inventories: Volume 2 Energy.
Table A 3-3 Calculate the OM of Southern China Grid in 2005
Fuel TypeUnit NCV Unit
for EF
(tC/TJ)OXID Guan
gdongGuangxi
Guizhou
yunnan
CO2 Emission
102

PROJECT DESIGN DOCUMENT FORM (CDM PDD) - Version 03
CDM – Executive Board
NCV
A B C D E F GJ=(D+E+F+G)*A*B*C*4
4/12Raw Coal Mt 20908 MJ/t 25.8 1 66.964
7 14.35 32.1231
19.7555
263,442,602
Clean Coal Mt 26344 MJ/t 25.8 1 0.0015 3,738
Other washed Mt 8363 MJ/t 25.8 1 0.1039 0.3388 350,238
Coke Mt 28435 MJ/t 29.2 1 0.0479 0.0805 345,390
Coal Total 264,141,967
Crude Oil Mt 41816 MJ/t 20.0 1 0.1091 334,556Gasoline Mt 43070 MJ/t 18.9 1 0.0068 20,296
Diesel Mt 42652 MJ/t 20.2 1 0.3196 0.0202 0.0181 0
Fuel Oil Mt 41816 MJ/t 21.1 1 8.8721 1,130,639LPG Mt 50179 MJ/t 17.2 1 28,702,703Refinery Gas Mt 46055 MJ/t 18.2 1 0.0492 47,833
30,236,028Other petroleum products Mt 41816 MJ/t 20.0 1 0.017 203,115
Oil Total 58,624Natural Gas Gm3 38931 kJ/m3 15.3 1 0.093 413,486Coke Oven Gas Gm3 17354 kJ/m3 12.1 1 0.079 0
Other Coal Gas Gm3 16970 kJ/m312.1 1 0.187 1.59
6151,211
Gas Total 826,436
Total a 295,204,431
GenerationGWh b 17645
3 25023 58430 27281 287187
103

PROJECT DESIGN DOCUMENT FORM (CDM PDD) - Version 03
CDM – Executive Board
Self Consumption rate c 5.58% 7.95% 7.34
% 6.94%Electricity delivered to Grid GWh d=b*(1-
c)16660
7 23034 54141 25388 269170
The Calculation of OM:a : The total emissions of SCPG: 2952044731 tCO2d: The electricity delivered to SCPG by thermal power plants: 269170 GWhe: The net import from CCPG to SCPG is 96363000 MWh in 2003f: the average emission factor of CCPG is 0.7712 tCO2/MWhOM=(a+e*f)/(d+e/1000)*10-6=1.0109λcoal=89.48%λoil=10.24%λgas=0.28%Data Sources:China Energy Statistical Yearbook 2006, China Statistics Press, 2007.China Electric Power Yearbook 2006, China Electric Power Press, 20072006 IPCC Guidelines for National Greenhouse Gas Inventories: Volume 2 Energy.
Table A3-4 Calculate the Simple OM (3 year generation weighted average)Year 2002 Year 2003 Year 2004 OM
(tCO2/MWh)OM(tCO2/MWh) 0.9522 1.0616 1.0109 1.0119Electricity delivered (GWh)
208736.9 258317.47 365532.53
Table A3-5 Installed Capacity and generation of SCPG in 2005Guangdong Guangxi Yunan Guizhou Total
A B C D G=A+B+C+DThermal Capacity (MW) 35182.6 4931.2 4758.4 9634.8 54507Hydro Capacity (MW) 9035.7 6085.3 7993.1 7233 30347.1
Nuclear Capacity (MW) 3780 0 0 0 3780Other Capacity (MW) 83.4 0 0 0 83.4

PROJECT DESIGN DOCUMENT FORM (CDM PDD) - Version 03
CDM – Executive Board
Total Capacity (MW) 48081.7 11016.5 12751.5 16867.8 88717.5Data Sources:China Electric Power Yearbook 2006, China Electric Power Press, 2007
Table A3-6 Installed Capacity and generation of SCPG in 2004Guangdong Guangxi Yunnan Yunan Total
A B C D G=A+B+C+DThermal Capacity
(MW) 30172.9 4378.1 4306.9 7801.8 46659.7Hydro Capacity
(MW) 8584.6 5040.4 7058.6 6896.5 27580.1Nuclear Capacity
(MW) 3780 0 0 0 3780Other Capacity
(MW) 83.4 0 0 0 83.4Total Capacity
(MW) 42621 9418.5 11365.5 14698.3 78103.3Data Sources:China Electric Power Yearbook 2005, China Electric Power Press, 2006
Table A3-7 Installed Capacity and generation of SCPG in 2003Guangdong Guangxi Yunnan Guizhou Total
A B C D G=A+B+C+DThermal Capacity
(MW) 27231.4 3190.1 3556.8 6465.8 40444.1Hydro Capacity
(MW) 8107.2 4525.2 6543.2 6233.7 25409.3Nuclear Capacity
(MW) 3780 0 0 0 3780Other Capacity
(MW) 83.4 0 0 0 83.4Total Capacity
(MW) 39202 7715.3 10100 12699.5 69716.8
Data Sources:China Electric Power Yearbook 2002, China Electric Power Press, 2003
104

PROJECT DESIGN DOCUMENT FORM (CDM PDD) - Version 03
CDM – Executive Board
Table A3-8 Calculation of COEF
Fuel Efficiency (%) Carbon coefficient (tc/TJ) Oxidation factor EFadv (tCO2/MWh) A B C D=(3.6/(A*1000))*B*C*44/12
Coal 35.82% 25.8 1 0.9508
Gas 47.67% 15.3 1 0.4237Oil 47.67% 21.1 1 0.5843
Table A3-9 Calculation of BM in SCPG
Installed Capacity in year 2003
(MW)
Installed Capacity in year
2004 (MW)
Installed Capacity in year 2005 (MW)
Newly added capacity from
2003-2005(Build
Margin) (MW)
Share of new added capacity fuelled by fuel type i.
A B C D=C-AThermal Capacity 40444.1 46659.7 54507 14062.9 74.01%Hydro Capacity 25409.3 27580.1 30347.1 4937.8 25.99%
Nuclear Capacity 3780 3780 3780 0 0.00%Other Capacity 83.4 83.4 83.4 0 0.00%Total Capacity 69716.8 78103.3 88717.5 19000.7 100.00%Percentage as
installed capacity in 2004
78.58% 88.04% 100%
105 106

PROJECT DESIGN DOCUMENT FORM (CDM PDD) - Version 03
CDM – Executive Board

PROJECT DESIGN DOCUMENT FORM (CDM PDD) - Version 03
CDM – Executive Board
ANNEX 4
MONITORING INFORMATION
No additional information.- - - - -
107

Annex 11: Statement of Loans and Credits
CHINA: Huizhou Combined Cycle Gas Turbine Thermal Power Project
Difference BetweenExpected and
ActualOriginal Amount in US$ Millions Disbursements a/
Project ID Project Name FY IBRD IDA GRAN
TCancel
. Undisb. Orig. Frm Rev'd
P087318 CN--GEF-Guangxi Integrated Forestry Dev.
2007 0.00 5.25
5.25 0.12
P086515 CN-3rd National Railway
2007
200.00
200.00 10.67
P091020 CN-Fujian Highway Sector Investment
2007
320.00
320.00 30.00
P090377 CN-GEF-2nd Shandong Environment
2007 5.35
0.01
4.50
P090375 CN-GEF-Liaoning
2007 5.00
P081776 CN-GUANGDONG/PRD2
2007
96.00
96.00 3.67
P088964 CN-Guangxi Integrated Forestry Dev
2007
100.00
92.00
(6.67)
P092618 CN-LIAONING MED CITIES INFRAS 2
2007
173.00
173.00
P096285 CN-MSE Finance
2007
100.00
100.00 62.67
P077752 CN-SHANDONG ENVMT 2
2007
147.00
147.00 3.33
P083322 CN-SICHUAN URBAN DEV
2007
180.00
171.99 15.99
P075613 CN-Shaanxi Ankang Road Development
2007
300.00
300.00 7.70
P095315 CN-W. Region Rural Water & Sanitation
2007
25.00
25.00
P093906 CN-3rd Jiangxi Hwy
2006
200.00
175.87 0.87
P085333 CN-5th Inland Waterways
2006
100.00
68.70 19.37
P081255 CN-Changjiang/Pearl River Watershed Reha
2006
100.00
97.75 15.08
P085124 CN-Ecnomic Reform Implementation
2006
20.00
18.44 2.61
P070519 CN-Fuzhou Nantai Island Peri-Urban Dev
2006
100.00
99.75 19.75
P090336 CN-GEF-NINGBO WATER & ENVMT
2006 5.25
4.50 0.42
P082993 CN-GEF-PCB Mgnt & Disposal
2006 18.34
17.57 7.73
P082992 CN-GEF-Termite Control Demonstration
2006 14.36
14.36 0.87
P081348 CN-HENAN TOWNS WATER
2006
150.00
149.63 17.13
P086629 CN-Heilongjiang Dairy
2006
100.00
94.64 11.81
P084742 CN-IAIL III
2006
200.00
129.02 16.95
P099992 CN-Liaoning Medium Cities Infrastructure
2006
218.00
190.41
(9.26)
P096158 CN-Renewable Energy II (CRESP II)
2006
86.33
72.67 26.48
P075732 CN-SHANGHAI URBAN APL2
2006
180.00
146.64 9.98
P069862 CN - Agricultural Technology Transfer
2005
100.00
78.24 31.14
108

P071094 CN - Poor Rural Communities Development
2005
100.00
80.44 45.54
P081161 CN-CHONGQING SMALL CITIES
2005
180.00
162.73 47.46
P072721 CN-GEF-Heat Reform & Bldg Egy Eff.
2005 18.00
14.95 4.32
P067625
CN-GEF-Renewable Energy Scale-Up Program
2005 40.57
37.67
P075730 CN-HUNAN URBAN DEV
2005
172.00
160.06 52.40
P068752 CN-Inner Mongolia Highway & Trade Corrid
2005
100.00
51.55
(5.11)
P081346 CN-LIUZHOU ENVIRONMENT MGMT
2005
100.00
73.81 6.31
P086505 CN-NINGBO WATER & ENVMT
2005
130.00
96.45
(1.55)
P067828 CN-Renewable Energy Scale-up Program
2005
87.00
10.00
7.88 12.88
P057933 CN-TAI BASIN URBAN ENVMT
2005
61.00
34.18 18.03
P075035 CN - GEF-Hai Basin Integr. Wat. Env.Man.
2004 17.00
11.07 4.93
P075602 CN-2nd National Railways (Zhe-Gan Line)
2004
200.00
1.00
2.47
(23.19)
(24.19)
P077137 CN-4th Inland Waterways
2004
91.00
0.46
57.55 28.34 27.84
P073002 CN-Basic Education in Western Areas
2004
100.00
38.37 35.39
Difference BetweenExpected and
ActualOriginal Amount in US$ Millions Disbursements a/
Project ID Project Name FY IBRD IDA GRAN
TCancel
. Undisb. Orig. Frm Rev'd
P084003 CN-GEF GUANGDONG PRD URB ENV
2004 10.00
9.70 5.43
P077615 CN-GEF-Gansu & Xinjiang Pastoral Develop
2004 10.50
5.91 3.74
P075728 CN-GUANGDONG/PRD UR ENVMT
2004
128.00
0.64
74.58 15.69
P065035 CN-Gansu & Xinjiang Pastoral Development
2004
66.27
26.15 13.77
P081749 CN-Hubei Shiman Highway
2004
200.00
1.00
11.05
(14.61)
P065463 CN-Jiangxi Integrated Agric. Modern.
2004
100.00
61.14 33.79
P069852 CN-Wuhan Urban Transport
2004
200.00
1.00
82.38 79.60
P066955 CN-ZHEJIANG URBAN ENVMT
2004
133.00
90.34 36.70
P076714 CN-2nd Anhui Hwy
2003
250.00
51.25 17.92
P067337 CN-2nd GEF Energy Conservation
2003 26.00
7.17 7.00
P058847 CN-3rd Xinjiang Hwy Project
2003
150.00
19.16 17.82
P070441 CN-Hubei Xiaogan Xiangfan Hwy
2003
250.00
19.25 19.25
P070191 CN-SHANGHAI URB ENVMT APL1
2003
200.00
88.67 50.27
P040599 CN-TIANJIN URB DEV II
2003
150.00
128.76 76.29 3.33
P068058 CN-Yixing Pumped Storage Project
2003
145.00
49.77 36.71
P060029 CN-GEF-Sustain. Forestry Dev
2002 16.00
5.91 4.31
P068049 CN-Hubei Hydropower Dev in Poor Areas
2002
105.00
13.44 10.77
109

P070459 CN-Inner Mongolia Hwy Project
2002
100.00
14.15 7.15
P058846 CN-Natl Railway Project
2002
160.00
5.00
1.56 6.56
P064729 CN-Sustainable Forestry Development
2002
93.90
20.14 12.92
P071147 CN-Tuberculosis Control Project
2002
104.00
43.58 28.20
P056199 CN-3rd Inland Waterways
2001
100.00
7.67 6.17
P047345 CN-HUAI RIVER POLLUTION CONTROL
2001
105.50
14.80 14.80
(0.98)
P051859 CN-LIAO RIVER BASIN
2001
100.00
14.47 13.84
P056596 CN-Shijiazhuang Urban Transport
2001
100.00
46.04 46.04
P045915 CN-Urumqi Urban Transport
2001
100.00
32.17 32.17
P042109 CN-BEIJING ENVIRONMENT II
2000
349.00
26.51
157.95 184.46 7.55
P049436 CN-CHONGQING URBAN ENVMT
2000
200.00
29.50
57.42 86.92 16.58
P064924 CN-GEF-BEIJING ENVMT II
2000 25.00
19.12 19.12 3.94
P045910 CN-HEBEI URBAN ENVIRONMENT
2000
150.00
33.78 33.78 9.07
P056424 CN-Tongbai Pumped Storage
2000
320.00
100.00
27.76 132.96 5.51
P064730 CN-Yangtze Dike Strengthening
2000
210.00
68.20 68.20 40.53
P051856 CN-Accounting Reform & Development
1999
27.40
5.61
6.18 6.03 4.92
P038121 CN-GEF-Renewable Energy Development
1999 27.00
5.97 13.74 7.86
P036953 CN-Health IX
1999
10.00
50.00
0.40
13.01 11.59 11.59
P042299 CN-Tec Coop Credit IV
1999
10.00
35.00
5.84
11.49 14.97
P039838 CN ODS IV PHASE OUT PRJ
1998 440.35
0.10
106.00 5.35
(69.74)
P036414 CN-GUANGXI URBAN ENVMT
1998
72.00
20.00
13.48
12.39 25.23 4.56
P003614 CN-Guangzhou City Transport
1998
200.00
20.00
44.79 64.79 44.79
P003539 CN-Sustainable Coastal Resources Dev.
1998
100.00
2.06
10.50 12.56 10.50
P003409 CN THIRD ODS PHASE OUT
1995 120.10
31.59 23.25 20.17
Overall Result 9,205.40
110.61 804.07
217.00
5,367.48 1,805.65 123.82
110

CHINASTATEMENT OF IFC’s
Committed and Disbursed Outstanding Investment Portfolio(In USD Millions)
Committed Disbursed Outstanding
FY Approval Company Loan Equity
**Quasi Equity
*GT/RM
Partici pant Loan Equity
**Quasi Equity
*GT/RM
Partici pant
2007 Aier medical 8.52 0.00 0.00 0.00 0.00 8.52 0.00 0.00 0.00 0.002002/06 Asimco 0.00 7.61 4.32 0.00 0.00 0.00 7.61 4.32 0.00 0.002005 Babei 0.00 5.00 0.00 0.00 0.00 0.00 5.00 0.00 0.00 0.00
Babei necktie 8.00 0.00 0.00 0.00 4.36 8.00 0.00 0.00 0.00 4.361999/00/02 Bank of shanghai 0.00 50.27 0.00 0.00 0.00 0.00 50.27 0.00 0.00 0.002005 Bccb 0.00 59.22 0.00 0.00 0.00 0.00 59.03 0.00 0.00 0.002005 Biochina 0.00 4.65 0.00 0.00 0.00 0.00 4.33 0.00 0.00 0.002008 Bioveda china ii 0.00 10.00 0.00 0.00 0.00 0.00 0.00 0.00 0.00 0.002006 Bufh 8.63 0.00 0.00 0.00 0.00 8.63 0.00 0.00 0.00 0.002006 Capital today 0.00 25.00 0.00 0.00 0.00 0.00 5.63 0.00 0.00 0.002002 Cdh china fund 0.00 2.02 0.00 0.00 0.00 0.00 1.02 0.00 0.00 0.002005 Cdh china ii 0.00 17.99 0.00 0.00 0.00 0.00 15.98 0.00 0.00 0.002006 Cdh venture 0.00 20.00 0.00 0.00 0.00 0.00 8.45 0.00 0.00 0.002007 Century sunshine 15.97 0.00 0.00 0.00 0.00 15.97 0.00 0.00 0.00 0.002005 Changyu group 0.00 18.07 0.00 0.00 0.00 0.00 18.07 0.00 0.00 0.001998 Chengdu huarong 2.24 3.20 0.00 0.00 1.56 2.24 3.20 0.00 0.00 1.562007 China glass 0.00 11.31 0.00 0.00 0.00 0.00 11.31 0.00 0.00 0.002004 China green ener 18.13 0.00 0.00 0.00 0.00 18.13 0.00 0.00 0.00 0.001994 China walden mgt 0.00 0.01 0.00 0.00 0.00 0.00 0.01 0.00 0.00 0.002006 Chinasoft 0.00 0.00 15.00 0.00 0.00 0.00 0.00 10.00 0.00 0.002004 Colony china 0.00 9.30 0.00 0.00 0.00 0.00 6.94 0.00 0.00 0.002004 Colony china gp 0.00 0.42 0.00 0.00 0.00 0.00 0.33 0.00 0.00 0.002006 Conch 86.49 0.00 0.00 0.00 0.00 86.49 0.00 0.00 0.00 0.002004 Cuna mutual 0.00 10.53 0.00 0.00 0.00 0.00 0.00 0.00 0.00 0.002007 Dac 0.00 30.00 0.00 0.00 0.00 0.00 12.00 0.00 0.00 0.002002 Darong 9.76 0.00 0.00 0.00 7.74 6.43 0.00 0.00 0.00 5.072006 Deqingyuan 0.00 1.75 0.00 0.00 0.00 0.00 1.75 0.00 0.00 0.002007 Dongyue 0.00 15.73 0.00 0.00 0.00 0.00 15.73 0.00 0.00 0.000 Dongyue silicon 25.00 0.00 0.00 0.00 25.00 25.00 0.00 0.00 0.00 25.001994 Dynamic fund 0.00 1.32 0.00 0.00 0.00 0.00 1.12 0.00 0.00 0.002007 Epure 0.00 9.22 0.00 0.00 0.00 0.00 9.22 0.00 0.00 0.002008 Feec 0.00 12.17 0.00 0.00 0.00 0.00 12.17 0.00 0.00 0.002004 Fenglin 11.36 0.00 6.00 4.00 10.03 11.36 0.00 6.00 0.00 10.032006 Fenglin hj mdf 0.21 0.00 0.00 0.00 3.05 0.21 0.00 0.00 0.00 3.052007 Fosun intnl 42.58 0.00 0.00 0.00 0.00 42.58 0.00 0.00 0.00 0.002006 Gdih 53.96 0.00 0.00 0.00 0.00 53.96 0.00 0.00 0.00 0.002007 Gds china 0.00 5.00 0.00 0.00 0.00 0.00 5.00 0.00 0.00 0.002003 Great infotech 0.00 0.70 0.00 0.00 0.00 0.00 0.00 0.00 0.00 0.002006 Hangzhou rcb 0.00 11.29 0.00 0.00 0.00 0.00 11.22 0.00 0.00 0.00
111

06/08/2005 Hisoft tech 0.00 11.84 0.00 0.00 0.00 0.00 11.84 0.00 0.00 0.002004 Ib 0.00 52.18 0.00 0.00 0.00 0.00 52.18 0.00 0.00 0.002004 Jiangxi chenming 40.00 12.79 0.00 0.00 0.00 40.00 12.79 0.00 0.00 0.000 Jiuda holding 0.00 15.00 0.00 0.00 0.00 0.00 15.00 0.00 0.00 0.002006 Launch tech 0.00 7.99 0.00 0.00 0.00 0.00 7.97 0.00 0.00 0.002001/05 Maanshan carbon 14.75 3.00 0.00 0.00 0.00 8.75 3.00 0.00 0.00 0.002005 Minsheng 14.29 0.00 0.00 0.00 0.00 14.29 0.00 0.00 0.00 0.002004 Nanjing kumho 26.15 0.00 0.00 0.00 0.00 26.15 0.00 0.00 0.00 0.002001/07 Nccb 48.70 8.95 0.00 0.00 0.00 48.70 8.82 0.00 0.00 0.002006 Neophotonics 0.00 0.00 10.00 0.00 0.00 0.00 0.00 10.00 0.00 0.002001 New china life 0.00 1.55 0.00 0.00 0.00 0.00 1.55 0.00 0.00 0.002008 Newauto 0.00 0.00 10.00 0.00 0.00 0.00 0.00 0.00 0.00 0.001995 Newbridge inv. 0.00 0.22 0.00 0.00 0.00 0.00 0.22 0.00 0.00 0.002005 North andre 8.00 1.92 0.00 0.00 0.00 0.00 1.92 0.00 0.00 0.002008 Orient fortune 0.00 44.84 0.00 11.18 0.00 0.00 0.00 0.00 0.00 0.002003 Psam 0.00 2.13 0.00 0.00 0.00 0.00 0.00 0.00 0.00 0.000 Rak china 11.82 0.00 0.00 0.00 0.00 11.82 0.00 0.00 0.00 0.002006 Renaissance sec 0.00 0.00 21.01 0.00 0.00 0.00 0.00 9.64 0.00 0.002008 Rjvc 0.00 5.70 0.00 0.00 0.00 0.00 0.00 0.00 0.00 0.002006 Rongde 0.00 35.00 0.00 0.00 0.00 0.00 32.58 0.00 0.00 0.000 Sac hk holding 0.00 1.60 0.00 0.00 0.00 0.00 1.60 0.00 0.00 0.002003 Saic 9.60 0.00 0.00 0.00 0.00 9.60 0.00 0.00 0.00 0.002006 Sbcvc 0.00 20.00 0.00 0.00 0.00 0.00 8.00 0.00 0.00 0.002000 Seaf ssif 0.00 3.48 0.00 0.00 0.00 0.00 3.10 0.00 0.00 0.001998 Shanghai krupp 15.75 0.00 0.00 0.00 26.25 15.75 0.00 0.00 0.00 26.252006 Shanshui group 50.00 5.50 2.20 0.00 0.00 50.00 5.50 2.20 0.00 0.001999 Shanxi 12.61 0.00 0.00 0.00 0.00 12.61 0.00 0.00 0.00 0.002004 Shct 34.36 0.00 0.00 0.00 25.77 30.65 0.00 0.00 0.00 22.990/06 Stora enso 100.00 0.00 0.00 0.00 200.00 63.00 0.00 0.00 0.00 70.502006 Tbk 4.00 0.00 0.00 0.00 0.00 2.00 0.00 0.00 0.00 0.002007 Tianrui cement 50.00 11.00 0.00 0.00 0.00 35.00 11.00 0.00 0.00 0.002006 Verisilicon 0.00 1.00 0.00 0.00 0.00 0.00 1.00 0.00 0.00 0.000 Wanjie high-tech 9.89 0.00 0.00 0.00 0.00 9.89 0.00 0.00 0.00 0.002007 Weigao 20.00 0.00 0.00 0.00 0.00 0.00 0.00 0.00 0.00 0.002004 Wumart 0.00 1.62 0.00 0.00 0.00 0.00 1.62 0.00 0.00 0.002003 Xacb 0.00 18.38 0.00 0.00 0.00 0.00 0.00 0.00 0.00 0.002007 Xinao chemicals 40.00 0.00 0.00 0.00 128.00 17.26 0.00 0.00 0.00 55.242004 Xinao gas 17.50 10.00 0.00 0.00 0.00 17.50 10.00 0.00 0.00 0.000 Xinneng holding 0.00 10.00 0.00 0.00 0.00 0.00 4.37 0.00 0.00 0.002006 Zhejiang glass 50.00 21.48 0.00 0.00 18.00 44.12 21.46 0.00 0.00 15.882003 Zhengye-adc 9.85 0.00 0.00 0.00 4.60 9.85 0.00 0.00 0.00 4.602002 Zhong chen 0.00 4.78 0.00 0.00 0.00 0.00 4.78 0.00 0.00 0.002006 Zhongda_yanjin 24.27 0.00 0.00 0.00 0.00 19.77 0.00 0.00 0.00 0.00
Total Portfolio: 902.39 653.73 68.53 15.18 454.36 774.23 485.69 42.16 0.00 244.53
* Denotes Guarantee and Risk Management Products.** Quasi Equity includes both loan and equity types.
112

Annex 12: Country at a Glance
CHINA: Huizhou Combined Cycle Gas Turbine Thermal Power Project
China at a glance 9/28/07
East Lower-POVERTY and SOCIAL Asia & middle-
China Pacific income2006Population, mid-year (millions) 1,311.8 1,900 2,276GNI per capita (Atlas method, US$) 2,000 1,863 2,037GNI (Atlas method, US$ billions) 2,623.6 3,539 4,635
Average annual growth, 2000-06
Population (%) 0.6 0.9 0.9Labor force (%) 1.0 1.3 1.4
Most recent estimate (latest year available, 2000-06)
Poverty (% of population below national poverty line) .. .. ..Urban population (% of total population) 41 42 47Life expectancy at birth (years) 72 71 71Infant mortality (per 1,000 live births) 23 26 31Child malnutrition (% of children under 5) 8 15 13Access to an improved water source (% of population) 77 79 81Literacy (% of population age 15+) 91 91 89Gross primary enrollment (% of school-age population) 113 114 113 Male 113 115 117 Female 112 113 114
KEY ECONOMIC RATIOS and LONG-TERM TRENDS
1986 1996 2005 2006
GDP (US$ billions) 295.7 856.1 2,243.9 2,644.7Gross capital formation/GDP 38.6 40.4 43.9 44.6Exports of goods and services/GDP 11.8 20.1 37.3 40.1Gross domestic savings/GDP 35.8 42.5 49.4 52.5Gross national savings/GDP 35.9 41.3 51.0 54.1
Current account balance/GDP -2.8 0.8 7.2 9.4Interest payments/GDP 0.2 0.5 0.1 ..Total debt/GDP 8.0 15.0 12.6 ..Total debt service/exports 8.2 8.7 3.0 ..Present value of debt/GDP .. .. 12.3 ..Present value of debt/exports .. .. 30.6 ..
1986-96 1996-06 2005 2006 2006-10(average annual growth)GDP 10.1 9.0 10.4 10.7 10.6GDP per capita 8.6 8.2 9.7 10.1 9.9Exports of goods and services 10.0 21.8 24.3 23.3 17.4
STRUCTURE of the ECONOMY1986 1996 2005 2006
(% of GDP)Agriculture 27.1 19.5 12.5 11.7Industry 44.0 47.5 47.5 48.4 Manufacturing 35.2 33.5 33.5 ..Services 28.9 33.0 39.9 39.9
Household final consumption expenditure 49.3 43.5 36.1 33.2General gov't final consumption expenditure 14.9 14.0 14.5 14.3Imports of goods and services 14.7 18.0 31.7 32.2
1986-96 1996-06 2005 2006(average annual growth)Agriculture 4.3 3.5 5.2 5.0Industry 13.5 10.1 11.7 12.5 Manufacturing 12.8 10.2 12.1 ..Services 9.4 9.8 10.5 10.3
Household final consumption expenditure 10.9 7.8 5.8 6.3General gov't final consumption expenditure 10.4 9.5 11.6 10.9Gross capital formation 11.9 10.2 11.6 13.2Imports of goods and services 11.9 18.5 11.4 14.3
Note: 2006 data are preliminary estimates.This table was produced from the Development Economics LDB database.* The diamonds show four key indicators in the country (in bold) compared with its income-group average. If data are missing, the diamond will be incomplete.
0
5
10
15
20
01 02 03 04 05 06
GCF GDP
Growth of capital and GDP (%)
0
10
20
30
40
01 02 03 04 05 06Exports Imports
Growth of exports and imports (%)
China
Lower-middle-income group
Development diamond*
Life expectancy
Access to improved water source
GNIpercapita
Grossprimary
enrollment
ChinaLower-middle-income group
Economic ratios*
Trade
Indebtedness
Domesticsavings
Capital formation
113

China
PRICES and GOVERNMENT FINANCE1986 1996 2005 2006
Domestic prices(% change)Consumer prices .. 8.3 1.8 1.5Implicit GDP deflator 4.6 6.4 4.2 3.6
Government finance(% of GDP, includes current grants)Current revenue 0.0 10.5 17.2 18.4Current budget balance -17.7 0.2 2.4 3.0Overall surplus/deficit -24.8 -1.4 -1.3 -0.7
TRADE1986 1996 2005 2006
(US$ millions)Total exports (fob) 30,942 151,048 761,999 969,073 Food 4,448 10,231 22,481 25,722 Mineral fuels, lubricants, and related materials 3,683 5,931 17,621 17,776 Manufactures 19,670 129,123 712,960 916,147Total imports (cif) 42,904 138,833 660,118 791,614 Food 1,625 5,672 9,388 9,997 Fuel and energy 504 6,877 63,957 89,002 Capital goods 16,781 54,763 290,628 357,107
Export price index (2000=100) 59 122 104 107Import price index (2000=100) 76 108 118 124Terms of trade (2000=100) 77 113 88 87
BALANCE of PAYMENTS1986 1996 2005 2006
(US$ millions)Exports of goods and services 34,952 171,678 836,888 1,061,681Imports of goods and services 43,453 154,127 712,090 852,769Resource balance -8,501 17,551 124,798 208,912
Net income -23 -12,437 10,635 11,755Net current transfers 378 2,129 25,385 29,200
Current account balance -8,146 7,243 160,818 249,867
Financing items (net) 6,419 24,462 46,198 -2,842Changes in net reserves 1,727 -31,705 -207,016 -247,025
Memo:Reserves including gold (US$ millions) .. 111,717 831,427 1,046,465Conversion rate (DEC, local/US$) 3.5 8.3 8.2 8.0
EXTERNAL DEBT and RESOURCE FLOWS1986 1996 2005 2006
(US$ millions)Total debt outstanding and disbursed 23,719 128,817 281,612 .. IBRD 965 7,616 11,140 11,415 IDA 774 7,579 9,741 9,997
Total debt service 2,973 15,756 27,361 .. IBRD 66 840 1,139 1,443 IDA 8 73 296 316
Composition of net resource flows Official grants 155 245 332 .. Official creditors 1,165 4,401 844 .. Private creditors 3,693 6,454 5,144 .. Foreign direct investment (net inflows) 1,875 40,180 79,127 .. Portfolio equity (net inflows) 0 0 20,346 ..
World Bank program Commitments 1,120 1,900 1,277 0 Disbursements 607 2,097 1,131 1,170 Principal repayments 0 364 1,004 1,144 Net flows 607 1,734 127 27 Interest payments 75 549 430 615 Net transfers 532 1,185 -303 -588
Note: This table was produced from the Development Economics LDB database. 9/28/07
0
5
10
00 01 02 03 04 05 06
Current account balance to GDP (%)
0
250,000
500,000
750,000
1,000,000
1,250,000
00 01 02 03 04 05 06
Exports Imports
Export and import levels (US$ mill.)
-2
0
2
4
6
8
01 02 03 04 05 06
GDP deflator CPI
Inflation (%)
G: 148,267
A: 11,140
D: 5,532B: 9,741
F: 81,113
E: 25,819
A - IBRDB - IDA C - IMF
D - Other multilateralE - BilateralF - PrivateG - Short-term
Composition of 2005 debt (US$ mill.)
114

Annex 13: Map
CHINA: Huizhou Combined Cycle Gas Turbine Thermal Power Project
115