project 2: atm’s & queues
DESCRIPTION
Project 2: ATM’s & Queues. ATM’s & Queues. Certain business situations require customers to wait in line for a service Examples: Waiting to use an ATM machine Paying for groceries at the supermarket A line of people or objects is called a “queue”. ATM’s & Queues. - PowerPoint PPT PresentationTRANSCRIPT

Project 2: ATM’s & Queues

ATM’s & Queues
Certain business situations require customers to wait in line for a service
Examples: Waiting to use an ATM machine Paying for groceries at the supermarket
A line of people or objects is called a “queue”

ATM’s & Queues
Queues occur in many places:
Running multiple programs on a computer A print queue is formed when many documents
are sent to the printer Telephone calls on a switchboard Vehicles waiting at a traffic light
ATM’s & Queues Studying how these lines form and how to manage
them is called Queuing Theory
Queuing Theory has become an important tool in business decisions regarding quality and expense of customer service
Example: Supermarket manager sees checkout lines are too long, so more cashiers are called to work the registers, but this costs more money

ATM’s & Queues
Automated services make queue theory important when direct monitoring of service isn’t possible Example:
Bank manager can’t monitor ATM machine service at mid-night.
Opening up more machines might improve customer service but may cost a lot of money

ATM’s & Queues
Managing queues is a balancing act:
Customer Satisfaction
$$$$$$$$$$$$$$$$$$

ATM’s & Queues
Two Queue Models
Standard Queue
Serpentine Queue

ATM’s & Queues Standard Queue
Customers select what they believe to be the shortest or most rapidly moving line from individual queues at several stations.
This model is used at most supermarkets.

ATM’s & Queues Serpentine Model
Customers form a single line, and advance to the front to get their service.
Used at most airline ticket counters and in many post offices

ATM’s & Queues
Analyzing how to manage queues often uses computer simulation
Two types of Simulation
Monte Carlo
Bootstrapping

ATM’s & Queues
Monte Carlo Simulation
Sample data is used to estimate the actual probability distribution of some random variable.
This theoretical distribution is then used to generate new samples.

ATM’s & Queuing
Bootstrapping
When the data does not indicate any known theoretical probability distribution, we can simulate new data by random sampling from the original data

ATM’s & Queues
Class Project
The People’s Bank has 3 ATM’s At least one ATM is available 24 hours a day 7
days a week Bank manager has records of ATM usage and
customer service times for 5 weeks

ATM’s & Queues Mean numbers of customers arriving for ATM
usage during every hour of the week is contained in Queue Data.xls.
The complete arrival data for the 9:00 a.m. and 9:00 p.m. hours on Fridays are shown in that file as well.
These hours happen to be the bank’s busiest days of service.

ATM’s & Queues We will study the queues for the ATM’s during:
The 9:00am hour on Friday The 9:00pm hour on Friday
The starting and ending times of ATM service were recorded for each arriving customer.
Data for these service times during the first week of record keeping are shown in Queue Data.xls.

ATM’s & Queues Bank manager wants to avoid long wait times, long
queue lengths, and do this using the least number of ATM’s
The bank manager would like to know what level of service to provide for managing the queues based on:
Services Times for individual customers The number of customers waiting to be served
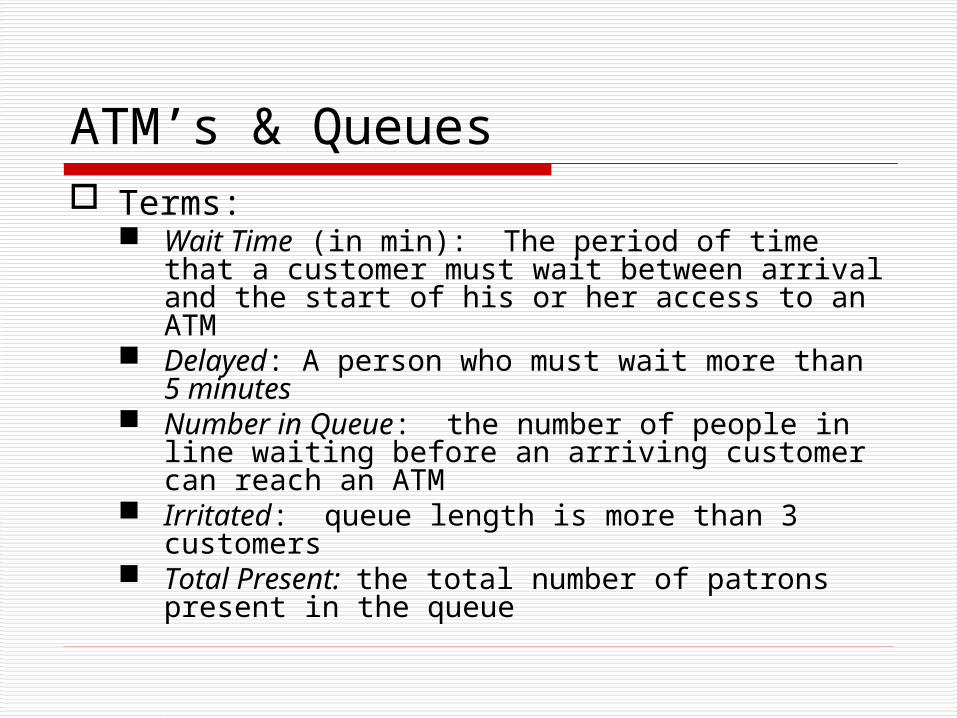
ATM’s & Queues Terms:
Wait Time (in min): The period of time that a customer must wait between arrival and the start of his or her access to an ATM
Delayed: A person who must wait more than 5 minutes Number in Queue: the number of people in line waiting
before an arriving customer can reach an ATM Irritated: queue length is more than 3 customers Total Present: the total number of patrons present in the
queue

ATM’s & Queues
The bank manager is looking at three advertising claims for service times: (Mean Wait Claim) The mean waiting time is at
most 1 minute. (Maximum Wait Claim) No one will wait more than
12 minutes. (Percent Delayed Claim) At most 5% of the
customers will be delayed (wait more than 5 minutes)

ATM’s & Queues The bank manager is also looking at three advertising
claims for the number of customers waiting in line: (Mean Queue Claim) The mean number of people in the
queue will not exceed 8. (Percent Irritated Claim) At most 2% of the
customers will be irritated (find more than 3 people in line or waiting to be served).
(Maximum Present Claim) The total number present will never exceed 10.

ATM’s & Queues
Project Assumptions: No one is using an ATM or waiting for a machine at
the start of the hour.
Service times for each ATM have the same distribution as sampled in Week 1 Service Times in the sheet Data of Queue Data.xls.

ATM’s & Queues Project Assumptions (cont)
The time until the first arrival and the times between arrivals of customers have the same distribution.
In the standard queuing model, if more than one ATM is open, arriving customers enter the shortest of the existing queues. If two or more queues are the same length, a customer selects a queue at random.

ATM’s & Queues Objectives:
Based only on 9 a.m. hour on Fridays, how many ATM’s should be opened and what queuing model should be used to validate each advertising claim during 9-10 a.m. period?
Based only on 9 p.m. hour on Fridays, how many ATM’s should be opened and what queuing model should be used to validate each advertising claim during 9-10 p.m. period?
NOTE: We only consider the use of a serpentine model when three ATM’s are in use

ATM’s & Queues Objectives (cont)
Finding the hourly cost of a gift certificate program for 3 ATM’s Serpentine:
If a serpentine queue is used, customers don’t physically stand in a line because the bank currently uses a number dispenser and service indicator that gives customers slips of paper indicating their position in the queue.

ATM’s & Queues Objectives (cont)
Finding the cost of gift certificate program (cont)
Bank is considering updating to a system that stamps the arrival time of a customer which could be used to document a customer’s wait time
The hourly cost for such an upgrade (maintenance, purchase price, etc.) is $20

ATM’s & Queues Objectives
Finding the cost of the gift certificate program (cont)
A $25 gift to any customer who is delayed (waits more than 5 minutes).
What is the expected hourly cost of such a plan? How would this change if it is estimated that only 60% of eligible customers would decide to claim the gift?

ATM’s & Queues Team Data will be posted on class web page
Data includes
historical records of ATM service times and customer arrival times for two hours out of each week
Parameters for six potential advertising strategies. Mean Wait Claim Maximum Wait Claim Percent Delayed Claim Mean Queue Claim Percent Irritated Claim Maximum Present Claim

ATM’s & Queues
Team Data will be posted after Spring Break
Team Preliminary Report Date: Monday March 31st, 2008