progressive collapse analysis with various lateral load
TRANSCRIPT

SSRG International Journal of Civil Engineering Volume 8 Issue 5, 35-44, May 2021 ISSN: 2348 – 8352 /doi:10.14445/23488352/IJCE-V8I5P104 ©2021 Seventh Sense Research Group®
This is an open access article under the CC BY-NC-ND license (http://creativecommons.org/licenses/by-nc-nd/4.0/)
Progressive Collapse Analysis with Various
Lateral Load Resisting Systems
Vaidehi J. Patel#1, Snehal V. Mevada#2 and Sumant B. Patel#3
#1PG Research Scholar, Structural Engineering Department, Birla Vishvakarma Mahavidyalaya Engineering
College, Vallabh Vidyanagar, Anand, Gujarat, India
#2Assistant Professor, Structural Engineering Department, Birla Vishvakarma Mahavidyalaya Engineering
College, Vallabh Vidyanagar, Anand, Gujarat, India
#3Associate Professor, Structural Engineering Department, Birla Vishvakarma Mahavidyalaya Engineering College, Vallabh Vidyanagar, Anand, Gujarat, India
Received Date: 16 April 2021 Revised Date: 23 May 2021 Accepted Date: 29 May 2021
Abstract - In this study, the progressive collapse potential of
10 storey reinforced concrete building with lateral load
resisting systems are investigated. Two lateral load resisting system is considered named as bracing, and shear wall and
their performance are compared with those of reinforced
concrete building without lateral load resisting system with
the same design load and seismic parameters. Linear static
analysis and nonlinear static analysis (pushdown analysis)
are carried out for different ground-story column removal
cases. According to the linear static analysis result,
members of both lateral load resisting systems have Demand
Capacity Ratio values under permissible limit except RC
building with the shear wall has not under the permissible
limit of 2 for two cases. Pushdown analysis results show
that all three types of structure have sufficient strength to resist progressive collapse. RC building with Bracing gives
the better result as compared to the shear wall with reduced
size of column for all cases.
Keywords — Progressive collapse, Alternate path method,
Demand Capacity Ratio, Lateral Load Resisting System.
I. INTRODUCTION The term “progressive collapse” is used in structural
engineering to describe the spread of an initial local failure in
a similar manner to a chain reaction from local damage to
one or more structural elements that leads to the partial or
total collapse of a building. General Service Administration
(GSA) defined progressive collapse as “an extent of damage
or collapse that is disproportionate to the magnitude of the
initiating event.” The progressive collapse might happen in a
building when the structure is exposed to unexpected
loadings beyond the design constraints of the building and occurred due to hurricanes, tsunamis, earthquakes,
explosions, vehicle impacts, fires, and human errors or even
terrorist attacks. In recent years, a number of notorious
progressive collapses occurred. It Includes the classics Ronan
Point (London, 1968), the A.P. Murrah Federal Building (Oklahoma, 1995), and the buildings of the World Trade
Center (New York, 2001). From a series of catastrophes, it
has been observed that a structure should have sufficient
continuity to offer an alternative path to the stability of the
structure, even if an element of a vertical load-resisting
system is removed in order to prevent progressive collapse.
There are no common rules to design against
progressive collapse. However, there are some groups of
design methods that can be easily identified across the
different international codes; there are three widely
recognized approaches, (1) tying force prescriptive rules, (2)
alternative load path (ALP) methods, and (3) key element design methods. Recent comprehensive reviews in this field
identified a fourth group, (4) risk-based methods. The tying
force and ALP methods consider local failure, whereas the
key element design method prevents local failure of critical
elements. ALP approaches that supported the notional
member removal concept are deterministic instead of
prescriptive and are widely accepted by all codes.
Many studies have been carried out to evaluate the
behavior and resistance of different structural systems during
the progressive collapse, either experimentally or
numerically. Tsai and Huang (2011) investigated by linear and nonlinear static analysis that without consideration of the
non-structural walls, the moment demands of beams may be
overestimated while the shear demand may be
underestimated. Khandelwal and Tawil (2011) investigated
that the frame designed for moderate seismic risk is less
robust than the corresponding one designed for high seismic
risk by pushdown analysis. Mashhadiali et al. (2016)
compared steel plate shear wall with x-braced frame and
investigated that steel plate shear wall system has more

Vaidehi J. Patel et al. / IJCE, 8(5), 35-44, 2021
36
progressive collapse resisting potential than X-braced and
moment frame structure. Salmasi and Sheidaii (2017) carried
out a nonlinear static analysis and found that changes in the
type of bracing resulted in significant changes in the system
capacity in the progressive collapse, and also chevron type eccentrically brace showed higher strength against
progressive collapse. Naji and Ommetalab (2019) obtained
capacity curves for each case, and their results indicate that
horizontal bracing would increase the resistance of moment
frames against progressive collapse. Naji and Zadeh (2019)
studied the behavior of concentrically braced frames (CBF)
and eccentrically braced frames (EBF) under progressive
collapse scenarios and concluded that both systems could
withstand the progressive collapse. In the CBF system, the
ductility of the CBF structure increases with a decrease in the
cross-sections of braces. Mashhadiali and Kheyroddin (2014)
investigated that the new system had high resistance to progressive collapse than diagrids in similar conditions. Kim
et al. (2011) observed that the inverted-V type braced frames
showed superior ductile behavior among all considered
braced frames during the progressive collapse, and
deflections of all braced structures were less than that of the
moment-resisting frame. Shayanfar and Javidan (2017)
observed that partially damaged shear walls could
redistribute the loads and withstand progressive collapse.
In this paper, progressive collapse analysis is carried
out for reinforced concrete (RC) structures, RC structure
with bracings, and RC structure with the shear wall by different column removal scenarios. The specific objectives
of the study are: (1) To perform the progressive collapse
analysis of RC structure with various lateral load resisting
system, (2) To study the comparative performance of lateral
load resisting systems like Shear wall system and Bracing
system, and (3) To compare various parameters like Demand
Capacity Ratio, vertical displacement, base shear and to
study the behaviour of hinge.
II. PROCEDURE FOR PROGRESSIVE COLLAPSE
ANALYSIS
An alternative path approach assumes a critical element is
removed from the structure due to abnormal loading, and
therefore the structure is required to redistribute the gravity
loads to the remaining undamaged structural elements. An
advantage of this approach is that it promotes structural
systems with ductility, continuity, and energy-absorbing
properties, which is desirable in preventing progressive
collapse. An alternate load path analysis may be performed
using one among three procedures: nonlinear dynamic,
nonlinear static, or linear static.
A. Linear Static Analysis
In linear static analysis, the column is removed from the
location being considered, and linear static analysis has
been carried out with the gravity load imposed on the
structure. For all sections, provided reinforcement detail
are obtained from the originally seismically designed
section. Based on provided reinforcement, the capacity of
the member is calculated. From the results of linear static
analysis for different column removal scenarios, demands
at critical locations are obtained. Check for the Demand
Capacity Ratio (DCR) is carried out in each structural
member. The member is taken into account as failed if the DCR of a member exceeds the acceptance criteria in
flexure and shear. The DCR calculated from linear static
analysis helps to Fig. out the potential for progressive
collapse of the building. For linear static analysis purpose,
the following vertical load shall be applied downward to
the structure under investigation:
Load = 2(DL + 0.25 LL)
where,
DL = Dead Load, LL = Live Load
For static analysis, the GSA (2003) recommends the use
of a dynamic amplification factor of 2.0 in load
combination. This factor is used to account for the dynamic effects of column or wall removal to assess the potential
for progressive collapse analysis.
The acceptance criterion for progressive collapse:
The GSA proposed the use of the Demand–Capacity
Ratio (DCR), the ratio of the member force and the
member strength, as a criterion to determine the failure of
main structural members by the linear analysis procedure.
D.C.R. = QUD / QCE
QUD = Acting Force (demand) determined in component or
connection/joint (moment, axial force, shear, and possible
combine forces)
QCE = Expected ultimate, unfactored capacity of the
component and/or connection/joint (moment, axial force,
shear, and possible combine forces)
The capacity of members calculated as per IS 456:2000
at critical section using increased material strength.
The allowable limit of DCR values for primary and
secondary structural elements are:
DCR< 2.0 (Typical structural configurations)
DCR< 1.5 (A-typical structural configurations)
B. Nonlinear Static Analysis
The nonlinear static pushdown analysis method is carried
out to investigate the structural performance of buildings
against progressive collapse by gradually increasing the
vertical displacement in the location of the removed column.
A non-linear static procedure that is popular in seismic
assessment of structures is ‘‘pushover analysis’’ wherein a
structure is subjected to a monotonically increasing lateral load pattern till a failure mechanism is formed. This analysis
provides valuable information in which sequence plastic
hinges form in the elements and strength and deformation
reserves, if any, in the system beyond the required seismic
demands. Similarly, in several studies, the concept of a
‘‘pushdown’’ analysis has been utilized in the case of
progressive collapse simulations. A pushdown analysis is an

Vaidehi J. Patel et al. / IJCE, 8(5), 35-44, 2021
37
incremental non-linear static procedure in which a
downward distributed or concentrated load of increasing
intensity is applied to the structure till a collapse condition
occurs.
The pushdown analysis is used to investigate the
robustness of building system residual by computing
residual capacity and establishing collapse modes of a
damaged structure. In the Nonlinear static analysis, define
and assign plastic hinges to beams and columns. Load case
defined for nonlinear static analysis is the same as static
linear analysis as per GSA, which is
2 (DL + 0.25 LL),
Where DL= Dead Load and LL = Live Load
Nonlinear static analysis with the load case imposed on
the structure has been carried out for all column removal
scenarios. In pushdown analysis, a maximum load factor less
than 1 implies that the structure cannot resist the progressive collapse under the load combination of 2(DL+0.25LL) as
per GSA guidelines, where load factor is referred to as the
ratio of applied load and the GSA specified load.
III. MODELING OF STRICTURE
In this study, the performance of RC structure with
bracings and with shear wall subjected to the sudden removal of a column was investigated by linear static and
nonlinear static analysis using the software SAP2000.
The analyzed structural models are basically 10-storeys
structures with 5 bays width of 4m in both directions
subjected to the loss of the ground storey column from
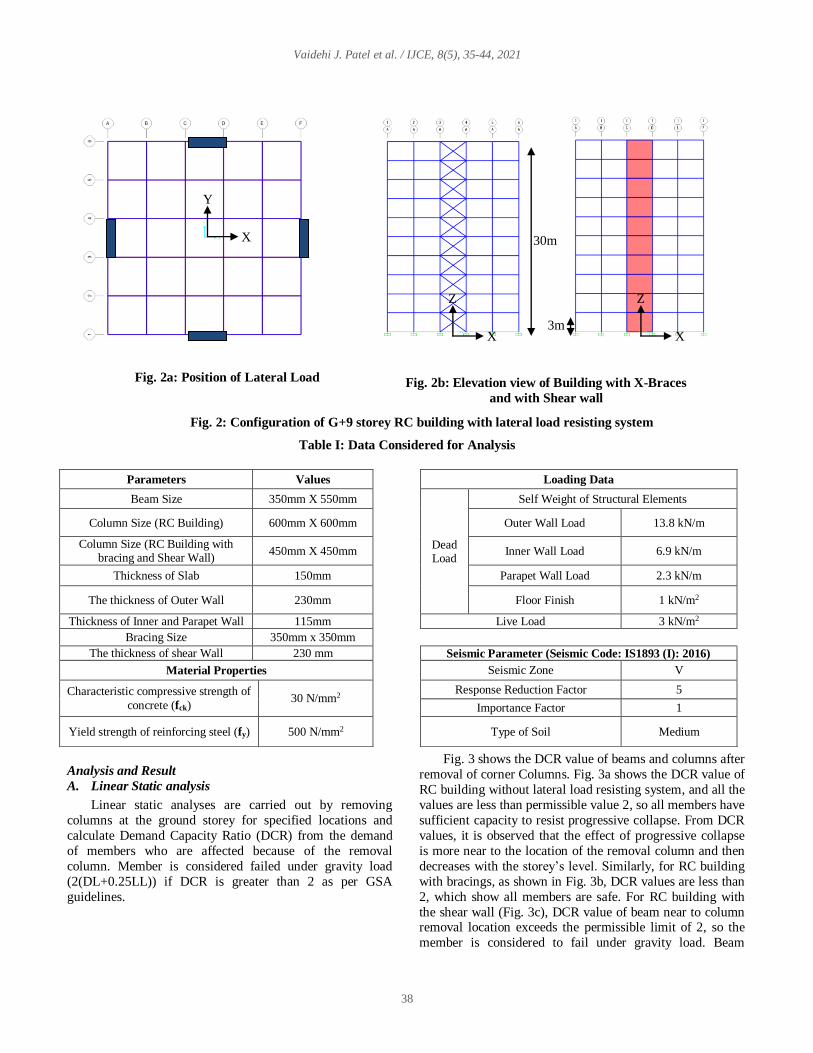
different locations one at a time. The plan dimension of the building is 20m x20m. The height of the building is 30m
with 3m of each floor height. Fig. 1 shows 3D and plan view
of the RC building. Fig. 2 shows the configurations of G+ 9
storey with bracing and with shear wall to be analyzed.
Four-column removal cases are considered for progressive
collapse analysis as mentioned below:
1) The corner column is removed (C1)
2) Internal Column is removed (C201)
3) An exterior column near the middle of the Building in
the X direction (C181)
4) An exterior column beside the corner column of the
Building in Y direction (C11)
Fig. 1b shows the location of four-column removal cases
for progressive collapse analysis. In Fig. 1b, the dotted line
is showing the affected area due to the removal of the
column.
IV. NUMERICAL STUDY
A 10 storey building is designed for seismic loading in
SAP2000 according to IS456:2000. After that, progressive
collapse analysis is carried out. All supports are modeled as
fixed supports. Data considered for all 3 types of buildings
are listed below in Table I.
Construction Material Strength
Increase
Factor
Concrete (compressive Strength) 1.25
Reinforcing Bar (tensile strength) 1.25
4m 4m 4m 4m 4m
4m
4m
4m
4m
4m
X
Y
20m
20m
Fig. 1a: 3D and Plan View of Building
Fig. 1b: Column Removal Locations
Fig. 1: Configuration and Consideration for Building
C1
C11
C201
C181
Vaidehi J. Patel et al. / IJCE, 8(5), 35-44, 2021
38
Table I: Data Considered for Analysis
Analysis and Result A. Linear Static analysis
Linear static analyses are carried out by removing
columns at the ground storey for specified locations and
calculate Demand Capacity Ratio (DCR) from the demand
of members who are affected because of the removal
column. Member is considered failed under gravity load
(2(DL+0.25LL)) if DCR is greater than 2 as per GSA
guidelines.
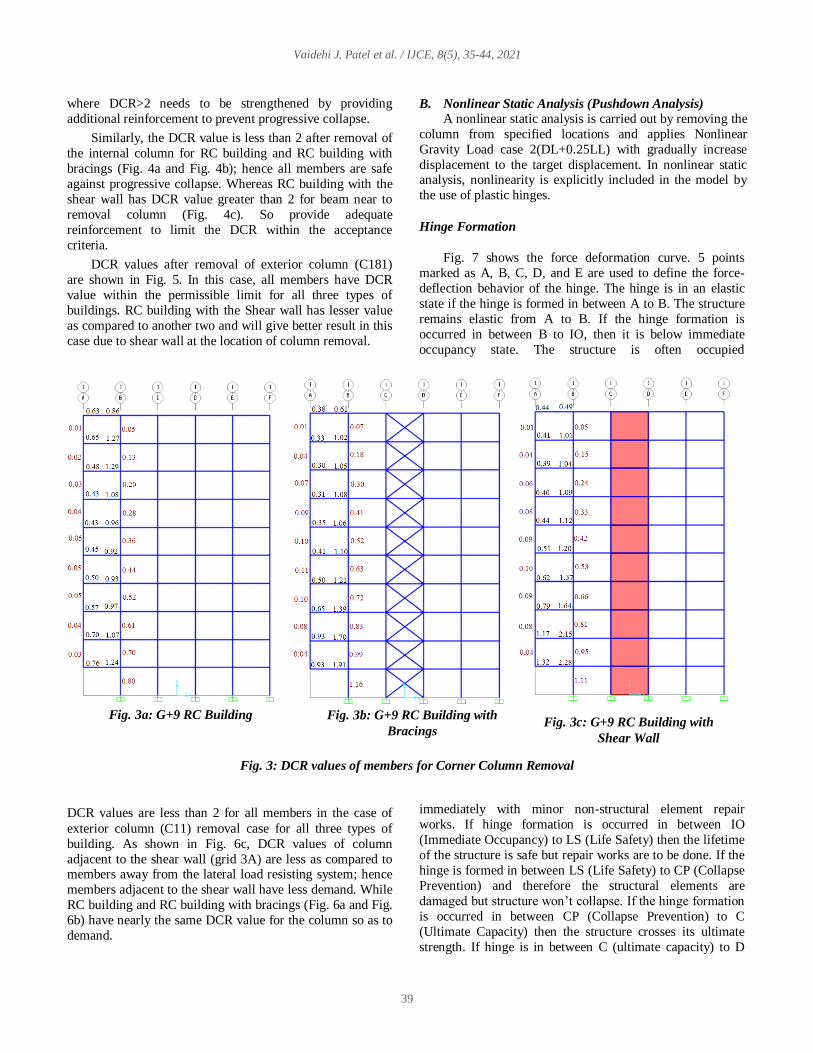
Fig. 3 shows the DCR value of beams and columns after
removal of corner Columns. Fig. 3a shows the DCR value of
RC building without lateral load resisting system, and all the
values are less than permissible value 2, so all members have
sufficient capacity to resist progressive collapse. From DCR
values, it is observed that the effect of progressive collapse
is more near to the location of the removal column and then
decreases with the storey’s level. Similarly, for RC building
with bracings, as shown in Fig. 3b, DCR values are less than
2, which show all members are safe. For RC building with
the shear wall (Fig. 3c), DCR value of beam near to column removal location exceeds the permissible limit of 2, so the
member is considered to fail under gravity load. Beam
Parameters Values Loading Data
Beam Size 350mm X 550mm
Dead Load
Self Weight of Structural Elements
Column Size (RC Building) 600mm X 600mm Outer Wall Load 13.8 kN/m
Column Size (RC Building with bracing and Shear Wall)
450mm X 450mm Inner Wall Load 6.9 kN/m
Thickness of Slab 150mm Parapet Wall Load 2.3 kN/m
The thickness of Outer Wall 230mm Floor Finish 1 kN/m2
Thickness of Inner and Parapet Wall 115mm Live Load 3 kN/m2
Bracing Size 350mm x 350mm
The thickness of shear Wall 230 mm Seismic Parameter (Seismic Code: IS1893 (I): 2016)
Material Properties Seismic Zone V
Characteristic compressive strength of
concrete (fck) 30 N/mm2
Response Reduction Factor 5
Importance Factor 1
Yield strength of reinforcing steel (fy) 500 N/mm2 Type of Soil Medium
X
Y
Fig. 2a: Position of Lateral Load
Resisting System
Fig. 2b: Elevation view of Building with X-Braces
and with Shear wall
Fig. 2: Configuration of G+9 storey RC building with lateral load resisting system
30m
X
Z
3m X
Z
Vaidehi J. Patel et al. / IJCE, 8(5), 35-44, 2021
39
where DCR>2 needs to be strengthened by providing
additional reinforcement to prevent progressive collapse.
Similarly, the DCR value is less than 2 after removal of
the internal column for RC building and RC building with
bracings (Fig. 4a and Fig. 4b); hence all members are safe
against progressive collapse. Whereas RC building with the
shear wall has DCR value greater than 2 for beam near to
removal column (Fig. 4c). So provide adequate
reinforcement to limit the DCR within the acceptance
criteria.
DCR values after removal of exterior column (C181)
are shown in Fig. 5. In this case, all members have DCR
value within the permissible limit for all three types of
buildings. RC building with the Shear wall has lesser value
as compared to another two and will give better result in this
case due to shear wall at the location of column removal.
DCR values are less than 2 for all members in the case of
exterior column (C11) removal case for all three types of
building. As shown in Fig. 6c, DCR values of column
adjacent to the shear wall (grid 3A) are less as compared to members away from the lateral load resisting system; hence
members adjacent to the shear wall have less demand. While
RC building and RC building with bracings (Fig. 6a and Fig.
6b) have nearly the same DCR value for the column so as to
demand.
B. Nonlinear Static Analysis (Pushdown Analysis)
A nonlinear static analysis is carried out by removing the
column from specified locations and applies Nonlinear
Gravity Load case 2(DL+0.25LL) with gradually increase
displacement to the target displacement. In nonlinear static analysis, nonlinearity is explicitly included in the model by
the use of plastic hinges.
Hinge Formation
Fig. 7 shows the force deformation curve. 5 points
marked as A, B, C, D, and E are used to define the force-
deflection behavior of the hinge. The hinge is in an elastic
state if the hinge is formed in between A to B. The structure
remains elastic from A to B. If the hinge formation is
occurred in between B to IO, then it is below immediate
occupancy state. The structure is often occupied
immediately with minor non-structural element repair
works. If hinge formation is occurred in between IO
(Immediate Occupancy) to LS (Life Safety) then the lifetime
of the structure is safe but repair works are to be done. If the
hinge is formed in between LS (Life Safety) to CP (Collapse
Prevention) and therefore the structural elements are
damaged but structure won’t collapse. If the hinge formation
is occurred in between CP (Collapse Prevention) to C
(Ultimate Capacity) then the structure crosses its ultimate
strength. If hinge is in between C (ultimate capacity) to D
Fig. 3a: G+9 RC Building Fig. 3b: G+9 RC Building with
Bracings Fig. 3c: G+9 RC Building with
Shear Wall
Fig. 3: DCR values of members for Corner Column Removal

Vaidehi J. Patel et al. / IJCE, 8(5), 35-44, 2021
40
(residual strength) then the structural elements drop the load
and there is reduction in load carrying capacity.
If the hinge drops at D or beyond D, then there will be no
increase in load-carrying capacity. The structure will
collapse if the hinges are formed beyond the E.
Fig. 4a: G+9 RC Building Fig. 4b: G+9 RC Building
with Bracings
Fig. 4c: G+9 RC Building
with Shear Wall
Fig. 4: DCR values of members for Internal Column Removal
Fig. 5a: G+9 RC Building Fig. 5b: G+9 RC Building
with Bracings
Fig. 5c: G+9 RC Building
with Shear Wall
Fig. 5: DCR values of members for Exterior Column Removal (C181)

Vaidehi J. Patel et al. / IJCE, 8(5), 35-44, 2021
41
Hinge formations for all cases are shown in Fig. 8, 9,
and 10. Hinges are started to form near the column removal
location and moving forward towards the upper storey. In the RC building (Fig. 8), the performance of the building is
in between immediate occupancy to life safety level for all
4 cases, so the life of the structure is safe, but there may be
repair works that need to be done. Performance of RC
building with bracing (Fig. 9) is in between IO to LS for
corner and exterior column (C11) cases while for internal
and exterior (C181) column removal case, performance is
in between B to IO, so there will be minor repair work in
the non-structural element. Similarly, hinge formation for
RC buildings with shear walls is shown in Fig. 10. A
number of hinges form for all cases are listed according to
a different state in Table 2.
Vertical displacements are obtained corresponding
to respective load for several steps after performing
pushdown analysis. Table II shows the maximum vertical
displacements for all considered cases. Vertical
displacement is more for RC buildings as compared to RC buildings with bracings and with the shear wall for all cases.
For the corner column removal case, vertical displacement
decreased by 37.5 % for RC building with bracing and
decreased by 27.9 % for RC building with the shear wall in
comparison with RC building. Whereas for internal column
remove the case, vertical displacement decreased by 21% for
RC building with bracing and increased by 15.6 % for RC
building with the shear wall. In the other two cases of
exterior column removal C181 and C11, vertical
displacement decreased by 73.91%, 96.7%, and 37.44%,
43% accordingly for RC building with bracing and RC
building with the shear wall, respectively. Base shear force
is less for RC building with bracings; RC building with the
shear wall has more than that.
Fig. 11 shows the load factor versus displacement graph
of all four cases. For all 3 types of buildings, the maximum
load factor reaches up to 1, as shown in Fig. 11a, so the
structure has enough strength to resist progressive collapse
by loss of a corner column. However, after the maximum
strength is reached, the strength drops abruptly with a further
decrease in displacement for RC buildings with the shear wall. As shown in Fig. 11c, the maximum load factor
reaches up to 1, so the building has the capacity to resist
progressive collapse and strength decrease with a decrease in
displacement after reached to maximum strength for RC
building and RC building with a shear wall. Similar results
are obtained for the exterior column (C11) removal case
(Fig. 11d).
Fig. 6a: G+9 RC Building Fig. 6b: G+9 RC Building
with Bracings
Fig. 6c: G+9 RC Building
with Shear Wall
Fig. 6: DCR values of members for Exterior Column Removal (C11)
A
B IO
LS CP
C
D E
Deformation
Fo
rce
Fig. 7: Force Deformation curve

Vaidehi J. Patel et al. / IJCE, 8(5), 35-44, 2021
42
Fig. 8a: Corner
Column Removal
Fig. 8b: Internal
Column Removal
Fig. 8c: Exterior
C181 Column
Removal
Fig. 8d: Exterior C11
Column Removal
Fig. 8: Hinge Formation for G+9 Storey RC building
Fig. 9a: Corner
Column Removal
Fig. 9b: Internal
Column Removal Fig. 9c: Exterior
C181 Column
Removal
Fig. 9d: Exterior C11
Column Removal
Fig. 9: Hinge Formation for G+9 Storey RC building with Bracings
Fig. 10a: Corner
Column Removal
Fig. 10b: Internal
Column Removal Fig. 10c: Exterior
C181 Column
Removal
Fig. 10d: Exterior
C11 Column
Removal
Fig. 10: Hinge Formation for G+9 Storey RC building with Shear Wall

Vaidehi J. Patel et al. / IJCE, 8(5), 35-44, 2021
43
TABLE II: Pushdown Analysis Result (Base force, Displacement, Hinge result)
Column
removal location Type of Building Base Force (kN) Displacement(mm)
Hinge Results
Total A to B B to IO IO to LS
Corner Column
Removal
RC Building 314134.18 90.4
1918
1851 26 41
With Bracings 192442.28 56.5 1865 34 19
With Shear Wall 214318.48 65.2 1820 72 26
Internal
Column
Removal
RC Building 334303.49 45.6
1918
1780 134 4
With Bracings 217145.22 36.0 1768 150 0
With Shear Wall 296862.83 52.7 1562 344 12
Exterior
Column
Removal (C181)
RC Building 331301.15 66.7
1918
1803 57 58
With Bracings 296504.96 17.4 1670 248 0
With Shear Wall 234246.75 2.2 1831 87 0
Exterior
Column
Removal (C11)
RC Building 331761.96 66.5
1918
1810 50 58
With Bracings 223473.02 41.6 1794 124 36
With Shear Wall 234290.43 37.9 1760 157 1
0.00
0.20
0.40
0.60
0.80
1.00
1.20
0 10 20 30 40 50 60 70 80 90 100
Loa
d F
acto
r
Vertical Displacement (mm)
0.00
0.20
0.40
0.60
0.80
1.00
1.20
0 10 20 30 40 50 60
Loa
d F
acto
r
Vertical Displacement (mm)
Regular
With
Bracings
With Shear
Wall
-0.40
-0.20
0.00
0.20
0.40
0.60
0.80
1.00
1.20
0 10 20 30 40 50 60 70
Load
Facto
r
Vertical Displacement (mm)
0.00
0.20
0.40
0.60
0.80
1.00
1.20
0 10 20 30 40 50 60 70
Load
Facto
r
Vertical Displacement (mm)
Fig. 11a: Corner Column Removal Fig. 11b: internal Column Removal
Fig. 11c: Exterior C181 Column Removal Fig. 11d: Exterior C11 Column Removal
Fig. 11: Load Factor Vs Displacement

Vaidehi J. Patel et al. / IJCE, 8(5), 35-44, 2021
44
V. CONCLUSIONS This study investigated the progressive collapse potential
of RC building, RC building with bracings, and RC building
with shear wall with 10 storeys, subject to loss of column at
the ground storey. Four cases are considered for progressive collapse analysis by two methods of alternate path approach
named linear static analysis and nonlinear static analysis. The
parameters considered are Demand capacity ratio, Hinge
formation, Base force, Vertical displacement, load factor.
After obtained the results of the present studies, the
following conclusions can be drawn:
DCR values meet permissible limit as per GSA
guideline for RC building and RC building with bracing,
so member have sufficient capacity to resist progressive
collapse. For RC building with shear wall, DCR greater
than 2 for corner and internal removal cases hence need
to provide additional reinforcement to strengthened member. DCR values are higher for corner removal
cases as compared to other three.
Performance of three type of building is in between
immediate occupancy to life safety level for all cases
except performance of RC building with bracing in
internal column removal case and RC building with
bracing and shear wall in exterior column (C181) are
below immediate occupancy level.
Vertical Displacement of RC building with bracing is
less as compared to shear wall for all cases except
exterior column (C181) removal case. In this case, vertical displacement is very small for RC building with
shear wall.
The nonlinear static pushdown analysis results showed
that the model structures had enough strength as the
strength required by the GSA guideline for all column
removal case. However, after the maximum values were
reached, the strengths sharply dropped for some case.
According to all results, it is observed that RC building
with bracing gives better result for all cases as compared
to two others.
REFERENCES [1] A. Ch. Salmasi and M. R. Sheidaii, Assessment of eccentrically
braced frames strength against progressive collapse, International
Journal of Steel Structures, 17(2) (2017) 543-551.
[2] A. Naji and M. K. Zadeh, Progressive collapse analysis of steel
braced frames, Pract. Period. Struct. Des. Constr., 24(2) (2019)
04019004-(1-9).
[3] A. Naji and M. R. Ommetalab, Horizontal bracing to enhance
progressive collapse resistance of steel moment frames, The
Structural Design of Tall and Special Buildings, 28(7) (2019) 1-15.
[4] D. D. Joshi, P. V. Patel and S. J. Tank, Linear and nonlinear static
analysis for assessment of progressive collapse potential of
multistoried building, Structure Congress, April 2012.
[5] General Services Administration (GSA), (2003), Progressive
collapse analysis and design guidelines for new federal office
buildings and major modernization projects, The U.S. General
Services Administration.
[6] IS 456: 2000, Plain and reinforced concrete- code of practice,
Bureau of Indian Standards.
[7] IS 1893 (Part 1): 2016, Criteria for earthquake resistant design of
structures, Bureau of Indian Standards.
[8] J. Kim, Y. Lee and H. Choi, Progressive collapse resisting capacity
of braced frames, Struct. Design Tall Spec. Build., 20 (2011) 257–
270.
[9] K. Khandelwal and S. EI-Tawil, Pushdown resistance as a measure
of robustness in progressive collapse analysis, Engineering
Structures, 33(9) (2011) 2653-2661.
[10] M. A. Shayanfar and M. M. Javidan, Progressive collapse-resisting
mechanisms and robustness of RC frame–shear wall structures,
Journal of Performance of Constructed Facilities, 31(5) (2017)
04017045-(1-12).
[11] M. Tsai and T. Huang, Progressive collapse analysis of an RC
building with exterior non-structural walls, Procedia Engineering,
14 (2011) 377-384.
[12] N. Mashhadiali and A. Kheyroddin, Progressive collapse
assessment of new hexagrid structural system for tall buildings, The
Structural Design of Tall and Special Buildings, 23(12) (2014) 947-
961.
[13] N. Mashhadiali, M. Gholhaki, A. Kheyroddin and R. Zahiri-
Hashemi, Technical note: Analytical evaluation of the vulnerability
of framed tall buildings with steel plate shear wall to progressive
collapse, Int J Civ Eng, 14 (2016) 595-608.