progressing our transformation to a leading global...
TRANSCRIPT

Flemming Ornskov, MD CEO
Jeff Poulton CFO
Q3 2015 results Progressing our transformation to a leading global biotech October 23, 2015
2
Statements included herein that are not historical facts, including without limitation statements concerning our 10x20 ambitions and targets, are forward-looking statements. Such forward-looking statements involve a number of risks and uncertainties and are subject to change at any time. In the event such risks or uncertainties materialize, Shire’s results could be materially adversely affected. The risks and uncertainties include, but are not limited to, that: • Shire’s products may not be a commercial success; • product sales from ADDERALL XR and INTUNIV are subject to generic competition; • the failure to obtain and maintain reimbursement, or an adequate level of reimbursement, by third-party payers in a timely manner for Shire's products
may affect future revenues, financial condition and results of operations; • Shire conducts its own manufacturing operations for certain of its products and is reliant on third party contract manufacturers to manufacture other
products and to provide goods and services. Some of Shire’s products or ingredients are only available from a single approved source for manufacture. Any disruption to the supply chain for any of Shire’s products may result in Shire being unable to continue marketing or developing a product or may result in Shire being unable to do so on a commercially viable basis for some period of time;
• the manufacture of Shire’s products is subject to extensive oversight by various regulatory agencies. Regulatory approvals or interventions associated with changes to manufacturing sites, ingredients or manufacturing processes could lead to significant delays, an increase in operating costs, lost product sales, an interruption of research activities or the delay of new product launches;
• Shire has a portfolio of products in various stages of research and development. The successful development of these products is highly uncertain and requires significant expenditures and time, and there is no guarantee that these products will receive regulatory approval;
• the actions of certain customers could affect Shire's ability to sell or market products profitably. Fluctuations in buying or distribution patterns by such customers can adversely affect Shire’s revenues, financial condition or results of operations;
• investigations or enforcement action by regulatory authorities or law enforcement agencies relating to Shire’s activities in the highly regulated markets in which it operates may result in significant legal costs and the payment of substantial compensation or fines;
• adverse outcomes in legal matters and other disputes, including Shire’s ability to enforce and defend patents and other intellectual property rights required for its business, could have a material adverse effect on Shire’s revenues, financial condition or results of operations;
• Shire faces intense competition for highly qualified personnel from other companies and organizations. Shire is undergoing a corporate reorganization and was the subject of an unsuccessful acquisition proposal and the consequent uncertainty could adversely affect Shire’s ability to attract and/or retain the highly skilled personnel needed for Shire to meet its strategic objectives;
• failure to achieve Shire’s strategic objectives with respect to the acquisition of NPS Pharmaceuticals Inc. may adversely affect Shire’s financial condition and results of operations;
• Shire's strategy to acquire Baxalta may not be successful: Baxalta may refuse to cooperate with Shire; if the proposed combination is consummated, the businesses may not be integrated successfully, including that expected synergies and other benefits of the combination may not be realized and unforeseen costs may arise; and disruption caused by the proposed transaction may adversely affect Shire; and
other risks and uncertainties detailed from time to time in Shire’s filings with the Securities and Exchange Commission, including those risks outlined in “Item 1A: Risk Factors” in Shire’s Annual Report on Form 10-K for the year ended December 31, 2014.
“SAFE HARBOR” statement under the Private Securities Litigation Reform Act of 1995

3
Agenda
Our progression towards becoming a leading global biotech
Financial review
Summary
Q & A All
Flemming Ornskov, MD
Flemming Ornskov, MD
Jeff Poulton
4
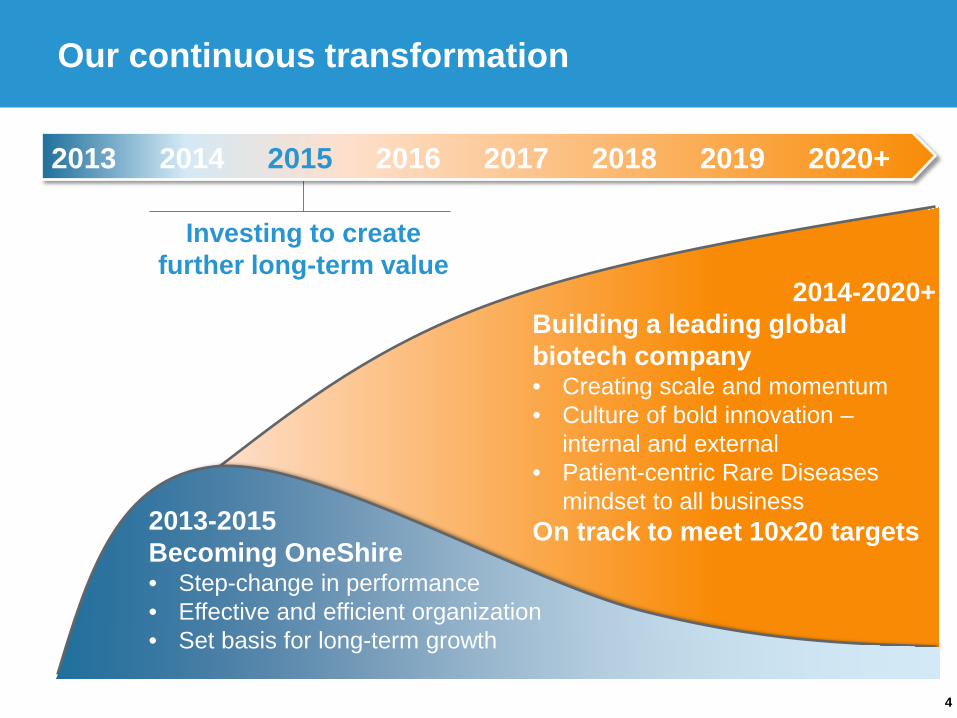
Our continuous transformation
2013-2015 Becoming OneShire • Step-change in performance • Effective and efficient organization • Set basis for long-term growth
Investing to create further long-term value
2013 2014 2015 2016 2017 2018 2019 2020+
2014-2020+ Building a leading global biotech company • Creating scale and momentum • Culture of bold innovation –
internal and external • Patient-centric Rare Diseases
mindset to all business On track to meet 10x20 targets

5
Q3 2015: Progress towards becoming a leading global biotechnology company
Strong performance driven by VYVANSE, CINRYZE, and FIRAZYR
GATTEX and NATPARA continue to benefit from Shire’s Rare Disease expertise
GROWTH
Double digit CER(1) product sales growth excluding INTUNIV
Phase 3 pediatrics study for SHP465 enrolling ahead of schedule
European approval for INTUNIV
INNOVATION
Continued investment and progress in expected future growth drivers, including VYVANSE BED, GATTEX/REVESTIVE, NATPARA and lifitegrast
Non GAAP diluted earnings per ADS growth guidance reiterated at mid-to-high single digit percent range for the full year
(1) Growth at Constant exchange rates (“CER”), a Non GAAP financial measure. CER performance is determined by comparing 2015 performance (restated using 2014 exchange rates) to actual 2014 reported performance. See slide 33 for a list of items excluded from the US GAAP equivalent used to calculate all Non GAAP measures detailed above. A reconciliation of Non GAAP financial measures to the most directly comparable measure under US GAAP is presented in Shire's Q3 2015 earnings release on pages 22 to 28.
Acquired Foresight Biotherapeutics, bringing global rights to FST-100 (now referred to as SHP640), a late stage asset for the treatment of infectious conjunctivitis
Multiple Phase 3 trials expected to start in late Q4 2015/early-to-mid 2016, including SHP620 for cytomegalovirus (“CMV”) infection in transplant patients, SHP621 for Eosinophilic Esophagitis (“EoE”), and CINRYZE in AMR
Phase 3 OPUS3 study for lifitegrast in symptoms of dry eye disease completed: topline results expected Q4 2015 and, if positive, to form the basis of Shire’s response to the CRL
6
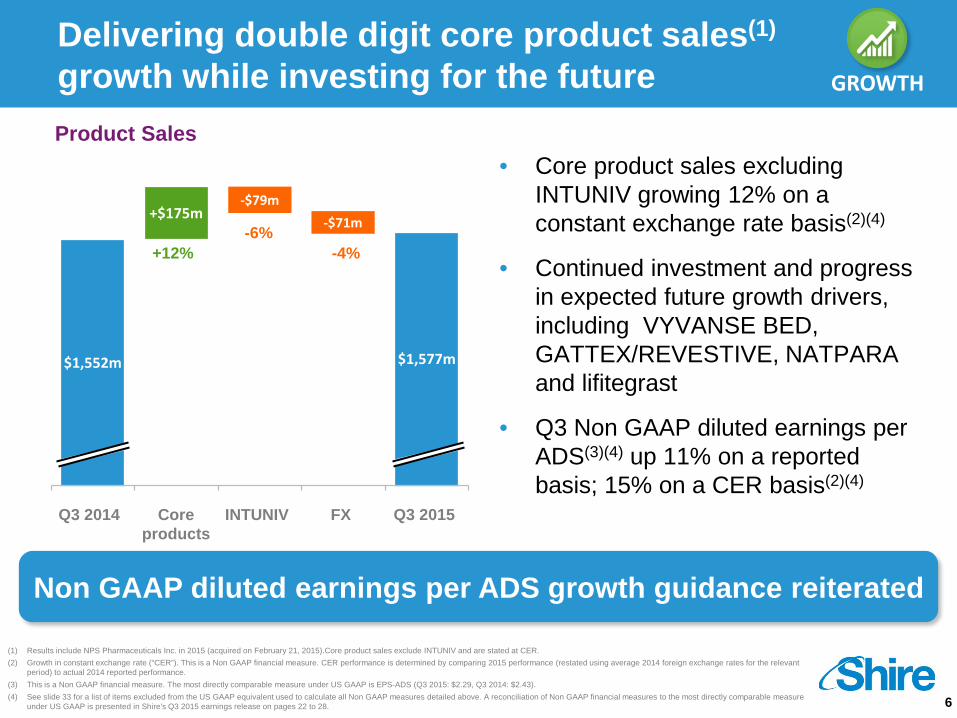
Delivering double digit core product sales(1) growth while investing for the future
$1,552m
+$175m
$1,577m
• Core product sales excluding INTUNIV growing 12% on a constant exchange rate basis(2)(4)
• Continued investment and progress in expected future growth drivers, including VYVANSE BED, GATTEX/REVESTIVE, NATPARA and lifitegrast
• Q3 Non GAAP diluted earnings per ADS(3)(4) up 11% on a reported basis; 15% on a CER basis(2)(4)
-$79m -$71m
Q3 2014 Core products
INTUNIV FX Q3 2015
GROWTH
+12% -6%
-4%
Product Sales
Non GAAP diluted earnings per ADS growth guidance reiterated
(1) Results include NPS Pharmaceuticals Inc. in 2015 (acquired on February 21, 2015).Core product sales exclude INTUNIV and are stated at CER. (2) Growth in constant exchange rate (“CER”). This is a Non GAAP financial measure. CER performance is determined by comparing 2015 performance (restated using average 2014 foreign exchange rates for the relevant
period) to actual 2014 reported performance. (3) This is a Non GAAP financial measure. The most directly comparable measure under US GAAP is EPS-ADS (Q3 2015: $2.29, Q3 2014: $2.43). (4) See slide 33 for a list of items excluded from the US GAAP equivalent used to calculate all Non GAAP measures detailed above. A reconciliation of Non GAAP financial measures to the most directly comparable measure
under US GAAP is presented in Shire's Q3 2015 earnings release on pages 22 to 28.
7
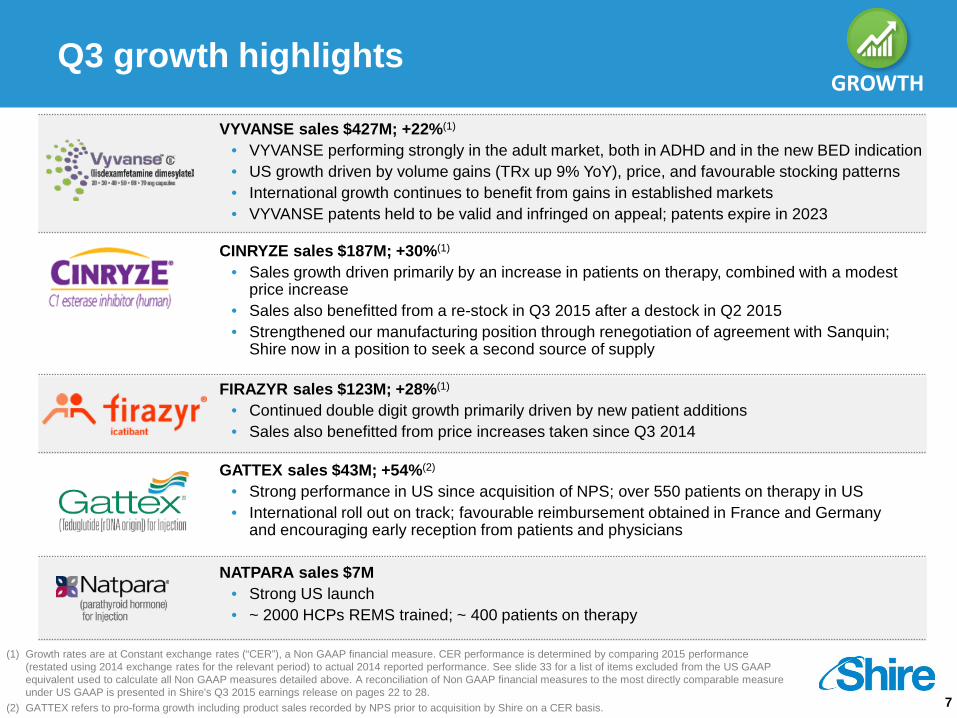
Q3 growth highlights
(1) Growth rates are at Constant exchange rates (“CER”), a Non GAAP financial measure. CER performance is determined by comparing 2015 performance (restated using 2014 exchange rates for the relevant period) to actual 2014 reported performance. See slide 33 for a list of items excluded from the US GAAP equivalent used to calculate all Non GAAP measures detailed above. A reconciliation of Non GAAP financial measures to the most directly comparable measure under US GAAP is presented in Shire's Q3 2015 earnings release on pages 22 to 28.
(2) GATTEX refers to pro-forma growth including product sales recorded by NPS prior to acquisition by Shire on a CER basis.
CINRYZE sales $187M; +30%(1)
• Sales growth driven primarily by an increase in patients on therapy, combined with a modest price increase
• Sales also benefitted from a re-stock in Q3 2015 after a destock in Q2 2015 • Strengthened our manufacturing position through renegotiation of agreement with Sanquin;
Shire now in a position to seek a second source of supply
FIRAZYR sales $123M; +28%(1) • Continued double digit growth primarily driven by new patient additions • Sales also benefitted from price increases taken since Q3 2014
VYVANSE sales $427M; +22%(1) • VYVANSE performing strongly in the adult market, both in ADHD and in the new BED indication • US growth driven by volume gains (TRx up 9% YoY), price, and favourable stocking patterns • International growth continues to benefit from gains in established markets • VYVANSE patents held to be valid and infringed on appeal; patents expire in 2023
GATTEX sales $43M; +54%(2) • Strong performance in US since acquisition of NPS; over 550 patients on therapy in US • International roll out on track; favourable reimbursement obtained in France and Germany
and encouraging early reception from patients and physicians
GROWTH
NATPARA sales $7M • Strong US launch • ~ 2000 HCPs REMS trained; ~ 400 patients on therapy
Our purpose We enable people with life-altering conditions to lead better lives.
Strong and innovative pipeline
9
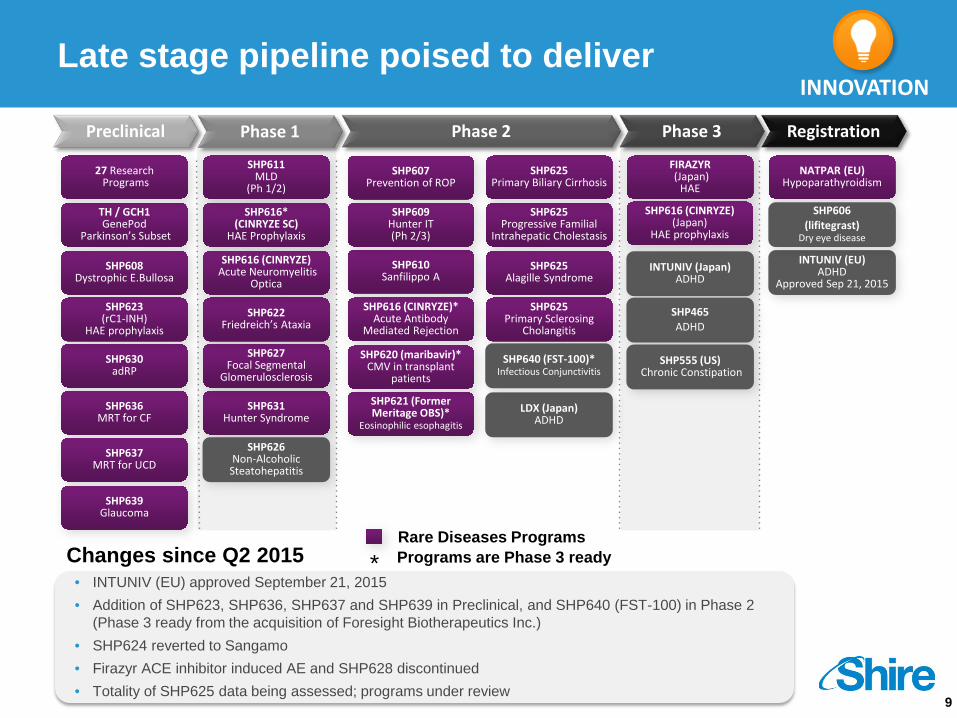
Late stage pipeline poised to deliver
Preclinical Phase 1 Phase 2 Phase 3 Registration
TH / GCH1 GenePod
Parkinson’s Subset
27 Research Programs
SHP608
Dystrophic E.Bullosa
SHP631
Hunter Syndrome
SHP630 adRP
SHP623 (rC1-INH)
HAE prophylaxis
SHP616* (CINRYZE SC)
HAE Prophylaxis
SHP627 Focal Segmental
Glomerulosclerosis
SHP626 Non-Alcoholic
Steatohepatitis
SHP622 Friedreich’s Ataxia
SHP616 (CINRYZE) Acute Neuromyelitis
Optica
SHP610
Sanfilippo A
LDX (Japan) ADHD
SHP607 Prevention of ROP
SHP625 Progressive Familial
Intrahepatic Cholestasis
SHP625 Alagille Syndrome
SHP616 (CINRYZE)*
Acute Antibody Mediated Rejection
SHP625 Primary Sclerosing
Cholangitis
SHP625 Primary Biliary Cirrhosis
SHP621 (Former Meritage OBS)*
Eosinophilic esophagitis
FIRAZYR (Japan)
HAE
SHP616 (CINRYZE) (Japan)
HAE prophylaxis
INTUNIV (EU) ADHD
Approved Sep 21, 2015 INTUNIV (Japan)
ADHD
SHP465 ADHD
NATPAR (EU) Hypoparathyroidism
SHP606 (lifitegrast)
Dry eye disease
Rare Diseases Programs
SHP555 (US) Chronic Constipation
INNOVATION
Changes since Q2 2015 • INTUNIV (EU) approved September 21, 2015 • Addition of SHP623, SHP636, SHP637 and SHP639 in Preclinical, and SHP640 (FST-100) in Phase 2
(Phase 3 ready from the acquisition of Foresight Biotherapeutics Inc.) • SHP624 reverted to Sangamo • Firazyr ACE inhibitor induced AE and SHP628 discontinued • Totality of SHP625 data being assessed; programs under review
SHP636 MRT for CF
SHP640 (FST-100)* Infectious Conjunctivitis
SHP620 (maribavir)* CMV in transplant
patients
SHP637 MRT for UCD
SHP639 Glaucoma
SHP609 Hunter IT (Ph 2/3)
SHP611 MLD
(Ph 1/2)
Programs are Phase 3 ready *

10
INNOVATION
Shire requests signs AND
symptoms for treatment of DED at
pre-NDA meeting (May 2014)
2015 2015
Shire submits NDA for lifitegrast for
treatment of signs and symptoms of
DED (March 2)
FDA grants priority review
(April 9)
2014
Shire Initiates Phase 3 OPUS-3
trial for symptoms of
DED (Oct 2014)
Lifitegrast CRL received
(October 16)
Planned top-line release of OPUS-3 Phase 3 data for
symptoms of DED (Q4 2015)
2016
Planned resubmission
to the FDA (Q1 2016)
Expected revised PDUFA
date (Q3 2016)
INNOVATION
• FDA issued a CRL requesting an additional clinical study on October 16, 2015
• Shire has recently completed a Phase 3 study of lifitegrast, OPUS-3. Top line results are expected before year-end, and, and if positive, Shire plans to submit these data as part of a resubmission to the FDA during the first quarter of 2016
• In its review of product quality the FDA also requested more information on lifitegrast, which Shire will address in its CRL response
Lifitegrast: next steps for potential first agent to treat signs and symptoms of Dry Eye Disease (DED)
11
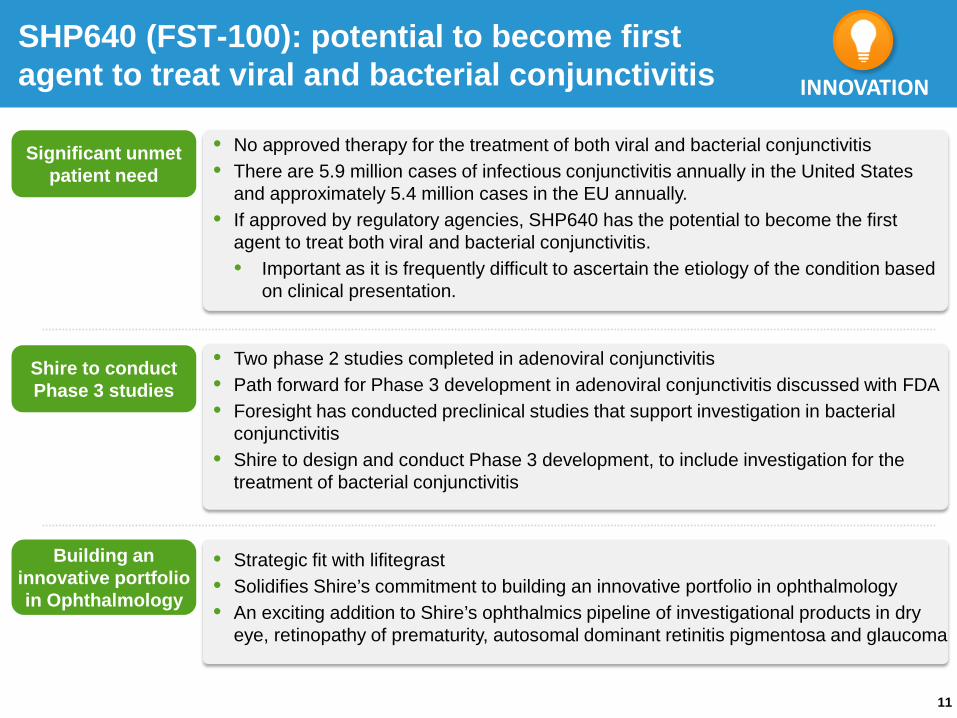
SHP640 (FST-100): potential to become first agent to treat viral and bacterial conjunctivitis
• No approved therapy for the treatment of both viral and bacterial conjunctivitis • There are 5.9 million cases of infectious conjunctivitis annually in the United States
and approximately 5.4 million cases in the EU annually. • If approved by regulatory agencies, SHP640 has the potential to become the first
agent to treat both viral and bacterial conjunctivitis. • Important as it is frequently difficult to ascertain the etiology of the condition based
on clinical presentation.
Significant unmet patient need
• Two phase 2 studies completed in adenoviral conjunctivitis • Path forward for Phase 3 development in adenoviral conjunctivitis discussed with FDA • Foresight has conducted preclinical studies that support investigation in bacterial
conjunctivitis • Shire to design and conduct Phase 3 development, to include investigation for the
treatment of bacterial conjunctivitis
Shire to conduct Phase 3 studies
• Strategic fit with lifitegrast • Solidifies Shire’s commitment to building an innovative portfolio in ophthalmology • An exciting addition to Shire’s ophthalmics pipeline of investigational products in dry
eye, retinopathy of prematurity, autosomal dominant retinitis pigmentosa and glaucoma
Building an innovative portfolio in Ophthalmology
INNOVATION

12
Q3 2015 other pipeline updates INNOVATION
INTUNIV EU approval
• EC granted marketing authorisation for INTUNIV for the treatment of ADHD in children and adolescents (aged 6-17 years) for whom stimulants are not suitable, not tolerated or have been shown to be ineffective
• Launches planned for 2016
• FDA granted Fast Track designation to CINRYZE (SHP616) in the treatment of AMR in patients receiving kidney transplants
• Phase 3 studies to start October 2015 • CINRYZE subcutaneous (SC) IND submitted, potential for Phase 2/3 study to start in
Q4 2015
Multiple Phase 3 studies expected to start in late Q4 2015/early to mid 2016
SHP616
SHP620
SHP621
• SHP620 for cytomegalovirus (“CMV”) infection in transplant patients to start a Phase 3 study in 1H 2016
• SHP621 (oral budesonide suspension) for use in the treatment of eosinophilic esophagitis to move into Phase 3 studies by early 2016
• Studies to commence by early 2016 to include a 12 week induction study with a 36 week treatment extension study

Our purpose We enable people with life-altering conditions to lead better lives.
Financial review
Jeff Poulton, Chief Financial Officer
14
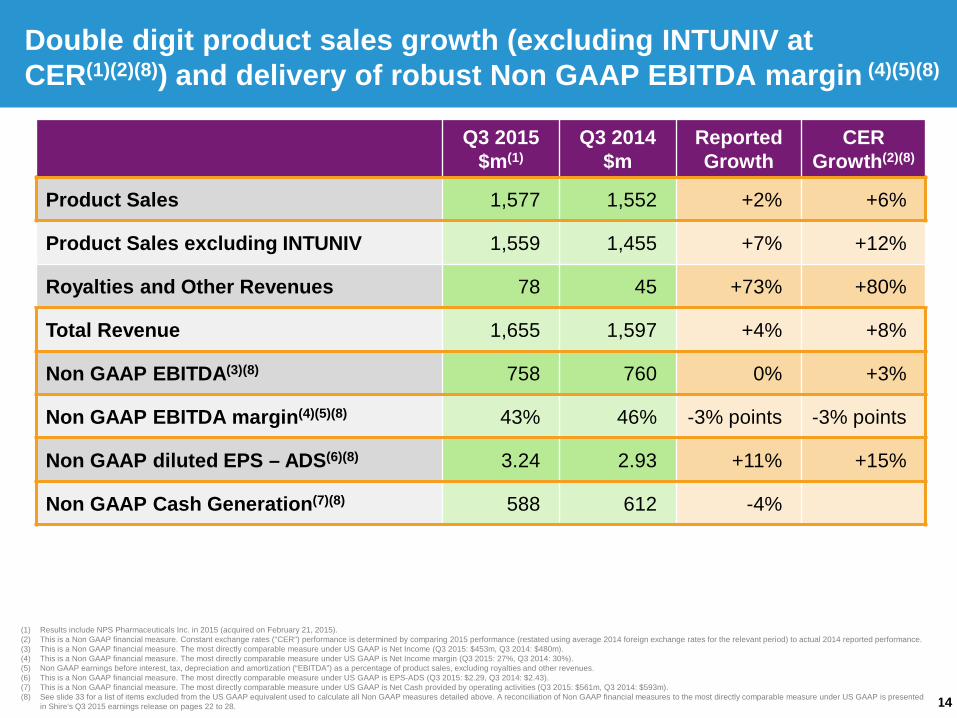
Double digit product sales growth (excluding INTUNIV at CER(1)(2)(8)) and delivery of robust Non GAAP EBITDA margin (4)(5)(8)
(1) Results include NPS Pharmaceuticals Inc. in 2015 (acquired on February 21, 2015). (2) This is a Non GAAP financial measure. Constant exchange rates ("CER") performance is determined by comparing 2015 performance (restated using average 2014 foreign exchange rates for the relevant period) to actual 2014 reported performance. (3) This is a Non GAAP financial measure. The most directly comparable measure under US GAAP is Net Income (Q3 2015: $453m, Q3 2014: $480m). (4) This is a Non GAAP financial measure. The most directly comparable measure under US GAAP is Net Income margin (Q3 2015: 27%, Q3 2014: 30%). (5) Non GAAP earnings before interest, tax, depreciation and amortization (“EBITDA”) as a percentage of product sales, excluding royalties and other revenues. (6) This is a Non GAAP financial measure. The most directly comparable measure under US GAAP is EPS-ADS (Q3 2015: $2.29, Q3 2014: $2.43). (7) This is a Non GAAP financial measure. The most directly comparable measure under US GAAP is Net Cash provided by operating activities (Q3 2015: $561m, Q3 2014: $593m). (8) See slide 33 for a list of items excluded from the US GAAP equivalent used to calculate all Non GAAP measures detailed above. A reconciliation of Non GAAP financial measures to the most directly comparable measure under US GAAP is presented
in Shire's Q3 2015 earnings release on pages 22 to 28.
Q3 2015 $m(1)
Q3 2014 $m
Reported Growth
CER Growth(2)(8)
Product Sales 1,577 1,552 +2% +6%
Product Sales excluding INTUNIV 1,559 1,455 +7% +12%
Royalties and Other Revenues 78 45 +73% +80%
Total Revenue 1,655 1,597 +4% +8%
Non GAAP EBITDA(3)(8) 758 760 0% +3%
Non GAAP EBITDA margin(4)(5)(8) 43% 46% -3% points -3% points
Non GAAP diluted EPS – ADS(6)(8) 3.24 2.93 +11% +15%
Non GAAP Cash Generation(7)(8) 588 612 -4%

15
$1,552m$1,577m
Q3 2014 OTHERPRODUCT
SALES
Total FXImpact
Q3 2015
(1) Results include NPS Pharma Inc. in 2015 (acquired on February 21, 2015). (2) Gattex growth on a pro-forma basis, including product sales recorded by NPS prior to acquisition by Shire. (3) This is a Non GAAP financial measure. Constant exchange rates ("CER") performance is determined by comparing 2015 performance (restated using average 2014 foreign exchange rates for the relevant period) to actual 2014 reported performance. (4) See slide 33 for a list of items excluded from the US GAAP equivalent used to calculate all Non GAAP measures detailed above. A reconciliation of Non GAAP financial measures to the most directly comparable measure under US GAAP is presented in
Shire's Q3 2015 earnings release on pages 22 to 28.
CER(3)(4): Core product sales up $175m or 12%.
FX headwinds holds back reported product sales by $71m or 4%.
INTUNIV generic entry holds back reported product sales by $79m or 6%.
Strong product sales growth in Q3 2015, up 12% (excluding INTUNIV and at CER(1)(3)(4))
Q3 2015(1)
$m Q3 2014
$mReported Growth
CER(3)(4)
GrowthVYVANSE 427 355 +20% +22%CINRYZE 187 145 +29% +30%LIALDA/MEZAVANT 177 177 +0% +2%ELAPRASE 134 169 -21% -10%FIRAZYR 123 98 +25% +28%REPLAGAL 111 136 -18% -6%PENTASA 88 78 +12% +12%VPRIV 85 96 -12% -4%ADDERALL XR 78 95 -18% -17%GATTEX(1) 43 0 n/a n/aNATPARA(1) 7 0 n/a n/aOther 99 106 -7% +3%Total Product Sales excluding INTUNIV 1,559 1,455 +7% +12%
INTUNIV 18 97 -81% -81%Total Product Sales 1,577 1,552 +2% +6%GATTEX Pro-Forma Product Sales(2) 43 28 +54% +56%
16
(1) Results from continuing operations including NPS Pharmaceuticals Inc. in 2015 (acquired on February 21, 2015) and ViroPharma Inc. in 2014 (acquired on January 24, 2014) and excluding DERMAGRAFT in 2014 (treated as a discontinued operation following divestment on January 17, 2014).
(2) This is a Non GAAP financial measure. The most directly comparable measure under US GAAP is R&D (YTD 2015: +47%, YTD 2014: +17%). (3) This is a Non GAAP financial measure. The most directly comparable measure under US GAAP is SG&A (YTD 2015: +18%, YTD 2014: +21%). (4) This is a Non GAAP financial measure. The most directly comparable measure under US GAAP is Combined R&D and SG&A (YTD 2015: +28%, YTD 2014: +20%). (5) This is a Non GAAP financial measure. The most directly comparable measure under US GAAP is Gross Margin (YTD 2015: 83.9%, YTD 2014: 82.4%). (6) This is a Non GAAP financial measure. The most directly comparable measure under US GAAP is R&D (YTD 2015: 27%, YTD 2014: 19%). (7) This is a Non GAAP financial measure. The most directly comparable measure under US GAAP is SG&A (YTD 2015: 38%, YTD 2014: 33%). (8) This is a Non GAAP financial measure. The most directly comparable measure under US GAAP is Net income Margin (YTD 2015: 22%, YTD 2014: 28%). (9) Excluding Royalties and Other Revenues. (10) See slide 33 for a list of items excluded from the US GAAP equivalent used to calculate all Non GAAP measures detailed above. A reconciliation of Non GAAP financial measures to the most directly comparable measure under US GAAP is presented in
Shire's Q3 2015 earnings release on pages 22 to 28.
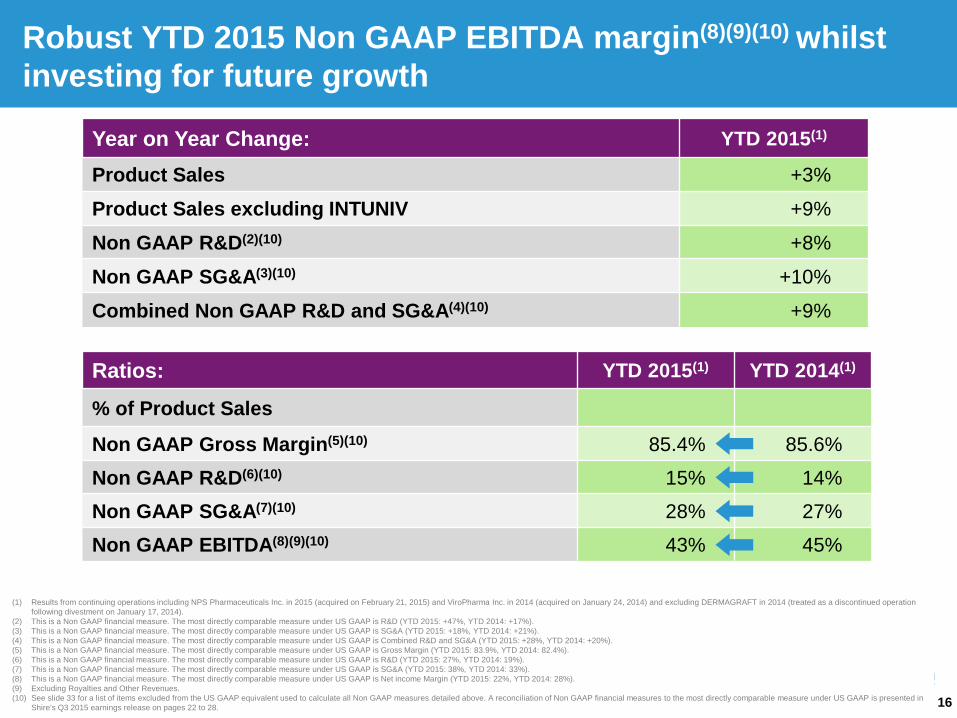
Robust YTD 2015 Non GAAP EBITDA margin(8)(9)(10) whilst investing for future growth
Year on Year Change: YTD 2015(1)
Product Sales +3%
Product Sales excluding INTUNIV +9%
Non GAAP R&D(2)(10) +8%
Non GAAP SG&A(3)(10) +10%
Combined Non GAAP R&D and SG&A(4)(10) +9%
Ratios: YTD 2015(1) YTD 2014(1)
% of Product Sales
Non GAAP Gross Margin(5)(10) 85.4% 85.6%
Non GAAP R&D(6)(10) 15% 14%
Non GAAP SG&A(7)(10) 28% 27%
Non GAAP EBITDA(8)(9)(10) 43% 45%

17
(2,938)
(19)
(24)
(230)
(304)
539
(22)
(27)
588
(1) This is a Non GAAP financial measure. The most directly comparable measure under US GAAP is Net cash provided by operating activities (Q3 2015: $561m, Q3 2014: $593m). (2) This is a Non GAAP financial measure. The most directly comparable measure under US GAAP is Cash and cash equivalents (September 30, 2015: $45m, December 31, 2014: $2,982m). (3) See slide 33 for a list of items excluded from the US GAAP equivalent used to calculate all Non GAAP measures detailed above. A reconciliation of Non GAAP financial measures to the most directly comparable
measure under US GAAP is presented in Shire's Q3 2015 earnings release on pages 22 to 28.
Strong Non GAAP cash generation(1)(3) of $0.6B in Q3 2015. Non GAAP net debt(2)(3) of $2.05B at September 30, 2015
September 30, 2015 $m
December 31, 2014 $m
Cash and cash equivalents 45 2,982
Long-term borrowings (71) -
Short-term borrowings (2,006) (850)
Other debt (13) (13)
Non GAAP Net (debt)/cash(2)(3) (2,045) 2,119
Non GAAP Cash Generation(1)(3)
Non GAAP Free Cash Flow(1)(3)
Other investing and financing
Net Cash outflow YTD
Tax and Interest paid, net
Capital expenditure
Net repayment of facility and term loans
Net Cash outflow QTD
Payments in respect of business combinations

18
Our 2015 Outlook is based on an average of YTD 2015 actual exchange rates and the September 30, 2015 exchange rates holding for Q4 2015 (implied full year rates of Euro:$1.12, £:$1.53, CHF:$1.04, CAD:$0.79). The estimated impact of a 10% appreciation in the US Dollar against the respective currency, over the full year, on our 2015 Guidance is as follows:
(1) Results from continuing operations including NPS Pharmaceuticals Inc. in 2015 (acquired on February 21, 2015) and ViroPharma Inc. in 2014 (acquired on January 24, 2014) and excluding DERMAGRAFT in 2014 (treated as a discontinued operation following divestment on January 17, 2014).
(2) Based on a latest assumption of a full year 2015 weighted average number of ordinary shares of 594 million. (3) See slide 33 for a list of items excluded from the US GAAP equivalent used to calculate all Non GAAP measures detailed above. A reconciliation of Non GAAP financial measures to the most directly comparable measure under US GAAP is presented in
Shire's Q3 2015 earnings release on pages 22 to 28. (4) This is a Non GAAP financial measure. Constant exchange rates ("CER") performance is determined by comparing 2015 guidance (restated using average 2014 foreign exchange rates for the relevant period) to actual 2014 reported performance.
Revenue Earnings
EUR (1.3%) (2.2%)
GBP (0.3%) (0.2%)
CHF (0.1%) 0.4%
CAD (0.3%) (0.4%)
Other (0.6%) (0.8%)
2015 Guidance reiterated
Full Year 2015 Dynamics Direction Versus
FY 14(1) CER Growth (3)(4) Impact of FX Rates on Guidance Guidance
Total Product Sales High single digit growth -3 to 4% points 4-5% higher than
2014
Product Sales excluding INTUNIV Low teens growth Low double digit
Royalties & Other Revenues 45-55% higher than in 2014
Non GAAP Gross Margins(3) ~ Similar to 2014
Non GAAP Combined R&D and SG&A(3) High single digit growth
Non GAAP Net Interest/Other(3) ~ Broadly in line with 2014
Non GAAP Tax Rate(3) Core effective tax rate of 15-17%
Non GAAP diluted Earnings per ADS(2)(3) Low double digit growth -4 to 5% points Mid-to-high single
digit growth
Our purpose We enable people with life-altering conditions to lead better lives.
Summary
Flemming Ornskov, MD, Chief Executive Officer
20
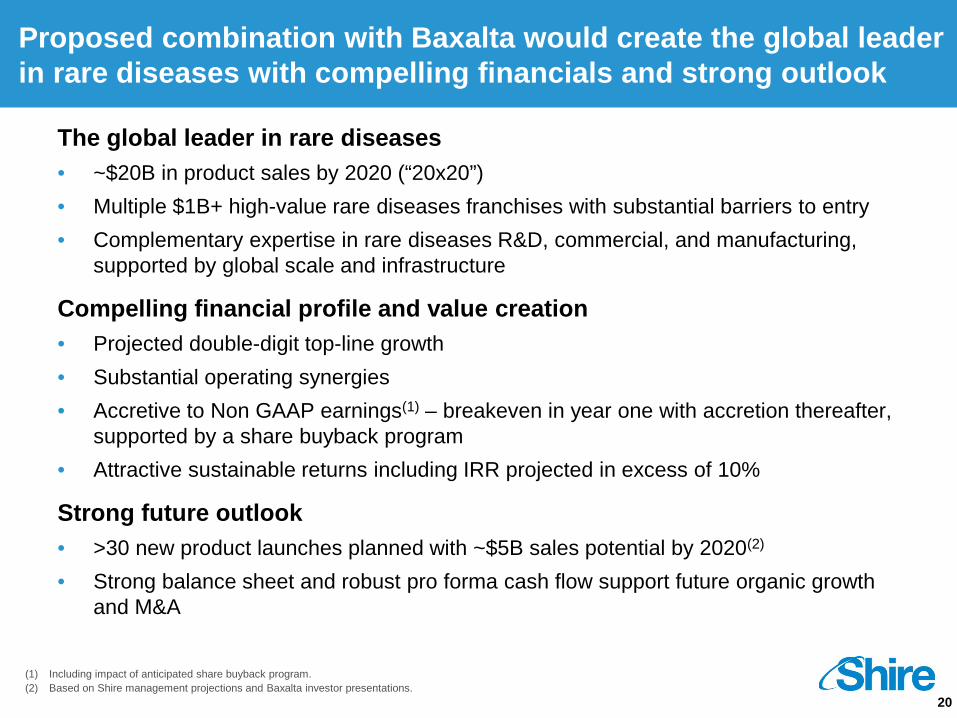
Proposed combination with Baxalta would create the global leader in rare diseases with compelling financials and strong outlook
The global leader in rare diseases • ~$20B in product sales by 2020 (“20x20”) • Multiple $1B+ high-value rare diseases franchises with substantial barriers to entry • Complementary expertise in rare diseases R&D, commercial, and manufacturing,
supported by global scale and infrastructure
Compelling financial profile and value creation • Projected double-digit top-line growth • Substantial operating synergies • Accretive to Non GAAP earnings(1) – breakeven in year one with accretion thereafter,
supported by a share buyback program • Attractive sustainable returns including IRR projected in excess of 10%
Strong future outlook • >30 new product launches planned with ~$5B sales potential by 2020(2)
• Strong balance sheet and robust pro forma cash flow support future organic growth and M&A
(1) Including impact of anticipated share buyback program. (2) Based on Shire management projections and Baxalta investor presentations.
21
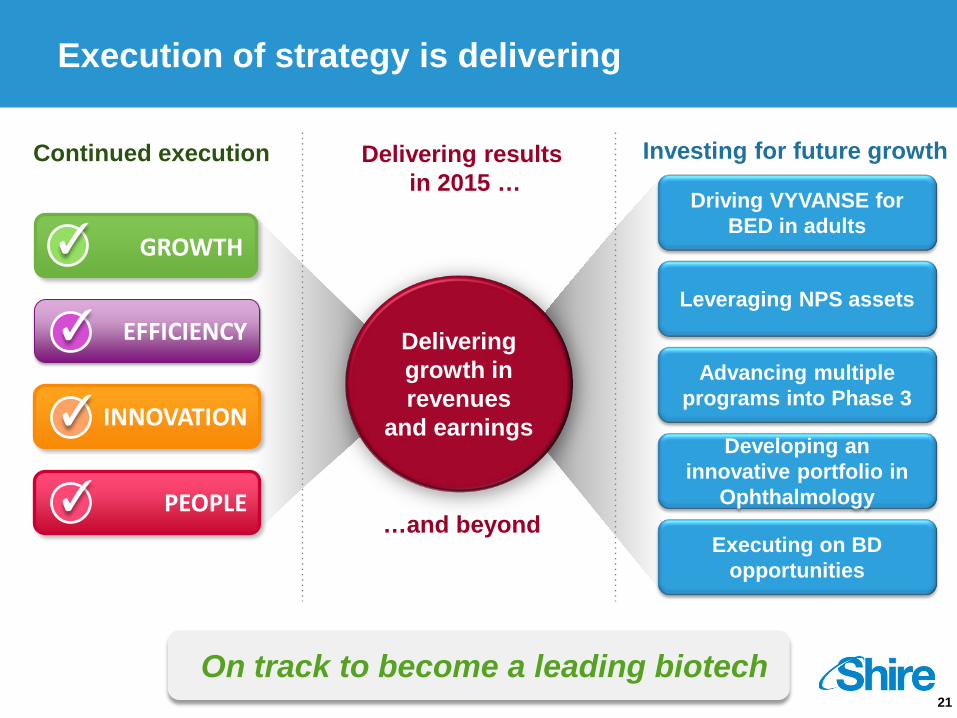
On track to become a leading biotech
Continued execution Delivering results in 2015 …
Delivering growth in revenues
and earnings
Execution of strategy is delivering
Investing for future growth
Executing on BD opportunities
Leveraging NPS assets
Advancing multiple programs into Phase 3
Developing an innovative portfolio in
Ophthalmology
Driving VYVANSE for BED in adults ✓ GROWTH
EFFICIENCY ✓
INNOVATION ✓
PEOPLE ✓ …and beyond

Questions and Answers

Our purpose We enable people with life-altering conditions to lead better lives.
APPENDIX
24
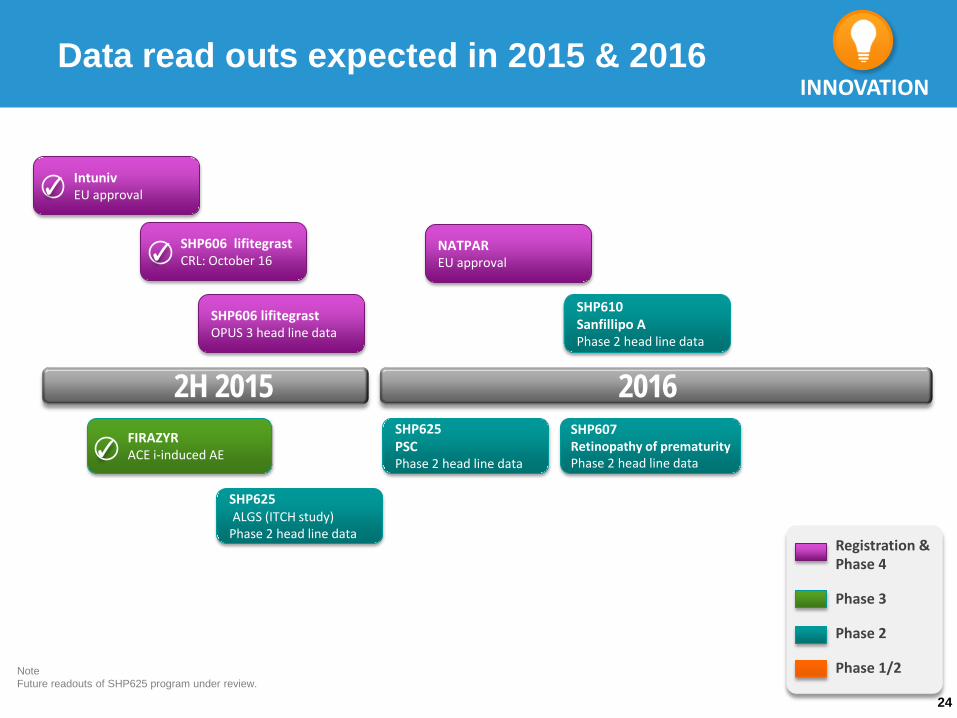
Intuniv EU approval
Data read outs expected in 2015 & 2016
2H 2015
SHP606 lifitegrast CRL: October 16
SHP607 Retinopathy of prematurity Phase 2 head line data
SHP625 ALGS (ITCH study) Phase 2 head line data
Registration & Phase 4
Phase 3
Phase 2
Phase 1/2
INNOVATION
Note Future readouts of SHP625 program under review.
FIRAZYR ACE i-induced AE
VYVANSE BED maintenance
SHP606 lifitegrast OPUS 3 head line data
✓
SHP610 Sanfillipo A Phase 2 head line data
SHP625 PSC Phase 2 head line data
NATPAR EU approval
2016
✓
✓

25
YTD 2015 Performance summary
(1) Results from continuing operations including NPS Pharmaceuticals Inc. in 2015 (acquired on February 21, 2015) and ViroPharma Inc. in 2014 (acquired on January 24, 2014) and excluding DERMAGRAFT in 2014 (treated as a discontinued operation following divestment on January 17, 2014).
(2) This is a Non GAAP financial measure. Constant exchange rates ("CER") performance is determined by comparing 2015 performance (restated using average 2014 foreign exchange rates for the relevant period) to actual 2014 reported performance. (3) This is a Non GAAP financial measure. The most directly comparable measure under US GAAP is Net Income (YTD 2015: $1,023m, YTD 2014: $1,233m). (4) This is a Non GAAP financial measure. The most directly comparable measure under US GAAP is Net Income margin (YTD 2015: 22%, YTD 2014: 28%). (5) Non GAAP earnings before interest, tax, depreciation and amortization (“EBITDA”) as a percentage of product sales, excluding royalties and other revenues. (6) This is a Non GAAP financial measure. The most directly comparable measure under US GAAP is EPS-ADS (YTD 2015: $5.17, YTD 2014: $6.25). (7) This is a Non GAAP financial measure. The most directly comparable measure under US GAAP is Net Cash provided by operating activities (YTD 2015: $1,575m, YTD 2014: $1,674m). (8) See slide 33 for a list of items excluded from the US GAAP equivalent used to calculate all Non GAAP measures detailed above. A reconciliation of Non GAAP financial measures to the most directly comparable measure under US GAAP is presented in
Shire's Q3 2015 earnings release on pages 22 to 28.
YTD 2015 $m(1)
YTD 2014 $m(1)
Reported Growth
CER Growth(2)(8)
Product Sales 4,476 4,330 +3% +8%
Product Sales excluding INTUNIV 4,431 4,051 +9% +14%
Royalties and Other Revenues 225 116 +93% +99%
Total Revenue 4,701 4,446 +6% +10%
Non GAAP EBITDA(3)(8) 2,127 2,063 +3% +7%
Non GAAP EBITDA margin(4)(5)(8) 43% 45% -2% points -3% points
Non GAAP diluted EPS – ADS(6)(8) 8.71 7.95 +10% +14%
Non GAAP Cash Generation(7)(8) 1,609 1,602 0%

26
(1) Results from continuing operations including NPS Pharmaceuticals Inc. in 2015 (acquired on February 21, 2015) and ViroPharma Inc. in 2014 (acquired on January 24, 2014) and excluding DERMAGRAFT in 2014 (treated as a discontinued operation following divestment on January 17, 2014).
US Europe LATAM Other Total
Q3 2015 Product Sales $m(1) 1,169 258 55 95 1,577 % of Product Sales 74% 16% 4% 6% 100% YoY Growth +8% -11% -32% -2% +2%
YTD 2015 Product Sales $m(1) 3,267 769 147 293 4,476 % of Product Sales 73% 17% 3% 7% 100% YoY Growth +8% -10% -13% +3% +3%
FY 2014 Product Sales $m(1) 4,082 1,147 214 387 5,830 % of Product Sales 70% 20% 4% 6% 100% YoY Growth +28% +13% +3% +10% +23%
Product Sales – Regional analysis

27
(1) Results include NPS Pharmaceuticals Inc. in 2015 (acquired on February 21, 2015).
Q3 2015(1)
$m Q3 2014
$m Reported Growth
SENSIPAR 35 - n/a
FOSRENOL 13 15 -10%
3TC and ZEFFIX 12 9 +35%
ADDERALL XR 7 10 -25%
Other 9 6 +33%
Royalties 76 40 +91%
Other Revenues 2 5 -63%
Royalties & Other Revenues 78 45 +73%
Royalties and Other Revenues

28
(1) Results from continuing operations including NPS Pharmaceuticals Inc. in 2015 (acquired on February 21, 2015) and ViroPharma Inc. in 2014 (acquired on January 24, 2014) and excluding DERMAGRAFT in 2014 (treated as a discontinued operation following divestment on January 17, 2014).
(2) This is a Non GAAP financial measure. The most directly comparable measure under US GAAP is Gross Margin (Q3 2015: 83.3%, Q3 2014: 83.6%). (3) This is a Non GAAP financial measure. The most directly comparable measure under US GAAP is Combined R&D and SG&A (Q3 2015: 9%, Q3 2014: 21%). (4) This is a Non GAAP financial measure. The most directly comparable measure under US GAAP is Net income Margin (Q3 2015: 27%, Q3 2014: 30%). (5) This is a Non GAAP financial measure. The most directly comparable measure under US GAAP is Tax rate (Q3 2015: -5%, Q3 2014: 11%). (6) This is a Non GAAP financial measure. The most directly comparable measure under US GAAP is EPS-ADS (Q3 2015: $2.29, Q3 2014: $2.43). (7) See slide 33 for a list of items excluded from the US GAAP equivalent used to calculate all Non GAAP measures detailed above. A reconciliation of Non GAAP financial measures to the most directly comparable measure under US GAAP is presented in
Shire's Q3 2015 earnings release on pages 22 to 28.
Shire income statement growth analysis
2014 Q1 (1)
2014 Q2 (1)
2014 Q3 (1)
2014 Q4 (1)
2014 FY (1)
2015 Q1 (1)
2015 Q2 (1)
2015 Q3 (1)
FY 2015 Dynamics Direction v.
FY 14 Guidance
Total Product Sales $1,308m $1,470m $1,552m $1,500m $5,830m $1,423m $1,476m $1,577m
4-5% higher than in 2014
versus prior year +19% +22% +33% +17% +23% +9% +0% +2%
Royalties & Other Revenues $39m $32m $45m $76m $192m $65m $81m $78m 45-55% higher than in 2014
versus prior year -14% -27% +8% +65% +8% +68% +150% +73%
Total Revenue $1,347m $1,502m $1,597m $1,576m $6,022m $1,488m $1,558m $1,655m
versus prior year +18% +20% +32% +19% +22% +11% +4% +4%
Non GAAP Gross Margin (2)(7) 86% 85% 86% 86% 86% 86% 86% 84% ~ Similar to 2014
Combined Non GAAP R&D and SG&A(3)(7) $539m $602m $618m $677m $2,436m $571m $697m $652m
High single digit growth
versus prior year -3% +2% +10% +11% +5% +6% +16% +5%
Non GAAP EBITDA Margin(4)(7) 45% 44% 46% 41% 44% 46% 39% 43%
Non GAAP Tax Rate(5)(7) 20% 16% 18% 19% 18% 17% 13% 10% Core effective tax rate of 15-17%
Non GAAP diluted Earnings per ADS(6)(7) $2.36 $2.67 $2.93 $2.63 $10.60 $2.84 $2.63 $3.24 Mid-to-high single digit
growth
versus prior year +38% +42% +60% +17% +38% +20% -2% +11%
29
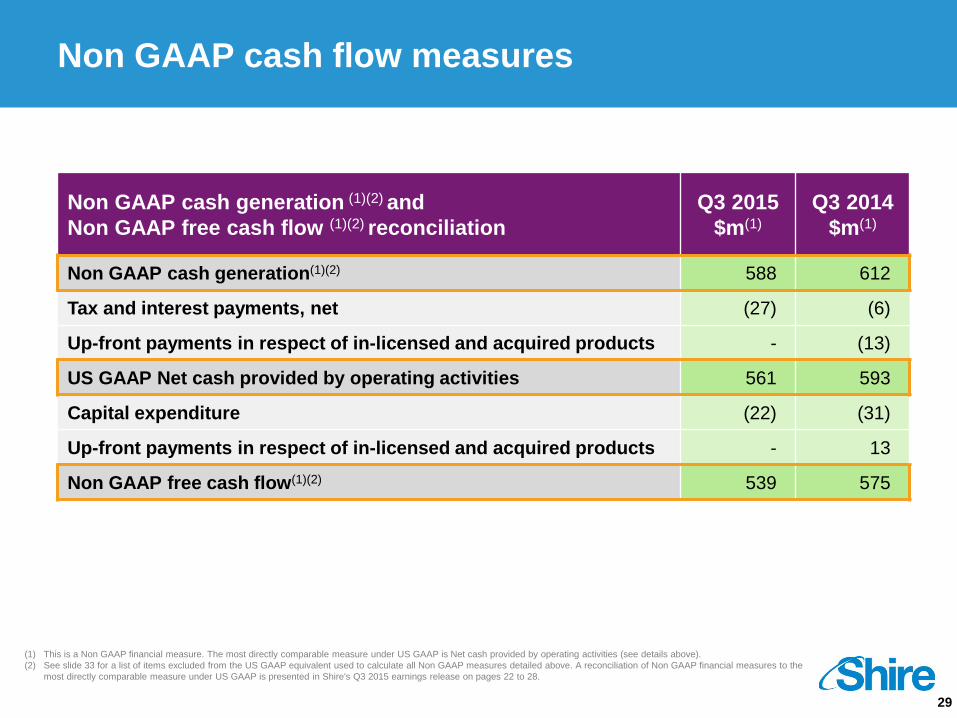
(1) This is a Non GAAP financial measure. The most directly comparable measure under US GAAP is Net cash provided by operating activities (see details above). (2) See slide 33 for a list of items excluded from the US GAAP equivalent used to calculate all Non GAAP measures detailed above. A reconciliation of Non GAAP financial measures to the
most directly comparable measure under US GAAP is presented in Shire's Q3 2015 earnings release on pages 22 to 28.
Non GAAP cash flow measures
Non GAAP cash generation (1)(2) and Non GAAP free cash flow (1)(2) reconciliation
Q3 2015
$m(1) Q3 2014
$m(1)
Non GAAP cash generation(1)(2) 588 612
Tax and interest payments, net (27) (6)
Up-front payments in respect of in-licensed and acquired products - (13)
US GAAP Net cash provided by operating activities 561 593
Capital expenditure (22) (31)
Up-front payments in respect of in-licensed and acquired products - 13
Non GAAP free cash flow(1)(2) 539 575
30
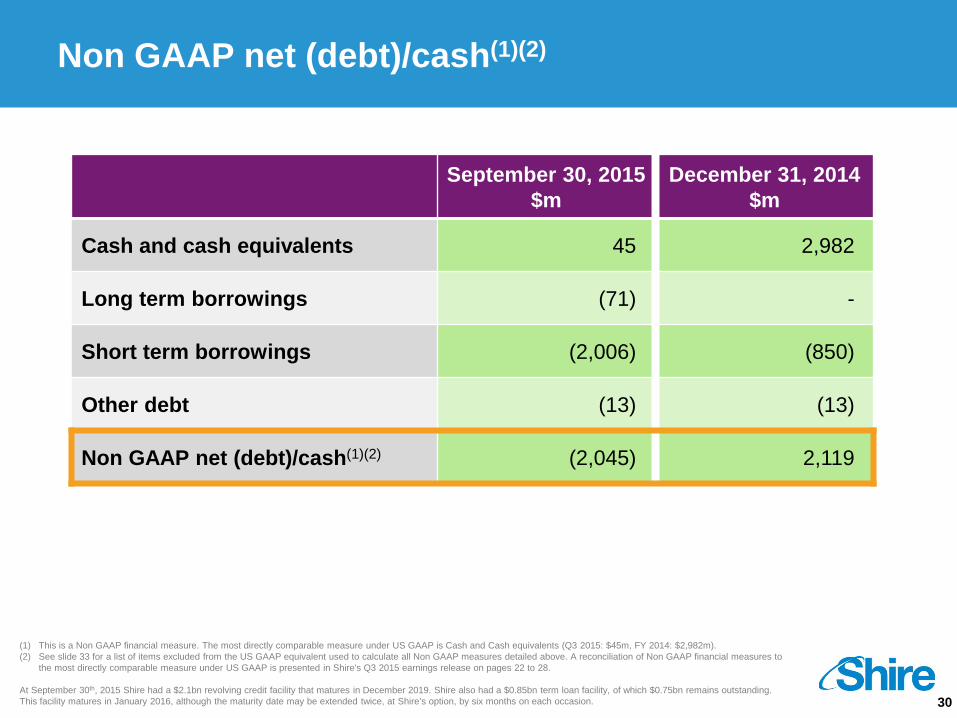
(1) This is a Non GAAP financial measure. The most directly comparable measure under US GAAP is Cash and Cash equivalents (Q3 2015: $45m, FY 2014: $2,982m). (2) See slide 33 for a list of items excluded from the US GAAP equivalent used to calculate all Non GAAP measures detailed above. A reconciliation of Non GAAP financial measures to
the most directly comparable measure under US GAAP is presented in Shire's Q3 2015 earnings release on pages 22 to 28.
At September 30th, 2015 Shire had a $2.1bn revolving credit facility that matures in December 2019. Shire also had a $0.85bn term loan facility, of which $0.75bn remains outstanding. This facility matures in January 2016, although the maturity date may be extended twice, at Shire’s option, by six months on each occasion.
Non GAAP net (debt)/cash(1)(2)
September 30, 2015
$m December 31, 2014
$m
Cash and cash equivalents 45 2,982
Long term borrowings (71) -
Short term borrowings (2,006) (850)
Other debt (13) (13)
Non GAAP net (debt)/cash(1)(2) (2,045) 2,119

31
(1) Results include NPS Pharmaceuticals Inc. in 2015 (acquired on February 21, 2015). (2) This is a Non GAAP financial measure. The most directly comparable measure under US GAAP is US GAAP Operating income (see details above). (3) See slide 33 for a list of items excluded from the US GAAP equivalent used to calculate all Non GAAP measures detailed above. A reconciliation of Non GAAP financial measures to
the most directly comparable measure under US GAAP is presented in Shire's Q3 2015 earnings release on pages 22 to 28.
Q3 2015 – Operating Income US GAAP and Non GAAP
Q3 2015
$m(1) Q3 2014
$m Reported Growth
Non GAAP Operating Income(2)(3) from continuing operations 725 717 +1%
Intangible asset amortization (133) (63)
Legal and litigation costs (2) (3)
Acquisition and integration costs (97) (68)
Gains on sale of product rights 1 46
Reorganization costs (31) (28)
Other (7) (29)
US GAAP Operating Income from continuing operations 456 572 -20%

32
(1) Results from continuing operations including NPS Pharmaceuticals Inc. in 2015 (acquired on February 21, 2015) and ViroPharma Inc. in 2014 (acquired on January 24, 2014) and excluding DERMAGRAFT in 2014 (treated as a discontinued operation following divestment on January 17, 2014).
(2) This is a Non GAAP financial measure. The most directly comparable measure under US GAAP is US GAAP Operating income (see details above). (3) See slide 33 for a list of items excluded from the US GAAP equivalent used to calculate all Non GAAP measures detailed above. A reconciliation of Non GAAP financial
measures to the most directly comparable measure under US GAAP is presented in Shire's Q3 2015 earnings release on pages 22 to 28.
YTD 2015 – Operating Income US GAAP and Non GAAP
YTD 2015
$m(1) YTD 2014
$m(1) Reported Growth
Non GAAP Operating Income(2)(3) from continuing operations 2,022 1,938 +4%
Intangible asset amortization (352) (182)
Impairment of IPR&D intangible assets (523) (188)
Legal and litigation costs (4) (7)
Acquisition and integration costs 24 (259)
Gains on sale of product rights 13 86
Reorganization costs (60) (123)
Other (57) (48)
US GAAP Operating Income from continuing operations 1,063 1,217 -13%
33
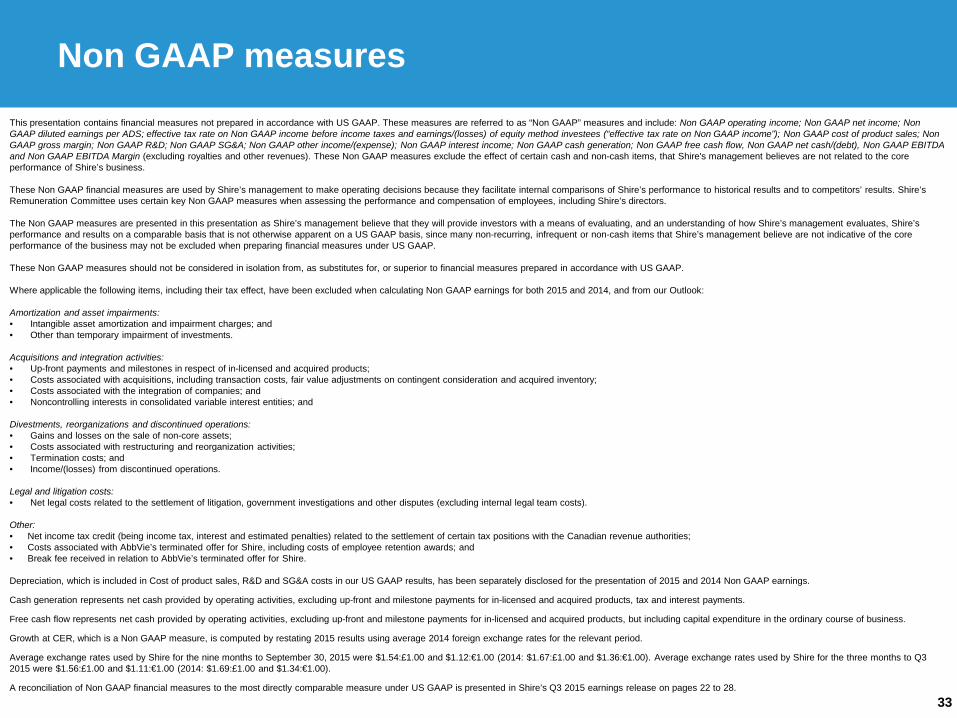
This presentation contains financial measures not prepared in accordance with US GAAP. These measures are referred to as “Non GAAP” measures and include: Non GAAP operating income; Non GAAP net income; Non GAAP diluted earnings per ADS; effective tax rate on Non GAAP income before income taxes and earnings/(losses) of equity method investees (“effective tax rate on Non GAAP income”); Non GAAP cost of product sales; Non GAAP gross margin; Non GAAP R&D; Non GAAP SG&A; Non GAAP other income/(expense); Non GAAP interest income; Non GAAP cash generation; Non GAAP free cash flow, Non GAAP net cash/(debt), Non GAAP EBITDA and Non GAAP EBITDA Margin (excluding royalties and other revenues). These Non GAAP measures exclude the effect of certain cash and non-cash items, that Shire's management believes are not related to the core performance of Shire’s business. These Non GAAP financial measures are used by Shire’s management to make operating decisions because they facilitate internal comparisons of Shire’s performance to historical results and to competitors’ results. Shire’s Remuneration Committee uses certain key Non GAAP measures when assessing the performance and compensation of employees, including Shire’s directors. The Non GAAP measures are presented in this presentation as Shire’s management believe that they will provide investors with a means of evaluating, and an understanding of how Shire’s management evaluates, Shire’s performance and results on a comparable basis that is not otherwise apparent on a US GAAP basis, since many non-recurring, infrequent or non-cash items that Shire’s management believe are not indicative of the core performance of the business may not be excluded when preparing financial measures under US GAAP. These Non GAAP measures should not be considered in isolation from, as substitutes for, or superior to financial measures prepared in accordance with US GAAP. Where applicable the following items, including their tax effect, have been excluded when calculating Non GAAP earnings for both 2015 and 2014, and from our Outlook: Amortization and asset impairments: • Intangible asset amortization and impairment charges; and • Other than temporary impairment of investments. Acquisitions and integration activities: • Up-front payments and milestones in respect of in-licensed and acquired products; • Costs associated with acquisitions, including transaction costs, fair value adjustments on contingent consideration and acquired inventory; • Costs associated with the integration of companies; and • Noncontrolling interests in consolidated variable interest entities; and Divestments, reorganizations and discontinued operations: • Gains and losses on the sale of non-core assets; • Costs associated with restructuring and reorganization activities; • Termination costs; and • Income/(losses) from discontinued operations. Legal and litigation costs: • Net legal costs related to the settlement of litigation, government investigations and other disputes (excluding internal legal team costs). Other: • Net income tax credit (being income tax, interest and estimated penalties) related to the settlement of certain tax positions with the Canadian revenue authorities; • Costs associated with AbbVie’s terminated offer for Shire, including costs of employee retention awards; and • Break fee received in relation to AbbVie’s terminated offer for Shire. Depreciation, which is included in Cost of product sales, R&D and SG&A costs in our US GAAP results, has been separately disclosed for the presentation of 2015 and 2014 Non GAAP earnings.
Cash generation represents net cash provided by operating activities, excluding up-front and milestone payments for in-licensed and acquired products, tax and interest payments.
Free cash flow represents net cash provided by operating activities, excluding up-front and milestone payments for in-licensed and acquired products, but including capital expenditure in the ordinary course of business.
Growth at CER, which is a Non GAAP measure, is computed by restating 2015 results using average 2014 foreign exchange rates for the relevant period.
Average exchange rates used by Shire for the nine months to September 30, 2015 were $1.54:£1.00 and $1.12:€1.00 (2014: $1.67:£1.00 and $1.36:€1.00). Average exchange rates used by Shire for the three months to Q3 2015 were $1.56:£1.00 and $1.11:€1.00 (2014: $1.69:£1.00 and $1.34:€1.00).
A reconciliation of Non GAAP financial measures to the most directly comparable measure under US GAAP is presented in Shire’s Q3 2015 earnings release on pages 22 to 28.
Non GAAP measures