progress tables (value tables): another measure of … 21. 2015 progress tables (value tables):...
TRANSCRIPT

January 21. 2015
Progress Tables (Value Tables): Another Measure of Student
Growth
Presentation to the Virginia Board of Education’s Committee on School and Division Accountability
January 21, 2015
1

January 21. 2015
Student Growth Percentiles
• For the past several years Virginia has used student growth percentiles (SGPs) as a measure of growth for its reading and mathematics tests.
• SGPs measure growth by comparing individual student performance to that of other students with similar score histories.
• Because of this comparison, SGPs must be calculated each year, and the calculations cannot be prepared until all statewide data are available. This requirement has resulted in growth information not being available to school districts until the early fall of the next school year.
2
January 21. 2015
Transition to Progress Tables • Because of limitations of SGPs, Department of
Education (DOE) staff have been investigating other growth models.
• The progress table model was selected because it accounts for student success in closing the achievement gap, is more understandable, and is available for more students.
3

January 21. 2015
Transition to Progress Tables • In the progress table model, student growth is
determined by comparing the student’s test score in the current year to his/her prior test score.
• VDOE plans to transition to the use of progress tables as a growth measure in the 2015-2106 school year.
4

January 21. 2015
Change in ESEA Waiver
• The current ESEA waiver identifies SGPs as the growth measure used in Virginia.
• Because of the planned transition to progress tables in 2015-2016, information about the planned change is included in the current ESEA waiver application.
• In the ESEA waiver application, “progress tables” are referred to as “ value tables” as this is the technical term.
5
January 21. 2015
Development of Progress Tables Using Performance Levels
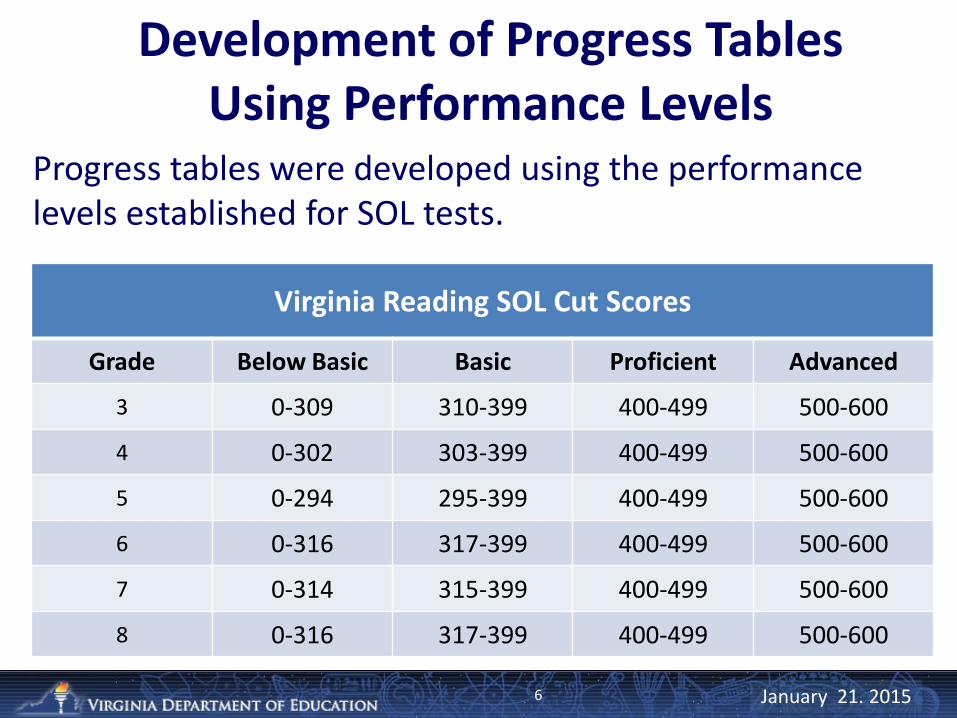
Virginia Reading SOL Cut Scores
Grade Below Basic Basic Proficient Advanced
3 0-309 310-399 400-499 500-600
4 0-302 303-399 400-499 500-600
5 0-294 295-399 400-499 500-600
6 0-316 317-399 400-499 500-600
7 0-314 315-399 400-499 500-600
8 0-316 317-399 400-499 500-600
6
Progress tables were developed using the performance levels established for SOL tests.

January 21. 2015
Development of Sub-levels for Progress Tables
• Each performance level (Below Basic, Basic, Proficient, and Advanced) was divided into two sub-levels: Low and High
• Use of sub-levels allows more opportunity for students to demonstrate growth
7

January 21. 2015
Performance Sub-Levels
Virginia Reading SOL Cut Scores
Grade Below Basic Basic Proficient Advanced
Low High Low High Low High Low High
3 0-280 281-309 310-361 362-399 400-438 439-499 500-511 512-600
4 0-277 278-302 303-359 360-399 400-438 439-499 500-512 513-600
5 0-270 271-294 295-360 361-399 400-438 439-499 500-512 513-600
6 0-291 292-316 317-364 365-399 400-440 441-499 500-511 512-600
7 0-291 292-314 315-365 366-399 400-440 441-499 500-511 512-600
8 0-293 294-316 317-366 367-399 400-438 439-499 500-507 508-600
8

January 21. 2015
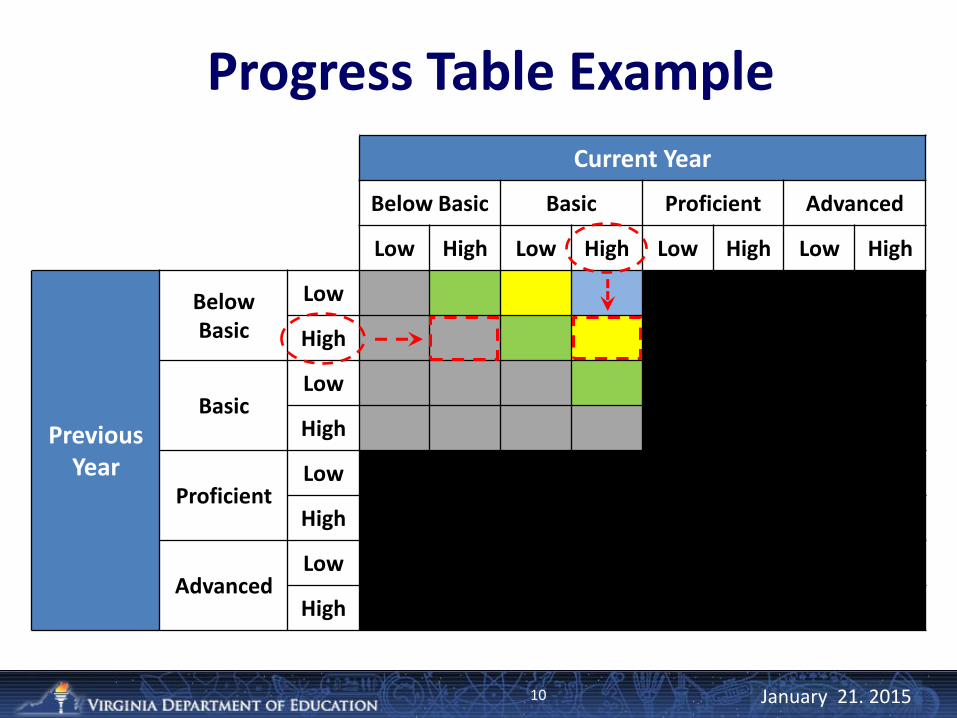
Determining Growth
• Growth is measured by the number of performance sub-levels a student advances toward demonstrating proficiency of the state standards.
• For example, a student whose grade 3 Reading SOL score was in the “Below Basic – High” performance sub-level and whose grade 4 Reading SOL score was in the “Basic – High” performance sub-level improved by two sub-levels.
9
January 21. 2015
Progress Table Example
10
Current Year
Below Basic Basic Proficient Advanced
Low High Low High Low High Low High
Previous Year
Below Basic
Low
High
Basic Low
High
Proficient Low
High
Advanced Low
High

January 21. 2015
Progress Table Example
11
Current Year
Below Basic Basic Proficient Advanced
Low High Low High Low High Low High
Previous Year
Below Basic
Low
High
Basic Low
High
Proficient Low
High
Advanced Low
High
1 2
January 21. 2015
Progress Table Growth Labels
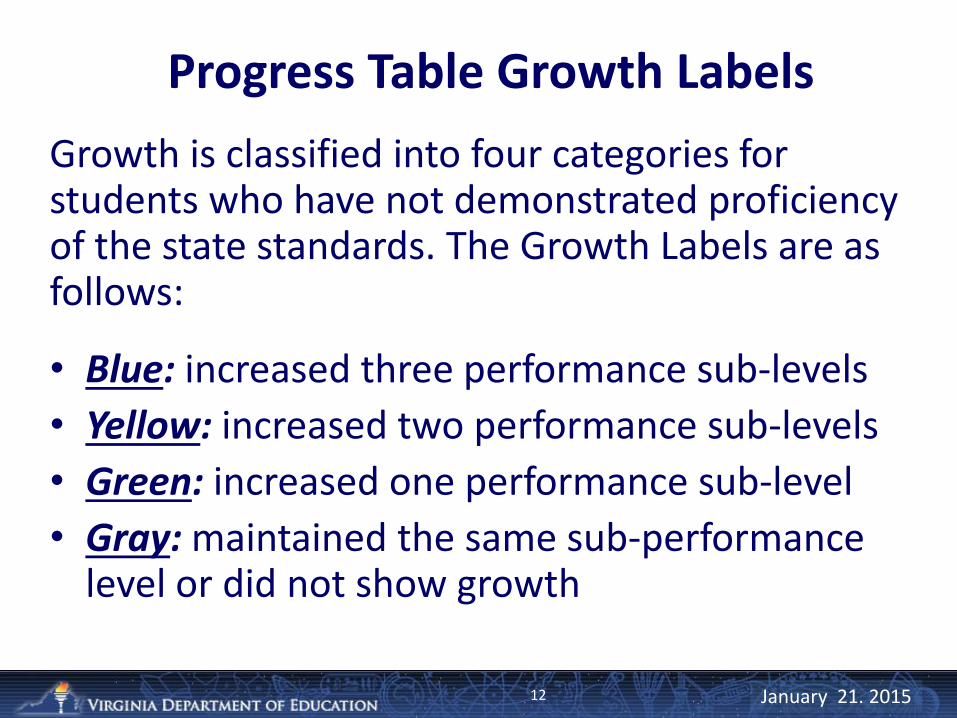
Growth is classified into four categories for students who have not demonstrated proficiency of the state standards. The Growth Labels are as follows:
• Blue: increased three performance sub-levels
• Yellow: increased two performance sub-levels
• Green: increased one performance sub-level
• Gray: maintained the same sub-performance level or did not show growth
12

January 21. 2015
Advantages of Progress Tables
Provide for maximum transparency and validity • The process for determining student growth is more
easily understood. • Progress tables are meaningful at the student, group,
teacher, school and division level. • Students and teachers will know in advance what
score on the current year’s test will be necessary to show growth.
• Student progress is determined by comparing the student to his/her prior performance.
• Change in performance level is calculated for each student who has not demonstrated proficiency on the state standards for two consecutive years.
13

January 21. 2015
Advantages of Progress Tables - continued -
• Maintains rigorous standards for student growth.
• Growth data from the value tables should be available soon after the student finishes testing rather than waiting until all test data are available.
14

January 21. 2015
Advantages of Progress Tables - continued -
• Applicable to regular, alternate and alternative assessments:
Standards of Learning (SOL):
• Grades 3-8 Reading
• Grades 3-8 Mathematics, Algebra I (Perhaps Geometry and Algebra II, as well)
Virginia Grade Level Alternative (VGLA):
• Grades 3-8 Reading
Virginia Alternate Assessment Program (VAAP):
• Grades 3-8 Reading
• Grades 3-8 Mathematics
15

January 21. 2015
Potential Application to Accreditation
• The growth measure derived from the Progress
Tables could be used to create an “adjusted” accreditation pass rate.
• This adjusted pass rate might be used to identify schools that eligible for a new accreditation pass rate that would recognize students who failed the tests but made significant growth toward proficiency.
16

January 21. 2015
Potential Application to Accreditation
• In the current calculation of the accreditation pass rate, a passing student counts as “one passer” in the numerator of the pass rate. In order to account for students working toward demonstrating proficiency, partial credit could be awarded for sub-level growth.
• For example, partial points for growth could be awarded for student progress as shown below: – a student who fails but progresses three sub-levels would
count as 0.75, – a student who progresses two sub-levels would count as
0.5, and – a student who progresses one sub-level would count as
0.25.
17

January 21. 2015
Potential Application to Accreditation
Using the “partial point for growth” logic, the accreditation pass rate could be adjusted in the following manner to account for growth:
18
Accreditation Pass Rate
[(# moving 3 levels x 0.75) + (# moving 2 levels x 0.5) + (# moving 1 level x 0.25)]
# of failing students +
January 21. 2015
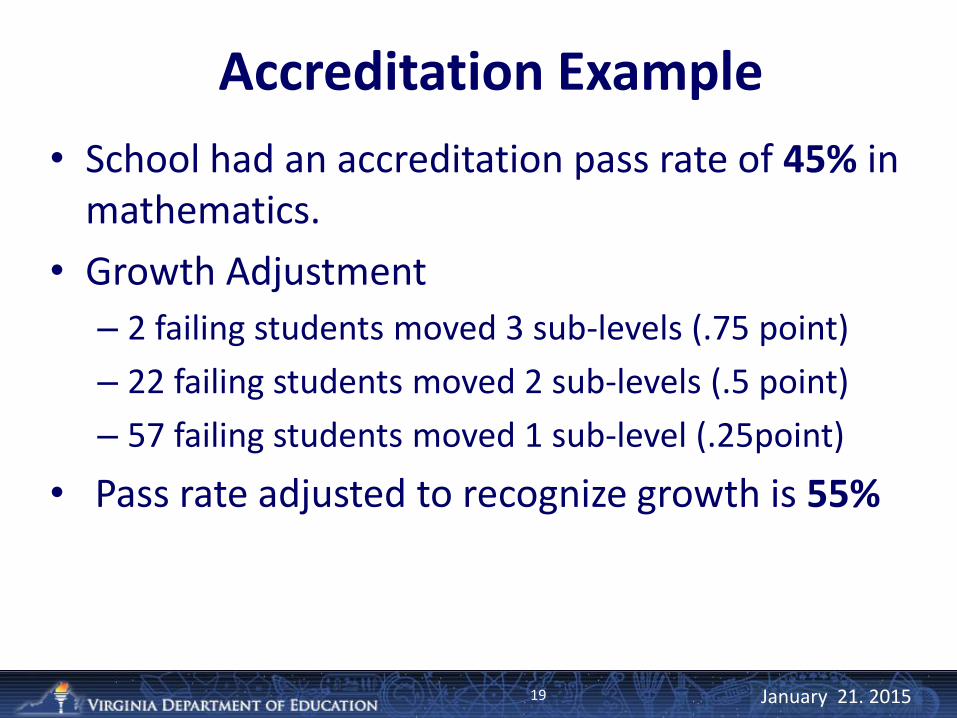
Accreditation Example
• School had an accreditation pass rate of 45% in mathematics.
• Growth Adjustment
– 2 failing students moved 3 sub-levels (.75 point)
– 22 failing students moved 2 sub-levels (.5 point)
– 57 failing students moved 1 sub-level (.25point)
• Pass rate adjusted to recognize growth is 55%
19

January 21. 2015
Progress Tables and Evaluation
• Utilizing growth measures as part of the teacher evaluation process may be accomplished by calculating the aggregate growth of the students in the teacher’s class.
• Similarly, growth measures may be used as part of the principal evaluation process by aggregating the growth demonstrated by students in the principal’s school.
20

January 21. 2015
Other States
Progress tables have been used in a number of states, including:
• Arkansas
• Delaware
• Florida
• Iowa
• Michigan
• Minnesota
• New Hampshire
• Texas
• Puerto Rico
21

January 21. 2015
Questions?
22