progress report: toledo area regional transit authority ... · progress report: toledo area...
TRANSCRIPT

Progress Report: Toledo Area Regional Transit Authority (TARTA)
and the City of Toledo Biodiesel Study
June 1, 2007 through May 30, 2008
(This Progress Report is based on data collected in the second one-third of the project.)
Sponsor: Congresswoman Marcy Kaptur –
Her vision and support are vital to this project.
Partners: TARTA, the City of Toledo, the Intermodal Transportation Institute at The University of Toledo, H2 Engine Systems, Shrader Tire and Oil, Chevron, Biodiesel
Partnership for Renewable Energy

TABLE OF CONTENTS Page EXECUTIVE SUMMARY ............................................................................................... i PROGRESS REPORT Purpose Using Biodiesel Performance and Costs TARTA Results City of Toledo Results Life Cycle Costs Environmental Impact Assessment APPENDIX

TARTA Year 2 Report
i
Executive Summary Progress Report: Toledo Area Regional Transit Authority (TARTA)
and City of Toledo Biodiesel Study July 1, 2007 through June 30, 2008
(Progress Report is based on data collected in the second one-third of the project.)
With the vision and leadership of Congresswoman Marcy Kaptur, the Toledo Area Regional Transit Authority (TARTA) and the Intermodal Transportation Institute (ITI) at the University of Toledo developed a long-term, large scale comprehensive research project to understand and assess the impacts of using a mixture of renewable biofuel and diesel fuel (B-20: 20% biofuel and 80% ultra-low sulfur diesel) compared to ultra-low sulfur diesel (ULSD). The following factors make this study unique.
1. This is the first study that does on-road testing of ultra-low sulfur diesel supreme
and the first attempt to investigate the impact of using B-20 made with ultra-low sulfur diesel.
2. The testing is exhaustive including nearly 60 vehicles over a three year period and involves more than 5 million miles of operation.
3. With three years of data, it is possible to estimate and compare the life cycle costs of using ultra-low sulfur (ULSD) fuel versus B-20 made with ULS diesel.
4. In addition to tail pipe emission testing, this study examines in-bus air quality. Using these data, the study attempts to create a model to estimate the impact of in-bus air quality on health and wellness.
5. This is the first study that examines the use of hydrogen gas as an additive to B-20.
The purpose of the study is to investigate the impact of using ULS diesel and B-20 made with ULSD on engine emissions and air quality inside the bus as well as on operating costs including fuel economy and maintenance costs. In addition, the impact on engine wear is assessed by examining the metal content of the engine oil after each oil change. These cost factors are combined to estimate and compare the total life cycle costs of operating vehicles on ULS diesel fuel and B-20 made with ULSD. During the study, 47 buses from TARTA and 3 vehicles from the City of Toledo are part of the research. Performance and Costs For the City of Toledo, there was an improvement in miles per gallon (mpg) for B-20 over ULSD for the Ford F-250 and the Mack MR6885 trucks. The data for the ULS diesel was collected in 2005-2006. With respect to engine maintenance on the City of Toledo vehicles currently in the study, none of the vehicles had engine related maintenance during this period.

TARTA Year 2 Report
ii
City of Toledo Vehicles
MPG
Fuel Costs ($/mi)
Engine ($/mi) Maintenance
Vehicle
B-20 ULSD Change B-20 ULSD Change B-20 ULSD Ford F-250
12.41 11.15 11.30% $0.255 $0.227 12.33% $0.00 $0.00
Crane LET-2
2.33 2.53 -7.51% $1.410 $1.000 41.00% $0.00 $0.00
Mack MR6885
2.51 2.29 9.61% $1.399 $1.103 26.84% $0.00 $0.00
(NOTE: The B-20 figures are results from the second year. The ULSD figures are baseline data that was collected on these vehicles prior to the study. Change computation formula is as follows: (B-20 – ULSD)/ULSD For TARTA vehicles, data was collected for mileage and fuel consumption for 19 Thomas buses using B-20, 18 Thomas buses using ULSD, 5 Bluebird buses using B-20, and 5 Bluebird buses using ULSD for this period. The tables in the Appendix show the performance and cost details of the report. Buses were run on different routes.
• Fuel cost is based on price provided by TARTA: o B-20 = $3.007/gallon (Tables A1, A2) o ULSD = $2.864/gallon (Tables A3, A4)
• Thomas Buses: o Average MPG of buses using B-20 (3.9842) is 17.37% lower than MPG of
buses using ULSD (4.8216). o Average fuel cost/mile of buses using B-20 ($0.8219) is 26.24% higher
than that of buses using ULSD ($0.6062). • Bluebird Buses:
o Average MPG of buses using B-20 (4.1839) is 5.25% lower than MPG of buses using ULSD (4.4158).
o Average fuel cost/mile of buses using B-20 ($0.7344) is 11.34% higher than that of Bluebird buses using ULSD ($0.6511).
On the Thomas buses in the TARTA fleet, engine related maintenance cost was $0.0163/mile for the buses using ULSD/ULSD Supreme and $0.0106/mile for buses using B-20. For the Bluebird buses the engine related maintenance costs were $0.0324/mile and $0.0239/mile for ULSD/ULSD Supreme and B-20, respectively. For the second year, buses run on B-20 had lower engine related maintenance costs than vehicles using ULSD/ULSD Supreme. With respect to engine wear for the TARTA fleet, oil test data were collected for twenty-four B-20 and twenty-three ULSD Thomas buses between June, 2007 and May, 2008 in Year 2 of the study. Testing was done when the engine oil was changed. Analysis of the

TARTA Year 2 Report
iii
engine oil was conducted by Staveley Services, an expert in fluid analysis. The results showed that the buses run on B-20 required corrective action in less than half as many cases as those run on ULSD in Bluebird buses, and slightly more than half in Thomas buses. In all cases for both B-20 and ULSD the readings were well within limits. Currently, there is insufficient data to develop life cycle costs. These estimates will be developed next year as more data becomes available. Environmental Impact Assessment A field study to continuously collect indoor air quality data was carried out. The study found that the in-bus concentration levels are affected by different factors in each month studied. This finding is different from the results given in the current literature. Those reported studies generally combine all the data to draw conclusions regardless of the time of the year.
An extensive exhaust emission study was performed and the buses in the study which included idle testing, real-world on-road testing and special test cycles to compare the effects of B-20, ULSD, and ULSD supreme. The emissions comparison showed that the buses running on B-20 produced lower emissions of CO, NO, SO2, NO2, and NOX when compared to ULSD supreme. But the concentration of CO2 was observed to increase for the buses operating on B-20. For Cummins and Mack trucks, the exhaust gas concentrations of CO, SO2, NOX, and CO2 were very high during cold starts compared to hot starts for all fuel/manufacturing year combinations. No significant reduction trends were observed in the concentrations of regulated pollutants during cold and hot idling modes using B-20 over ULSD supreme for Mack trucks, whereas the concentration of CO has decreased with the use of B-20 over ULSD supreme during both idling modes for Cummins trucks. These results on particulate characterization should be considered as preliminary in nature. Please refer to the full report for an explanation of the methodology used for airborne diesel exhaust analysis. New Activities Planned For Year 3
1. Conduct tests on the fuel economy in stop-and-go or over-the-road runs. 2. Complete life cycle costing 3. Conduct a detailed analysis of maintenance costs to determine if there is a
relationship between the type of fuel used and engine related maintenance. 4. Investigate the characteristics in the use of different levels of biodiesel from B-5
up to B-100. 5. Investigate the possibility of using additives in ULSD and in B-20 to determine if
there are differences in fuel economy and emissions.
TARTA Year 2 Report
- 1 -
Progress Report: Toledo Area Regional Transit Authority (TARTA)
and the City of Toledo Biodiesel Study
PURPOSE The purpose of the study is to investigate the impact of using ultra low sulfur diesel (ULSD) and B-20 (made with 20% biofuel and 80% ultra low sulfur diesel) on engine emissions and air quality inside the buses, as well as on operating costs including fuel economy and maintenance costs. In addition, the impact on engine wear is assessed by examining the metal content of the engine oil after each oil change. These cost factors are combined to estimate and compare the total life cycle costs of operating vehicles on ULSD and B-20. This study involves 47 buses from TARTA and 3 vehicles from the City of Toledo. The TARTA buses are divided into two groups with one group using ULSD and another using B-20. During the course of the full three year study the following factors will be measured, evaluated, and discussed.
1. Assess the Use of B-20: • What start-up problems, if any, were encountered in switching from diesel
to biodiesel? • Were any on-going problems encountered in using biodiesel? • How did the mechanics and their supervisors react to servicing vehicles
that burned biodiesel? • What was the driver’s reaction to the use of biodiesel, especially power
and performance? 2. Performance and Costs:
• Overview of the methods used to gather data and to ensure accuracy • Miles per gallon and fuel cost per mile for TARTA and City of Toledo • Maintenance cost for TARTA and City of Toledo • Engine wear for TARTA • Life cycle cost
3. Environmental Impacts: • Overview of the methods used to gather data and to ensure accuracy • In-bus air quality for TARTA • Tail pipe emissions for TARTA
4. Hydrogen Enhancement Project: • Brief and simplified statement about the technology and anticipated
outcomes • Overview of the modifications made to the bus • Overview of the methods used to gather data and to ensure accuracy • Impact of the addition of hydrogen on fuel economy • Impact of the addition of hydrogen on emissions

TARTA Year 2 Report
- 2 -
USING BIODIESEL For the period covering this report during Year 2, the City of Toledo used three vehicles operating on B-20 made with ULSD (2003 Ford F-250 pickup truck with a 6.0 liter power stroke diesel, 2003 Mack MR6885 refuse packer with a 12.0 liter Mack Diesel, and 2001 Crane LET – 2 recycle truck with an 8.3 liter Cummins Diesel). TARTA used 37 Thomas buses with 2003 Detroit Diesel MBE 900 engines and 10 Bluebird buses with 2006 Cummins ISB engines. In the buses, half of each type used ULSD and the other half used B-20 made with ULSD. In addition, near the end of Year 2 TARTA operated ten new Bluebird buses on B-20, bringing the total number of Bluebird buses to 20. It is important to note that ULSD switched over to ULSD Supreme near the end of December, 2007. Therefore, all analysis is based on use of ULSD through 2007, and commencing with ULSD Supreme in beginning of 2008. Biodiesel mixture always utilized ULSD as the diesel component.

TARTA Year 2 Report
- 3 -
PERFORMANCE AND COSTS The overall study was designed to investigate the impact of a mixture of renewable bio-fuel and diesel fuel on operating costs as well as engine performance, and expected life cycle in a subset of the TARTA bus fleet and City of Toledo vehicles. Design of the study Fuels. Two fuels were evaluated: (1) ultra low sulfur diesel (ULSD) fuel initially, then ULSD/ULSD Supreme and (2) B-20, a mix of 80% ULSD and 20% bio-fuel. Ultra low sulfur diesel Supreme was used in the TARTA vehicles commencing December 18, 2007 with record keeping commencing in January ‘08. The City of Toledo vehicles used B-20 made with ULSD in its three test vehicles, but it continued to use ultra low sulfur diesel in the balance of the fleet. Vehicles. The vehicles used in the study at TARTA included 47 buses ( 37 Thomas buses and 10 Bluebird buses). Each type of bus was divided into two groups, one using ULSD and the other using B-20. For the City of Toledo, three vehicles were included in the study (1 – Ford F-250 truck, 1 – Mack MR6885 refuse packer, and 1 – Crane LET-2 recycle truck) all running on B-20. Data Collection The following data on performance and costs was collected during the reporting period . Data collection will continue through the third year of the study. Fuel data (each time a vehicle is fueled)
Type of fuel Amount of fuel Odometer reading
Oil data (each time oil is added)
Make, type and viscosity of oil Amount of oil Odometer reading
Oil data (each time oil is changed)
Make, type and viscosity of oil Amount of oil Odometer reading Oil sample analysis data
Cost data The following elements were identified by both TARTA personnel and the study team as items that could have an impact on the operation, repair and maintenance of the vehicles:

TARTA Year 2 Report
- 4 -
1. Cost per gallon for each type of fuel. 2. Repair Costs: air intake system, cooling system, radiator, fan, water pump,
thermostats, coolant preheater engine, fan clutch, fan drive, exhaust system, emission controls, fuel system, tank and pump.
3. Maintenance Costs: TARTA performs regular preventive maintenance on their
vehicles at the recommended periods (3 months) or based on mileage. There are three levels of service: A, B and C. Service A is typically lubrication, oil and filter change. Additional services like brake service, etc., are done under B and C. Usually B and C are performed along with A. Typically, every three months AB or AC maintenance is performed. An analysis of the costs between June 2007 and May 2008 showed that nonengine repair and maintenance costs of buses using B-20 was 30.5 % lower than buses using ULSD (See Tables A1 – A4 in Appendix). Preventive maintenance is performed on the City of Toledo vehicles every 4,500 miles.

TARTA Year 2 Report
- 5 -
TARTA RESULTS
Ultra Low Sulfur Diesel B20 Diesel
Cost Difference
Year Month Average Cost/Gal.
B20 Average Cost/Gal. B20-ULSD
2007 June 2.241$ 2.368$ 0.126$
2007 July 2.341$ 2.448$ 0.107$
2007 Aug. 2.359$ 2.466$ 0.107$
2007 Sept. 2.500$ 2.598$ 0.097$
2007 Oct. 2.501$ 2.704$ 0.203$
2007 Nov. 2.941$ 2.988$ 0.047$
2007 Dec. 2.737$ 2.868$ 0.130$
Total 17.621$ 18.439$ 0.818$
2.517$ 2.634$ 0.117$
Timeframe
Average
Table 1a. Average Monthly Fuel Cost per Gallon - June '07 - Dec. '07
Table 1a reflects the average cost of ULSD and B-20 during the period June 2007 through December 2007. Notably, there is generally an increase in the average cost-per-gallon for B-20 of $.117 per gallon.
$2.000 $2.100 $2.200 $2.300 $2.400 $2.500 $2.600 $2.700 $2.800 $2.900 $3.000
June July Aug. Sept. Oct. Nov. Dec.
Cost/G
allon ($)
Fig. 1a. Monthly Fuel Cost Comparison June'07 - December '07
Average Cost/Gal. of ULSD
Average Cost/Gal. of B20

TARTA Year 2 Report
- 6 -
Table 1b reflects average fuel costs, of B-20 and ULSD (ULSD Supreme) between June and December, 2007.
Ultra Low Sulfur Diesel
Supreme B20 DieselCost
Difference
Year Month Average Cost/Gal.
B20 Average Cost/Gal.
Difference B20 -
ULSDS2008 Jan. 2.982$ 2.903$ (0.080)$ 2008 Feb. 2.881$ 3.139$ 0.258$ 2008 March 3.425$ 3.807$ 0.382$ 2008 April 3.565$ 3.748$ 0.183$ 2008 May 3.899$ 4.047$ 0.148$ Total 16.751$ 17.644$ 0.893$
3.350$ 3.529$ 0.179$
Table 1b. Average Monthly Fuel Cost per Gallon - Jan '08 - May '08
Timeframe
Average This table reflects average fuel costs, and the difference between ULSD and B20. Values The parentheses represent amount of B20 exceeding ULSD. There is generally an increase in the average cost per gallon of B20 of $.179.
2.5
3
3.5
4
4.5
0 2 4 6
Cost/Gallon ($)
2008 Months (Jan- May)
Fig 1b. Monthly Fuel Cost Comparison Jan. '08- May '08
Average Cost/Gal. of ULSD
B20 Average Cost/Gal.

TARTA Year 2 Report
- 7 -
MPG and Fuel Cost per Mile for TARTA Buses (The tables containing the detail from which the information in this section was developed can be found in the Appendix.) Comparison of Average MPG of Buses: Data was collected for mileage and fuel consumption for 19 Thomas buses using B-20, (Bus ID 500 – 518, Table A1) ; 18 Thomas buses initially using ULSD, followed by ULSD Supreme (Bus ID 519 – 536, Table A3); 5 Bluebird buses using B-20 (Bus ID 300 – 304, Table A2); and 5 Bluebird buses initially using ULSD, followed by ULSD Supreme (Bus ID 305 – 309, Table A4) for June 2007 through May 2008. Buses were run on different routes. The average MPG for each bus group was calculated.
• Fuel cost is based on average price provided by TARTA: o B-20: $3.007/gallon during period of June, 2007 – May, 2008 (Tables A1,
A2) o ULSD: $2.864/gallon during period of June, 2007 – May, 2008 (Tables
A3, A4).
• Thomas Buses: o Average MPG of buses using B-20 (3.9842, Table A1) is 17.37% lower
than MPG of buses using ULSD, and ULSD Supreme fuel (4.8216, Table A3).
o Average fuel cost/mile of buses using B-20 ($0.8219, Table A1) is 26.24% higher than that of buses using ULSD fuel and ULSD Supreme ($0.6062, Table A3).
• Bluebird Buses: o Average MPG of buses using B-20 (4.1839, Table A2) is 5.25% lower
than MPG of buses using ULSD and ULSD Supreme fuel (4.4158, Table A4).
o Average fuel cost/mile of buses using B-20 ($0.7344, Table A2) is 11.34% higher than that of Bluebird buses using ULSD and ULSD Supreme fuel ($0.6511, Table A4).
MPG of Buses with Similar/Same Routing and MPG of Buses with Highway Routing: These will be studied in detail in the third year of the study.

TARTA Year 2 Report
- 8 -
Maintenance Cost for TARTA Buses Data was collected on maintenance and repair for 19 Thomas buses using B-20 fuel, and 18 Thomas buses using ULSD fuel and ULSD Supreme between June 7, 2007 and May 14, 2008 (Tables 2 and 4 which follow; A1 and A3 in the appendix). It is important to note that all busses not using B20 ran on ULSD initially, and then switched over to ULSD Supreme later in December. Henceforth this will be referred to as ULSD/ULSD Supreme in the report.
• Total maintenance & repair costs for the Thomas buses were as under: o Total engine-related repair costs of per bus per year were $0.0163/mile for
Thomas ULSD/ULSD Supreme and $0.0106/mile for Thomas B-20 (Table A3).
o Total repair and maintenance costs were $0.0495/mile for Thomas B-20 buses compared to $0.0587mile for Thomas ULSD/ULSD Supreme buses.
• Results (Table 2) indicate that average ULSD/ULSD Supreme bus maintenance/repair costs exceed those of B-20 buses:
o Average B-20 engine-related repair cost is 67.3% of the ULSD/ULSD Supreme bus cost.
o Average maintenance and repair cost for B-20 is equivalent to 87.7% of ULSD/ULSD Supreme bus cost.
B20 Biodiesel
425.74$
1,992.60$
35,349.26$
Average Eng.-Related Costs 632.54$ 67.3%
Table 2. Thomas Bus Costs (Per Bus Per Year)
ULSD/ULSD Supreme
Comparison (B20)/(ULSD/ULSD
Supreme)
Average Maint & Repair Costs 2,273.08$ 87.7%
Average M & R + Fuel Costs 25,657.40$ 137.8%

TARTA Year 2 Report
- 9 -
Data was collected for maintenance and repair for 5 B-20 Bluebird buses, and 5 ULSD/ULSD Supreme Bluebird buses between the months of June 7, 2007 – May 14, 2008 (Tables 3, 4, A2, A4). Note: ULSD/ULSD Supreme reflects switch from ULSD to ULSD Supreme.
• The Total maintenance and repair costs for the Bluebird buses were as under: o Total Engine-related costs were $0.0324/mile for Bluebird ULSD/ULSD
Supreme and $0.0240/mile for Bluebird B-20 (derived from A2, A4). o Total repair and maintenance costs were $0.0470/mile for Bluebird B-20
buses compared to $0.0908/mile for Bluebird ULSD/ULSD Supreme bus • Results (Table 3) indicate
o Average B-20 engine-related repair cost is 86.2% of the ULSD/ULSD Supreme bus cost.
o Total Maintenance and Repair Cost for B-20 is equivalent to 60.3% of ULSD/ULSD Supreme bus cost.
B20 Biodiesel
861.60$
1,690.10$
27,848.41$
Average Maint & Repair Costs 2,804.73$ 60.3%
Average M&R + Fuel Costs 22,949.27$ 121.3%
Average Engine-Related Costs 999.05$ 86.2%
Table 3. Bluebird Bus Costs (Per Bus Per Year)
Ultra-Low Sulphur Diesel (ULSD)
Comparison (B20)/ULSD/ULSD
Supreme)
A B C E
Average Fuel Cost ($/Mile)
Average Engine-Related
Repair Costs ($/Mile)
Ave. Fuel Costs & ER Rep. Costs
($/Mile)
Average Total Cost Per Mile
(A + B + D)
0.6287$ 0.0243$ 0.6530$ 0.7034$
0.7782$ 0.0173$ 0.7954$ 0.8264$
23.78% -29.10% 21.81% 17.48%
Table 4. ULS and B20 ComparisonD
Difference = ( B20-ULSD) / (ULSD)
-38.60%
Fuel Type
Average Nonengine-Related Repair & Maint.
Costs ($/Mile)
ULSD/ULSD Supreme (Thomas Ave. +
Bluebird Ave.) / 2
0.0504$
B20 (Thomas Ave. + Bluebird Ave.) / 2
0.0310$
It is important to note that even though B-20 fuel costs per mile are generally higher than

TARTA Year 2 Report
- 10 -
ULSD, respective repair costs are lower for both non-engine and engine related work. Details of Engine-Related Costs Note: The following table and graph represent data for Year 1 and Year 2.
Table 4b. Details - Engine-Related Costs (Yr. 1, Yr. 2)
Engine-Related Year 1 ($/Mile) Year 2 ($/Mile) Change ($/Mile) (Year 1 - Year 2)
Fuel Bio ULS Bio ULS Bio ULS Type Diesel Diesel Diesel Diesel Diesel Diesel
Air Intake System $0.000201 $0.001940 $0.001325 $0.005700 ($0.001124) ($0.003760)
Cooling System $0.007470 $0.007248 $0.002591 $0.006202 $0.004879 $0.001046
Fan $0.000591 $0.000099 $0.003370 $0.002034 ($0.002779) ($0.001935)
Water Pump $0.000472 $0.000000 $0.000190 $0.000679 $0.000282 ($0.000679)
Coolant Pre-Heater Engine $0.002446 $0.001927 $0.005696 $0.005256 ($0.003250) ($0.003329)
Fan Drive $0.000000 $0.000255 $0.000000 $0.000000 $0.000000 $0.000255
Exhaust Systems $0.002320 $0.000992 $0.000211 $0.001324 $0.002109 ($0.000332)
Fuel System $0.001871 $0.004953 $0.000852 $0.001286 $0.001019 $0.003667
Fuel Tank $0.000269 $0.001905 $0.000424 $0.000665 ($0.000155) $0.001240
Fuel Pump $0.000743 $0.000000 $0.000325 $0.000329 $0.000418 ($0.000329)
Engine $0.004077 $0.005058 $0.005856 $0.010420 ($0.001779) ($0.005362)
Electronic Engine Controls $0.002175 $0.013116 $0.005109 $0.007151 ($0.002934) $0.005965
Total $0.022635 $0.037493 $0.025948 $0.041047 ($0.003313) ($0.003554)

TARTA Year 2 Report
- 11 -
Note: Biodiesel in noted in blue, and ULSD/ULSD Supreme in red Engine Wear - TARTA Buses Oil test data was collected for 19 B-20 Thomas buses, 18 ULSD/ULSD Supreme Thomas buses, 5 B-20 Bluebird buses, and 5 ULSD Bluebird buses from June 2007 through May 2008. (For detail see Tables A5 and A10 in the appendix.) Analysis of the engine oil conducted by an outside agency exhibited the following:
• B-20 Bluebird buses requiring corrective action equaled 18.2% • ULSD Bluebird buses requiring corrective action equaled 66.7% • B-20 Thomas buses requiring corrective action equaled 18.2% • ULSD/ULSD Supreme Thomas buses requiring corrective action equaled 34.4% • Average concentration of lead (Pb) in engine oil is roughly 80% higher for
Bluebird buses compared to Thomas buses. • As can be seen in Table A10 in the appendix, averages of each of the parameters
tested were well within the specification limits shown in the last row of the table.

TARTA Year 2 Report
- 12 -
CITY OF TOLEDO RESULTS PURPOSE The previous sections were devoted to the TARA fleet mass transit system. To enlarge the study scope to biofuels in settings other than mass transit, vehicles from the City of Toledo were included. The purpose of the study is to investigate the impact of using B-20 on operating costs, fuel economy and maintenance costs on a sample of vehicles from the City of Toledo. This study involved 3 vehicles from the City of Toledo: one Ford 250 truck, one Let-2 Crane, and one Mack Truck. The duration of work for the study is similar to that of the TARTA portion. MPG and Fuel Cost per Mile for City of Toledo – B-20 Fuel Data was collected for mileage and fuel consumption for the Ford 250, Crane, and Mack Truck using B-20 (Tables 5-7), for June 2007 through May 2008. The vehicles were run in different areas under different driving conditions. The average MPG for each was calculated.
• Table 5 exhibits results for the 2003 Ford F-250. o While average mpg and fuel cost decreased slightly between the first and
second half of the year, fuel cost/mile increased in second half roughly 32%, .
Fuel Type Ave. MPGFuel Cost ($/Gal.)
Fuel Cost ($/Mile) Time Period
B20 12.490$ 2.748$ 0.220$ 7/1/07 - 12/31/07
B20 12.330$ 3.576$ 0.290$ 1/1/08 - 7/1/08
Table 5. Truck 2344 (2003 Ford F250) Fuel Information
• Table 6 exhibits results for the Crane LET-2. o Even though average mpg and fuel cost decreased slightly between first and
second half of the year, fuel cost/mile increased in second half roughly 31%,
Fuel Type Ave. MPGFuel Cost ($/Gal.)
Fuel Cost ($/Mile) Time Period
B20 2.3366 2.8500$ 1.2197$ 7/1/07 - 12/31/07
B20 2.3174 3.7104$ 1.6011$ 1/1/08 - 7/1/08
Table 6. Truck 2667 (2001 Crane LET-2) Fuel Information

TARTA Year 2 Report
- 13 -
• Table 7 displays results for 2003 Mack MR6885. o While average mpg decreased slightly between the first and second half of
the year, fuel cost increased by 34%, and fuel cost per mile increased in the second half by roughly 41%,
Fuel Type Ave. MPGFuel Cost ($/Gal.)
Fuel Cost ($/Mile) Time Period
B20 2.3879 2.7685$ 1.1594$ 7/1/07 - 12/31/07
B20 2.2639 3.7121$ 1.6397$ 1/1/08 - 7/1/08
Table 7. Truck 2681 (2003 Mack MR6885) Fuel Information
All vehicles exhibit a slight decrease in average MPG in the second Time Period (January – June). This may be caused by the type of driving during more harsh climatic conditions of winter.
Maintenance Costs for City of Toledo – B-20 Fuel Data was collected for Maintenance and Repair for the Ford 250, Crane, and Mack Truck using B-20 (Tables 8-10), June, 2007 through May, 2008. There were no engine-related costs during the timeframe. Maintenance and non engine related costs per mile differ considerably between the two time periods among the Ford F250 truck, Crane, and Mack truck.
• Table 8 exhibits results for the 2003 Ford F-250. o Maintenance and non engine-related costs increased by 23% between the
first and second half of the year. Maintenance and non engine-related costs per mile increased by more than 73% in the second half of the year.
Fuel
Engine-Related Costs
Maint. & Non Engine-Related
Costs MileageEngine-Related
Costs/Mile
Maint. & Non Engine-
Related Costs/Mile Time Period
B20 -$ 1,110.86$ 16,935 -$ 0.0656$ 7/1/07 - 12/31/07
B20 -$ 1,371.16$ 12,061 -$ 0.1137$ 1/1/08 - 7/1/08
Table 8. Truck 2344 (2003 Ford F250) Maintenance & Repair Information

TARTA Year 2 Report
- 14 -
• Table 9 exhibits results for the Crane LET-2. o Maintenance and non engine-related costs decreased by 6% between the
first and second half of the year. Maintenance and non engine-related costs per mile decreased by more than 42% in the second half of the year.
Fuel
Engine-Related Costs
Maint. & Non Engine-Related
Costs MileageEngine-Related
Costs/Mile
Maint. & Non Engine-
Related Costs/Mile Time Period
B20 -$ 13,627.50$ 2,834 -$ 4.8086$ 7/1/07 - 12/31/07
B20 -$ 12,821.39$ 4,666 -$ 2.7478$ 1/1/08 - 7/1/08
Table 9. Truck 2667 (2001 Crane LET-2) Maintenance & Repair Information
Table 10 displays results for 2003 Mack MR6885.
o Maintenance and non engine-related costs increased by 87% between the first and second half of the year. Maintenance and non engine-related costs per mile increased by more than 109% in the second half of the year.
Fuel
Engine-Related Costs
Maint. & Non Engine-Related
Costs MileageEngine-Related
Costs/Mile
Maint. & Non Engine-
Related Costs/Mile Time Period
B20 -$ 5,141.63$ 5,042 -$ 1.0198$ 7/1/07 - 12/31/07
B20 -$ 9,635.11$ 4,511 -$ 2.1359$ 1/1/08 - 7/1/08
Table 10. Truck 2681 (2003 Mack MR6885) Maintenance & Repair Information
• All vehicles exhibit an overall increase in costs per mile during the second Time
Period (January – June). This may be caused by the type of driving during more harsh climatic conditions of winter.

TARTA Year 2 Report
- 15 -
Cost Summary for City of Toledo – B-20 Fuel Data was collected for the Cost Summary for the Ford 250, Crane, and Mack Truck using B-20 (Tables 11-13), for June 2007 through May 2008. The vehicles were run in different areas under different driving conditions. There were no engine-related costs during the timeframe. Non engine related costs per mile differ considerably between the two time periods among the Ford F250 truck, Crane Let-2, and the Mack MR6885.
• Table 11 exhibit results for the 2003 Ford F-250. o Fuel costs per mile increased by 32% between the first and second half of
the year. Non engine-related repair and maintenance costs per mile increased by more than 72% in the second half of the year.
A B C D E
FuelFuel Cost ($/Mile)
Engine-Related Repair Costs
($/Mile)
Fuel Cost & Engine-Related
Repair Cost ($/Mile)
Non Engine-Related Repair & Maint. Costs
($/Mile)
A+B+D Total Cost ($/Mile) Time Period
B20 0.220$ -$ 0.220$ 0.066$ 0.2856$ 7/1/07 - 12/31/07
B20 0.290$ -$ 0.290$ 0.114$ 0.4037$ 1/1/08 - 7/1/08
Table 11. Truck 2344 (2003 Ford F250) Cost Summary
• Table 12 exhibits results for the Crane LET-2. o Fuel costs per mile increased by 31% between the first and second half of
the year. Non engine-related repair and maintenance costs per mile decreased by 43% in the second half of the year.
A B C D E
FuelFuel Cost ($/Mile)
Engine-Related Repair Costs
($/Mile)
Fuel Cost & Engine-Related
Repair Cost ($/Mile)
Non Engine-Related Repair & Maint. Costs
($/Mile)A+B+D
Total Cost Time Period
B20 1.2197$ -$ 1.2197$ 4.8086$ 6.0283$ 7/1/07 - 12/31/07
B20 1.6011$ -$ 1.6011$ 2.7478$ 4.3489$ 1/1/08 - 7/1/08
Table 12. Truck 2667 (2001 Crane LET - 2) Cost Summary

TARTA Year 2 Report
- 16 -
• Table 13 display results for 2003 Mack MR6885. o Fuel costs increased by 41% between the first and second half of the year.
Non engine-related repair and maintenance costs per mile increased by more than 109% in the second half of the year.
A B C D E
FuelFuel Cost ($/Mile)
Engine-Related Repair Costs
($/Mile)
Fuel Cost & Engine-Related
Repair Cost ($/Mile)
Non Engine-Related Repair & Maint. Costs
($/Mile)A+B+D
Total Cost Time Period
B20 1.1594$ -$ 1.1594$ 1.0198$ 2.1792$ 7/1/07 - 12/31/07
B20 1.6397$ -$ 1.6397$ 2.1359$ 3.7756$ 1/1/08 - 7/1/08
Table 13. Truck 2681 (2003 Mack MR6885) Cost Summary
• The Ford and Mack trucks exhibit an overall increase in total costs per mile
during the second Time Period (January – June). The Crane did not. The truck increase in cost may be caused by the type of driving during more harsh climatic conditions of winter.

TARTA Year 2 Report
- 17 -
Future Recommended Research Areas for Biodiesel:
1. Life Cycle Analysis could be pursued to reflect the cradle-to-grave cost structure. This may include relative costs, by products, wastes, etc. for the following:
a. Organic Matter for conversion i. Growth
ii. Harvesting iii. Transport to production facility
b. Production facility conversion to ethanol i. Emissions
ii. Discharge iii. Transport to petrochemical processing facility
c. Production facility generation of ULSD/ULSD Supreme i. Emissions
ii. Discharge d. Facility costs for production of Biodiesel
i. Emissions ii. Discharge
iii. Transport to TARTA for bus use e. Vehicle use Currently being performed
i. Emissions ii. Wear
iii. Fuel
2. Comparative Monitoring of vehicles with stop/go versus highway travel. A simple statistical experimental design will be applied to this study.
3. Performing further statistical analysis (for example, a Two-Way Analysis of Variance) on engine wear analysis.

TARTA Year 2 Report
- 18 -
LIFE CYCLE COSTS Introduction Life-cycle costs (LCCs) are all anticipated fees associated with a project, or program related to the respective alternatives throughout the lifespan of the project. This includes all incurred costs from initial planning, design, compliance with state/federal/local permit requirements, as well as equipping (tooling/retooling) for production start up, in addition to and daily operations through the end of the specific cycle under study. Notably, there are several phases for production life cycles – Design and Permit Application, Production Related, Use of Product, followed by End-of-Life Disposal/Recycle. Life Cycle Cost Analysis is utilized to evaluate an array of issues, such as alternatives in design configurations, manufacturing methods, and support scenarios. The following figure exhibits a general scheme for viewing Life Cycle Phases, relative areas of impact, and a basic flow pattern resulting in the possibility of Life Cycle Assessment.
Figure 2 . Life Cycle Phases and Related Issues
Design , Permit application
Product Development,
Production
End -of-Life, Dispose /Recycle
Use of Product
Economic Issues Environmental Compliance
Social Responsibility
During this stage all known and unknown parameters would be explored. For example the researcher may reflect on environmental issues that evolve during the growth of the product during the Life Cycle. If issues are resolved, reducing uncertainties , a Life Cycle Assessment can be performed.

TARTA Year 2 Report
- 19 -
Life Cycle for a Biodiesel The total life cycle cost is the sum of product design and development, farming production, product production, transport, infrastructure, bus-alteration, refueling, maintenance expenses, environmental effects, as well as waste disposal for a transit fleet over a projected life cycle of the refueling infrastructure. For the types of vehicles in this study, a 30-year life cycle would apply. This cost is usually converted to present value, as noted below.
LCC for Fleet = Total cost over life of the fleet (30 years discounted to the present value)
The economic performance of alternative fuels used in buses can be measured by estimating and comparing the expected total cost of running a bus fleet during its anticipated operating life using different fuels. The comparison of total costs is enhanced by considering the present value of total fleet costs over the fleet’s life cycle.
Total Cost = Infrastructure Cost +Refueling Cost+ Maintenance Cost
Total costs of running a bus are infrastructure, refueling and maintenance costs. Infrastructure costs represent lane building and tank installation expenditures. Changing fuel storage and delivery systems, as well as bus engines and fuel systems, to use biodiesel may require additional expenditures. Refueling costs include actual fuel expenditures and refueling labor charges. Maintenance expenses include repair, rebuild, and insurance costs, and costs associated with the loss of ridership and good will due to unexpected breakdowns. Major maintenance costs involve engine rebuilds and general bus maintenance and repair. These are the expenses attributable to use of biodiesel fuels. The life cycle cost will begin in the next year once all of the data from year two are in place and verified.

TARTA Year 2 Report
- 20 -
ENVIRONMENTAL IMPACT ASSESSMENT The purpose of this research is to study the effects of using alternative diesel fuel on vehicular emissions and indoor air quality of public transport buses and solid waste & recycling trucks in the City of Toledo, Ohio. The study also aims to analyze the different factors affecting vehicular emissions and indoor air quality inside the bus compartment and to characterize and speciate the fine particulate matter collected indoors. This section focuses on the following aspects of environmental assessment:
• Overview of the methods used to gather data and ensure accuracy • In-bus air quality • Characterization and Speciation of fine particulate matter inside buses. • Tail pipe emissions from Public transport buses • Tail pipe emissions from solid waste and recycle trucks.
Overview of Experimental Procedures: The experiments are divided into two areas of research: in-bus air quality and the study of exhaust emissions. An overview of the methodology adopted for different areas of research and database development are discussed in this section: In-Bus Air Quality Methodology
1. TARTA fleet characteristics: TARTA runs seven different full-duty fleets for their regular runs. Table 14 presents the different fleet information including engine and chassis manufacturers, and year of manufacture for each of the fleets.
Table 14: TARTA Fleet Details Series
Number Engine Chassis Year of
Manufacture 200 6V92 Detroit Diesel RTS Dec, 1990 300 ISB 275 Cummins Bluebird Nov, 2005 400 Series 50 Detroit Diesel TMC Sep, 1994 500 MBE 900 Mercedes Benz Thomas Mar, 2003
600 Series 40 International Navistar Gillig Sep, 1998
700 Series 40 International Navistar Gillig Dec, 1999
900 6V92 Detroit Diesel Flxible Mar, 1993
2. Selection of routes and buses for testing: Two buses (ID 506 and 536) were selected from the 500 series of the TARTA fleet with 506 running on biodiesel (B-20) and 536 on ultra low sulfur diesel. The 500 series buses are medium duty buses having an MBE900 Mercedes Benz engine. The buses were run on a pre-assigned route daily and the location of the buses during the run was identified by

TARTA Year 2 Report
- 21 -
the GPS unit located inside the bus. The route selected was #20 which runs from the TARTA garage to the Meijer store on Central Avenue and returns back.
3. Instrumentation and Experimental setup: Continuous monitoring of particulate
matter in the buses was done using Grimm 1.108 and TSI Dust TrackTM
instruments. Temperature and relative humidity were measured simultaneously along with the gases using YES Plus instruments. The gases monitored using Yes Plus instrument are carbon dioxide (CO2), carbon monoxide (CO), nitric oxide (NO), nitrogen dioxide (NO2) and sulphur dioxide (SO2). Power is continuously supplied to the instruments from the adapters connected to the bus. A wired mesh box is provided to safeguard the instruments which are held in place by Velcro attachments. Their location when placed inside a bus can be observed in the following diagram in Figure 3.
4. Data Collection and Quality: Data collection included downloading the data
from instruments, obtaining meteorological data and monitoring the real time variables. The data downloaded from all the instruments were set for 1 minute intervals that are then averaged to 1 hour for analysis. The filters were changed periodically and the instruments were calibrated on a regular basis. The variables considered for developing regression tree models for gases were ambient temperature, ambient relative humidity, wind speed, wind direction, precipitation, visibility, indoor temperature, indoor relative humidity, passenger count, bus status (bus position/door position - Idle/Open, Idle/Close, Run/Close), number of cars and buses/trucks ahead, while ambient PM2.5 concentrations were also used in developing regression tree models for particulate matter. Meteorological data were downloaded from the National Climatic Data Center (NCDC, 2008) and ambient PM2.5 concentrations were obtained from the EPA. The passenger data, vehicles in front of the bus, and the bus status were monitored using the cameras present in the bus which made a video recording during the run. The position of cameras inside the bus from which the real time variables are monitored can be observed in Figure3.

TARTA Year 2 Report
- 22 -
Figure 3: Experimental Setup for
Indoor Air Quality Testing The experimental setup of the indoor air quality monitoring instruments in the bus, the problems encountered during data collection, and the measures taken to overcome the obstacles are discussed in detail by Vijayan (2007).
5. Particulate Matter Filter Analyses: Particulate Matter (PM10) filters were collected from the indoor particulate matter measuring instruments throughout the year in biodiesel blend (B-20) fueled buses. The analyses performed on the collected particulate matter filters are discussed below:
SEM Analyses: Using these analytical techniques, individual particle analysis was undertaken for morphology. The particle analysis was carried out by use of the ESEM coupled to an automatic computer imaging system having a resolution of 10 nm. The size, morphology, and shape of the particles were analyzed with the SEM. Seven samples from the biodiesel engine, with respect to particle size, distribution, and appearance were analyzed. The filters were prepared for an electron microscopic investigation. The ESEM (Quanta 3D) with an image analyzer located in the Electron Micro-Beam Analysis Laboratory at the University of Michigan in Ann Arbor, Michigan was used for the analysis of samples collected from the TARTA buses. Full filters were mounted on bulk sample holders with silver adhesive. The fields for counting and size distribution analysis were randomly selected. The interaction of the electron beam with the sample produces various effects that can be monitored with suitable detectors. The resulting signals include secondary electrons and backscattered electrons that are used for imaging. The secondary, backscattered, and x-ray signals were collected in synchronization with the position of the electron beam to provide highly detailed spatial and compositional information of microscopic features. However, PM10 characterization will require more detailed quantification. Signal strength is proportional to particle volume. XRD Analyses: An X-ray diffractometer with a scintillation counter, a graphite monochromator, and a copper anode rotated target X-ray tube that was operated at

TARTA Year 2 Report
- 23 -
50 kV with 200 mA was used to analyze airborne particulates in the instrumentation center at The University of Toledo.
Emission Profiling for Buses Methodology
1. Selection of the Routes and Buses for the Study: The buses selected for exhaust emission testing were the 500 series medium duty buses equipped with MBE900 Mercedes Benz engine and running on biodiesel (B-20) or ultra low sulfur diesel (ULSD) supreme. All the buses were allowed to run on the selected fuel for more than 6 months in order to avoid any discrepancies that arise because of the change in fuel. The buses for testing were selected one day before the testing date and the instruments were installed on the day of testing, about 30 minutes prior to the scheduled bus time, in the TARTA garage. For each of the 12 buses tested, the bus number and miles travelled are listed in Table 15.
Table 15: Type of Fuel Used and Mileage on the Bus During Testing
B-20 ULSD Supreme Bus # Mileage (k) Bus # Mileage (k)
500 127 527 186
502 178 525 175
503 163 528 176
504 163 532 157
505 158 536 158
501 192 521 180
2. Instrumentation and Experimental Setup: The portable emission measurement
system (PEMS) Testo 350 XL was used for collecting the emission data from the exhaust of the buses. The exhaust emissions temperature and gases that were measured include O2, CO2, CO, SO2, NO and NO2 with calculated NOX. The system was installed on the rear seat of the buses with power sourced from the bus power control panel at the rear of the bus. The probe of the instrument was clamped to the tail pipe and the instrument connected to a lap-top computer to download the data simultaneously during the run. The collected data was then exported into an Excel spreadsheet. Continuous power supply to the instrument and laptop needed to be maintained in order to avoid discrepancies during the time of data collection.
3. On-Road Testing: Real time on-road exhaust emissions were obtained when the selected buses went on the assigned route. Route number 20 was selected for this

TARTA Year 2 Report
- 24 -
study because it was convenient for the test protocol. The total testing time for the study was 15 minutes starting from the TARTA garage and ending at the Westfield Franklin Park mall. The testing equipment was installed on the bus in the garage on the day of the run. It took about 15-20 minutes for installing and removing the measurement system from the bus. The testing was carried out in such a way that one bus was tested for each day with the driver remaining the same for the complete study. Regular on road test timings were 10:31 A.M. to 10:46 A.M.
4. UT-TARTA Test Cycle: A test protocol was developed for standardizing the
testing procedure on all TARTA buses. The run simulates an actual operational run of TARTA buses and gives specific details about the emission behavior of buses in the City of Toledo. All buses were tested after midnight on a weekend to ensure there was no traffic to disrupt the standard run. The buses ran on TARTA Route #20 which runs between the TARTA garage and the Meijer’s store on Central Avenue; the distance is approximately nine miles one way. The bus was scheduled to make five stops in each direction which lasted ten seconds each to simulate passenger pickup/drop off. During stage 1 (TARTA garage to Meijer’s), the buses were generally started in cold-start, and during stage 2 (Meijer to TARTA garage), the engines were warmed up and demonstrate hot-start characteristics. The total run time for each test stage was always between 20 minutes and 15 seconds to 21 minutes.
5. Idle Testing: Idle tests of the buses involve setting up the OBD connection with
the computer and connecting it to the Engine Diagnostic Software. A list of important engine parameters to be monitored is generated and prepared for data-logging. Emission monitoring instrumentation is connected to the sampling probes and is set up at the exhaust. Both sets of instruments are started simultaneously in order to maintain easy comparison. The bus is then started in the desired idling mode (fast or normal idle) and the engine parameters along with emission characteristics are monitored for 15 to 20 minutes.
Emission Profiling for Garbage Disposal Trucks Methodology
1. Instrumentation and Experimental Setup: Tail pipe emission data is collected using the TESTO350 XL emission measuring instrument. Only two vehicular modes (hot idle and cold idle) are considered for this study. The data was downloaded onto a laptop from the instrument. The engine operating parameters such as idle rpm, speed, power, fuel ratio, coolant temperature, intake temperature, etc., were gathered during vehicle operation using the engine scanner connected to the On-Board Diagnostic (OBD) link of the vehicle. The engine scanner was interfaced with the computer using software purchased from Cummins and Mack. An aluminum attachment clamped to the exhaust pipe was

TARTA Year 2 Report
- 25 -
also designed to protect the instrument analyzer probe from the heat and to ensure uniform insertion depth of the probe into the vehicle exhaust (Figure 4). Tailpipe emission data was collected for cold idle testing and hot idle testing. The TESTO 350XL is portable and can be installed in approximately 15 minutes. The probe attached to the emission testing instrument is plugged into the exhaust of the truck and the OBD was connected to gather information about the engine performance variables. The engine performance data and emission data were collected simultaneously without any time lag. The OBD used for obtaining engine performance data from trucks were supplied by the Mack trucks Inc., and Cummins Inc. The truck was started in the idling mode and emission data along with the engine performance data was collected for 15 minutes. A similar procedure was repeated for each of the 20 trucks.
Figure 4: Aluminum attachment clamped to the exhaust pipe
2. Data Collection and Quality: For cold idle monitoring, the data was collected between 5 A.M. and 7 A.M. on weekdays. The trucks left the facility for their assigned routes at 7 A.M. and returned to the garage by noon. For hot idle monitoring, the data was collected during afternoons when the trucks returned from their regular routes. The instrument was purged with fresh air between each idle test so as to clear the electrochemical sensors of any gas residues and also to sample fresh air which is considered to be free from significant levels of CO, NO, and SO2. The average ambient values for O2 and CO2 are assumed to be at 20.9 Vol % and 0.03 Vol % respectively. All the particulate filters in the instrument were replaced in accordance with recommendations from the manufacturers.
In-Bus Air Quality Continuous monitoring of indoor air quality in public transport buses throughout the year helped develop a large database. The data collected was analyzed to study the factors affecting the pollutant levels in different months and the collected in-vehicle pollutant levels helped determine the pollutant trends. Following is a summary of these results.
TARTA Year 2 Report
- 26 -
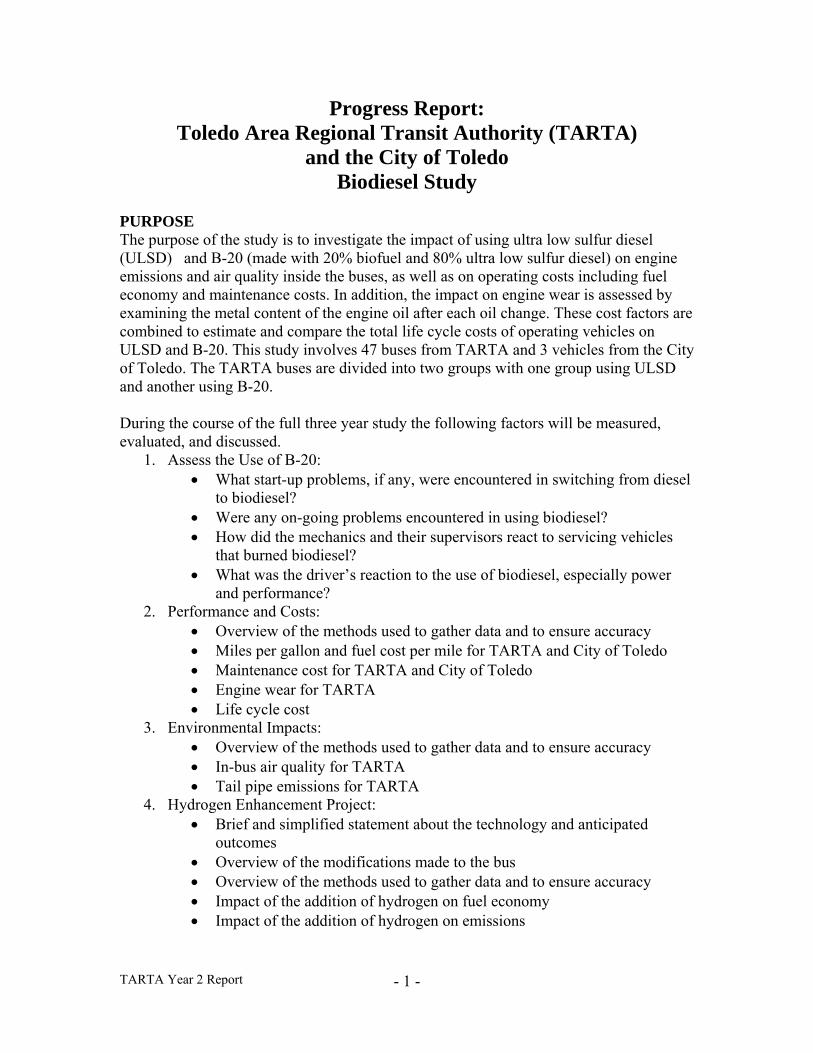
Factors Affecting In-Vehicle Pollutants A regression tree analysis was carried out using the CART® software issued by Salford Systems. The Classification & Regression Trees help in accurately predicting and classifying the data based on a set of if-then logical split conditions developed by the tree building algorithms. Tree methods are more useful when there is very little or no knowledge on any theories or predictions that relate the variables. This is a new approach in analyzing this type of real time data. The regression tree analysis helps in better understanding the in-vehicle pollutant concentration variations by providing significant patterns and relationships. This helps in identifying the variables that affect the in-vehicle concentrations and establishes and quantifies the in-vehicle pollutant behavior with respect to other variables. Indoor air quality models were developed by Vijayan and Kumar (2008a) using regression analysis. Kadiyala and Kumar (2008a) discussed the application of two different methods (regression and regression tree) of analyzing such complicated multivariate environmental data easily using the respective software.
Regression tree analysis was performed using the CART software. To check the working capability of the software in developing regression tree models and identifying important variables for the indoor pollutants on a monthly, seasonal, and yearly basis, four different analytical runs were performed using CART software for each month’s data. The software runs performed to obtain regression tree models and important factors affecting vehicular pollutant levels are discussed below.
• Run 1: The complete month’s pollutant concentration data with some missing variables as CART can account for any missing values.
• Run 2: 90% of the data used in Run 1. • Run 3: Only the pollutant concentration data with the complete set of
variables. • Run 4: 90% of the data used in Run 3.
On performing these runs, it was confirmed that the software is reliable as most of
the tree patterns obtained for 90% of the data and the corresponding data are similar or the main factors affecting pollutant concentrations can be observed as the same for all the runs with an interchange in the order of relative importance. The results presented here are those obtained from Run 3. A regression tree model obtained for carbon dioxide in the month of September 2007 can be seen in Figure 5. It has been observed that the factors affecting the in-vehicle pollutant concentrations for each month have been changing. Figures 6 through 10 show the CART output indicating the variable importance, tree splitters and terminal node predictions for different pollutants in September 2007. A summary of the main factors affecting the pollutant concentrations for different months for a biodiesel bus are given in Table 16.

TARTA Year 2 Report
- 27 -
Figure 5: Optimal regression tree model for carbon dioxide
Figure 6: CART output for carbon dioxide in September 2007
Figure 7: CART output for carbon monoxide in September 2007

TARTA Year 2 Report
- 28 -
Figure 8: CART output for nitric oxide in September 2007
Figure 9: CART output for sulphur dioxide in September 2007
Figure 10: CART output for PM1.0 in September 2007

TARTA Year 2 Report
- 29 -
Table 16: Summary of Factors Affecting Pollutant Concentrations in a Biodiesel Bus CO2 CO NO NO2 SO2
Apr’07 Idle/Open, Wind direction Indoor RH Wind speed, Wind
direction NA Wind speed
May’07 Passengers, Wind direction
Wind direction, Indoor Temp., Indoor RH, Cars
Indoor RH, Cars, Wind direction
Run/Close, Wind direction
Indoor RH, Wind direction, Ambient Temp.
Jun’07
Indoor RH, Passengers, Indoor Temp., Ambient RH
Wind direction, Ambient RH, Ambient Temp.
Indoor RH, Ambient RH, Indoor Temp.
Indoor RH Ambient RH
Jul’07
Trucks, Indoor Temp., Indoor RH, Wind direction, Ambient Temp.
Indoor RH, Indoor Temp., Wind direction
Indoor Temp., Wind direction
Wind direction, Indoor RH, Ambient RH,
Indoor RH, Indoor Temp
Aug’07
Indoor RH, Indoor Temp., Wind direction, Ambient Temp.
Indoor RH, Indoor Temp.
Wind direction, Indoor RH, Idle/Open, Indoor Temp.
Indoor Temp., Wind direction
Indoor RH
Sep’07 Passengers Wind direction, Indoor Temp.
Indoor Temp., Wind direction NA
Ambient RH, Wind direction, Indoor RH
Oct’07
Wind direction, Passengers, Trucks, Ambient RH
Indoor Temp., Passengers, Wind direction, Idle/Close, Run/Close, Trucks
Indoor Temp., Wind direction Indoor RH
Trucks, Indoor RH, Wind direction
Nov’07
Passengers, Wind speed, Trucks, Indoor Temp., Indoor RH
Indoor RH, Wind direction
Wind speed, Indoor Temp.
Wind speed, Indoor Temp.
Wind speed, Indoor RH, Ambient Temp.
Dec’07
Passengers, Wind direction, Indoor Temp., Ambient Temp., Indoor RH
Indoor RH Indoor Temp., Wind direction, Cars
Wind direction, Idle/Open
Wind direction, Ambient RH
Jan’08
Passengers, Ambient RH, Ambient Temp., Wind speed
Wind direction, Indoor RH, Indoor Temp.
Indoor RH, Wind direction, Ambient Temp., Ambient RH, Run/Close, Indoor Temp
Wind direction, Indoor Temp., Ambient Temp., Indoor RH, Trucks
Ambient Temp., Indoor RH
Feb’08 Ambient RH, Passengers, Indoor Temp.
Indoor RH Ambient RH, Indoor Temp
Indoor RH, Ambient Temp., Indoor Temp.
Ambient Temp., Indoor Temp.
Mar’08 Wind direction, Indoor RH, Ambient RH
Indoor RH, Indoor Temp., Wind direction
Indoor Temp, Wind direction, Ambient RH
Indoor Temp. Indoor Temp.

TARTA Year 2 Report
- 30 -
Particulate matter was mainly influenced by ambient PM2.5 concentrations irrespective of the month considered. The pollutant concentrations were also found to be influenced by the time of the day. Similar patterns were observed throughout the year. A summary of the pollutant concentration variation across a period of 4 months is discussed below. The carbon dioxide concentration levels were found to be mainly influenced by passenger ridership and vehicular traffic. Figure 11 shows that the carbon dioxide levels were found to peak during the time between 8:00 A.M. and 11:00 A.M. while most of the people will be going to their work places and kids going to schools. The carbon dioxide levels then decreased in the afternoon when there was a decrease in the number of passengers in the bus and a peak is again observed between 5:00 P.M. and 8:00 P.M., the time at which most of the people are returning home. After 8:00 P.M. the levels go down once again and another small spike in concentrations is observed in some cases when there is an increase in ridership. The carbon dioxide concentrations were found to be the highest in the month of September followed by August, June and July. From the regression tree models developed, it was observed that the carbon dioxide concentrations were directly proportional to indoor relative humidity, passengers, vehicular traffic, and ambient temperature.
Carbon Dioxide Time Series: June – September, 6A.M. – 11 P.M.
Carbon Monoxide Time Series: June – September, ^ A.M. – 11 P.M.
Figure 11: Variation of CO2 and CO average concentrations

TARTA Year 2 Report
- 31 -
From Figure 11, it can be inferred that the carbon monoxide levels gradually increased as the day progressed and peaked around 10 AM. Indoor carbon monoxide levels were found to be strongly influenced by the vehicular traffic and bus status. The carbon monoxide emissions from vehicular traffic seem to have a strong correlation with the indoor carbon monoxide levels as can be seen from CART results also. The gradual increase in the carbon monoxide levels in the morning might be due to the fact that most people would be travelling to their work places and schools. Then it decereases in the afternoon when lower levels of traffic were observed and increases once again in the evening when people return from their work places and another peak is observed between 9 P.M. and 11 P.M. The carbon monoxide concentrations were found to be the highest in the month of July followed by August, September and June. It was observed that the carbon monoxide levels were directly proportional to indoor relative humidity and vehicular traffic. The average monthly trends for nitric oxide during the months of June 2007 to September 2007are shown in Figure 12. A peak is obtained early in the morning between 6 AM and 8 AM. The concentration levels then decrease and the second spike is observed around 11 AM. The concentrations decrease further in the afternoon and an upward trend is observed between 4 PM and 8 PM. These concentrations were found to be inversely related to indoor temperature, indoor relative humidity and directly proportional to vehicular traffic from regression trees. Nitrogen dioxide levels did not show much variation and their concentrations indoors remained to be almost “zero”. The sulphur dioxide concentrations as observed in Figure 12 were found to be higher during the morning peak hours and either remained the same or decreased in the afternoon and once again increased during the evening peak hours and in the late night. It was observed that sulphur dioxide concentrations were positively correlated to indoor temperature, vehicular traffic and indoor relative humidity from regression trees.
TARTA Year 2 Report
- 32 -
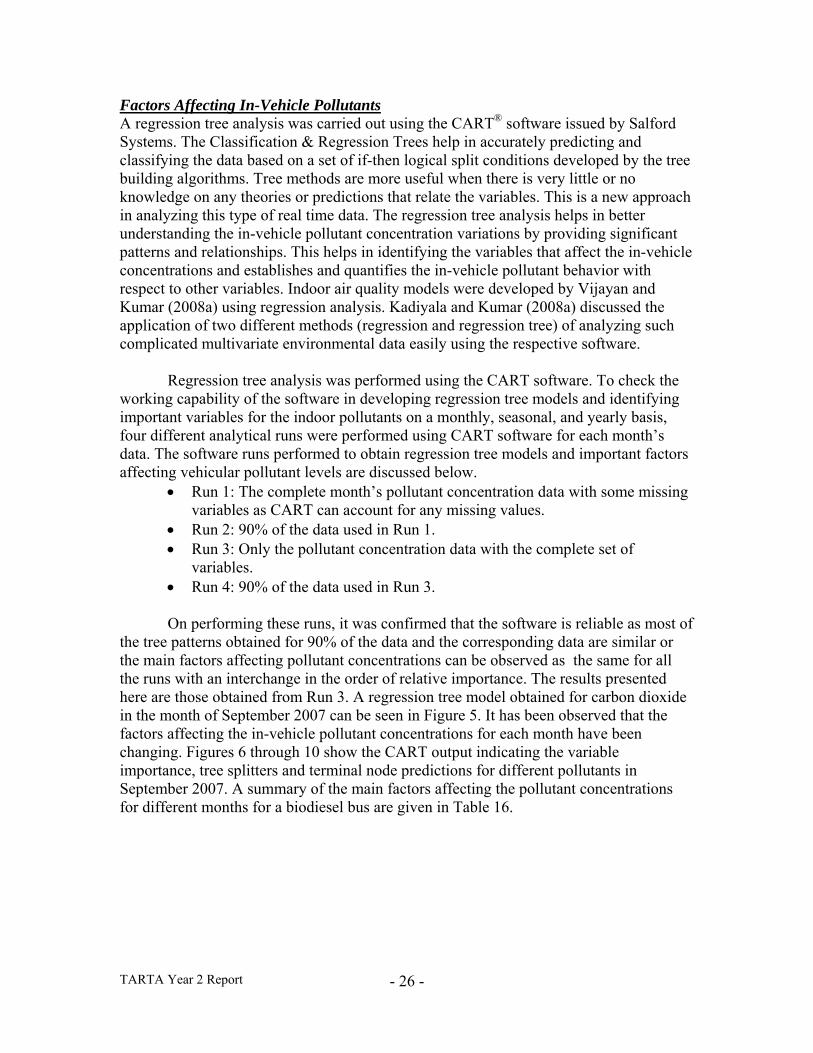
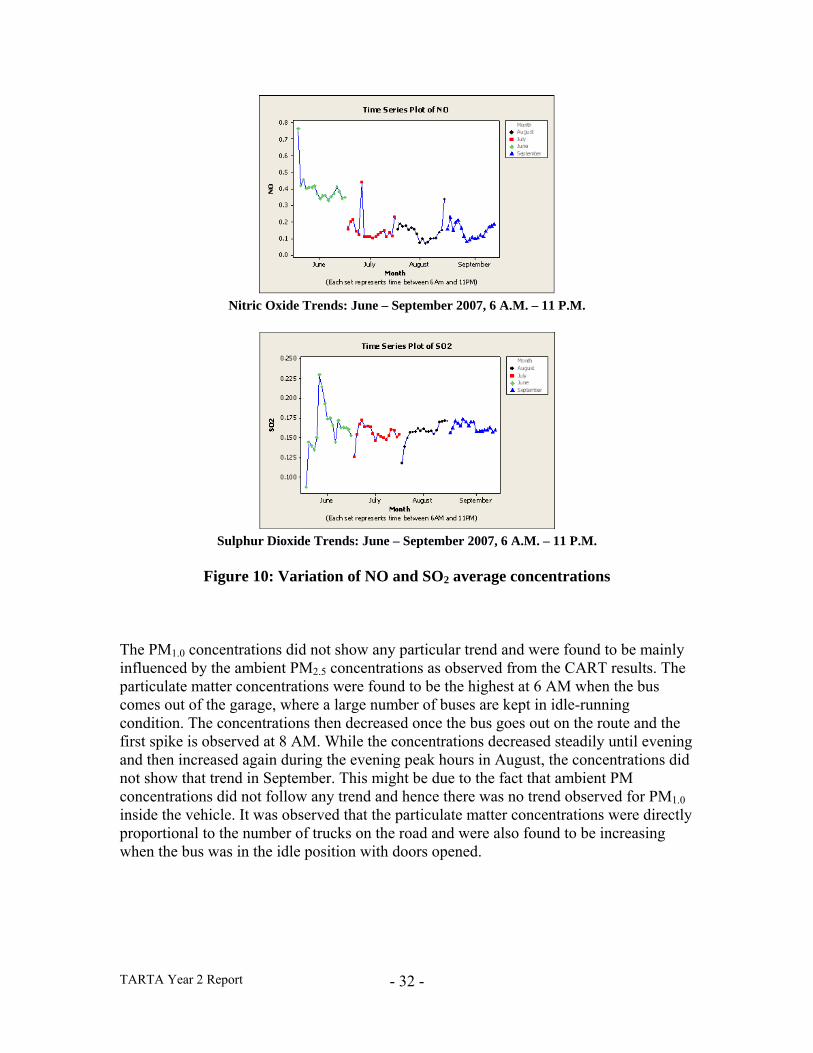
Nitric Oxide Trends: June – September 2007, 6 A.M. – 11 P.M.
Sulphur Dioxide Trends: June – September 2007, 6 A.M. – 11 P.M.
Figure 10: Variation of NO and SO2 average concentrations The PM1.0 concentrations did not show any particular trend and were found to be mainly influenced by the ambient PM2.5 concentrations as observed from the CART results. The particulate matter concentrations were found to be the highest at 6 AM when the bus comes out of the garage, where a large number of buses are kept in idle-running condition. The concentrations then decreased once the bus goes out on the route and the first spike is observed at 8 AM. While the concentrations decreased steadily until evening and then increased again during the evening peak hours in August, the concentrations did not show that trend in September. This might be due to the fact that ambient PM concentrations did not follow any trend and hence there was no trend observed for PM1.0 inside the vehicle. It was observed that the particulate matter concentrations were directly proportional to the number of trucks on the road and were also found to be increasing when the bus was in the idle position with doors opened.

TARTA Year 2 Report
- 33 -
Indoor Air Pollutants: August and September, 6 A.M. – 11 P.M.
Figure 13: Variation of PM1.0 average concentrations
A summary of the factors affecting indoor air pollutants in public transport buses obtained using regression tree analysis for four months was discussed by Kadiyala and Kumar (2008b). Vijayan, et. al. (2007) discussed in detail the indoor particulate matter charcaterization and also provided comparisons such as indoor versus outdoor, and front versus back. Characterization and Speciation of fine particulate matter Four micrographs of 7 samples of particulate matter obtained by the ESEM method are shown in Figure 14. All of the measurements were made using images of this type.
A B C D
Figure 14: Scanning electron micrographs showing different particles
The different morphologies of particles found in the indoor air samples can be seen in the micrographs given in Figure 12. All the sample types were found to have a large variety of particles. The particles were different in both morphology and size and were found both as single as well as clusters of particles. Investigation performed on the samples using SEM evidenced the presence of solid spherical particles with typical dimensions ranging between 200 nm and 2–3µm. For each sample, more than 1500 particles on several areas were measured.

TARTA Year 2 Report
- 34 -
Tail pipe emissions - Public transport buses Comparison of Idling Exhausts Emissions at Different Engine Loads Engine load is one of the key variables affecting vehicular emissions. To support a greater engine load, the engine has to be capable of a greater work load requiring a higher fueling rate and thereby producing higher emissions. A lower engine load is therefore expected to generate lower emissions than a higher load. For this analysis, a 500 series bus was selected and emission testing was performed at a higher engine load (fast idle enabled, 1200 rpm, 15 minute period). Emission testing was performed again the next day at a lower engine load (normal idle / fast idle disabled, 1000 rpm, and auto shutdown after 5 minutes) and the results were compared. The testing was performed at the same engine temperatures (cold start) in both cases for an accurate comparison. It was observed that for each of the pollutants, the emission trends were similar for both the operation modes. The scale of increase during startup for ‘fast idle’ mode in comparison to regular idle mode was most significant for CO (over 40%), CO2 (30%), NO (33%) and NO2 (20%). At 5 minutes from startup, CO2 and NO concentration for ‘fast idle’ mode reduced to the ‘normal idle’ concentrations. For CO and NO2, the differences in emission concentration were maintained throughout the test period.
Figure 15: Comparison of Emission Concentrations for Fast Idle vs. Normal Idle

TARTA Year 2 Report
- 35 -
Comparison of Fleets in Different Run Modes Even though there was a considerable difference in the age of the different fleets, there was no clear indication that older vehicles emitted higher amounts of pollutants as compared to newer models. It can therefore be inferred that engine technology and operation are more significant influencing factors affecting emission behavior as compared to the age of the vehicle. NO and CO2 concentrations were clearly higher for Run 1 as compared to Run 2, while NO2 concentrations exhibited the exact opposite behavior. This could be attributed to the fact that Run 1 had a larger continuous run time (less stops encountered at traffic lights) and therefore a higher temperature and a higher fuel rate. CO and SO2 concentrations did not show any clear trends. The average CO emissions during idling mode for series 200 was around 150 ppm (which was comparable with the CO emissions of the other fleets) whereas during on-road testing, it rose to over 1000 ppm which was four times the emissions compared to any other fleet. This could be attributed to vehicle age and technology as the fleet was manufactured in 1990 and was due for retirement in 2002. Series 400, 600 and 700 emitted the highest amount of all the other pollutants which was also seen from the idling behavior as well. However, the scale of difference varied for most pollutants indicating that engine technology was the most important variable affecting the emission behavior of a vehicle.
Figure 16: Comparison of Fleets in Different Run Modes

TARTA Year 2 Report
- 36 -
Real-World On-Road Emission Testing Standard drive cycles cannot represent the real-world driving conditions as the real-world fuel use and emissions are episodic in nature. Emission testing was carried out on 12 buses and problems have been encountered while testing on a couple of the buses (1 B-20 and 1 ULSD supreme). The results obtained from analysis of the remaining ten buses are discussed below. On-road emissions were monitored for around 15 minutes (first 15 minutes of the route) for all ten buses from the 500 series. The emission measurement starts immediately as the bus leaves the TARTA garage and stops at Franklin Park mall. A 15 minute average concentration of each pollutant was taken to compare the emissions across different buses. Comparison of real-world on-road emission concentrations are provided in Figure 17. The test results show that buses running on B-20 emitted lower concentrations of all the monitored pollutants except for CO2, which showed a 3% increase as compared to ULSD supreme buses. But, if the complete life cycle of biodiesel is considered, these higher CO2 emissions are observed to be balanced. NO and SO2 concentrations were observed to be reduced by 7% and 9% respectively. The amount of SO2 emissions depends on the sulfur content present in the fuel. As biodiesel is free from sulfur, SO2 emissions from B-20 buses could be lower than ULSD supreme buses. NO2 emission concentration does not vary much for both fuels, but the B-20 fuel showed a 4% reduction. NOX and CO concentrations were observed to be reduced by 3% and 19% for B-20 buses respectively. The high oxygen content in biodiesel improves the fuel burning characteristics, thus encouraging complete combustion.

TARTA Year 2 Report
- 37 -
Figure 17: Comparison of Real-World On-Road Emissions

TARTA Year 2 Report
- 38 -
Instantaneous Emission Behavior and Engine Performance The emission and vehicle operation behavior of a sample set of buses during Run 1 are shown below. Note that the emissions of all the pollutants increase at the exact intervals during which the vehicle acceleration, speed and fuel rate increase. It should also be noted that these emissions are an effect of the combination of multiple factors, i.e., different factors may contribute to two different concentration spikes occurring at different time periods for a pollutant.

TARTA Year 2 Report
- 39 -
Figure 18: Instantaneous Emission behavior and Engine performance
Comparison of On-Road Emissions with Engine Idling Emissions On-road emissions (Run 1, Run 2) were also compared with engine idling emissions in order to understand the emission behavior in different modes. Series 500 buses were selected for a detailed study of the effects of engine operating mode on vehicular emissions. It should be noted that during Run 2, the driver was forced to stop the bus at more traffic stops than during Run 1. This in turn decreased the continuous driving time during Run 2 as compared to Run 1, and therefore shows a higher emission temperatures and higher fuel rates during Run 1. Oxygen concentration for idling mode (in cold start) was always higher than the on-road test mode which shows that buses run cleaner in the idling mode. It was also observed that idling and Run 2 modes produced higher average O2 concentrations than Run 1 due to longer continuous driving periods in Run 1. For bus 532, Run 1 got many more red lights on traffic intersections than usual and therefore showed higher than usual O2 concentration. On the other hand, CO2 followed the exact opposite trend as compared to O2. It was observed that as O2 increased, CO2 decreased and vice-versa. CO2 concentrations for idling mode (in cold start) were always lower than the on-road test modes. Run 1 always emitted higher CO2 concentration than during Run 2 due to longer continuous driving (acceleration) periods. Carbon monoxide, nitric oxide, nitrogen dioxide and sulfur dioxide concentrations for idling mode (in cold start) were always higher than the on-road test mode. Run 1 also emitted higher NO and CO concentrations as compared to Run 2 due to longer continuous driving (acceleration) periods, whereas the differences in NO2 and SO2 concentrations between the two runs were not as significant. It was observed that for the same amount of time in operation, vehicles in idling mode produced higher average concentrations of CO, NO, NO2 and SO2. This is an important

TARTA Year 2 Report
- 40 -
finding as reducing the idling time or shutting down the vehicle during long expected durations of idling could substantially reduce the total vehicular impact on air quality.
Figure 19: Emission Comparisons for Idling and Run Modes
Emission Modeling for On-Road Test Mode Instantaneous emission modeling was carried out on the data obtained from the on-road tests for each fleet. Best subset and multiple regression analyses were carried out on the processed data set to identify the significant variables forming the best regression models for each pollutant of every fleet. The variables used in the analysis were coolant temperature (in F, representative of engine temperature), engine oil temperature (F), fuel temperature (F), ambient temperature (F), exhaust temperature (Tf, in F), air filter use (days), fuel filter use (days), fuel grade (1 = B-20, 0 = ULS diesel) and engine mileage. The best models for each pollutant were selected based on their model statistics. These models were developed to understand the on-road emission behavior of the different TARTA buses in real-world settings. The models also helped in identifying how a variable would affect the on-road emissions of pollutants. One bus from each fleet was selected for this study. All the models showed good predictive ability but as the vehicular characteristics were different, the emission behavior and emission performance relationships were sometimes different for different fleets. A total of 18 models were developed, 3 for each pollutant that included 200, 500 and 900 series buses.

TARTA Year 2 Report
- 41 -
Table 17a: Regression Results for Pollutant O2: Instantaneous Models
Table 17b: Regression Results for Pollutant CO: Instantaneous Models
Table 17c: Regression Results for Pollutant NO: Instantaneous Models

TARTA Year 2 Report
- 42 -
Table 17d: Regression Results for Pollutant SO2: Instantaneous Models
Table 17e: Regression Results for Pollutant NO2: Instantaneous Models
Table 17f: Regression Results for Pollutant CO2: Instantaneous Models

TARTA Year 2 Report
- 43 -
Fuel Rate Comparison of B-20 and ULSD Bus Fleets The graph shows that the 15 minute average idling fuel rate for B-20 buses in comparison with ULSD buses was 5.82% and 13.68% higher for 300 and 500 series B-20 buses respectively.
Figure 20: Fuel Rate Comparisonof B-20 and ULSD Fleets
Vijayan et al. (2008) provided an overview of the key findings on emissions from public transport buses for both idling and real-world conditions while the factors affecting the emission behavior are provided by Vijayan and Kumar (2008b). Tail Pipe Emissions - Solid Waste and Recycle Trucks Mack (Solid waste) Trucks Fourteen Mack trucks running on ULSD supreme and two Mack trucks running on B-20 were considered in this analysis. Out of the fourteen trucks six trucks were manufactured in the year 1997 (8.3L) and another eight in the year 2003(12.0L). Both of the trucks running on B-20 were manufactured in 2003. The fleet average emissions by year for both cold and hot starts for the Mack trucks are as shown in the Table 18 and Table 19. The percentage change in emissions for both cold and hot idles using B-20 was studied only for trucks manufactured in 2003 because both of the trucks fuelled with B-20 were also manufactured in 2003 and not in 1997 (Table 20 and 21). The effect of age on the tail pipe emissions from Mack trucks is presented in Tables 22 and 23.

TARTA Year 2 Report
- 44 -
Table 18: Fleet Average Emissions (Cold Idle) Year (Fuel) O2 CO NO SO2 NO2 NOx CO2 (%) 2003 (ULSD
supreme) 17.01 194.21 290.24 69.18 52.35 342.58 3.05 1997 (ULSD
supreme) 17.67 175.15 449.42 111.87 72.49 521.91 2.59 2003 (BD) 17.32 206.95 280.03 70.42 53.71 333.74 2.86
Table 19: Fleet Average Emissions (Hot Idle) Year (Fuel) O2 CO NO SO2 NO2 NOx CO2 (%) 2003 (ULSD
supreme) 18.18 168.94 182.33 51.79 42.81 225.13 2.15 1997 (ULSD
supreme) 18.50 103.11 362.98 77.78 51.97 414.93 1.98 2003 (BD) 18.13 190.31 195.28 55.40 45.01 240.22 2.24
Table 20: Percentage Change in Emissions (Cold Idle)
Pollutant(PPM)
ULSD supreme
('03) B-20 %
Change O2 17.10 17.32 1.27 CO 194.21 206.95 6.56 NO 290.24 280.03 -3.52 SO2 69.18 70.42 1.79 NO2 52.35 53.71 2.59 NOx 342.58 333.74 -2.58
CO2 (%) 3.05 2.86 -6.25
Table 21: Percentage Change in Emissions (Hot Idle)
Pollutant(PPM)
ULSD supreme
('03) B-20 %
Change O2 18.18 18.13 -0.28 CO 168.94 190.31 12.65 NO 182.33 195.28 7.10 SO2 51.79 55.40 6.96 NO2 42.81 45.01 5.15 NOx 225.13 240.22 6.70
CO2 (%) 2.15 2.24 4.38

TARTA Year 2 Report
- 45 -
Table 22: Effect of Vehicle Age on Emissions (Cold Idle)
Pollutant(PPM)
ULSD supreme
('97)
ULSD supreme
('03) %
Difference O2 17.67 17.10 -3.25 CO 175.15 194.21 10.88 NO 449.42 290.24 -35.42 SO2 111.87 69.18 -38.16 NO2 72.49 52.35 -27.78 NOx 521.91 342.58 -34.36
CO2 (%) 2.59 3.05 17.90
Table 23: Effect of Vehicle Age on Emissions (Hot Idle)
Pollutant(PPM)
ULSD supreme
('97)
ULSD supreme
('03) %
Difference O2 18.50 18.18 -1.73 CO 103.11 168.94 63.85 NO 362.98 182.33 -49.77 SO2 77.78 51.79 -33.41 NO2 51.97 42.81 -17.63 NOx 414.93 225.13 -45.74
CO2 (%) 1.98 2.15 8.41 The following were the observations made from Tables 18 - 23:
The exhaust gas concentrations of CO, SO2, NOx and CO2 were much higher during cold idle compared to hot idle in the case of all fuel/manufacturing year combinations.
Considerably higher levels of CO and CO2 were emitted by the newer (2003) than the older (1997) trucks in both idling modes, whereas a significant reduction in concentrations of other pollutants was observed in newer trucks than the older ones.
The biodiesel truck used in the study, manufactured in 2003, emitted higher concentrations of all the regulated pollutants during hot idle when compared to trucks fuelled with ULSD supreme.
A trivial decrease in concentrations of NOx and CO2 were observed during cold idle due to the use of B-20.

TARTA Year 2 Report
- 46 -
Cummins (Recycle) Trucks Four Cummins trucks running on ULSD supreme and two Cummins trucks running on B-20 are considered. All the trucks were manufactured in 2001. These trucks had an engine displace of 8.3l. The fleet average emissions for each fuel in the case of both cold and hot idles for Cummins trucks are as shown in Tables 24 and 25. The percentage change in emissions B-20 in the case of cold and hot idle is shown in Tables 26 and Table 27.
Table 24: Fleet Average Emissions (Cold Idle) Pollutant(PPM) O2 CO NO SO2 NO2 NOx CO2 (%) ULSD supreme 17.01 252.45 529.17 122.82 77.55 606.73 3.11
B-20 16.92 193.74 655.68 151.10 81.69 737.37 3.10
Table 25: Fleet Average Emissions (Hold Idle) Pollutant(PPM) O2 CO NO SO2 NO2 NOx CO2 (%) ULSD supreme 17.95 183 289 69 49.2 338 2.39
B-20 17.87 121 387 81 50.8 438 2.45
Table 26: Percentage Change in Emissions (Cold Idle)
Pollutant(PPM)ULSD
Supreme B-20 % Change O2 17.01 16.92 -0.53 CO 252.45 193.74 -23.26 NO 529.17 655.68 23.91 SO2 122.82 151.1 23.03 NO2 77.55 81.69 5.34 NOx 606.73 737.37 21.53
CO2 (%) 3.11 3.10 -0.32
Table 27: Percentage Change in Emissions (Hot Idle)
Pollutant(PPM)ULSD
Supreme B-20 % Change O2 17.95 17.87 -0.45 CO 183 121 -33.88 NO 289 387 33.91 SO2 69 81 17.39 NO2 49.2 50.8 3.25 NOx 338 438 29.59
CO2 (%) 2.39 2.45 2.51

TARTA Year 2 Report
- 47 -
The following were the observations made from Tables 24 to 27:
• Pollutant concentrations for both fuels have shown a significant decrease during hot idle compared to cold idle.
• The concentrations of all the pollutants, except CO, have increased considerably during both cold and hot idle tests with the use of B-20 over ULSD supreme.
• Several studies have identified increases in NOx concentrations with the use of B-20. The result from the present study for both idling modes also agrees with the earlier findings.
• The percentage change in concentrations of CO2 have increased drastically during hot idle compared to cold idle with the use of B-20.
Conclusion A field study to continuously collect indoor air quality data was carried out. The important variables affecting in-vehicle pollutant concentrations for each month have been identified. The study found that the in-bus concentration levels are affected by different factors in each month studied. This finding is different as compared to the results given in the current literature. The reported studies generally combine all the data to draw conclusions regardless of the time of the year.
The particulate matter filter analyses helped provide a basis for consideration of strategies to deal with the methodology for airborne biodiesel exhaust analysis in SEM. The analysis method is very sensitive to the amount of samples collected and the sampling time has an influence on the total particulate matter collected on the filter. In this study, the ESEM was used to characterize the morphology and microstructure of individual carbonaceous particles generated from diesel fuel. These results on particulate characterization should be considered as preliminary in nature.
An extensive exhaust emission study was performed which included idle testing, real-world on-road testing and special test cycles to compare the effect of different fuels. The emission comparison showed that the buses running on B-20 biodiesel fuel produced lower emissions of CO, NO, SO2, NO2, and NOX. But the concentration of CO2 was observed to increase for the buses operating on B-20 fuel. The exhaust gas concentrations of CO, SO2, NOx, and CO2 were very high during cold starts compared to hot starts in the cases of all fuel/manufacturing year combinations for Cummins and Mack trucks. No significant reduction trends were observed in the concentrations of regulated pollutants during cold and hot idling modes due to the use of B-20 over ULSD supreme for Mack trucks whereas the concentration of CO decreased due to the use of B-20 over ULSD supreme during both idling modes in the case of Cummins trucks.

TARTA Year 2 Report
- 48 -
References
1. A.Vijayan, Characterization of Vehicular Exhaust Emissions and Indoor Air Quality of Public Transport Buses Operating on Alternative Diesel Fuels, Ph.D. Dissertation, University of Toledo, 2007.
2. A. Vijayan, and A. Kumar, Characterization of Indoor Air Quality inside Public Transport Buses Using Alternative Diesel Fuels, Proceedings of TRB Conference, Washington, D.C., Jan. 2008a.
3. A. Kadiyala and A. Kumar, Application of CART and Minitab Software to Identify Variables Affecting Indoor Concentration Levels, Environmental Progress, 27(2), xx-xx, 2008a (in press).
4. A. Kadiyala, and A. Kumar, Study of Factors Affecting In-Vehicle Pollutant Levels in the City of Toledo Public Transport Buses Running on Biodiesel, Paper # 508, Proceedings of A&WMA Annual Conference, Portland, OR, 2008b.
5. A. Vijayan, A. Kumar, and M. Abraham, Characterization of Sub-1.0 µm Particulate Matter Distribution Inside Public Transport Buses, Paper # 528, Proceedings of the 2007 A&WMA Annual Conference, Pittsburgh, PA, June 2007.
6. A. Vijayan, A. Kumar, and M. A. Abraham, Experimental Analysis of Vehicle Operation Parameters Affecting Emission Behavior of Public Transport Buses Operating on Alternative Diesel Fuels, Accepted for publication in Journal of the Transportation Research Board, 2008.
7. A. Vijayan and A. Kumar, June 2008b, Multivariate Statistical Identification of Factors Affecting the Emission Behavior of Public Transport Buses, Paper # 674, Proceedings of the 2008 AWMA Annual Conference, Pittsburgh, PA.

TARTA Year 2 Report
- 1 -
APPENDIX

TARTA Year 2 Report
- 2 -
A B C D E F G H I
Bus ID
Total Miles (Adj.)
Total Fuel (Adj.
Gallons) MPGFuel Cost
Per GallonFuel Cost ($/Mile) Engine -Related
Non Engine-Related
Total Maint & Repair
Fuel, R&M Costs (A*E)+(H)
500 43,270.0 18,231.3 2.373386191 3.007$ 1.2670$ 161.02$ 848.82$ 1,009.84$ 55,831.47$ 501 44,293.0 15,104.2 2.932492576 3.007$ 1.0254$ 312.93$ 1,105.96$ 1,418.89$ 46,837.27$ 502 40,331.0 10,431.2 3.866386147 3.007$ 0.7777$ 1,234.04$ 816.89$ 2,050.93$ 33,417.51$ 503 44,356.0 11,769.7 3.768645929 3.007$ 0.7979$ 183.50$ 1,204.45$ 1,387.95$ 36,779.57$ 504 40,918.0 9,239.7 4.42850683 3.007$ 0.6790$ 749.94$ 2,424.96$ 3,174.90$ 30,958.63$ 505 37,375.0 11,774.6 3.174211322 3.007$ 0.9473$ 861.84$ 941.44$ 1,803.28$ 37,209.44$ 506 37,871.0 10,473.2 3.615995587 3.007$ 0.8316$ 394.94$ 637.70$ 1,032.64$ 32,525.51$ 507 41,854.0 10,639.9 3.933701728 3.007$ 0.7644$ 325.81$ 2,616.95$ 2,942.76$ 34,936.79$ 508 37,484.0 10,792.9 3.473021871 3.007$ 0.8658$ 232.02$ 2,609.20$ 2,841.22$ 35,295.49$ 509 40,790.5 9,361.6 4.357210524 3.007$ 0.6901$ 32.83$ 1,515.65$ 1,548.48$ 29,698.84$ 510 43,177.5 8,102.6 5.328846154 3.007$ 0.5643$ 271.36$ 1,440.35$ 1,711.71$ 26,076.22$ 511 40,966.0 18,493.6 2.215141149 3.007$ 1.3575$ 343.29$ 1,094.23$ 1,437.52$ 57,047.86$ 512 37,397.0 12,810.9 2.919146045 3.007$ 1.0301$ 91.97$ 1,236.02$ 1,327.99$ 39,850.48$ 513 43,425.0 12,339.3 3.519233451 3.007$ 0.8544$ 740.36$ 1,178.38$ 1,918.74$ 39,023.12$ 514 31,322.0 3,694.0 8.479237241 3.007$ 0.3546$ 504.42$ 2,583.56$ 3,087.98$ 14,195.73$ 515 41,988.0 9,498.4 4.420512376 3.007$ 0.6802$ 461.87$ 1,391.01$ 1,852.88$ 30,414.71$ 516 38,679.0 10,454.2 3.69984655 3.007$ 0.8127$ 125.09$ 1,905.53$ 2,030.62$ 33,466.45$ 517 38,723.0 7,856.0 4.929097122 3.007$ 0.6101$ 765.82$ 2,634.53$ 3,400.35$ 27,023.35$ 518 41,372.0 9,699.6 4.265309026 3.007$ 0.7050$ 296.07$ 1,584.56$ 1,880.63$ 31,047.47$ Total 765,592.0 210,767.1 75.69992782 15.6152$ 8,089.12$ 29,770.19$ 37,859.31$ 671,635.92$
Average 40,294.3 11,093.0 3.984206727 0.8219$ 425.74$ 1,566.85$ 1,992.60$ 35,349.26$
Table A1. Thomas Biodiesel Summary Costs (June 2007 - May, 2008)Additional Information Repair/Maint. Costs ($/Mile)
Total fuel is based on the time period between June 1, 2007 through May, 2008 with scale adjustment for missing data in March through May. Average Fuel Cost per Gallon is based on Weighted B2 Diesel cost per gallon between June. 2007 – May, 2008. Mileage is based on actual and adjusted miles between June, 2007 through May, 2008.

TARTA Year 2 Report
- 3 -
A B C D E F G H I
Bus ID
Total Miles (Adj.)
Total Fuel (Adj.
Gallons) MPGFuel Cost
Per GallonFuel Cost ($/Mile) Engine -Related
Non Engine-Related
Total Maint & Repair
Fuel, R&M Costs (A*E)+(H)
300 37006 8327.7 4.443731817 3.007$ 0.6767$ 1,500.80$ 985.40$ 2,486.20$ 27,527.55$ 301 36086 10642.3 3.390820268 3.007$ 0.8868$ 91.00$ 681.46$ 772.46$ 32,773.74$ 302 35601 8630.5 4.125007006 3.007$ 0.7290$ 1,018.32$ 783.76$ 1,802.08$ 27,754.09$ 303 30135 8042.4 3.747001299 3.007$ 0.8025$ 389.80$ 1,084.31$ 1,474.11$ 25,657.70$ 304 40938 7852.8 5.213179106 3.007$ 0.5768$ 1,308.06$ 607.57$ 1,915.63$ 25,528.97$
Total 179766 43495.7 20.9197395 3.6718$ 4,307.98$ 4,142.50$ 8,450.48$ 139,242.05$ Average 35953.2 8699.1 4.183947899 0.7344$ 861.60$ 828.50$ 1,690.10$ 27,848.41$
Table A2. Bluebird Biodiesel Costs (June 2007 - May, 2008)Additional Information Repair/Maint. Costs ($/Mile)
Total fuel is based on time period between June 1, 2007 through May 2008, with scaling adjustment for missing data in March through May. Average fuel cost per galleon is based on weighted B20 Diesel cost per gallon between June – May, 2008. Mileage is based on actual and adjusted miles June, 2007 through May, 2008

TARTA Year 2 Report
- 4 -
A B C D E F G H I
Bus IDTotal Miles
Driven (Adj.)
Total Fuel Gallons (Adj.) MPG
Fuel Cost Per Gallon
Fuel Cost ($/Mile) Engine -Related
Non Engine-Related
Total Maint & Repair
Fuel, R&M Costs (A*E)+(H)
519 34,287.00 7,426.39 4.616913616 2.864$ 0.6203$ 556.37$ 1,267.79$ 1,824.16$ 23,093.34$ 520 43,917.00 8,812.69 4.983383054 2.864$ 0.5747$ 106.26$ 1,486.74$ 1,593.00$ 26,832.54$ 521 41,321.00 9,567.65 4.318823686 2.864$ 0.6631$ 611.00$ 1,046.75$ 1,657.75$ 29,059.50$ 522 44,654.00 8,955.15 4.986403202 2.864$ 0.5744$ 284.64$ 1,864.14$ 2,148.78$ 27,796.34$ 523 42,360.00 11,190.47 3.785362572 2.864$ 0.7566$ 274.91$ 1,879.11$ 2,154.02$ 34,203.54$ 524 35,925.00 7,460.14 4.815593265 2.864$ 0.5947$ 1,114.39$ 1,806.34$ 2,920.73$ 24,286.57$ 525 41,844.00 8,471.77 4.939226188 2.864$ 0.5798$ 223.05$ 2,029.60$ 2,252.65$ 26,515.81$ 526 41,199.00 7,362.55 5.595751776 2.864$ 0.5118$ 188.90$ 928.23$ 1,117.13$ 22,203.47$ 527 43,064.00 6,308.53 6.826312681 2.864$ 0.4196$ 604.31$ 1,994.89$ 2,599.20$ 20,666.83$ 528 39,543.00 7,012.60 5.638846217 2.864$ 0.5079$ 1,195.77$ 1,450.37$ 2,646.14$ 22,730.24$ 529 37,625.00 7,146.56 5.264768412 2.864$ 0.5440$ 435.54$ 3,783.45$ 4,218.99$ 24,686.75$ 530 32,506.50 7,296.88 4.454850441 2.864$ 0.6429$ 28.52$ 1,137.38$ 1,165.90$ 22,064.16$ 531 38,524.25 7,692.60 5.007959245 2.864$ 0.5719$ 438.44$ 1,461.24$ 1,899.68$ 23,931.30$ 532 33,305.00 7,919.19 4.205607577 2.864$ 0.6810$ 111.40$ 1,124.46$ 1,235.86$ 23,916.42$ 533 35,052.00 8,808.50 3.979337348 2.864$ 0.7197$ 194.40$ 939.21$ 1,133.61$ 26,361.16$ 534 37,164.00 7,721.13 4.813287651 2.864$ 0.5950$ 3,976.32$ 1,992.91$ 5,969.23$ 28,082.53$ 535 39,340.00 8,322.77 4.72679259 2.864$ 0.6059$ 607.19$ 1,634.46$ 2,241.65$ 26,078.06$ 536 35,174.00 9,185.66 3.829230673 2.864$ 0.7479$ 434.25$ 1,702.66$ 2,136.91$ 28,444.63$ Total 696,804.75 146,661.24 86.78845019 10.9113$ 11,385.66$ 29,529.73$ 40,915.39$ 460,953.18$
Average 38,711.38 8,147.85 4.821580566 0.6062$ 632.54$ 1,640.54$ 2,273.08$ 25,608.51$
Table A3. Thomas ULSD/ULSD Supreme Summary Costs (June 2007 - May, 2008)Additional Information Repair/Maint. Costs ($/Mile)
Total Fuel is based on time period between June 1, 2007 through May, 2008, with scaled adjustment for missing data in March through May. Fuel Cost per gallon is based on weighted averaging ULSD, and ULSD Supreme costs between June 2007 through May 2008. Mileage is based on adjusted miles driven June, 2007 through May, 2008.

TARTA Year 2 Report
- 5 -
A B C D E F G H I
Bus IDTotal Miles
(Adj.)
Total Fuel Gallons (Adj.) MPG
Fuel Cost Per Gallon
Fuel Cost ($/Mile) Engine -Related
Non Engine-Related
Total Maint & Repair
Fuel, R&M Costs (A*E)+(H)
305 30500.0 7757.4 3.931727245 2.864$ 0.7284$ 1,285.06$ 929.45$ 2,214.51$ 24,431.72$ 306 31261.5 6646.6 4.70339104 2.864$ 0.6089$ 1,097.22$ 833.34$ 1,930.56$ 20,966.39$ 307 30949.0 7031.0 4.401808617 2.864$ 0.6506$ 477.44$ 954.09$ 1,431.53$ 21,568.24$ 308 32195.0 7296.4 4.41242968 2.864$ 0.6491$ 1,103.77$ 1,014.83$ 2,118.60$ 23,015.59$ 309 29461.0 6363.6 4.629607955 2.864$ 0.6186$ 1,031.74$ 5,296.73$ 6,328.47$ 24,553.84$ Total 154366.5 35095.0 22.07896454 3.2557$ 4,995.23$ 9,028.44$ 14,023.67$ 114,535.77$
Average 30873.3 7019.0 4.415792907 0.6511$ 999.05$ 1,805.69$ 2,804.73$ 22,907.15$
Additional Information Repair/Maint. Costs ($/Mile)Table A4. Bluebird ULSD/ULSD Supreme Costs (June 2007 - May, 2008)
Total fuel is based on time period between June 1, 2007 through May, 2008, with scaled adjustment for missing data March through May. Fuel cost per gallon is based on weighted averaging ULSD, and ULSD Supreme Costs between June 2007 through May, 2008. Mileage is based on adjusted miles driven June ’07 through May ’08.

TARTA Year 2 Report
- 6 -
No Issues Fuel Soot Viscosity Silicone
1 - No Problems
2 - Elevated. Incomplete
Combustion.
3 - Elevated. Possible Contam.
4 - Possible Contam.
5 - Elevated6 -
Reduction
Blue Bird Biodiesel
300 - 304 5 11 2 18.2% 9 0 1 0 1 0
Oct-00 Oct-00Blue Bird
ULSD305 - 309 5 9 6 66.7% 3 6 0 0 0 0
305, 306, 307, 308, 309
Thomas Biodiesel
500 - 518 19 33 6 18.2% 26 5 1 0 0 1
500, 501, 503, 507, 513 May-01 May-01
Thomas ULSD
519 - 536 18 32 11 34.4% 21 5 5 1 0 0
522, 525, 529, 530, 536
521, 527, 531, 532, 535 Jun-01
59 16 7 1 1 170.24% 19.05% 8.33% 1.19% 1.19% 1.19%
ID of Busses Requiring Corrective Action ►►
ID of Busses Requiring Corrective Action ►►
ID of Busses Requiring Corrective Action ►►
Total Categorical RecommendationsRelative % of Total Per Category
Table A5. Wear Metals Results Summary
ID of Busses Requiring Corrective Action ►►
Information Exhibited for Wear Metal Oil Data During the Timeframe Between June 15, 2007 and December 31, 2007
Information Identified in Sample Results Recommendation Summary - See Number Outline Below
Coolant Additives
Type of Bus Bus ID Sequence
Number of Busses in
Total Number of Samples
# Samples Needing
% Needing Corrective
No Action Required
Change lube oil and filter.
Pressure check coolant system. Change lube oil and
Change lube oil
None
Key:Recommendations 1
23456
Coolant additives seem to be high - possible coolant contamination. Recommend pressure check of coolant system, change Coolant additives present - possible coolant contamination. Recommend pressure check of coolant system, change lube oil Viscosity seems high. Recommend change lube oil and filter, if not already done. Recommend resample at next oil drain. Results: No Corrective Action Required. Si concentration decreased since last sample.
Results: No Corrective Action Required.High Fuel Soot--Indicator of Incomplete Combustion. Soot thickens oil, accelerates wear, and promotes carbon deposits.

TARTA Year 2 Report
- 7 -
Thomas Biodiesel Busses
Jun-07 Jul-07 Aug-07 Sep-07 Oct-07 Nov-07 Dec-07 Jan-08 Feb-08 Mar-08 Apr-08 May-08Annual
Mileage Vehicle Miles Miles Miles Miles Miles Miles Miles Miles Miles Miles Miles MilesNumber Driven Driven Driven Driven Driven Driven Driven Driven Driven Driven Driven Driven
500 5,144 5,275 4,732 4,036 3,714 3,210 2,126 1,841 2,892 3,177 3,211 3,912 43,270501 5,987 4,310 3,094 1,604 4,883 5,702 3,691 3,866 3,198 3,045 3,111 1,802 44,293502 4,559 4,378 3,237 3,420 3,974 2,929 2,305 2,898 2,386 2,628 2,514 5,103 40,331503 3,885 4,363 4,739 3,810 4,121 3,845 2,540 3,485 3,094 3,174 3,665 3,635 44,356504 3,520 2,088 3,791 2,709 3,820 3,631 3,377 3,420 3,003 2,842 4,131 4,586 40,918505 4,273 4,358 4,141 2,193 4,118 3,215 1,374 1,666 1,600 2,047 5,563 2,827 37,375506 3,758 4,848 3,578 3,507 3,436 3,458 1,305 2,626 1,403 3,382 2,723 3,847 37,871507 3,739 3,324 4,432 3,360 3,636 3,793 3,173 3,442 2,078 3,015 4,147 3,715 41,854508 4,304 3,770 3,033 1,884 3,294 3,596 3,644 2,910 3,210 2,454 4,151 1,234 37,484509 3,389 3,349 3,015 2,680 4,601 3,777 3,221 3,700 2,632 2,526 4,290 3,611 40,791510 3,607 4,112 3,569 3,025 4,103 3,092 3,308 3,820 3,000 3,186 4,505 3,851 43,178511 4,055 3,666 3,197 3,330 3,694 3,347 2,499 2,606 3,226 2,866 3,771 4,709 40,966512 4,259 4,227 2,171 3,953 3,176 3,889 2,951 521 1,798 3,555 3,259 3,638 37,397513 4,098 4,300 2,027 2,169 3,484 4,585 3,941 3,246 2,877 3,859 4,393 4,446 43,425514 3,816 1,588 1,577 2,375 2,375 2,375 2,297 2,417 2,555 2,147 4,140 3,660 31,322515 2,934 2,809 4,670 2,684 3,499 3,799 2,639 3,667 3,299 3,179 4,825 3,984 41,988516 4,145 3,424 4,826 3,566 3,869 2,877 3,247 1,296 1,612 2,986 3,961 2,870 38,679517 3,992 3,087 4,883 767 2,725 2,979 4,081 3,729 2,292 2,777 3,586 3,825 38,723518 4,339 3,501 4,627 3,433 3,336 4,677 1,337 2,935 2,986 3,243 3,411 3,547 41,372
Totals 77,803 70,777 69,338 54,505 69,858 68,776 53,056 54,091 49,141 56,088 73,357 68,802 765,592
Table A6. Thomas Biodiesel Annual Mileage Summary - June '07 - May '08
Bus 506 registered '0' mileage for Sept. '07 To estimate the mileage, an average for the adjacent month on either side of Sept. was utilized.Bus 509 registered '0' mileage for Aug. '07. To estimate the mileage, an average for the adjacent month on either side of Aug. was utilized.Bus 510 registered '0' mileage for Aug. '07. To estimate the mileage, an average for the adjacent month on either side of Aug. was utilized.
500 Buses - Thomas
Bus 514 registered '0' mileage for Sept. - Nov. '07. To estimate the mileage, averages for the adjacent (3) months on either side of Sept. - Nov. was utilized..

TARTA Year 2 Report
- 8 -
Bluebird Biodiesel Busses
Jun-07 Jul-07 Aug-07 Sep-07 Oct-07 Nov-07 Dec-07 Jan-08 Feb-08 Mar-08 Apr-08 May-08Annual
MileageVehicle Miles Miles Miles Miles Miles Miles Miles Miles Miles Miles Miles MilesNumber Driven Driven Driven Driven Driven Driven Driven Driven Driven Driven Driven Driven
300 4,938 4,348 3,758 1,603 2,263 2,998 2,891 1,699 2,844 3,184 3,355 3,125 37,006301 4,458 1,914 3,809 3,467 3,622 3,652 4,659 2,360 2,314 3,474 1,516 841 36,086302 1,976 2,250 3,394 3,494 3,331 3,383 3,217 3,008 2,997 2,166 2,763 3,622 35,601303 3,783 3,259 1,998 2,500 1,805 2,386 2,165 1,253 1,760 2,824 2,880 3,522 30,135304 3,887 2,690 4,219 2,831 3,160 2,404 3,475 2,837 2,702 4,021 4,513 4,199 40,938
Totals 19,042 14,461 17,178 13,895 14,181 14,823 16,407 11,157 12,617 15,669 15,027 15,309 179,766
Table A7. Bluebird Biodiesel Annual Mileage Summary - June '07 - May '08
General Info.
300 Buses - BluebirdBus 300 registered '0' miles for July '07. To estimate the mileage, an average for the adjacent month on either side of July was utilized.
Bus mileage below10% of average was treated as suspect, and averages of adjacent monthly mileage was utilized.

TARTA Year 2 Report
- 9 -
Thomas ULSD Busses
Jun-07 Jul-07 Aug-07 Sep-07 Oct-07 Nov-07 Dec-07 Jan-08 Feb-08 Mar-08 Apr-08 May-08Annual
MileageVehicle Miles Miles Miles Miles Miles Miles Miles Miles Miles Miles Miles MilesNumber Driven Driven Driven Driven Driven Driven Driven Driven Driven Driven Driven Driven
519 5,898 3,663 1,864 1,232 3,824 3,129 3,049 2,603 2,606 2,677 2,096 1,646 34,287520 5,082 4,199 2,273 2,212 3,255 2,414 3,942 2,984 3,147 7,438 4,803 2,168 43,917521 4,015 4,515 2,256 2,367 4,372 3,393 3,639 3,339 2,233 3,640 3,621 3,931 41,321522 5,709 3,219 4,645 2,558 4,018 5,478 1,962 3,500 2,960 3,125 3,974 3,506 44,654523 3,598 3,828 4,708 4,059 3,099 4,111 3,835 2,706 3,592 2,520 2,459 3,845 42,360524 4,025 720 3,012 3,447 4,120 3,147 3,201 3,502 3,143 2,119 2,679 2,810 35,925525 5,425 2,880 4,635 3,113 2,848 3,390 3,043 3,396 2,942 2,658 4,272 3,242 41,844526 3,805 3,935 4,176 3,620 3,563 3,474 2,957 2,370 1,948 3,665 4,436 3,250 41,199527 4,521 3,560 4,399 2,721 3,761 3,837 3,466 2,807 3,150 3,377 3,766 3,699 43,064528 2,017 2,674 3,832 3,315 4,555 3,292 2,574 3,167 3,285 2,905 3,823 4,104 39,543529 5,023 2,556 4,277 3,420 1,515 2,929 3,338 2,379 3,555 3,330 2,073 3,230 37,625530 1,432 1,979 2,525 3,664 3,117 3,051 2,663 2,579 3,444 2,959 3,745 1,349 32,507531 3,291 3,923 2,659 1,394 3,468 3,132 3,806 3,156 3,514 3,013 3,363 3,806 38,524532 905 3,273 747 1,377 3,649 4,028 2,537 4,244 3,341 3,414 2,177 3,613 33,305533 1,372 1,362 2,576 1,152 4,123 3,918 2,943 3,714 3,104 3,101 3,380 4,307 35,052534 1,772 4,588 4,039 825 2,390 3,527 2,439 1,925 3,917 3,257 3,819 4,666 37,164535 2,345 2,126 3,607 3,028 3,912 2,320 4,374 2,945 2,901 3,514 4,049 4,219 39,340536 1,645 1,636 4,890 2,010 4,468 2,898 3,645 1,717 2,404 3,357 2,812 3,692 35,174
Totals 61,880 54,636 61,120 45,514 64,057 61,468 57,413 53,033 55,186 60,069 61,347 61,083 696,805
Table A8. Thomas ULSD/ULSD Supreme Annual Mileage Summary - June '07 - May '08
Mileage for Bus 522 registered '0' miles in July, Oct. '07. To estimate the mileage, an average for the adjacent month on either side of July was utilized.
Mileage for Bus 530 registered '3' miles in July, July '07. To estimate the mileage, an average for the adjacent month on either side of July was utilized.Mileage for Bus 531 registered '0' miles in Aug. '08. To estimate the mileage, an average for the adjacent month on either side of Aug. was utilized.
Mileage for Bus 520 registered '0' miles in April '08. To estimate the mileage, an average for the adjacent month on either side of Aug. was utilized.

TARTA Year 2 Report
- 10 -
Bluebird ULSD
BussesJun-07 Jul-07 Aug-07 Sep-07 Oct-07 Nov-07 Dec-07 Jan-08 Feb-08 Mar-08 Apr-08 May-08
Annual Mileage
Vehicle Miles Miles Miles Miles Miles Miles Miles Miles Miles Miles Miles MilesNumber Driven Driven Driven Driven Driven Driven Driven Driven Driven Driven Driven Driven
305 2,872 1,728 3,008 1,601 3,558 3,429 3,081 1,379 1,343 2,517 3,109 2,875 30,500306 3,493 2,639 2,102 1,564 2,834 4,255 2,537 846 739 4,313 3,339 2,601 31,262307 2,975 3,479 3,983 2,094 2,206 2,318 2,582 727 1,023 2,033 3,729 3,800 30,949308 2,146 2,364 3,219 2,614 2,007 3,929 1,915 3,106 3,059 2,455 2,854 2,527 32,195309 4,885 626 373 1,450 2,101 3,680 2,760 3,581 2,362 1,674 3,447 2,522 29,461
Totals 16,371 10,836 12,685 9,323 12,706 17,611 12,875 9,639 8,526 12,992 16,478 14,325 154,367
Table A9. Bluebird ULSD Annual Mileage Summary - June '07 - May '08
300 Buses - Bluebird
Mileage for Bus 307 registered '0' miles in July, and Oct. '07. To estimate the mileage, an average for the adjacent month on either side of July, and Oct. was utilized.
Bus mileage below10% of average was treated as suspect, and averages of adjacent monthly mileage was utilized.
Mileage for Bus 306 registered '0' miles in Aug. '07. To estimate the mileage, an average for the adjacent month on either side of Aug.was utilized.

TARTA Year 2 Report
- 11 -
Bus Type IDIron (Fe)
Chromium (Cr)
Lead (Pb)
Copper (Cu)
Tin (Sn)
Aluminum (Al)
Nickel (Ni)
Silver (Ag)
Silicon (Si)
300-304 Mean34.36 2.55 8.55 7.73 0.09 6.82 0.00 0.82 5.45
300-304 Low 15 1 0 2 0 3 0 0 3
300-304 High 66 7 12 12 1 12 0 2 11
305-309 Mean41.11 3.78 5.78 6.56 0.00 11.33 0.00 1.00 5.78
305-309 Low 28 2 0 3 0 7 0 0 4
305-309 High 85 7 21 12 0 12 0 2 10
500-518 Mean30.33 0.97 2.21 3.27 0.00 8.30 0.00 0.00 5.82
500-518 Low 11 0 0 1 0 2 0 0 2
500-518 High 81 5 9 14 0 21 0 0 21
519-536 Mean31.78 1.34 0.63 3.28 0.03 8.53 0.00 0.00 5.47
519-536 Low 8 0 0 1 0 2 0 0 2
519-536 High 87 4 10 12 1 23 0 0 15
Specification Limit 150 25 50 50 25 30 10 5 50
Note: The Mean is generated to compare with the Specification Limit. The High/Low exhibit the range.
Table A10. Wear Metal Analytical Results (Mean, and Range)
Blue Bird Biodiesel
Blue Bird ULSD
Thomas Biodiesel
Thomas ULSD