progress report on physical habitat trend analyses for...
TRANSCRIPT
Progress Report on Physical Habitat Trend Analyses for Fall Midwater Trawl
September 30, 2005
Fred Feyrer ([email protected]), Matt Nobriga, Ted Sommer
Introduction
We are midway through an in-depth analysis of the Fall Midwater Trawl (FMT)
data to answer the following question: Has physical habitat suitability for delta smelt and
age-0 striped bass declined over the period of record? The analysis was based on the
following assumptions: (1) Delta smelt and young striped bass are generally pelagic
fishes. Thus, their physical habitat can be adequately defined in terms of water quality
parameters. (2) The available water quality parameters (water temperature, Secchi disk
depth, and specific conductance) are sufficient to characterize habitat quality for these
species. (3) All three water quality variables constrain distribution in an additive manner.
We made this assumption because we did not have data to the contrary.
The basic approach used was somewhat comparable to instream flow methods
(IFIM) that have been applied to rivers and streams. First, we developed habitat criteria
to define the physical and chemical conditions that were suitable for striped bass and
delta smelt. Second, we divided the study region into area units based on the location of
FMT sampling sites. Third, we applied the habitat criteria (step 1) to long-term water
quality monitoring data for each FMT site to determine which provided suitable habitat.
Finally, the area units (step 2) based on suitable habitat at FMT sites were summed to
provide an estimate of total suitable area. Note that a major difference between our
approach and traditional IFIM methods is that we relied on actual water quality
1This is a draft work in progress subject to review and revision as information becomes available.

monitoring data at sampling stations to calculate suitable habitat, while IFIM typically
uses model simulations to generate data for each station.
Methods
The FMT has sampled approximately 100 stations across four months -
September, October, November, and December – since 1967. Each site is sampled once
per visit each month. Each monthly collection of samples is termed a survey, thus four
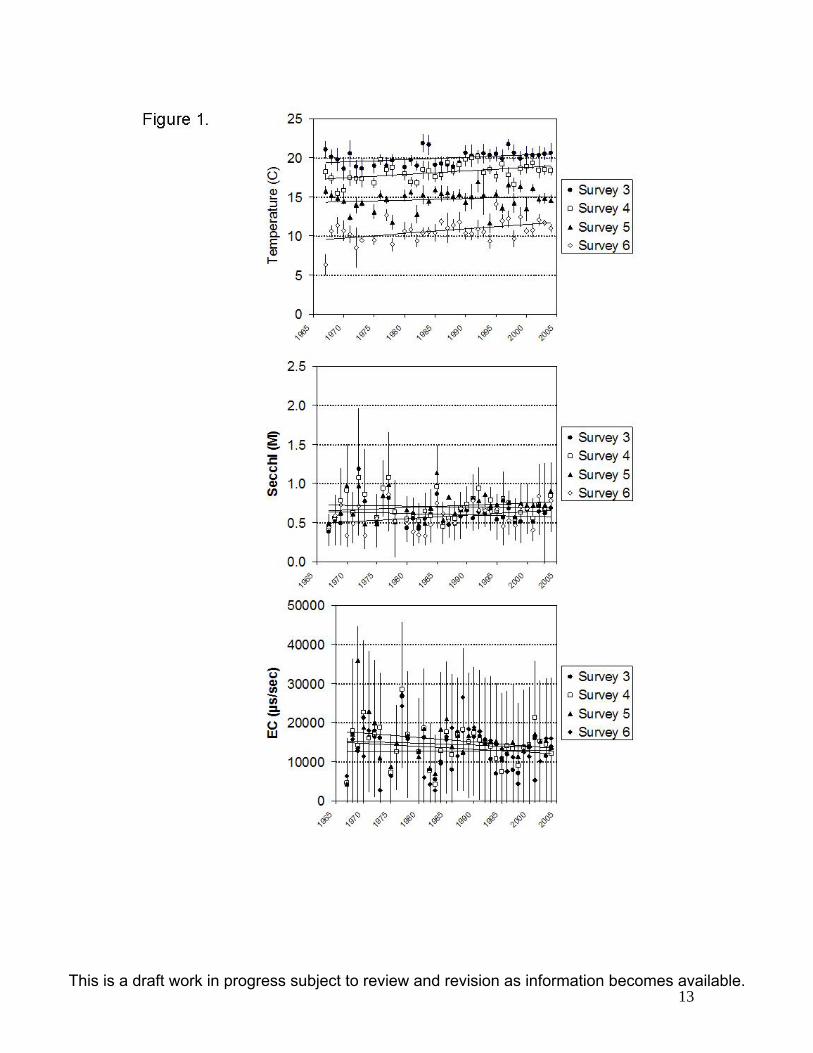
surveys are completed each year. Mean water temperature decreases from approximately
20 ˚C to 10 ˚C over the course of the four surveys because of the seasonal transition from
fall to winter (Figure 1). Secchi depth and specific conductance also exhibit some
seasonal variability but the gross differences are obscured by spatial variability across the
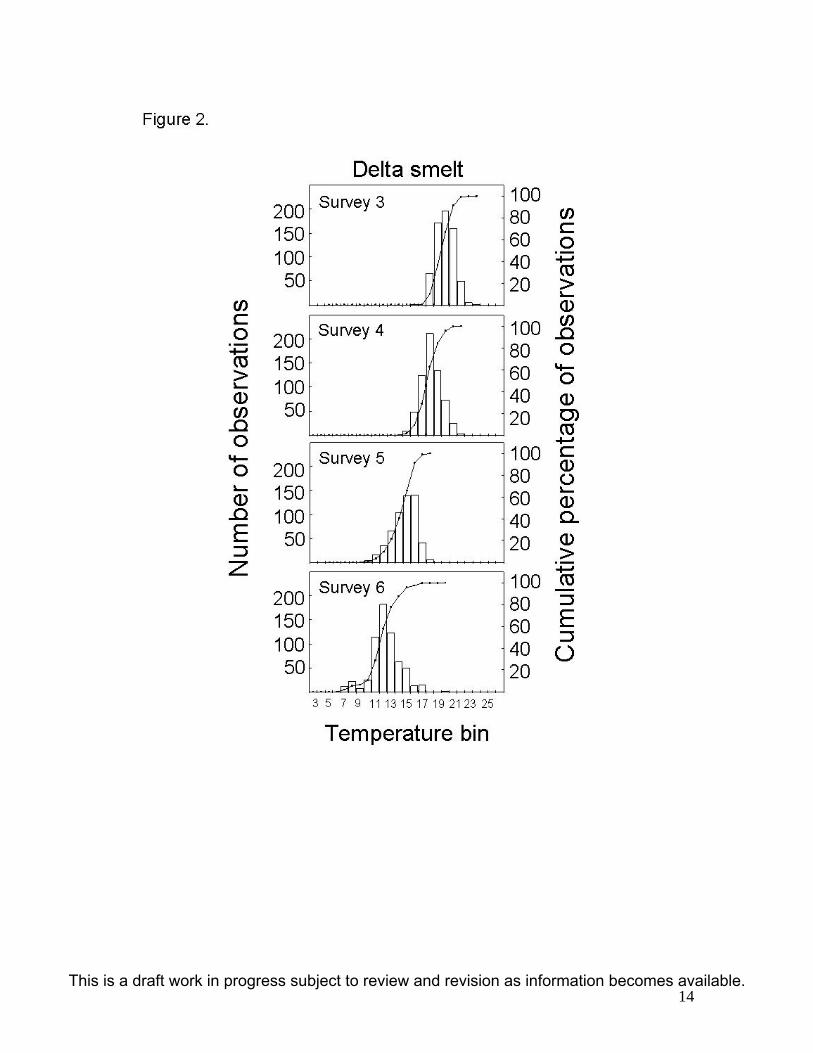
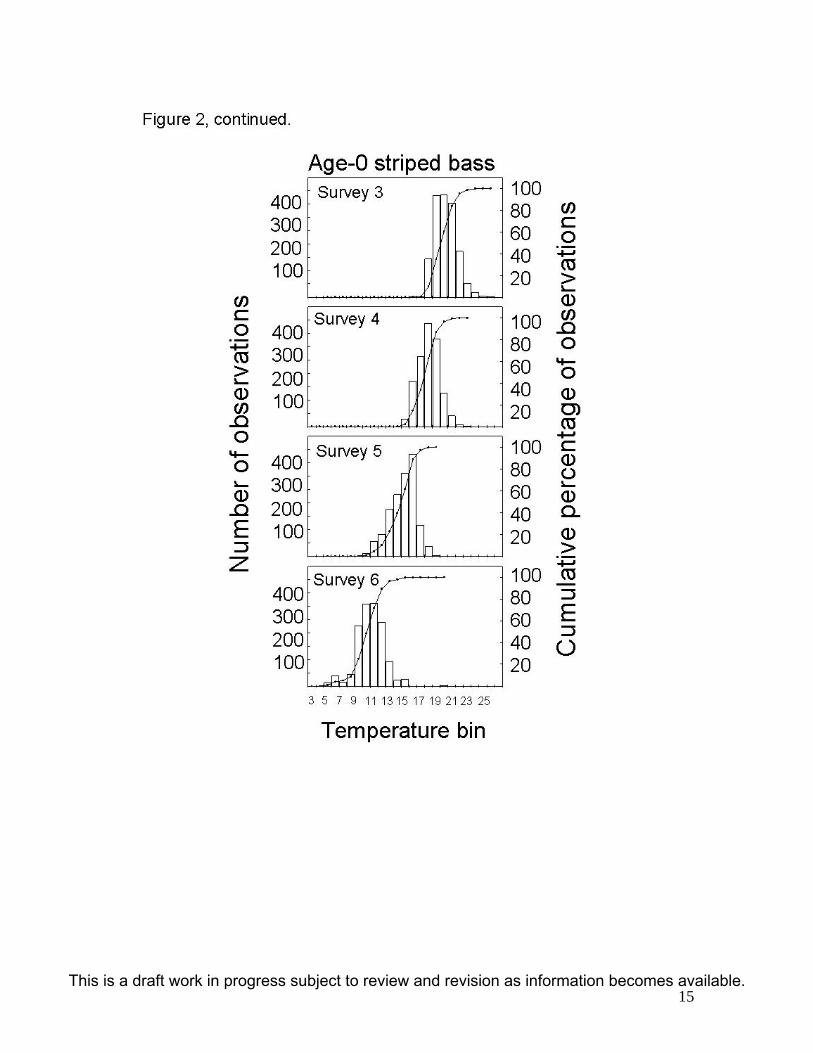
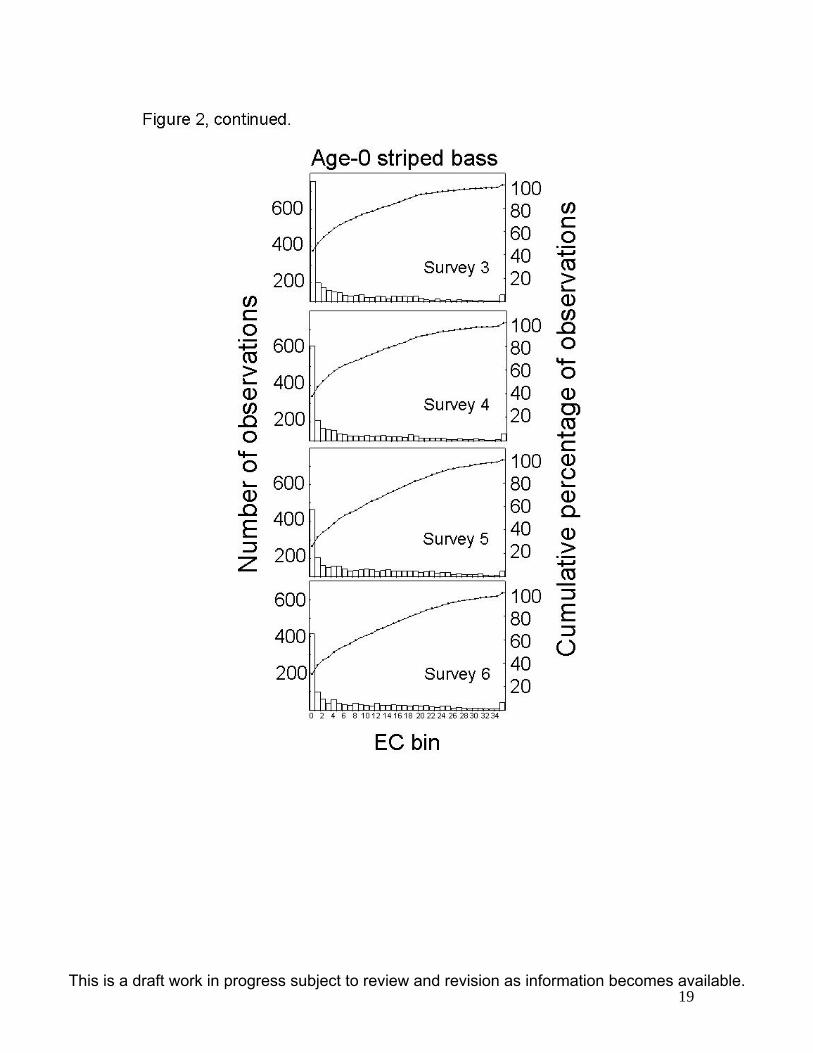
wide geographic area encompassed by the sites (Figure 1). Due to this seasonal
variability, distributions of delta smelt and striped bass shifted to cooler temperatures
across surveys, while shifts in Secchi depth and specific conductance were less apparent
(Figure 2). Due to these differences across surveys, physical habitat suitability criteria
for delta smelt and striped bass were developed separately for each survey.
Physical habitat suitability criteria were developed from a subset of 97% of FMT
samples collected from 1967 to 2004 that had both fish catch and physical environmental
data (N = 14,017 samples). Analyses such as IFIM are often highly sensitive to what
types of habitat suitability criteria are selected. To address this issue, we developed four
different criteria that we believed “bracketed” the habitat of the target fishes (Table 1).
Each method was devised such that data from each survey in each year contributed
2This is a draft work in progress subject to review and revision as information becomes available.

equally to setting habitat suitability criteria. In other words, interannual and inter-survey
abundance differences did not influence our results.
Overall, the constructed physical habitat criteria for temperature was similar for
delta smelt and striped bass however, striped bass exhibited broader criteria for Secchi
depth and specific conductance (Figure 3). Further, for each species, methods A and D
produced similar physical habitat suitability criteria across all environmental variables,
while methods B and C were similar and typically produced a narrower range of criteria.
There was a seasonal downward shift in temperature across the surveys for both species
under all three criteria methods. Secchi depth criteria across surveys appeared relatively
stable. Specific conductance criteria for delta smelt under methods A and C appeared to
increase across surveys. Specific conductance criteria for striped bass exhibited subtle
shifts across surveys but all criteria appeared to remain within a similar range of what
could be considered biologically relevant.
Due to variability in the number of sites sampled among years, we standardized
the amount of total habitat available to a core set of stations used to establish the FMT
fish abundance indices. The list of core stations and associated surface areas (Table 2)
were obtained directly from California Department of Fish and Game staff. Estimates of
surface area meeting suitability criteria are based relative to 347.37 km2, which is the
estimated total available surface area per survey and was derived from the sum of the
surface areas associated for each FMT index station. Because not all index sites were
sampled in all years, estimated surface area sampled also varied among years (Figure 4).
To correct for this problem, a nearest neighbor extrapolation was used to assign
environmental variables to stations with missing data. Sites with missing data and those
3This is a draft work in progress subject to review and revision as information becomes available.

used for extrapolation are given in Table 3. Due to time constraints, the present surface
area analyses are limited to survey 3 for the time period 1982-2004, and 1994 was
omitted from the analyses because of an extensive number of missing sites.
Results
Delta smelt
Overall, there appears to be some evidence of a decreasing time trend in the
proportion of sites sampled meeting suitable habitat criteria (Figure 5) for delta smelt but
not for the total suitable surface area (Figure 6). The proportion of samples meeting
suitable habitat criteria appears to have decreased since about 1990, as has the variability
in sites meeting the criteria. These contrasting results suggest there is likely an
interaction between suitable sites and time periods that requires further investigation.
There is some indication using Methods A and D that suitable habitat area since 2001 has
been below average; however, these trends are within the range of variability of previous
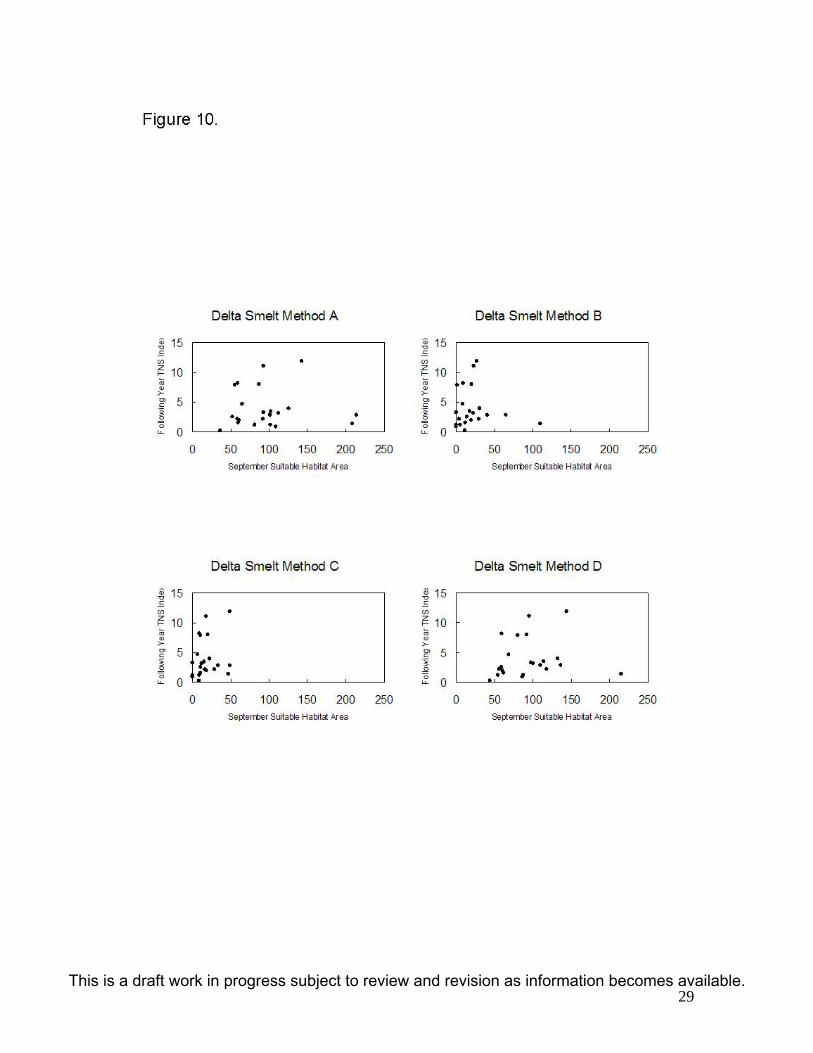
years. It does not appear that total suitable surface area influences September FMT or the
following year’s Summer Townet index (Figures 9 and 11). However, it should be
clearly noted that statistical characterization of these time series and relationships needs
to be completed before conclusions should be drawn from these data.
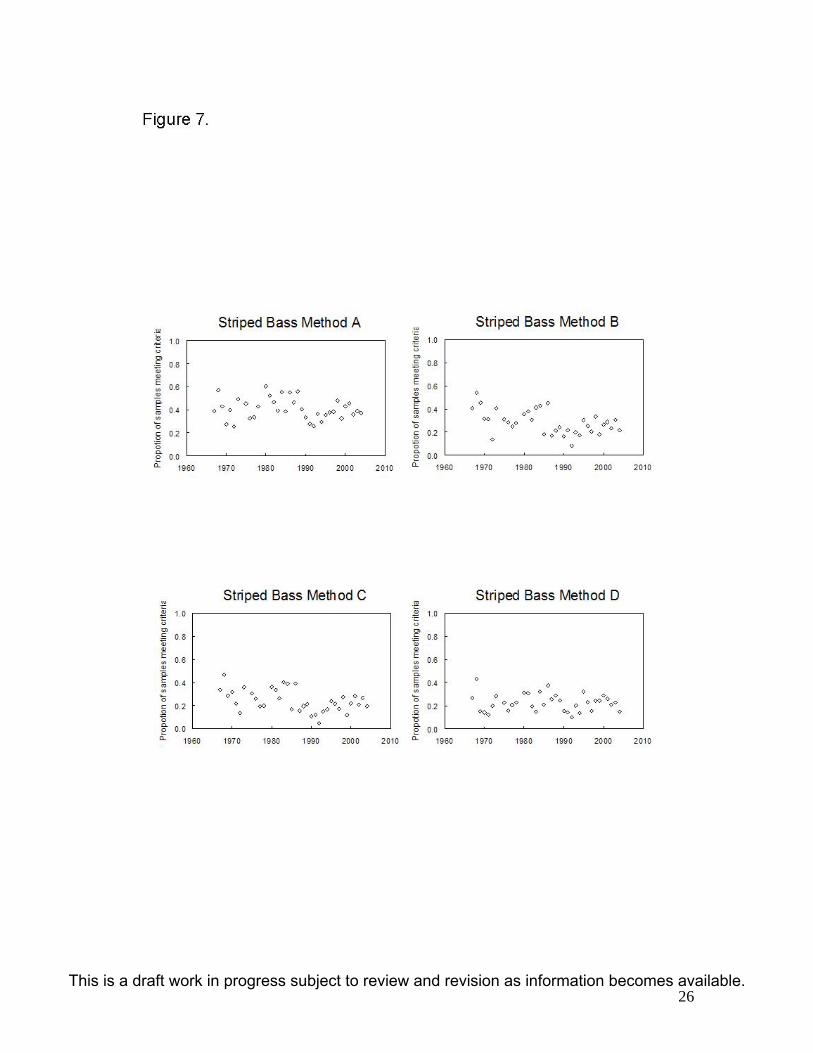
Striped bass
Overall, the results for striped bass are similar to those for delta smelt. There
appears to be some evidence of a decreasing time trend in the proportion sites sampled
meeting suitable habitat criteria (Figure 7) but not for the total suitable surface area
4This is a draft work in progress subject to review and revision as information becomes available.

(Figure 8). Methods B and C suggest that the proportion of samples meeting suitable
habitat criteria may have decreased since about 1990, as has the variability in sites
meeting the criteria. Unlike delta smelt, none of the methods suggest that the past four
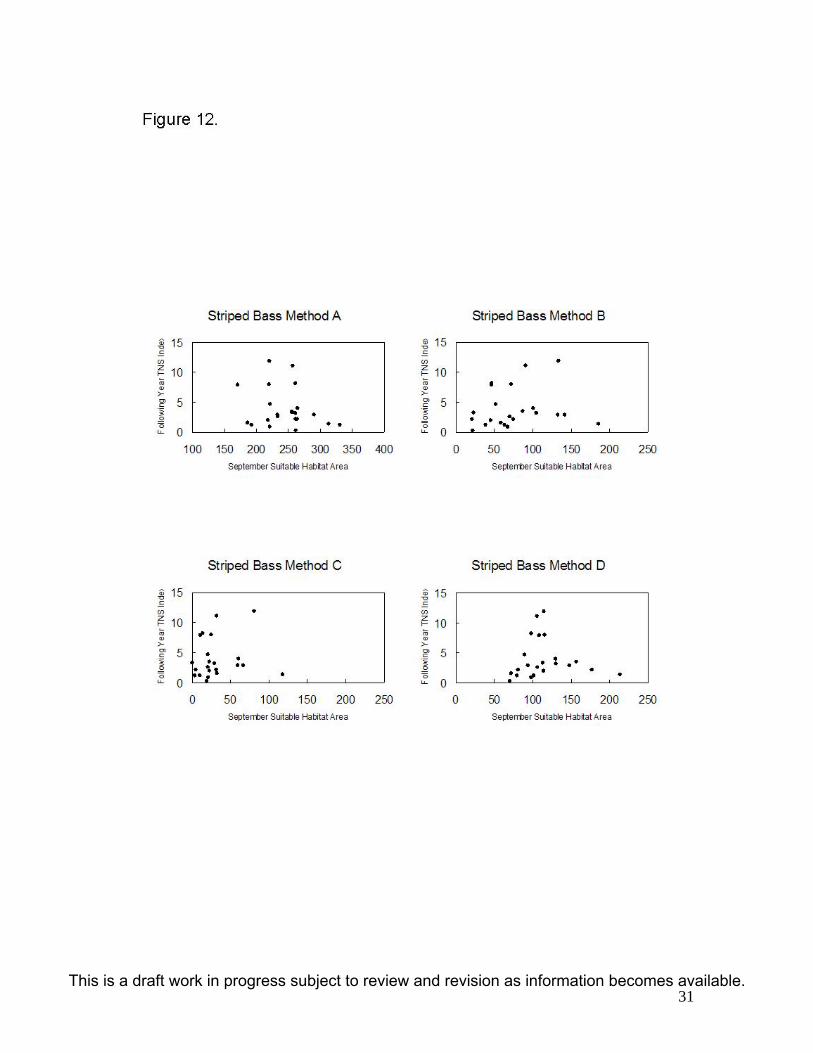
years have shown below average levels of suitable habitat. It does not appear that total
suitable surface area influences September FMT or the following year’s Summer Townet
index (Figures 10 and 12). Again, however, it should be clearly noted that statistical
characterization of these time series and relationships needs to be completed.
Next Steps
• Complete the surface area analyses for all possible years and surveys.
• Statistically characterize all time series.
• Examine all time series in more detail relative to other factors (e.g., delta inflow)
to elucidate mechanisms of variability. This will include investigating possible
interactions between regions meeting suitable habitat criteria and time periods.
• Re-do the analysis by developing the habitat criteria using the top 50% of years
with highest fish abundance, then testing the probability that the 50% of years
with lowest fish abundance come from the same multivariate distribution of
habitat variables. This would provide further assurance that our results are robust
by testing the probability that pooling all years for analysis was an appropriate
choice.
• Use GIS software to examine the distribution of predicted ‘optimal’ habitat and
the empirical distribution of the population. This might provide insight into other
5This is a draft work in progress subject to review and revision as information becomes available.

distribution-constraining variables that we have not accounted for (zooplankton
abundance, water depth, etc.).
6This is a draft work in progress subject to review and revision as information becomes available.
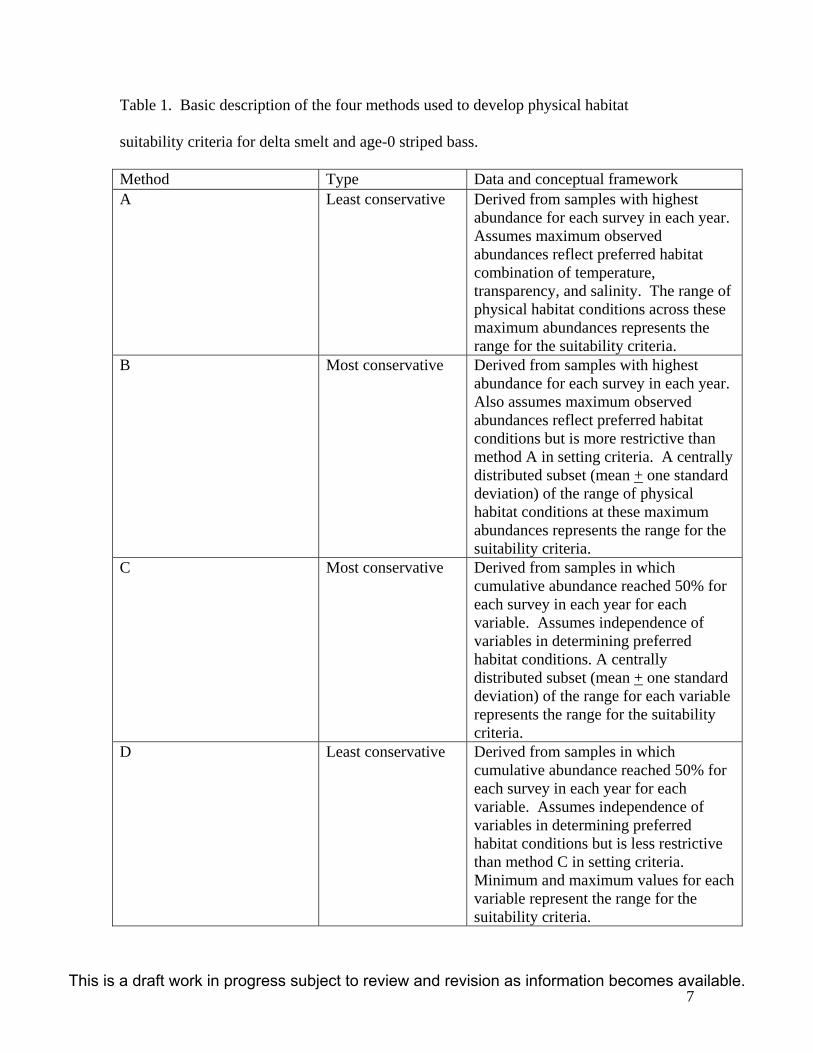
Table 1. Basic description of the four methods used to develop physical habitat
suitability criteria for delta smelt and age-0 striped bass.
Method Type Data and conceptual framework A Least conservative Derived from samples with highest
abundance for each survey in each year. Assumes maximum observed abundances reflect preferred habitat combination of temperature, transparency, and salinity. The range of physical habitat conditions across these maximum abundances represents the range for the suitability criteria.
B Most conservative Derived from samples with highest abundance for each survey in each year. Also assumes maximum observed abundances reflect preferred habitat conditions but is more restrictive than method A in setting criteria. A centrally distributed subset (mean + one standard deviation) of the range of physical habitat conditions at these maximum abundances represents the range for the suitability criteria.
C Most conservative Derived from samples in which cumulative abundance reached 50% for each survey in each year for each variable. Assumes independence of variables in determining preferred habitat conditions. A centrally distributed subset (mean + one standard deviation) of the range for each variable represents the range for the suitability criteria.
D Least conservative Derived from samples in which cumulative abundance reached 50% for each survey in each year for each variable. Assumes independence of variables in determining preferred habitat conditions but is less restrictive than method C in setting criteria. Minimum and maximum values for each variable represent the range for the suitability criteria.
7This is a draft work in progress subject to review and revision as information becomes available.
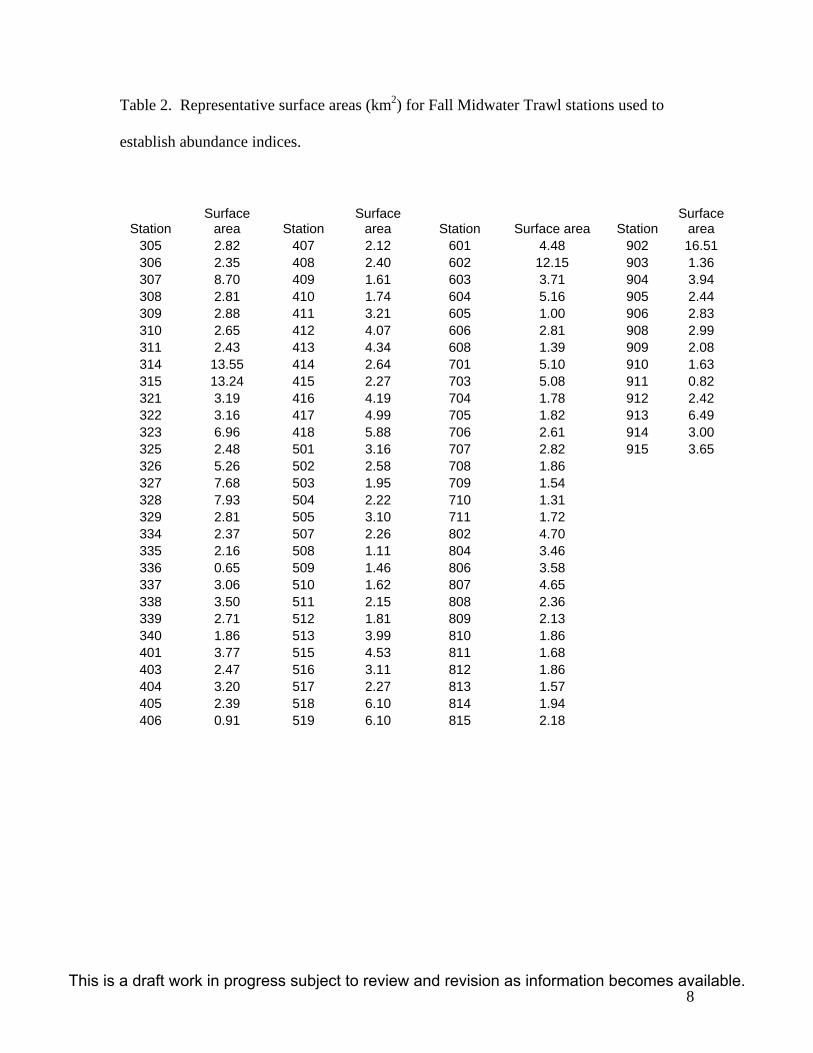
Table 2. Representative surface areas (km2) for Fall Midwater Trawl stations used to
establish abundance indices.
Station Surface
area Station Surface
area Station Surface area Station Surface
area 305 2.82 407 2.12 601 4.48 902 16.51 306 2.35 408 2.40 602 12.15 903 1.36 307 8.70 409 1.61 603 3.71 904 3.94 308 2.81 410 1.74 604 5.16 905 2.44 309 2.88 411 3.21 605 1.00 906 2.83 310 2.65 412 4.07 606 2.81 908 2.99 311 2.43 413 4.34 608 1.39 909 2.08 314 13.55 414 2.64 701 5.10 910 1.63 315 13.24 415 2.27 703 5.08 911 0.82 321 3.19 416 4.19 704 1.78 912 2.42 322 3.16 417 4.99 705 1.82 913 6.49 323 6.96 418 5.88 706 2.61 914 3.00 325 2.48 501 3.16 707 2.82 915 3.65 326 5.26 502 2.58 708 1.86 327 7.68 503 1.95 709 1.54 328 7.93 504 2.22 710 1.31 329 2.81 505 3.10 711 1.72 334 2.37 507 2.26 802 4.70 335 2.16 508 1.11 804 3.46 336 0.65 509 1.46 806 3.58 337 3.06 510 1.62 807 4.65 338 3.50 511 2.15 808 2.36 339 2.71 512 1.81 809 2.13 340 1.86 513 3.99 810 1.86 401 3.77 515 4.53 811 1.68 403 2.47 516 3.11 812 1.86 404 3.20 517 2.27 813 1.57 405 2.39 518 6.10 814 1.94 406 0.91 519 6.10 815 2.18
8This is a draft work in progress subject to review and revision as information becomes available.

Table 3. Sites used for extrapolation (replacement site) for those missing environmental
data (missing site), 1982-2004. 1994 was omitted because of extensive missing sites.
Year Missing site Replacement site 2004 2003 412 413 2002 315 314 2001 2000 1999 1998 1997 407,408 406
703 704 1996 310 309
806 807 1995 306 305
512 513 1993 414 415
509 510 703,704 705 709 710
1992 338 337 339 337 909 910
1991 329 328 501 502 516 516
1990 329 334 501 502 815 814 913,914,915 Average of 902,908
1989 314,315 321 327,328 329 913,914,915 Average of 902,908
1988 414,415 416 913,914,915 Average of 902,908
1987 309 310 815 814 913,914,915 Average of 902,908
1986 413 412 815 814 913,914,915 Average of 902,908
1985 323 322 603 602 815 814
9This is a draft work in progress subject to review and revision as information becomes available.

913,914,915 Average of 902,908 1984 305,306 307
327 328 404 405 408 407 815 814 913,914,915 Average of 902,908
1983 913,914,915 Average of 902,908 1982 310 309
334 335 339 338 602 601 813,815 814 913,914,915 Average of 902,908
10This is a draft work in progress subject to review and revision as information becomes available.

Figure headings
Figure 1. Mean values for environmental variables per survey per year. Error bars are
one standard deviation.
Figure 2. Distribution of delta smelt and age-0 striped bass across surveys for each
environmental variable. Bars represent total number of observations and lines represent
the cumulative percentage of observations.
Figure 3. Range of values encompassed for each physical habitat suitability method
across species and surveys. Details regarding analyses used to derive values for methods
A, B, C, and D are presented in the text and in Table 1.
Figure 4. Estimated total surface area sampled across surveys and years.
Figure 5. Proportion of sites sampled that met suitable habitat criteria for delta smelt
under each method.
Figure 6. Total surface area that met suitable habitat criteria for delta smelt under each
method. This time series is limited to Survey 3 for the time period 1982-2004, with 1994
excluded because of extensive missing sites.
11This is a draft work in progress subject to review and revision as information becomes available.

Figure 7. Proportion of sites sampled that met suitable habitat criteria for striped under
each method.
Figure 8. Total surface area that met suitable habitat criteria for striped bass under each
method. This time series is limited to Survey 3 for the time period 1982-2004, with 1994
excluded because of extensive missing sites.
Figure 9. Total September suitable delta smelt habitat area plotted against September
FMT delta smelt index.
Figure 10. Total September suitable delta smelt habitat area plotted against following
year’s Summer Townet delta smelt index.
Figure 11. Total September suitable striped bass habitat area plotted against September
FMT striped bass index.
Figure 12. Total September suitable striped bass habitat area plotted against following
year’s Summer Townet striped bass index.
12This is a draft work in progress subject to review and revision as information becomes available.
13This is a draft work in progress subject to review and revision as information becomes available.
14This is a draft work in progress subject to review and revision as information becomes available.
15This is a draft work in progress subject to review and revision as information becomes available.

16This is a draft work in progress subject to review and revision as information becomes available.

17This is a draft work in progress subject to review and revision as information becomes available.

18This is a draft work in progress subject to review and revision as information becomes available.
19This is a draft work in progress subject to review and revision as information becomes available.

20This is a draft work in progress subject to review and revision as information becomes available.

21This is a draft work in progress subject to review and revision as information becomes available.

22This is a draft work in progress subject to review and revision as information becomes available.

23This is a draft work in progress subject to review and revision as information becomes available.

24This is a draft work in progress subject to review and revision as information becomes available.

25This is a draft work in progress subject to review and revision as information becomes available.
26This is a draft work in progress subject to review and revision as information becomes available.

27This is a draft work in progress subject to review and revision as information becomes available.

28This is a draft work in progress subject to review and revision as information becomes available.
29This is a draft work in progress subject to review and revision as information becomes available.

30This is a draft work in progress subject to review and revision as information becomes available.
31This is a draft work in progress subject to review and revision as information becomes available.