progress report 2015 - better buildings initiative · better buildings progress report 2015...
TRANSCRIPT
Progress Report 2015
Better Buildings Progress Report 2015
Executive Summary 1
Better Buildings Platform 2
Better Buildings Challenge
Year in Review 4
Leaders Deliver Results: Goal Achievers in 2014 5
Solutions Help Organizations of All Sizes and Sectors 6
Sharing Proven Strategies 7
Showcasing Real Projects 9
Sector Spotlights 11
Commercial Sector 12
Industrial Sector 13
State and Local Sector 14
Education Sector 15
Multifamily Sector 16
Financial Allies 17
Expanding to Additional Strategic Areas 18
Recognizing Leadership 19
Better Buildings Accelerators 20
Better Buildings Workforce Guidelines 24
Better Buildings Challenge: Partners and Allies 25
Learn more at energy.gov/betterbuildings/solutioncenter

A cornerstone of Better Buildings is the Better Buildings Challenge, a leadership initiative calling on CEOs, university presidents, building owners, state and local government leaders, and residential housing developers to publicly pledge to reduce the energy use of their entire building portfolios. More than 250 leaders from diverse sectors have stepped up to the Challenge, representing over 3.5 billion square feet, 650 manufacturing plants, and $5.5 billion in financing investments.
Across the country, partners have shared energy data for more than 32,000 properties and are reporting savings of 20% or more at 4,500 properties, and 10% or more at 12,000 properties. This means partners are on track to meet energy savings goals, saving on average 2% each year or $840 million since the program launched.
As partners continue to meet their goals to save energy, they have also contributed more than 120 showcase projects and 70 unique implementation models. These solutions are now available online to help other organizations implement their own energy efficiency projects.
Executive SummaryBetter Buildings, launched by President Obama in 2011, is a broad, multi-strategy initiative aiming to improve the energy use of our nation’s commercial, industrial, residential, and public buildings by 20% over 10 years. Over the past four years, Better Buildings has had tremendous success harnessing public and private sector leadership, state and local policies, financing mechanisms, workforce development, and efforts to improve building energy information to meet that ambitious goal.
Hundreds of organizations are currently partnering with the Energy Department (DOE) and furthering four key strategic areas to accelerate investments in energy efficiency.
� Developing Innovative, Replicable Solutions with Market Leaders
� Making Energy Efficiency Investment Easier
� Federal Leadership by Example
� Developing a Skilled Clean Energy Workforce
As partners achieve their energy goals, they are saving hundreds of millions of dollars annually on energy bills, reducing greenhouse gas (GHG) emissions, creating thousands of jobs, and helping to meet the goals set forth in the President’s Climate Action Plan. Key achievements this year include:
� More than $10 billion is committed to greater efficiency (through federal, state, and local leadership on performance contracting and commitments by financial allies in the Better Buildings Challenge) with more than $4.5 billion invested in projects.
� Expanded to seven Better Buildings Accelerators, which address barriers of national impact across the commercial, industrial, public, and now residential sectors.
� Launched the Better Buildings Solution Center to help organizations easily navigate a central repository of successful strategies that overcome organizational and technical barriers and drive greater efficiency across their portfolios.
“As the Better Buildings Initiative enters its fourth year, leaders continue to showcase how saving energy saves money, creates jobs, and most importantly accelerates the nation’s competitiveness in the clean energy economy while preserving our environment for generations to come.”
Energy Secretary Ernest Moniz
1
MARKETLEADERSHIP
WORKFORCEDEVELOPMENT
Learn more at energy.gov/betterbuildings/solutioncenter
Developing Innovative, Replicable Solutions with Market Leaders
•
•
•
•
•
•
Better Buildings Challenge President’s challenge to CEOs, university presidents, state and local government leaders, and building owners to help lead the country to 20% savings over 10 years; 250 organizations spanning more than 3.5 billion sq. ft. of building space have taken this leadership challenge
Better Buildings AllianceMore than 180 organizations representing 10 billion sq. ft. have joined this collaborative effort to develop high-impact technical and market solutions for improved energy efficiency in commercial buildings
Better Buildings, Better Plants 150+ industrial companies representing 11% of the U.S. manufacturing energy footprint participate in this voluntary pledge to reduce energy intensity by 25% over 10 years
Better Buildings AcceleratorsDemonstrating innovative approaches to address targeted barriers with national impact, including energy data, performance contracting, and strategic energy management
Better Buildings ResidentialWorking with stakeholders to increase the number of high-performing, energy-efficient homes in the United States
Superior Energy PerformanceProviding a market-based solution for certifying manufacturing and commercial facilities that have demonstrated energy management excellence through the ISO 50001 standard and sustained energy performance improvement
Developing a Skilled Clean Energy Workforce
• Better Buildings Workforce GuidelinesDOE partnered with the National Institute of Building Sciences todevelop national guidelines for professional certification programsfor key energy-related jobs to improve the quality and consistency ofcommercial building workforce credentials
2
Better Buildings aims to make commercial, public, industrial, and residential buildings 20% more energy efficient over the next decade. This means saving hundreds of billions of dollars on energy bills, reducing GHG emissions, and creating thousands of jobs. Through Better Buildings, public and private sector organizations across the country are working together to share and replicate positive gains in energy efficiency. DOE is currently pursuing strategies within four interrelated key areas to catalyze change and investment in energy efficiency.
3
FEDERALLEADERSHIP
BETTERINFORMATION
Making Energy Efficiency Investment Easier
•
•
•
•
•
•
Building Performance Database9,000 users have accessed the largest searchable dataset of information about the physical and operational characteristics of real buildings to understand trends in building performance
Building Energy Data Exchange SpecificationA dictionary of 575 terms and definitions to facilitate consistent exchange of information on building characteristics and energy use
New Financing SolutionsFinancial allies in the Better Buildings Challenge have extended $3 billion in financing and are sharing innovative solutions
Building Energy Asset Scoring Tool500+ buildings have been scored using this tool that evaluates the physical energy efficiency of buildings to determine potential improvements
Home Energy ScoreWith 20,000 homes scored to date, this tool helps homeowners and homebuyers understand how much energy a home is expected to use and provides suggestions for improving its energy efficiency
Appraisal Foundation Memorandum of UnderstandingThe Appraisal Foundation, with support from DOE, will release practical guidelines for appraisers to properly evaluate energy performance when conducting building appraisals
Leading by Example in the Federal Government
•
•
•
New Executive Order Extends federal goals through 2025 with targets of 40% reduction in GHG emissions, 30% increased use of renewable electricity, and 25% improved building efficiency by 2025
President’s Performance Contracting ChallengeAgencies have contracted for $2 billion toward a $4 billion performance contracting goal to improve the sustainability of federal facilities
DOE LeadershipDOE has reduced its GHG emissions by 34%, ahead of its 2020 target
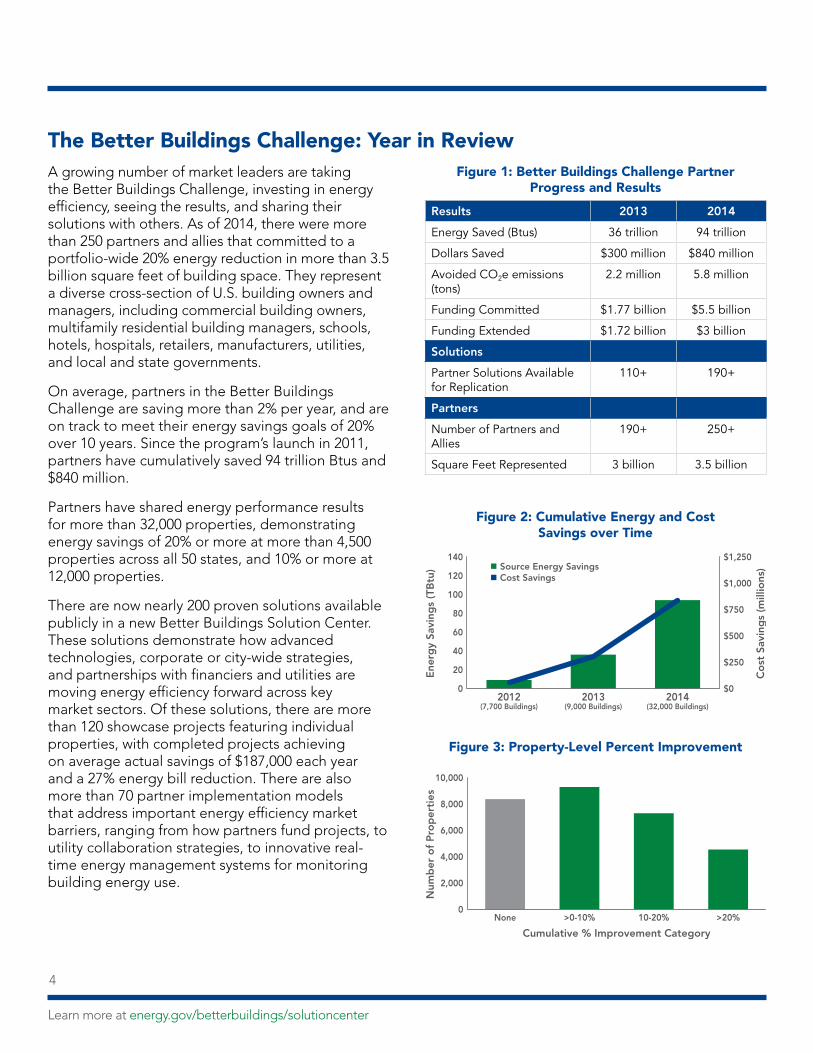
The Better Buildings Challenge: Year in ReviewA growing number of market leaders are taking the Better Buildings Challenge, investing in energy efficiency, seeing the results, and sharing their solutions with others. As of 2014, there were more than 250 partners and allies that committed to a portfolio-wide 20% energy reduction in more than 3.5 billion square feet of building space. They represent a diverse cross-section of U.S. building owners and managers, including commercial building owners, multifamily residential building managers, schools, hotels, hospitals, retailers, manufacturers, utilities, and local and state governments.
On average, partners in the Better Buildings Challenge are saving more than 2% per year, and are on track to meet their energy savings goals of 20% over 10 years. Since the program’s launch in 2011, partners have cumulatively saved 94 trillion Btus and $840 million.
Partners have shared energy performance results for more than 32,000 properties, demonstrating energy savings of 20% or more at more than 4,500 properties across all 50 states, and 10% or more at 12,000 properties.
There are now nearly 200 proven solutions available publicly in a new Better Buildings Solution Center. These solutions demonstrate how advanced technologies, corporate or city-wide strategies, and partnerships with financiers and utilities are moving energy efficiency forward across key market sectors. Of these solutions, there are more than 120 showcase projects featuring individual properties, with completed projects achieving on average actual savings of $187,000 each year and a 27% energy bill reduction. There are also more than 70 partner implementation models that address important energy efficiency market barriers, ranging from how partners fund projects, to utility collaboration strategies, to innovative real-time energy management systems for monitoring building energy use.
Figure 1: Better Buildings Challenge Partner Progress and Results
Results 2013 2014
Energy Saved (Btus) 36 trillion 94 trillion
Dollars Saved $300 million $840 million
Avoided CO2e emissions (tons)
2.2 million 5.8 million
Funding Committed $1.77 billion $5.5 billion
Funding Extended $1.72 billion $3 billion
Solutions
Partner Solutions Available for Replication
110+ 190+
Partners
Number of Partners and Allies
190+ 250+
Square Feet Represented 3 billion 3.5 billion
Figure 2: Cumulative Energy and Cost Savings over Time
0
20
40
60
80
100
120
140
201420132012
Ene
rgy
Savi
ngs
(TB
tu)
Co
st S
avin
gs
(mill
ions
)n Source Energy Savingsn Cost Savings
$0
$250
$500
$750
$1,000
$1,250
(32,000 Buildings)(9,000 Buildings)(7,700 Buildings)
Figure 3: Property-Level Percent Improvement
0
2,000
4,000
6,000
8,000
10,000
>20%10-20%>0-10%None
Num
ber
of
Pro
per
ties
Cumulative % Improvement Category
Learn more at energy.gov/betterbuildings/solutioncenter5
4
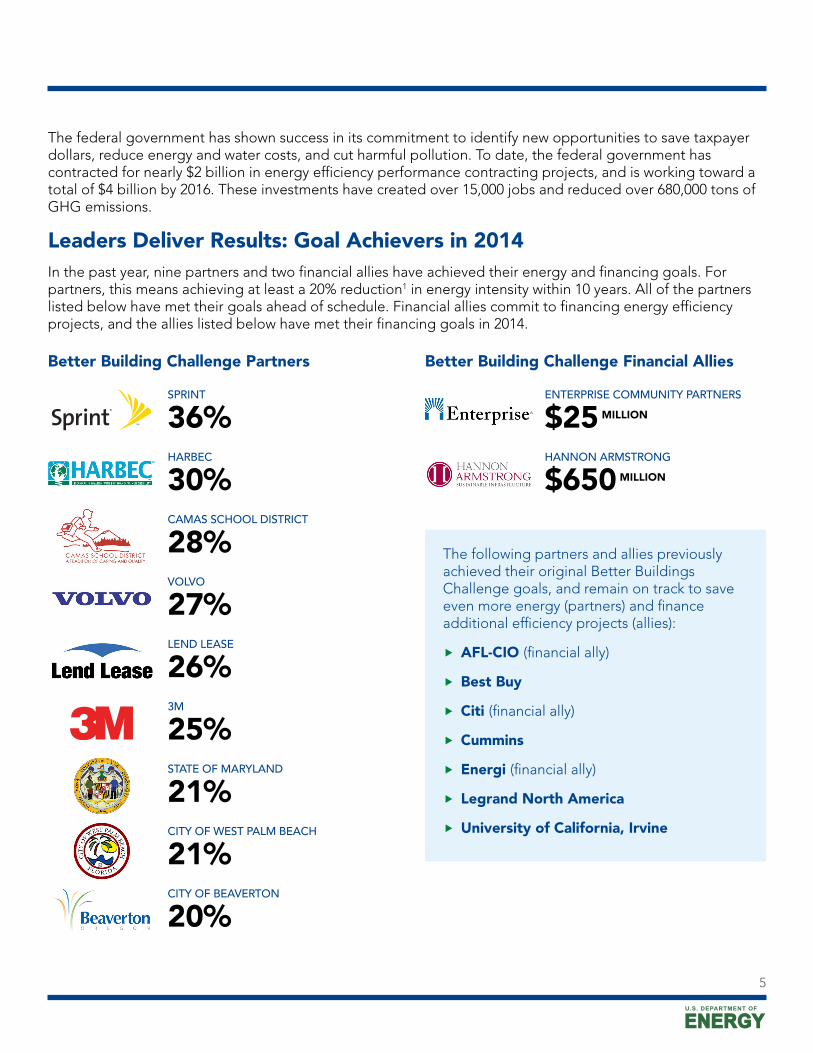
The federal government has shown success in its commitment to identify new opportunities to save taxpayer dollars, reduce energy and water costs, and cut harmful pollution. To date, the federal government has contracted for nearly $2 billion in energy efficiency performance contracting projects, and is working toward a total of $4 billion by 2016. These investments have created over 15,000 jobs and reduced over 680,000 tons of GHG emissions.
Leaders Deliver Results: Goal Achievers in 2014In the past year, nine partners and two financial allies have achieved their energy and financing goals. For partners, this means achieving at least a 20% reduction1 in energy intensity within 10 years. All of the partners listed below have met their goals ahead of schedule. Financial allies commit to financing energy efficiency projects, and the allies listed below have met their financing goals in 2014.
Better Building Challenge Partners
SPRINT
36%HARBEC
30%CAMAS SCHOOL DISTRICT
28%VOLVO
27%LEND LEASE
26%3M
25%STATE OF MARYLAND
21%CITY OF WEST PALM BEACH
21%CITY OF BEAVERTON
20%
Recreated PMS
Better Building Challenge Financial Allies
ENTERPRISE COMMUNITY PARTNERS
$25 MILLION
HANNON ARMSTRONG
$650 MILLION
The following partners and allies previously achieved their original Better Buildings Challenge goals, and remain on track to save even more energy (partners) and finance additional efficiency projects (allies):
�
�
�
�
�
�
�
AFL-CIO (financial ally)
Best Buy
Citi (financial ally)
Cummins
Energi (financial ally)
Legrand North America
University of California, Irvine
5
Solutions Help Organizations of All Sizes and SectorsThrough their transparency and foresight, Better Buildings Challenge partners are moving the market forward and collectively advancing our nation’s energy efficiency. Their leadership is exhibited through the novel strategies they apply across their building portfolios and the best practices sharing they undertake, which inspires their peers to do the same.
�
�
Sharing Proven Strategies:Partners create unique, replicable implementation models for overcoming common energy efficiency barriers, so other organizations can apply these strategies and achieve similar savings.
Showcasing Real Projects:Partners share details on their energy savings projects, which apply cutting-edge energy efficiency measures to single facilities taking a multi-measure, whole-building approach to achieve comprehensive energy and cost savings. These solutions typically show savings of 20% or more.
Learn more at energy.gov/betterbuildings/solutioncenter
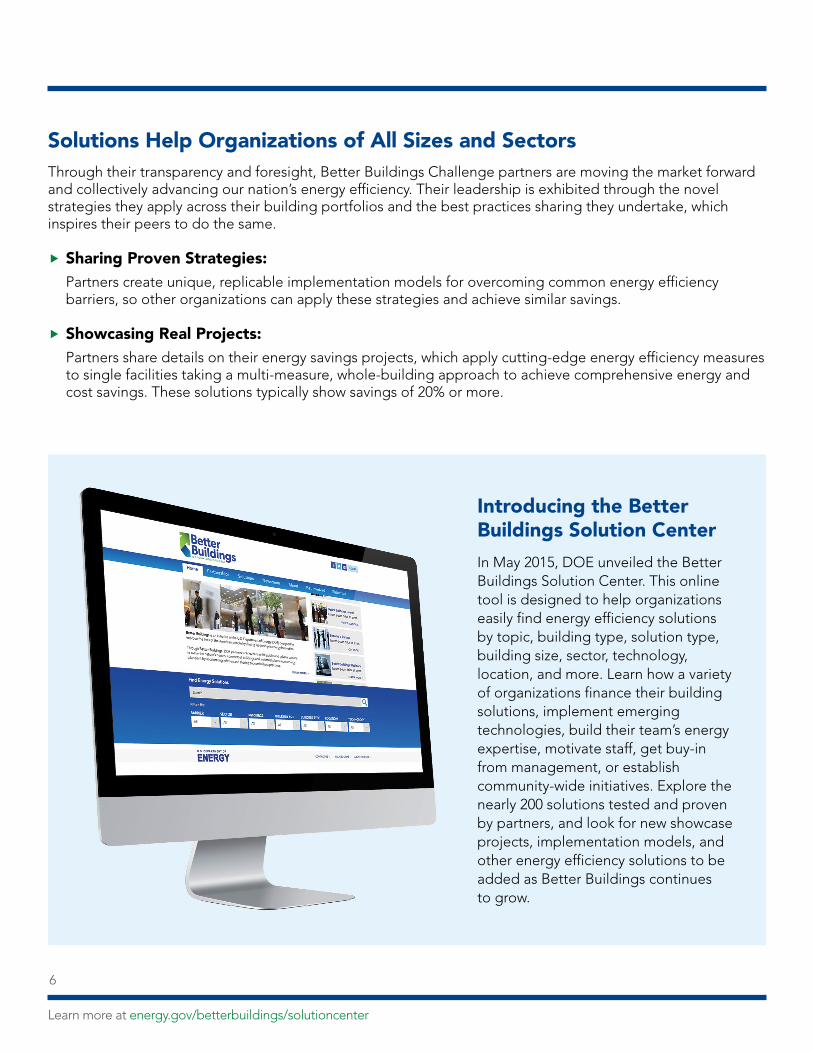
Introducing the Better Buildings Solution Center
In May 2015, DOE unveiled the Better Buildings Solution Center. This online tool is designed to help organizations easily find energy efficiency solutions by topic, building type, solution type, building size, sector, technology, location, and more. Learn how a variety of organizations finance their building solutions, implement emerging technologies, build their team’s energy expertise, motivate staff, get buy-in from management, or establish community-wide initiatives. Explore the nearly 200 solutions tested and proven by partners, and look for new showcase projects, implementation models, and other energy efficiency solutions to be added as Better Buildings continues to grow.
6
Sharing Proven StrategiesSharing strategies that work is a key contribution of Better Buildings Challenge partners. Currently, there are more than 70 implementation models in the Better Buildings Solution Center including 20 new models shared in the past year. The implementation models listed below are examples of the real world solutions that partners are sharing to guide other organizations as they overcome barriers to greater energy efficiency.
Finding the money and paying for energy efficiency projects
Motivating and engaging employees across your organization
Ford Go Green Dealership Program: Ford Motor Company launched a national Go Green Sustainability Program that has helped participating franchised Ford dealerships reduce energy use 27% on average.
Inter-Agency Energy Competition: Maryland launched the 16-Agency Energy Competition, a state-led initiative, as an incentive for the state building portfolio’s largest energy consumers to reduce energy costs and consumption.
Corporate Goal Is a Catalyst for Custom Efficiency Strategies for Office, Retail, and Data Assets: Sprint builds support for its overall goal by applying a unique energy savings approach to each asset class and tying compensation to energy reduction, which has resulted in more than $60 million in avoided energy costs.
Engaging and retaining employees, tenants, and customers
Plant Energy Awards for Internal Recognition: 3M’s awards program cultivates employee engagement and sparks energy efficiency innovation by creating energy champions and increasing visibility for plant-level energy saving efforts.
Smart Meter Resident Energy Savings Program: Balfour Beatty Communities gets more savings from already efficient buildings through a resident engagement strategy that provides specific feedback messages from smart meter data.
Energy Performance Contracting: General Motors’ creation of an Energy Performance Contracting model helped double the amount of money directed toward energy conservation from $40 million to $80 million.
Renewable Solar Financing Model: National Housing Trust and Enterprise Preservation Corporation created an innovative stand-alone business entity to finance solar energy in affordable multifamily housing that takes the burden of equipment ownership and maintenance off of the individual properties and leverages economies of scale.
Recreated PMS
7
Reaching your community
Partner-Ally Network: The Fort Worth Better Buildings Challenge was launched in 2012, and is a public-private partnership to facilitate energy and water improvements in commercial buildings as well as city facilities.
Municipal Action Plan for Sustainability: Cleveland, OH’s municipal action plan enabled the city to accelerate its sustainability efforts in a more coordinated and impactful manner.
Using technologies and tools for data-driven results
Real Time Energy Monitoring: Beaverton, OR used real time energy monitoring to more accurately identify, prioritize, and implement low- and no-cost energy savings measures at two city facilities, achieving 23% and 15% energy savings respectively.
Building expertise within your organization to help meet goals faster
Leverage Student-Faculty Research: Allegheny College’s student-faculty research team predicts the financial benefits of energy-saving options for campus construction and renovations.
Global Water Conservation Guidance Document: United Technologies Corporation provided its employees the tools and resources that helped result in a 33% absolute reduction in global water use.
Gallery Walks: New York-Presbyterian Hospital launched a retrocommissioning program that blends energy management with improving the quality of patient care for a holistic approach that engages all hospital staff to improve the environment of care.
Getting access to data
Centralized Data Repository: Delaware utilized EPA’s Portfolio Manager to benchmark state building energy use, develop a centralized data repository, analyze building energy performance, and strategically identify and prioritize retrofit projects.
Designing a Comprehensive Energy Plan: Knoxville, TN convened a public-private task force to develop a work plan, entered into an energy services performance contract to retrofit municipal facilities, and implemented an energy data tracking system.
Partnering with your utility
Learn more at energy.gov/betterbuildings/solutioncenter
Customized Utility Incentives: Whole Foods Market worked with a regional utility provider to customize energy efficiency incentives for the grocery sector, and signed an agreement to receive incentive funds based on actual energy reductions rather than one-for-one equipment replacements.
8
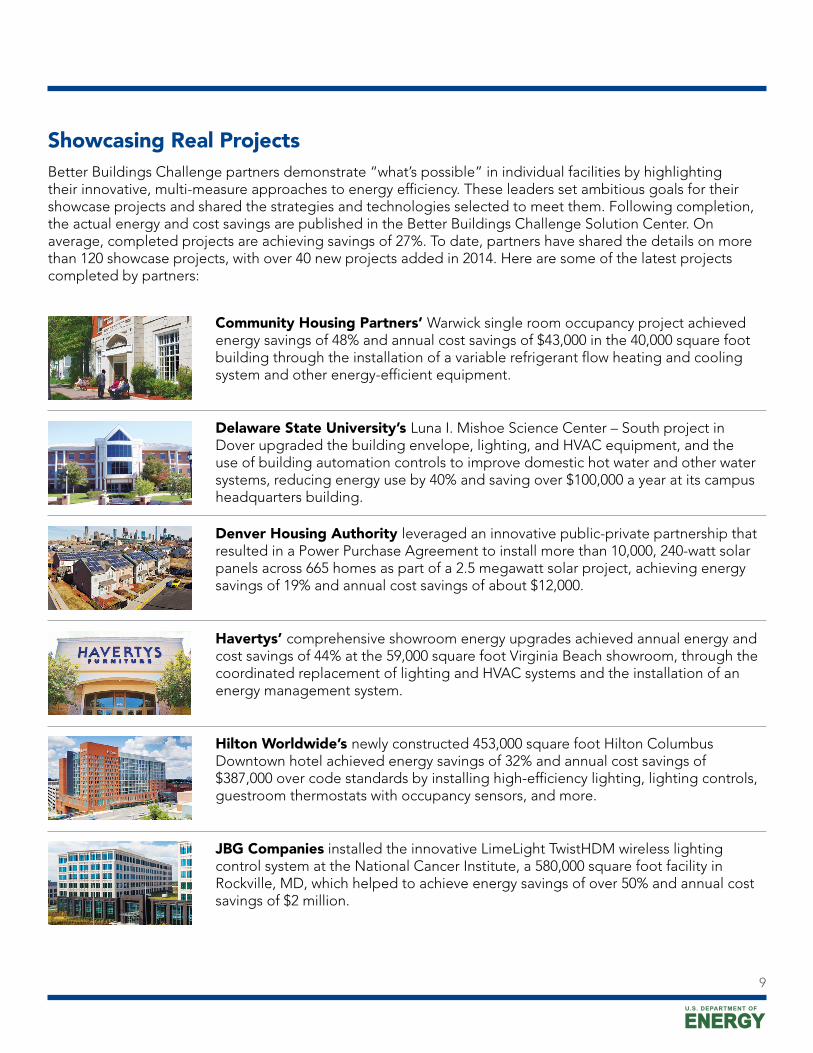
Showcasing Real ProjectsBetter Buildings Challenge partners demonstrate “what’s possible” in individual facilities by highlighting their innovative, multi-measure approaches to energy efficiency. These leaders set ambitious goals for their showcase projects and shared the strategies and technologies selected to meet them. Following completion, the actual energy and cost savings are published in the Better Buildings Challenge Solution Center. On average, completed projects are achieving savings of 27%. To date, partners have shared the details on more than 120 showcase projects, with over 40 new projects added in 2014. Here are some of the latest projects completed by partners:
Community Housing Partners’ Warwick single room occupancy project achieved energy savings of 48% and annual cost savings of $43,000 in the 40,000 square foot building through the installation of a variable refrigerant flow heating and cooling system and other energy-efficient equipment.
Delaware State University’s Luna I. Mishoe Science Center – South project in Dover upgraded the building envelope, lighting, and HVAC equipment, and the use of building automation controls to improve domestic hot water and other water systems, reducing energy use by 40% and saving over $100,000 a year at its campus headquarters building.
Denver Housing Authority leveraged an innovative public-private partnership that resulted in a Power Purchase Agreement to install more than 10,000, 240-watt solar panels across 665 homes as part of a 2.5 megawatt solar project, achieving energy savings of 19% and annual cost savings of about $12,000.
Havertys’ comprehensive showroom energy upgrades achieved annual energy and cost savings of 44% at the 59,000 square foot Virginia Beach showroom, through the coordinated replacement of lighting and HVAC systems and the installation of an energy management system.
Hilton Worldwide’s newly constructed 453,000 square foot Hilton Columbus Downtown hotel achieved energy savings of 32% and annual cost savings of $387,000 over code standards by installing high-efficiency lighting, lighting controls, guestroom thermostats with occupancy sensors, and more.
9
JBG Companies installed the innovative LimeLight TwistHDM wireless lighting control system at the National Cancer Institute, a 580,000 square foot facility in Rockville, MD, which helped to achieve energy savings of over 50% and annual cost savings of $2 million.

Commonwealth of Massachusetts combined funding from ARRA SEP grants, state-issued clean energy bonds, utility incentives, and deferred maintenance funds to conduct a comprehensive renovation of the Wrentham Developmental Center and Hogan Regional Center resulting in a 41% energy savings and $2.57 million in annual cost savings.
Nissan North America used a combination of new technologies, extensive sub-metering, and established best practices to achieve a 40% reduction in energy use and annual cost savings of 37% at its new 250,000 square foot paint plant in Smyrna, TN.
Poudre School District’s infrastructure replacement project in Fort Collins, CO has seen energy savings of 26%, with annual cost savings of $10,000, through energy efficiency improvements built into renovation plans for the 277,000 square foot facility.
Preservation of Affordable Housing leveraged the HUD Green Retrofit Program at the 80,000 square foot Colony Plaza Apartments in Excelsior Springs, MO, resulting in 21% energy savings and about $21,000 in annual cost savings by installing a new efficient boiler plant, chiller, and ventilation unit, along with lighting retrofits and motion sensors.
Rochester, NY’s 338,500 square foot Sister Cities Municipal Parking Garage has seen 36% energy savings and $33,000 in annual cost savings, through high-performance lighting technology coupled with occupancy sensors and timers.
University of California, Irvine’s Natural Sciences II building safely reduced energy required for ventilation at the 146,000 square foot building in Irvine, CA, achieving an energy use reduction of 51% and annual cost reduction of $180,000.
Walmart achieved 37% energy savings against code at its new 185,000 square foot store in South Euclid, OH, resulting in over $160,000 in annual energy cost reductions.
Learn more at energy.gov/betterbuildings/solutioncenter
WinnCompanies’ Castle Square Apartment’s project in Boston, MA has achieved 36% energy savings and $213,000 annual cost savings across the 568,000 square foot building by installing a new super-insulated shell and an insulated reflective roof, high-efficiency windows, and extensive air sealing.
10
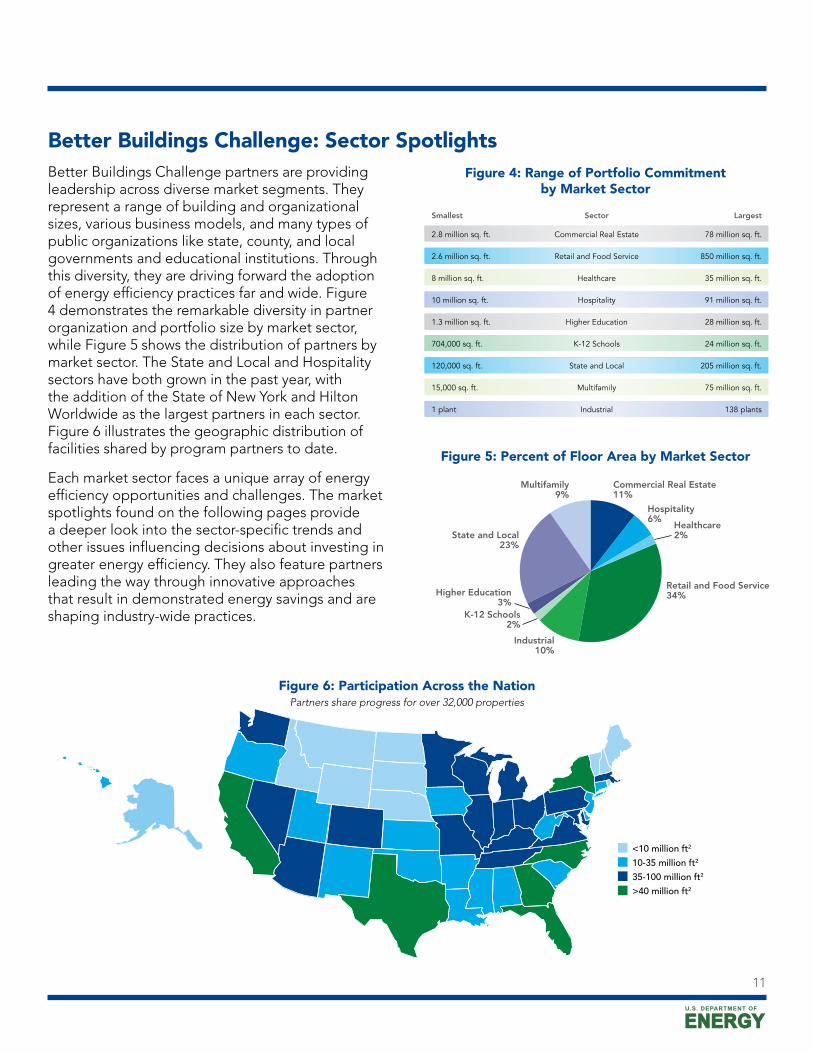
Better Buildings Challenge: Sector SpotlightsBetter Buildings Challenge partners are providing leadership across diverse market segments. They represent a range of building and organizational sizes, various business models, and many types of public organizations like state, county, and local governments and educational institutions. Through this diversity, they are driving forward the adoption of energy efficiency practices far and wide. Figure 4 demonstrates the remarkable diversity in partner organization and portfolio size by market sector, while Figure 5 shows the distribution of partners by market sector. The State and Local and Hospitality sectors have both grown in the past year, with the addition of the State of New York and Hilton Worldwide as the largest partners in each sector. Figure 6 illustrates the geographic distribution of facilities shared by program partners to date.
Each market sector faces a unique array of energy efficiency opportunities and challenges. The market spotlights found on the following pages provide a deeper look into the sector-specific trends and other issues influencing decisions about investing in greater energy efficiency. They also feature partners leading the way through innovative approaches that result in demonstrated energy savings and are shaping industry-wide practices.
Figure 4: Range of Portfolio Commitment by Market Sector
Smallest Sector Largest
2.8 million sq. ft. Commercial Real Estate 78 million sq. ft.
2.6 million sq. ft. Retail and Food Service 850 million sq. ft.
8 million sq. ft. Healthcare 35 million sq. ft.
10 million sq. ft. Hospitality 91 million sq. ft.
1.3 million sq. ft. Higher Education 28 million sq. ft.
704,000 sq. ft. K-12 Schools 24 million sq. ft.
120,000 sq. ft. State and Local 205 million sq. ft.
15,000 sq. ft. Multifamily 75 million sq. ft.
1 plant Industrial 138 plants
Figure 5: Percent of Floor Area by Market Sector
State and Local23%
Retail and Food Service34%
Hospitality6%
Healthcare2%
Industrial10%
Multifamily9%
Commercial Real Estate11%
K-12 Schools2%
Higher Education3%
11
Figure 6: Participation Across the NationPartners share progress for over 32,000 properties
<10 million ft2
10-35 million ft2
35-100 million ft2
>40 million ft2
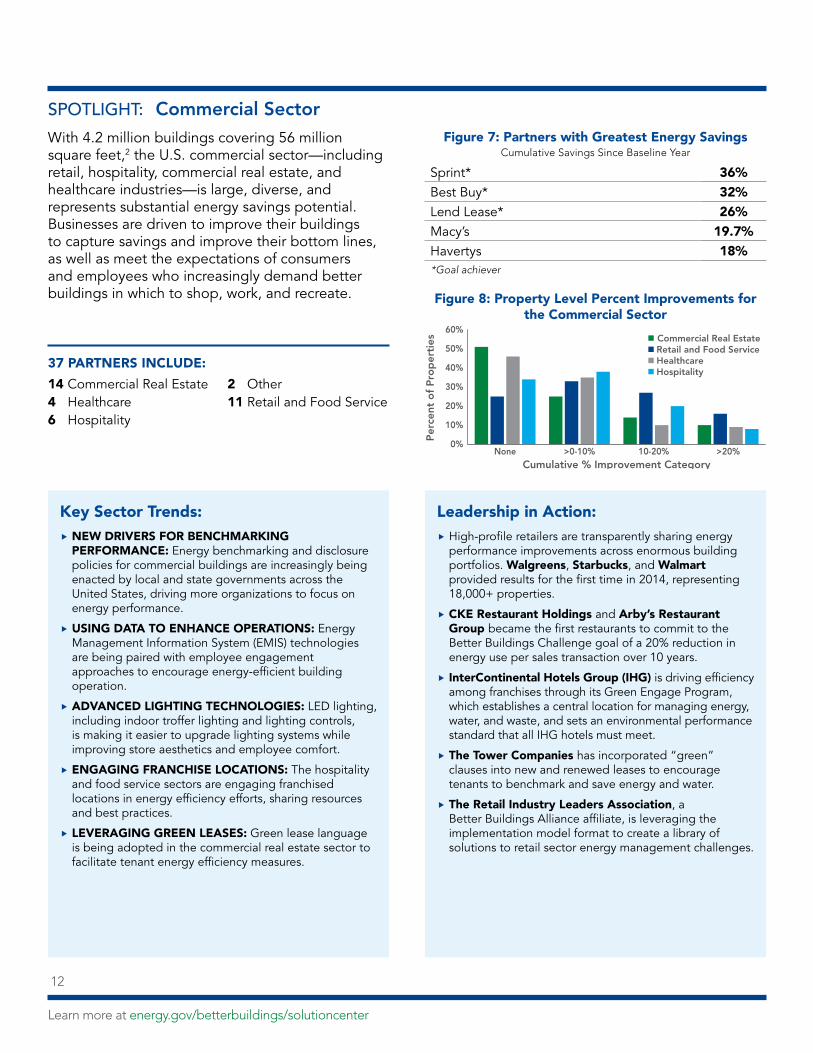
SPOTLIGHT: Commercial SectorWith 4.2 million buildings covering 56 million square feet,2 the U.S. commercial sector—including retail, hospitality, commercial real estate, and healthcare industries—is large, diverse, and represents substantial energy savings potential. Businesses are driven to improve their buildings to capture savings and improve their bottom lines, as well as meet the expectations of consumers and employees who increasingly demand better buildings in which to shop, work, and recreate.
37 PARTNERS INCLUDE:
14 Commercial Real Estate4 Healthcare6 Hospitality
2 Other11 Retail and Food Service
Figure 7: Partners with Greatest Energy SavingsCumulative Savings Since Baseline Year
Sprint* 36%Best Buy* 32%Lend Lease* 26%Macy’s 19.7%Havertys 18%*Goal achiever
Figure 8: Property Level Percent Improvements forthe Commercial Sector
0%
10%
20%
30%
40%
50%
60%
>20%10-20%>0-10%None
Per
cent
of
Pro
per
ties
Cumulative % Improvement Category
n Commercial Real Estaten Retail and Food Servicen Healthcaren Hospitality
Learn more at energy.gov/betterbuildings/solutioncenter
Key Sector Trends:��
�
�
�
�
NEW DRIVERS FOR BENCHMARKING PERFORMANCE: Energy benchmarking and disclosure policies for commercial buildings are increasingly being enacted by local and state governments across the United States, driving more organizations to focus on energy performance.
�USING DATA TO ENHANCE OPERATIONS: Energy Management Information System (EMIS) technologies are being paired with employee engagement approaches to encourage energy-efficient building operation.
�ADVANCED LIGHTING TECHNOLOGIES: LED lighting, including indoor troffer lighting and lighting controls, is making it easier to upgrade lighting systems while improving store aesthetics and employee comfort.
�ENGAGING FRANCHISE LOCATIONS: The hospitality and food service sectors are engaging franchised locations in energy efficiency efforts, sharing resources and best practices.
�LEVERAGING GREEN LEASES: Green lease language is being adopted in the commercial real estate sector to facilitate tenant energy efficiency measures.
Leadership in Action:��
�
�
�
�
High-profile retailers are transparently sharing energy performance improvements across enormous building portfolios. Walgreens, Starbucks, and Walmart provided results for the first time in 2014, representing 18,000+ properties.
�CKE Restaurant Holdings and Arby’s Restaurant Group became the first restaurants to commit to the Better Buildings Challenge goal of a 20% reduction in energy use per sales transaction over 10 years.
�InterContinental Hotels Group (IHG) is driving efficiency among franchises through its Green Engage Program, which establishes a central location for managing energy, water, and waste, and sets an environmental performance standard that all IHG hotels must meet.
�The Tower Companies has incorporated “green” clauses into new and renewed leases to encourage tenants to benchmark and save energy and water.
�The Retail Industry Leaders Association, a Better Buildings Alliance affiliate, is leveraging the implementation model format to create a library of solutions to retail sector energy management challenges.
12
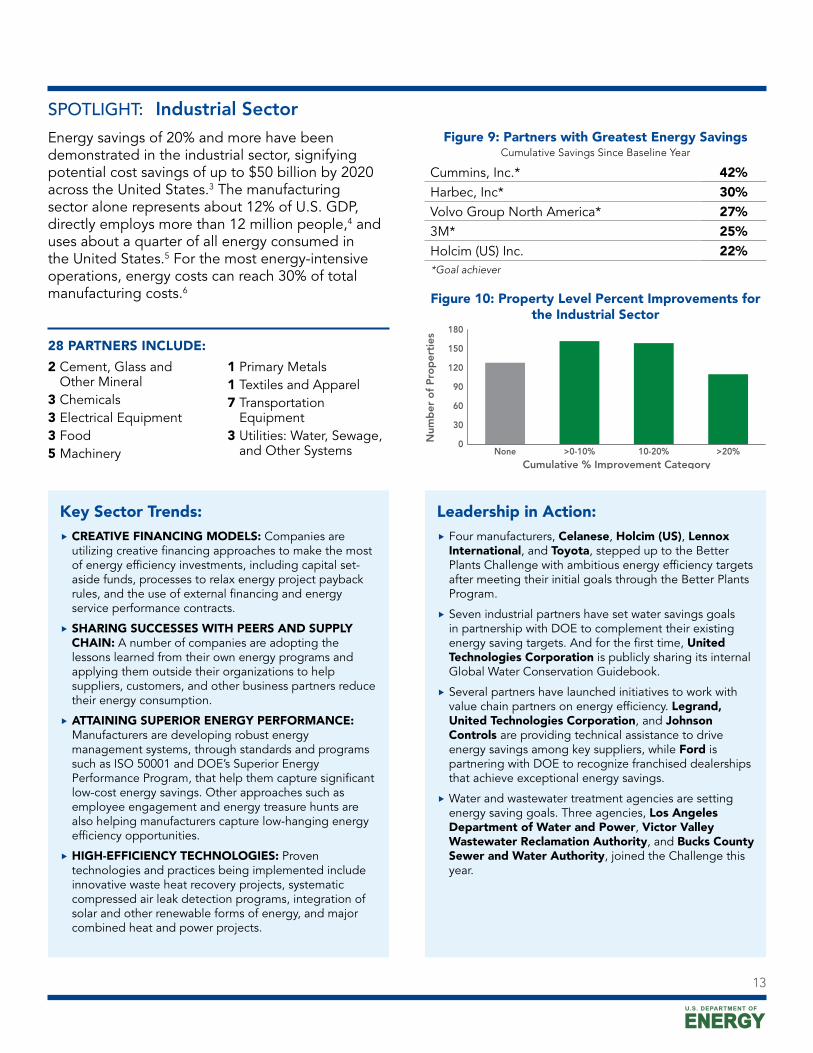
SPOTLIGHT: Industrial SectorEnergy savings of 20% and more have been demonstrated in the industrial sector, signifying potential cost savings of up to $50 billion by 2020 across the United States.3 The manufacturing sector alone represents about 12% of U.S. GDP, directly employs more than 12 million people,4 and uses about a quarter of all energy consumed in the United States.5 For the most energy-intensive operations, energy costs can reach 30% of total manufacturing costs.6
�
�
�
�
�
I
�
i
�
�
28 PARTNERS INCLUDE:
2 Cement, Glass and Other Mineral
3 Chemicals3 Electrical Equipment3 Food5 Machinery
Figure 9: Partners with Greatest Energy SavingsCumulative Savings Since Baseline Year
Cummins, Inc.* 42%Harbec, Inc* 30%Volvo Group North America* 27%3M* 25%Holcim (US) Inc. 22%*Goal achiever
1 Primary Metals1 Textiles and Apparel7 Transportation
Equipment3 Utilities: Water, Sewage,
and Other Systems
Figure 10: Property Level Percent Improvements for the Industrial Sector
0
30
60
90
120
150
180
>20%10-20%>0-10%None
Num
ber
of
Pro
per
ties
Cumulative % Improvement Category
13
Key Sector Trends:�CREATIVE FINANCING MODELS: Companies are utilizing creative financing approaches to make the most of energy efficiency investments, including capital set-aside funds, processes to relax energy project payback rules, and the use of external financing and energy service performance contracts.
�SHARING SUCCESSES WITH PEERS AND SUPPLY CHAIN: A number of companies are adopting the lessons learned from their own energy programs and applying them outside their organizations to help suppliers, customers, and other business partners reduce their energy consumption.
�ATTAINING SUPERIOR ENERGY PERFORMANCE: Manufacturers are developing robust energy management systems, through standards and programs such as ISO 50001 and DOE’s Superior Energy Performance Program, that help them capture significant low-cost energy savings. Other approaches such as employee engagement and energy treasure hunts are also helping manufacturers capture low-hanging energy efficiency opportunities.
�HIGH-EFFICIENCY TECHNOLOGIES: Proven technologies and practices being implemented include innovative waste heat recovery projects, systematic compressed air leak detection programs, integration of solar and other renewable forms of energy, and major combined heat and power projects.
Leadership in Action:�Four manufacturers, Celanese, Holcim (US), Lennox
nternational, and Toyota, stepped up to the Better Plants Challenge with ambitious energy efficiency targets after meeting their initial goals through the Better Plants Program.
�Seven industrial partners have set water savings goals n partnership with DOE to complement their existing energy saving targets. And for the first time, United Technologies Corporation is publicly sharing its internal Global Water Conservation Guidebook.
�Several partners have launched initiatives to work with value chain partners on energy efficiency. Legrand, United Technologies Corporation, and Johnson Controls are providing technical assistance to drive energy savings among key suppliers, while Ford is partnering with DOE to recognize franchised dealerships that achieve exceptional energy savings.
�Water and wastewater treatment agencies are setting energy saving goals. Three agencies, Los Angeles Department of Water and Power, Victor Valley Wastewater Reclamation Authority, and Bucks County Sewer and Water Authority, joined the Challenge this year.
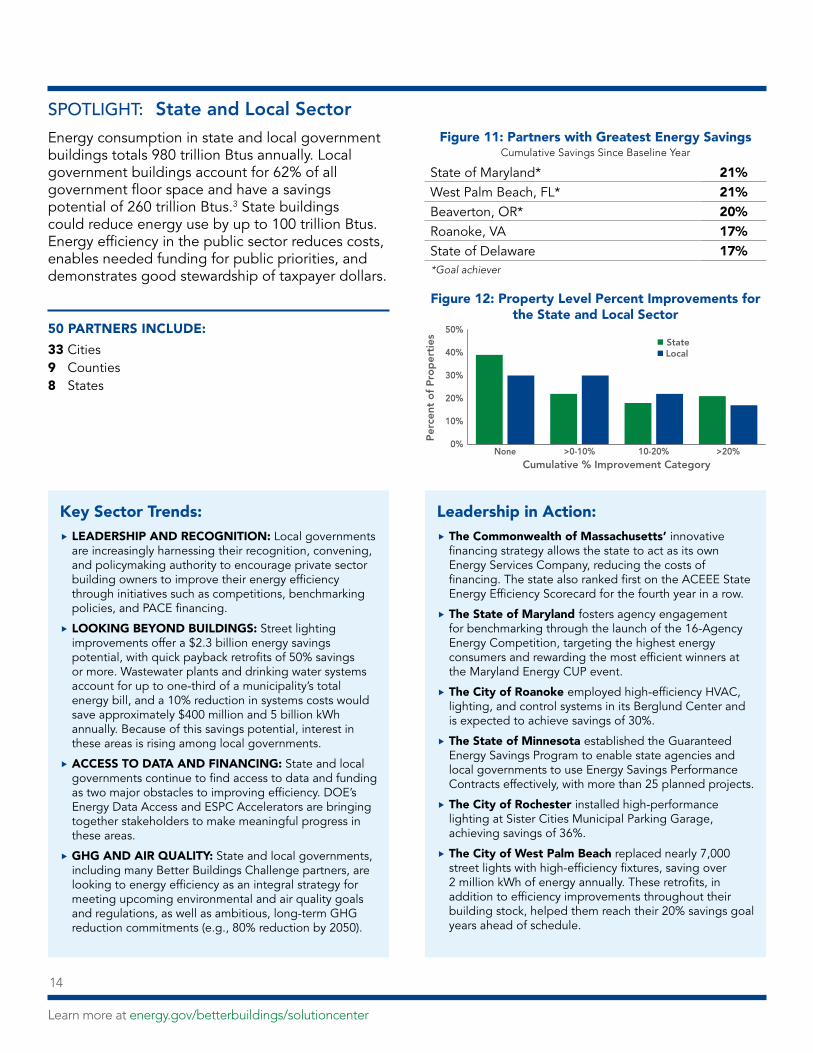
SPOTLIGHT: State and Local SectorEnergy consumption in state and local government buildings totals 980 trillion Btus annually. Local government buildings account for 62% of all government floor space and have a savings potential of 260 trillion Btus.3 State buildings could reduce energy use by up to 100 trillion Btus. Energy efficiency in the public sector reduces costs, enables needed funding for public priorities, and demonstrates good stewardship of taxpayer dollars.
50 PARTNERS INCLUDE:
33 Cities9 Counties8 States
Figure 11: Partners with Greatest Energy SavingsCumulative Savings Since Baseline Year
State of Maryland* 21%West Palm Beach, FL* 21%Beaverton, OR* 20%Roanoke, VA 17%State of Delaware 17%*Goal achiever
Figure 12: Property Level Percent Improvements for the State and Local Sector
0%
10%
20%
30%
40%
50%
>20%10-20%>0-10%None
Per
cent
of
Pro
per
ties
Cumulative % Improvement Category
n Staten Local
Learn more at energy.gov/betterbuildings/solutioncenter
Key Sector Trends:��
�
�
�
LEADERSHIP AND RECOGNITION: Local governments are increasingly harnessing their recognition, convening, and policymaking authority to encourage private sector building owners to improve their energy efficiency through initiatives such as competitions, benchmarking policies, and PACE financing.
�LOOKING BEYOND BUILDINGS: Street lighting improvements offer a $2.3 billion energy savings potential, with quick payback retrofits of 50% savings or more. Wastewater plants and drinking water systems account for up to one-third of a municipality’s total energy bill, and a 10% reduction in systems costs would save approximately $400 million and 5 billion kWh annually. Because of this savings potential, interest in these areas is rising among local governments.
�ACCESS TO DATA AND FINANCING: State and local governments continue to find access to data and funding as two major obstacles to improving efficiency. DOE’s Energy Data Access and ESPC Accelerators are bringing together stakeholders to make meaningful progress in these areas.
�GHG AND AIR QUALITY: State and local governments, including many Better Buildings Challenge partners, are looking to energy efficiency as an integral strategy for meeting upcoming environmental and air quality goals and regulations, as well as ambitious, long-term GHG reduction commitments (e.g., 80% reduction by 2050).
Leadership in Action:��
�
�
�
�
�
The Commonwealth of Massachusetts’ innovative financing strategy allows the state to act as its own Energy Services Company, reducing the costs of financing. The state also ranked first on the ACEEE State Energy Efficiency Scorecard for the fourth year in a row.
�The State of Maryland fosters agency engagement for benchmarking through the launch of the 16-Agency Energy Competition, targeting the highest energy consumers and rewarding the most efficient winners at the Maryland Energy CUP event.
�The City of Roanoke employed high-efficiency HVAC, lighting, and control systems in its Berglund Center and is expected to achieve savings of 30%.
�The State of Minnesota established the Guaranteed Energy Savings Program to enable state agencies and local governments to use Energy Savings Performance Contracts effectively, with more than 25 planned projects.
�The City of Rochester installed high-performance lighting at Sister Cities Municipal Parking Garage, achieving savings of 36%.
�The City of West Palm Beach replaced nearly 7,000 street lights with high-efficiency fixtures, saving over 2 million kWh of energy annually. These retrofits, in addition to efficiency improvements throughout their building stock, helped them reach their 20% savings goal years ahead of schedule.
14
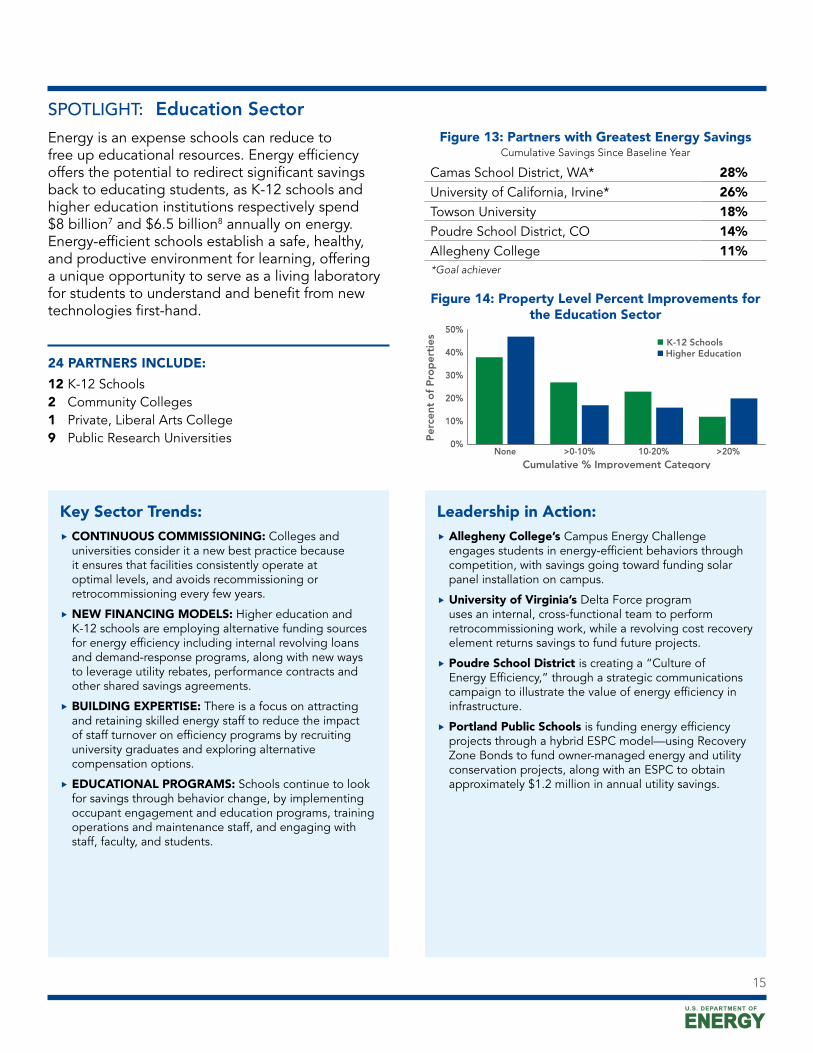
SPOTLIGHT: Education SectorEnergy is an expense schools can reduce to free up educational resources. Energy efficiency offers the potential to redirect significant savings back to educating students, as K-12 schools and higher education institutions respectively spend $8 billion7 and $6.5 billion8 annually on energy. Energy-efficient schools establish a safe, healthy, and productive environment for learning, offering a unique opportunity to serve as a living laboratory for students to understand and benefit from new technologies first-hand.
24 PARTNERS INCLUDE:
12 K-12 Schools2 Community Colleges 1 Private, Liberal Arts College9 Public Research Universities
Figure 13: Partners with Greatest Energy SavingsCumulative Savings Since Baseline Year
Camas School District, WA* 28%University of California, Irvine* 26%Towson University 18%Poudre School District, CO 14%Allegheny College 11%*Goal achiever
Figure 14: Property Level Percent Improvements for the Education Sector
0%
10%
20%
30%
40%
50%
>20%10-20%>0-10%None
Per
cent
of
Pro
per
ties
Cumulative % Improvement Category
n K-12 Schoolsn Higher Education
15
Key Sector Trends:��
�
�
�
CONTINUOUS COMMISSIONING: Colleges and universities consider it a new best practice because it ensures that facilities consistently operate at optimal levels, and avoids recommissioning or retrocommissioning every few years.
�NEW FINANCING MODELS: Higher education and K-12 schools are employing alternative funding sources for energy efficiency including internal revolving loans and demand-response programs, along with new ways to leverage utility rebates, performance contracts and other shared savings agreements.
�BUILDING EXPERTISE: There is a focus on attracting and retaining skilled energy staff to reduce the impact of staff turnover on efficiency programs by recruiting university graduates and exploring alternative compensation options.
�EDUCATIONAL PROGRAMS: Schools continue to look for savings through behavior change, by implementing occupant engagement and education programs, training operations and maintenance staff, and engaging with staff, faculty, and students.
Leadership in Action:��
�
�
�
Allegheny College’s Campus Energy Challenge engages students in energy-efficient behaviors through competition, with savings going toward funding solar panel installation on campus.
�University of Virginia’s Delta Force program uses an internal, cross-functional team to perform retrocommissioning work, while a revolving cost recovery element returns savings to fund future projects.
�Poudre School District is creating a “Culture of Energy Efficiency,” through a strategic communications campaign to illustrate the value of energy efficiency in infrastructure.
�Portland Public Schools is funding energy efficiency projects through a hybrid ESPC model—using Recovery Zone Bonds to fund owner-managed energy and utility conservation projects, along with an ESPC to obtain approximately $1.2 million in annual utility savings.
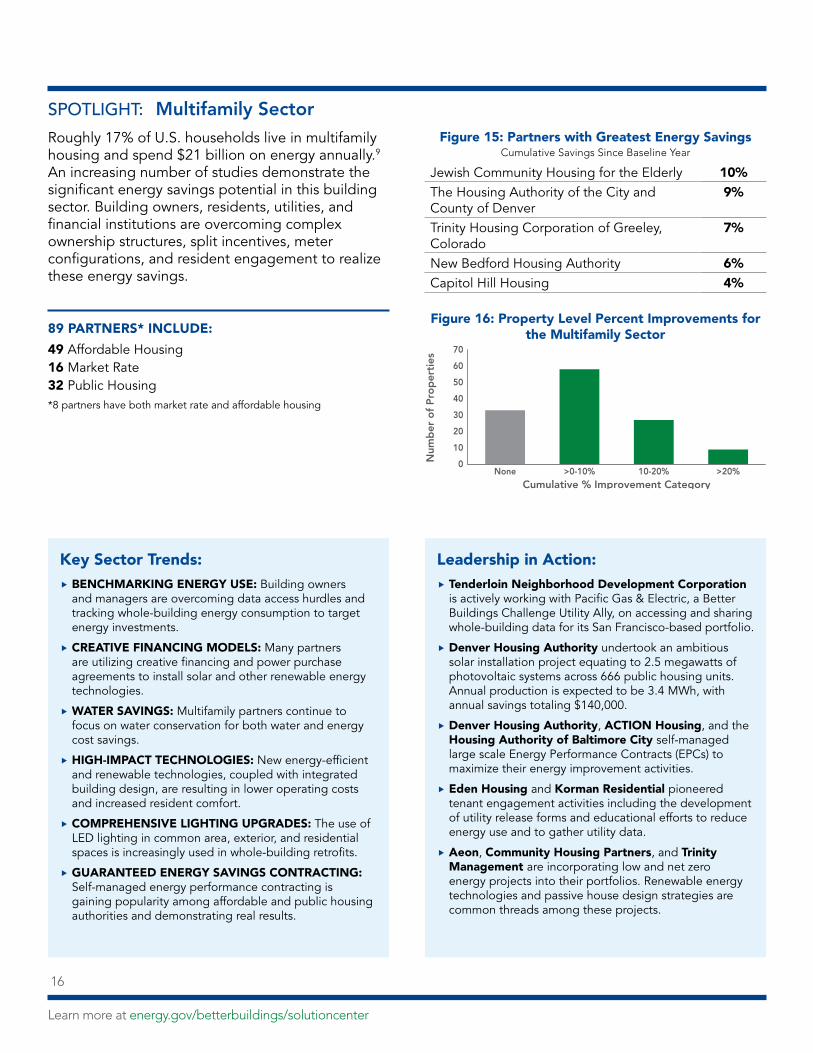
SPOTLIGHT: Multifamily SectorRoughly 17% of U.S. households live in multifamily housing and spend $21 billion on energy annually.9 An increasing number of studies demonstrate the significant energy savings potential in this building sector. Building owners, residents, utilities, and financial institutions are overcoming complex ownership structures, split incentives, meter configurations, and resident engagement to realize these energy savings.
89 PARTNERS* INCLUDE:
49 Affordable Housing16 Market Rate32 Public Housing*8 partners have both market rate and affordable housing
Figure 15: Partners with Greatest Energy SavingsCumulative Savings Since Baseline Year
Jewish Community Housing for the Elderly 10%The Housing Authority of the City and County of Denver
9%
Trinity Housing Corporation of Greeley, Colorado
7%
New Bedford Housing Authority 6%Capitol Hill Housing 4%
Figure 16: Property Level Percent Improvements for the Multifamily Sector
0
10
20
30
40
50
60
70
>20%10-20%>0-10%None
Num
ber
of
Pro
per
ties
Cumulative % Improvement Category
Learn more at energy.gov/betterbuildings/solutioncenter
Key Sector Trends:��
�
�
�
�
�
BENCHMARKING ENERGY USE: Building owners and managers are overcoming data access hurdles and tracking whole-building energy consumption to target energy investments.
�CREATIVE FINANCING MODELS: Many partners are utilizing creative financing and power purchase agreements to install solar and other renewable energy technologies.
�WATER SAVINGS: Multifamily partners continue to focus on water conservation for both water and energy cost savings.
�HIGH-IMPACT TECHNOLOGIES: New energy-efficient and renewable technologies, coupled with integrated building design, are resulting in lower operating costs and increased resident comfort.
�COMPREHENSIVE LIGHTING UPGRADES: The use of LED lighting in common area, exterior, and residential spaces is increasingly used in whole-building retrofits.
�GUARANTEED ENERGY SAVINGS CONTRACTING: Self-managed energy performance contracting is gaining popularity among affordable and public housing authorities and demonstrating real results.
Leadership in Action:��
�
�
�
�
Tenderloin Neighborhood Development Corporation is actively working with Pacific Gas & Electric, a Better Buildings Challenge Utility Ally, on accessing and sharing whole-building data for its San Francisco-based portfolio.
�Denver Housing Authority undertook an ambitious solar installation project equating to 2.5 megawatts of photovoltaic systems across 666 public housing units. Annual production is expected to be 3.4 MWh, with annual savings totaling $140,000.
�Denver Housing Authority, ACTION Housing, and the Housing Authority of Baltimore City self-managed large scale Energy Performance Contracts (EPCs) to maximize their energy improvement activities.
�Eden Housing and Korman Residential pioneered tenant engagement activities including the development of utility release forms and educational efforts to reduce energy use and to gather utility data.
�Aeon, Community Housing Partners, and Trinity Management are incorporating low and net zero energy projects into their portfolios. Renewable energy technologies and passive house design strategies are common threads among these projects.
16
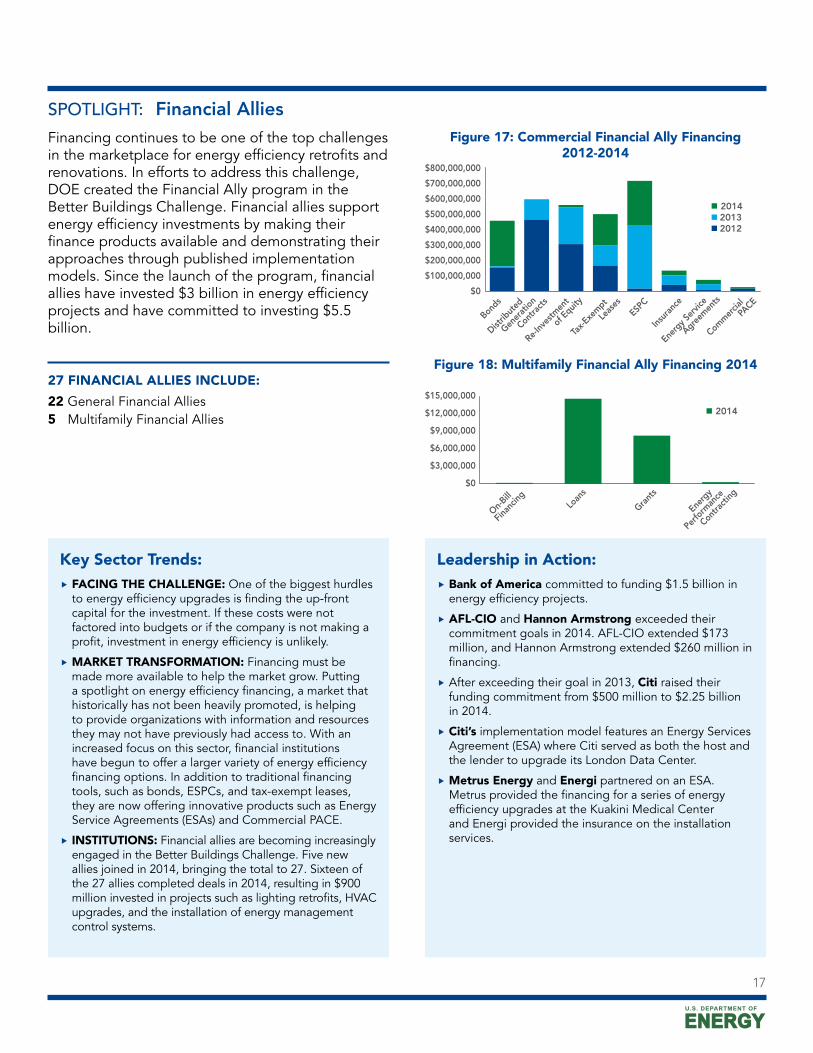
SPOTLIGHT: Financial AlliesFinancing continues to be one of the top challenges in the marketplace for energy efficiency retrofits and renovations. In efforts to address this challenge, DOE created the Financial Ally program in the Better Buildings Challenge. Financial allies support energy efficiency investments by making their finance products available and demonstrating their approaches through published implementation models. Since the launch of the program, financial allies have invested $3 billion in energy efficiency projects and have committed to investing $5.5 billion.
27 FINANCIAL ALLIES INCLUDE:
22 General Financial Allies5 Multifamily Financial Allies
Figure 17: Commercial Financial Ally Financing 2012-2014
$0
$100,000,000
$200,000,000
$300,000,000
$400,000,000
$500,000,000
$600,000,000
$700,000,000
$800,000,000
n 2014n 2013n 2012
Bonds
Commer
cial
PACE
Ener
gy Ser
vice
Agreem
ents
Insur
ance
ESPC
Tax-E
xempt
Leas
es
Re-Inv
estm
ent
of Eq
uity
Distrib
uted
Gener
ation
Contra
cts
Figure 18: Multifamily Financial Ally Financing 2014
$0
$3,000,000
$6,000,000
$9,000,000
$12,000,000
$15,000,000
n 2014
On-Bill
Finan
cing
Ener
gy
Perfo
rman
ce
Contra
cting
Grant
sLo
ans
17
Key Sector Trends:��
�
�
FACING THE CHALLENGE: One of the biggest hurdles to energy efficiency upgrades is finding the up-front capital for the investment. If these costs were not factored into budgets or if the company is not making a profit, investment in energy efficiency is unlikely.
�MARKET TRANSFORMATION: Financing must be made more available to help the market grow. Putting a spotlight on energy efficiency financing, a market that historically has not been heavily promoted, is helping to provide organizations with information and resources they may not have previously had access to. With an increased focus on this sector, financial institutions have begun to offer a larger variety of energy efficiency financing options. In addition to traditional financing tools, such as bonds, ESPCs, and tax-exempt leases, they are now offering innovative products such as Energy Service Agreements (ESAs) and Commercial PACE.
�INSTITUTIONS: Financial allies are becoming increasingly engaged in the Better Buildings Challenge. Five new allies joined in 2014, bringing the total to 27. Sixteen of the 27 allies completed deals in 2014, resulting in $900 million invested in projects such as lighting retrofits, HVAC upgrades, and the installation of energy management control systems.
Leadership in Action:��
�
�
�
�
Bank of America committed to funding $1.5 billion in energy efficiency projects.
�AFL-CIO and Hannon Armstrong exceeded their commitment goals in 2014. AFL-CIO extended $173 million, and Hannon Armstrong extended $260 million in financing.
�After exceeding their goal in 2013, Citi raised their funding commitment from $500 million to $2.25 billion in 2014.
�Citi’s implementation model features an Energy Services Agreement (ESA) where Citi served as both the host and the lender to upgrade its London Data Center.
�Metrus Energy and Energi partnered on an ESA. Metrus provided the financing for a series of energy efficiency upgrades at the Kuakini Medical Center and Energi provided the insurance on the installation services.
Expanding to Additional Strategic AreasThrough the Better Buildings Challenge, DOE continues to engage existing and potential partners to accelerate U.S. energy savings and resource efficiency. In 2014, special attention was given to highlighting the efficiency potential and leadership examples in the following sectors and building energy end uses:
Data Centers. In the United States, data centers consume over 100 billion kWh of electricity per year, more than 2% of all U.S. electricity use, and are rapidly growing users of energy as more information is shared and stored online. Eight data center owners/operators have taken the Better Buildings Challenge to reduce their entire portfolio’s energy use by at least 20% over 10 years. These Better Buildings Challenge partners represent over 30 data centers with over 100 megawatts of IT load. An additional 16 Better Buildings Accelerator partners have committed to reduce the energy use in one (or more) data center facilities over five years. See below in the Better Buildings Accelerator section for additional details.
Food Service. CKE Restaurants Holdings, LLC (brands include Hardee’s, Carl’s Junior, and Green Burrito) and Arbys Restaurant Group are the first food service organizations to take the Better Buildings Challenge. Restaurants use five to seven times more energy per square foot than other commercial building types, with the majority used for powering heating, cooling, ventilation, and cooking systems. There are nearly 300,000 food service facilities in the United States, spanning 1.7 billion square feet and consuming approximately 400 trillion Btus of energy per year. The food service sector is unique in that the energy use of food service establishments is correlated to the quantity of food served, and so food service partners can report their energy savings with a per-transaction metric.
Water Pilot. Last year, DOE launched and ran a water savings pilot with 23 commercial, industrial, and multifamily partners that agreed to set water reduction goals, report progress, and share their solutions with the market. The sectors represented in the Better Buildings Challenge account for a significant share of the withdrawals from public water supplies and many organizations in these sectors are facing increased market and regulatory pressures to reduce their water use. Using water more efficiently results in lower operating costs, a more reliable water supply, and improved water quality. It also takes energy to treat and transport water, so cutting water use will also save energy.
Partners in the water savings pilot reported strong water savings results, with water use intensity improvements ranging from 10% to 20% measured against their baseline years. In 2014 alone, partners reported saving about 377 million gallons, or the equivalent of about 570 Olympic-size swimming pools. Generally speaking, partners experienced greater difficulty compiling and reporting water data relative to energy data, partially due to billing and metering issues and partially due to the newness of their water tracking efforts. Partners are beginning to share solutions, including how they make the business case for water savings in light of water’s typically low cost. A few have been able to make significant progress through low- and no-cost savings opportunities, while others are beginning to take a broader view of water’s costs—including the costs associated with treating, pumping, and discharging the water—to justify larger investments.
Based on progress made working with its pilot partners, DOE is expanding its efforts in this area, and is inviting interested Better Buildings Challenge partners to make a water savings commitment, once they have completed a showcase project and a year of energy reporting. DOE will work with these partners to advance data collection and analysis practices and share more solutions to common water-saving barriers. DOE will coordinate with other federal agencies, including the U.S. Environmental Protection Agency and the Department of Housing and Urban Development, as well as work with experts from non-governmental organizations to lend additional technical expertise to its Water Saving Partners.
Learn more at energy.gov/betterbuildings/solutioncenter
18
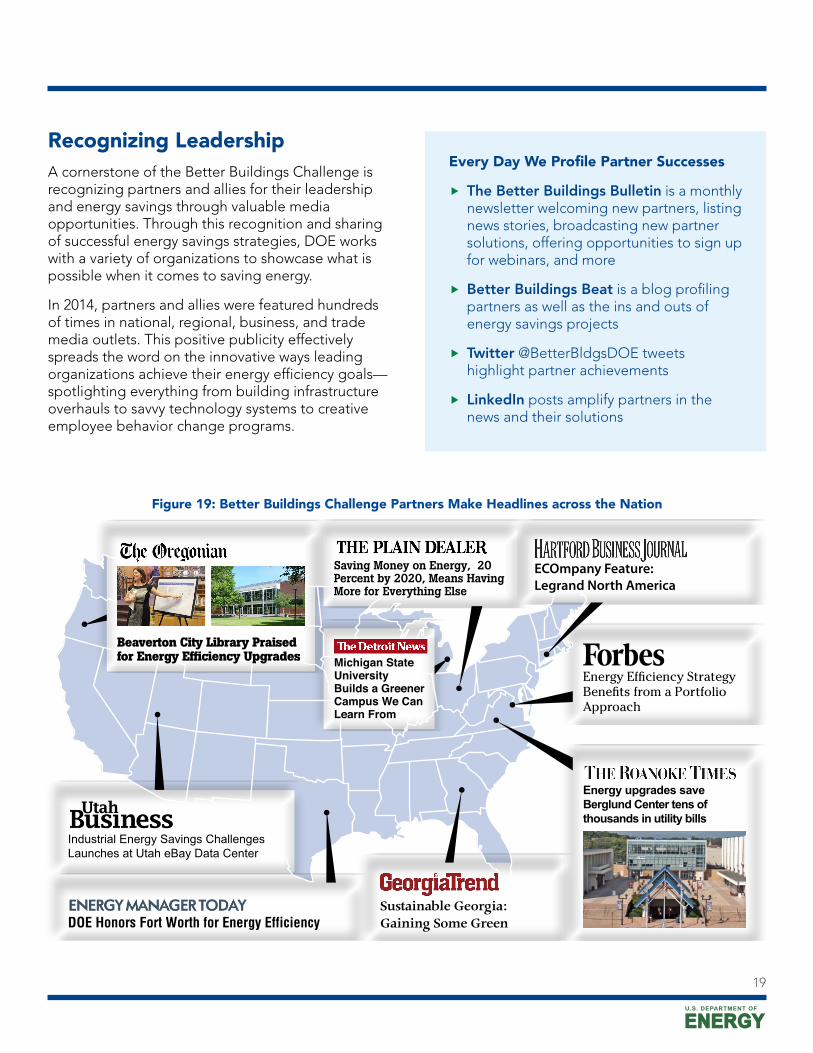
Recognizing LeadershipA cornerstone of the Better Buildings Challenge is recognizing partners and allies for their leadership and energy savings through valuable media opportunities. Through this recognition and sharing of successful energy savings strategies, DOE works with a variety of organizations to showcase what is possible when it comes to saving energy.
In 2014, partners and allies were featured hundreds of times in national, regional, business, and trade media outlets. This positive publicity effectively spreads the word on the innovative ways leading organizations achieve their energy efficiency goals—spotlighting everything from building infrastructure overhauls to savvy technology systems to creative employee behavior change programs.
Every Day We Profile Partner Successes
�
�
�
�
The Better Buildings Bulletin is a monthly newsletter welcoming new partners, listing news stories, broadcasting new partner solutions, offering opportunities to sign up for webinars, and more
Better Buildings Beat is a blog profiling partners as well as the ins and outs of energy savings projects
Twitter @BetterBldgsDOE tweets highlight partner achievements
LinkedIn posts amplify partners in the news and their solutions
19
Figure 19: Better Buildings Challenge Partners Make Headlines across the Nation
Better Buildings AcceleratorsBetter Buildings Accelerators were initiated under the President’s Climate Action Plan in 2013. There are now seven Accelerators. Each is a targeted, short-term, partner-focused activity designed to address persistent barriers that stand in the way of greater efficiency. Over the past year, there has been significant progress in each of the Accelerators.
Energy Savings Performance Contracting (ESPC) Accelerator: Launched in 2013, this Accelerator works with 21 partners who have collectively committed to investing $2 billion in ESPCs, with $767 million committed to new contracts in the first year of the program. These partners are also committed to working with DOE to demonstrate successful implementation of projects overcoming key barriers. With active participation by the Accelerator partners, DOE facilitated a year-long, stakeholder-driven process to update and revise template contractual documents in order to streamline the ESPC process and cut transaction costs. The Accelerator has also focused on improving the ability to benchmark ESPC projects across the federal, state, and local levels by collaborating on the expansion of a federal data tracking tool, eProject Builder, to the state and local sectors. In 2016, ESPC Accelerator partners will work with DOE on optimizing measurement and verification for ESPC projects.
�
�
�
�
�
�
�
�
�
�
�
�
�
�
�
�
�
�
�
�
�
City of Cincinnati, OH *
City of El Paso, TX*
City of Fort Worth, TX*
City of Houston, TX*
City of Newark, NJ
Philadelphia School District
Commonwealth of Massachusetts
Commonwealth of Virginia *
State of Alabama
State of Colorado*
State of Connecticut
State of Hawaii*
State of Illinois
State of Michigan *
State of Minnesota
State of Montana *
State of Nevada
State of New Mexico *
State of North Carolina
State of Washington *
U.S. Virgin Islands
Superior Energy Performance (SEP) Accelerator: This Accelerator is a two-prong effort that supports manufacturers, commercial business, utilities, and program administrators to develop and deploy strategic energy management systems in industrial and large energy-using commercial facilities and building complexes. Focusing on ISO 50001 and SEP, the first prong addresses engaging utilities and program administrators to include ISO/SEP in their program designs for industrial and commercial customers. A toolkit of resources is being developed and will include a generic regulatory filing guide and a cost-effectiveness screening tool. The second prong involves Better Buildings and Better Plants partners working with DOE to create a deployment strategy for SEP on an enterprise-wide level, by having multiple industrial facilities or commercial buildings as part of a common ISO 50001 energy management (enterprise) system, and also verifying energy performance for all facilities seeking SEP certification. All participating partners have implemented training with their facilities and building operators.
ENTERPRISE-WIDE PARTNERS
�
�
�
3M Company (6 plants)
Cummins (4 plants)
General Dynamics ( 5 plants)
�
�
Nissan (3 plants)
Schneider Electric (10 plants)
RATEPAYER-FUNDED PARTNERS
�
�
�
�
Bonneville Power Administration
Efficiency Vermont
Eversource
Focus on Energy
* Signed contracts for 50% of original commitment and active participation in one working group
Learn more at energy.gov/betterbuildings/solutioncenter
20
Energy Data Access Accelerator: Twenty-two utility-city pairs have engaged in this effort, working together to improve access to and consistency of whole-building data for the purposes of benchmarking building performance. Since the inception of this Accelerator, partners have worked with local stakeholders to design a local strategy for access to energy usage data in support of whole-building benchmarking, and are now actively working to develop and implement approaches for whole-building data aggregation to pilot in their communities. Based on the solutions that Accelerator partners are designing to date, it has become clear that best practice solutions for whole-building data access include the following:
�
�
�
Provide functionality that allows utilities to reliably “map” meters to buildings.
Automate the transfer of utility data to ENERGY STAR® Portfolio Manager via web services.
Use an aggregation threshold that balances the need to protect privacy with making whole-building aggregated data available to building owners with multiple tenants.
As of May 2015, partners are being recognized as leaders in whole-building data access. As early providers of whole-building data access, they have been mentoring the other Energy Data Access Accelerator partners, playing a leadership role in the marketplace, sharing their experiences, influencing the development of the best practices in this space, and upgrading their systems to more fully incorporate the best practices. Partners are also being recognized for their work on implementing aggregated whole-building data access systems. They have already started the process or have plans in place to provide aggregated whole-building data to at least 20% of commercial and/or multifamily building owners by the end of 2015.
�
�
�
�
�
�
City of Atlanta, GA & Atlanta Gas Light Company
City of Austin, TX & Austin Energy
Cities of Boston & Cambridge, MA* & Eversource*
City of Chicago, IL** & Commonwealth Edison**
City of Columbus, OH & AEP Ohio
District of Columbia** & PEPCO Holdings, Inc.**
�
�
�
�
�
�
City of Houston, TX & Reliant (an NRG Company)
City of Kansas City, MO & Kansas City Power & Light Company
City of Los Angeles, CA* & Los Angeles Department of Water and Power* & Southern California Gas Company
City of Minneapolis, MN* & Xcel Energy Inc.*
City of New York, NY** & National Grid**
City of Orlando, FL & Orlando Utility Company
�
�
�
�
�
�
City of Philadelphia, PA** & PECO Energy Company**
Cities of San Diego & Chula Vista, CA & San Diego Gas & Electric Company
City of Salt Lake City, UT & Rocky Mountain Power and Questar
City of San Francisco, CA & Pacific Gas & Electric Company
City of Santa Monica, CA & Southern California Edison
City of Seattle, WA** & Puget Sound Energy**
* Implementation recognition ** Leadership recognition
21
Data Center Accelerator: Launched in early 2015, this Accelerator is designed to demonstrate best energy management strategies and cost-effective infrastructure improvements in small, medium, and large sized data centers. Data center infrastructure represents nearly 50% of overall data center energy use savings and typical payback periods are less than five years. As a result, DOE is focusing on improving efficiency of infrastructure (cooling, power supply losses) which has a longer lifespan than IT systems housed in the facilities. The opportunity to make energy efficiency improvements is large, with savings of 20% to 40% possible by applying best management energy efficiency measures and common strategies that have attractive rates of return. If all U.S. data centers were 20% more efficient, the savings would grow to more than 20 billion kWh by 2022 and roughly $2 billion in cost savings.
Sixteen organizations have committed to reduce the energy use in one (or more) data centers within five years and will work with DOE to implement metering to capture infrastructure and IT energy usage, demonstrate successful strategies, and showcase the work done across a variety of data centers (with different ownership/management structures). This work will complement the work being done by an additional eight organizations that are including data center upgrades as part of their portfolio in the Better Buildings Challenge.
�
�
�
�
�
�
Argonne National Laboratory
U.S. Department of Defense - Defense Information Systems Agency
Environmental Molecular Sciences Laboratory
U.S. Environmental Protection Agency
The Home Depot
Indiana University
�
�
�
�
�
U.S. Department of Justice – Drug Enforcement Agency
Lawrence Berkeley National Laboratory
Lawrence Livermore National Laboratory
Los Alamos National Laboratory
U.S. National Aeronautics and Space Administration
�
�
�
�
�
National Energy Research Scientific Computing Center
National Renewable Energy Laboratory
U.S. Social Security Administration
Stanford University
U.S. Department of Veterans Affairs
Outdoor Lighting Accelerator: Through this Accelerator, launched in 2014, partners demonstrate the adoption of system-wide high-performance outdoor lighting at the municipal level. DOE is working with state and local governments and regional networks to exchange more than 1.5 million lighting fixtures in two years as part of the President’s Outdoor Lighting Challenge, and helping cities overcome financial, regulatory, and technical barriers to accelerate these exchanges. Eleven cities, three regional networks (working with many cities) and two states are currently partnering with DOE to perform these upgrades. The City of Detroit has already installed a total of 36,000 poles, over half of their commitment of 65,000.
�
�
�
�
�
�
Dearborn, MI
Detroit, MI
Flint, MI
Huntington Beach, CA
Little Rock, AR
Los Angeles, CA
�
�
�
�
�
Mid-America Regional Council representing Kansas City, MO metro area
Portland, ME
Racine, WI
State of Rhode Island
San Diego, CA
�
�
�
�
�
Southeast Michigan Regional Energy Office
Southern California Regional Energy Network
St. Petersburg, FL
State of Tennessee
West Palm Beach, FL
Learn more at energy.gov/betterbuildings/solutioncenter
22
Home Upgrade Program Accelerator: This Accelerator was launched in May to help home energy upgrade programs bring services to more homes across the country by leveraging data management strategies that minimize costs while improving overall program effectiveness. These programs are currently completing hundreds of thousands of home upgrades annually with average savings of 20% for participating households. By improving the processes programs use to manage and track home upgrades, review the quality of work, and evaluate savings and other impacts, programs can scale up to reach goals of completing millions of home energy upgrades annually. Partners in the Accelerator are administrators of energy efficiency programs that will demonstrate a range of best practices to minimize program costs while improving and expanding program savings, including through the use of information technology and adoption of common data standards to streamline data exchange, among other approaches. Key collaborators may include developers of program management and home energy assessment software that implements common data standards to streamline data exchange.
Home Energy Information Accelerator: Buying a home is among the most significant investment decisions Americans make. Home buyers are understandably interested in getting reliable information about the homes they are considering so that they can make informed purchase decisions. Until recently, it has been difficult and costly to get credible information about how much energy a home is likely to use. This Accelerator aims to make home energy information, such as a home’s efficiency certification or its estimated energy usage, much more readily available so that in the not too distant future, finding out how much a home’s energy bills are likely to run will be as easy as looking up a home’s age, size, or school district. As a collaborative effort among national organizations, federal agencies, and regional, state, and local leaders in real estate and energy efficiency, the Home Energy Information Accelerator is designed to expand the availability and use of reliable home energy information at relevant points in residential real estate transactions. Accelerator partners will develop and demonstrate replicable, sustainable approaches that make energy-related information—important data for the home buying process—easily available to home buyers and sellers through multiple listing service and other reports.
23
Better Buildings Workforce Guidelines Improving the operational performance of the nation’s offices, schools, hospitals, and other commercial buildings offers significant energy savings. It also requires highly skilled and qualified workers, particularly as building technologies become more advanced. Through the Better Buildings Workforce Guidelines, industry now has national guidelines from which to develop high-quality and nationally recognized training and certification programs, helping to address challenges found in the energy efficiency workforce with quality, consistency, and scalability across certification and certificate programs.
DOE responded to these challenges by working with the National Institute of Building Sciences and industry stakeholders to develop the Better Buildings Workforce Guidelines, voluntary national guidelines to improve the quality and consistency of commercial building workforce credentials for four key energy-related jobs:
�
�
�
�
Building Energy Auditor
Building Commissioning Professional
Building Operations Professional
Energy Manager
In addition, industry stakeholders were engaged for feedback on the Federal Facilities Manager job description, with a focus on implementing the Federal Buildings Personnel Training Act.
DOE will recognize certification programs that are aligned with the Better Buildings Workforce Guidelines and have received qualified accreditation by the American Standards National Institute, International Accreditation Service, or other qualified accreditation bodies that are in compliance with ISO/IEC 17024:2012. DOE will provide public recognition, including highlighting the certification program on the Better Buildings Workforce Guidelines website, and will provide a Better Buildings Recognized Program mark to qualified certification bodies. In addition, DOE is exploring
options for individuals who hold a certification from a Better Buildings Recognized Program to receive a preferential review for federal workforce opportunities.
The U.S. General Services Administration (GSA) is committed to improving the qualifications of individuals who operate and maintain federal buildings. GSA supports the development of credentials accredited to the standards established by DOE and the National Institute of Building Sciences Better Buildings Workforce Guidelines effort. GSA recognizes these standards as contributing to compliance by federal and contractor personnel with the requirements of the Federal Buildings Personnel Training Act of 2010 (FBPTA) in the roles of energy management, building operations, and commissioning. As credentials are established and accredited to these standards they will be added to annual updates to FBPTA Core Competencies and Curriculum posted at the Facilities Management Institute and may ultimately replace the FBPTA-Aligned qualifications for those roles.
Learn more at energy.gov/betterbuildings/solutioncenter
24
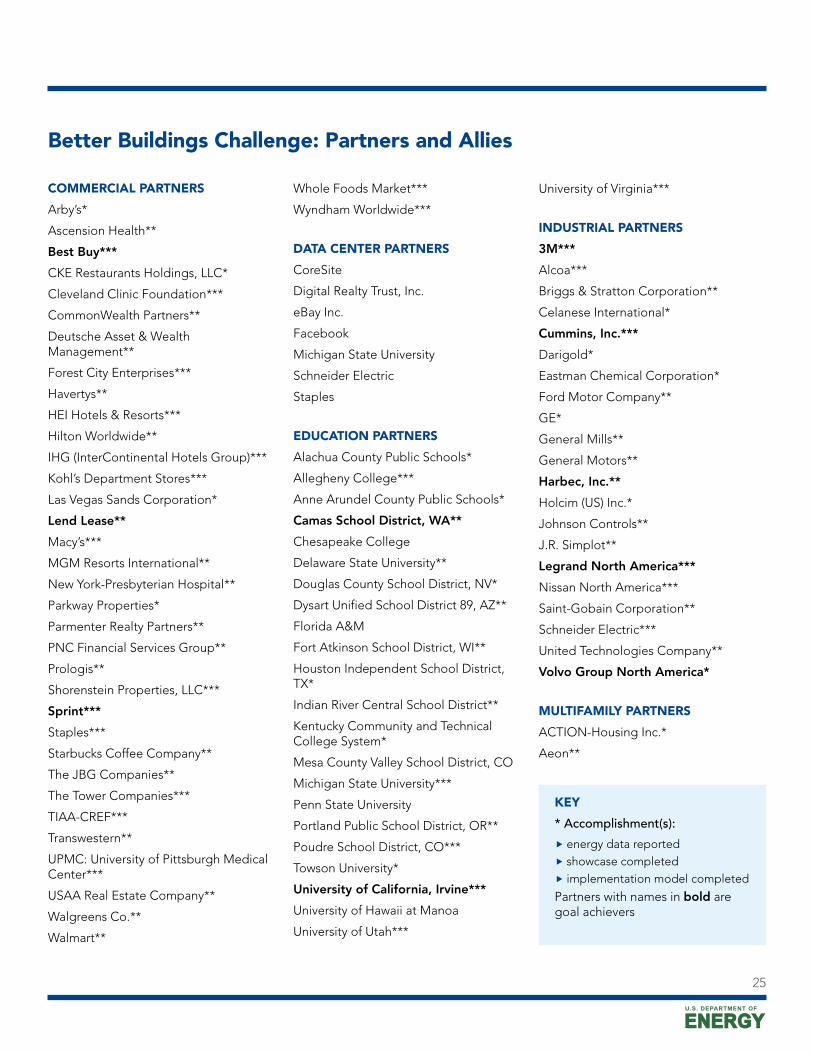
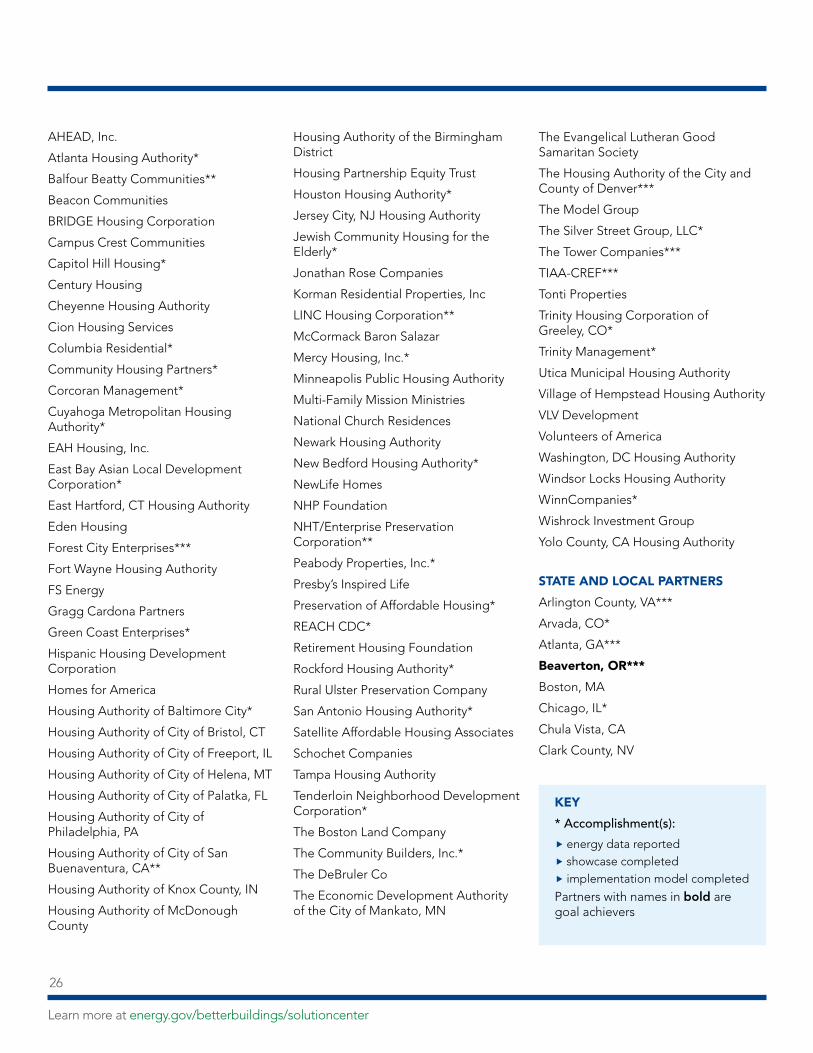
Better Buildings Challenge: Partners and Allies
COMMERCIAL PARTNERS
Arby’s*
Ascension Health**
Best Buy***
CKE Restaurants Holdings, LLC*
Cleveland Clinic Foundation***
CommonWealth Partners**
Deutsche Asset & Wealth Management**
Forest City Enterprises***
Havertys**
HEI Hotels & Resorts***
Hilton Worldwide**
IHG (InterContinental Hotels Group)***
Kohl’s Department Stores***
Las Vegas Sands Corporation*
Lend Lease**
Macy’s***
MGM Resorts International**
New York-Presbyterian Hospital**
Parkway Properties*
Parmenter Realty Partners**
PNC Financial Services Group**
Prologis**
Shorenstein Properties, LLC***
Sprint***
Staples***
Starbucks Coffee Company**
The JBG Companies**
The Tower Companies***
TIAA-CREF***
Transwestern**
UPMC: University of Pittsburgh Medical Center***
USAA Real Estate Company**
Walgreens Co.**
Walmart**
Whole Foods Market***
Wyndham Worldwide***
DATA CENTER PARTNERS
CoreSite
Digital Realty Trust, Inc.
eBay Inc.
Michigan State University
Schneider Electric
Staples
EDUCATION PARTNERS
Alachua County Public Schools*
Allegheny College***
Anne Arundel County Public Schools*
Camas School District, WA**
Chesapeake College
Delaware State University**
Douglas County School District, NV*
Dysart Unified School District 89, AZ**
Florida A&M
Fort Atkinson School District, WI**
Houston Independent School District, TX*
Indian River Central School District**
Kentucky Community and Technical College System*
Mesa County Valley School District, CO
Michigan State University***
Penn State University
Portland Public School District, OR**
Poudre School District, CO***
Towson University*
University of California, Irvine***
University of Hawaii at Manoa
University of Utah***
University of Virginia***
INDUSTRIAL PARTNERS
3M***
Alcoa***
Briggs & Stratton Corporation**
Celanese International*
Cummins, Inc.***
Darigold*
Eastman Chemical Corporation*
Ford Motor Company**
GE*
General Mills**
General Motors**
Harbec, Inc.**
Holcim (US) Inc.*
Johnson Controls**
J.R. Simplot**
Legrand North America***
Nissan North America***
Saint-Gobain Corporation**
Schneider Electric***
United Technologies Company**
Volvo Group North America*
MULTIFAMILY PARTNERS
ACTION-Housing Inc.*
Aeon**
KEY
* Accomplishment(s):
� energy data reported � showcase completed � implementation model completed
Partners with names in bold are goal achievers
25
AHEAD, Inc.
Atlanta Housing Authority*
Balfour Beatty Communities**
Beacon Communities
BRIDGE Housing Corporation
Campus Crest Communities
Capitol Hill Housing*
Century Housing
Cheyenne Housing Authority
Cion Housing Services
Columbia Residential*
Community Housing Partners*
Corcoran Management*
Cuyahoga Metropolitan Housing Authority*
EAH Housing, Inc.
East Bay Asian Local Development Corporation*
East Hartford, CT Housing Authority
Eden Housing
Forest City Enterprises***
Fort Wayne Housing Authority
FS Energy
Gragg Cardona Partners
Green Coast Enterprises*
Hispanic Housing Development Corporation
Homes for America
Housing Authority of Baltimore City*
Housing Authority of City of Bristol, CT
Housing Authority of City of Freeport, IL
Housing Authority of City of Helena, MT
Housing Authority of City of Palatka, FL
Housing Authority of City of Philadelphia, PA
Housing Authority of City of San Buenaventura, CA**
Housing Authority of Knox County, IN
Housing Authority of McDonough County
Housing Authority of the Birmingham District
Housing Partnership Equity Trust
Houston Housing Authority*
Jersey City, NJ Housing Authority
Jewish Community Housing for the Elderly*
Jonathan Rose Companies
Korman Residential Properties, Inc
LINC Housing Corporation**
McCormack Baron Salazar
Mercy Housing, Inc.*
Minneapolis Public Housing Authority
Multi-Family Mission Ministries
National Church Residences
Newark Housing Authority
New Bedford Housing Authority*
NewLife Homes
NHP Foundation
NHT/Enterprise Preservation Corporation**
Peabody Properties, Inc.*
Presby’s Inspired Life
Preservation of Affordable Housing*
REACH CDC*
Retirement Housing Foundation
Rockford Housing Authority*
Rural Ulster Preservation Company
San Antonio Housing Authority*
Satellite Affordable Housing Associates
Schochet Companies
Tampa Housing Authority
Tenderloin Neighborhood Development Corporation*
The Boston Land Company
The Community Builders, Inc.*
The DeBruler Co
The Economic Development Authority of the City of Mankato, MN
The Evangelical Lutheran Good Samaritan Society
The Housing Authority of the City and County of Denver***
The Model Group
The Silver Street Group, LLC*
The Tower Companies***
TIAA-CREF***
Tonti Properties
Trinity Housing Corporation of Greeley, CO*
Trinity Management*
Utica Municipal Housing Authority
Village of Hempstead Housing Authority
VLV Development
Volunteers of America
Washington, DC Housing Authority
Windsor Locks Housing Authority
WinnCompanies*
Wishrock Investment Group
Yolo County, CA Housing Authority
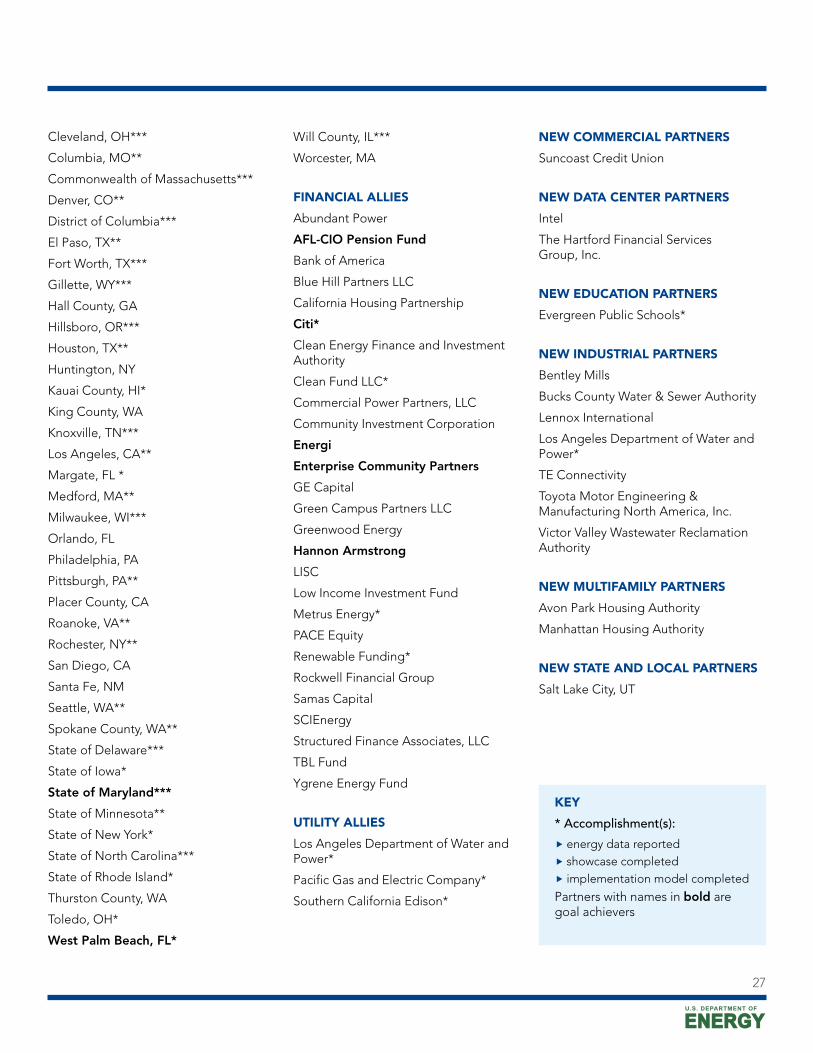
STATE AND LOCAL PARTNERS
Arlington County, VA***
Arvada, CO*
Atlanta, GA***
Beaverton, OR***
Boston, MA
Chicago, IL*
Chula Vista, CA
Clark County, NV
KEY
* Accomplishment(s):
� energy data reported � showcase completed � implementation model completed
Partners with names in bold are goal achievers
Learn more at energy.gov/betterbuildings/solutioncenter
26
Cleveland, OH***
Columbia, MO**
Commonwealth of Massachusetts***
Denver, CO**
District of Columbia***
El Paso, TX**
Fort Worth, TX***
Gillette, WY***
Hall County, GA
Hillsboro, OR***
Houston, TX**
Huntington, NY
Kauai County, HI*
King County, WA
Knoxville, TN***
Los Angeles, CA**
Margate, FL *
Medford, MA**
Milwaukee, WI***
Orlando, FL
Philadelphia, PA
Pittsburgh, PA**
Placer County, CA
Roanoke, VA**
Rochester, NY**
San Diego, CA
Santa Fe, NM
Seattle, WA**
Spokane County, WA**
State of Delaware***
State of Iowa*
State of Maryland***
State of Minnesota**
State of New York*
State of North Carolina***
State of Rhode Island*
Thurston County, WA
Toledo, OH*
West Palm Beach, FL*
Will County, IL***
Worcester, MA
FINANCIAL ALLIES
Abundant Power
AFL-CIO Pension Fund
Bank of America
Blue Hill Partners LLC
California Housing Partnership
Citi*
Clean Energy Finance and Investment Authority
Clean Fund LLC*
Commercial Power Partners, LLC
Community Investment Corporation
Energi
Enterprise Community Partners
GE Capital
Green Campus Partners LLC
Greenwood Energy
Hannon Armstrong
LISC
Low Income Investment Fund
Metrus Energy*
PACE Equity
Renewable Funding*
Rockwell Financial Group
Samas Capital
SCIEnergy
Structured Finance Associates, LLC
TBL Fund
Ygrene Energy Fund
UTILITY ALLIES
Los Angeles Department of Water and Power*
Pacific Gas and Electric Company*
Southern California Edison*
NEW COMMERCIAL PARTNERS
Suncoast Credit Union
NEW DATA CENTER PARTNERS
Intel
The Hartford Financial Services Group, Inc.
NEW EDUCATION PARTNERS
Evergreen Public Schools*
NEW INDUSTRIAL PARTNERS
Bentley Mills
Bucks County Water & Sewer Authority
Lennox International
Los Angeles Department of Water and Power*
TE Connectivity
Toyota Motor Engineering & Manufacturing North America, Inc.
Victor Valley Wastewater Reclamation Authority
NEW MULTIFAMILY PARTNERS
Avon Park Housing Authority
Manhattan Housing Authority
NEW STATE AND LOCAL PARTNERS
Salt Lake City, UT
KEY
* Accomplishment(s):
�
�
�
energy data reported showcase completed implementation model completed
Partners with names in bold are goal achievers
27
Endnotes1 Industrial partners typically make a 25% commitment.
2 2012 Commercial Building Energy Consumption Survey Data, Building Characteristics, Table B17 and Table B18, released April 30, 2015.
3 McKinsey & Company, Unlocking Energy Efficiency in the U.S. Economy, 2009.
4 U.S. Census Bureau, U.S. Bureau of Economic Analysis, Gross Domestic Product (GDP) by Industry Data, 1997-2012.
5 U.S. Energy Information Administration, Annual Energy Outlook, Residential, Commercial, & Industrial De-mand Sector Data Tables, 2013.
6 U.S. Census Bureau, U.S. Bureau of Economic Analysis, 2011 Annual Survey of Manufacturers, 2013.
7 U.S. Department of Energy, Guide to Financing EnergySmart Schools.
8 National Association of College and University Business Officers, Higher Education: Leading the Nation to a Safe and Secure Energy Future, 2012.
9 U.S. Energy Information Administration, 2009 Residential Energy Consumption Survey.
Learn more at energy.gov/betterbuildings/solutioncenter
28

Learn more at energy.gov/betterbuildings/solutioncenter