progress in reducing drink driving in...
TRANSCRIPT

PROGRESS IN REDUCING DRINK DRIVING
IN EUROPE
SMARTSOBER MOBILITY ACROSS ROAD TRANSPORT
February 2018

AcknowledgementsThis report would not have been possible without the support of the ETSC Road Safety Performance Index (PIN) panel of contributing experts. A full list is available at www.etsc.eu/pin.
For more informationEuropean Transport Safety Council20 Avenue des CeltesB-1040 BrusselsTel: +32 2 230 [email protected]/smart
This report is published as part of the SMART project, which receives financial support from The Brewers of Europe. The contents of this publication do not necessarily represent the views of the sponsor.
© 2018 European Transport Safety Council

PROGRESS IN REDUCINGDRINK DRIVING IN EUROPE
AuthorsTheodora Calinescu Dovile Adminaite
February 2018
SMARTSOBER MOBILITY ACROSS ROAD TRANSPORT

Progress in reducing drink driving in Europe | 5
CONTENTS
INTRODUCTION 5
1. THE SCOPE OF ALCOHOL CONSUMPTION AND THE DRINK DRIVING PROBLEM IN THE EU 6
2. PROGRESS IN REDUCING DRINK DRIVING DEATHS IN THE EU 8
2.1 Comparison between countries 8
2.2 Drink driving data collection and definition 12
3. MEASURES TO TACKLE DRINK DRIVING IN THE EU 15
3.1 Legal blood alcohol limits 15
3.2 Enforcement 17
3.2.1 Annual change in the number of drink driving checks 17
3.2.2 Drink driving enforcement levels 18
3.2.3 Road user perception on drink driving enforcement activities 19
3.3 Sanctions 19
3.4 Rehabilitation programmes 20
3.5 Alcohol interlocks 20
3.6 Education and campaigns 21
4. RECOMMENDATIONS 23
4.1 Recommendations to Member States 23
4.2 Recommendations to EU institutions 23
Progress in reducing drink driving in Europe | 5
INTRODUCTION
25,670 people were killed in the European Union as a consequence of road collisions in 2016.1 Driving under the influence of alcohol is one of the four main killers on the road, alongside speeding, non-use of seatbelts and driver distraction. Impairment through alcohol is an important factor influencing both the risk of a road collision as well as the severity of the injuries that result from collisions.
It is estimated that 1.5 - 2% of kilometres travelled in the EU are driven with an illegal Blood Alcohol Concentration, but around 25% of all road deaths in the EU are alcohol related.2 Consequently, ETSC estimates that at least 5120 deaths would have been prevented in 2016 if all drivers had been sober.3
In Europe, the number of road deaths attributed to alcohol have decreased at a similar rate to road deaths from other causes over the past decade. Changing public attitudes towards drink driving, the adoption of legal measures and enhanced enforcement have played an important role in the decrease of road deaths attributed to alcohol. However, the trends differ from country to country and drink driving remains a significant problem for road safety in the EU.4
This report aims to provide an updated overview of the drink driving situation in Europe, covering 32 countries: the 28 member states of the European Union together with Israel, Norway, the Republic of Serbia and Switzerland. It looks at country progress in reducing road deaths attributed to drink driving over the past decade. The report highlights specific legislation and enforcement measures from across Europe. A range of recommendations concerning further improvements in tackling drink driving are made to Member States and the EU institutions throughout this report.
1 ETSC (2017), 11th Road Safety PIN Report, Ranking EU Progress on Road Safety, https://goo.gl/QrWFYh 2 European Commission (2015), Alcohol, Directorate General for Transport, https://goo.gl/q1jCS8 3 As indicated by the estimate that the risk of a fatal collision when driving with a blood alcohol concentration of
0.5g/l is 5 times that when sober. Allsop R (2015) Saving lives by lowering the legal drink-drive limit. https://goo.gl/JrQhTr 4 For the scope of this report, the term ‘drink driving’ is used to refer exclusively to driving under the influence of alcohol above legal limits and not other intoxicating substances.
Around 25% of all road deaths in the EU are alcohol related.

6 | Progress in reducing drink driving in Europe Progress in reducing drink driving in Europe | 7
PART ITHE SCOPE OF ALCOHOL CONSUMPTION AND THE DRINK DRIVING PROBLEM IN THE EU
Fig.1: Alcohol consumption in the EU in 2015 (litres per person aged 15+ per year)5
No data
2.4 - 2
3 - 4
5 - 5
6 - 6
7 - 8
9 - 9
10 - 11
12 - 12
13 - 13
14 - 16.2
Progress in reducing drink driving in Europe | 7
The European Union is the heaviest alcohol consuming region in the world.5 According to the WHO, in one fifth of the population aged 15 years and above heavy drinking prevails at least once a week.6 The European average of 11.3 litres of pure alcohol consumed per person per year hides significant differences among countries.7 Italy and Malta have the lowest alcohol consumption among EU Member States with 6 litres (Fig.1). At the opposite end are Lithuania and the Czech Republic with more than 14 litres per head of alcohol consumption.
The problem of driving under the influence of alcohol demands particular attention from policy makers in Europe. Drink driving, even at low levels, increases the risk of being involved in a fatal road collision since it increases driver reaction time and decreases vigilance, concentration and visual acuity. It also results in poorer judgement and slower reflexes coupled with increased confidence and the likelihood of other risky behaviour, such as speeding or not using the seatbelt.
It is estimated that 1.5 - 2% of kilometres travelled in the EU are driven with an illegal Blood Alcohol Concentration (BAC), but around 25% of all road deaths in the EU are alcohol related.8
The ESRA (2016) road user attitude survey revealed that 97% of respondents are aware of the inappropriateness of driving after having consuming alcohol.9 However, 31% said they had driven after drinking alcohol in the last 12 months and 12% admitted they had driven when they may have been over the legal alcohol limit at least once in the last 30 days. While road users in Europe understand the risks related to drink driving, this phenomenon remains widespread.
More than 5000 deaths a year could be preventedIf, as estimated by the EC, 25% of road deaths, i.e. about 6400 in 2016, occur in drink driving collisions, and at least 80% of these could have been prevented if all drivers had been sober, then at least 5120 deaths per year could be prevented by eliminating drink driving.10
5 European Commission, ECHI (European Core Health Indicators) data tool, Extracted 10.2017 https://goo.gl/U423Bb 6 WHO Regional Office for Europe, (2017), Data and statistics https://goo.gl/AikW1T 7 WHO Regional Office for Europe, (2016), Web appendices for public health successes and missed opportunities,
https://goo.gl/2iJTT9 8 European Commission (2015), Alcohol, Directorate General for Transport, https://goo.gl/q1jCS8 9 Buttler, I. (2016) Enforcement and support for road safety policy measures. ESRA thematic report no. 6. ESRA
project https://goo.gl/2f1tJp 10 As indicated by the estimate that the risk of a fatal collision when driving with a blood alcohol concentration of
0.5g/l is five times that when sober. Allsop R (2015) Saving lives by lowering the legal drink-drive limit. https://goo.gl/JrQhTr

8 | Progress in reducing drink driving in Europe Progress in reducing drink driving in Europe | 9
Around 2,630 people were recorded killed in drink driving collisions in police records in 2016 in 25 EU countries11, compared to 4,950 in 2006. However, these figures are likely to be lower than the true figures due to underreporting, see section 2.2.
Road deaths attributed to alcohol were cut by 47% between 2006 and 2016 in the EU25, while other road deaths went down by 40% over the same period (Fig.2).
2.1 Comparison between countries
Fig.3 shows individual country performance in reducing road deaths attributed to drink driving compared with progress in reducing other road deaths since 2006, using each country’s own method of identifying alcohol-related deaths (see indicator box and section 2.2). Collectively in the EU, drink-driving deaths have been reduced 1% per year faster than other road deaths.
In 17 out of 26 countries, progress in reducing drink-driving deaths has been faster than overall reductions in other road deaths. In Israel, Bulgaria, Estonia and Latvia, progress on drink-driving has contributed most to overall reductions in roads deaths over the last decade. In Bulgaria and Israel, drink-driving deaths were cut by 12% faster than other road deaths each year on average since 2006. In Estonia drink driving deaths fell by 10% per year faster than other road deaths, in Latvia by 8.3%.
11 25 EU countries that could provide data.
PART IIPROGRESS IN REDUCING DRINK DRIVING DEATHS IN THE EU
Fig.2 Relative developments in road deaths attributed to alcohol and other road deaths in 25 EU countries
taken together over the period 2006-2016.
EU25 average: i.e. EU28 average excluding IT, PT, MT as drink-driving deaths data were not
available in these countries for the entire time series.
100%
90%
80%
70%
60%
50%
40%40%
50%
60%
70%
80%
90%
100%
2006 2007 2008 2009 2010 2011 2012 2013 2014 2015 2016
DD EU25 Other road deaths EU25
2006 2007 2008 2009 2010 2011 2012 2013 2014 2015 2016
DD EU25 Other road deaths EU25

Progress in reducing drink driving in Europe | 9
i
IND
ICA
TOR
At the other end of the ranking are Slovakia, Greece and Romania where developments in drink driving deaths have slowed down overall progress in reducing road deaths. In Greece and Romania road deaths attributed to drink driving went down 2% slower than other road deaths. In Slovakia the annual progress in reducing drink driving deaths stagnated over the period 2006-2016 while the number of other road deaths went down by on average 11% annually, creating an 11 percentage points difference presented in Fig. 3.
Data on drink driving deaths were not available in Italy, Malta and Norway. For Ireland, Luxembourg and Serbia the data are not comparable over the observed times series, due to changes in methodology.
Levels of deaths attributed to drink-driving cannot be compared between countries, as there are large differences in the way in which countries define and record a ‘road death attributed to drink driving’ (see section 2.2). National definitions of drink driving as provided by PIN panellists are available in the Annexes.
Countries are therefore compared on the basis of developments in deaths attributed to drink driving relative to developments in other road deaths, using each country’s own method of identifying alcohol-related deaths (Fig.3). Rates of change are comparable across countries in so far as procedures for recording drink driving deaths and other road deaths have remained consistent in the countries concerned during the reporting period.
This ranking is an update of previous ETSC publications: 9th Road Safety PIN Annual Report (2015); Ranking EU progress on car occupant safety (2014); Drink Driving: Towards Zero Tolerance (2012) and the 4th Road Safety PIN Report (2010). The numbers of deaths attributed to drink driving were supplied by the PIN panellists in each country (see www.etsc.eu/pin). Estimates of the number of deaths attributed to drink driving are not available in Italy, Malta and Norway, leaving the countries with no indicator for the effectiveness of their fight against drink driving. For Spain and Sweden the numbers of killed drivers who tested positive in post-mortem blood alcohol tests were used.
Fig.3 Difference between the average annual change
(%) in the number of road deaths attributed
to alcohol and the corresponding reduction
for other road deaths over the 2006-2016 period.
*2006-2015; **2010-2016; ***2008-2016. EU25
average: EU28 average excluding IT, PT, MT as data were not available in these
countries for the entire time series. LU and IE are
excluded from the figure due to changes in the method of data collection, but are
included in the EU average.
15%
10%
5%
0%
-5%
-10%
-15%IL BG EE LV BE NL DK DE SI GB* FI AT CZ*** HR HU PL CH SE FR PT** CY LT ES* RO EL* SK
-15%
-10%
-5%
0%
5%
10%
15%
EU25 average: -1%

10 | Progress in reducing drink driving in Europe Progress in reducing drink driving in Europe | 11
Estonia: highest levels of drink driving enforcement
In Estonia, drink driving deaths went down from 61 in 2006 to 7 in 2016, representing an 89% decrease. This impressive progress is the result of a comprehensive policy against drink driving.
A 0.2g/l BAC limit for all drivers was introduced in 2000 and drink driving compliance is regularly checked by the police (Table 1). The number of alcohol roadside breath tests went up from 105 in 2010 to 677 tests per 1000 inhabitants in 2015. Currently, Estonia has the highest drink driving enforcement levels in the EU (Table 2).
“Fighting drink driving is a clear priority for our traffic police. Opinion polls show that 99% of drivers think drink and drug driving is dangerous or rather dangerous. The longstanding support from our citizens and politicians for drink driving prevention and enforcement activities helped to achieve such a high number of drink driving checks. We aim to sustain current enforcement levels and improve the effectiveness of enforcement activities by identifying where and when the tests should be done to get the best safety effects. On top of this, over the last 20 years we had continuous and intensive campaigns against drink driving. As a result, drink driving has become socially unacceptable in Estonian society. People are drinking less in general, which is helping on the roads too.” Erik Ernits, Road Administration, Estonia
Latvia: lower BAC limit and tough sanctions for drink driving offenders brought positive results
Drink driving deaths went down from 84 in 2006 to 17 in 2016. This 15% annual average reduction was the result of a series of measures, including a reduction of the limit for novice drivers from 0.5g/l to 0.2g/l back in 2004. In January 2016, the blood alcohol limit was also reduced to 0.2g/l for bus and tram drivers.
“Drink drivers face tough sanctions: fines between 500 and 1500 EUR, the suspension of their driving license from 1 to 4 years and 8 penalty points valid for 5 years. To get one’s driving license back, offenders have to pass a theoretical and driving test at the end of the disqualification period as well as a medical check which includes a drug test and a psychological test. Campaigns combined with roadside drink driving police checks take place every year in June and around Christmas and New Year.” Aldis Lama, Road Traffic Safety Directorate, Latvia
EE
LV

Progress in reducing drink driving in Europe | 11
Denmark: alcohol rehabilitation for employees, tough sanctions and negative societal attitudes towards drink driving
There were 112 drink-driving deaths in 2007 in Denmark compared to 30 in 2016. Alcohol-related road deaths have decreased at an annual average rate of more than 12% in the past decade. Sanctions for drink driving have increased several times since 2005. All drivers found with BAC levels above 0.5g/l must pay for and follow a mandatory 12 hour course on alcohol and road safety to be able to regain a driving licence. The fines take into account BAC levels and personal income. When a driver is caught with a BAC level above 1.2g/l an unconditional driving ban for a minimum of three years is applied. Repeat offenders are sentenced to prison or undertake community service. If a driver is caught with a BAC level above 1.2g/l twice within three years, the police can confiscate the car. Since 2010, the Danish Police has introduced screening breath analysers, increasing the number of random controls and making them more effective (Table 2).
“Another important factor is alcohol policy in the workplace. A no-alcohol policy is implemented in nearly all public and private working places and an increasing number of employers offer rehabilitation to employees with alcohol addiction, instead of dismissing them.
National drink driving campaigns have raised public disapproval of drunk driving to nearly 100%. A focus on decisions before driving, serving of alternative non-alcoholic drinks at social events and increased civil control have been the areas of focus. Most of the population now has the right attitude and most people are aware and willing to stop others from drinking and driving.” Jesper Sølund, Danish Road Safety Council
Israel: a set of measures led to a rapid reduction in drink driving deaths
In Israel, the number of alcohol-related deaths was cut from 28 in 2006 to 10 in 2015, representing a 64% reduction. The number of drink-driving deaths decreased by 12% faster each year than other road deaths over the period 2006-2015.
“The fight against drink driving is a major priority for the National Traffic Police force and the Road Safety Authority (RSA). The Police have significantly increased the number of random alcohol breath tests since 2006. The peak was reached in 2010 when almost one million alcohol breath tests were conducted in a country with less than 8 million inhabitants. The RSA accompanied police activities with publicity campaigns. The idea of a responsible driver, who abstains from drinking while partying and going to pubs, caught on, especially with younger drivers. To support the efforts, night buses have been introduced to provide a safe and cheap travel option. These measures contributed to the decrease in drink driving deaths in Israel over the last decade.“ Victoria Gitelman, Technion University, Israel
Germany: a continuous reduction in alcohol-related road deaths
Road deaths attributed to alcohol consumption decreased in Germany from 559 in 2006 to 225 in 2016.
“In 2016, 7% of all killed in traffic were due to drink driving, in 2006 it was 11.8 %. Over the last 25 years, there has been a change regarding the attitude towards drink driving: it is now considered as unacceptable. Nevertheless, those who are involved in serious traffic collisions present very high levels of BAC. This shows, that these are persons who have alcohol problems. The average driver knows how to behave.” Jacqueline Lacroix, German Road Safety Council, Germany
Fines for drink driving in Denmark take into
account BAC levels and personal income.
DK
IL
DE

12 | Progress in reducing drink driving in Europe Progress in reducing drink driving in Europe | 13
Slovenia: stricter penalties for drink driving and rehabilitation programmes
The share of drink driving deaths in overall road deaths decreased from 37% in 2006 to 31% in 2016. Alcohol behind the wheel is mostly detected among young drivers aged 18 to 34, despite a zero tolerance policy for novice drivers.
“To decrease the number of deaths due to drink-driving, we used a combination of different measures: increased police checks, stricter penalties introduced in 2008 including arresting drivers caught with an alcohol level over 1.1g/l and drivers refusing to be tested. Drivers who have committed a major offence while intoxicated face their motor vehicle to be seized and their driving licence suspended. Repeat offenders have to follow rehabilitation programs, divided into educational and psychosocial workshops. In 2016, around 3300 drivers took part in the educational workshops and 480 in the psychosocial ones. All these measures were complemented by mass-media prevention campaigns.”
“In 2016 the Drivers Act was modified, to make the use of alcohol interlocks possible, as allowed by the EU Directive on Driving Licenses. The priority now is to make the most of this possibility and use alcohol interlocks more widely.” Vesna Marinko, Slovenian Traffic Safety Agency.
2.2 All road users involved in a collision with injuries should be tested for drink driving
There is a widespread consensus that the real number of drink driving road deaths in many countries is higher than the officially-reported figures. Based on official EU25 data, the proportion of drink driving deaths is around 13% of all road deaths, but the European Commission estimates that the real number of alcohol related deaths in the EU is up to 25% of all road deaths.12
A majority of countries still base the official drink driving death data upon a single data source, most often police records. But these figures alone do not give the full picture. Some countries are trying to address the issue of underreporting of alcohol-related road collisions by linking police data with hospital data or/and forensic reports.13
In a number of countries a deceased person cannot be checked for drink driving due to legal constraints. In some countries, such as Belgium and the Netherlands, drivers who are killed on the spot might not be tested for alcohol.14 Not all countries include systematic testing of all active road users who are involved in a collision.
The issue is further complicated by the different national definitions of deaths attributed to drink driving. Researchers in the European project SafetyNet recommend using the definition of “any death occurring as a result of a road accident in which any active participant was found with a blood alcohol level above the legal limit”.15 While some EU countries have adopted the SafetyNet recommended definition, there are indications that not all active road users involved in a road collision that resulted in road death or serious injury are systematically tested for alcohol.
Therefore, official data on the number of drink driving deaths must be viewed with caution. Due to data underreporting and differing definitions, international comparisons are not possible. Such comparisons would be negatively affected by the shortcomings in data collection. However, the rate of progress in reducing drink driving deaths can be compared between countries if drink driving reporting procedures have remained consistent in the countries concerned during the reporting period.
12 European Commission (2015), Alcohol, Directorate General for Transport, https://goo.gl/q1jCS8 13 International Transport Forum ITF, International Traffic Safety Data and Analysis Group IRTAD Research Report
(2017) Alcohol-related road casualties in official crash statistics https://goo.gl/5bYTQB 14 ECORYS ( 2014), Study on the prevention of drink-driving by the use of alcohol interlock devices https://goo.gl/U8kBvU 15 SafetyNet Project (2008)https://goo.gl/uHX2aU
SI

Progress in reducing drink driving in Europe | 13
Italy
The scale of the drink driving problem across Italy is currently unknown. However, work is underway to fill the gap. The Carabinieri and National Police, who collect about one third of all road collisions with injuries, have made available some data for 2015 showing that out of 58,981 collisions with injuries, 5876 (or 10%) involved at least one of the drivers of the vehicles under the influence. Italy is working to improve the datacollection of drink driving deaths and serious injuries throughout the country.
Ireland
A reduction in the number of drink driving deaths has been at the core of Ireland’s road safety policy for years. However, a high level of drink driving is still evident. A report published by the Irish Road Safety Authority (RSA) revealed that 38% of all fatal collisions that occurred over the period 2008-2012 involved a driver, motorcyclist, cyclist or pedestrian who had consumed alcohol. Moreover, 86% of drivers and 51% of passengers who had consumed alcohol and were killed did not wear a seatbelt.16 The RSA used data from forensic reports to estimate the actual scope of the drink driving problem.
The most up-to-date information on alcohol-related road deaths shows that in 2014 one third of road users killed had alcohol in their blood. Out of those, 82% had a BAC level of more than 0.5g/l and 60% a BAC of more than 1.5g/l. This figure however looks at alcohol-impaired deaths only and not at other victims of road users who had consumed alcohol contrary to the SafetyNet recommended definition, meaning that the overall number of alcohol-related deaths is higher in Ireland.17
Serbia
Serbia is working to improve drink driving data collection according to the EU guidelines on the Common Accident and Injury Database (CaDas).18 Before 2016, information on whether the drivers involved in the collision were under the influence of alcohol was not collected. Traffic police officers only had to indicate whether alcohol was the ‘cause’ of the road collision. If the police officer estimated that alcohol was not the predominant cause, deaths of drivers impaired would not have been counted as ‘drink driving deaths’.
Serbia only collects information on whether the drivers or pedestrians involved in a collision were above the permitted limits because this is what is recommended in the CaDas guidelines. The CaDas guidelines urgently need to be updated to include cyclists impaired, as well as victims of road users who had consumed alcohol in order to implement the recommended SafetyNet definition.
16 Road Safety Authority (2016), Fatal Collisions 2008 – 2012 Alcohol as a Factor https://goo.gl/yFRA7q 17 The Health Research Board (HRB) collated information on closed coronial file on behalf of the RSA in the context
of the National Drug-Related Death Index (NDRDI). A summary version of the report available at this link : https://goo.gl/3Cba4q
18 CaDas, the Common Accident Data Set, consists of a minimum set of standardised data elements, to help comparable road accident data to be available in Europe. The CADaS can be implemented on a voluntary basis by any country that wishes to update their national road accident collection system. https://goo.gl/Roaa9M
IE
RS
IT
14 | Progress in reducing drink driving in Europe Progress in reducing drink driving in Europe | 15
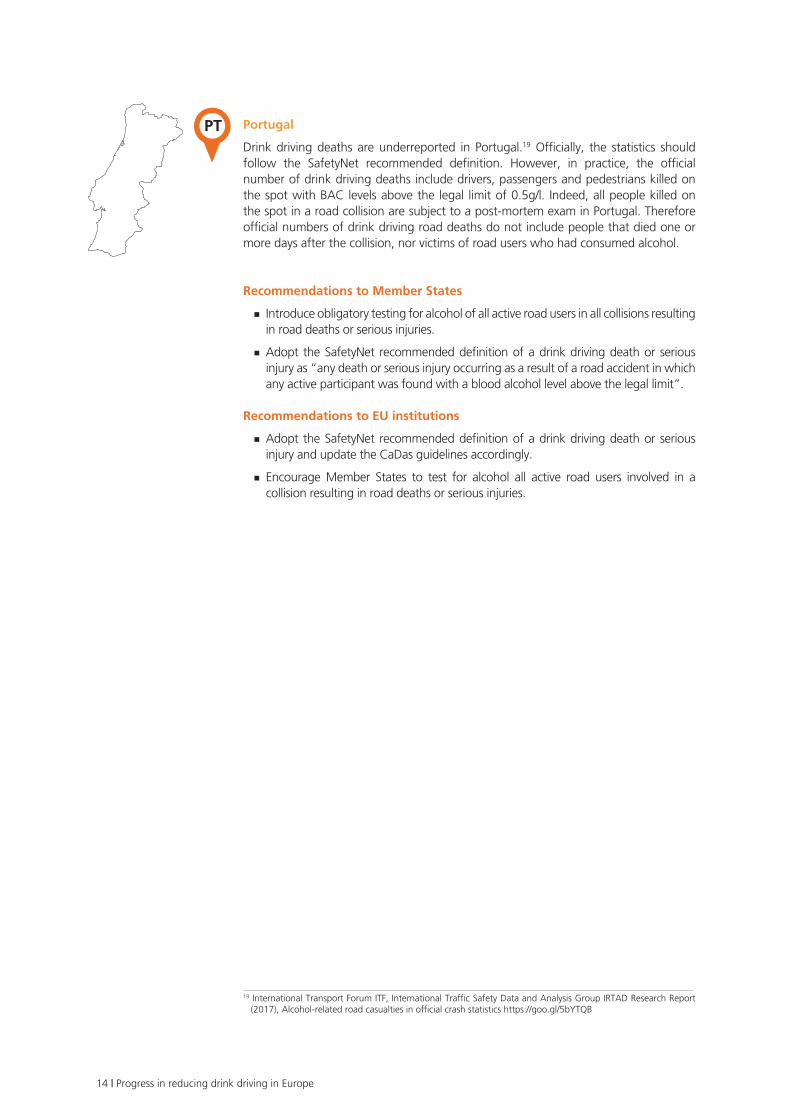
Portugal
Drink driving deaths are underreported in Portugal.19 Officially, the statistics should follow the SafetyNet recommended definition. However, in practice, the official number of drink driving deaths include drivers, passengers and pedestrians killed on the spot with BAC levels above the legal limit of 0.5g/l. Indeed, all people killed on the spot in a road collision are subject to a post-mortem exam in Portugal. Therefore official numbers of drink driving road deaths do not include people that died one or more days after the collision, nor victims of road users who had consumed alcohol.
Recommendations to Member States
Introduce obligatory testing for alcohol of all active road users in all collisions resulting in road deaths or serious injuries.
Adopt the SafetyNet recommended definition of a drink driving death or serious injury as “any death or serious injury occurring as a result of a road accident in which any active participant was found with a blood alcohol level above the legal limit”.
Recommendations to EU institutions
Adopt the SafetyNet recommended definition of a drink driving death or serious injury and update the CaDas guidelines accordingly.
Encourage Member States to test for alcohol all active road users involved in a collision resulting in road deaths or serious injuries.
19 International Transport Forum ITF, International Traffic Safety Data and Analysis Group IRTAD Research Report (2017), Alcohol-related road casualties in official crash statistics https://goo.gl/5bYTQB
PT

Progress in reducing drink driving in Europe | 15
PART IIIMEASURES TO TACKLE DRINK DRIVING IN THE EU
Research has identified a number of proven effective methods for keeping alcohol-impaired drivers off the road and consequently saving thousands of lives each year, including reduced legal BAC limits, effective drink driving enforcement and the use of alcohol interlock devices for certain categories of drivers as well as drink driving offenders, coupled with rehabilitation programmes, education and awareness-raising campaigns.20 In this section, we explore several key measures.
3.1 Legal blood alcohol limits
Legal Blood Alcohol Concentration (BAC) limits are an important measure for tackling drink-driving. The European Commission recommends BAC limits are set at maximum 0.5g/l with a lower limit of 0.2g/l for novice and professional drivers.
An increasing number of countries have lowered their BAC limits to be in line with the EC recommendation. Four countries have gone beyond the EC recommendation by introducing zero tolerance for all road users. The countries with 0 BAC for all drivers are the Czech Republic, Hungary, Romania and Slovakia (Table 1). Cyprus, Estonia, Poland, Sweden and Norway have a standard BAC level of 0.2g/l.
22 EU countries apply a lower BAC for novice drivers (0.0g/l – 0.2g/l) and 19 EU countries apply a lower BAC for professional drivers (0.0g/l to 0.2g/l BAC).
In Scotland, which has lowered the drink drive limit to 0.5g/l in 2014, police figures showed a 12.5% decrease in drink-drive offences in the first nine months.21
Switzerland went from 0.8g/l to 0.5g/l in 2005, the same year it began randomised breath testing. Since 2014 driving under the influence of alcohol has been completely prohibited for novice and commercial drivers. Anyone who drives a vehicle while strongly intoxicated (BAC level above 1.6g/l) has to undergo an assessment of suitability to drive a motor vehicle.
In Spain, the change in the criminal code in 2007 established drink driving with a BAC above 1.2g/l or 0.6g/l for novice drivers as a criminal offence. Last year Spain announced it will cut the drink driving limit for professional and novice drivers to zero and suspend the driving licenses of anyone caught drink driving twice in two years.22
20 Centre for Public Health Excellence NICE (2010), Review of effectiveness of laws limiting blood alcohol concentration levels to reduce alcohol-related road injuries and deaths, https://goo.gl/FQuJuR
21 Institute of Alcohol Studies (2016),Road safety and health groups call for lower drink driving limit, https://goo.gl/ic2Mcu
22 ETSC (2017) Spain looking to apply zero tolerance alcohol limits for novice and professional drivers https://goo.gl/2z71pV

16 | Progress in reducing drink driving in Europe Progress in reducing drink driving in Europe | 17
England, Wales and Northern Ireland together with Malta, have one of the highest drink driving limits in the world and the highest drink driving limit in Europe.23According to a recent study commissioned by PACTS and the RAC foundation, lowering the BAC limit from 0.8g/l to 0.5g/l in 2010 would have saved about 25 lives and 95 people from being seriously injured each year over the period 2010-2013.24
However, lowering BAC limits is not enough for drink driving deaths to go down – drink driving enforcement is crucial.
23 Police Service of Northern Ireland (2016) Police winter drink drive operation launched with new random testing powers https://goo.gl/PujNb9
24 Allsop, R. (2015), Saving Lives by Lowering the Legal Drink-Drive Limit, https://goo.gl/ph8wrQ
Table 1. BAC limits (in g/l) and sanctions.
Source: ETSC and PIN Panellists (*Northern Ireland
has passed legislation in November 2016 allowing
for random breath testing at checkpoints23)
Standard BAC
BACCommercial
drivers
BACNovice drivers
Penalties Random Breath TestingFine License suspended Penalty
points
Czech Republic 0.0 0.0 0.0 Yes Yes Yes Yes
Hungary 0.0 0.0 0.0 Yes Yes Yes Yes
Romania 0.0 0.0 0.0 Yes Yes Yes Yes
Slovakia 0.0 0.0 0.0 Yes Yes No Yes
Estonia 0.2 0.2 0.2 Yes Yes No Yes
Poland 0.2 0.2 0.2 Yes Yes Yes Yes
Sweden 0.2 0.2 0.2 Yes Yes No Yes
Norway 0.2 0.2 0.2 Yes Yes Yes Yes
Serbia 0.3 0.0 0.0 Yes Yes Yes Yes
Lithuania 0.4 0.0 0.0 Yes Yes No Yes
Croatia 0.5 0.0 0.0 Yes Yes Yes Yes
Germany 0.5 0.0 0.0 Yes Yes Yes No
Italy 0.5 0.0 0.0 Yes Yes Yes Yes
Slovenia 0.5 0.0 0.0 Yes Yes Yes Yes
Austria 0.5 0.1 0.1 Yes Yes Yes Yes
Israel 0.5 0.1 0.1 Yes Yes Yes Yes
Switzerland 0.5 0.1 0.1 Yes Yes No Yes
Belgium 0.5 0.2 0.5 Yes Yes No Yes
Cyprus 0.5 0.2 0.2 Yes No Yes Yes
Greece 0.5 0.2 0.2 Yes Yes Yes Yes
Ireland 0.5 0.2 0.2 Yes Yes Yes Yes
Luxembourg 0.5 0.2 0.2 Yes Yes Yes Yes
Portugal 0.5 0.2 0.2 Yes Yes Yes Yes
Spain 0.5 0.3 0.3 Yes Yes Yes Yes
Latvia 0.50.5
(0.2 bus and tram drivers)
0.2 Yes Yes Yes Yes
France 0.50.5
(0.2 bus drivers)0.2 Yes Yes Yes Yes
Netherlands 0.5 0.5 0.2 Yes Yes Yes Yes
Bulgaria 0.5 0.5 0.5 Yes Yes Yes Yes
Denmark 0.5 0.5 0.5 Yes Yes Yes Yes
Finland 0.5 0.5 0.5 Yes Yes No Yes
Scotland 0.5 0.5 0.5 Yes Yes Yes No
Malta 0.8 0.8 0.8 Yes Yes No No
UK 0.8 0.8 0.8 Yes Yes Yes No*
Progress in reducing drink driving in Europe | 17
3.2 Enforcement
Consistent and visible police enforcement is a powerful deterrent to drink driving. Moreover, the effectiveness of other measures, such as rehabilitation courses or alcohol interlock programmes, depends heavily on drink drivers being detected.
All PIN countries, except Germany, Malta and Great Britain, allow for random targeted roadside alcohol breath testing (Table 1). This means that every driver or rider has the same probability to be selected for a drink driving test. In Great Britain, breath testing may be used when there is reasonable cause for suspicion that a driver may have been drinking but police do not have powers to conduct random breath testing.25
As the use of social media and mobile phones makes it easier for people to inform their social network about the location of police checks, in countries such as Belgium the police have increased the use of small flexible police units for random breath testing26, since they are able to change locations fast and efficiently. France, on the other hand, has taken measures to ban sharing of the location of temporary police checks and mobile safety cameras.27 The effectiveness of random targeted breath testing can be further enhanced when it is targeted in the vicinity of places where alcohol is consumed and at times when the prevalence of drink driving is high, i.e. weekend nights, and when publicity accompanies enforcement campaigns.
Research has shown that increased drink driving enforcement contributes to a decrease in drink driving deaths and injuries.28
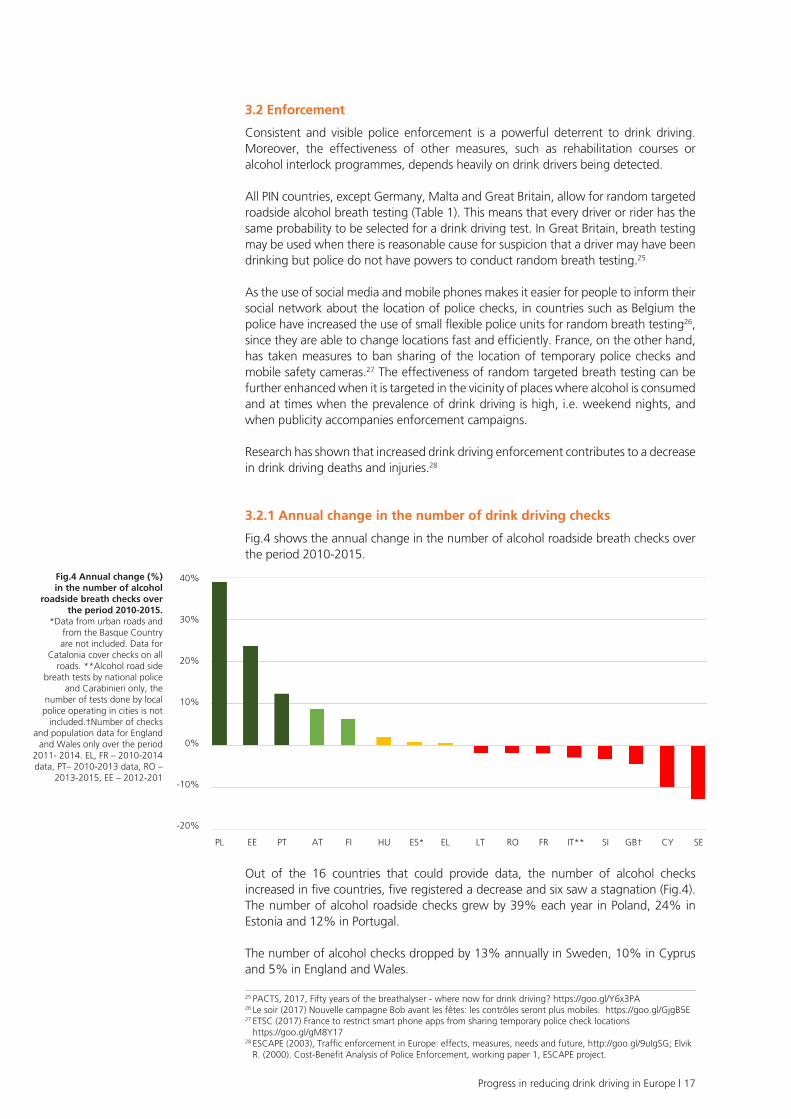
3.2.1 Annual change in the number of drink driving checks
Fig.4 shows the annual change in the number of alcohol roadside breath checks over the period 2010-2015.
Out of the 16 countries that could provide data, the number of alcohol checks increased in five countries, five registered a decrease and six saw a stagnation (Fig.4). The number of alcohol roadside checks grew by 39% each year in Poland, 24% in Estonia and 12% in Portugal.
The number of alcohol checks dropped by 13% annually in Sweden, 10% in Cyprus and 5% in England and Wales.
25 PACTS, 2017, Fifty years of the breathalyser - where now for drink driving? https://goo.gl/Y6x3PA 26 Le soir (2017) Nouvelle campagne Bob avant les fêtes: les contrôles seront plus mobiles. https://goo.gl/GjgB5E27 ETSC (2017) France to restrict smart phone apps from sharing temporary police check locations https://goo.gl/gM8Y17 28 ESCAPE (2003), Traffic enforcement in Europe: effects, measures, needs and future, http://goo.gl/9uIgSG; Elvik
R. (2000). Cost-Benefit Analysis of Police Enforcement, working paper 1, ESCAPE project.
Fig.4 Annual change (%) in the number of alcohol
roadside breath checks over the period 2010-2015.
*Data from urban roads and from the Basque Country are not included. Data for
Catalonia cover checks on all roads. **Alcohol road side
breath tests by national police and Carabinieri only, the
number of tests done by local police operating in cities is not
included.†Number of checks and population data for England
and Wales only over the period 2011- 2014. EL, FR – 2010-2014 data, PT– 2010-2013 data, RO –
2013-2015, EE – 2012-201
40%
30%
20%
10%
0%
-10%
-20%
PL EE PT AT FI HU ES* EL LT RO FR IT** SI GB† CY SE

18 | Progress in reducing drink driving in Europe Progress in reducing drink driving in Europe | 19
3.2.2 Drink driving enforcement levels
Among the countries that could provide up-to-date data, police in Estonia, Poland and Finland are most active in the fight against drink driving with respectively 677, 466 and 279 driver checked per 1000 inhabitants in 2015 (Table 2). The number of checks are also high in Austria (189) and Slovenia (156). The lowest probability of being checked for drink driving is in Lithuania and Romania with less than 80 per 1000 inhabitants being checked for drink driving per year.
Poland and Estonia registered the lowest proportion of drivers tested who were found to be above the legal drink driving limit. The proportion of such drivers are high in GB (11%), Cyprus (7%) and Slovenia (3.6%). However, these figures are difficult to interpret since the roadside checks are not comparable between the countries on aspects such as randomness, the place and time of the checks.29
At least ten countries do not collect data on the number of drink driving police checks: Belgium, Switzerland30, Czech Republic, Germany, Denmark, Croatia, Latvia, the Netherlands, Serbia and Slovakia.
29 ETSC, 2016, PIN Flash 31 How traffic law enforcement can contribute to safer roads, https://goo.gl/cpKsj2 30 Not recently.
Table 2. Total number of roadside alcohol breath tests and proportion of
those tested found above the legal limit.29 *Drink driving tests by national
police and Carabinieri only. Checks done by the local police operating in cities
are not available. **Drink driving tests for England and Wales only, the figure for the
number found to be above the legal limit includes those
who refused to take the breath test.
2015 2014 2013 2012 2011 2010
EE 677 0.9% 572 1.0% 470 1.3% 356 1.8% n/a 105 0.7%
PL 466 0.7% 405 0.9% 234 1.8% 194 2.3% 149 3.2% 88 4.9%
FI 279 1.0% 286 0.9% 149 1.5% 175 1.3% 220 1.0% 206 1.0%
AT 189 1.6% 214 1.8% 209 2.0% 195 2.4% 169 2.8% 123 3.7%
SI 156 3.6% 186 3.6% 184 3.7% 161 3.9% 188 4.5% 200 4.7%
EL n/a 166 1.6% 163 1.7% 156 1.8% 158 2.0% 164 2.1%
FR 152 2.9% 164 2.9% 160 3.1% 168 3.2% 172 3.5% 168 3.4%
HU 135 1.5% 124 1.9% 121 1.9% 125 2.1% 118 2.9% 120 3.6%
CY 135 7.0% 138 6.7% 146 7.2% 176 7.4% 205 4.9% 213 5.3%
SE 130 1.0% 205 0.6% 234 0.6% 256 0.6% 259 0.7% 287 0.6%
RO 72 1.8% 73 1.6% 75 1.0% n/a n/a n/a
LT 48 1.8% 52 1.9% 55 2.2% 53 2.1% 83 2.0% 42 2.7%
PT n/a 149 n/a 133 n/a 111 n/a 107 3.8%
IL 122 1.0%
NO 367 0.2%
Countries where data are available for checks on part of the road network only
IT* 25 2.5% 26 2.4% 29 2.6% 30 2.8% 31 3.1% 28 3.3%
GB** n/a 11 11.0% 12 10.4% 12 11.1% 12 11.8% 13 11.5%
Ro
adsi
de
po
lice
test
s p
er
1000
inh
abit
ants
Pro
po
rtio
n a
bo
ve t
he
leg
al
limit
(in
%)
Ro
adsi
de
po
lice
test
s p
er
1000
inh
abit
ants
Pro
po
rtio
n a
bo
ve t
he
leg
al
limit
(in
%)
Ro
adsi
de
po
lice
test
s p
er
1000
inh
abit
ants
Pro
po
rtio
n a
bo
ve t
he
leg
al
limit
(in
%)
Ro
adsi
de
po
lice
test
s p
er
1000
inh
abit
ants
Pro
po
rtio
n a
bo
ve t
he
leg
al
limit
(in
%)
Ro
adsi
de
po
lice
test
s p
er
1000
inh
abit
ants
Pro
po
rtio
n a
bo
ve t
he
leg
al
limit
(in
%)
Ro
adsi
de
po
lice
test
s p
er
1000
inh
abit
ants
Pro
po
rtio
n a
bo
ve t
he
leg
al
limit
(in
%)

Progress in reducing drink driving in Europe | 19
3.2.3 Road user perception on drink driving enforcement activities
Enforcement is essential for giving drivers the feeling that there is a high chance to be caught and punished when breaking the traffic law. This deterrent mechanism also applies to drink driving enforcement. Therefore, road user perception on drink driving enforcement activities is crucial when evaluating the effectiveness of police efforts.
The ESRA (2016) survey on road user attitudes asked respondents from 16 EU countries to evaluate the likelihood of being checked at a roadside alcohol breath test on a typical journey. On average, only 18% of all respondents thought that on a typical journey, the probability of being submitted to an alcohol test by the police is high or very high. Even though driver perception on the likelihood to be tested for alcohol increased over the last years, the scale of enforcement activities in the EU remains insufficient.31
Road user perception on drink driving enforcement activities differs between countries. The ESRA results show that the perceived likelihood of a police check for drink driving is the highest in Poland - 44% of drivers think the chance of being checked for drink driving is high or very high (Fig.5). It shows that Poland’s increased drink driving enforcement started to pay off. Poland is followed by France and Slovenia where respectively 29% and 27% of respondents think they are very likely to be tested for drink driving on a regular trip. The perceived likelihood of a police drink driving check is the lowest for drivers in Denmark (2%), Finland (4%), Germany (8%), the UK and Ireland (9%).32
3.3 Sanctions
Many different types of sanctions exist for drink driving offenders. Most EU Member States have fixed fines for driving under the influence (DUI) offences that are not income related, while countries such as Denmark, Finland and Sweden apply income-based fines.33A benefit of fines is that they have a higher benefit-to cost ratio than jail sentences and that the earned money can be used to support further measures against drink driving.34
31 Buttler, I. (2016) Enforcement and support for road safety policy measures. ESRA thematic report no. 6. ESRA project (European Survey of Road users’ safety Attitudes), https://goo.gl/2f1tJp
32 Ibid 33 Ibid 34 Krismann, M., Schoech, H., Knoche, A., Hargutt, V. & Klipp, S. (2011). Evaluation of legal measures to combat
DUI/DUID DRUID Driving Under the Influence of Drugs, Alcohol and Medicines. Deliverable 1.4.1. www.druid-project.eu
Fig.5 Proportion (%) of respondents who replied they are very likely to be
checked for drink driving on a typical journey.
Source: ESRA survey (2016) 33
0%
5%
10%
15%
20%
25%
30%
35%
40%
45%
PL FR SI ES PT CH EL IT AT BE SE NL IE UK DE FI DK
45%
40%
35%
30%
25%
20%
15%
10%
5%
0%
PL FR SI ES PT CH EL IT AT BE SE NL IE UK DE FI DK
EU16 average: 18%
In Denmark, Finland and Sweden, drink
drivers face income-based fines.

20 | Progress in reducing drink driving in Europe Progress in reducing drink driving in Europe | 21
At the same time, repeat convictions for drink or drug driving may be symptomatic of an underlying health problem relating to alcohol misuse or dependency. In these cases, the standard penalties are unlikely to deter further offending unless the underlying cause of the behaviour is addressed. Treating substance misuse or dependency issues has wider societal benefits than road safety, including improvements to the individual’s health and well-being, and the wider community in terms of reduced crime, anti-social behaviour and unintentional injuries arising from alcohol misuse.35
The suspension or withdrawal of the driving license can be an effective deterrent, but the effectiveness of this sanction depends on the ability of the police to enforce the measure. If enforcement is rather weak, drivers who have lost their driving license may start to drive illegally. Research shows that the optimum duration for the license withdrawal is between 2-12 months. Furthermore, effects can be enhanced when driving license sanctions are combined with treatment or rehabilitation measures. Withdrawal of the license of patients undergoing long-term treatment, including substitution treatment, should be based on an individual assessment of a patient’s fitness to drive overall, not simply on substance consumption.36
3.4 Rehabilitation programmes
According to the findings of the DRUID project, two main groups, namely non-addicts and addicts have to be distinguished. Their risk of relapse differs significantly due to the severity of the underlying problem behaviour, in this case alcohol. This means that at least two levels of intervention have to be provided: less intense rehabilitative measures for non-dependent offenders and intense treatment for dependent offenders.
Sweden, Switzerland, Estonia, the UK, the Netherlands, Finland and Slovenia are among the countries that offer driver rehabilitation programmes to drink driving offenders. Moreover, Austria, Belgium, Finland, France, Sweden and Poland provide driver rehabilitation programmes including alcohol interlocks for drink driving offenders. These programmes are combined with counselling and close monitoring in most cases.37
3.5 Alcohol interlocks
There is still a group of hard-core drink driving offenders that seem unwilling or unable to change their behaviour despite the use of traditional countermeasures such as awareness campaigns, fines and driving bans. For this group, the introduction of an alcohol interlock programme seems to be an effective measure.38
Studies have repeatedly shown that alcohol interlock programmes, combined with rehabilitation programmes, cut reoffending rates both during and after the driver has been required to install the device in their vehicle.39
In many EU countries the technology has found its way on a voluntary basis into vehicles which are used for the transport of goods or passengers. More and more countries in Europe are adopting legislation for the use of alcohol interlocks. Legislation needs to be well-founded in the legal system and clearly described so that it cannot be disputed on legal grounds. As part of the legal foundation, special emphasis should be given to the relative position of the alcohol interlock programme when compared to other sanctions and measures. Alcohol interlock laws for drink driving offenders and/or professional drivers have been introduced in Austria, Belgium, Denmark, Finland, France, Poland and Sweden.40
35 Ministry of Transport NZ (2015), Drink-drive Sanctions Review Report, https://goo.gl/5Lw9z2 36 Schulze, H., et al, (2012), Driving Under the Influence of Drugs, Alcohol and Medicines in Europe – findings from
the DRUID project, https://goo.gl/o5Q8o7 37 Meesmann, U. & Rossi, M. (2015), Drinking and driving: learning from good practices abroad, https://goo.gl/hQZ8b8 38 ETSC (2016) Alcohol Interlocks and Drink Driving Rehabilitation in the EU https://goo.gl/aqGEpM 39 ibid 40 ETSC (2017) Alcohol Interlocks in the EU https://goo.gl/qq8vMY

Progress in reducing drink driving in Europe | 21
ALCOHOL INTERLOCKS AND DRINK DRIVING
REHABILITATION IN THE EUROPEAN UNION
SMARTSOBER MOBILITY ACROSS ROAD TRANSPORT
Best practice and guidelines for Member States
An alcohol interlock programme should not be limited to just the installation of the interlock device itself but rather designed as a coordinated set of activities designed to minimise the possibility that programme participants drive after drinking.41
Countries that want to introduce alcohol interlock programmes should, as a minimum, ensure that the interlock devices selected meet the CENELEC standards. Strong enforcement is a key requirement of successful alcohol interlock programmes for drink driving offenders. A clear code on the driving license for participants of the alcohol interlock programme makes it easier for police officers to detect misuse while checking the driving license. The harmonised code in Europe is now represented by the number 69, making it easier for police to enforce the requirements across EU borders.42
For more information and ETSC recommendations on alcohol interlocks see the ETSC SMART report (2016): Alcohol interlocks and drink driving rehabilitation in the European Union. Best practice and guidelines for Member States. The report is available at http://etsc.eu/projects/smart/
A study commissioned by the European Commission’s DG MOVE and published in 2014 concluded that alcohol interlocks can offer effective and cost-beneficial improvement to road safety in Europe, particularly for offender and commercial vehicle populations.43 The report said that if in the future the devices would become less intrusive and costs came down due to economies of scale in production or technological development the option of making an alcohol interlock a compulsory device in all passenger cars could show a “robust net benefit to society”.
The European Parliament also commissioned a study published in 2014 on the same topic. It includes recommendations calling for the adoption of a legislation within five years to extend the mandatory use of alcohol interlocks as part of rehabilitation programmes targeting certain categories of users, and as a preventive measure in specific categories of commercial vehicles.44
The revised general safety regulation expected in 2018 should allow for a standardised installation document to enable alcohol interlock devices to be easily installed in all kinds of new car and also allow for a standardised electrical interface connection between the alcohol interlock and the vehicle to be made mandatory in the future.45
3.6 Education and campaigns
Publicity campaigns using mass media are intended to change attitudes and behaviour. This can be done either by raising awareness of the dangers of drink driving, by raising the likelihood of being detected and punished for drink driving, by informing drivers about the social norm, or by promoting strategies to avoid drink driving.
The effect of publicity campaigns can be increased when a study is conducted on how to address the target group, and when the public campaign is supported by other measures such as enforcement and education.
41 ETSC (2016) Alcohol Interlocks and Drink Driving Rehabilitation in the EU https://goo.gl/aqGEpM 42 ibid 43 ECORYS ( 2014), Study on the prevention of drink-driving by the use of alcohol interlock devices https://goo.gl/U8kBvU 44 Martino, A., Sitran, A., & Rosa, C. (2014) Tehnical development and deployment of alcohol interlocks in road
safety policy https://goo.gl/MV1spU45 ETSC Position Paper (2017) Revision of the General Safety Regulation 2009/661 https://goo.gl/PXpg6j

22 | Progress in reducing drink driving in Europe Progress in reducing drink driving in Europe | 23
The impact of drink drive campaignsAn econometric analysis commissioned by the UK Department for Transport undertaken by THINK! in 2012 concluded that 30 years of drink drive communication campaigns have saved almost 2,000 lives, prevented over 10,000 serious injuries and created a value to society of £3bn. This was achieved through influencing three key factors: attitudes - particularly understanding of risks, norms – perception of what others think of drink-driving and drink driver image.46
The ‘BOB’ campaign is a recurrent annual campaign started in Belgium in 1995. One of the main principles of the ‘BOB’ campaign is combining the prevention message with visible enforcement, with a section about awareness and another about police patrols and checks. The basic assumption is that an increased ‘chance of arrest’ results in a fall in the number of people driving under the influence of alcohol. The campaign was developed by the Belgian Road Safety Institute (now VIAS) in conjunction with the Belgian Brewers. In its original meaning ‘BOB’ stood for ‘the person who doesn’t drink if he/she is driving’. He or she represents the designated driver who stays sober so that he/she can take the other passengers travelling in the vehicle home safely.47
46 Bullmore, J., Watkins, S., (2012) Department for Transport: how thirty years of drink drive communications saved almost 2000 lives https://goo.gl/mMihu5
47 VIAS (2017) BOB celebrates its 22nd birthday https://goo.gl/QYAzP6
Progress in reducing drink driving in Europe | 23
4.1 Recommendations to Member States
Allow for the testing of drink driving in all police roadside checks and introduce roadside evidential breath testing procedures.
Consider adopting a zero tolerance level for drink driving (i.e. a maximum BAC of 0.2g/l).
Intensify enforcement of drink driving laws by setting targets for minimum levels of alcohol checks of the motorist population, e.g. 1 in 5 motorists should be checked each year. Couple enforcement with publicity activities.
Develop use of alcohol interlocks as part of the rehabilitation programmes for first time high-level and recidivists offenders.
Mandate the use of alcohol interlocks for repeat offenders and professional drivers.
Collect the annual number of drink driving checks and those which were positive.
Organise regular nationwide campaigns to raise the public’s understanding that drinking and driving is very dangerous.
4.2 Recommendations to EU institutions
Include best practice guidelines on drink driving enforcement and sanctions to encourage Member States to achieve high standards on enforcement methods and practices and a greater convergence of road-safety-related road traffic rules, building on the EC Recommendation on Enforcement in the field of Road Safety.48
Mandate the CENELEC standards for alcohol interlocks in Europe which ensure that vehicle interfaces make it possible to fit an alcohol interlock.
As a first step towards wider use of alcohol interlocks, legislate their use for repeat offenders and professional drivers.
48 Official Journal of the European Union (2004) Commission Recommendation on enforcement in the field of road safety https://goo.gl/HuJBru
PART IVRECOMMENDATIONS
24 | Progress in reducing drink driving in Europe Progress in reducing drink driving in Europe | 25
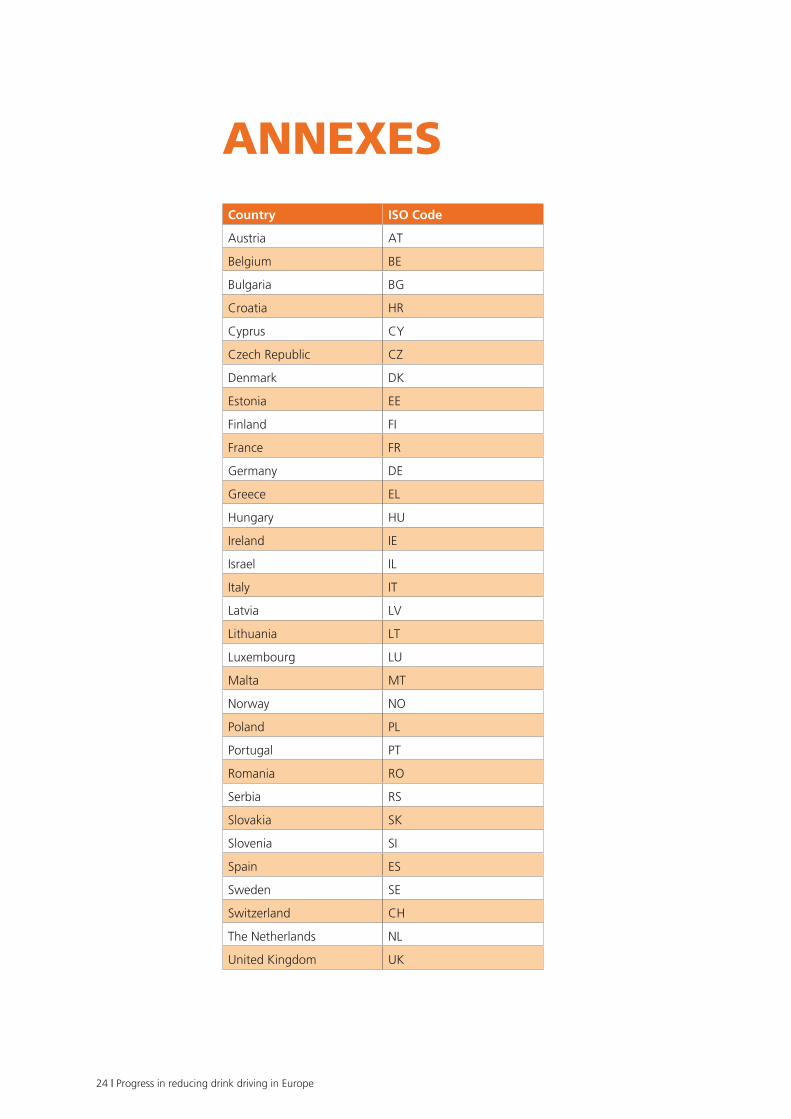
ANNEXESCountry ISO Code
Austria AT
Belgium BE
Bulgaria BG
Croatia HR
Cyprus CY
Czech Republic CZ
Denmark DK
Estonia EE
Finland FI
France FR
Germany DE
Greece EL
Hungary HU
Ireland IE
Israel IL
Italy IT
Latvia LV
Lithuania LT
Luxembourg LU
Malta MT
Norway NO
Poland PL
Portugal PT
Romania RO
Serbia RS
Slovakia SK
Slovenia SI
Spain ES
Sweden SE
Switzerland CH
The Netherlands NL
United Kingdom UK

Progress in reducing drink driving in Europe | 25
Table 1 (Fig.2,3). Total number of road deaths over the period 2006-2016.
Source: national statistics provided by the PIN panellists for each country. * FI, EL, LT, SK - provisional data for 2016.**IE - provisional data for 2015-2016.***EE - provisional data for 2010-2016.(1) ES, SE - data refer to the total number of killed drivers.(2) PT - increases in Portugal 2010 and 2011 are partly due to change in reporting methods. Like Spain prior to 2010 the number of people
killed are people killed on the spot multiplied by a coefficient of 1.14. Since 2010 Portugal is able to collect deaths according to the EU common definition of any person killed immediately or dying within 30 days as a result of an injury accident. The number of people killed in 2010 would have been 845 in 2010, 785 in 2011 and 653 in 2012 using the old methodology.
2006 2007 2008 2009 2010 2011 2012 2013 2014 2015 2016
AT 730 691 679 633 552 523 531 455 430 479 432
BE 1,073 1,071 944 943 841 862 770 724 727 732 637
BG 1,043 1,006 1,061 901 776 656 601 601 651 708 708
CY 86 89 82 71 60 71 51 44 45 57 46
CZ 1,063 1,222 1,076 901 802 773 742 654 688 737 611
DE 5,091 4,949 4,477 4,152 3,651 4,009 3,601 3,340 3,368 3,459 3,206
DK 306 406 406 303 255 220 167 191 183 178 211
EE*** 204 196 132 100 79 101 87 81 78 67 71
ES(1) 1,360 1,259 975 923 855 702 615 557 614 638 n/a
FI* 336 380 344 279 272 292 255 258 229 270 256
FR 4,709 4,620 4,275 4,273 3,992 3,963 3,653 3,268 3,384 3,461 3,477
EL* 1,657 1,612 1,553 1,456 1,258 1,141 988 879 795 793 819
HR 614 619 664 548 426 418 393 368 308 348 307
HU 1,303 1,232 996 822 740 638 605 591 626 644 607
IE** 365 338 279 238 212 186 163 188 193 162 186
IT 5,669 5,131 4,725 4,237 4,114 3,860 3,753 3,401 3,381 3,428 3,283
LU 43 45 35 48 32 33 34 45 35 36 32
LV 407 419 316 254 218 179 177 179 212 188 158
LT* 760 740 499 370 299 297 302 258 267 242 188
MT 10 14 15 21 15 17 9 18 10 11 22
NL 811 791 750 720 640 661 650 570 570 620 629
PL 5,243 5,583 5,437 4,572 3,907 4,189 3,571 3,357 3,202 2,938 3,026
PT(2) 969 974 885 840 937 891 718 637 638 593 563
RO 2,587 2,800 3,065 2,797 2,377 2,018 2,042 1,861 1,818 1,893 1,913
SE(1) 198 200 179 163 118 100 100 101 85 106 100
SI 262 293 214 171 138 141 130 125 108 120 130
SK* 579 627 558 347 345 324 296 223 258 259 242
UK 3,300 3,056 2,718 2,337 1,905 1,960 1,802 1,769 1,854 1,804 1,860
GB 3,172 2,946 2,538 2,222 1,850 1,901 1,754 1,713 1,775 1,730 1,792
CH 370 384 357 349 327 320 339 269 243 253 216
IL 405 382 412 314 352 341 263 277 279 322 335
NO 242 233 255 212 210 168 145 187 147 117 135
RS 911 968 905 809 660 731 688 650 536 599 607
EU25 34,002 34,134 31,534 28,207 24,695 24,398 22,278 20,631 20,649 20,865 19,784

26 | Progress in reducing drink driving in Europe Progress in reducing drink driving in Europe | 27
Table 2 (Fig.3). Officially-reported road deaths attributed to drink driving over the period 2006-2016
2006 2007 2008 2009 2010 2011 2012 2013 2014 2015 2016 Difference between the average annual change (%)
in the number of road deaths attributed to alcohol and the corresponding reduction for
other road deaths over the 2006-2016 period.
AT(1) 55 54 52 46 32 51 39 31 32 27 22 IL -11.7%
BE(9) 54 60 54 55 49 46 46 35 n/a n/a 35 BG -11.6%
BG 40 44 47 38 25 28 29 18 13 10 7 EE -10.0%
CY 15 16 19 19 26 25 19 9 13 12 8 LV -8.4%
CZ(8) 48 41 85 127 108 100 50 56 68 72 58 BE -7.9%
DE 599 565 523 440 342 400 338 314 260 256 225 NL -7.4%
DK 73 112 93 75 64 53 24 41 37 27 30 DK -6.4%
EE 61 81 42 33 16 21 18 22 15 16 7 DE -5.4%
ES* 364 336 273 277 265 230 216 161 161 184 n/a SI -3.6%
FI(2) 88 91 96 68 64 74 43 57 41 57 61 GB -3.5% 2006-2015
FR(1) 1,384 1,358 1,206 1,282 1,230 1,220 1,130 952 958 1,057 1,009 FI -3.2%
EL 132 149 116 132 88 101 100 94 76 71 n/a AT -2.9%
HR 223 219 224 187 152 151 147 96 85 115 99 CZ -2.5% 2008-2016
HU 175 161 111 81 61 57 52 49 47 80 76 HR -2.4%
IE(3) 67 48 71 75 96 66 58 36 42 n/a n/a HU -1.9%
LU(5) 9 5 4 5 11 11 9 8 6 10 4 PL -0.5%
LV 84 91 58 36 22 26 25 10 29 18 17 CH -0.2%
LT 66 74 50 40 32 24 41 32 49 17 16 SE -0.1%
NL 22 28 25 27 18 14 16 19 12 9 9 FR 0.1%
PL 390 461 470 357 271 325 305 292 259 234 198 PT 0.1% 2010-2016
PT(6) n/a n/a n/a n/a 242 228 193 168 140 142 163 CY 0.6%
RO 211 223 267 222 194 164 224 166 181 174 160 LT 0.8%
SE 46 48 37 41 17 18 24 19 16 26 24 ES 1.0% 2006-2015
SI 97 104 76 59 49 35 43 38 25 37 41 RO 1.6%
SK 49 30 24 36 26 37 32 23 38 35 40 EL 2.2% 2006-2015
GB* 560 410 400 380 240 240 230 240 240 200 n/a SK 11.0%
CH 58 55 58 56 63 53 57 48 29 38 37
IL 28 33 31 19 14 7 8 9 5 12 10
RS(7) 46 55 65 77 44 60 77 64 51 65 103
IL
IT(4) 156 189 204 n/a
MT n/a
NO 35 44 65 42 40 n/a
UK n/a
EU25 4,912 4,809 4,423 4,138 3,498 3,517 3,258 2,818 2,703 2,744 2,146
EU25: EU28 average excluding IT, PT, MT as data were not available in these countries for the entire time seriesSource: National statistics provided by the PIN panellists for each country using each country’s own method of identifying alcohol related deaths. See Table 3 Country definition of road deaths attributed to alcohol.(1) AT, FR Data for 2016 extracted by ETSC from national statistics.(2) FI - provisional data for 2016.(3) IE - data from 2008 to 2012 comply with the definition provided in Table 3. These data source is a Pre-crash report “Alcohol as a contributory factor in fatal collisions”
(2016). The data from 2003 to 2007 are not comparable to 2008-2012 data. (4) IT - The Carabinieri and National Police, who collect about one third of all road collisions with injuries, have made available some data for 2015 showing that out of
58,981 collisions with injuries, 5876 (or 10%) involved at least one of the drivers of the vehicles under the influence. (5) LU - The 2011-2014 values refer to the number of fatal collisions. The number of road deaths is not available. (6) PT- data from forensic post-mortem tests of drivers, passengers and pedestrians killed on the spot. (7) RS - all road deaths where at least one of the drivers was under the influence of the alcohol above permitted limits prescribed by law (more than 0.3 mg/ml). Since 2016,
Serbia is collecting data on drink driving according to the EU guidelines on the Common Accident and Injury Database (CaDas).(8) CZ -the annual average reduction refers to 2008-2016; in 2008 a substantial change of methodology of drink-driving determination took place and previous data is not
comparable. (9) BE - the annual average reduction calculation excludes 2014 and 2015, due to unreliable data.

Progress in reducing drink driving in Europe | 27
National definition of deaths attributed to drink driving if different to the SafetyNet recommended definition
AT SafetyNet recommended definition. However killed and unconscious road users are not tested for alcohol unless the prosecutor requires it.
BE Any death occurring as a result of road accident in which any active participant was found with blood alcohol level above the legal limit (active participants who refuse to be tested are considered to have an illegal blood alcohol level).
BG Guilty driver/other participant under influence of alcohol.
CY SafetyNet recommended definition.
CZ SafetyNet recommended definition.
DE SafetyNet recommended definition. However, drivers killed on the spot might not be tested.
DK SafetyNet recommended definition.
EE Deaths occurring as a result of a road collision in which at least one motor-vehicle driver was found with blood alcohol level above 0.2g/l.
ES Killed car drivers who tested more than 0.3 g/l in post-mortem blood alcohol tests.
FI Fatal accidents where the driver of motor vehicle participant has had blood alcohol level above 0.5g/l or 220 microgrammes of alcohol per litre of breath.
FR SafetyNet recommended definition.
EL Deaths in collisions where a driver was found with blood alcohol level above the legal limit. In practice, however, the Police is not systematically testing drivers for alcohol.
HR SafetyNet recommended definition. However, drivers or other killed persons on the spot might not be tested.
HU Killed car drivers who tested positive in post-mortem blood alcohol tests. Drivers are only tested if they are assumed to be responsible for the collision.
IE For the figures provided in Table 2 the definition for a death attributed to drink driving is: a fatality that occurred where it was confirmed that a road user involved in a fatal collision had consumed alcohol. Alcohol consumption is based on a confirmed BAC of >20mg/100ml or equivalent in urine/breath. In the case of the pre-crash study, alcohol consumption is also based on Garda opinion or witness statements/other strong evidence in the file.
IT SafetyNet recommended definition. In practice, it seems however that deaths are often attributed to drink driving only when alcohol is considered by the Police officer to be the unique contributory factor of the fatal accident.
LU From 2001 to 2009: killed persons of accidents where the police suspected the presence of alcohol. As from 2010 on we use SafetyNet recommended definition.
LV Deaths occurring as a result of road accident in which at least one driver (excluding moped riders and cyclists) was found with blood alcohol level above the legal limit (0.2 g/l for novice drivers, 0.5g/l for all other drivers).
LT Deaths occurring as a result of a road collision in which at least one driver was found with blood alcohol level above the legal limit (0.2 g/l for novice and professional drivers, 0.4 g/l for all other drivers).
MT n/a
NL Drivers killed on the spot might not be tested.
PL SafetyNet recommended definition.
PT SafetyNet recommended definition. However, the official definition is not applied in practice. The road deaths attributed to drink driving refer to the number of drivers, pedestrians and passengers fatally injured on the spot. It may happen that deceased passengers above the alcohol limit were not involved in an accident attributable to drink driving.
RO Killed people tested for alcohol. Testing might only occur when the Police suspects the presence of alcohol (legal limit is 0.0g/l).
SE Killed car drivers who tested positive (BAC > 0.2) in post-mortem blood alcohol tests.
SI Deaths occurring as a result of a road traffic accident in which a couser of the traffic accident was found with blood alcohol level above 0.5g/l.
SK Killed people in fatal collision where alcohol was considered by the Police officer to be one of the main contributing factor.
UK n/a
GB People killed in a collision where one or more of the motor vehicle drivers or riders involved either refused to give a breath test specimen when requested to do so by the police (other than when incapable of doing so for medical reasons), or one of the following: a) failed a roadside breath test by registering over 0.35g/l of alcohol in their breath. b) died and was subsequently found to have more than 0.8g/l of alcohol in their blood.
CH SafetyNet recommended definition.
IL SafetyNet recommended definition.
NO n/a
RS There is no national definition of deaths attributed to drink driving. Serbia is working to improve the data collection of drink driving collisions according to the EU guidelines on the Common Accident and Injury Database (CaDas).
Table 3. National definitions of deaths attributed to drink driving. SafetyNet recommended definition: Any death occurring as a result of road accident in which any active participant was found with blood alcohol level above the legal limit.

Progress in reducing drink driving in Europe | 28
European Transport Safety Council
20 Avenue des CeltesB-1040 [email protected]: +32 2 230 4106www.etsc.eu/smart
@ETSC_EU
Gra
ph
ic D
esig
n: m
azo
ut.
nu