progress & challenges in plasmon- enhanced photocatalysis ... · progress & challenges in...
TRANSCRIPT
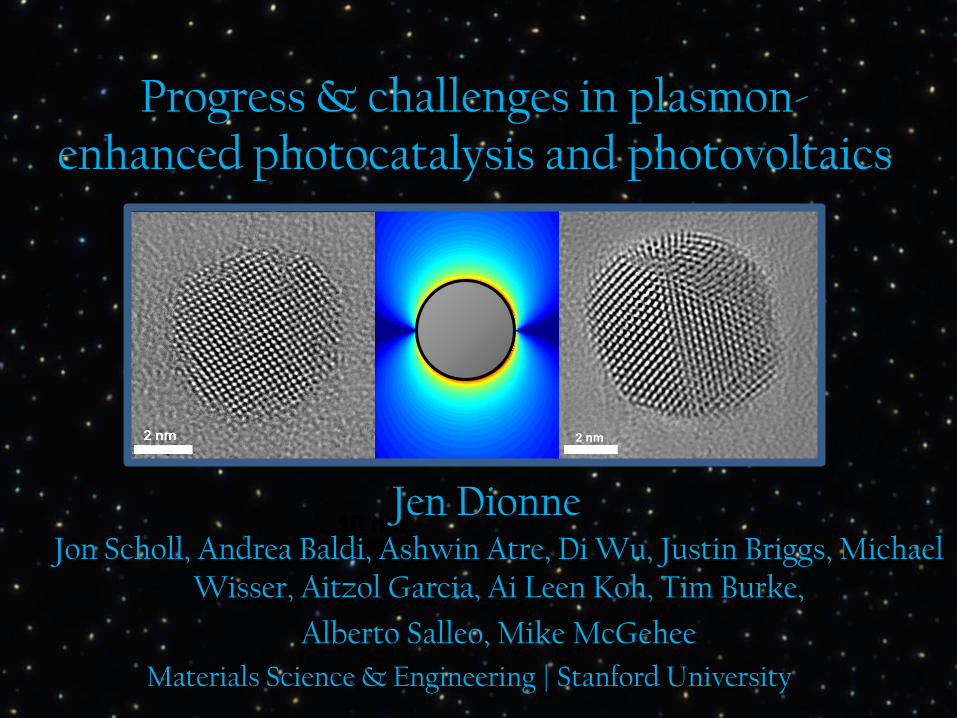
Jen Dionne
Materials Science & Engineering | Stanford University
Progress & challenges in plasmon-enhanced photocatalysis and photovoltaics
Jon Scholl, Andrea Baldi, Ashwin Atre, Di Wu, Justin Briggs, Michael Wisser, Aitzol Garcia, Ai Leen Koh, Tim Burke,
Alberto Salleo, Mike McGehee

Oh the places plasmons go!
Jen Dionne
Materials Science & Engineering | Stanford University
Jon Scholl, Andrea Baldi, Ashwin Atre, Di Wu, Justin Briggs, Michael Wisser, Aitzol Garcia, Ai Leen Koh, Tim Burke,
Alberto Salleo, Mike McGehee
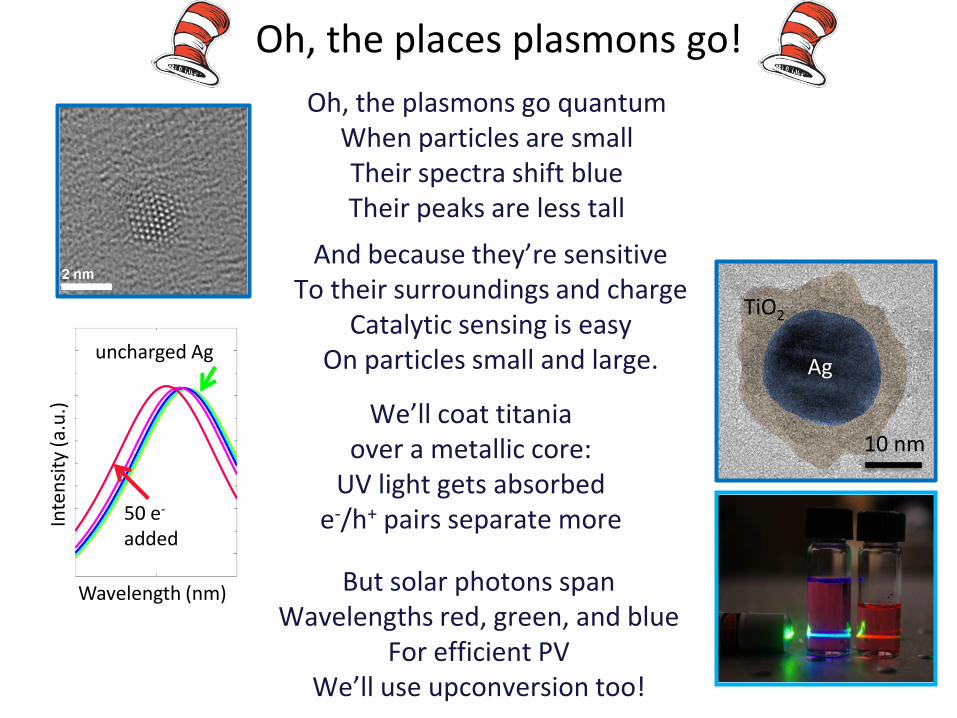
Oh, the plasmons go quantum When particles are small Their spectra shift blue Their peaks are less tall
But solar photons span Wavelengths red, green, and blue
For efficient PV We’ll use upconversion too!
And because they’re sensitive To their surroundings and charge
Catalytic sensing is easy On particles small and large.
Oh, the places plasmons go!
10 nm
Ag
TiO2
Wavelength (nm)
Inte
nsi
ty (
a.u
.)
50 e- added
uncharged Ag
We’ll coat titania over a metallic core:
UV light gets absorbed e-/h+ pairs separate more
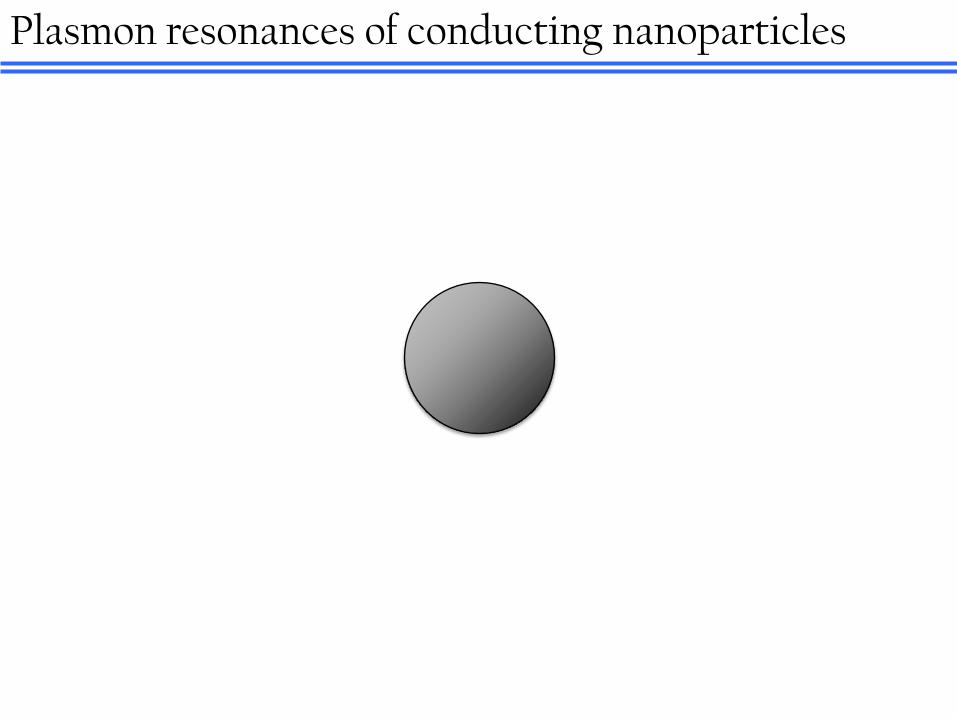
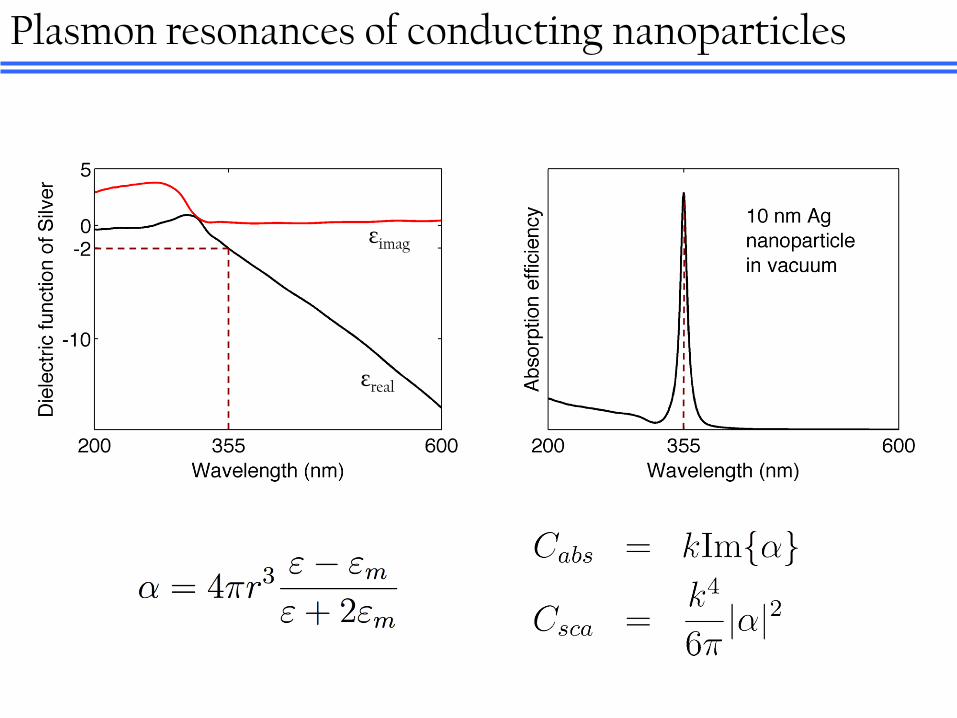
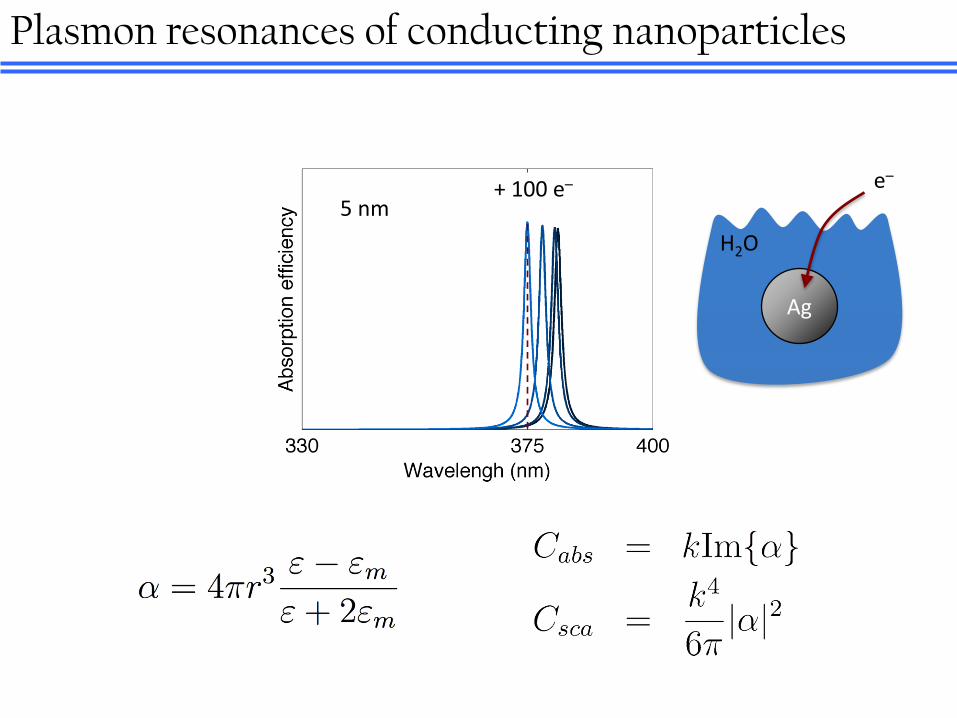
Plasmon resonances of conducting nanoparticles
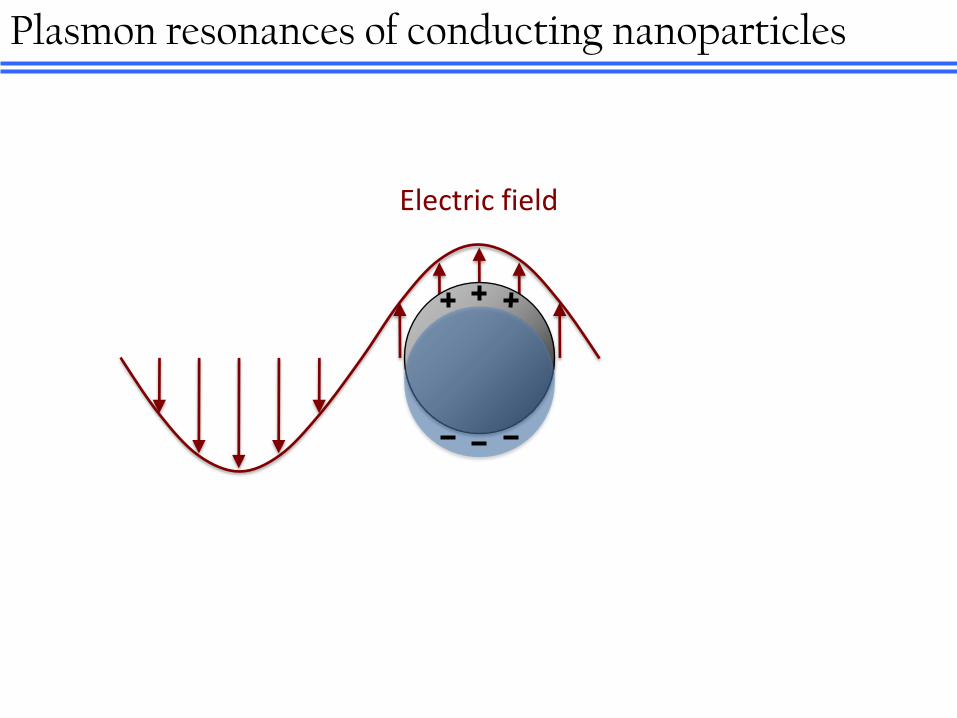
Electric field
Plasmon resonances of conducting nanoparticles

r
Plasmon resonances of conducting nanoparticles
r
Plasmon resonances of conducting nanoparticles
εimag
εreal

50 nm 10 nm
Ag
Plasmon resonances of conducting nanoparticles
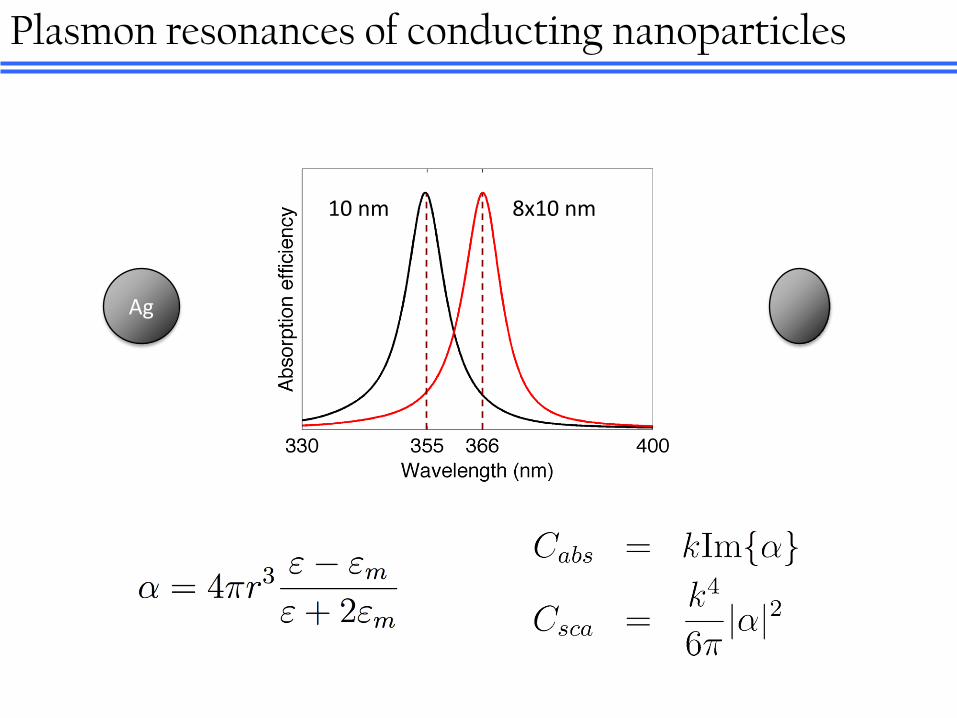
8x10 nm 10 nm
Ag
Plasmon resonances of conducting nanoparticles
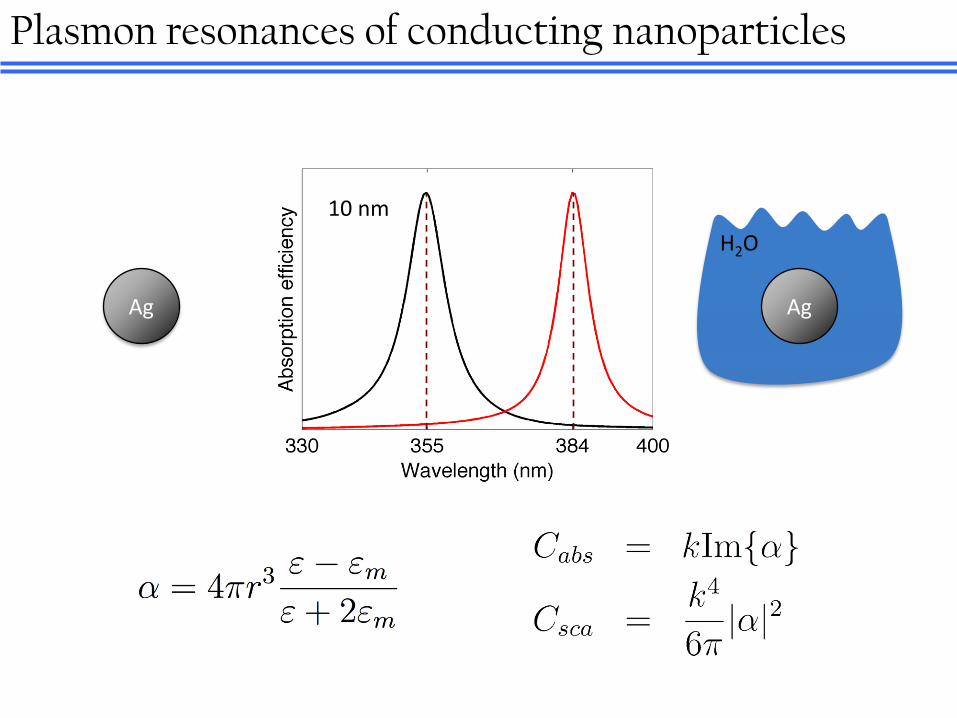
H2O
Ag Ag
10 nm
Plasmon resonances of conducting nanoparticles
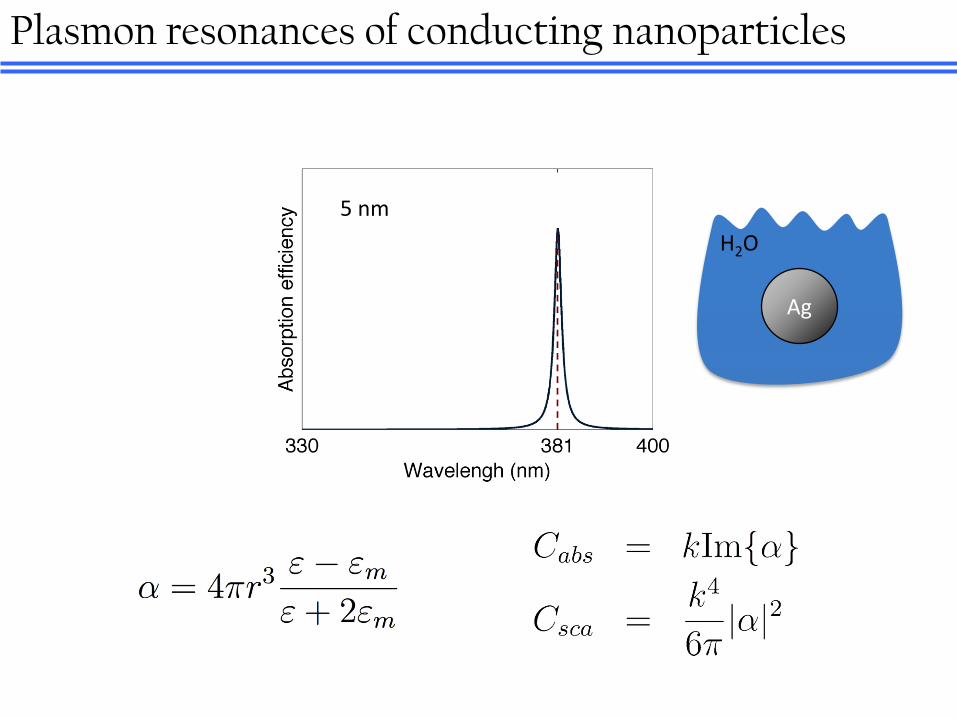
5 nm
H2O
Ag
Plasmon resonances of conducting nanoparticles

5 nm
H2O
Ag
+ 50 e– e–
Plasmon resonances of conducting nanoparticles
5 nm
H2O
Ag
+ 100 e– e–
Plasmon resonances of conducting nanoparticles

5 nm
H2O
Ag
+ 200 e– e–
Plasmon resonances of conducting nanoparticles

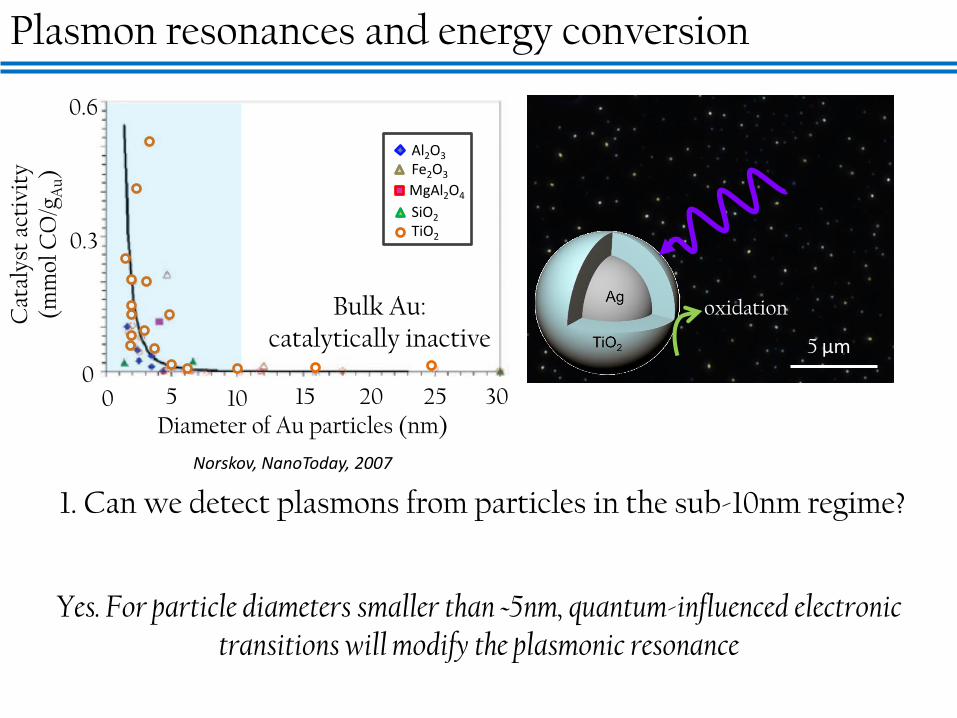
Plasmon resonances and energy conversion
“Hot” electrons
e–
Au Si
EF
EC
EV
S
A
Near-field enhancement
Thomann, Brongersma, Nano Lett. (2011)
Reaction Sensors
Tang, Liu, Dionne, Alivisatos, JACS (2011)
100 nm
50 nm
Knight, Halas, Science (2011)
100 nm
50 nm
Au
Pd
830,000 e-
Novo et al., Nature Nanotech 3(10) 2008
Au
Scat
tere
d in
ten
sity
Wavelength
PdH
100 nm Peak
wav
elen
gth
Reaction time (min)
Pd
D- D+e-
Au
Au

Plasmon resonances and energy conversion C
atal
yst
acti
vity
(m
mol
CO
/gA
u)
Bulk Au: catalytically inactive
0 5 10 15 20 25 30
0.3
0
0.6
MgAl2O4
Al2O3
Fe2O3
SiO2
TiO2
Norskov, NanoToday, 2007
1. Can we detect plasmons from particles in the sub-10nm regime?
2. Can we use these plasmons to monitor photocatalytic reactions in-situ?
3. Can we improve below-bandgap absorption of solar photons for photocatalysis & (photovoltaics)
Diameter of Au particles (nm)
oxidation
5 μm
20 nm
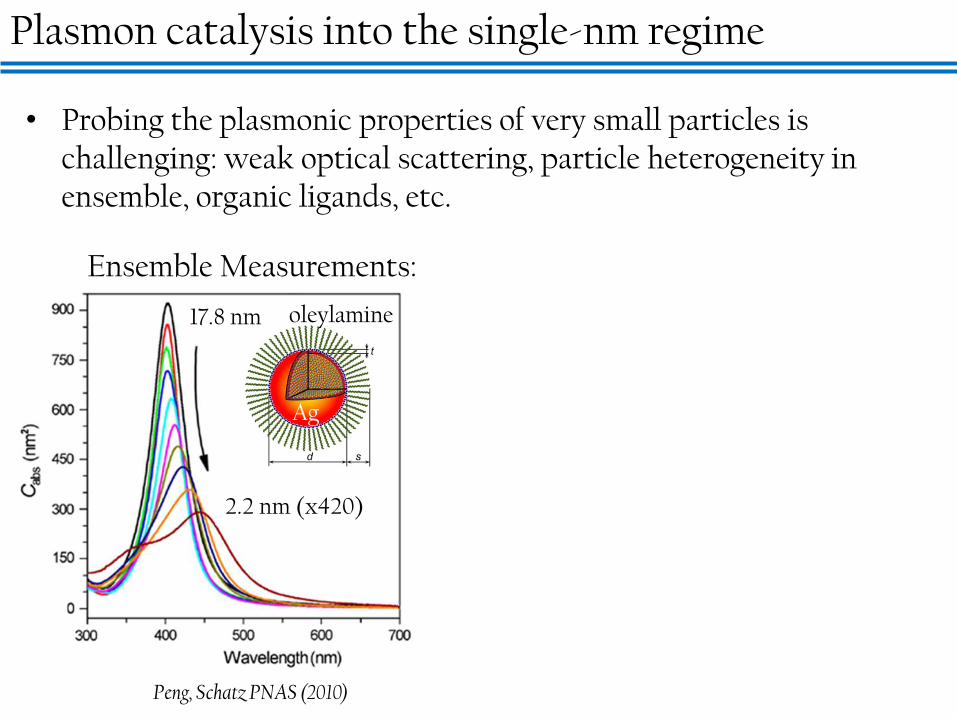
• Probing the plasmonic properties of very small particles is challenging: weak optical scattering, particle heterogeneity in ensemble, organic ligands, etc.
Peng, Schatz PNAS (2010)
17.8 nm
2.2 nm (x420)
Ensemble Measurements:
Plasmon catalysis into the single-nm regime
oleylamine
Ag

20 nm
Diameter D=
D=
D=
Lindfors, Sandoghdar, PRL (2004) Peng, Schatz PNAS (2010)
17.8 nm
2.2 nm (x420)
Ensemble Measurements: Single Particle Measurements:
• Probing the plasmonic properties of very small particles is challenging: weak optical scattering, particle heterogeneity in ensemble, organic ligands, etc.
Plasmon catalysis into the single-nm regime
oleylamine
Ag

Scanning Transmission Electron Microscopy (STEM) EELS has an imaging spatial resolution of ~0.25nm
Monochromated STEM Electron Beam
Sample on Thin Carbon Film
EEL Spectrometer Prism
CCD
Annular Dark Field Detector
Jon Scholl, Ai Leen Koh
Probing very small plasmonic particles: EELS

Organic-ligand-free synthesis minimizes organic contamination and the influence of ligand surface damping
Individual, organic-ligand-free nanoparticles
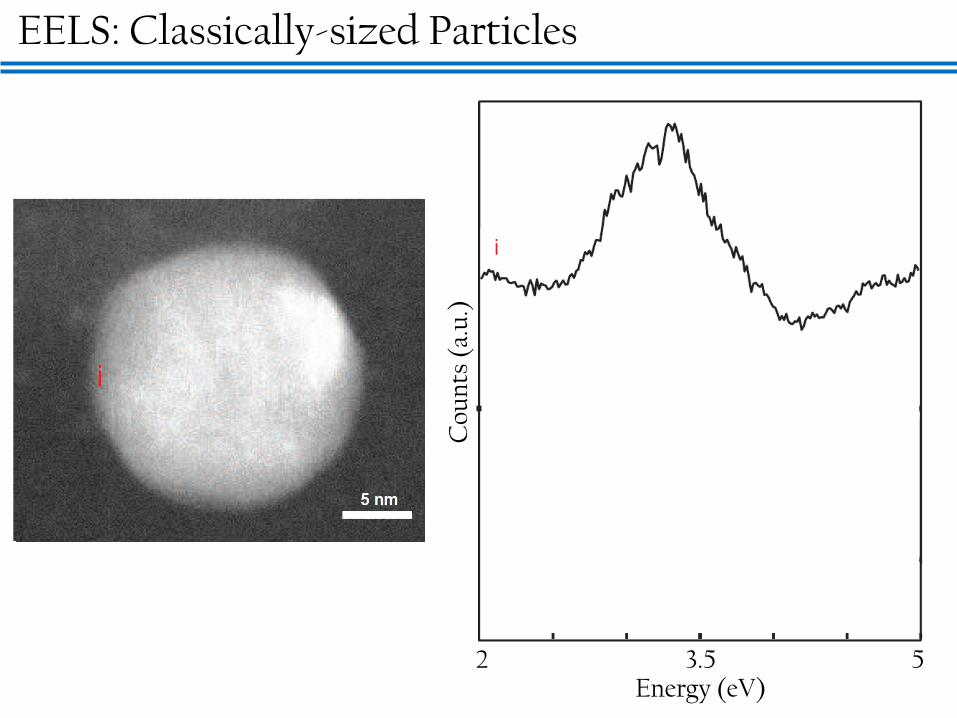
EELS: Classically-sized Particles
Energy (eV) 2 3.5 5
Cou
nts
(a.
u.)

Surface resonance
Energy (eV) 2 3.5 5
Cou
nts
(a.
u.)
EELS: Classically-sized Particles

Surface resonance
Energy (eV) 2 3.5 5
Cou
nts
(a.
u.)
EELS: Classically-sized Particles

Surface resonance
Bulk resonance
Energy (eV) 2 3.5 5
Cou
nts
(a.
u.)
EELS: Classically-sized Particles

Surface resonance
Bulk resonance
Energy (eV) 2 3.5 5
Cou
nts
(a.
u.)
EELS: Classically-sized Particles
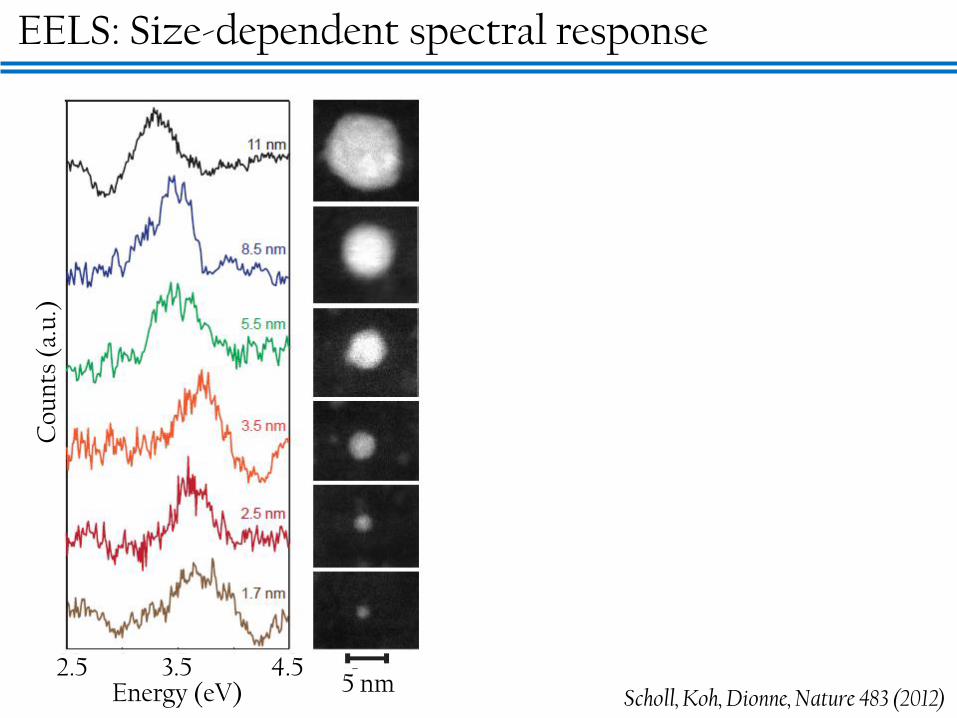
EELS: Size-dependent spectral response C
oun
ts (
a.u
.)
Energy (eV) 2.5 3.5 4.5
5 nm Scholl, Koh, Dionne, Nature 483 (2012)

EELS: Size-dependent spectral response C
oun
ts (
a.u
.)
Energy (eV) 2.5 3.5 4.5
5 nm
Par
ticl
e D
iam
eter
(n
m)
0
5
10
15
20
3 3.2 3.4 3.6 3.8 4 Peak Energy (eV)

EELS: Size-dependent spectral response C
oun
ts (
a.u
.)
Energy (eV) 2.5 3.5 4.5
5 nm
Par
ticl
e D
iam
eter
(n
m)
0
5
10
15
20
3 3.2 3.4 3.6 3.8 4 Peak Energy (eV)
Surface Bulk
3.7 3.9 4.1 Energy (eV)
Dia
met
er (
nm
)
5
20

• Classical treatment uses damping term:
• Accounts for peak broadening but predicts a red shift R
AvFBulk
Modeling the size-dependence of plasmons

• Classical treatment uses damping term:
• Accounts for peak broadening but predicts a red shift
• Instead, use a quantum approach:
R
AvFBulk
J. Garcia de Abajo, Nature 483 (2012)
Modeling the size-dependence of plasmons

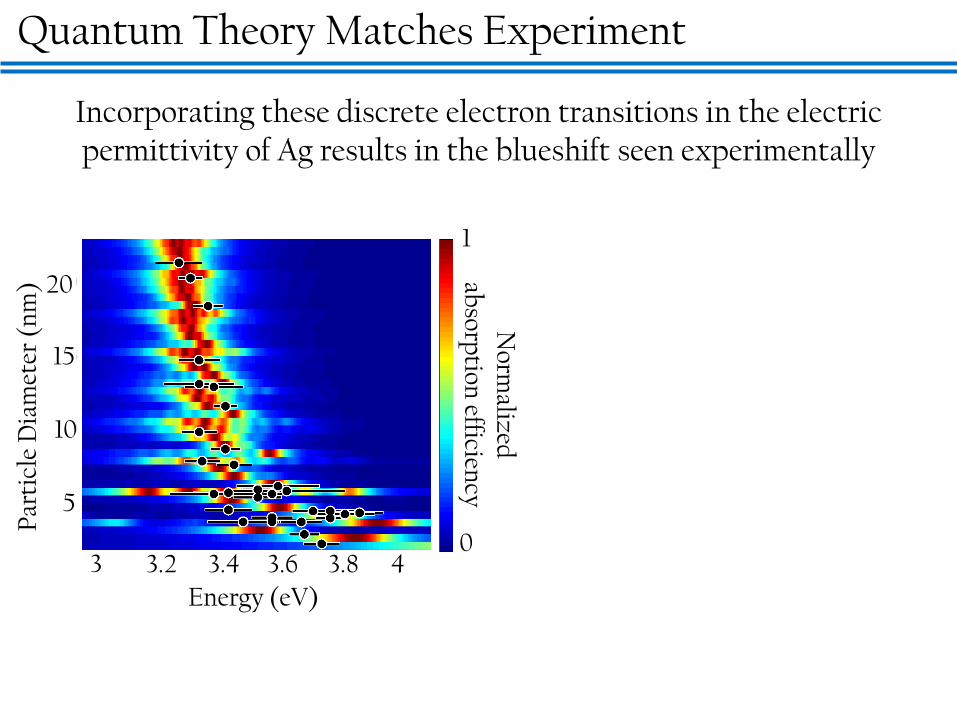
Quantum Theory Matches Experiment
Incorporating these discrete electron transitions in the electric permittivity of Ag results in the blueshift seen experimentally
Par
ticl
e D
iam
eter
(n
m)
5
10
15
20
3 3.2 3.4 3.6 3.8 4
Energy (eV)
Norm
alized
absorp
tion efficien
cy
0
1
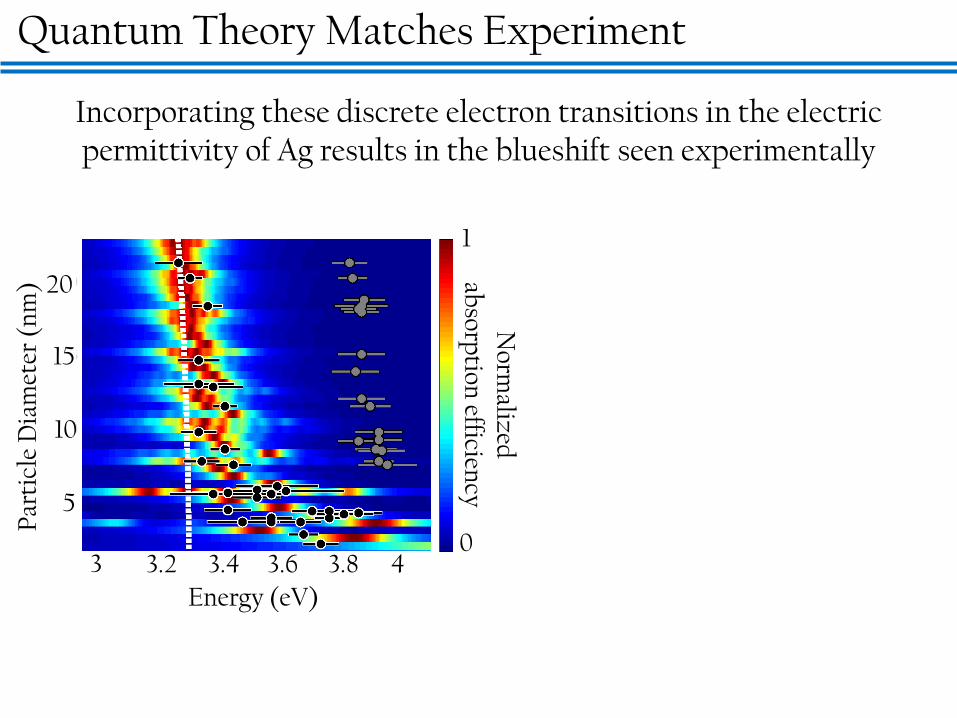
Quantum Theory Matches Experiment P
arti
cle
Dia
met
er (
nm
)
5
10
15
20
3 3.2 3.4 3.6 3.8 4
Energy (eV)
Norm
alized
absorp
tion efficien
cy
0
1
Incorporating these discrete electron transitions in the electric permittivity of Ag results in the blueshift seen experimentally

Quantum Theory Matches Experiment P
arti
cle
Dia
met
er (
nm
)
5
10
15
20
3 3.2 3.4 3.6 3.8 4
Energy (eV)
Norm
alized
absorp
tion efficien
cy
0
1
Incorporating these discrete electron transitions in the electric permittivity of Ag results in the blueshift seen experimentally
Quantum Theory Matches Experiment P
arti
cle
Dia
met
er (
nm
)
5
10
15
20
3 3.2 3.4 3.6 3.8 4
Energy (eV)
Norm
alized
absorp
tion efficien
cy
0
1
Incorporating these discrete electron transitions in the electric permittivity of Ag results in the blueshift seen experimentally

Quantum Theory Matches Experiment P
arti
cle
Dia
met
er (
nm
)
5
10
15
20
3 3.2 3.4 3.6 3.8 4
Energy (eV)
Norm
alized
absorp
tion efficien
cy
0
1
Incorporating these discrete electron transitions in the electric permittivity of Ag results in the blueshift seen experimentally

Scholl, Koh, Dionne, Nature 483 (2012)
DFT permittivity functions based on He & Zeng, JPCC. 2010
Quantum Theory Matches Experiment P
arti
cle
Dia
met
er (
nm
)
5
10
15
20
3 3.2 3.4 3.6 3.8 4
Energy (eV)
Par
ticl
e D
iam
eter
(n
m)
5
10
15
20
3 3.2 3.4 3.6 3.8 4
Energy (eV)
Norm
alized
absorp
tion efficien
cy
0
1 Analytic Ab-initio
Incorporating these discrete electron transitions in the electric permittivity of Ag results in the blueshift seen experimentally
Plasmon resonances and energy conversion C
atal
yst
acti
vity
(m
mol
CO
/gA
u)
Bulk Au: catalytically inactive
0 5 10 15 20 25 30
0.3
0
0.6
MgAl2O4
Al2O3
Fe2O3
SiO2
TiO2
Norskov, NanoToday, 2007
1. Can we detect plasmons from particles in the sub-10nm regime?
Diameter of Au particles (nm)
oxidation
5 μm
Yes. For particle diameters smaller than ~5nm, quantum-influenced electronic transitions will modify the plasmonic resonance

Plasmon resonances and energy conversion C
atal
yst
acti
vity
(m
mol
CO
/gA
u)
Bulk Au: catalytically inactive
0 5 10 15 20 25 30
0.3
0
0.6
MgAl2O4
Al2O3
Fe2O3
SiO2
TiO2
Norskov, NanoToday, 2007
1. Can we detect plasmons from particles in the sub-10nm regime?
2. Can we use these plasmons to monitor photocatalytic reactions in-situ?
Diameter of Au particles (nm)
oxidation
5 μm

Porous TiO2
IrO2nH2O
Youngblood et al., JACS (2009)
Case study: water-splitting photocatalysis

Porous TiO2
IrO2nH2O
H2O O2
Youngblood et al., JACS (2009)
Case study: water-splitting photocatalysis

1. Synthesis of well-dispersed Ag@TiO2 nanoparticles
2. Characterization of their photocatalytic activity in: Ensemble measurements Single particle measurements
Can small plasmonic particles help?
Ag TiO2
EtOH
EtOH
EF
V.B.
C.B.
Andrea Baldi
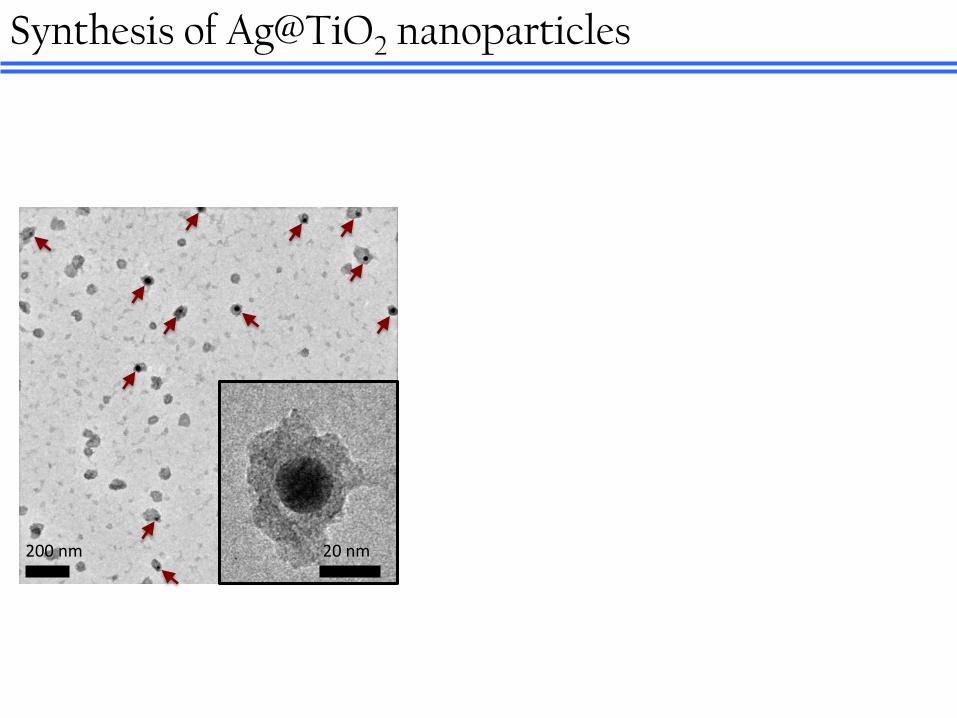
200 nm 20 nm
Synthesis of Ag@TiO2 nanoparticles

200 nm 20 nm
Synthesis of Ag@TiO2 nanoparticles
Ag

200 nm 20 nm
Synthesis of Ag@TiO2 nanoparticles
Ag Ag Ag Ag
TiO2

200 nm 20 nm
Synthesis of Ag@TiO2 nanoparticles
Ag Ag Ag Ag
TiO2

UV irradiation of de-aerated Ag@TiO2
Hg(Ne) lamp
Wavelength (nm)
254 313 365 436 405 19 nm
Ensemble Measurements
See also: Kamat et al., JACS (2005); ACS Nano (2011)

UV irradiation of de-aerated Ag@TiO2
19 nm
Ag TiO2
EtOH
EtOH
Ensemble Measurements
See also: Kamat et al., JACS (2005); ACS Nano (2011)

Discharge in O2
Ag TiO2
O2
O2–
Ensemble Measurements
See also: Kamat et al., JACS (2005); ACS Nano (2011)

Ensemble Measurements
See also: Kamat et al., JACS (2005); ACS Nano (2011)

A A A
Single Particle Optical Measurements
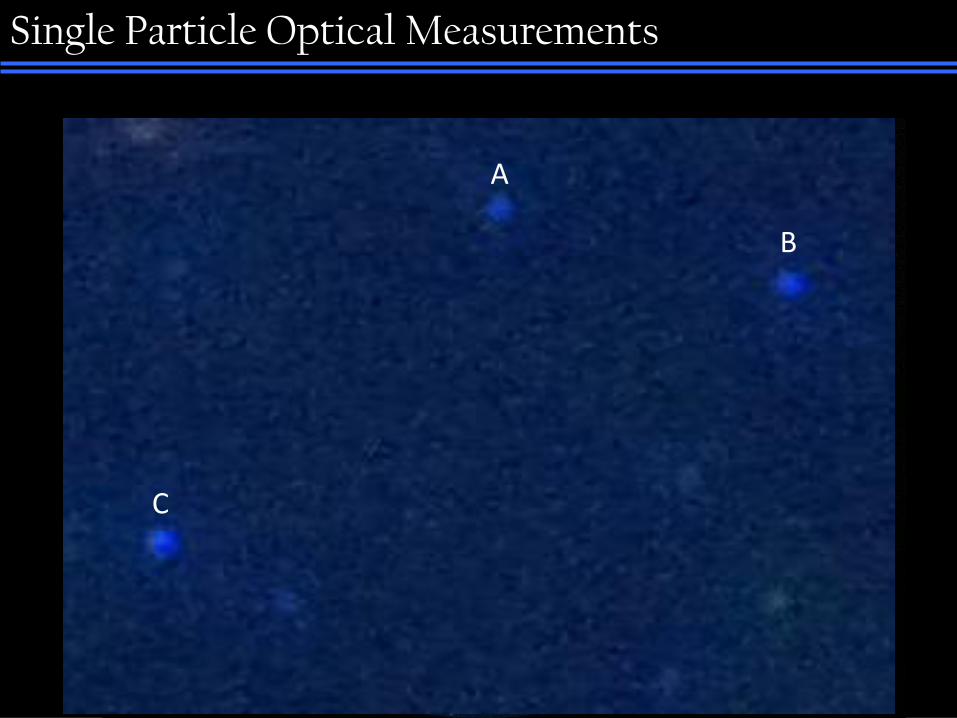
A
B
C
Single Particle Optical Measurements

Charge 0 min UV
Single Particle Optical Measurements

Charge 20 min UV
Single Particle Optical Measurements

Charge 40 min UV
Single Particle Optical Measurements
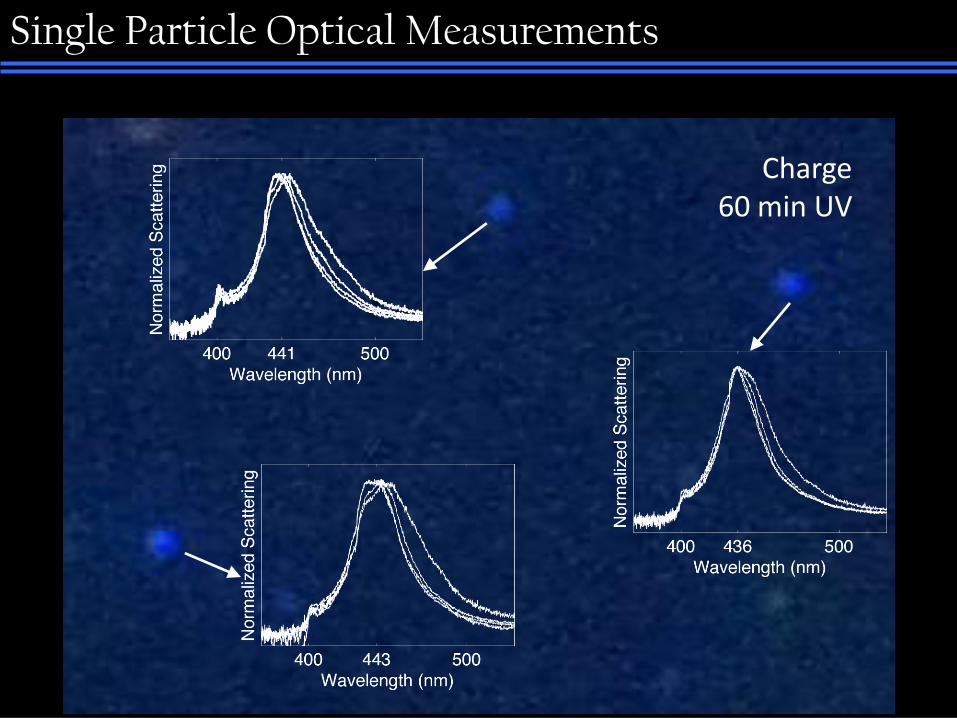
Charge 60 min UV
Single Particle Optical Measurements

Discharge 0 min O2
Single Particle Optical Measurements

Discharge 20 min O2
Single Particle Optical Measurements
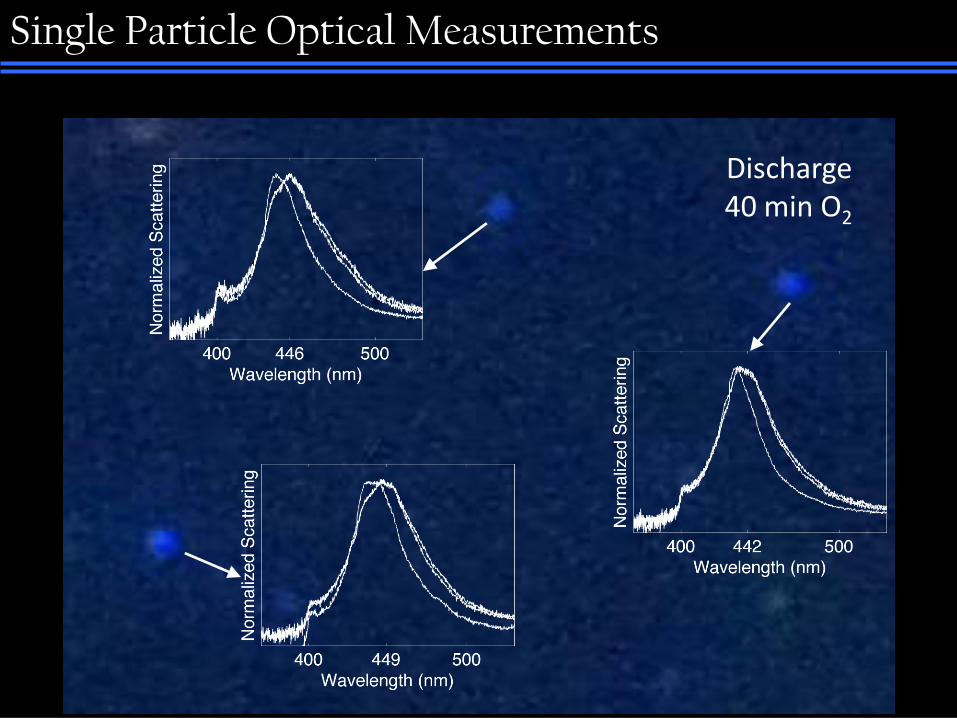
Discharge 40 min O2
Single Particle Optical Measurements

Discharge 60 min O2
Single Particle Optical Measurements

Discharge 80 min O2
Single Particle Optical Measurements

Ensemble Particle A Particle B Particle C
Single Particle Optical Measurements
Bars denote peak full-width at half maximum On-going: correlate single particle structure with catalytic activity

Plasmon resonances and energy conversion C
atal
yst
acti
vity
(m
mol
CO
/gA
u)
Bulk Au: catalytically inactive
0 5 10 15 20 25 30
0.3
0
0.6
MgAl2O4
Al2O3
Fe2O3
SiO2
TiO2
Norskov, NanoToday, 2007
Diameter of Au particles (nm)
oxidation
5 μm
Preliminary results are promising. It will be exciting to correlate catalyst size and shape with activity.
1. Can we detect plasmons from particles in the sub-10nm regime?
2. Can we use these plasmons to monitor photocatalytic reactions in-situ?

Plasmon resonances and energy conversion C
atal
yst
acti
vity
(m
mol
CO
/gA
u)
Bulk Au: catalytically inactive
0 5 10 15 20 25 30
0.3
0
0.6
MgAl2O4
Al2O3
Fe2O3
SiO2
TiO2
Norskov, NanoToday, 2007
Diameter of Au particles (nm)
oxidation
5 μm
1. Can we detect plasmons from particles in the sub-10nm regime?
2. Can we use these plasmons to monitor photocatalytic reactions in-situ?
3. Can we improve below-bandgap absorption of solar photons for photocatalysis & (photovoltaics)

5 % Ultraviolet 43 % Visible 52 % Infrared
Solar cell
30-50% of sun’s energy cannot be absorbed
Solar upconversion

5 % Ultraviolet 43 % Visible 52 % Infrared
Solar cell
30-50% of sun’s energy cannot be absorbed
Solar cell
Upconverter Insulator
Utilize low-energy transmitted photons
Solar upconversion

Modeling upconversion (UC) efficiencies
Trupke, et al. J. Appl. Phys. 92 (2002) Atre, Dionne. J. Appl. Phys. 115 2 (2011) &
1.0 2.0 2.5 1.5
Cell bandgap (eV) C
ell e
ffic
ien
cy (
%)
With upconverter
No upconverter
44
30
• Peak cell efficiency increases from 30% to 44% • Ideal cell bandgap blue-shifts from 1.1 eV to 1.8 eV • Challenges: UC absorption & emission efficiency, UC
absorption bandwidths , UC energy levels
Solar cell Upconverter
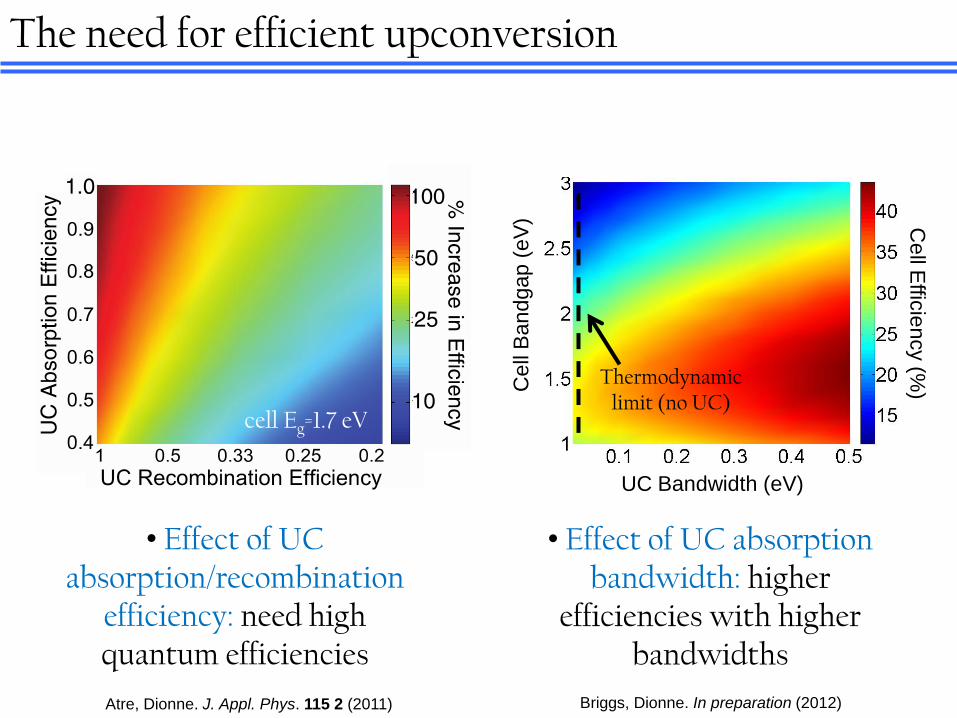
The need for efficient upconversion
• Effect of UC absorption bandwidth: higher
efficiencies with higher bandwidths
UC Bandwidth (eV)
Ce
ll B
an
dg
ap (
eV
) Ce
ll Effic
ien
cy (%
)
Thermodynamic limit (no UC)
cell Eg=1.7 eV
• Effect of UC absorption/recombination
efficiency: need high quantum efficiencies
Atre, Dionne. J. Appl. Phys. 115 2 (2011) Briggs, Dionne. In preparation (2012)

Two promising upconverting systems
Photos by Ashwin Atre; See also: Singh-Rachford, et al. JACS. 131 (2009)
Bimolecular systems Lanthanoid-doped nanoparticles
200 nm
Photos by Diane Wu; See also: Wang, Nature (2010)

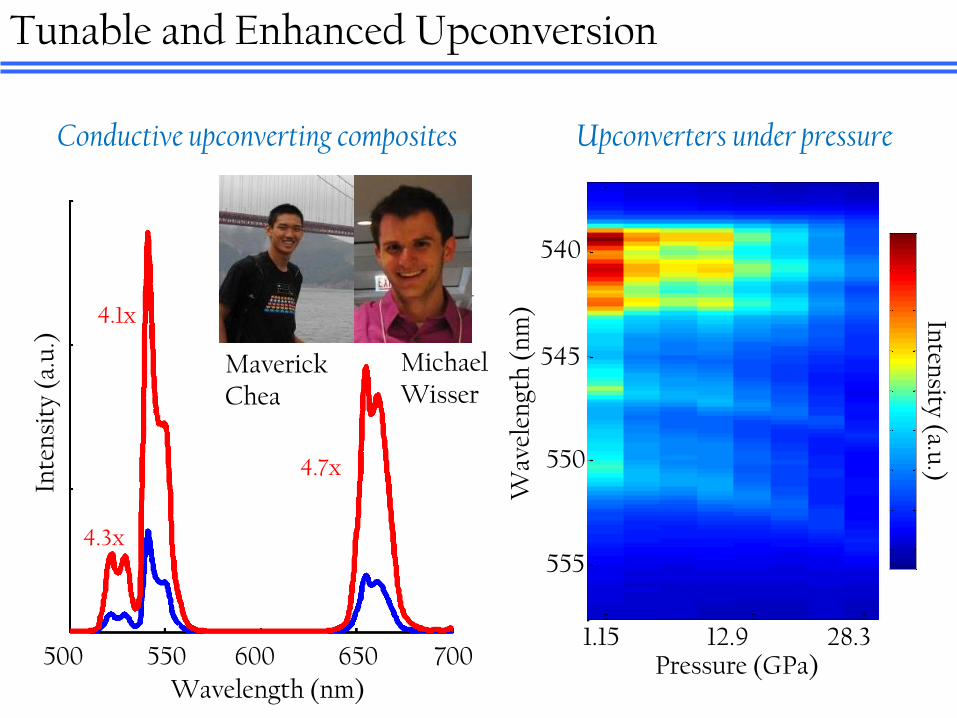
Tunable and Enhanced Upconversion
UC Film
Plasmon composite UC film (as conductive as ITO)
4.3x
Wavelength (nm)
500 550 600 650 700
Inte
nsi
ty (
a.u
.)
Conductive upconverting composites
Diane Wu
4.1x
4.7x
Tunable and Enhanced Upconversion
UC Film
nanowire enhanced UC film
4.3x
4.1x
4.7x
Pressure (GPa)
Wavele
ngth
(nm
)
1.15 12.9 28.3 14.1 1.15
540
545
550
5552000
4000
6000
8000
10000
12000
14000
16000
Pressure (GPa)
1.15 12.9 28.3
Pressure (GPa)
Wavele
ngth
(nm
)
1.15 12.9 28.3 14.1 1.15
540
545
550
5552000
4000
6000
8000
10000
12000
14000
16000
Inten
sity (a.u.)
555
550
545
540
Wav
elen
gth
(n
m)
Wavelength (nm)
500 550 600 650 700
Inte
nsi
ty (
a.u
.)
Conductive upconverting composites Upconverters under pressure
Maverick Chea
Michael Wisser

Ashwin Atre 50 nm 50 nm
Solar cell Solar cell
Up
converted
pow
er tow
ards cell
No nanocrescent With nanocrescent
Tunable and Enhanced Upconversion
1 μm
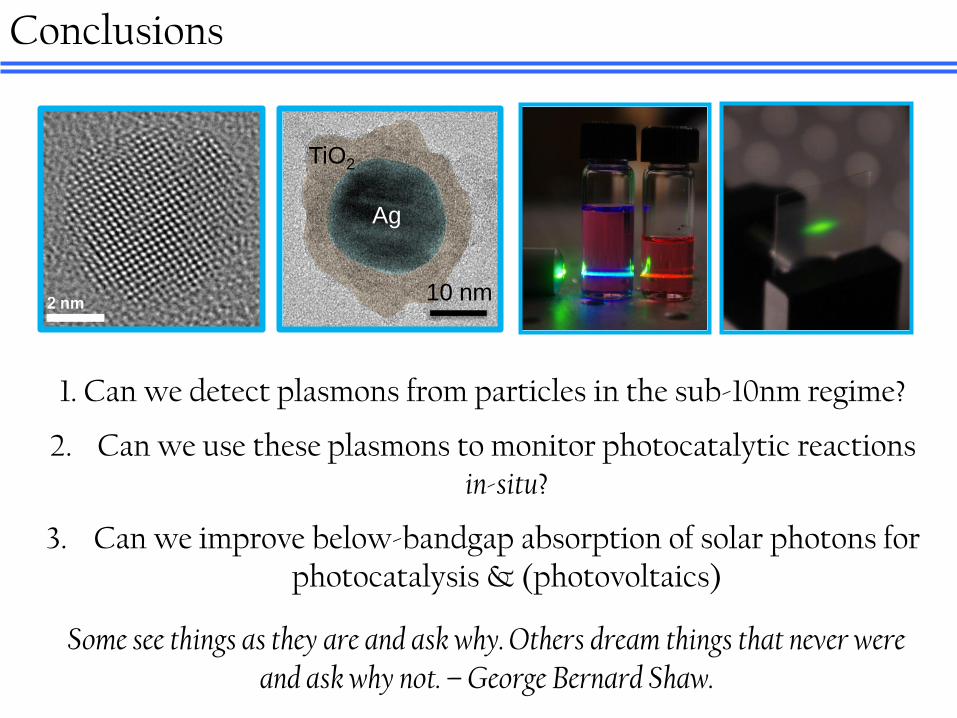
Conclusions
10 nm
Ag
TiO2
Some see things as they are and ask why. Others dream things that never were and ask why not. – George Bernard Shaw.
1. Can we detect plasmons from particles in the sub-10nm regime?
2. Can we use these plasmons to monitor photocatalytic reactions in-situ?
3. Can we improve below-bandgap absorption of solar photons for photocatalysis & (photovoltaics)

Conclusions
Thanks to you and our funders!!: GCEP, TomKat, DOE
10 nm
Ag
TiO2
1. Can we detect plasmons from particles in the sub-10nm regime?
2. Can we use these plasmons to monitor photocatalytic reactions in-situ?
3. Can we improve below-bandgap absorption of solar photons for photocatalysis & (photovoltaics)


Bimolecular upconversion process
S = sensitizer; E = emitter
1S 1S*
hν1
ISC 3S*
1S
TET
3E*
1E
3E*
hν1 1S*
ISC 3S*
TET
1S
1E
1S* 1E
3S*
TTA
1E
1E*
hν2
3E*
3E*
1S 1S*
hν1
ISC 3S*
1S
TET
3E*
1E
3E*
hν1 1S*
ISC 3S*
TET
1S
1E
1S* 1E
3S*
TTA
1E
1E*
hν2
3E*
3E*
Energy Requirements:
Sensitizer
1S*
3S*
1S Emitter
1E*
3E*
1E
TTA
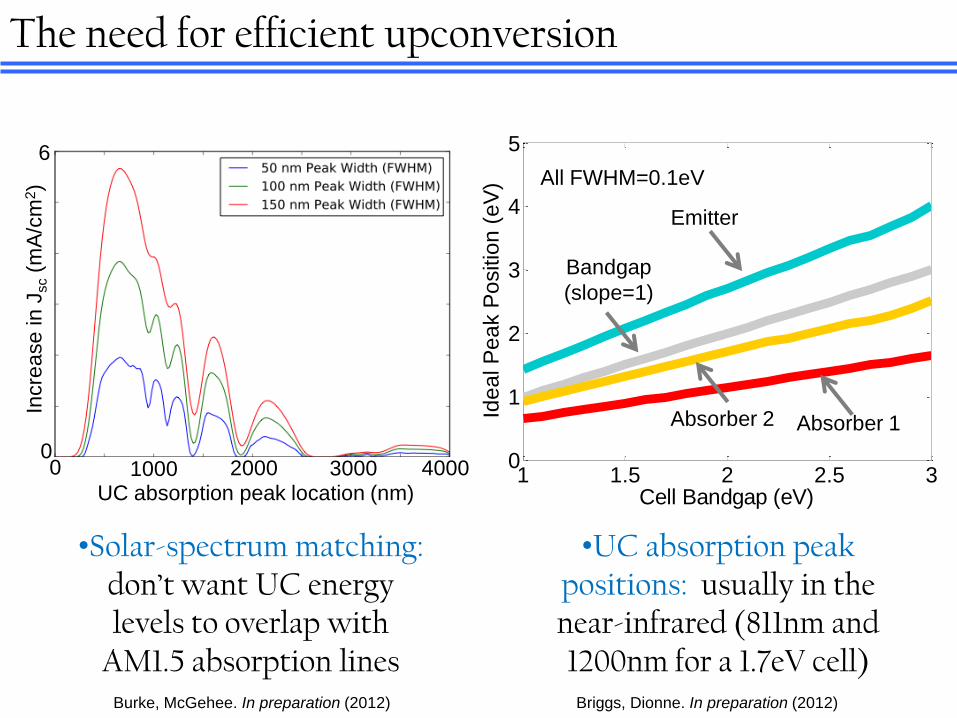
The need for efficient upconversion C
ell E
fficie
ncy (%
)
1 1.5 2 2.5 30
1
2
3
4
5
Cell Bandgap (eV)Id
ea
l P
ea
k P
ositio
n (
eV
)
All FWHM=0.1eV
Emitter
Absorber 1 Absorber 2
Bandgap
(slope=1)
Incre
ase
in J
sc (
mA
/cm
2)
0
6
UC absorption peak location (nm)
0 2000 4000
•UC absorption peak positions: usually in the near-infrared (811nm and 1200nm for a 1.7eV cell)
1000 3000
•Solar-spectrum matching: don’t want UC energy levels to overlap with
AM1.5 absorption lines Briggs, Dionne. In preparation (2012) Burke, McGehee. In preparation (2012)