progress and challenges in sub 20 nm particle detection ... · progress and challenges in sub 20 nm...
TRANSCRIPT

cnse.albany.edu
Progress and challenges in sub 20 nm particle detection
from vacuum components
Gregory Denbeaux and Yashdeep Khopkar
College of Nanoscale Science and Engineering
Current and Future Defectivity Issues from Components in the Semiconductor Industry
November 12, 2012
Albany, NY
cnse.albany.edu
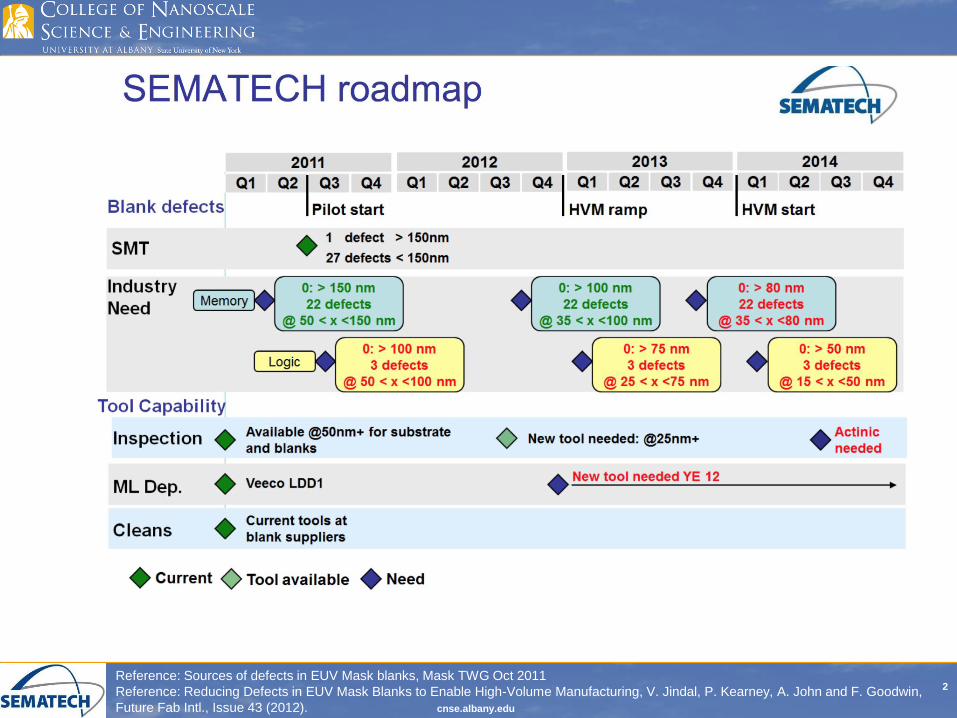
2 Reference: Sources of defects in EUV Mask blanks, Mask TWG Oct 2011
Reference: Reducing Defects in EUV Mask Blanks to Enable High-Volume Manufacturing, V. Jindal, P. Kearney, A. John and F. Goodwin,
Future Fab Intl., Issue 43 (2012).
cnse.albany.edu
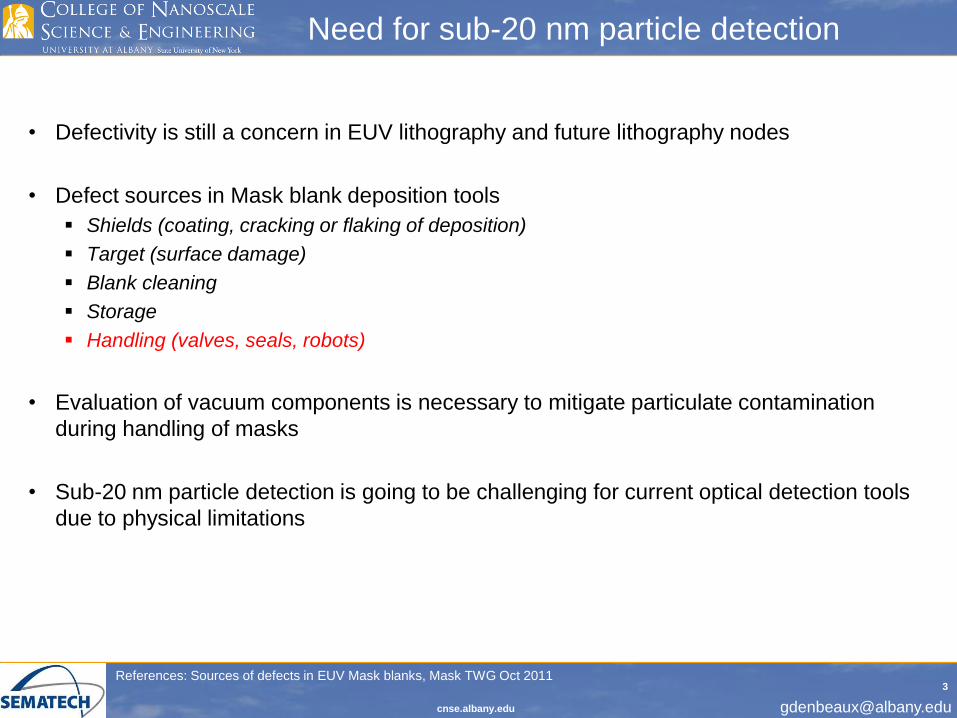
Need for sub-20 nm particle detection
• Defectivity is still a concern in EUV lithography and future lithography nodes
• Defect sources in Mask blank deposition tools
Shields (coating, cracking or flaking of deposition)
Target (surface damage)
Blank cleaning
Storage
Handling (valves, seals, robots)
• Evaluation of vacuum components is necessary to mitigate particulate contamination
during handling of masks
• Sub-20 nm particle detection is going to be challenging for current optical detection tools
due to physical limitations
3 References: Sources of defects in EUV Mask blanks, Mask TWG Oct 2011

cnse.albany.edu
Particle Detection Approaches
Particle detection
approaches
Surface
Electron
SEM TEM
Photon
Aerosol
Photon Condensation Electrical
4

cnse.albany.edu
Optical detection approaches
• Based on detection of intensity of light scattering using single
or multiple wavelengths of light
• Regime determined by “Size parameter α”
𝛼 = 𝜋𝐷𝑝
𝜆
• Scattering regimes
If α<<1 : Rayleigh Scattering
If α~1: Mie Scattering
• Rayleigh scattering cross-section is given by
𝜎𝑠 =2𝜋5
3
𝑑6
𝜆4
𝑛2 − 1
𝑛2 + 2
2
5 References: http://www.particlecounters.org/optical/, Particlecounters.org
http://en.wikipedia.org/wiki/Rayleigh_scattering

cnse.albany.edu
Limitations of optical detection approach
• Optical detection efficiency depends on
Wavelength of light illumination
Refractive index of particle
Size of particle
Sizing volume of the counter
• Optical counters are not suitable for sub-20 nm particle detection as the smaller
particles just do not scatter enough light
• This technique works in atmosphere or vacuum conditions
• Other options for sub-20 nm particle detection are electrical and condensation
based detectors
6

cnse.albany.edu
Detection based on particle charge
• Known charge distribution is imparted to particles in an aerosol
• These charged particles are attracted towards a detector which
measures current
• Current gives a measure of concentration of particles in the
aerosol based on the formula below
𝑁 =𝐼
𝑒 × 𝑛𝑝 × 𝑞𝑒
where,
N = particle number concentration (particles/cc)
e = elementary unit of charge, 1.602 x 10⁻¹⁹ Coulombs
np = number of charges per particle
qe = flow rate (cc/sec)
I = electrical current (Amps)
• For a sensitivity of 1 fA, considering single charged particle and
1 lit/min flowrate, minimum concentration required for detection
is 62.5 #/cc which is much higher than the particulate
concentration we expect to detect
• Need high concentration and atmospheric pressure to efficiently
detect particles
7
References: TSI Model 3068B Specifications sheet,
http://www.tsi.com/uploadedFiles/_Site_Root/Products/Literature/Spec_Sheets/3068B.pdf.

cnse.albany.edu
Condensation based particle detection
• Condenses solvent on all particles which grow into droplets as big as 11 microns
• These droplets are then detected easily by an optical particle counter
• Ideal for sub-20 nm particle detection at high efficiency
• However, it cannot be used in low pressure systems
• It is very pressure and flow sensitive
8 References: http://www.cas.manchester.ac.uk/restools/instruments/aerosol/cpc/Schematic%20_CPC/, Center for Atmospheric Science.

cnse.albany.edu
Particle sizing
Aerodynamic sorting
• Aerodynamic sorting is performed by a time-of-flight analysis of particles accelerated inside a tube
Electrical mobility sorting
• Electrical sorting is performed by charging particles with a known size distribution
• These charged particles are passed through a charged cylinder and particles of a specific size will get attracted to the cylinder
and passed on to the CPC for detection
𝑍𝑝 =𝑒𝐶(𝐷)
3𝜋𝜇𝐷
where,
Zp = electrical mobility
D = Particle diameter
C(D) = Cunningham slip correction factor
e = electron charge
µ = Dynamic viscosity of air
9
AERODYNAMIC SIZER ELECTRICAL MOBILITY SIZER
Ref: http://www.cas.manchester.ac.uk/restools/instruments/aerosol/aps/
Ref: http://www.tsi.com/uploadedFiles/_Site_Root/Products/Literature/Schematic/macroIMS_schematic.pdf
cnse.albany.edu
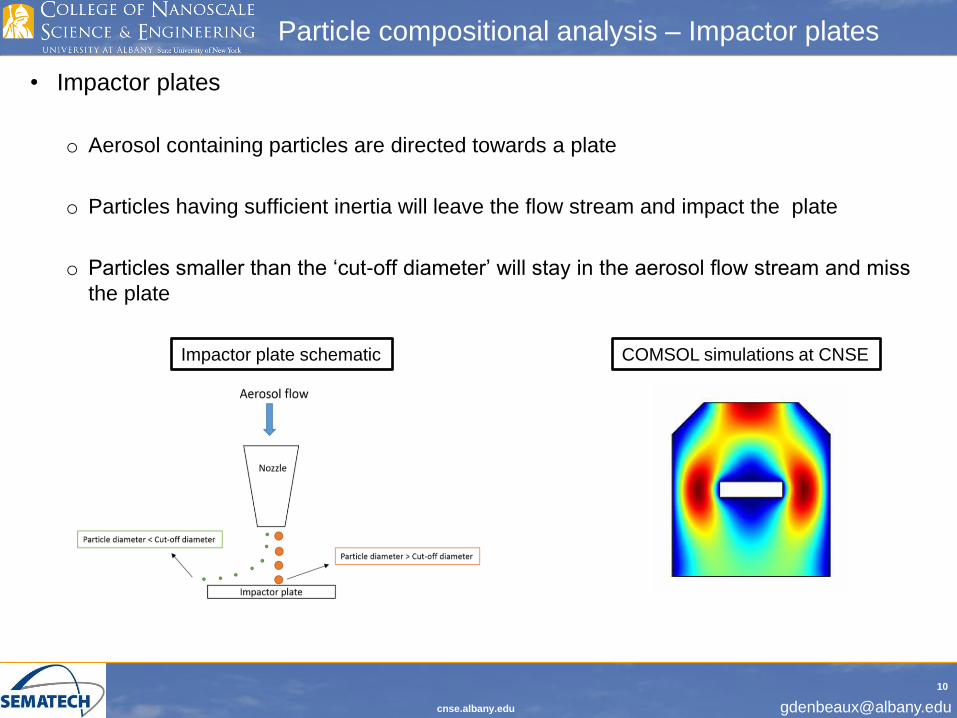
Particle compositional analysis – Impactor plates
• Impactor plates
o Aerosol containing particles are directed towards a plate
o Particles having sufficient inertia will leave the flow stream and impact the plate
o Particles smaller than the ‘cut-off diameter’ will stay in the aerosol flow stream and miss
the plate
COMSOL simulations at CNSE Impactor plate schematic
10

cnse.albany.edu
Test setup for component evaluation
Nitrogen flow
Filter
Component under
evaluation OPC
CPC+SMPS
Filter Exhaust
11

cnse.albany.edu
Nanoparticle detection and measurement system capabilities
Optical particle counter
Inficon Stiletto® OPC
220 nm – 2.2 µm
Real-time particle counts
Real-time size distribution
Condensation particle counter
TSI Model 3772 CPC
7 nm – 3 µm
Real-time particle counts
Particle sizing
TSI Model 3080 Scanning
Mobility Particle Sizer
7 nm – 300 nm
Real time size distribution
Impactor plates
Custom designed at
CNSE
200 nm – 10 µm
(>10 nm possible)
Elemental analysis
Aerosol Generator
TSI Model 3480 Electrospray Generator
Particulate aerosol
generation 10 nm and higher
Used in particle transport studies
12
cnse.albany.edu
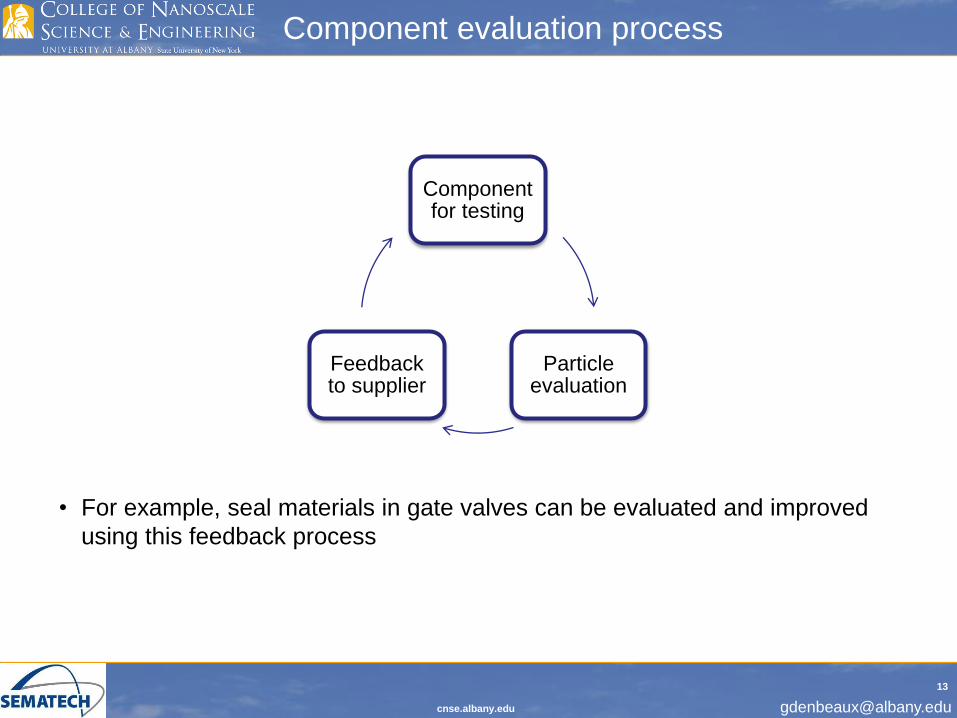
Component evaluation process
Component for testing
Particle evaluation
Feedback to supplier
• For example, seal materials in gate valves can be evaluated and improved
using this feedback process
13

cnse.albany.edu
Results – component testing
• Valves – Valve A (bellows sealed, Viton gate valve)
Stiletto
(#/cycle)
CPC
(#/cycle)
116 185
0
10
20
30
40
50
60
<0.2µm
0.2 -0.3µm
0.3 -0.45µm
0.45-
0.65µm
0.65- 1µm
1 -1.5µm
1.5 -2.2µm
>2.2µm
% T
ota
l s
ize
Particle counts OPC Size distribution SMPS Size distribution
0%
1%
1%
2%
2%
3%
3%
18 43 106 260 638
% T
ota
l s
ize
Particle size (nm)
14
cnse.albany.edu
Results – component testing
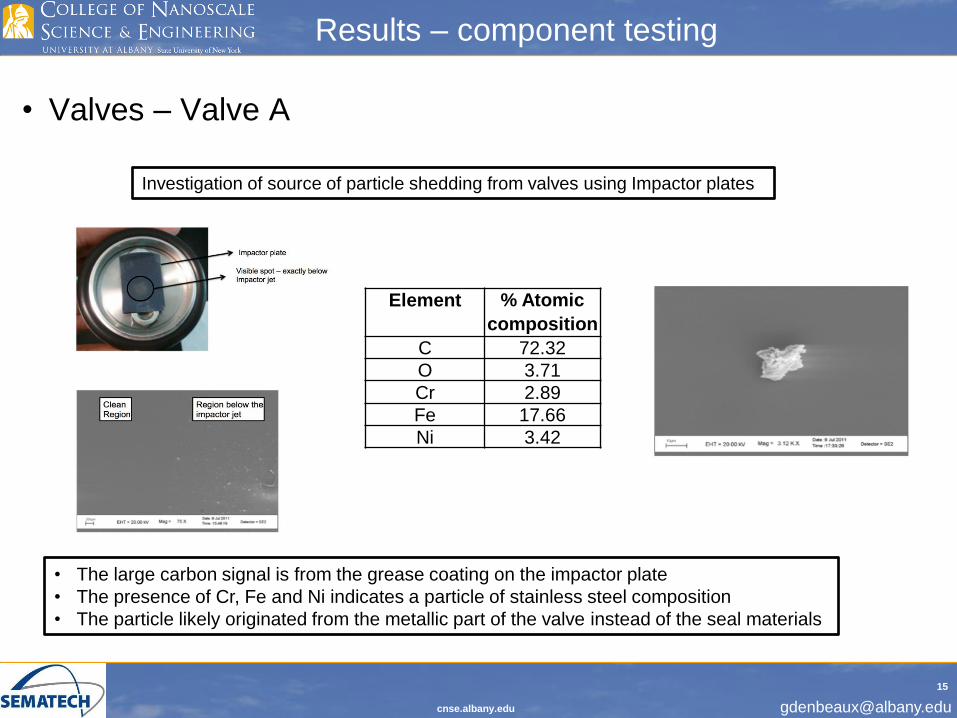
• Valves – Valve A
Investigation of source of particle shedding from valves using Impactor plates
Element % Atomic
composition
C 72.32
O 3.71
Cr 2.89
Fe 17.66
Ni 3.42
• The large carbon signal is from the grease coating on the impactor plate
• The presence of Cr, Fe and Ni indicates a particle of stainless steel composition
• The particle likely originated from the metallic part of the valve instead of the seal materials
15
cnse.albany.edu
Results – component testing
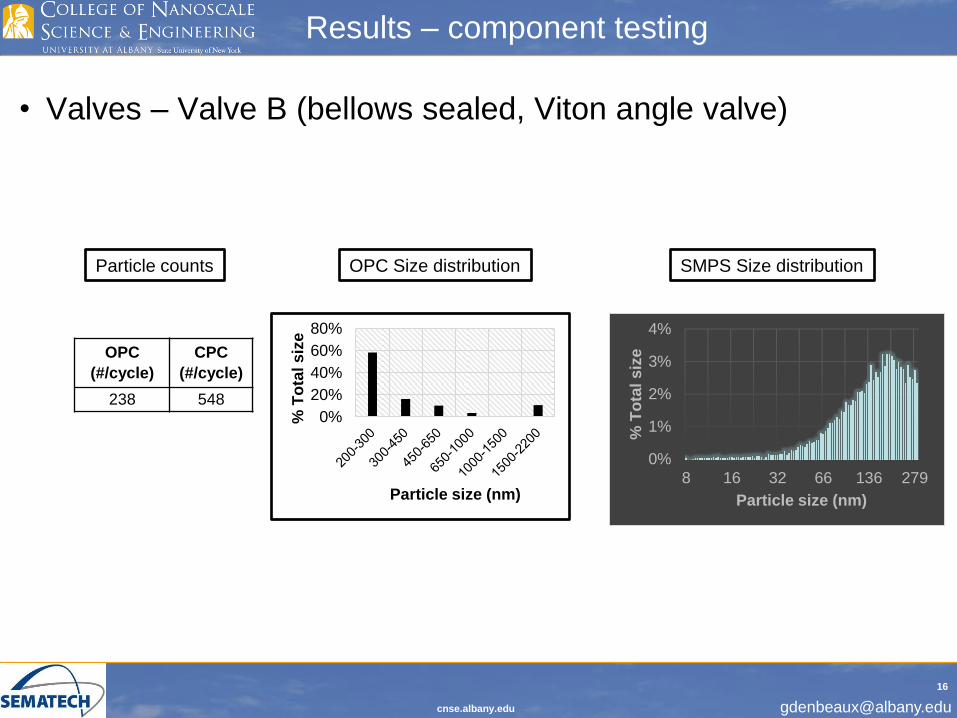
• Valves – Valve B (bellows sealed, Viton angle valve)
Particle counts OPC Size distribution SMPS Size distribution
OPC
(#/cycle)
CPC
(#/cycle)
238 548
0%
1%
2%
3%
4%
8 16 32 66 136 279
% T
ota
l s
ize
Particle size (nm)
0%
20%
40%
60%
80%
% T
ota
l s
ize
Particle size (nm)
16
cnse.albany.edu
Results – component testing
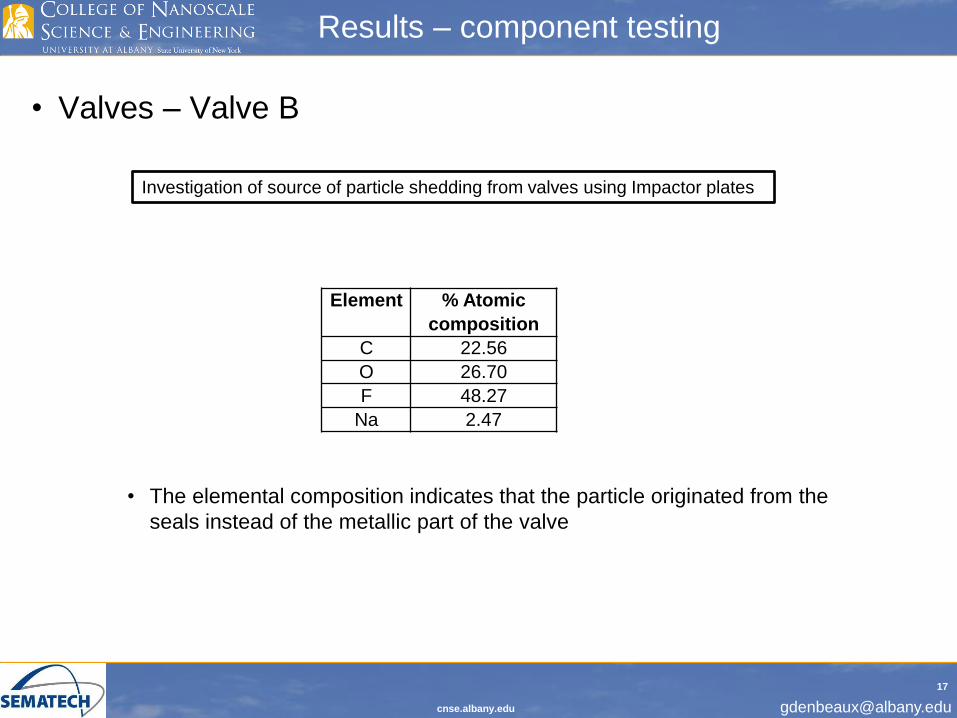
• Valves – Valve B
Investigation of source of particle shedding from valves using Impactor plates
Element % Atomic
composition
C 22.56
O 26.70
F 48.27
Na 2.47
• The elemental composition indicates that the particle originated from the
seals instead of the metallic part of the valve
17

cnse.albany.edu
Other results – Speed of closing a valve
• Operating parameters of valves can also be evaluated with respect to the number of particles
• Graphs below show OPC and CPC particle counts with increasing speed of closing a valve
• This speed was varied by changing the CDA line pressure at the valve
• It was observed that the particle generation from the valve decreased when the valve was
closed more slowly
• This test was performed at atmospheric pressure and this could be different than results in
vacuum conditions (normal operating conditions for the valve)
18
0
20
40
60
80
100
120
0 50 100 150 200 250 300
# P
art
icle
s/c
yc
le
Valve close time (ms)
# Particles (CPC) vs Valve close time
0
100
200
300
400
500
600
700
800
0 100 200 300
# P
art
icle
s/c
yc
le
Valve close time (ms)
# Particles (OPC) vs. Valve close time
cnse.albany.edu
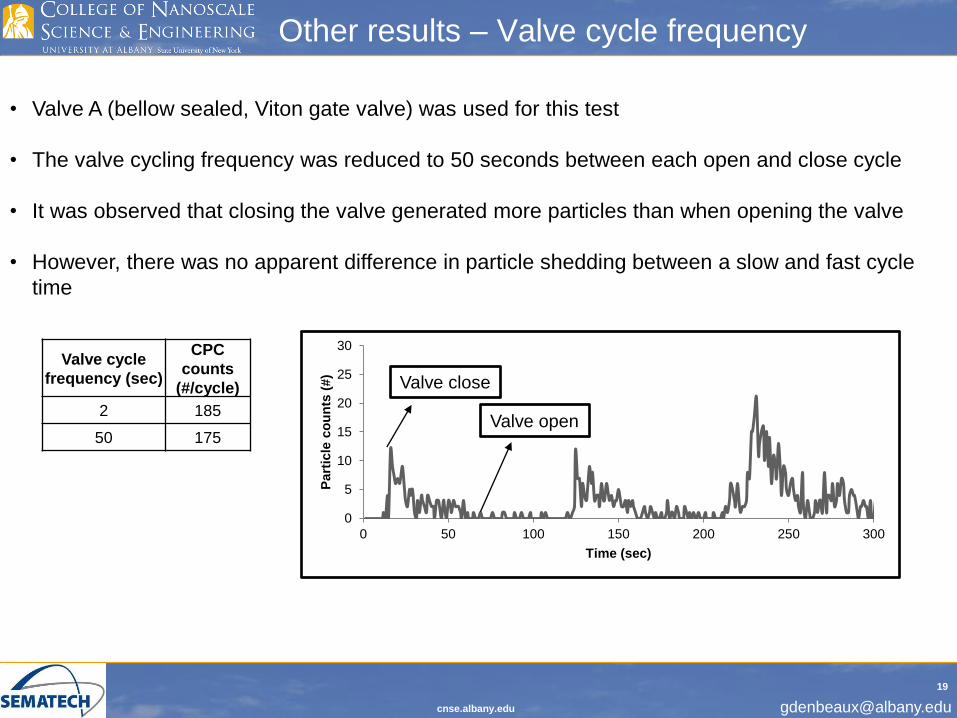
Other results – Valve cycle frequency
Valve cycle
frequency (sec)
CPC
counts
(#/cycle)
2 185
50 175
0
5
10
15
20
25
30
0 50 100 150 200 250 300
Part
icle
co
un
ts (
#)
Time (sec)
Valve close
Valve open
• Valve A (bellow sealed, Viton gate valve) was used for this test
• The valve cycling frequency was reduced to 50 seconds between each open and close cycle
• It was observed that closing the valve generated more particles than when opening the valve
• However, there was no apparent difference in particle shedding between a slow and fast cycle
time
19
cnse.albany.edu
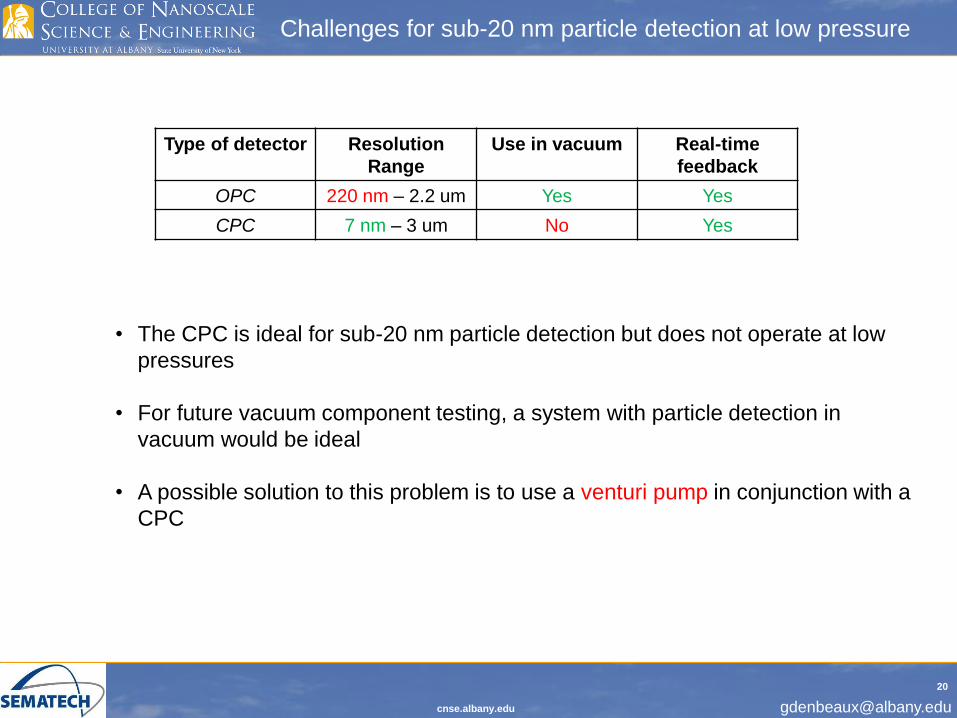
Challenges for sub-20 nm particle detection at low pressure
Type of detector Resolution
Range
Use in vacuum Real-time
feedback
OPC 220 nm – 2.2 um Yes Yes
CPC 7 nm – 3 um No Yes
• The CPC is ideal for sub-20 nm particle detection but does not operate at low
pressures
• For future vacuum component testing, a system with particle detection in
vacuum would be ideal
• A possible solution to this problem is to use a venturi pump in conjunction with a
CPC
20
cnse.albany.edu
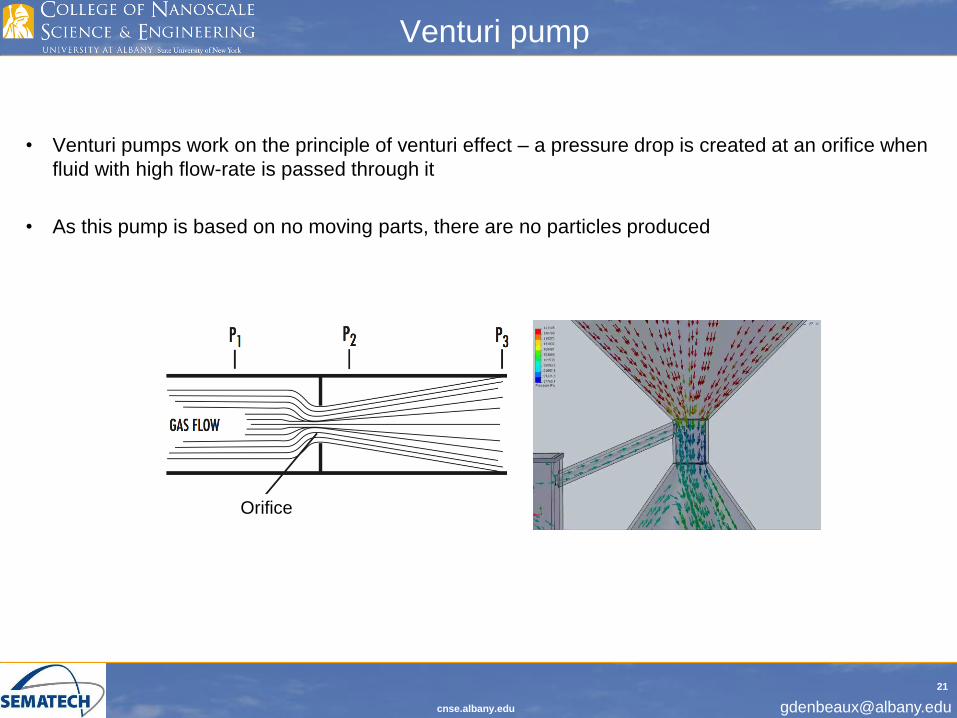
Venturi pump
• Venturi pumps work on the principle of venturi effect – a pressure drop is created at an orifice when
fluid with high flow-rate is passed through it
• As this pump is based on no moving parts, there are no particles produced
Orifice
21
cnse.albany.edu
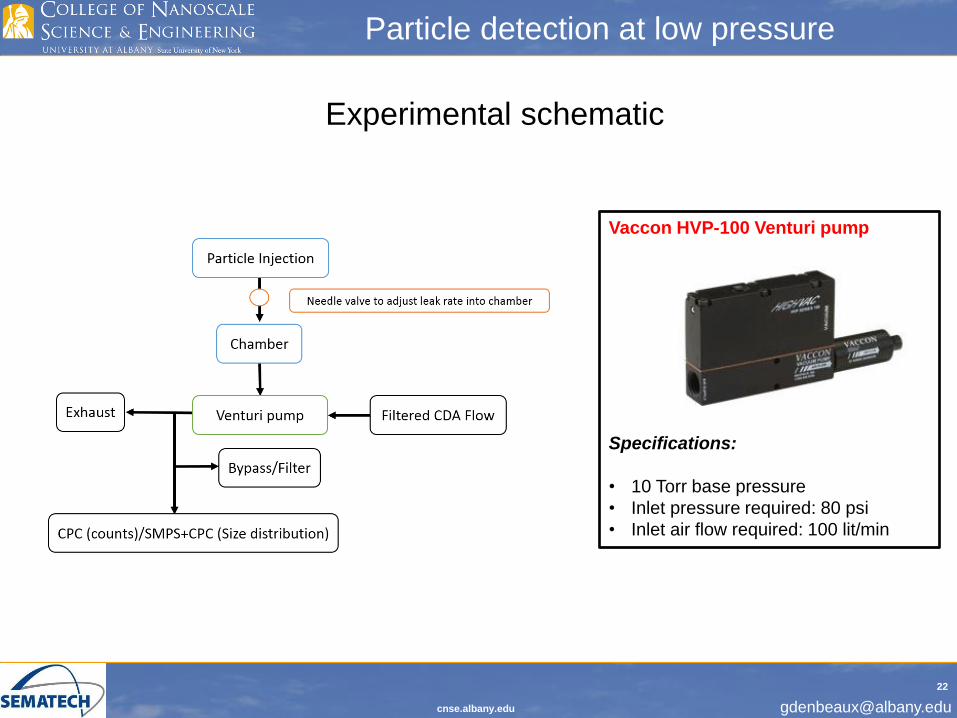
Particle detection at low pressure
Experimental schematic
Vaccon HVP-100 Venturi pump
Specifications:
• 10 Torr base pressure
• Inlet pressure required: 80 psi
• Inlet air flow required: 100 lit/min
22
cnse.albany.edu
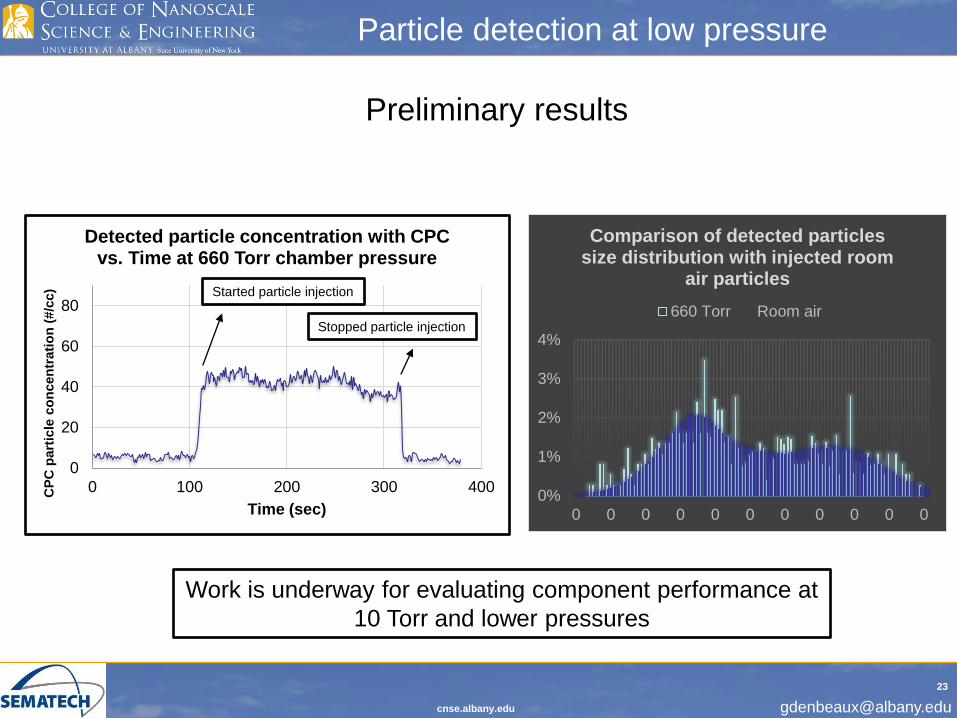
Particle detection at low pressure
Preliminary results
0
20
40
60
80
0 100 200 300 400CP
C p
art
icle
co
ncen
trati
on
(#/c
c)
Time (sec)
Detected particle concentration with CPC vs. Time at 660 Torr chamber pressure
0%
1%
2%
3%
4%
0 0 0 0 0 0 0 0 0 0 0
Comparison of detected particles size distribution with injected room
air particles
660 Torr Room air
Work is underway for evaluating component performance at
10 Torr and lower pressures
23
Started particle injection
Stopped particle injection

cnse.albany.edu
Summary and future work
• Capabilities to evaluate vacuum components have been
demonstrated
• Preliminary results on low pressure particle detection were shown
• 300 mm valve testing is also planned in the near future.
• Investigation of particle transport in vacuum systems is also
planned on the CNSE Test bench
24

cnse.albany.edu
Acknowledgements
• SEMATECH
– Vibhu Jindal
– Arun John
– Alin Antohe
– Frank Goodwin
25