programme implementation and project appraisal manual · project appraisal. hence, for successful...
TRANSCRIPT

PROGRAMME IMPLEMENTATION
AND
PROJECT APPRAISAL
MANUAL

ii

iii
CONTENTS
Introduction 1
The Project Life Cycle Approach 2
How to Use This Manual 7
1. Project Identification 9
2. Project Definition 18
3. Pre-Feasibility 29
4. Detailed Feasibility 48
5. Financing 66
6. Implementation and Monitoring 78
7. Ex-Post Evaluation 93
Abbreviations and Acronyms 101
Key Terms 102
Template Reference Sheet 105
Annexure I: Sample CBA 107

iv
LIST OF FIGURES
Figure 1: National investment Cycle 2
Figure 2: The Project Life Cycle 3
Figure 3: Development of the Long and Short Lists 6
Figure 4: Milestones for the Implementation and Monitoring Stage 81
Figure 5: The Logical Framework 83
Figure 6: Value for Money Measures and the Logical Framework 96
LIST OF BOXES
Box 1: Benefits of a Dual Screening Process 17
Box 2: Expected outputs of a CBA 34
Box 3: Outcomes of the Appraisal Process at Pre-feasibility stage 44
Box 4: Definitions of bankability and financial closure 64
Box 5: Difference between Monitoring and Impact Evaluation 95
1
INTRODUCTION
Capital and other types of projects are critically important in supporting economic growth and
development in Zambia. Effective infrastructure development, for example, has the capacity to
increase intra-regional and international trade, improve productivity within the economy and
lead to broad-based, sustainable development. Programmes and projects also reinforce one
another’s outcomes, such that programmes aimed at developing a range of complementary
projects often lead to impacts that greater than the sum of their individual parts.
The success and realization of such projects demands sound preparation and well-managed,
transparent processes throughout the project life cycle, combined with timely matching of
project preparation funding bodies. This makes project preparation a vital component for the
delivery of any project. The project preparation process consists of planning and packaging
work encompassing a number of phases of the project life cycle, from the conceptualisation,
design, evaluation and financing of projects; all are crucial components of the work that is
required to bring a project to eventual fruition.
Therefore, in order for the policies of the GRZ to be translated into the socio-economic
developments it seeks, it is necessary that the supporting systems and tools are in place to
translate policies into effective projects. This will ensure that scarce resources are used
appropriately and enhance the credibility of the National Budget.
ABOUT THIS MANUAL
The purpose of this Manual is to assist the Ministry of Finance (MOF) and other MPSAs in
Zambia to effectively and efficiently undertake Programme Implementation and Project
Appraisal of government projects. It aims to do this by providing a clear outline of the different
stages involved in these processes and presenting the respective systems and tools that are
necessary for engaging in each of these.
This Manual will be a single repository for all templates, forms and guidelines relating to the
different stages of the project life cycle and is a source and reference for those parties involved
at any stage of the Programme Implementation and Project Appraisal process. Having this
resource ensures:
Firstly, that a comprehensive approach is undertaken, such that all necessary stages
of the project development and implementation processes are taken into account;
Secondly, that systems and tools used are reputable and in line with best practice and;
and
Lastly, by creating a standardized set of documents that is commonly understood by
all who use it, the Manual will promote consistency throughout the GRZ.
Enhanced efficiency and effectiveness in the Programme Implementation and Project
Appraisal Processes in Zambia is an important part of assisting the GRZ in attaining its vision
of becoming a middle-income country by the year 2030.

2
National Development
Planning
Provincial and District
Planning
Programme Design and
Overall Resource Estimation
Project Appraisal
Ministry of Finance Budget
Allocations
Project Execution
THE PROJECT LIFE CYCLE APPROACH
ALIGNMENT OF POLICY PRIORTIES AND PROGRAMME
IMPLEMENTATION
Well-defined national policy priorities require effective implementation if they are be translated
into significant socio-economic impact. This process happens through the creation of
programmes informed by policy and then via the development of projects to support these
programmes’ objectives. This is known as the national investment cycle and it must be seen as
a continuous process.
The figure below presents a holistic view of this cyclical process, depicting the linkages
between policy formulation, programme design and project execution.
Figure 1: National investment Cycle
From the figure it is evident that programmes and projects derive from policy formulation. The
process of proceeding from high-level policy making to the execution of projects on the ground
requires careful thought so as to ensure that policy priorities are clearly reflected in projects
and, in resource constrained environments, budgeting is done efficiently.
Policy
Formulation
3
Project Identification
Project Definition
Pre-Feasibility
Detailed Feasibility
Financing
Implementation and Monitoring
Ex-post Impact Evaluation
Long list of projects for the
financing pipeline
Short list of projects for
the financing pipeline
THE PROJECT LIFE CYCLE
There is a high degree of complementarity between policy formulation, programme design and
project appraisal. Hence, for successful programme implementation to take place, it is
essential to design a system that links these interrelated stages of project planning.
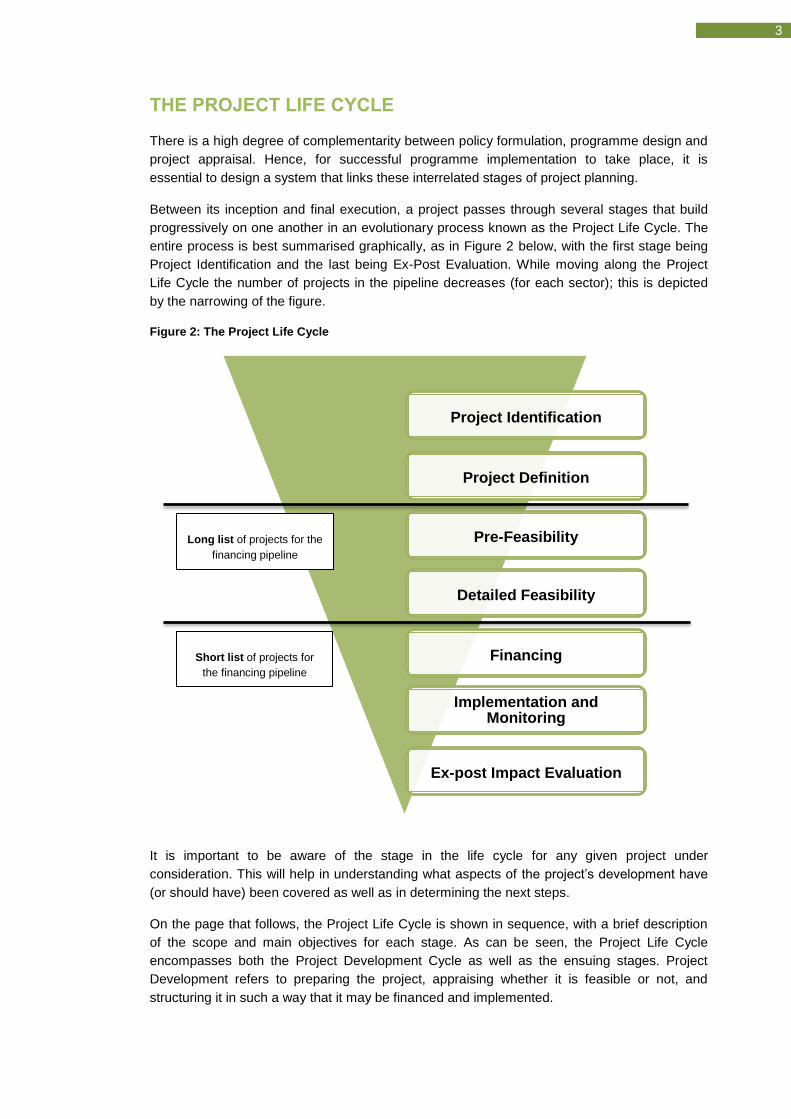
Between its inception and final execution, a project passes through several stages that build
progressively on one another in an evolutionary process known as the Project Life Cycle. The
entire process is best summarised graphically, as in Figure 2 below, with the first stage being
Project Identification and the last being Ex-Post Evaluation. While moving along the Project
Life Cycle the number of projects in the pipeline decreases (for each sector); this is depicted
by the narrowing of the figure.
Figure 2: The Project Life Cycle
It is important to be aware of the stage in the life cycle for any given project under
consideration. This will help in understanding what aspects of the project’s development have
(or should have) been covered as well as in determining the next steps.
On the page that follows, the Project Life Cycle is shown in sequence, with a brief description
of the scope and main objectives for each stage. As can be seen, the Project Life Cycle
encompasses both the Project Development Cycle as well as the ensuing stages. Project
Development refers to preparing the project, appraising whether it is feasible or not, and
structuring it in such a way that it may be financed and implemented.

PROJECT IDENTIFICATION
Scope: Screening of project ideas to ensure that projects proposed respond to previously identified national and sectoral policy priorities and are within the allocated budget
Key objectives:
Prioritising projects on a
‘Long List’
Assessing project alignment
with policy objectives
Determining project
affordability
1 PROJECT DEFINITION
Scope: Engaging with stakeholders, assessing the environment, and identifying and recording a number of key details relating to the project concept in order to set the project up for Pre-Feasibility in the next stage.
Key objectives:
Developing the project
concept
Engaging with stakeholders
Creating an enabling
environment
2
PRE-FEASIBILITY
Scope: Conducting preliminary Pre-Feasibility assessment of project characteristics to determine whether the project exhibits sufficient value to undergo a full feasibility study.
Key objectives:
Conceptual design of
project characteristics
High-level options analysis
and narrowing to select
few
Preparation of project for
Detailed Feasibility Study
3
DETAILED FEASIBILITY
Scope: Undertaking of Detailed Feasibility Study, including thorough analysis of selected options, appraisal of project characteristics and specialist studies, to determine if and how project should be financed and implemented
Key objectives:
Project design and detailed
assessment of project’s
feasibility
Development of ‘Short List’ of
projects to be financed
Appropriate technical and
commercial structuring of
projects
4
FINANCING
Scope: Identifying the mechanisms
and sources of financing available
for the project and negotiating and
finalizing the necessary agreements
for raising the required capital.
Key objectives:
Allocating capital from
government budget to project
Developing a Financing
Strategy for the project
Bringing the project to financial
close
5 IMPLEMENTATION AND
MONITORING
Scope: The detailed design and actual implementation of the project, as well as ongoing assessment of its progress.
Key objectives:
Detailed project design and
creation of Implementation
and Monitoring Plan
Procurement and roll out of
project activities (construction
and operating and
maintenance)
Monitoring of project progress
6 EX-POST EVALUATION
Scope: Conduct an Impact Evaluation exercise to assess whether a project achieved its specified objectives and whether it achieved value for money.
Key objectives:
Impact evaluation of project
outcomes and impacts
Reporting to key stakeholders
on findings
Determining lessons for
future project design
7
PROJECT DEVELOPMENT CYCLE
PROJECT LIFE CYCLE
LONG LIST SHORT LIST
Project Structuring
Procurement of Project Implementing Agent
Transaction Support

5
Key to project development are the various selection processes that determine whether a
project progresses to the next stage of the project life cycle. The sequence above shows
where a ‘Long List’ and a ‘Short List’ of projects enters the process:
The Long List incorporates those projects that have been screened based on policy
priorities and budget affordability and which qualify to undergo further development
through a feasibility study.
The Short List represents those projects which, based on an appraisal of their
feasibility study(s), are determined as viable and are approved to be financed and
implemented.
Both of these lists have both a draft and a final form which are created at different stages in the
project development cycle. More detail on each list can be found in the respective chapter as
depicted in the figure below.

6
Figure 3: Development of the Long and Short Lists

7
HOW TO USE THIS MANUAL
To use this Manual for developing a project, the Reader must know the stage of the Project Life Cycle the project in question is at. From the contents page, the correct chapter can then be found. Turning to the required section, the Reader may work through the chapter.
Chapters begin with a rationale for the stage, then present an outline of the key systems, tools and institutions involved, before providing guidance and templates required to undertake the stage. The chapter structure is visually described below.
1. Name of stage and position in the Project Life Cycle: Clearly indicates the beginning of the chapter and provides context on its place in the Project Life Cycle
2. Rationale of this Stage: Provides an overview of what happens during this stage and what the reasoning for this is.
3. Tools and Institutions Involved: Narrates the key processes and tools that are used during this stage and indicates the institution(s) responsible.
4. Key Tools and Authority Responsible: Tabulated outline of the key templates included in the chapter and the authority responsible for completing them.

8
At the beginning of each chapter is a list of the key tools for the stage and the authorities
responsible for completing them. However, for ease of reference, a table (like the one below) is
provided at the end of the Manual which contains all tools and responsible authorities in a
consolidated table. A list of abbreviations and acronyms as well as a list of key terms is
likewise contained at the end of the document.
What follows are sequential chapters detailing each stage of the project life cycle.
5. Section Guidance: Detailed walkthrough of the different processes that occur during the stage and guidance on how to complete templates
6. Section Templates: Presents the key tools that are to be used during the stage. Guidance on what to include is also provided within the templates.

9
Project Identification
Project Definition
Pre-Feasibility
Detailed Feasibility
Financing
Implementation and Monitoring
Ex-post Impact Evaluation
01 PROJECT
IDENTIFICATION

10
RATIONALE FOR THIS STAGE
The first stage of project development involves turning a project idea that has been
conceptualized into a form that can be presented and assessed. The details of the project are
therefore recorded in a Project Information Sheet which is then assessed through a screening
process. Recording project ideas in a clear and standard format will allow them to be assessed
consistently, to be more easily compared, and ensure that all important aspects are captured
Project Screening aims to make sure that any project sent on to be prepared further – such as
to undergo a feasibility study – is in line with the GRZ’s national and sectoral policy priorities.
Further, projects that are clearly unaffordable in terms of the available resources may be
removed early on from the pipeline.
It is important that the institutions that are responsible for assessing the Project Information
Sheets have a good understanding of two things: first, that they have the sector expertise to
make informed decisions about which projects fit with policy priorities; and second, that they
are able to liaise easily with other departments in the MOF to check whether the project is
affordable or could be funded using a combination of funding sources.
Projects that make it through the screening process qualify to move on to the next stage of
project development, the Project Definition stage, where the key details of the project are
examined in greater detail.

11
TOOLS AND INSTITUTIONS INVOLVED
The first tool used in the project preparation process is the Project Information Sheet,
which is prepared by the Sponsor Department.
This Sheet is sent to the Planning Directorate in the MPSA which conducts a first
screening of the project using a Project Assessment Sheet.
A decision is taken by the Planning Directorate on whether the project qualifies to undergo
further screening, or whether it is rejected, put on hold or sent back to the Sponsor
Department for revision.
If a project qualifies for further preparation, the Planning Directorate sends both its Project
Information Sheet and Project Assessment Sheet to the MOF for reviewing.
The MOF conducts a second screening of the project using the same Project Assessment
Sheet and based on the same criteria as before. It then also makes a decision on whether
the project qualifies for further preparation.
The MOF records projects that have been cleared for the next stage by both itself and by
the Planning Directorate in the MPSA for further preparation in a Draft Long List, which is
also shared with the Cabinet Office.
The MOF also communicates its final decision to the Planning Directorate and Sponsor
Department within the MPSA.
If a project qualifies for further preparation, it enters the next stage of project development,
Project Definition.
Key Tools Authority Responsible Page
1.1 Project Information Sheet Sponsor Dept., MPSA 12
1.2 Project Assessment Sheet Planning Directorate, MPSA & Ministry of Finance
13
1.3 Draft Long List Ministry of Finance 16

12
DEVELOPING THE PROJECT IDEA
Project development begins with the conceptualisation of different projects. Project Ideas are
generated by a variety of sources, including line ministries, forums such as Sector Advisory
Groups (SAGs), and other institutions and agencies. In order for these ideas to be translated
into a form that can be assessed, key information about the project needs to be documented.
The first tool to assist in project preparation is the Project Information Sheet (PIS). The PIS is
a document that contains key information relating to the proposed project. It is used to record
this information so that the project idea can be made more concrete and is prepared by the
Department within the MPSA that is proposing the project idea (‘Sponsor Department’). The
template below presents an outline of the basic information a PIS should contain.
1.1 PROJECT INFORMATION SHEET
PROJECT TITLE
Sponsor Dept. | MPSA The Department and MPSA under which the project mandate falls
Town | District | Province
Define the area in which the project is located, from village to province. Indicate multiple areas if applicable.
Sector | Sub-Sector Describe the sector and sub-sector in which the project focused
Description and Components
Provide a brief outline of the project design and, in point form, broadly describe the various activities planned for implementation
Project Objective This is a single, clear statement that speaks to the overarching developmental impact the project aims to achieve
Expected socio-economic benefits
In point form, describe the different high-level socio-economic benefits that are expected to result from the project
Alignment with NDP Describe the various high-level developmental outcomes and objectives (as outlined in the GRZ’s NDP) that the project contributes towards
External Stakeholders Outline the various stakeholders who have an interest in the project/who will be impacted by the project
Implementing Authority
Indicate the authority that will be in charge of implementing the project
Project Status Indicate the stage of the project life cycle that the project is current at. Provide a brief, bullet point of key preparation activities undertaken (e.g. stakeholder consultations, feasibility study, etc...)
Political Support Indicate the different MPSAs that may support the project/cross-cutting linkages that may be involved
Way Forward Indicate the next steps to be taken (e.g., specialist studies to be undertaken, detailed designs to be prepared etc.)
Project Start Date Indicate the day/month/year in which project implementation is expected to begin
Estimated Project Lifetime
Provide an estimate of the project’s economic lifetime
Estimated Project Cost
Provide a high-level estimate of how much the project is expected to cost in its entirety; i.e. the total funds required for both project preparation and capital and operating expenditure
Potential Financing Sources
In point form, outline potential sources of finance for the project
Other Comments Briefly provide other comments relating to the project, such as relevant motivation

13
PROJECT ASSESSMENT
The second step within the Project Identification Stage is the selection of projects to undergo
further preparation. This occurs through two screening processes. The first is undertaken by
the Planning Directorate within the MPSA and the second by the MOF.
First Screening Process
For the first screening process, the Sponsor Department submits the Project Information Sheet
to the Planning Directorate within the MPSA, which then conducts the first screening of the
projects by assessing them using a Project Assessment Sheet (PAS).
The PAS is a questionnaire that interrogates the project based on alignment with policy
priorities and budget affordability. The purpose of this first screening is to address three
aspects of the project:
1) Alignment with high-level policy priorities: Given the resource constraints inherent in all
public administrations, it is vital that any projects that are eventually funded have objectives
and expected outcomes that are aligned with those areas that have been identified by the
GRZ as the most necessary. This will ensure that the GRZ attains maximum development
impact from the resources it expends.
2) Budget Allocation: Project budgets are compared to the resources allocated to the MPSA
and described in the MTEF. The purpose here is not to assess whether the project’s costs
provide the best value for money, but is simply to determine whether the project is broadly
affordable given the MPSA’s limited resource allocation.
3) Efficiency: Projects with similar objectives can be aligned to be more efficiently undertaken
under suitable programs.
The Planning Directorate within the MPSA liaises with the National Planning Department
(NPD), the NPPID in the MOF to ensure consistency with plan and budgetary priorities.
The template that follows presents the Project Assessment Sheet. Each question must be
assessed in turn and the relevant box checked. Space is provided for comments, which must
be noted in the relevant assessor box.
1.2 PROJECT ASSESSMENT SHEET
PROJECT TITLE
No. Criteria Yes No N/A
1 POLICY PRIORITIES
1.1 Project contributes towards National Policy Priorities as outlined in the SNDP
Planning Directorate, MPSA □ □

14
Ministry of Finance □ □ □
1.2 Project contributes towards National Policy Priorities as outlined in the Vision 2030
Planning Directorate, MPSA □ □ □
Ministry of Finance □ □ □
1.3 Project contributes to sector priorities
Planning Directorate, MPSA
□ □ □
Ministry of Finance
□ □ □
1.4 Project falls within the institutional mandate of Sponsor Department
Planning Directorate, MPSA
□ □ □
Ministry of Finance
□ □ □
1.5 Project contributes towards other policy priorities
Planning Directorate, MPSA □ □ □
Ministry of Finance □ □ □
1.6 Additional Comments on institutional mandate and policy alignment
Planning Directorate, MPSA: Add comments here
Ministry of Finance: Add Comments here
2 BUDGET
2.1 Estimated project cost has been reviewed against MTEF and MPSA allocation
Planning Directorate, MPSA □ □ □
Ministry of Finance □ □ □
15
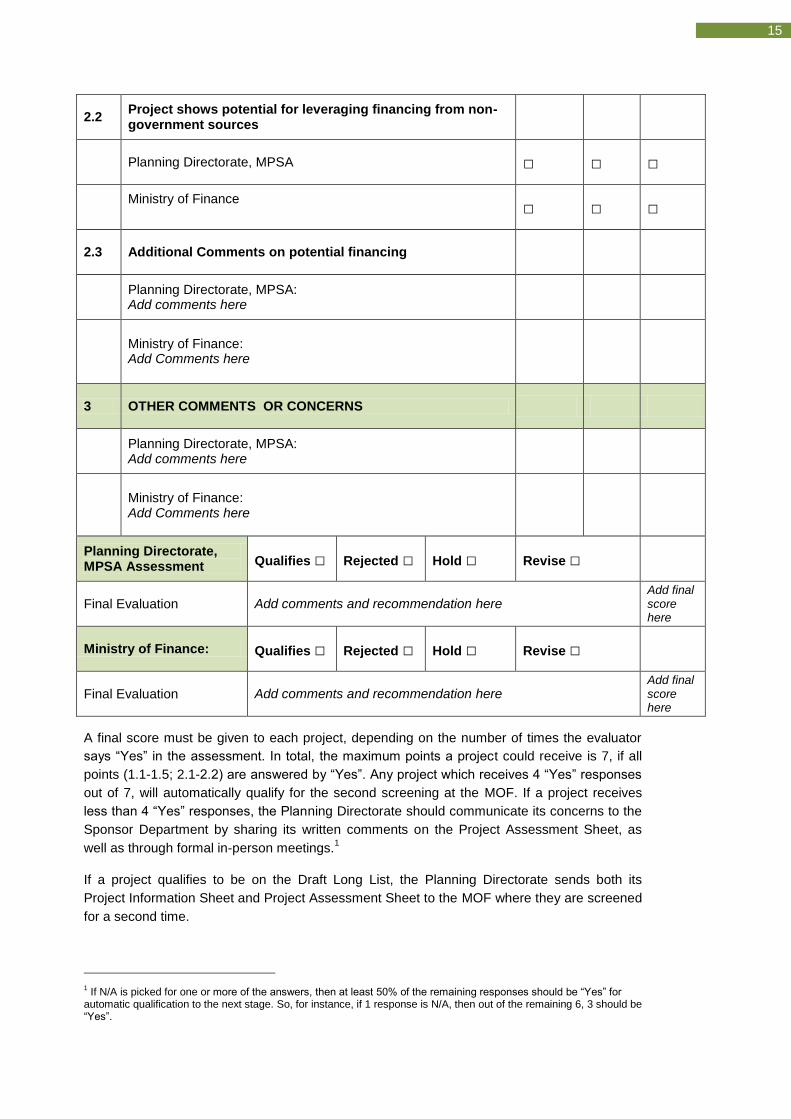
2.2 Project shows potential for leveraging financing from non-government sources
Planning Directorate, MPSA □ □ □
Ministry of Finance
□ □ □
2.3 Additional Comments on potential financing
Planning Directorate, MPSA: Add comments here
Ministry of Finance: Add Comments here
3 OTHER COMMENTS OR CONCERNS
Planning Directorate, MPSA: Add comments here
Ministry of Finance: Add Comments here
Planning Directorate, MPSA Assessment Qualifies □ Rejected □ Hold □ Revise □
Final Evaluation Add comments and recommendation here Add final score here
Ministry of Finance: Qualifies □ Rejected □ Hold □ Revise □
Final Evaluation Add comments and recommendation here Add final score here
A final score must be given to each project, depending on the number of times the evaluator
says “Yes” in the assessment. In total, the maximum points a project could receive is 7, if all
points (1.1-1.5; 2.1-2.2) are answered by “Yes”. Any project which receives 4 “Yes” responses
out of 7, will automatically qualify for the second screening at the MOF. If a project receives
less than 4 “Yes” responses, the Planning Directorate should communicate its concerns to the
Sponsor Department by sharing its written comments on the Project Assessment Sheet, as
well as through formal in-person meetings.1
If a project qualifies to be on the Draft Long List, the Planning Directorate sends both its
Project Information Sheet and Project Assessment Sheet to the MOF where they are screened
for a second time.
1 If N/A is picked for one or more of the answers, then at least 50% of the remaining responses should be “Yes” for
automatic qualification to the next stage. So, for instance, if 1 response is N/A, then out of the remaining 6, 3 should be “Yes”.

16
Second Screening Process
The second screening is conducted in the MOF. This second assessment is completed on the
same Project Assessment Sheet received from the Planning Directorate within the MPSA and
is again based on alignment with high-level policy priorities and budgetary constraints. At this
stage, the MOF will also score the project. Any project which receives 4 “Yes” responses out of
7, will automatically qualify for the project definition stage.2 If a project receives less than 4
“Yes” responses, the MOF should communicate its concerns to the Sponsor Department and
the Planning Directorate of the relevant MPSA by sharing its written comments on the Project
Assessment Sheet, as well as through formal in-person meetings.
For each project, the MOF review takes into account the alignment of the proposed project’s
objectives with national policy priorities as previously identified by the GRZ. If it feels that the
approval granted to the project is warranted or desirable, and that the project should proceed
with further preparation, the MOF will also approve the project and sign off on the Project
Assessment Sheet. If the project does not qualify to undergo further preparation, the MOF will
record this decision and provide input/commentary as to why this decision was taken.
The project and decision taken is recorded by the MOF in a Draft Long List. This List is a
record of all projects that have been screened by both the Planning Directorate in the MPSA
and the MOF, and have been approved for the next stage in the project lifecycle. The purpose
of the Draft Long List is to provide a record of which projects qualify to undergo further project
development.
1.3 DRAFT LONG LIST
Quarter | Year
No. Project Name Town,
District, Province
Sector Sub-
Sector Sponsor
Dept. Date of approval
from MOF
1
2
…
At this stage, the Draft Long List, accompanied by the relevant Project Information Sheets and
Project Assessment Sheets will be shared with the Cabinet Office.
All projects which receive approval from the MOF will be on the Draft Long List and proceed to
the Project Definition stage, while those which do not receive approval, will be sent back to the
Sponsor Department. The final decision taken within the MOF should be communicated clearly
and consistently to the Planning Directorate and Sponsor Department within the MPSA,
through the completed Project Assessment Sheet.
The benefits of this dual-screening process at the Project Identification Stage are outlined in
the Box below. The Draft Long List represents the key tool in the Project Identification Stage.
2 If N/A is picked for one or more of the answers, then at least 50% of the remaining responses should be “Yes” for
automatic qualification to the next stage. So, for instance, if 1 response is N/A, then out of the remaining 6, 3 should be “Yes”.

17
Box 1: Benefits of a Dual-Screening Process
Once a project has been through both screening processes, qualifies for further preparation,
and has been included on the Draft Long List, it moves on to Project Definition where it is
planned in greater detail.
Screen 1: Planning Directorate in the MPSA
The Planning Directorate within the MPSA is best-placed to assess projects put
forward by departments within the same MPSA. Its personnel have the knowledge and
the intimate sectoral understanding necessary to determine which projects are feasible
and preferable. Its links to the Ministry of Finance also make the process of
determining whether sufficient resources exist for the project easier.
Screen 2: Ministry of Finance
Although the Planning Directorate within the MPSA is able to take into account its own
sector-specific policy priorities, it is less well-placed when it comes to understanding
the project in terms of a broader national strategy. The Ministry of Finance is better
suited to this role; it is able to assess the project both on identified policy priorities as
well as on how the project complements or detracts from the objectives of other
projects currently in the pipeline. Ultimately, it is important that final oversight for
projects being instituted in the financing pipeline happens at a higher, centralized
authority level.

18
Project Identification
Project Definition
Pre-Feasibility
Detailed Feasibility
Financing
Implementation and Monitoring
Ex-post Impact Evaluation
02 PROJECT
DEFINITION
19
RATIONALE FOR THIS STAGE
If a project qualifies for further preparation, the Project Definition stage involves developing the
project idea. At this point, the project’s objective is clarified and key aspects that will help
inform whether the project is feasible are examined.
Specific aspects of the project are researched and developed in a Project Concept Note
(PCN). The PCN is different from the Project Information Sheet in that it contains more detailed
information on various aspects of the project and pays closer attention to how it will be
prepared and implemented. The purpose of the Project Concept Note is primarily to ensure
that sufficient information is collected for the Pre-Feasibility study in the next stage.
At this early stage of the project’s development it is also important that an enabling
environment is created for the project. The enabling environment refers to the relevant policies,
laws, regulations, and institutions which affect the development of the project. An assessment
of the institutional and legal situation is conducted using a Project Checklist that helps to
identify which of environmental factors are most likely to affect the successful implementation
of the project.
Once a Project Concept Note is approved, the project is ready to undergo preparation in the
Pre-Feasibility stage, as the key information necessary for undertaking the pre-feasibility study
is captured in the PCN.
20
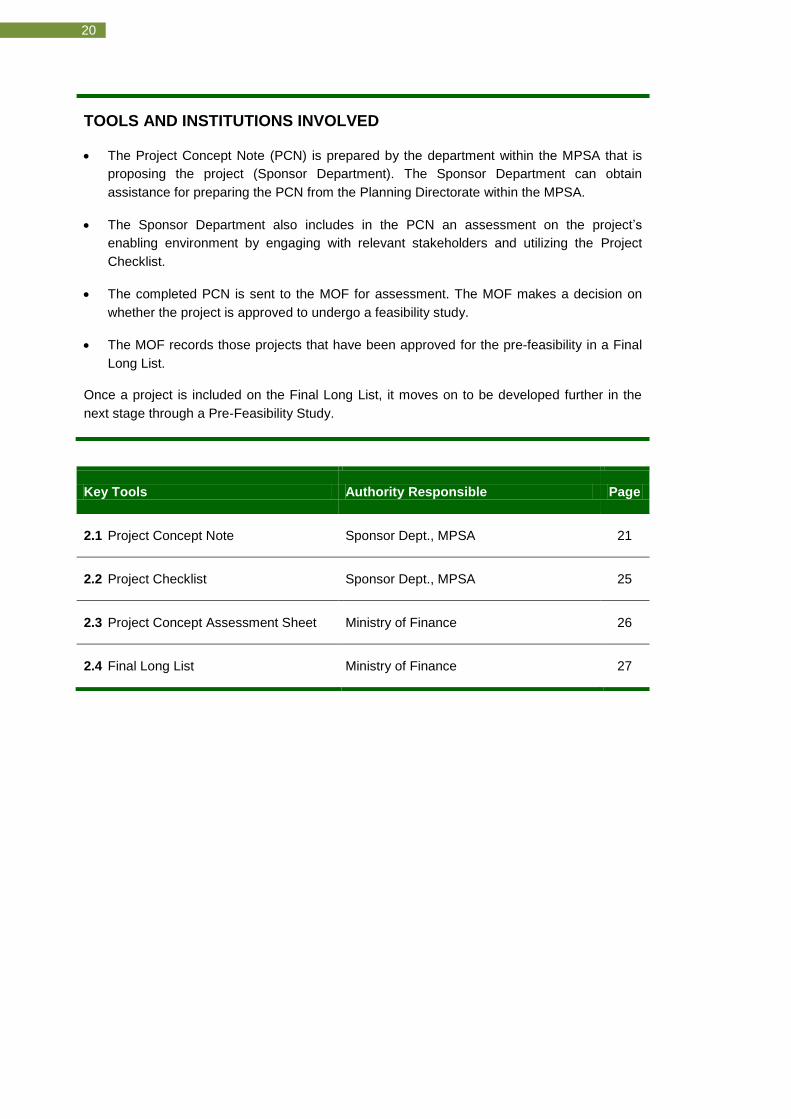
TOOLS AND INSTITUTIONS INVOLVED
The Project Concept Note (PCN) is prepared by the department within the MPSA that is
proposing the project (Sponsor Department). The Sponsor Department can obtain
assistance for preparing the PCN from the Planning Directorate within the MPSA.
The Sponsor Department also includes in the PCN an assessment on the project’s
enabling environment by engaging with relevant stakeholders and utilizing the Project
Checklist.
The completed PCN is sent to the MOF for assessment. The MOF makes a decision on
whether the project is approved to undergo a feasibility study.
The MOF records those projects that have been approved for the pre-feasibility in a Final
Long List.
Once a project is included on the Final Long List, it moves on to be developed further in the
next stage through a Pre-Feasibility Study.
Key Tools Authority Responsible Page
2.1 Project Concept Note Sponsor Dept., MPSA 21
2.2 Project Checklist Sponsor Dept., MPSA 25
2.3 Project Concept Assessment Sheet Ministry of Finance 26
2.4 Final Long List Ministry of Finance 27

21
To Recap: during Project Identification the project idea was formalized and documented in a
Project Information Sheet. This Sheet was screened first by the Planning Directorate in the
MPSA and then by the MOF. The screenings involved assessing whether the project qualifies
for further preparation based both on an alignment with policy priorities and on budget
affordability. Projects that qualified to undergo further development were included in a Draft
Long List, which is also shared with the Cabinet Office.
DEVELOPING THE PROJECT CONCEPT
Once a project has been selected for inclusion in the funding pipeline, a considerable amount
of preparation is done to take the project forward. The aim of this next stage – Project
Definition – is to define the project more clearly by preparing a Project Concept Note (PCN).
The PCN builds on the Project Information Sheet. It is a short (4 – 5 page) summary proposal
that is focused on the project concept, including clarifications on the project’s scope, initial
design options, financial cost estimates, key socio-economic costs and benefits, an
understanding of the institutional arrangements proposed, and potential sources of finance. It
also contains an indicative timeline for the preparation and implementation of the project.
The PCN is conducted before the full project design takes place, thus providing an
understanding of the project through a summary rather than a full report. This saves time and
effort in the assessment process and makes it easier to eliminate proposals that are unlikely to
be funded. It also reduces costs during project preparation by showcasing the project in broad
terms without large costs needed for detailed design. At this point it is also essential to plan the
timetable for the project with respect to the whole project life-cycle (including all project
development stages) and to set milestones which can be measured. These milestones are
stated in terms of clearly defined outputs and outcomes for each phase which must be
contained in the same Project Concept Note.
The Sponsor Department within the MPSA collects and reviews all the necessary data and
information required to complete the Project Concept Note. The Sponsor Department can
obtain assistance for preparing the PCN from the Planning Directorate within the MPSA.
The template below presents an outline of what the Project Concept Note should contain. It
contains relevant headings and commentary and questions under each which should be used
as a guide when preparing the document.
2.1 PROJECT CONCEPT NOTE
COVER SHEET
The Cover Sheet for the Project Concept Note is an updated version of the Project Information Sheet
prepared during the Project Identification stage.
PROJECT BACKGROUND AND OBJECTIVE
The objective of the project should be limited to a single, clear statement that aims to inform the reader
of the overarching developmental impact the project aims to achieve.
The background should be concise and should describe the context as well as the overall aims of the

22
project. It should answer the following key questions:
Problem Analysis: What are the key policy, institutional, social, economic, legal, and other
issues that impact the region, Zambia and the sector in which the project is concerned?
Previous Experience: What key projects or programmes have or are being conducted that
have a bearing on the implementation of this project and what are the lessons that have been
learned?
Rationale for Involvement: What is the rationale for the project based on the issues identified
and how does the project fit in line with national/regional/sectoral policy priorities?
PRELIMINARY PROJECT DESCRIPTION
The preliminary project description aims to provide clarity on the project, including:
Components: Describe the main project activities that will be undertaken.
Costs: Provide estimated preparation, capital and operating costs broken down by each
component of the project.
STAKEHOLDER ASSESSMENT
The stakeholder assessment aims to list the different stakeholders impacted by or involved in the project
and then identify any potential issues for the project relating to each. This information is recorded in the
table that follows:
Stakeholders and their Roles
Role Stakeholder
Project Sponsor Department / MPSA
Implementing Authority
Local government authority
Donor Organisations
NGOs / NPOs / CBOs
Civil Society Organisations
Organised Labour
Local Committees
Others
Overall, the stakeholder assessment will inform the future design of the project and provide an insight into
the role of key actors both in the project preparation and implementation processes. Possible
partnerships/co-funding arrangements can also be identified here.
RISK MITIGATION ARRANGEMENTS
The risks related to the project need to be identified and mitigation measures proposed for each.
These should be assessed with respect to the different risk types outlined in table below with each risk
described in detail and its perceived risk level identified. Proposed mitigation measures should then be
described for each risk.

23
Perceived Risks and Proposed Mitigation Measures
Risk Identified Risk Level Proposed Mitigation Measures
Describe risk.
Note high/medium/low risk and colour cell red/yellow/ green respectively.
Describe risk mitigation measures identified by Sponsor Department, MPSA.
Political risks
Policy-related risks
Social risks
Institutional risks
Fiduciary risks
Legal risks
Macro-economic risks
Financial risks
Other safeguard mechanisms
Etc.
WAY FORWARD
In proposing how the preparation of the project should proceed, a number of key recommendations
need to be outlined. These include:
A recommendation as to whether the project should undergo a Feasibility Study,
An outline of what specialist studies might be required to determine the project’s impacts3, and
Recommendations on a potential financing strategy for the project.
The project preparation process must also be outlined, including details relating to:
The proposed timetable of the next and other key steps in the preparation process (appraisal,
detailed feasibility, review, approval, financing, etc.)
The members of the project team (list titles, department/unit, MPSA), including capacity gaps
that may need to be filled by external consultants.
The estimated amount of funds needed for the entire process of project preparation.
PREPARATION TIMETABLE
The following Preparation Timetable should be completed. It provides an indicative timeline of the
different steps of project preparation and will aid in understanding the resources required for each.
3 These refer, for example, to key types of impact assessment such an Environmental Impact Statement Assessment
(EISA), or thematic types of impact assessment such as a Social, Health or Gender Impact Assessment.

24
PLANNED ACTIVITIES
TIME-FRAME*
AUTHORITY RESPONSIBLE
YEAR 1 YEAR 2 …
Q1 Q2 Q3 Q4 Q1 Q2 Q3 Q4 …
List the various project preparation activities necessary
(Sponsor Department, MPSA; Planning
Directorate, MPSA; etc.)
…
* Time-Frame can be adapted to different time periods (e.g. quarterly, monthly, yearly, etc.)
IMPLEMENTATION TIMETABLE
The following Implementation Timetable should be completed. It provides an indicative timeline of the
project’s planned activities and will help guide the more detailed preparation of the project that follows.
PLANNED ACTIVITIES
TIME-FRAME*
AUTHORITY RESPONSIBLE
YEAR 1 YEAR 2 …
Q1 Q2 Q3 Q4 Q1 Q2 Q3 Q4 …
List the various project components
and activities planned under these
components here
(Sponsor Department, MPSA; Planning
Directorate, MPSA; etc.)
…
* Time-Frame can be adapted to different time periods (e.g. quarterly, monthly, yearly, etc.)
ENSURING AN ENABLING ENVIRONMENT
In order for the project preparation and implementation to proceed efficiently, an enabling
environment for the project needs to be established; this involves identifying the legal,
regulatory, institutional, and other factors that may have an influence or impact on the project.
A straightforward and quick way of conducting this process is to use a Project Checklist to
guide the investigation and note down the key risk factors the project may face.
The Infrastructure Consortium for Africa provides a useful guide for countries in ensuring that
projects are allowed and supported4. A number of areas for attention are outlined in the Project
Checklist template below, which must be completed by the Sponsor Department along with the
Project Concept Note.
4 ICA. 2006. Infrastructure Project Preparation.

25
2.2 PROJECT CHECKLIST
Tick box if area of attention has been considered in the Project Concept Note. Provide
comments where necessary.
Legislation Context
Legal agreements which enable the development of projects must be reviewed (e.g.
restructuring of state owned utilities, restrictions on foreign capital, labour laws,
environmental and health laws). If appropriate, new enabling legislation may be identified
and developed for the efficient execution of the project.
□
Regulatory Approaches
Pre-existing regulation in the sector must be identified (e.g. tariff settings, subsidies,
guarantees, tax breaks, regulatory processes) along with regulatory bodies. If they are
deemed to be unable to support project development, these may need to be developed,
reviewed, or possible changed.
□
Institutional Reforms
Institutions that influence project development must be reviewed and possible overlaps
(such as inconsistencies in the mandates for national and local authorities) in authority
identified and resolved. The roles of key government ministries, departments and
agencies must also be clarified.
□
Capacity Building
Stakeholders in the project may require specialised training for the development of the
project. Learning key lessons from other similar projects and project contexts may prove
useful.
□
Consensus Building
Less tangible, consensus building within government and with the wider stakeholder
community is vital to a project’s success. This may involve, for example, internal
workshops and public hearings with a resulting change in sector development strategy to
support the project’s goals.
□
CREATING A FINAL ‘LONG LIST’ OF PROJECTS
The Draft Long List of projects was developed through the dual screening process in the
Project Identification stage of the Project Development Cycle. This was when the Project
Information Sheet was assessed both by the Planning Directorate in the MPSA and then by
the Ministry of Finance based on project alignment with policy priorities and a broad
assessment of budget affordability. The Draft Long List is then shared with the Cabinet Office.

26
These projects then went forward to be prepared through the development of the Project
Concept Note.
Once the PCN has been developed it gets sent to the MOF. The MOF will assess the Project
Concept Note using a Project Concept Assessment Sheet as shown below. The MOF
assesses the project based both on identified policy priorities at a broader national and
strategic level as well as on how the project complements or detracts from the objectives of
other projects currently being prepared. Therefore, this assessment is based on project policy
alignment and affordability. The MOF then makes a decision, recorded in this document, as to
whether the project is approved for pre-feasibility analysis or not. If approved, the project will
be appraised through a Pre-Feasibility Study.
2.3 PROJECT CONCEPT ASSESSMENT SHEET
PROJECT TITLE
No. Criteria Yes No N/A
1 POLICY PRIORITIES
1.1
Project contributes towards National Policy Priorities as outlined in the SNDP Add additional comments here
□ □
1.2 Project contributes towards National Policy Priorities as outlined in the Vision 2030 Add additional comments here
□ □ □
1.3 Project contributes towards sector policy priorities Add additional comments here
□ □ □
1.4 Project contributes towards other policy priorities Add additional comments here
□ □ □
1.5
Project falls within institutional mandate of the sponsor department Add additional comments here
□ □ □
2 BUDGET
2.1 Estimated project cost has been reviewed against MTEF and MPSA allocation Add additional comments here, particularly around whether project cost can be supported under the current MTEF
□ □ □

27
allocation
2.2
There is potential for leveraging non-government financing for the project Add additional comments here, particularly around potential financing sources outside of the Government identified in the project concept note
□ □ □
3 OTHER COMMENTS OR CONCERNS
Add comments here
MOF Assessment Approved □ Rejected □ Hold □ Revise □
Final Evaluation Add comments and final recommendation here
Add final score here
A final score must be given to each project, depending on the number of times the evaluator
says “Yes” in the assessment. In total, the maximum points a project could receive is 7, if all
points (1.1-1.5; 2.1-2.2) are answered by “Yes”. Any project which receives 4 “Yes” responses
out of 7, will automatically qualify for proceeding to pre-feasibility. Of these 4, at least 1 should
be from section 1 on policy priorities and at least 1 should be from section 2 on budget. If a
project receives less than 4 “Yes” responses, the MOF should communicate its concerns to the
Sponsor Department by sharing its written comments on the Project Concept Assessment
Sheet, as well as through formal in-person meetings.5
The MOF records those projects which have been approved to undergo a Pre-Feasibility Study
(the next stage in project development) in a Final Long List.
2.5 FINAL LONG LIST
Quarter | Year
No. Project Name Town;
District; Province
Sector Sub-
Sector
MPSA| Sponsor
Dept.
Date of approval
from MOF
1
2
…
Note: This Table includes only those projects approved to undergo Pre-Feasibility Studies
5 If N/A is picked for one or more of the answers, then at least 50% of the remaining responses should be “Yes” for
automatic qualification to the next stage. So, for instance, if 1 response is N/A, then out of the remaining 6, 3 should be “Yes”. The rule of at least one “Yes” being from section 1, and at least 1 “Yes” being from Section 2 would continue to apply.

28
The Final Long List provides a number of key details relating to the project and is a
consolidated document for projects that have been approved to undergo a Pre-Feasibility
Study. The Final Long List is also sent to the Cabinet Office for its records.
The Final Long List represents the final key tool in the Project Definition Stage. Once a project
has been included on the Final Long List, it moves on to Pre-Feasibility where the project will
begin to be appraised.

29
Project Identification
Project Definition
Pre-Feasibility
Detailed Feasibility
Financing
Implementation and Monitoring
Ex-post Impact Evaluation
03 PRE-FEASIBILITY

30
RATIONALE FOR THS STAGE
The primary aim of the Pre-Feasibility stage is to determine whether the project exhibits
sufficient value to undergo a full Feasibility Study. The Pre-Feasibility study takes the project
concept developed in the Project Definition stage and does an initial, more detailed
interrogation of the different aspects of the project.
The Pre-Feasibility Study (PFS) includes an assessment of the project’s technical, legal,
financial, institutional, risk, and socio-economic aspects. Importantly, it contains an options
analysis that aims to identify only those options that are most promising for the project.
The key aspect of appraising the project and its various technical options in the PFS is
contained in its Cost-Benefit Analysis (CBA). CBA is a methodology for appraising the financial
and economic value of investing in a project and gives an indication of whether the project will
result in a net positive impact on society in both financial and economic terms. The CBA is the
main method used to compare technical options and to assess those with the most potential.
It is important to note the difference between the Pre-Feasibility and Detailed Feasibility Study
that happens afterwards. The PFS is focused on providing a higher-level, more conceptual
(and, hence, less costly) engineering design for the project and identifying options that are
most likely to be feasible given the different technologies available. The Detailed Feasibility
Study (DFS) interrogates these chosen design options in much greater detail.
Similarly, the level of analysis on other aspects of the project (such as on financial, socio-
economic, institutional, and environmental criteria) is less detailed in the PFS than in the
Feasibility Study that follows. The CBA in the PFS, for example, will be based more on readily
available data compared to the DFS, which may include data gathered specifically for the
purpose of the analysis. This is because detailed assessment is generally costly and time
consuming.
The project moves to the Detailed Feasibility stage once its economic viability has been
established in the pre-feasibility study. This would save the resources that would otherwise be
allocated for conducting a detailed assessment, only to find that the project does not proceed..

31
TOOLS AND INSTITUTIONS INVOLVED
The MOF takes responsibility for issuing Guidelines on Cost-Benefit Analysis which will be
used in the preparation of the Pre-Feasibility Study.
The project Sponsor Department prepares the Pre-Feasibility Study, with technical
assistance from the Planning Directorate within the MPSA, inputs from relevant SAGs, and
external consultants.
Once the Pre-Feasibility Study has been prepared, it passes to a common ‘Gateway’
where it is reviewed.
The Gateway appraises the project by using a Pre-Feasibility Appraisal Form, which
checks the project against a specified set of criteria. It then decides whether the project
is approved for further preparation, rejected, put on hold, or sent back for revision.
The Gateway records those projects that are approved in a Draft Short List.
Projects approved by the Gateway at this point will move on to the next stage in the Project
Development Cycle, the Detailed Feasibility Stage, where they will undergo further
preparation.
Key Tools Authority Responsible Page
3.1 Cost Benefit Analysis Outline Ministry of Finance 35
3.2 CBA Executive Summary Sponsor Department, MPSA 36
3.3 Pre-Feasibility Study Sponsor Department, MPSA 38
3.4 Pre-Feasibility Appraisal Form Gateway 45
3.5 Draft Short List Gateway 47
32
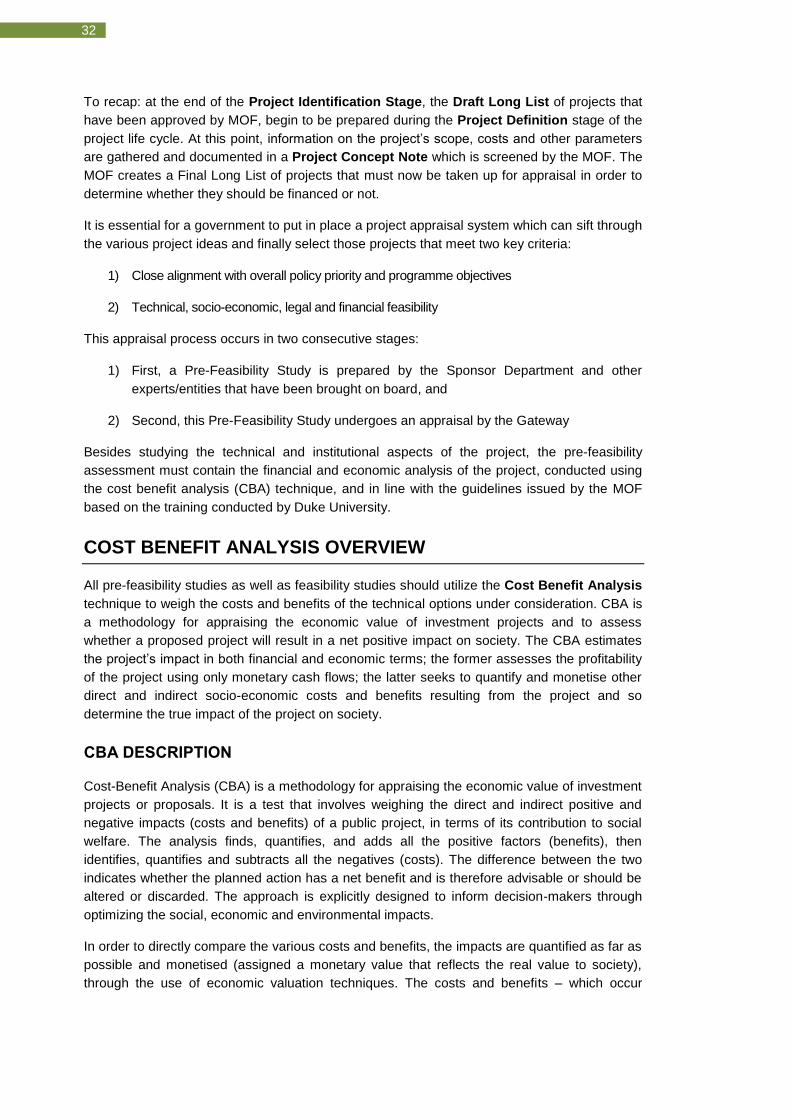
To recap: at the end of the Project Identification Stage, the Draft Long List of projects that
have been approved by MOF, begin to be prepared during the Project Definition stage of the
project life cycle. At this point, information on the project’s scope, costs and other parameters
are gathered and documented in a Project Concept Note which is screened by the MOF. The
MOF creates a Final Long List of projects that must now be taken up for appraisal in order to
determine whether they should be financed or not.
It is essential for a government to put in place a project appraisal system which can sift through
the various project ideas and finally select those projects that meet two key criteria:
1) Close alignment with overall policy priority and programme objectives
2) Technical, socio-economic, legal and financial feasibility
This appraisal process occurs in two consecutive stages:
1) First, a Pre-Feasibility Study is prepared by the Sponsor Department and other
experts/entities that have been brought on board, and
2) Second, this Pre-Feasibility Study undergoes an appraisal by the Gateway
Besides studying the technical and institutional aspects of the project, the pre-feasibility
assessment must contain the financial and economic analysis of the project, conducted using
the cost benefit analysis (CBA) technique, and in line with the guidelines issued by the MOF
based on the training conducted by Duke University.
COST BENEFIT ANALYSIS OVERVIEW
All pre-feasibility studies as well as feasibility studies should utilize the Cost Benefit Analysis
technique to weigh the costs and benefits of the technical options under consideration. CBA is
a methodology for appraising the economic value of investment projects and to assess
whether a proposed project will result in a net positive impact on society. The CBA estimates
the project’s impact in both financial and economic terms; the former assesses the profitability
of the project using only monetary cash flows; the latter seeks to quantify and monetise other
direct and indirect socio-economic costs and benefits resulting from the project and so
determine the true impact of the project on society.
CBA DESCRIPTION
Cost-Benefit Analysis (CBA) is a methodology for appraising the economic value of investment
projects or proposals. It is a test that involves weighing the direct and indirect positive and
negative impacts (costs and benefits) of a public project, in terms of its contribution to social
welfare. The analysis finds, quantifies, and adds all the positive factors (benefits), then
identifies, quantifies and subtracts all the negatives (costs). The difference between the two
indicates whether the planned action has a net benefit and is therefore advisable or should be
altered or discarded. The approach is explicitly designed to inform decision-makers through
optimizing the social, economic and environmental impacts.
In order to directly compare the various costs and benefits, the impacts are quantified as far as
possible and monetised (assigned a monetary value that reflects the real value to society),
through the use of economic valuation techniques. The costs and benefits – which occur
33
throughout the project lifetime – are then discounted to a
present-day value to find the net present value of the project.
The purpose of conducting a CBA is to assess whether a
proposed project, as it is currently designed, will result in a net
positive impact on society. Importantly, a CBA estimates this
impact in both financial and economic terms. A CBA seeks to
identify the financial, economic and social implications of the
viable project alternatives in order to identify the best
alternative.6
Given that profit is generally not the main objective in the
development of public-sector programmes and projects in
Zambia; a CBA serves to indicate whether there is a socio-economic rationale for the public
provision of a good/service because it will generate a positive net social benefit, even when the
project may not necessarily be financially profitable. The primary objectives of the Government
of the Republic of Zambia (GRZ) are geared towards socio-economic development and
building human capital; project CBAs must therefore be conducted with these priorities in mind.
Moreover, in addition to being an evaluation tool that enables more scientific choice of project
design; in the case of joint project ventures, CBA can be used as a tool for cost and benefit
sharing with a view to promoting optimality, efficiency, equity and fairness.
FINANCIAL AND ECONOMIC APPRAISALS
The financial and economic appraisals are the most important parts of a CBA.
The financial appraisal of an investment project is an assessment of the costs and benefits in
terms of project expenditures and incomes at market prices (cash flows, profitability, and the
application of funds). It gives an indication of the pressure the project will place on the project
budget, and the degree of subsidization it may require to be financially viable and sustainable.
Further, it also reflects the profitability of the project at market prices which is an important
starting point in any comprehensive CBA. While the options appraisal should put forward a
brief assessment of the costs associated with each technical option; the financial appraisal
will consist of a full cash flow analysis, i.e. analysis of all expenditures (i.e. outflows) and
revenues (i.e. inflows) stemming from the project’s design.
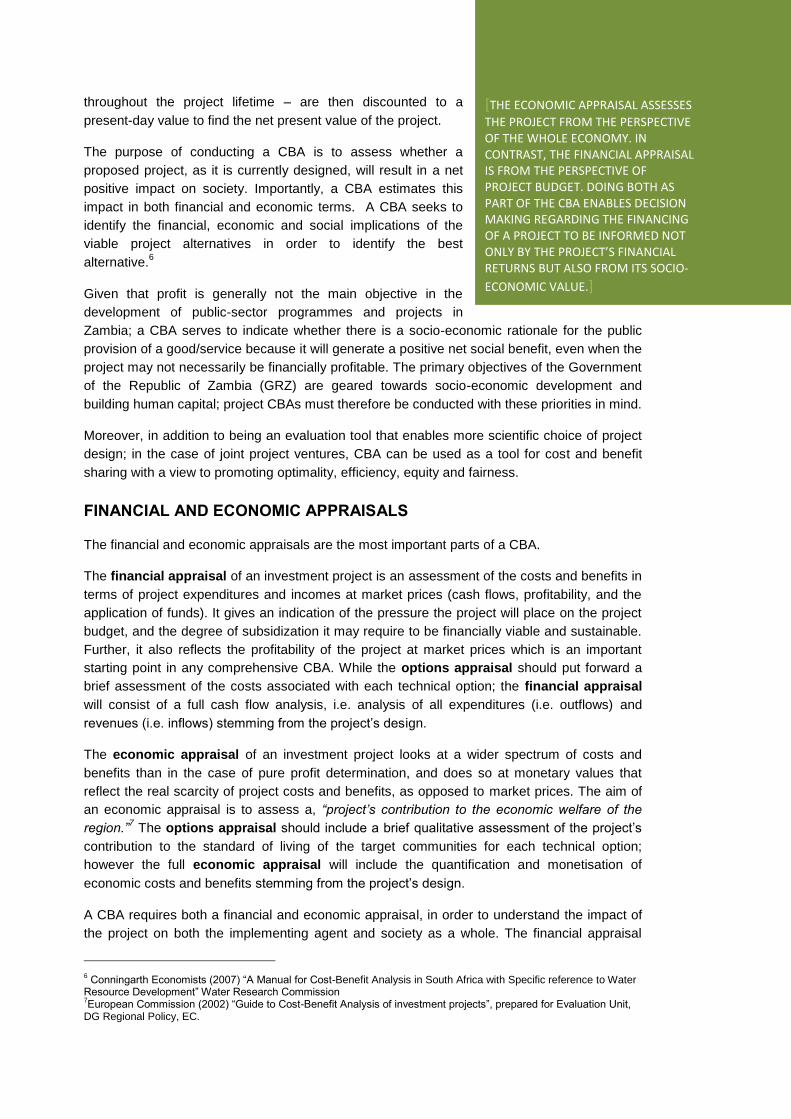
The economic appraisal of an investment project looks at a wider spectrum of costs and
benefits than in the case of pure profit determination, and does so at monetary values that
reflect the real scarcity of project costs and benefits, as opposed to market prices. The aim of
an economic appraisal is to assess a, “project’s contribution to the economic welfare of the
region.”7 The options appraisal should include a brief qualitative assessment of the project’s
contribution to the standard of living of the target communities for each technical option;
however the full economic appraisal will include the quantification and monetisation of
economic costs and benefits stemming from the project’s design.
A CBA requires both a financial and economic appraisal, in order to understand the impact of
the project on both the implementing agent and society as a whole. The financial appraisal
6 Conningarth Economists (2007) “A Manual for Cost-Benefit Analysis in South Africa with Specific reference to Water
Resource Development” Water Research Commission 7European Commission (2002) “Guide to Cost-Benefit Analysis of investment projects”, prepared for Evaluation Unit,
DG Regional Policy, EC.
[THE ECONOMIC APPRAISAL ASSESSES
THE PROJECT FROM THE PERSPECTIVE OF THE WHOLE ECONOMY. IN CONTRAST, THE FINANCIAL APPRAISAL IS FROM THE PERSPECTIVE OF PROJECT BUDGET. DOING BOTH AS PART OF THE CBA ENABLES DECISION MAKING REGARDING THE FINANCING OF A PROJECT TO BE INFORMED NOT ONLY BY THE PROJECT’S FINANCIAL RETURNS BUT ALSO FROM ITS SOCIO-
ECONOMIC VALUE.]
34
serves to first focus purely on monetary revenues and costs borne by the entity; while the
economic appraisal then factors in non-revenue related benefits and costs to the larger
society. Since many of the outputs of social/environmental projects are not traded in markets
for goods and services, financial costs and revenues fail to capture the social/environmental
benefits associated with such projects. Hence, on the basis of financial criteria only,
social/environmental investments may fail to prove viable enough to secure public funds.
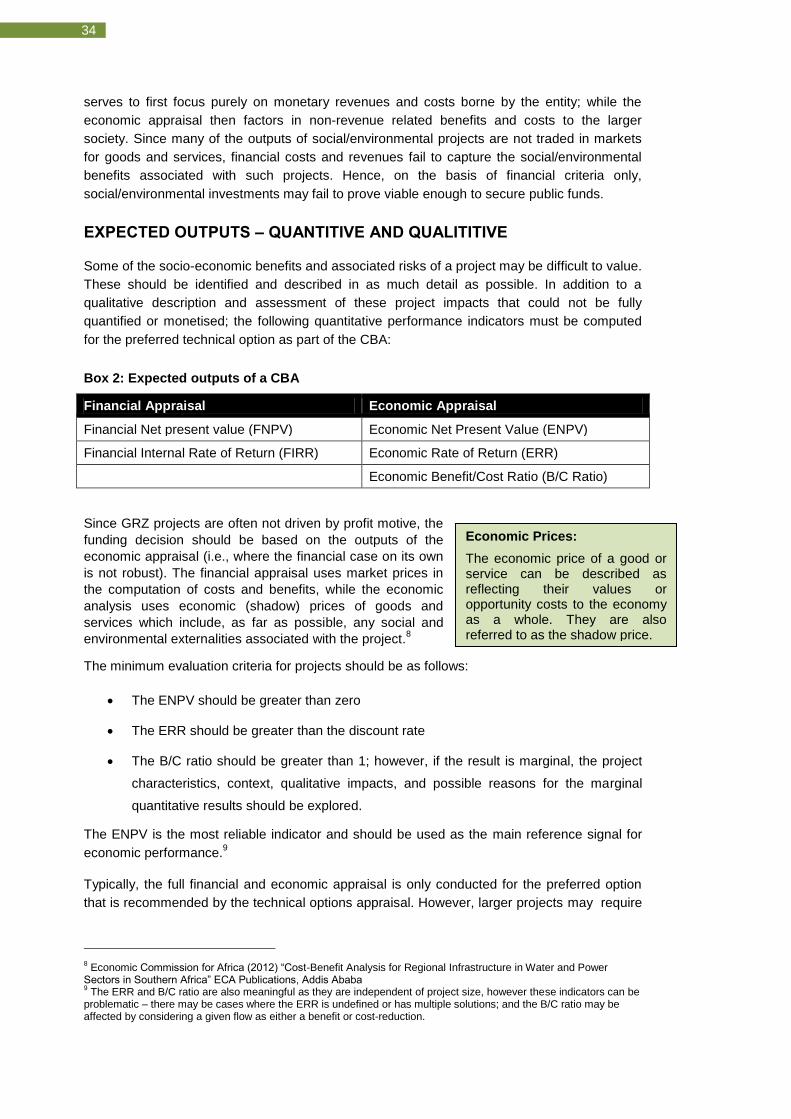
EXPECTED OUTPUTS – QUANTITIVE AND QUALITITIVE
Some of the socio-economic benefits and associated risks of a project may be difficult to value.
These should be identified and described in as much detail as possible. In addition to a
qualitative description and assessment of these project impacts that could not be fully
quantified or monetised; the following quantitative performance indicators must be computed
for the preferred technical option as part of the CBA:
Box 2: Expected outputs of a CBA
Financial Appraisal Economic Appraisal
Financial Net present value (FNPV) Economic Net Present Value (ENPV)
Financial Internal Rate of Return (FIRR) Economic Rate of Return (ERR)
Economic Benefit/Cost Ratio (B/C Ratio)
Since GRZ projects are often not driven by profit motive, the
funding decision should be based on the outputs of the
economic appraisal (i.e., where the financial case on its own
is not robust). The financial appraisal uses market prices in
the computation of costs and benefits, while the economic
analysis uses economic (shadow) prices of goods and
services which include, as far as possible, any social and
environmental externalities associated with the project.8
The minimum evaluation criteria for projects should be as follows:
The ENPV should be greater than zero
The ERR should be greater than the discount rate
The B/C ratio should be greater than 1; however, if the result is marginal, the project
characteristics, context, qualitative impacts, and possible reasons for the marginal
quantitative results should be explored.
The ENPV is the most reliable indicator and should be used as the main reference signal for
economic performance.9
Typically, the full financial and economic appraisal is only conducted for the preferred option
that is recommended by the technical options appraisal. However, larger projects may require
8 Economic Commission for Africa (2012) “Cost-Benefit Analysis for Regional Infrastructure in Water and Power
Sectors in Southern Africa” ECA Publications, Addis Ababa 9 The ERR and B/C ratio are also meaningful as they are independent of project size, however these indicators can be
problematic – there may be cases where the ERR is undefined or has multiple solutions; and the B/C ratio may be affected by considering a given flow as either a benefit or cost-reduction.
Economic Prices:
The economic price of a good or service can be described as reflecting their values or opportunity costs to the economy as a whole. They are also referred to as the shadow price.

35
a full financial and/or economic appraisal for several options. This decision should be taken on
a project by project basis.
VALUE FOR MONEY (VfM)
The conclusion, and associated recommendations, of every CBA must include a statement of
the VfM that will be achieved by the project. A VfM statement is an interpretation of the
qualitative and quantitative outputs of the financial and economic appraisal. Where possible,
the VfM statement should indicate the VfM of the project from the perspective of the project
beneficiaries and from the perspective of GRZ (see the Value for Money section in Chapter 6
Implementation and Monitoring Plan for further details).
The detail and comprehensiveness of a CBA will vary according to the size and complexity of
the project, but every CBA should consider the core components outlined in the table below.
3.1 COST BENEFIT ANALYSIS OUTLINE
Note: These guidelines provide an overview of Cost-Benefit Analysis. They are not exhaustive
and a full CBA should be undertaken by an expert who has had the necessary training.
CBA Component Basic Explanation
Context & objectives
Socio-economic context & needs / demand analysis
Project objectives
Definition of project boundaries/parameters
Options analysis Outline of technically viable options to achieve the project
objective, based on technology available and institutional capacity
Justification of preferred options
Financial analysis Sources of finance
Application of funds
Discounted cash flows (expenditures and revenues)
o Financial Net Present Value (FNPV)
o Financial Internal Rate of Return
Economic analysis Discounted net costs and benefits
o Economic Net Present Value (ENPV)
o Economic Internal Rate of Return (ERR)

36
o Economic benefit to cost ratio (EBC)
Description of qualitative impacts
Risk Analysis Identify the key technical, financial, legal, regulatory, institutional,
social and other risks facing the project.
Sensitivity analysis Robustness Check for the key assumptions used in the financial
and economic appraisal
Based on the key risk factors identified for in the project setting
Sustainability Analysis
Based on the financial and economic analysis results, an
assessment of the on-going sustainability of the project
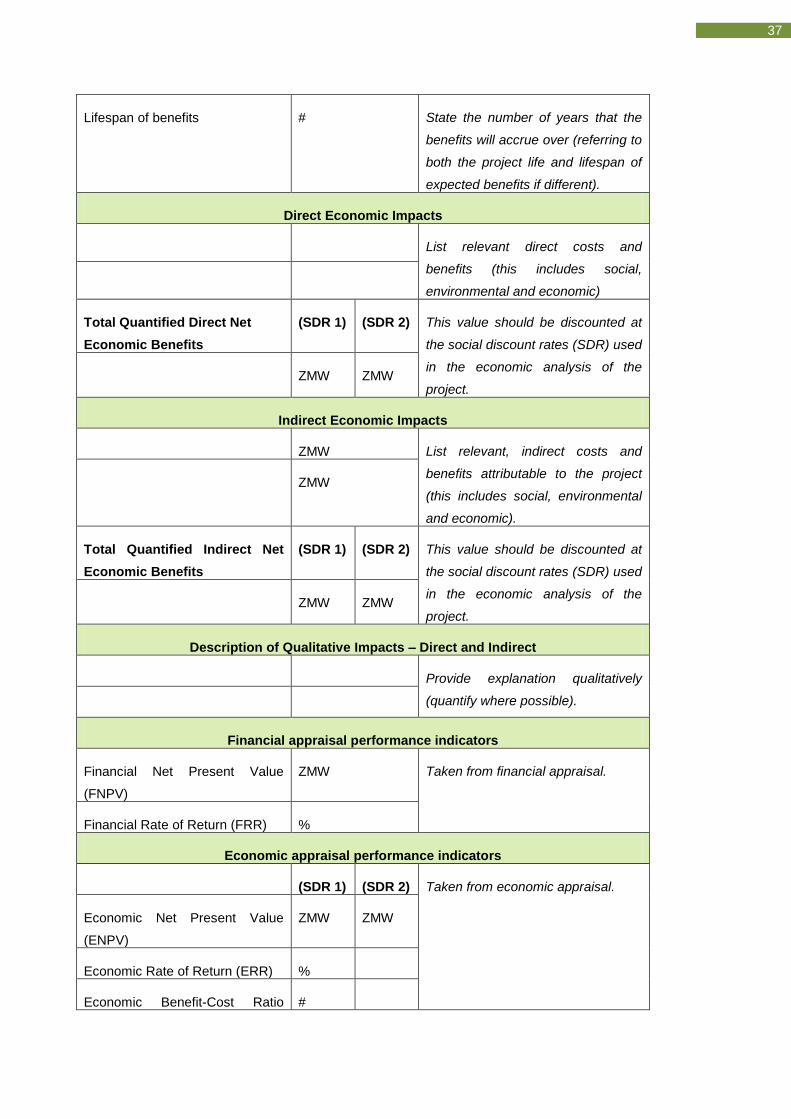
Further, it is recommended that a CBA Executive Summary Table is completed to clearly
records key information of the financial and economic analyses conducted on the project. It is
recommended that this CBA Executive Summary Table be included in the executive
summaries of any pre-feasibility and feasibility study that is undertaken.
3.2 CBA EXECUTIVE SUMMARY TEMPLATE
Indicator Values/comments Guidance
Budget
Project preparation and Technical Assistance by GRZ
ZMW Fill in the lines which are relevant or
else say N/A.
Project preparation and Technical Assistance by external sources
ZMW
Capital expenditure financed by external sources
ZMW
Total GRZ budget ZMW
Total external funding ZMW
Total Budget ZMW
Beneficiaries
Direct beneficiary households # Fill in the lines which are relevant or
else say N/A. Indirect beneficiary households #
Assumed number of people per
household
#
37
Lifespan of benefits # State the number of years that the
benefits will accrue over (referring to
both the project life and lifespan of
expected benefits if different).
Direct Economic Impacts
List relevant direct costs and
benefits (this includes social,
environmental and economic)
Total Quantified Direct Net
Economic Benefits
(SDR 1) (SDR 2) This value should be discounted at
the social discount rates (SDR) used
in the economic analysis of the
project. ZMW ZMW
Indirect Economic Impacts
ZMW List relevant, indirect costs and
benefits attributable to the project
(this includes social, environmental
and economic).
ZMW
Total Quantified Indirect Net
Economic Benefits
(SDR 1) (SDR 2) This value should be discounted at
the social discount rates (SDR) used
in the economic analysis of the
project. ZMW ZMW
Description of Qualitative Impacts – Direct and Indirect
Provide explanation qualitatively
(quantify where possible).
Financial appraisal performance indicators
Financial Net Present Value
(FNPV)
ZMW Taken from financial appraisal.
Financial Rate of Return (FRR) %
Economic appraisal performance indicators
(SDR 1) (SDR 2) Taken from economic appraisal.
Economic Net Present Value
(ENPV)
ZMW ZMW
Economic Rate of Return (ERR) %
Economic Benefit-Cost Ratio #

38
(B/C Ratio)
Sustainability
Discuss the perceived
sustainability of the project; and
explain the financing plan for
operations and maintenance
going forward
Provide explanation in words.
DEVELOPING THE PRE-FEASIBILITY STUDY
The key tool of the Pre-Feasibility stage is a Pre-Feasibility Study. This is a tool that attempts
to determine whether a project is feasible or not and is a document covering the technical,
legal, financial, and socio-economic aspects of a project. The Report is prepared by the
Sponsor Department, with technical guidance from the Planning Directorate within the same
MPSA and inputs from relevant SAGs.
The Pre-Feasibility Study (PFS) includes an assessment of the project’s technical, legal,
financial, institutional, risk, and socio-economic aspects. Compared to the Detailed Feasibility
Study, the PFS is focused on providing a higher-level, more conceptual (and, hence, less
costly) engineering design for the project and identifying options that are most likely to be
feasible given the different technologies available. The Detailed Feasibility Study interrogates
these chosen design options in much greater detail.
If the project budget is small, or if a technical design option for the project has already been
decided upon by various stakeholders, it may not be necessary to conduct both Feasibility
Studies, which can be combined into one. Care must be taken, though, that the chosen option
is indeed cost-effective and its feasibility verified. Failure to do so may result in high cost
overruns later on during project implementation.
The project Sponsor Department prepares the Pre-Feasibility Study, with technical
assistance from the Planning Directorate within the MPSA, inputs from relevant SAGs, and
external consultants. The template below outlines the Pre-Feasibility Study and provides
guidance on what content should be included.
3.3 PRE-FEASIBILITY STUDY
COVER SHEET
The Cover Sheet is the same as that for the Project Concept Note.
CONTENTS
List of Tables / Figures / Abbreviations / Key Terms

39
Executive Summary
0. Introduction
1. Project Objective
1.1. Objective
1.2. Contribution towards high-level development goals
2. Project Background
2.1. Needs Analysis
2.2. Previous Interventions and Lessons Learned
3. Options Assessment
3.1. Outline of Technical Options
3.2. High-level Comparison of Options
3.3. Recommended Option
4. Appraisal
5. Way Forward
5.1. Procurement Choice Recommendation
5.2. Potential Financing Options
5.3. Proposed Implementation Timeline
5.4. Risk Mitigation Arrangements
6. Forthcoming Feasibility Study
6.1. Further studies required
6.2. Terms of Reference for Feasibility Study
7. References
8. Annexes
TERMS AND ABBREVIATIONS
This section should list the various terms, abbreviations and acronyms used in the report. It will provide
the reader with a reference point when going through the document.
EXECUTIVE SUMMARY
The Executive Summary section summarises the entire document. It is not a background or introduction
and should allow the reader to get an idea of what the document entails independently of the rest of the
report. Specifically, it aims to:
Provide a brief overview of the entire report so that a reader may read the executive summary
alone without reading the entire document;

40
Provide complete and specific information that can be understood in isolation;
Allow the reader to understand the information in the report in a reasonably short space of time;
Make the reader aware of the key conclusions and recommendations of the document.
The CBA Executive Summary Table (as per template 3.2 of this manual) should be included
here.
0. INTRODUCTION
Include in this section information pertaining to the following:
Purpose of this document
A brief introduction to the project, including:
o Location
o Objective(s)
o Scope
o Sponsor Department/MPSA
o Person/Consultant/Organisation conducting this Feasibility Study
o Expected project outcomes
o Estimated Cost
Layout of this document
1. PROJECT OBJECTIVE
1.1. OBJECTIVE
What is the project’s expected objective? That is, if the project is successful, what will be its specific
contribution to the target communities?
1.2. CONTRIBUTION TOWARDS HIGHER-LEVEL DEVELOPMENT GOALS
How does the project fit with national/regional/sectoral policy priorities or contribute towards obtaining
national/regional/sectoral goals as outlined in the SNDP and/or other policy papers?
How does this project create cross-cutting linkages to other departments/MPSA’s social objectives?
2. PROJECT BACKGROUND
2.1. NEEDS ANALYSIS
What are the key policy, institutional, social, economic, legal, and other issues that impact the region,
Zambia and the sector in which the project is situated?
What is being done to address the above outlined issues at a policy and programme level (e.g. poverty

41
reduction strategies, sectoral strategies, strategic frameworks, etc.)?
What is the envisioned contribution of this project to these policies and programmes?
2.2. PREVIOUS INTERVENTIONS AND LESSONS LEARNED
What key projects or programmes have or are being conducted that have a bearing on the
implementation of this project?
What lessons drawn from these experiences have influenced this project and how have they done so?
3. OPTIONS ANALYSIS
The purpose of this section is to undertake a high-level assessment of the possible technical options that
could be employed to undertake the project. The range of options will depend on the nature of the project
objectives.
The options analysis in the pre-feasibility is focused on providing a higher-level, more conceptual (and,
hence, less costly) engineering design for the project. It aims to identify the options that are most likely to
be feasible given the different technologies available and narrow them down to select only the most
promising. The Detailed Feasibility Study in the next stage of project development will then interrogate
these selected design options in much greater detail.
Similarly, the level of analysis on other aspects of the project (such as on financial, socio-economic,
institutional, and environmental criteria) is less detailed in the Pre-Feasibility Study than in the Feasibility
Study. This is generally because detailed assessment of options can be costly and time consuming,
something which is especially true for larger projects, where a wider range of options should be
considered before they are short listed for Detailed Feasibility and appraisal.
This section should therefore focus on the following three tasks:
1. Developing different technical options for the project
2. Conducting a high-level comparison of these options based on a certain set of criteria, most
notably the net financial and economic benefit of each, and
3. Providing guidance on which option is most preferred.
Both qualitative as well as quantitative benefits associated with a particular option must be factored in to
the analysis. Some qualitative benefits may not (or, not yet) be quantifiable – and hence not offset costs –
so it is important that they are identified early on at this stage of the project development.
A number of criteria for the Pre-Feasibility options analysis can be found in the table below:
Demand Analysis Assessing the demand for a specific good or service and exploring various
constraints that may affect this (such as certain regulations).
Technical Analysis Determining a broad outline of the technological design for each option, including
its various components, size, location, implementation schedule, and procurement
procedures.
Cost Effectiveness
Analysis
Determining the costs of the various technical options and conducting an
analysis of which option is most cost-effective (i.e. achieves the project
objective at the lowest cost)
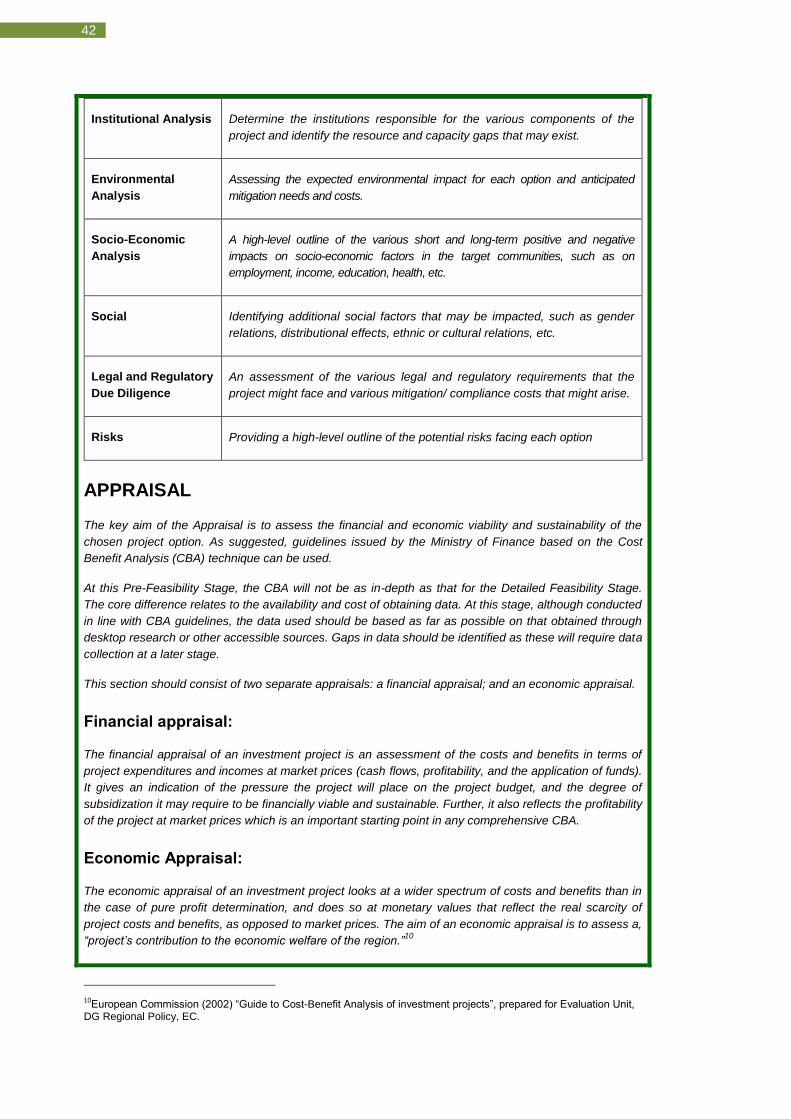
42
Institutional Analysis Determine the institutions responsible for the various components of the
project and identify the resource and capacity gaps that may exist.
Environmental
Analysis
Assessing the expected environmental impact for each option and anticipated
mitigation needs and costs.
Socio-Economic
Analysis
A high-level outline of the various short and long-term positive and negative
impacts on socio-economic factors in the target communities, such as on
employment, income, education, health, etc.
Social Identifying additional social factors that may be impacted, such as gender
relations, distributional effects, ethnic or cultural relations, etc.
Legal and Regulatory
Due Diligence
An assessment of the various legal and regulatory requirements that the
project might face and various mitigation/ compliance costs that might arise.
Risks Providing a high-level outline of the potential risks facing each option
APPRAISAL
The key aim of the Appraisal is to assess the financial and economic viability and sustainability of the
chosen project option. As suggested, guidelines issued by the Ministry of Finance based on the Cost
Benefit Analysis (CBA) technique can be used.
At this Pre-Feasibility Stage, the CBA will not be as in-depth as that for the Detailed Feasibility Stage.
The core difference relates to the availability and cost of obtaining data. At this stage, although conducted
in line with CBA guidelines, the data used should be based as far as possible on that obtained through
desktop research or other accessible sources. Gaps in data should be identified as these will require data
collection at a later stage.
This section should consist of two separate appraisals: a financial appraisal; and an economic appraisal.
Financial appraisal:
The financial appraisal of an investment project is an assessment of the costs and benefits in terms of
project expenditures and incomes at market prices (cash flows, profitability, and the application of funds).
It gives an indication of the pressure the project will place on the project budget, and the degree of
subsidization it may require to be financially viable and sustainable. Further, it also reflects the profitability
of the project at market prices which is an important starting point in any comprehensive CBA.
Economic Appraisal:
The economic appraisal of an investment project looks at a wider spectrum of costs and benefits than in
the case of pure profit determination, and does so at monetary values that reflect the real scarcity of
project costs and benefits, as opposed to market prices. The aim of an economic appraisal is to assess a,
“project’s contribution to the economic welfare of the region.”10
10
European Commission (2002) “Guide to Cost-Benefit Analysis of investment projects”, prepared for Evaluation Unit, DG Regional Policy, EC.

43
Appropriate indicators (as outlined in the CBA Guidance section) must be included for each of the above
in order to show the financial and economic viability of the project.
4. WAY FORWARD
Based on the assessment of various technical options and the outcome of an analysis of the preferred
option, this section should do the following:
Make a recommendation on the most preferable or feasible procurement choice for the project
(e.g. fully government-funded, PPP, etc.)
Outline potential financing options available (e.g. investment grants, structured loans and other
borrowing options, etc.)
Outline a proposed implementation timeline for the project, including the various project
components and the phases in which each will take place, and
Describe various risks facing the project and outline potential mitigation arrangements for each.
5. FORTHCOMING FEASIBILITY STUDY
This section prepares the project for the next stage, and should include three parts:
An outline of the data gaps that remain and how best to collect this information;
A description of what specialist studies will be required should the project undergo a full
feasibility study; and
If necessary, a Terms of Reference for the appointment of a consultant to undertake a
Detailed Feasibility Study on the project.
6. REFERENCES
References should be included for all text cited.
7. ANNEXES
The annex should contain any information supporting the Report’s content.
ASSESSING THE PRE-FEASIBILITY STUDY
Once the Pre-Feasibility Study has been prepared, it passes to a common ‘Gateway’ where it
is reviewed. The Gateway is a multi-disciplinary body which acts as a common authority that
takes responsibility for assessing all projects that are being developed. It has the authority and
expertise to ensure that the appraisal process is conducted consistently and thoroughly. In
addition to technical and sector experts, the Gateway would consist of senior officials from the
MOF.
The Gateway should have the technical skills and authority to perform the following functions:
Appraising the pre- and detailed feasibility studies;

44
If a project is APPROVED, it will be sent onwards to the detailed feasibility study stage.
If a project is NOT APPROVED, the outcome is one of three options:
1) The project may be REJECTED if it fails to meet policy alignment and budgetary
conditions. The project is then removed from the preparation process.
2) The project may be PUT ON HOLD if it is deemed that is has the potential to
undergo preparation in the future but, due to certain limiting factors, does not in
the present (e.g. lack of sufficient resources, conflicting timelines with other
projects)
3) The project may be sent back to the Sponsor Department for REVISION, if the
assessment indicates that the project has potential but needs certain aspects
revised in order for it to be approved.
Making the procurement choice based on the recommendation of the pre- and
detailed feasibility studies; and
Making recommendations on the capital allocation for projects.
The Gateway utilises a Pre-Feasibility Appraisal Form to assess the project’s feasibility. The
Pre-Feasibility Appraisal Form checks the project’s Pre-Feasibility Study against a specified
set of criteria. These criteria focus on the results of the CBA, and on the relevance, feasibility
and sustainability of the project.
The Gateway makes a decision on whether the project is approved for a detailed feasibility
study or not. The box below outlines the various decisions that can be taken by the Gateway at
this stage.
Box 3: Outcomes of the Appraisal Process at Pre-feasibility stage
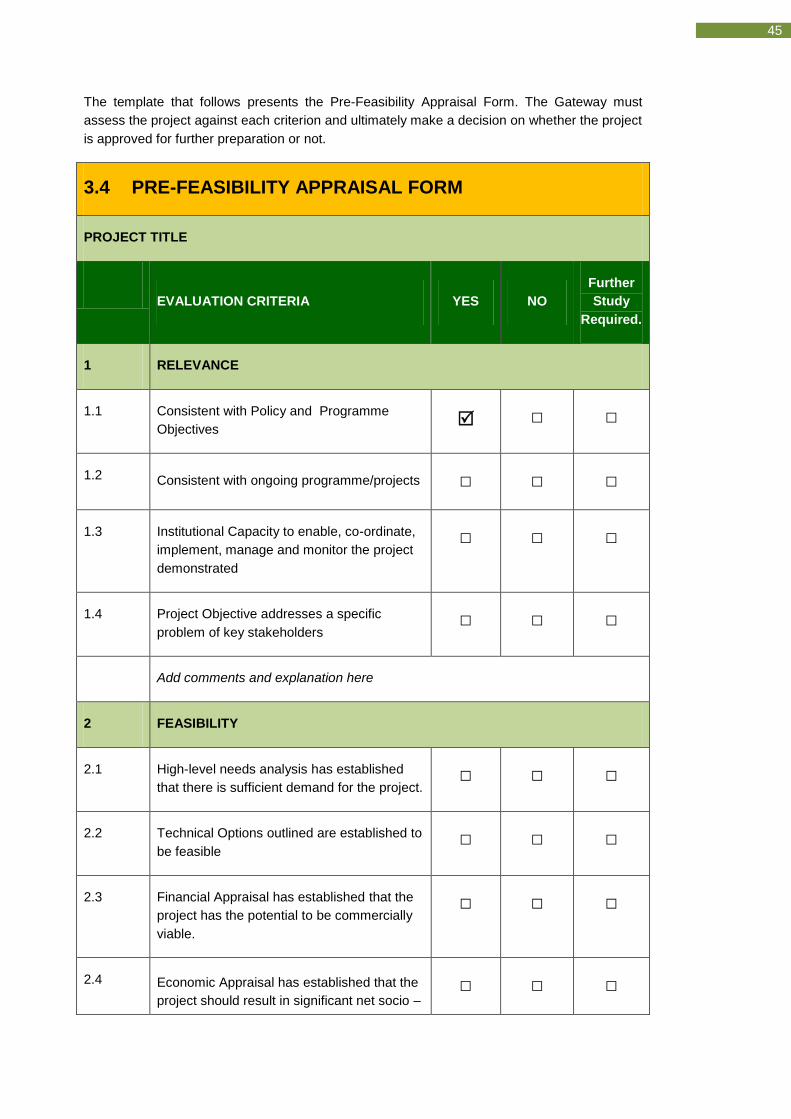
45
The template that follows presents the Pre-Feasibility Appraisal Form. The Gateway must
assess the project against each criterion and ultimately make a decision on whether the project
is approved for further preparation or not.
3.4 PRE-FEASIBILITY APPRAISAL FORM
PROJECT TITLE
EVALUATION CRITERIA YES NO
Further
Study
Required.
1 RELEVANCE
1.1 Consistent with Policy and Programme
Objectives □ □
1.2 Consistent with ongoing programme/projects □ □ □
1.3 Institutional Capacity to enable, co-ordinate,
implement, manage and monitor the project
demonstrated
□ □ □
1.4 Project Objective addresses a specific
problem of key stakeholders □ □ □
Add comments and explanation here
2 FEASIBILITY
2.1 High-level needs analysis has established
that there is sufficient demand for the project. □ □ □
2.2 Technical Options outlined are established to
be feasible □ □ □
2.3 Financial Appraisal has established that the
project has the potential to be commercially
viable.
□ □ □
2.4 Economic Appraisal has established that the
project should result in significant net socio – □ □ □

46
economic benefits.
2.5 Assumptions made by the analysts are
sound and justifiable. □ □ □
2.6 There are no significant legal and regulatory
hurdles. □ □ □
Add comments and explanation here
3 SUSTAINABILITY
3.1 Policy priorities will not change arbitrarily, in
the lifetime and even after the completion of
the project.
□ □ □
3.2 Risks identified are comprehensive and
mitigation arrangements proposed are
appropriate
□ □ □
3.3 All relevant stakeholders have been correctly
and thoroughly identified □ □ □
Add comments and explanation here
4 ADDITIONAL COMMENTS/CONCERNS
If there are any other comments, not covered in the first three sections, please
elucidate on them here.
FINAL RECOMMENDATION OF PRE–FEASIBLIITY REPORT EVALUATION
APPROVED □ REJECTED □ HOLD □ REVISE □ Add final score
here
Provide a detailed explanation for comments and explain whether the Gateway
agrees/disagrees with the recommendations of the pre-feasibility study
A final score must be given to each project, depending on the number of times the evaluator
says “Yes” in the assessment. In total, the maximum points a project could receive is 13, if all
points are answered by “Yes”. Any project which receives 9 “Yes” responses out of 13, will
automatically qualify for proceeding to the detailed feasibility. Of these 9, at least 1 should be
from section 1 on relevance and at least 3 should be from section 2 on feasibility and at least 1

47
should be from section 3 on Sustainability. If a project receives less than 9 “Yes” responses,
the Gateway should communicate its concerns to the Sponsor Department by sharing its
written comments on the Pre-feasibility Appraisal Form, as well as through formal in-person
meetings.
The Gateway informs the project’s Sponsor Department of the decision taken through the Pre-
feasibility Appraisal Form, which presents the decision taken by the Gateway on whether the
proposed project has been approved for further preparation or not, and includes comments on
why the decision was taken and recommendations on a further course of action.
Those projects that are approved by the Gateway for a detailed feasibility study are
documented in a tool called a Draft Short List, which is prepared by the Gateway.
3.5 DRAFT SHORT LIST
Quarter | Year
No. Project Name Town |
District | Province
Sector Sub-
Sector MPSA
Sponsor Dept.
Date of approval by Gateway
1
2
3
…
Those projects not deemed feasible for any reason – technically, legally, regulatory, or
financially – are shelved or studied further. If a project is rejected but found to have significant
socio-economic benefits, it is useful to send the Report back to the Sponsor Department to
review the infeasibility and conduct further research on how to overcome constraints.
Projects that are approved by the Gateway are sent forward to the next stage in the project
development cycle in which they will undergo a Detailed Feasibility study.

48
Project Identification
Project Definition
Pre-Feasibility
Detailed Feasibility
Financing
Implementation and Monitoring
Ex-post Impact Evaluation
04 DETAILED
FEASIBILITY

49
RATIONALE FOR THIS STAGE
The Detailed Feasibility stage in the project development process involves investigating in
whether a project should be put forward to be financed and implemented or not. This is done
through the preparation of a Detailed Feasibility study which explores all aspects of a project’s
feasibility, including a detailed financial and economic assessment.
The Detailed Feasibility Study (DFS) focuses only on the most preferred technical option(s) for
the project as identified during in the Pre-Feasibility Study. It therefore provides much greater
detail on the project’s design and a more thorough assessment of its financial and economic
feasibility. Data collection activities during the Detailed Feasibility stage are often more
intensive and costly than in the Pre-Feasibility stage as data more specific to the project’s
design needs to be collected.
Once the DFS has been prepared, it is appraised and a decision is made as to whether or not
the project should be approved for financing and eventual implementation. If a project is
approved, it is included on a Final Short List.
Before financing can take place, the appropriate technical and commercial structure for the
project is created. This is important for attracting diversified financing for the project, which is
the next step in the project development process. If not already done, part of this process
involves the appointment of a transaction advisor(s) who will assist in structuring the project.
Based on the procurement choice identified, this is also the stage at which a Project
Implementing Agent is appointed. The Implementing Agent will be responsible for carrying out
and overseeing the implementation of the project if it is to be executed with private sector
participation. The Implementing Agent that may be another government entity, a private
developer, or even a Joint Venture (JV) between public and private entities.
Project structuring is undertaken by the advisors to the project. The project structure
(commercial and financial arrangements) is approved by the Gateway and Sponsor
Department who draw on the Detailed Feasibility Study for doing so. Once the structure is
complete and the appropriate appointments made, the project moves on to be financed.

50
TOOLS AND INSTITUTIONS INVOLVED
The Sponsor Department coordinates the preparation of the Detailed Feasibility Study,
which is either prepared internally or with the technical assistance of external consultants.
The project’s Detailed Feasibility Study is then sent to the Gateway, which again takes
responsibility for appraising the project.
The Gateway uses a Detailed Feasibility Appraisal Form to assess the project based on a
specific set of criteria, which focus on the CBA and on the relevance, feasibility, and
sustainability of the project.
The Gateway makes a decision on whether the project is approved for procurement which
also entails a decision on financing approach. The Gateway informs the Sponsor
Department of the outcome of the final appraisal process.
Projects that are approved are recorded by the Gateway in a ‘Final Short List’.
For those projects that have been approved, the Gateway makes recommendations so as
to finalise technical, legal and financial aspects prior to financing and procurement.
Transaction Advisors are contracted to provide support to the Sponsor Department during
the financing and procurement phases.
The Detailed Feasibility Studies that are approved move on to the next stage of the Project Life
Cycle to be Financed.
Key Tools Authority Responsible Page
4.1 Detailed Feasibility Study Sponsor Department, MPSA 52
4.2 Detailed Feasibility Appraisal Form Gateway 59
4.3 Final Short List Gateway 62

51
To recap: at the Project Definition and Pre-Feasibility stages of the project life cycle,
preliminary concept designs of the project are prepared in the Project Concept Note and
subsequent Pre-Feasibility Study, and are then reviewed by the Gateway which approves a
project based on its technical feasibility and socio-economic CBA. However, since the socio-
economic, financial and legal feasibility are not confirmed at these stages, preparing detailed
technical designs during the Pre-Feasibility Stage is not recommended as these often require
large investments.
DEVELOPING THE DETAILED FEASIBILITY STUDY
Once the project has been appraised by the Gateway, been approved, and become part of the
‘Draft Short List’, it enters the Detailed Feasibility stage. At this stage, the details of the
project are finalised, within a Detailed Feasibility Study (DFS), the key output of this stage.
A DFS builds on the previously developed Pre-Feasibility Study and interrogates the project in
even greater detail. It contains an options analysis of a narrower set of preferred options, a
detailed technical design, in-depth financial and economic analyses, and an implementation
work-plan for the project, among other aspects. Importantly, a comprehensive risk assessment
is also conducted and risk mitigation arrangements are put in place.
Distinguishing between a Pre-Feasibility and Detailed Feasibility Study
Both the Pre- and Detailed Feasibility Studies focus on the project’s viability. However, the
differences between the two are clarified below in light of both project design options and
project size.
Project Design and Options Analysis
The Pre-Feasibility Study aims to prepare the project for a successful Detailed Feasibility
Study that will follow. The Pre-Feasibility Study is focused on the preliminary designs of the
project concept, with a particular emphasis on identifying the project design options that are
most likely to present an opportunity for investment.
The options analysis in the pre-feasibility is a more conceptual engineering design for the
project. It aims to identify the options that are most likely to be feasible given the different
technologies available and narrow them down to select only the most promising. The Detailed
Feasibility Study then interrogates these selected design options in much greater detail.
Similarly, the level of analysis on other aspects of the project (such as on financial, socio-
economic, institutional, and environmental criteria) is more exhaustive in the Detailed
Feasibility Study as greater resources are made available for appraising the project in detail
and for carrying out specialist studies that may be necessary.
Project Size and Budget
For smaller and technically simple projects, it is often not necessary to conduct both a Pre-
Feasibility and a Detailed Feasibility Study. It is possible for these two tools to be collapsed
into a single Feasibility Study for the project, which entails both a detailed options analysis as
well as any specialist studies that may be required to determine the feasibility of the project.
This may also apply when the range of options for implementing the project is limited and
resources may be targeted towards project design rather. This decision must be taken on a

52
project by project basis by the Sponsor Department, based on the advice of specialist technical
consultants as well as the MOF.
Combining the two Feasibility studies may also be necessary where budgets are tight or the
amount allocated to project preparation will not cover both studies. It is important, however,
that the correct processes are taken in project development as shortcuts taken in project
preparation can prove costly when the project is actually implemented.
Projects that have an estimated capital expenditure above USD 20 million, must have both a
pre-and a detailed feasibility study, while those that fall below this threshold may proceed with
a single feasibility study. The MOF could recommend collapsing the two feasibility studies into
one, after the assessment of the Project Concept Note.
The template below provides a content description of the Detailed Feasibility Study. The
Report is prepared by the Sponsor Department within the MPSA, with technical guidance from
the Planning Directorate within the MPSA, inputs from the relevant SAGs and utilising the
services of external technical experts where necessary.
4.1 DETAILED FEASIBILITY STUDY
CONTENTS
List of Tables / Figures
Abbreviations and Key Terms
Executive Summary
Introduction
Project Objective
Objective
Contribution towards high-level development goals
Project Background
Needs Analysis
Previous Interventions and Lessons Learned
Technical Options Analysis
Project Description
Detailed Technical Design
Institutional Design
Appraisal
Way Forward
Procurement Choice

53
Potential Financing Options
Implementation Timeline
Risk Mitigation Arrangements
References
Annexes
Technical and Institutional Data
Financial Data and Analysis
Economic Data and Analysis
Specialist Studies
Workshop Minutes
Terms of Reference
TERMS AND ABBREVIATIONS
This section should list the various terms, abbreviations and acronyms used in the report. It will provide
the reader with a reference point when going through the document.
EXECUTIVE SUMMARY
The Executive Summary section summarises the entire document. It is not a background or introduction
and should allow someone who reads only that section to get an idea of what the document entails.
Specifically, it aims to:
Provide a brief overview of the entire report so that a reader may read the executive summary
alone without reading the entire document,
Provide complete and specific information that can be understood in isolation, and
Allow the reader to understand the information in the report in a reasonably short space of time.
The CBA Executive Summary Table (as per template 3.2 of this manual) should be included
here.
0. INTRODUCTION
Include in this section information pertaining to the following:
Purpose of this document
A brief introduction to the project, including:
o Location
o Objective(s)
o Scope
o Sponsor Department/MPSA
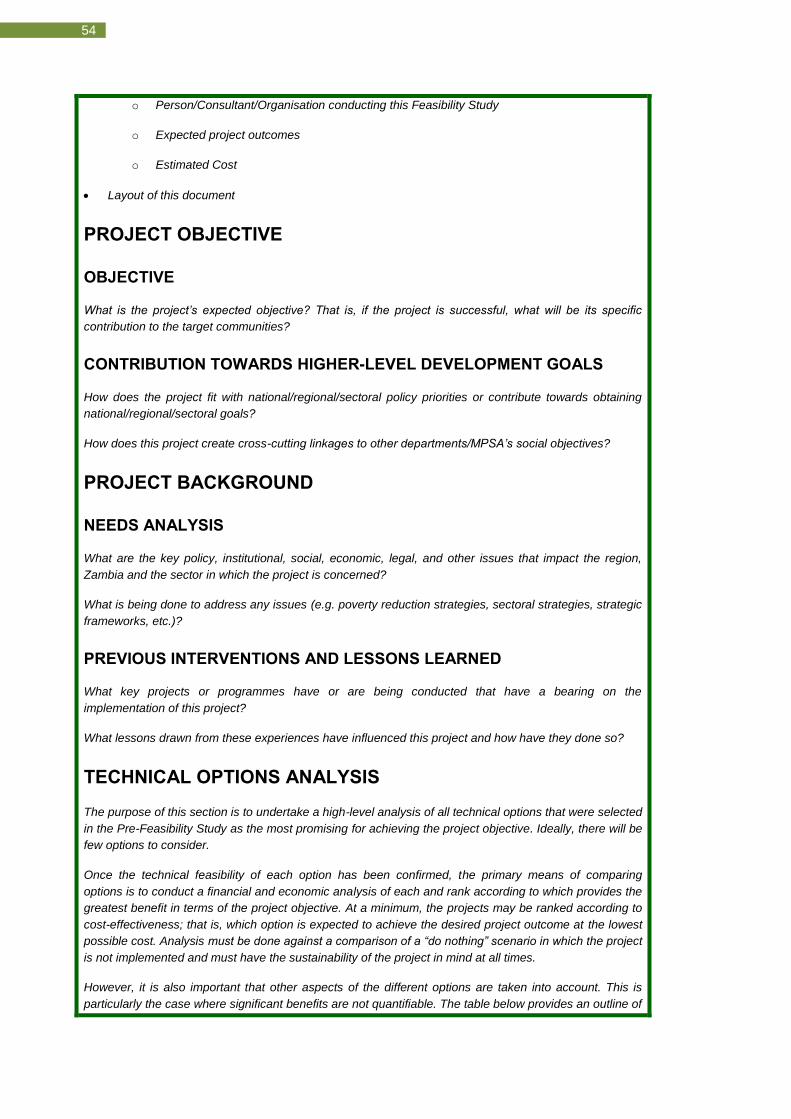
54
o Person/Consultant/Organisation conducting this Feasibility Study
o Expected project outcomes
o Estimated Cost
Layout of this document
1. PROJECT OBJECTIVE
1.1. OBJECTIVE
What is the project’s expected objective? That is, if the project is successful, what will be its specific
contribution to the target communities?
1.2. CONTRIBUTION TOWARDS HIGHER-LEVEL DEVELOPMENT GOALS
How does the project fit with national/regional/sectoral policy priorities or contribute towards obtaining
national/regional/sectoral goals?
How does this project create cross-cutting linkages to other departments/MPSA’s social objectives?
2. PROJECT BACKGROUND
2.1. NEEDS ANALYSIS
What are the key policy, institutional, social, economic, legal, and other issues that impact the region,
Zambia and the sector in which the project is concerned?
What is being done to address any issues (e.g. poverty reduction strategies, sectoral strategies, strategic
frameworks, etc.)?
2.2. PREVIOUS INTERVENTIONS AND LESSONS LEARNED
What key projects or programmes have or are being conducted that have a bearing on the
implementation of this project?
What lessons drawn from these experiences have influenced this project and how have they done so?
3. TECHNICAL OPTIONS ANALYSIS
The purpose of this section is to undertake a high-level analysis of all technical options that were selected
in the Pre-Feasibility Study as the most promising for achieving the project objective. Ideally, there will be
few options to consider.
Once the technical feasibility of each option has been confirmed, the primary means of comparing
options is to conduct a financial and economic analysis of each and rank according to which provides the
greatest benefit in terms of the project objective. At a minimum, the projects may be ranked according to
cost-effectiveness; that is, which option is expected to achieve the desired project outcome at the lowest
possible cost. Analysis must be done against a comparison of a “do nothing” scenario in which the project
is not implemented and must have the sustainability of the project in mind at all times.
However, it is also important that other aspects of the different options are taken into account. This is
particularly the case where significant benefits are not quantifiable. The table below provides an outline of

55
some of the analyses that can be conducted to determine the viability of the various options.
Demand Analysis Assess demand for a good or service over the project’s economic lifetime;
Determine whether market failures are resulting in lack of provision of a good
or service that the market needs but cannot afford;
Constraints such as government regulations (administered prices, ceilings,
quotas, including arrangements for making future adjustments to prices).
Technical Analysis The technology choice and input parameters for the project;
Project size and location;
Implementation schedule and output targets;
Procurement procedures
Institutional Analysis The institutions responsible for the implementation of the project and its
various activities;
The capacity and resources constraints that are present in each; and
Costs of the measures necessary to build required capacity
Environmental
Analysis
Environmental sustainability;
Anticipated mitigation or displacement costs;
Other necessary approvals and permits.
Socio-Economic
Analysis
Positive and negative impacts on socio-economic factors, including:
Employment, both local and further afield,
Income and wealth,
Income inequality
Affordability,
Education,
Health, etc.
Social Assessment Identifying additional social factors that may be impacted, such as:
Gender relations,
Distributional effects,
Ethnic or cultural diversity, etc.

56
Legal and Regulatory
Due Diligence
A legal and regulatory due diligence study should confirm that the project
will be able to comply with all regulatory requirements, identify any risks and
obligations that could increase costs or decrease benefits. The cost of
compliance must be included in the financial and economic analysis.
4. PROJECT DESCRIPTION
4.1. DETAILED TECHNICAL DESIGN
Once the technical team has chosen a preferred technical option, the following should be described:
A review and refinement of the selected project option;
A summary of the parameters used in the design of the project (such as population growth rates,
demand factors, geographic determinants, etc.);
A preliminary design of project components; and
A high level outline of the project implementation timeline, including a description of the various
phases and components associated with each.
4.2. INSTITUTIONAL DESIGN
The Institutional Design should address the following aspects of the project:
Stakeholder analysis
Proposed organisational set-up (including potential partnership arrangements)
Operational arrangements
Training and capacity needs
5. APPRAISAL
The key aim of the Appraisal is to assess the financial and economic viability and sustainability of the
chosen project option. A widely used and comprehensive way of doing this is to adopt the Cost Benefit
Analysis (CBA) technique.
CBA is a methodology for appraising the economic value of development projects. It is a test that
involves weighing the implicit and explicit positive and negative impacts (costs and benefits) of a public
project, in terms of its contribution to social welfare. The analysis finds, quantifies, and adds all the
positive factors (benefits), then identifies, quantifies and subtracts all the negatives (costs). The
difference between the two indicates whether the planned intervention has a net benefit and is therefore
advisable or should be altered or discarded. The approach is explicitly designed to inform decision-
makers through optimizing the social and environmental impacts.11
Further, it is vital that project impacts that are not easily quantifiable are included in the assessment. This
is more so the case when projects are expected to provide much needed goods and services to a group
11
Economic Commission for Africa (2012) “Cost-Benefit Analysis for Regional Infrastructure in Water and Power Sectors in Southern Africa” ECA Publications, Addis Ababa

57
who may not be able to afford to pay for their receipt.
The detail and comprehensiveness of a CBA will vary according to the size and complexity of the project
under analysis, but every CBA should at least consider the following core components:
CBA Framework
CBA Component Basic Explanation
Financial analysis
Sources of finance
Application of funds
Discounted cash flows (expenditures and revenues)
o Financial Net Present Value (FNPV)
o Financial Internal Rate of Return
Economic analysis
Discounted net costs and benefits
o Economic Net Present Value (ENPV)
o Economic Internal Rate of Return (ERR)
o Economic benefit to cost ratio (EBC)
Description of qualitative impacts
Risk Analysis Identify the key technical, financial, legal, regulatory, institutional, social
and other risks facing the project.
Sensitivity analysis
Robustness Check for the key assumptions used in the financial and
economic appraisal
Based on the key risk factors identified for in the project setting
Sustainability Analysis
Based on the financial and economic analysis results, an assessment of
the on-going sustainability of the project
WAY FORWARD
5.1. PROCUREMENT CHOICE
The procurement choice for the project is informed by the Feasibility Study, which should contain a
recommendation as to what type of procurement strategy best fits the project design. This recommendation will
draw on the financial model contained in the Study and will generally be one of the following broad options:
Joint Venture (JV)
Public-Private Partnership (PPP)
Outsource
Traditional public procurement
Others
5.2. POTENTIAL FINANCING OPTIONS
The procurement choice made will give an indication of what type of private sector involvement is
required for meeting project costs. If it is decided that private sector participation is necessary or
appropriate, then this section must briefly outline the different mechanisms and sources of financing that

58
may potentially be used.
5.3. IMPLEMENTATION PLAN
The Implementation timeline should indicate following:
Expected project start date
Estimated project useful life; and
Estimated project implementation schedule, detailing key outputs and dates each is expected to
be completed, as well as a broad indication of funding needs and sources, as outlined in the
table below.
Planned Activities
Time Frame*
Responsible Authority
Budget
Year 1 Year2 … Estimated
Cost Funding Source
Q1 Q2 Q3 Q4 Q1 Q2 Q3 Q4 …
…
* Time-Frame can be adapted to different time periods (e.g. quarterly, monthly, yearly, etc.)
5.4. RISK MITIGATION ARRANGEMENTS
The risks related to the project need to be identified and mitigation measures proposed for each.
These should be assessed with respect to the risk types outlined in table below, with each risk described
in detail and its perceived risk level identified. Proposed mitigation measures for each risk identified
should then be described.
Perceived Risks and Proposed Mitigation Measures
Risk Before Mitigation Proposed Mitigation
Describe risk.
(Note risk level: high/medium/low risk in brackets and colour cell red/yellow/ green respectively)
Political risks
Policy-related risks
Social risks
Institutional risks
Fiduciary risks
Legal risks
Macro-economic risks
Financial risks

59
Other safeguard mechanisms
Etc.
6. REFERENCES
References should be included for all text cited.
7. ANNEXES
Annexes should include, but not be limited to, the following:
Technical and institutional data
Financial data and analysis
Economic data and analysis
Specialist studies
Workshop minutes
Terms of reference
ASSESSING THE FEASIBILITY STUDY
Once the Feasibility Study has been prepared, it is submitted to the Gateway which takes
responsibility for appraising the project. This is the last review of the project before it proceeds
to be financed and implemented. As the final screen in the project preparation process, it is
important that this review is in-depth and consistent. The Gateway therefore uses a Feasibility
Appraisal Form to conduct the appraisal of the Feasibility Study.
The Feasibility Appraisal Checklist checks the project’s Feasibility Study against a specified
set of criteria. These criteria focus on the results of the CBA, and on the relevance, feasibility
and sustainability of the project, as outlined in the template below.
4.2 DETAILED FEASIBILITY APPRAISAL FORM
PROJECT TITLE
EVALUATION CRITERIA YES NO
Further
Study
Rqd.
1 ADMINISTRATIVE
1.1 All relevant sections of the Feasibility Study have
been completed □ □
1.2 The Feasibility Study has been signed off by the □ □ □

60
relevant authority/project sponsor
Add comments and explanation here
2 RELEVANCE
2.1 The project objective is clearly stated and appropriate □ □ □
2.2 Consistent with Policy and Programme Objectives □ □ □
2.3 Consistent with ongoing programme/projects □ □ □
2.4 Project objective addresses a specific problem of key
stakeholders □ □ □
2.5 All project activities are necessary, i.e. all activities are
required in order to achieve the project’s objective □ □ □
2.6 All project activities are efficient, i.e. use the least
amount of inputs necessary to achieve their outcomes □ □ □
Add comments and explanation here
3 FEASIBILITY
3.1 Needs analysis has established that there is sufficient
demand for the project. □ □ □
3.2 Expert studies have established that the project is
technically feasible. □ □ □
3.3 Environmental Impact Assessment has established
that environmental impact can be mitigated. □ □ □
3.4 Financial Appraisal has established that the project
has commercial viability. □ □ □
3.5 Economic Appraisal has established that the project
has significant socio – economic benefits, exceeding
project costs.
□ □ □

61
3.6 All other appropriate and relevant specialist studies
have been carried out □ □ □
3.7 Institutional Capacity to enable, co-ordinate,
implement, manage and monitor the project is present □ □ □
3.8 There are no significant legal and regulatory hurdles. □ □ □
3.9 Assumptions made by the analysts are sound and
justifiable. □ □ □
Add comments and explanation here
4 SUSTAINABILITY
4.1 All relevant stakeholders have been correctly and
thoroughly identified □ □ □
4.2 The authority in charge of the project has been clearly
defined □ □ □
4.3 There is sufficient ownership of the project by
beneficiaries. □ □ □
4.4 Policy priorities will not change arbitrarily, in the
lifetime and even after the completion of the project. □ □ □
4.5 Technology used will be long lasting. □ □ □
4.6 The project will have long–term socio–economic
impact on beneficiaries. □ □ □
4.7 Financing will be available for the entire duration of
the project’s implementation. □ □ □
4.8 Risks identified are comprehensive and mitigation
arrangements proposed appropriate □ □ □
Add comments and explanation here
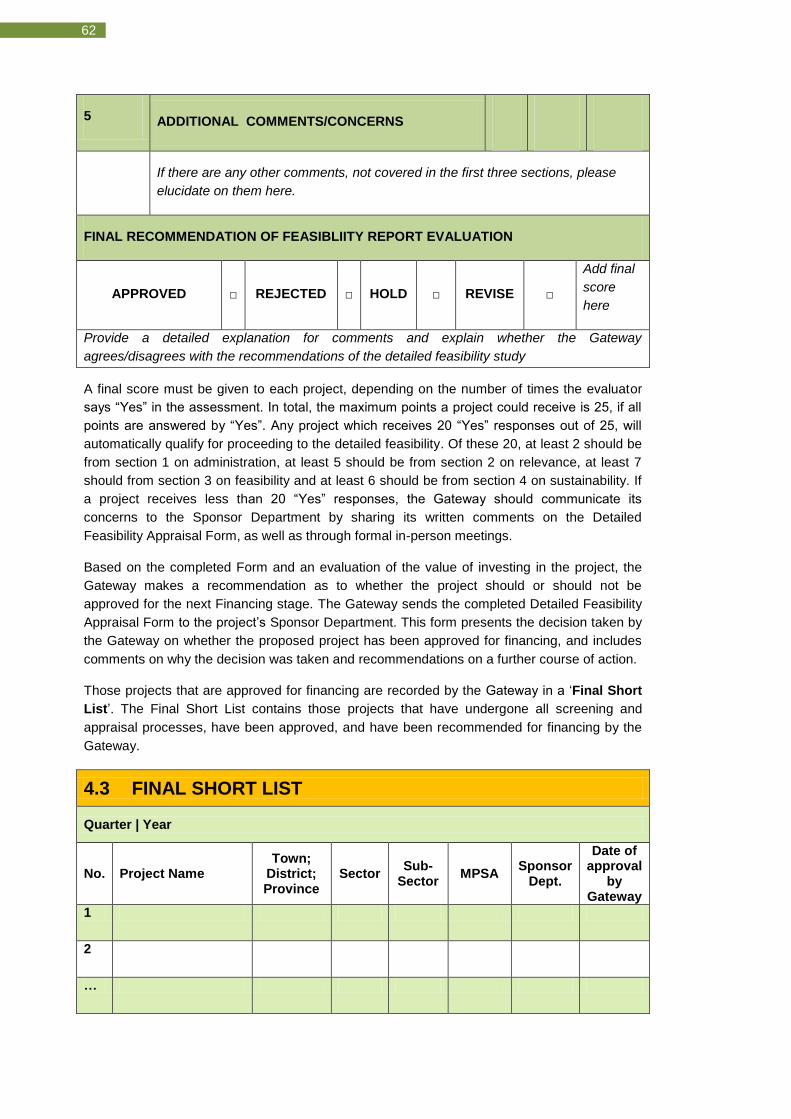
62
5 ADDITIONAL COMMENTS/CONCERNS
If there are any other comments, not covered in the first three sections, please
elucidate on them here.
FINAL RECOMMENDATION OF FEASIBLIITY REPORT EVALUATION
APPROVED □ REJECTED □ HOLD □ REVISE □
Add final
score
here
Provide a detailed explanation for comments and explain whether the Gateway
agrees/disagrees with the recommendations of the detailed feasibility study
A final score must be given to each project, depending on the number of times the evaluator
says “Yes” in the assessment. In total, the maximum points a project could receive is 25, if all
points are answered by “Yes”. Any project which receives 20 “Yes” responses out of 25, will
automatically qualify for proceeding to the detailed feasibility. Of these 20, at least 2 should be
from section 1 on administration, at least 5 should be from section 2 on relevance, at least 7
should from section 3 on feasibility and at least 6 should be from section 4 on sustainability. If
a project receives less than 20 “Yes” responses, the Gateway should communicate its
concerns to the Sponsor Department by sharing its written comments on the Detailed
Feasibility Appraisal Form, as well as through formal in-person meetings.
Based on the completed Form and an evaluation of the value of investing in the project, the
Gateway makes a recommendation as to whether the project should or should not be
approved for the next Financing stage. The Gateway sends the completed Detailed Feasibility
Appraisal Form to the project’s Sponsor Department. This form presents the decision taken by
the Gateway on whether the proposed project has been approved for financing, and includes
comments on why the decision was taken and recommendations on a further course of action.
Those projects that are approved for financing are recorded by the Gateway in a ‘Final Short
List’. The Final Short List contains those projects that have undergone all screening and
appraisal processes, have been approved, and have been recommended for financing by the
Gateway.
4.3 FINAL SHORT LIST
Quarter | Year
No. Project Name Town;
District; Province
Sector Sub-
Sector MPSA
Sponsor Dept.
Date of approval
by Gateway
1
2
…
63
PROJECT STRUCTURING
The Feasibility Study should include recommendations as to the appropriate procurement
choice for the project as well as potential financing sources. At this stage, the Gateway must
provide recommendations as to how the project should be structured based on discussion with
the Sponsor Department, and the MOF, with regard to the following aspects:
Procurement Choice: this involves determining the optimal mix of public and private
participation in the project (options for private participation include concessions,
leases, PPPs, and joint ventures) and should be guided by the financial models and
indicators presented in the Feasibility Study as well as consultation with relevant
stakeholders.
Project Financing Options: this includes assessing the possibility and cost of sourcing
finance from the GRZ’s budget (capital budgeting allocation) or, if appropriate, from
the market (e.g. loans from banks, equity from investors, DFIs, donors etc.). This is
merely an outline of various financing options; the development of a comprehensive
business case and financing strategy will take place in the next Financing Stage.
Legal Structuring: legal advice will be required to assist in the drafting of any
agreements (such as Implementation or Concession Agreements) that result from
discussions with relevant stakeholders. It also involves the review of any laws or
regulations that may affect the project and highlighting gaps that may need to be
addressed. Legal support will be ongoing throughout the financing and
implementation process.
Technical / Engineering Design: although the Feasibility Study contains a detailed
technical design for the project, and considering that a detailed design will be
developed once sufficient financing for the project has been raised, ongoing support
may be required to assess the technical and engineering aspects of the project
structure. This is important if changes to the project design or structure are made that
impact financing options.
The Gateway’s recommendations and comments on these particular aspects must be included
in the Detailed Feasibility Appraisal Form.
TRANSACTION SUPPORT
When a project moves from the planning stages to implementation, detailed work is
undertaken to translate plans into concrete agreements and to procure goods and service
providers who will be responsible for implementation. There is often a need to appoint
Transaction Advisors who are experts with experience in the following areas:
Project Finance: assisting in obtaining the best terms and conditions – whether
government or market-based – for the chosen financing option.
Legal Structuring: provision of advice in arranging agreements with providers of
finance, service and goods providers, etc.
Technical/Engineering Design: provision of support to ensure that technical plans are
implemented as agreed.
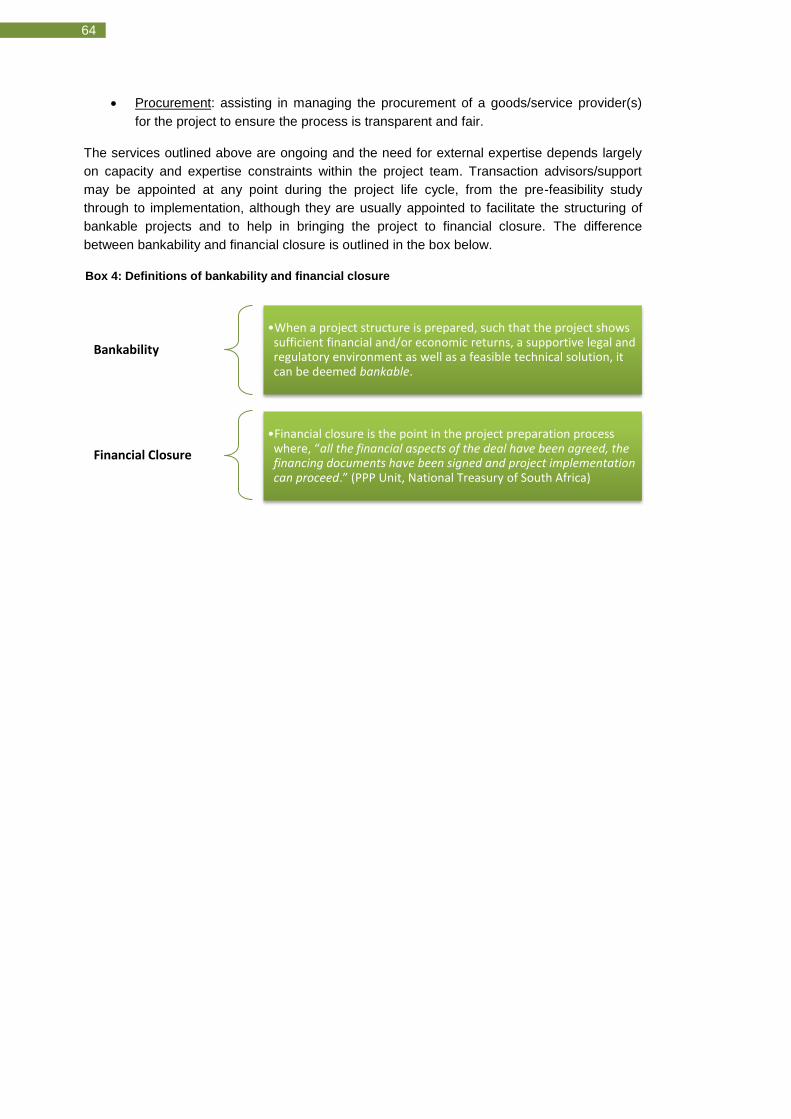
64
Bankability
•When a project structure is prepared, such that the project shows sufficient financial and/or economic returns, a supportive legal and regulatory environment as well as a feasible technical solution, it can be deemed bankable.
Financial Closure
•Financial closure is the point in the project preparation process where, “all the financial aspects of the deal have been agreed, the financing documents have been signed and project implementation can proceed.” (PPP Unit, National Treasury of South Africa)
Procurement: assisting in managing the procurement of a goods/service provider(s)
for the project to ensure the process is transparent and fair.
The services outlined above are ongoing and the need for external expertise depends largely
on capacity and expertise constraints within the project team. Transaction advisors/support
may be appointed at any point during the project life cycle, from the pre-feasibility study
through to implementation, although they are usually appointed to facilitate the structuring of
bankable projects and to help in bringing the project to financial closure. The difference
between bankability and financial closure is outlined in the box below.
Box 4: Definitions of bankability and financial closure
65
PROCUREMENT OF PROJECT IMPLEMENTING AGENT
During the project structuring process, the procurement choice for the project is finalised. This
procurement choice, or implementation model, is the organizational structure through which
the project will be implemented. For projects developed by the GRZ, this choice may involve
‘traditional’ public procurement, a pure PPP, or a hybrid approach, with a mix of public and
private participation in the project.
If the procurement choice involves private sector participation, a Project Implementing Agent
needs to be appointed once the project has been properly structured. The Project
Implementing Agent is the institution which is contracted to carry out and oversee the
implementation of the project. It is possible that the transaction appointing the Project
Implementing Agent is structured in such a manner that multiple institutions are part of the
project’s development as contractors, managers, and operators.
Once the commercial structure for the project has been defined, and the Transaction Advisors
and Project Implementing Agent have been appointed, financing needs to be raised to fund the
implementation of the project. This is the next stage of the project life cycle.

66
Project Identification
Project Definition
Pre-Feasibility
Detailed Feasibility
Financing
Implementation and Monitoring
Ex-post Impact Evaluation
05 FINANCING

67
RATIONALE FOR THIS STAGE
Once a project’s Detailed Feasibility study has been approved by the Gateway and included in
the Final Short List, financing for the project is required before it can be implemented. This
next stage in the project life cycle is therefore the Financing stage where the raising of capital
for the project takes place.
At the end of the Detailed Feasibility stage, project structuring takes place. This structuring
process feeds into the financing stage, where the project’s technical and commercial structure
is finalized. As part of the structuring phase, the procurement choice for the project is also
finalized. This procurement choice involves deciding what mix between private and public
funding the project will utilize.
If the procurement choice specifies that the project will be funded fully, or in part, by the GRZ,
then the Budget Office in the MOF will review the project and allocate it a specific amount of
capital. If the procurement choice involves private sector participation, the Sponsor
Department will engage with the PPP Unit. The PPP Unit will provide assistance for appointing
a Project Implementing Agent for the project. This Implementing Agent has the skills and
expertise to design the project and will be responsible for overseeing its implementation.
The Sponsor Department is responsible for developing a Financing Strategy that outlines the
business case for the project and identifies the different potential mechanisms and sources of
finance for the project. This Strategy is based on the final technical and commercial structure
of the project finalised at the detailed feasibility stage.
Negotiations then take place between the Sponsor Department and potential funders and
financiers. In this process, financiers will be identified and the terms and conditions of financing
arrangements will be reached. The Project Implementing Agent is also included in these
discussions.
These negotiations often require multiple meetings with a variety of stakeholders. The final
step is for the Sponsor Department to bring the project to Financial Closure, where all aspects
of the project financing deal have been agreed and the necessary documents signed. This is
the primary aim of this stage, and only once financial closure has been reached can the project
move to the Implementation and Monitoring Stage.

68
TOOLS AND INSTITUTIONS INVOLVED
Based on the procurement choice identified, the Budget Office conducts a capital
budgeting allocation process, whereby it apportions a part of the project cost to the
Government’s budget.
The Sponsor Department develops a Financing Strategy to raise required investment
costs that are not covered by the government according to the procurement model
specified.
The Sponsor Department, with assistance and final approval from the Budget Office, then
brings the project to Financial Closure, detailing all project financing agreements that have
been signed and all the required conditions that have been met for this financing to take
place.
Once a project has been brought to financial closure, it is ready to be Implemented.
Key Tools Authority Responsible Page
5.1 Financing Strategy Sponsor Department, MPSA 70
5.2 Financial Closure Form Sponsor Department, MPSA and Budget Office, Ministry of Finance
75

69
To recap: at the end of the Detailed Feasibility stage, project structuring took place for
projects included on the Final Short List. This structuring process feeds into the financing
stage, where the project’s technical and commercial structure is finalized. As part of the
structuring phase, the procurement choice for the project is also finalized. This procurement
choice involves deciding what mix between private and public funding the project will utilize.
CAPITAL BUDGETING ALLOCATION
There is a great variety in the nature and source of domestic and international financing that is
available for a project. A project that is selected by the Gateway for financing must then be
budgeted for and financed accordingly.
Depending on the procurement choice recommended by the Gateway, the project will either
require funding from the government or the private sector, or both. If the project requires full or
part funding from the GRZ, the Budget Office in the MOF must review the project and allocate
a specific amount of capital. Financing requirements apportioned to the government is either
allocated funds from the national budget or is managed through debt. This process is managed
by the Budget Office, which liaises with the Investments and Debt Management Departments
in the MOF to co-ordinate the debt funding.12
If a public private partnership (PPP) has been recommended, the Sponsor Department will
engage with the PPP Unit will take responsibility for working with the Sponsor Department in
developing a financing strategy for the project. With private sector participation, it is often the
case that transaction advisors will be appointed to facilitate the financing and procurement
phases of the project prior to implementation and to assist in the appointment of a Project
Implementation Agent.
DEVELOPING A FINANCING STRATEGY
A key output for the Financing stage is for the Sponsor Department to develop a sustainable
Financing Strategy to ensure that a sufficient level of financing is made available to the
project throughout its lifetime. This is particularly crucial if private sector participation is
expected and potential financiers are to be engaged. The Sponsor Department should engage
with the Budget Office, the Investment and Debt Management Department as well as the PPP
Unit in order to develop the financing strategy.
A Financing Strategy is developed to raise the required investment costs that are not covered
by the government according to the procurement model specified, and must come from the
private sector. It details the following aspects relating to financing of the project:
It presents a business case for the project, including a financial structure deemed
most attractive to private investors in order to bring the project to bankability
It identifies suitable mechanisms through which the project will be financed, such as
grants, loans, or user-fees.
12 It is important to note that even if a project receives 100% financing from the GRZ, a financing strategy is required to
ensure that donors/ other external financiers of government revenue remain interested in the particular project.

70
It assesses the various sources of financing for the project, including both domestic
and international sources of financing, such as:
o Local or foreign government entities
o Development Finance Institutions
o Non-governmental organisations
o Private sector foundations and Corporate Social Responsibility financing, and
o Local Private Sector Businesses
It involves the development of materials such as a project pitchbook and project
information sheet which clearly communicate the project’s objectives, costs and
benefits to potential financiers.
Once a comprehensive financing strategy has been developed, negotiations are conducted
with priority financiers and the project is showcased before them.
5.1 FINANCING STRATEGY
PROJECT DESCRIPTION
Include in this section information the following:
An Updated Project Information Sheet
A CBA Executive Summary of the project drawn from the Feasibility Study
BUSINESS CASE
The purpose of the Business Case for the project is to make a case for the financing of the project as well
as present the way forward with regards to procurement and capital allocation decisions.
The Business Case draws heavily on the project’s completed Feasibility Study. It briefly summarises
different aspects of the project in an aim to present its financial characteristics, which will then guide the
financing strategy for the project. The Business Case should present summaries of the following:
Summary of Business Plan Contents
SECTION RATIONALE
Needs Analysis Indicates what demand the project is expected to satisfy
Technical Design Option Outlines the project design and how it will be implemented
Summary of the
Financial Analysis
Describes the key financial characteristics of the project, including FNPV
and FIRR.

71
Summary of the
Economic Analysis
Describes the results of the economic analysis, including: the ENPV;
FIRR; Benefit-Cost Ratio
Summary of Risk
Mitigation Arrangements
Outlines the key risk factors with the potential to impact the project, as
well as the arrangements put in place to minimise the possibility of them
occurring.
Institutional and
Stakeholder Context
Describes the project’s key stakeholders and preferred institutional
structure for the project’s implementation.
Procurement Choice Based on the Gateway’s recommendation, indicates the preferred
procurement choice for the project.
Capital Budgeting
Allocation
Based on the procurement choice, details what proportion of the project
investment costs will be allocated to the Government.
Financing Requirements Based on the procurement choice and capital budgeting allocation,
describes the proportion of financing for the project required to come
from non-governmental sources.
FINANCING STRATEGY
Once the Business Case for the project has been made, the Financing Strategy is developed to raise
capital for the required investment costs that are not covered by the government according to the
procurement model specified, and which must come from the private sector. Specifically, it details the
factors related to financing the project which are listed and then discussed below:
1. Financing mechanism: assessing the different mechanisms available for financing and
determining which is appropriate for the project
2. Financing Sources: based on the identified financing mechanisms, determining what
potential sources of finance exist
3. Financier engagement: developing materials which clearly communicate the project’s
objectives, costs and benefits to potential financiers.
FINANCING MECHANISM
There are a number of different mechanisms available for financing a project. These refer to the different
ways that financing can be obtained for the project, where each has different benefits, costs and risks
associated with it. The following table provides a broad overview of the different basic mechanisms that
might be available. This list is non-exhaustive and often depends on the project context and innovative
sources of financing available.
Mechanisms for Financing a Project
MECHANISM TYPE DESCRIPTION

72
Investment Grants Grants are used to cover certain aspects of project costs and usually form
part of financing arrangements where the project is not financially
sustainable in isolation; i.e. cash-flows generated are not able to cover
project financing and O&M costs. Grants may be used in the financial
structure of the project in a number of ways. They may, for example, cover
full project costs or they may be simply be just large enough to allow the
project to finance itself internally.
Loans (or bonds) Loans (or bonds) come in various forms and are generally dependent on
the risk of the project and the ability to tie in collateral. Some of the most
common loan types are listed below:
Commercial Secured loan: funding is secured by project assets;
i.e. project assets are used as collateral for obtaining the loan.
Commercial Non-secured loan: funding is not secured against
project assets and therefore usually involves higher interest rates
than secured loans.
Concessional, or “soft”, loans: funding is granted on terms
substantially more generous than market loans, usually through
below-market interest rates, grace periods, or a combination of
both.
Other bond types that may be more appropriate for the project’s
structure
Private Equity If the project is deemed to have potential for private sector investment, and
the procurement choice involves private-sector participation (such as
through a joint-venture, or public-private partnership), then a funding option
is to allow private investors to take an equity stake in the project. If this is
the case, there are a range of equity offerings which should be explored in
detail.
User-fees User fees are charges paid by the beneficiaries of a service in exchange
for the right of use. Revenue generated by user fees contributes to the
project’s financial sustainability and, by linking prices with actual usage of
a project’s outputs, can make provision more efficient. This may therefore
prove to be an alternative to taxation, especially when the GRZ’s budget is
limited.
However, the success of user fees depends on whether beneficiaries can
afford to pay for goods and services. A balance therefore needs to be
struck between cost recovery and affordability. This would have been
explored during the feasibility stages of the project and should be clear at
this point whether this user fees are a viable option or not.
It is important to note that project financing may come from syndicates, where funding is provided by a
group of entities and may take any form. Further, the type of funding provided may be ‘blended’, that is
be structured in a way that makes use of a number of funding mechanisms. The type of mechanism
used for financing a project is also likely to depend on the length of the project’s economic lifetime, or
loan maturity specified.

73
At this stage, it is not necessary to narrow the mechanism down to a single type. It may be that a number
of financing mechanisms are appropriate for the project and the financing structure chosen should
combine multiple sources to minimize the cost of financing.
FINANCING SOURCES
Although the details of sources may vary, they can generally be grouped into one of the types listed in the
table below. This list is non-exhaustive.
Potential Sources of Finance for Projects
SOURCE OF FINANCE DESCRIPTION
Domestic Government Financing from the GRZs MTEF allocation.
Domestic sources may also include financing from government
agencies or institutions (such as a public investment corporation)
provided as loans and not included on the government books as
publicly-funded.
Foreign Governments (or
Donors)
Foreign governments, often through donor organisations, may
provide financing for projects aligned with their specific country
development / collaboration strategy.
Mutli-lateral development banks
(MDBs)
MDBs such as the World Bank or the African Development Bank
may provide financing for a project, particularly if it has a
compelling feasibility study, after reviewing alignment with their
strategic priorities.
Development Finance
Institutions (DFIs)
DFIs may provide financing for projects aligned with their
organisations objectives and which are based in their target
geographic location. DFIs often play an important role in
crowding in other investment into a project.
Non-Governmental
Organisations (NGOs)
NGOs often have limited budgets but may be a source of
financing for projects, especially if they are linked with other
donor or foreign-funded programs.
Private Sector Foundations /
Corporate Social Responsibility
financing
As a funding source, this often depends heavily on the project’s
objective and outcomes, which must necessarily be aligned with
a foundation/corporation’s development strategy. These can be
important sources of finance, though, especially institutions with
bigger national reach.
Private Sector Private-sector involvement usually draws on private equity
sources, investment funds, or commercial banks. In order for a
project to be attractive to these entities, it must demonstrate
significant financial return.
Potential sources of finance should be narrowed down based both on the mechanism(s) previously
chosen for financing the project and on the likelihood of obtaining financing from various sources. A

74
description of each financier to be approached should be listed, along with their available financing
mechanisms and sectoral/thematic focus areas.
FINANCIER ENGAGEMENT MATERIALS
The project needs to be captured in such a way that key details that interest financiers are presented
clearly and logically. A number of tools are useful for these purpose, including:
Project Information Sheet: An updated version of the Project Information Sheet (template 1.1)
containing key information relating to the project’s objectives and technical, institutional,
financial, and economic feasibility can be used for financier engagement. It should provide
potential financiers with a broad overview of the project while detailing key aspects that indicate
their financial worthiness. Upon reading the PIS, a potential financier should have a clear idea of
the project’s objectives, outcomes, funding needs, and financial attractiveness.
Project Pitchbook: This is used for conducting presentations with potential financers. It contains
similar information about the project as the PIS but is more refined in scope and developed as a
slide show that depicts the core aspects of the project that potential financiers need to know.
Compared to the PIS, it is less detailed, more succinct, visually more appealing in the
information that it conveys.
Project Information Memorandum: This provides a more comprehensive outline of the business
case for the project and details the potential financing mechanisms and sources. In this sense, it
is similar to the overall financing strategy but is presented to potential funders and is thus more
targeted in its outlook.
ACHIEVING FINANCIAL CLOSURE
The purpose of the financing strategy is to identify the optimal mechanisms and sources for
financing the project and to engage with potential financiers. After project appraisal and with
the project approved, negotiations take place between the Sponsor Department and potential
funders and financiers. The Project Implementing Agent assists the Sponsor Department in
this process. During this process, all parties will develop consensus on the terms and
conditions of the funding and financing provided; this will be ratified through the formal signing
of requisite legal agreements.
The final step in the Financing Process is then for the Sponsor Department to bring the project
to Financial Closure. Financial closure is the phase in the project life cycle where all aspects
of the project financing deal have been agreed and the necessary documents signed. Once
financial closure has been reached, the implementation of the project can proceed.
The Sponsor Department is ultimately responsible for bringing the project to financial closure
and preparing the financial closure form while the Budget Office signs off on the final
completed Financial Closure Form. This Form details all project financing agreements that
have been signed and all the required conditions that have been met for this financing to take
place. Financial close enables funds that have been agreed to start flowing so that project
implementation can begin. It also includes confirmation that all internal approvals have been
met. Once a project has reached financial closure, it is then ready to be implemented.
The template below serves to outline the requirements and minimum criteria that a project
needs to fulfil in order to achieve financial closure and be eligible for funding.
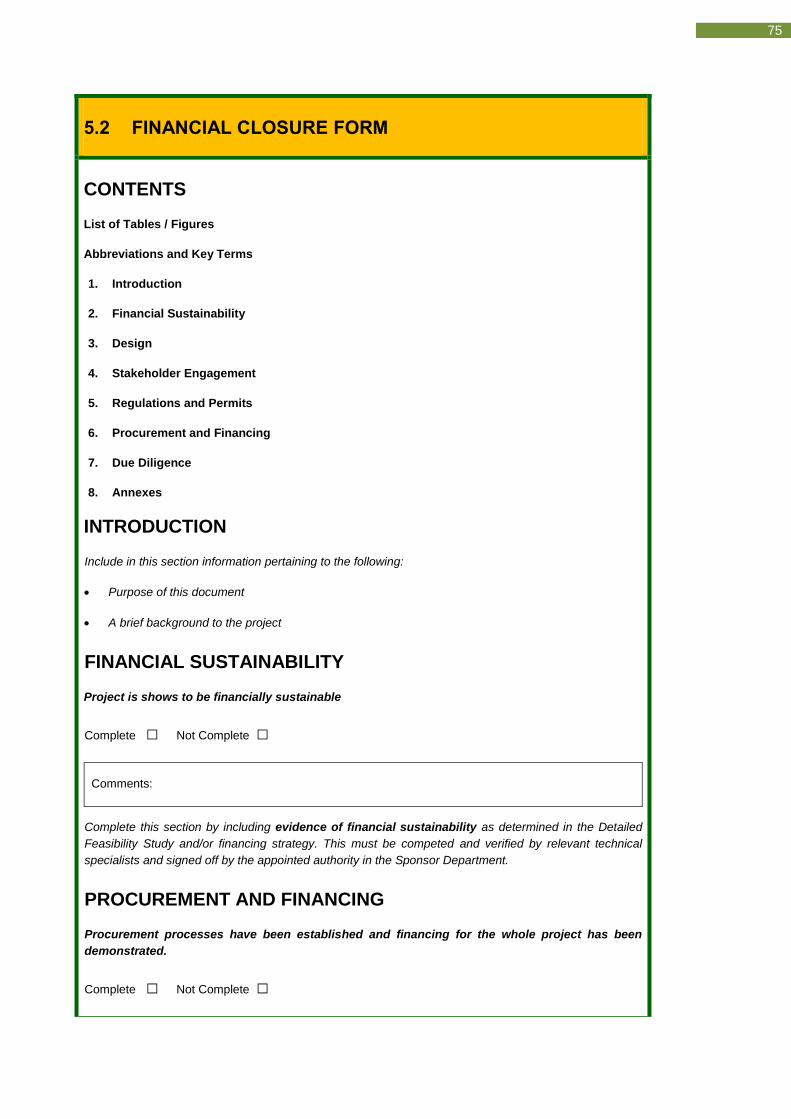
75
5.2 FINANCIAL CLOSURE FORM
CONTENTS
List of Tables / Figures
Abbreviations and Key Terms
1. Introduction
2. Financial Sustainability
3. Design
4. Stakeholder Engagement
5. Regulations and Permits
6. Procurement and Financing
7. Due Diligence
8. Annexes
INTRODUCTION
Include in this section information pertaining to the following:
Purpose of this document
A brief background to the project
FINANCIAL SUSTAINABILITY
Project is shows to be financially sustainable
Complete □ Not Complete □
Comments:
Complete this section by including evidence of financial sustainability as determined in the Detailed
Feasibility Study and/or financing strategy. This must be competed and verified by relevant technical
specialists and signed off by the appointed authority in the Sponsor Department.
PROCUREMENT AND FINANCING
Procurement processes have been established and financing for the whole project has been
demonstrated.
Complete □ Not Complete □

76
Comments:
Complete this section by including documents covering the procurement strategy for the project. This
strategy must include, at a minimum: a definition of the most appropriate procurement choice in
accordance with the recommendations made by the Gateway and Budget Office; a project contract,
signed by all parties, reflecting the financing plan; a disbursement schedule (see examples below)
detailing financing arrangements; and the various parties’ roles, powers, responsibilities and risk
allocation; and a comprehensive contract management plan for operation, with evidence that the plan
is adequately resourced. Further, in these contracts actions must be specified in the eventuality of time or
cost overruns.
Activity-Based Disbursement Schedule
ACTIVITY DATE SOURCE AMOUNT
Describe the
Activity/Deliverable/
Milestone* that requires
funding in order to be
implemented
Start or end date;
depends on payment
made up front or only
on completion of
deliverables
Funder
providing the
requisite
resources
Amount of
funding to be
provided (e.g.
lump sum, % of
total funding)
*A deliverable/milestone is a significant, observable and pre-specified activity, such as the drafting of a
report or the holding of a training session.
Time-Based Disbursement Schedule
DATE SOURCE AMOUNT
Date funding will
be provided
Funder providing the
requisite resources
Amount of funding to be provided (e.g.
lump sum, % of total funding)
DESIGN
Engineering Design is Complete
Complete □ Not Complete □
Comments:
For capital and infrastructure projects, complete this section by including documents that contain the final
engineering design of the infrastructure and associated technical drawings that are completed to a
degree that is appropriate to the procurement strategy chosen for the project. For example, a design-
build or design-build-operate procurement strategy would require preliminary designs only, with the
detailed drawings forming part of the work procured, while a more traditional procurement strategy would,
however, necessitate full detailed designs as a prerequisite for financial closure and procurement.

77
STAKEHOLDER ENGAGEMENT
Necessary social acceptance and endorsement of the project is attached
Complete □ Not Complete □
Comments:
Complete this section by including evidence of formal sign-off or endorsement of the social impact
assessment component of the feasibility study by relevant stakeholders, including relevant ministries,
departments and agencies, and other key stakeholders. In addition, a detailed record of such
stakeholder consultations as were conducted during the feasibility study must be presented, including
a risk mitigation/management plan developed where social issues/risks exist.
REGULATIONS AND PERMITS
The project abides by all relevant regulations and the necessary permits and clearances have
been acquired
Complete □ Not Complete □
Comments:
Complete this section by including documents relating to all regulations, required permits and approvals
identified as necessary for project implementation. At a minimum, these include: the securing of all
necessary environmental clearances and approvals, all relevant permits, evidence of a clear
allocation of (and no conflict over) all land to be developed under the project; evidence of
ownership/legal right of access by the project owner over all land where key infrastructure is
located; and, evidence that the ownership and management rights over the asset are clearly
allocated and formalised by the relevant authority.
DUE DILIGENCE
Due diligence report completed on the parties to the contract
Complete □ Not Complete □
Comments:
Complete this section by including due diligence reports on the parties to the contract including, at a
minimum, due diligence reports on parties to the contract legal status, financial standing, and service
delivery record. Importance must also be paid to due diligence carried out on the project owner.
ANNEXES
Annexes will contain full versions of the documents highlighted in the sections above.

78
Project Identification
Project Definition
Pre-Feasibility
Detailed Feasibility
Financing
Implementation and Monitoring
Ex-post Impact Evaluation
06 IMPLEMENTATION AND MONITORING

79
RATIONALE FOR THIS STAGE
Once financing for the project has been obtained, the next stage in the project life cycle is the
implementation of the project. This stage also involves ongoing assessment of how the project
is performing compared to what was expected of it.
During the project preparation and structuring phases, preliminary designs of the project were
conceptualized. However, preparing detailed technical designs then is not recommended as
this is a costly exercise to undertake when financing for the project is not yet guaranteed. This
is especially true for larger projects which require a high level of expertise and may take a long
time to prepare. Thus, only at this point, once a sufficient level of financing has been secured,
does the project undergo detailed design.
Project implementation can be defined as the process where the project actually produces
outputs in order to achieve its development objective. Before this can happen, however, the
project team needs to define exactly when the different project activities will be rolled out. This
will ensure that roles are clearly defined and that implementation happens efficiently.
Therefore, a Project Management Team (PMT) is put in place within the sponsor department
which produces an Implementation Plan that identifies the different project activities, when
each will be undertaken and which entity will be responsible.
Ongoing assessment of how a project is performing is important in that it ensures that the
project is moving towards its objective and allows the PMT to put in place strategies to bridge
performance gaps. Along with the Implementation Plan, the PMT also develops a Monitoring
Plan which identifies, for each of the project’s output and outcome, an indicator that can be
used for its measurement. This Plan also specifies targets for the indicator over the project’s
lifetime as well as which entity is responsible for monitoring activities. Comparing an indicator
over time against expected targets means that the performance of the project can be
assessed.
The Implementation and Monitoring Plan combines the two plans above in a document that
shows how the project will be implemented and how it will be monitored. It is then necessary
for the project to be implemented.
Whereas the procurement choice for the project takes place during the project structuring
process, procurement – the actual contracting of suppliers to provide goods and services to
physically implement the project – now occurs. This will be done by the PMT in line with the
Implementation and Monitoring Plan.
Finally, once procurement has taken place and the project has begun, it is important that the
findings from the project monitoring activities have a meaningful impact on how implementation
takes place. This is done by the monitoring team through regular project Monitoring Reports,
which detail the findings from the different monitoring activities and present an overall picture
of how well the project is performing.
Project implementation ends with the decommissioning of the project, once all activities have
been completed or it is decided that the project should be ended. The final stage is the project
life cycle is then to undertake Ex-Post Evaluation of the project’s impact.

80
TOOLS AND INSTITUTIONS INVOLVED
The PMT and Project Implementing Agent undertake a detailed design of the project,
including technical, institutional and organizational design.
For monitoring and evaluation purposed, the Sponsor Department develops a Logical
Framework, which builds a logical link between the project activities and its ultimate
impact.
The PMT creates an Implementation Plan which outlines the timeline over which project
activities will be implemented and allocates responsibility for doing so to specific
authorities.
The PMT then develops a Monitoring Plan that depicts the schedule for monitoring project
outcomes over its lifetime.
Before the project can be implemented, procurement takes place to appoint service
providers for the provision of goods and services involved in the actual implementation of
the project.
Once implementation is underway, the PMT takes responsibility for reviewing the
Monitoring Activity documents and compiling periodic Monitoring Reports, which are
presented to the project stakeholders and contain information on project progress and
suggest recommendations for how implementation and monitoring can be improved.
Once project implementation is complete, the final stage of the project life cycle, Ex-Post
Impact Evaluation, involves determining the impact the project has had on society.
Key Tools Authority Responsible Page
6.1 Project Implementation Schedule Sponsor Department, MPSA 85
6.2 Project Monitoring Schedule Sponsor Department, MPSA 88
6.3 Monitoring Report Template Sponsor Department, MPSA 90
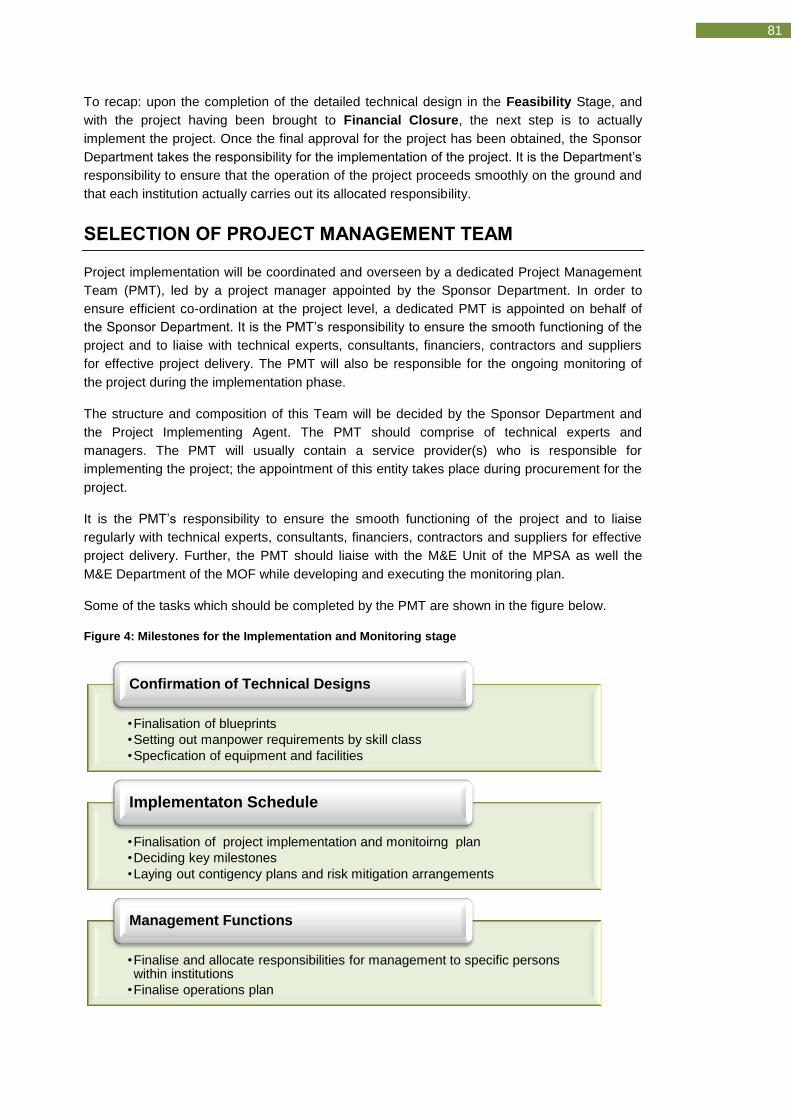
81
To recap: upon the completion of the detailed technical design in the Feasibility Stage, and
with the project having been brought to Financial Closure, the next step is to actually
implement the project. Once the final approval for the project has been obtained, the Sponsor
Department takes the responsibility for the implementation of the project. It is the Department’s
responsibility to ensure that the operation of the project proceeds smoothly on the ground and
that each institution actually carries out its allocated responsibility.
SELECTION OF PROJECT MANAGEMENT TEAM
Project implementation will be coordinated and overseen by a dedicated Project Management
Team (PMT), led by a project manager appointed by the Sponsor Department. In order to
ensure efficient co-ordination at the project level, a dedicated PMT is appointed on behalf of
the Sponsor Department. It is the PMT’s responsibility to ensure the smooth functioning of the
project and to liaise with technical experts, consultants, financiers, contractors and suppliers
for effective project delivery. The PMT will also be responsible for the ongoing monitoring of
the project during the implementation phase.
The structure and composition of this Team will be decided by the Sponsor Department and
the Project Implementing Agent. The PMT should comprise of technical experts and
managers. The PMT will usually contain a service provider(s) who is responsible for
implementing the project; the appointment of this entity takes place during procurement for the
project.
It is the PMT’s responsibility to ensure the smooth functioning of the project and to liaise
regularly with technical experts, consultants, financiers, contractors and suppliers for effective
project delivery. Further, the PMT should liaise with the M&E Unit of the MPSA as well the
M&E Department of the MOF while developing and executing the monitoring plan.
Some of the tasks which should be completed by the PMT are shown in the figure below.
Figure 4: Milestones for the Implementation and Monitoring stage
•Finalisation of blueprints
•Setting out manpower requirements by skill class
•Specfication of equipment and facilities
Confirmation of Technical Designs
•Finalisation of project implementation and monitoirng plan
•Deciding key milestones
•Laying out contigency plans and risk mitigation arrangements
Implementaton Schedule
•Finalise and allocate responsibilities for management to specific persons within institutions
•Finalise operations plan
Management Functions

82
CONFIRMATION OF DETAILED DESIGN
During project development, at the project preparation and appraisal stages, preliminary
concept designs of the project are reviewed and the technical option selection takes place on
the basis of technical feasibility as well the socio – economic CBA. Only once the project
appraisal has been completed and a sufficient level of financing has been secured, the project
undergoes a detailed design, for the detailed feasibility study. At this stage, the detailed design
is confirmed and finalised by the technical team.
DEVELOPING A PROJECT IMPLEMENTATION AND
MONITORING PLAN
The Project Implementation and Monitoring Plan is developed by the PMT. It identifies the links
between the project’s inputs and activities and its outputs, outcomes and impacts. It details
how and by whom the project is to be implemented over time, as well as builds a framework for
monitoring project progress. Assistance in developing and executing the Plan can be obtained
from the NPPID in the MOF and M&E Unit of the Sponsor MPSA.
The Implementation and Monitoring Plan is developed through three steps:
1. The first step is to prepare a Logical Framework that links project inputs and activities to
the eventual impacts it is expected to have.
2. The second step is to develop an Implementation Schedule which acts as a guide to
when the project’s different activities are expected to take place over its lifetime.
3. The final step is to develop a Monitoring Schedule that lists the project outcomes that are
expected and describes indicators and their values that will be used to assess project
progress.
The Implementation and Monitoring Plan thus provides a comprehensive guide to what the
project is expected to achieve, how it expects to achieve this and how to assess whether this
achievement has been made. The three steps are outlined in greater detail below.
Step 1: Prepare logical framework
In order to determine how a project is to be implemented and monitored, it is necessary to
determine its expected outputs and outcomes. This task is fundamental to identifying exactly
how a project expects to achieve its desired objective; without this understanding, projects may
waste resources and, potentially, not reach their eventual goals.
A logical framework is therefore developed to link a project’s inputs and activities to its outputs,
outcomes and eventual impact. These outputs and outcomes represent the causal links that
bridge the gap between the current status and the desired high-level results.
The figure below depicts logical framework design that helps in understanding this process.
Implementation happens by beginning on the left, with the actual inputs and activities that
comprise the project. These lead to outputs, the actual goods and services that result from the
project intervention. Outputs in turn lead to outcomes, the effects on society and long-lasting
impact. Planning occurs in the opposite direction; an objective, or desired impact, is specified
and the project is then designed in such a way that inputs logically lead to achieving this goal.

83
The logical framework is used to identify what activities are necessary to achieve a specific
outcome. It also specifies what the outcomes are; these will be measured to assess project
progress.
The logical framework is the first section of the Implementation and Monitoring Plan report and
is prepared by the PMT, with assistance from the MOF and the Project Implementing Agent.
Figure 5: The Logical Framework
Step 2: Prepare Implementation Schedule
Based on the detailed project design, a Project Implementation Schedule should be
developed before project rollout. An Implementation Plan outlines the projects expected
outputs (including various sub-outputs) and the planned activities (and various sub-activities)
associated with realizing each output. It further presents a timeline over which each activity will
be implemented and allocates the responsibility for each activity to a specific authority. Lastly,
the Plan gives an indication of the budget required for each activity and, based on the
financing strategy, designates the funding source for each. The implementation plan is the
second section in the Implementation and Monitoring Plan Report and is prepared by the PMT
with assistance from the MOF and the Project Implementing Agent. This implementation plan
should be presented clearly and succinctly, as shown in the table below.
Inputs
The financial, human, and
material resources used for developmnt
intervention
Activities
Actions taken through which
inputs are mobilised to
produce specific outputs
Outputs
The products, capital goods, and
services that results from
development interventions
Outcomes
The short and medium-term effects of an
intervention's outputs; change in development
conditions
Impact
Actual or intended changes in human development as
measured by people's well-being;
improvements in people's lives
How? What do we
want? Why?
IMPLEMENTATION
PLANNING
Source: UNDP (2011). Handbook on Planning, Monitoring and Evaluation

84
Step 3: Prepare Monitoring Schedule
It is important that the PMT measure project performance and adopt remedial strategies in
order to bridge performance gaps that may arise. Ongoing assessment of how the project is
performing is therefore an essential part of the project implementation process.
Monitoring of the project is undertaken in line with the project Monitoring Schedule. This is a
template that identifies, for each outcome and output, an indicator that can be used for their
measurement. Indicators must be measurable and quantifiable and can therefore be used to
measure project progress. Baseline values for the indicators are specified, as well as targets
expected to be reached over the project’s lifetime. Lastly, it also specifies the different methods
that will be used to gather data as well as the authority responsible for doing so. Setting up the
plan and identifying these aspects of it are described in greater detail below.
The purpose of developing the Monitoring Schedule before implementation begins is to ensure
that resources are used efficiently and that no gaps remain. Attempting to fit a monitoring
schedule to an existing project may lead to limitations in the amount and type of data that can
be collected.
While designing the Monitoring Schedule, it is essential that engagement takes place with all
main stakeholders so as to ensure consensus and to promote ownership of the project.
Specifically, the following groups must be included in the process:
Targeted beneficiaries or others whom the project is expected to affect;
Those who may be negatively affected by the project’s intervention;
Those who are expected to contribute resources towards to the project;
Those who are implementing projects with potentially conflicting goals; and
Those with the necessary decision-making authority.
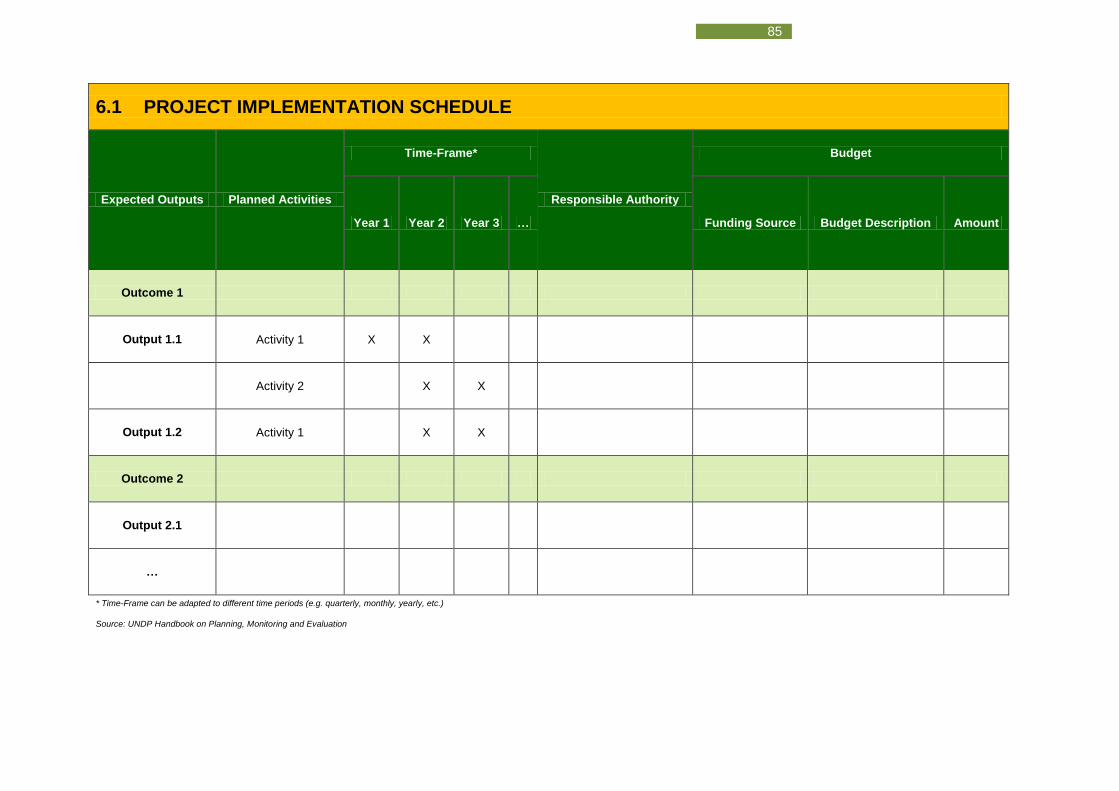
85
6.1 PROJECT IMPLEMENTATION SCHEDULE
Expected Outputs Planned Activities
Time-Frame*
Responsible Authority
Budget
Year 1 Year 2 Year 3 … Funding Source Budget Description Amount
Outcome 1
Output 1.1 Activity 1 X X
Activity 2 X X
Output 1.2 Activity 1 X X
Outcome 2
Output 2.1
…
* Time-Frame can be adapted to different time periods (e.g. quarterly, monthly, yearly, etc.)
Source: UNDP Handbook on Planning, Monitoring and Evaluation

86
The steps and final template below provide guidance on constructing a Monitoring Schedule.
Step 1: Identify the project objective, outputs and outcomes that are being monitored
The project objective should be consistent throughout the preparation process and can be
drawn from the Feasibility Study. The project outputs and outcomes – the causal links between
project inputs and its higher level objective – can also be drawn from the Feasibility Study as
well as from the logical framework previously created.
Given that there are many potential outcomes that a project may have, it is important during
this process to reach consensus on a reasonable number of critical outcomes that will be
measured. How effectively and efficiently these outcomes can be measured is also a point to
take into consideration.
Step 2: Specify the indicators that will be used to measure the progress of each output
and outcome
The outcomes determined above need to be translated into a form that can be evaluated. This
is done by defining a set of measures and indicators that focus on one or more characteristics
of the outcome in question and are used to measure whether targets for outputs and outcomes
are being met and whether the project is achieving its goals. These indicators should generally
be measurable, quantifiable and observable and should contain a logical link to the output or
outcome that they represent; without this link data may end up being collected that is not
useful, which wastes time and resources. Effective indicators usually have characteristics that
are SMART13
; that is, they are:
Specific – indicators should reflect simple information that is communicable and easily understood
Measurable – changes should be objectively verifiable
Achievable – indicators and their measurement units must be achievable and sensitive to change during the implementation process
Relevant – indicators should reflect information that is important and likely to be used for management or immediate analytical purposes.
Time-based – progress can be tracked at a desired frequency for a set period of time.
Step 3: Set baseline values and targets for each indicator
Baseline values and targets are the benchmarks against which each indicator will be
monitored during project implementation and evaluated at its end. These targets should be
realistic, should clearly indicate whether progress is being made, and should be agreed upon
by the project’s main stakeholders.
Step 4: Define the data required for each indicator and how that data will be collected
13
World Bank Group

87
For each indicator identified, specify what type of data – both quantitative and qualitative – is
required (for example, census data, specialist surveys, geographic data, assessment results,
or workshop minutes). Further, how this data will be collected must also be described. This will
ensure that all avenues for data collection are assessed and help in prioritising resources used
for the monitoring process.
Reliable, existing data is a good place to begin data identification, although too great a reliance
on certain data sources may not fully capture project effects. In this case, new data should be
collected that focuses specifically on the indicator in question.14
Step 5: Describe when data will be gathered and who will be responsible for doing so.
Once the types of data and means of gathering it have been identified, it should be determined
when the different data will be gathered. Collection of monitoring data, for example, may occur
regularly over short intervals, or less regularly, such as bi-annually or annually.
It is also important to assign responsibility for collecting this data so that all stakeholders are
clear about their roles and responsibilities. This also allows new staff who come onto the
project to easily understand what needs to be done and who is involved. Assigning timelines
ensures that ownership of each task is properly allocated.
The Monitoring Schdule would be developed by the PMT, with assistance from the M&E Unit
of the Sponsor MPSA.
The Monitoring Schedule should be presented as the third section of the Implementation and
Monitoring Plan, as per the template presented below.
14
A more detailed outline of common data collection methods and the advantages and challenges of each can be found in the UNDP’s (2011) Handbook on Planning, Monitoring and Evaluation.

88
6.2 PROJECT MONITORING SCHEDULE
PROJECT NAME
PROJECT RESULTS
INDICATOR BASELINE TARGETS DATA COLLECTION AND REPORTING
Year
1 Year
2 Year
3 Year
N Frequency
Data Sources/ Methodology
Responsibility for data collection
Project Development Objective
Indicator 1, 2, 3, …
Planned
Achieved
OUTCOME 1
OUTPUT 1.1 Indicator 1, 2, 3, …
Planned
Achieved
OUTPUT 1.2 Indicator 1, 2, 3, …
Planned
Achieved
OUTCOME 2
OUTPUT 2.1 Indicator 1,2,3, …
… … …
Source: World Bank. 2012. Designing a Results Framework for Achieving Results

89
PROCUREMENT
Once the Implementation and Monitoring Plan has been developed, procurement can begin.
This involves procuring the various inputs that are needed to undertake the different project
activities.
The procurement choice for the project is determined during the project structuring and
financing process. The actual procurement process – that is, the actual contracting of a service
provider(s) to provide goods and services to actually implement the project – occurs once
financial closure has been reached, as per the Implementation and Monitoring Plan.
The authority contracted to physically implement the project may be composed of a consortium
of firms. These firms undertake the construction of the project, setting up the necessary
processes and undertake the operations and maintenance of its activities.
REPORTING ONGOING PROJECT PERFORMANCE
The Monitoring Schedule specifies the different monitoring activities taking place. In order for
the findings from these activities to have a meaningful impact on project implementation, it is
necessary that they are collated and properly presented.
The Monitoring Team takes responsibility for reviewing the monitoring activities and compiles
Project Monitoring Reports. A Monitoring Report details the outcomes of these monitoring
activities that have been undertaken for the project and presents an overall picture of how the
project outputs and outcomes are performing relative to the targets that were set out in the
Implementation and Monitoring plan. As described in the Monitoring Schedule, these outputs
and outcomes are measured using appropriate indicators.
The Monitoring Report therefore provides detailed information on the Monitoring Activities that
have taken place and the findings that have emerged regarding how well the project is doing at
meeting its targeted outcomes. Importantly, based on these findings, it also provides an
opportunity to make recommendations on how improvements can be made on the
implementation of the project.
The Monitoring Schedule will also specify the intervals at which the Monitoring Report is to be
conducted. For example, a shorter Monitoring Report might be conducted monthly or quarterly,
while a larger, more comprehensive report should be produced on an annual basis. Annual
reports must be presented to the M&E Department within the MOF, while monthly/quarterly
reports should be presented to the M&E Unit in the MPSA.
The M&E Unit from the MPSA can provide technical assistance for compiling and drafting the
Monitoring Reports to the PMT. The template below provides an overview of the key
components of a Monitoring Report.

90
6.3 MONITORING REPORT
INTRODUCTION AND CONTEXT
PROJECT OBJECTIVE AND BACKGROUND
This section should provide information relating to the following aspects of the project:
Identification of the project objective;
Description of the socio-economic context before project intervention; and
Description of any lessons learned from previous evaluations that informed the design,
implementation and evaluation of the project.
PROJECT DESCRIPTION
This section should describe the following:
The project components; that is, its various inputs, activities and outputs and the time period
over which the project was implemented;
How the project is being funded/financed
What the expected results of the project are?
The Project Monitoring Schedule should be included here. This will provide a clear description of the
outcomes and outputs that are being monitored, the indicators and evaluation methods used, and the
authorities responsible for undertaking monitoring activities.
FINDINGS
For each project output identified (as per the Monitoring Schedule), complete the table below.
Output 1.1
Output Indicator
Target results
(date)
Results Achieved
(date period)
Output Description
Indicator 1
Indicator 2
…

91
Overall, did the output meet its performance expectations? Yes □ No □
Summary of the above table:
Describe the indicators and provide a brief summary of whether targets were met.
Describe briefly, if appropriate, why targets were not achieved.
Progress against expected results by output indicators:
List the indicators outlined in the table above and do the following for each:
Assess whether or not the indicator met its target
Describe the changes that occurred for the indicator
Describe the project inputs and activities that affected this indicator; and
Provide reasons for why targets were or were not met.
Recommendations:
Drawing on the indicator assessment above, list recommendations for changes to be made in order to
improve project outcomes and impact.
PROGRESS
This section addresses the following:
Project progress and activities completed against the original timescale,
Project spending against financial forecasts
Risks or changes that may have arisen which may or may not have caused changes in the
project’s implementation schedule
CONCLUSION AND RECOMMENDATIONS
Based on the findings from the various monitoring activities, provide an overall, high level summary of the success and lessons of the project and assess whether the project met overall expectations. Limitations in the monitoring process should also be clearly laid out.
It is important to communicate, if possible, how the findings from the monitoring process will be used both for moving ahead with the implementation of the project in question as well as in terms of future projects, programmes, policy changes etc.
APPENDICES
Provide detailed information to which some readers may want to refer to, including:
Description of the review/monitoring process
Questionnaires used in collecting data

92
Detailed results and information
Statistical analyses, etc.
DECOMMISSIONING
Decommissioning involves the finalisation and closure or withdrawal from a project. This
occurs if all project implementation is complete, funding circumstances change or the project
contract agreement finishes or is terminated. Decommissioning is undertaken by the Sponsor
Department, based on advice from the PMT and should be undertaken in a planned way. The
process will be guided by the Implementation and Monitoring plan.

Project Identification
Project Definition
Pre-Feasibility
Detailed Feasibility
Financing
Implementation and Monitoring
Ex-post Impact Evaluation
07 EX-POST
IMPACT EVALUATION

94
RATIONALE FOR THIS STAGE
Once a project has been decommissioned, it is important to understand whether the project
has been able to achieve its objective. The final stage of the project life cycle is therefore to
conduct an Impact Evaluation of the project that will attempt to answer this question as well as
identify other impacts the project may have had and evaluate whether the project provided
value-for-money relative to other possible interventions.
The Impact Evaluation will be conducted by an evaluation team from the M&E Unit in the
Sponsor MPSA. The M&E Department in the MOF should exercise overall supervision of the
Impact Evaluation. It will also be responsible for reviewing all Impact Evaluation reports that
come before it and presenting the findings before the Cabinet Office.
Ultimately, an Impact Evaluation will help in learning lessons from the project’s successes and
failures and will assist in designing projects in the future.
TOOLS AND INSTITUTIONS INVOLVED
Once a project has been implemented, the M&E Unit in the sponsor MPSA authorises an
Evaluation Team to evaluate the project and compile an Impact Evaluation Report which
details its findings.
As part of the above Report, a Value for Money (VfM) assessment of the project is
conducted so as to assess whether or not a project obtained the maximum benefit from
the resources it utilised.
This Impact Evaluation Report is presented to the Cabinet Office and represents the final tool
used in the project life cycle.
Key Tools Authority Responsible Page
7.1 Impact Evaluation Report M&E Unit, MPSA 97

95
Box 5: Difference between Monitoring and Impact Evaluation
EVALUATING THE PROJECT
Once a project has been completed, it is necessary to determine the impact that it had on
society. This is done through an Impact Evaluation exercise which assesses whether a
project has been able to achieve its specific objectives.
An Impact Evaluation Report contains the impact evaluation study completed for the project. It
requires proper preparation, with appropriate indicators developed and survey questionnaires
designed in order to address the following:
Assessment of project specific impacts and whether the project achieved its objective;
Assessment of the ex-post impact on the project’s beneficiaries for understanding:
o Whether expected benefits of the project were realised;
o To what extent these benefits were realized;
o Benefits other than those envisaged were realised; and
o There have been any unintended negative consequences due to the project.
Learning lessons for project implementation successes and failures that will help in
designing future projects.
Analysis of whether the project was value for money, particularly relative to other
similar projects measured in terms of economy, effectiveness and efficiency indicators.
The difference between monitoring and impact evaluation of a project – often grouped together
under Monitoring and Evaluation (M&E) – is outlined in the box below:
The Impact Evaluation will be conducted by an evaluation team from the M&E Department of
the sponsor MPSA. They would be assisted by the PMT and if required, by external technical
consultants, depending resource scarcity and capacity constraints.
The M&E Department in the MOF would exercise overall supervision of the Impact Evaluation
as well as provide guidelines on how it should be conducted. The M&E Department will also be
responsible for reviewing all Impact Evaluation reports that come before it and presenting the
findings before the Cabinet Office.
Monitoring Monitoring is designed to extract a constant stream of feedback on the ongoing performance of the programme. This allows for immediate action to resolve challenges as they arise, and to constantly improved the programme on the basis of the feedback received.
Impact Evaluation
Impact Evaluation constitutes a thorough investigation into the programme’s performance on targeted indicators over a period of time. This type of evaluation typically involves baseline and endline measurement of these indicators, after which analysis is conducted to establish the programme’s impact.

96
VALUE-FOR-MONEY ANALYSIS
The last point in particular represents the conclusion of the Impact Evaluation Report, which is
focused on assessing whether the project achieved – or how far it managed to achieve –
Value for Money (VfM), which is recorded on a specific template:
Value for Money is a term used here to assess whether or not a project has obtained the
maximum benefit from the resources it has used. VfM is not necessarily about doing things as
cheaply as possible, but rather aims to develop a better understanding of the costs driving the
project and the project results in order to make more informed decisions. VfM is often
described in terms of three aspects:
Economy: how well resources have been used to save expense, time or effort
This relates to how inputs for the project are purchased. Questions to ask should focus
on whether inputs of the appropriate quality are being bought at the right price.
Efficiency: how well inputs are being converted into outputs
Outputs are the project deliverables provided to beneficiaries. Questions to ask should
focus on the quality and quantity of outputs produced relative to inputs used. Further,
cost-efficiency includes both economy and efficiency and relates to how well the
costs involved in the program are translating into outputs delivered to beneficiaries.
Effectiveness: how effectively project outputs are achieving desired outcomes
This relates to how well outputs produced by the project are translating into measured
outcomes and impact. Cost-effectiveness takes this further, and involves
understanding how well an intervention achieves its impact relative to the inputs
(generally monetary costs) used in its implementation.
The figure below shows the relationship between the Logical Framework (developed when
designing the Implementation and Monitoring Plan) and the value for money measures
described above.
Figure 6: Value for Money Measures and the Logical Framework
Source: DFID Approach to Value for Money (VfM)

97
VfM measures can be drawn from the appraisal of the project that was completed as part of
the Detailed Feasibility Study. These measures should be relevant for the project objective and
should measure the economy, efficiency, effectiveness and cost-effectiveness of the project.
Measures should be provided that are measurable and can be used to track the project
progress and indicate whether it continues to represent good VfM. Some good examples of
measurement include: 15
Unit costs, at input and output levels
Measures of return from financial and economic appraisal, including Net Present
Value, Internal Rate of Return, Benefit-Cost ration, etc.
Other performance indicators specific to project outputs,
Equity and distributional analysis measures,
Comparisons of rates of return or unit costs with those from other similar interventions
or contexts,
Key cost drivers in the intervention, and
Benchmarks against which indicators must be measured against, etc.
There are no hard rules for which VfM indicators should be used. These will depend on the
project design and objective in question as well as on VfM measures specified by institutions
(such as donor organisations) as part of their operating procedures.
VfM measures will therefore form part of the Impact Evaluation Report after the completion of
the project. The template below shows the structure of an impact evaluation report and
indicates the different aspects of the evaluation to be included.
7.1 IMPACT EVALUATION REPORT
CONTENTS
1. Executive Summary
2. Introduction
3. Project Objective and Background
4. Project Description
5. Impact Evaluation
6. Conclusion
EXECUTIVE SUMMARY
15
DFID. 2011. How to Note: Writing a Business Case.
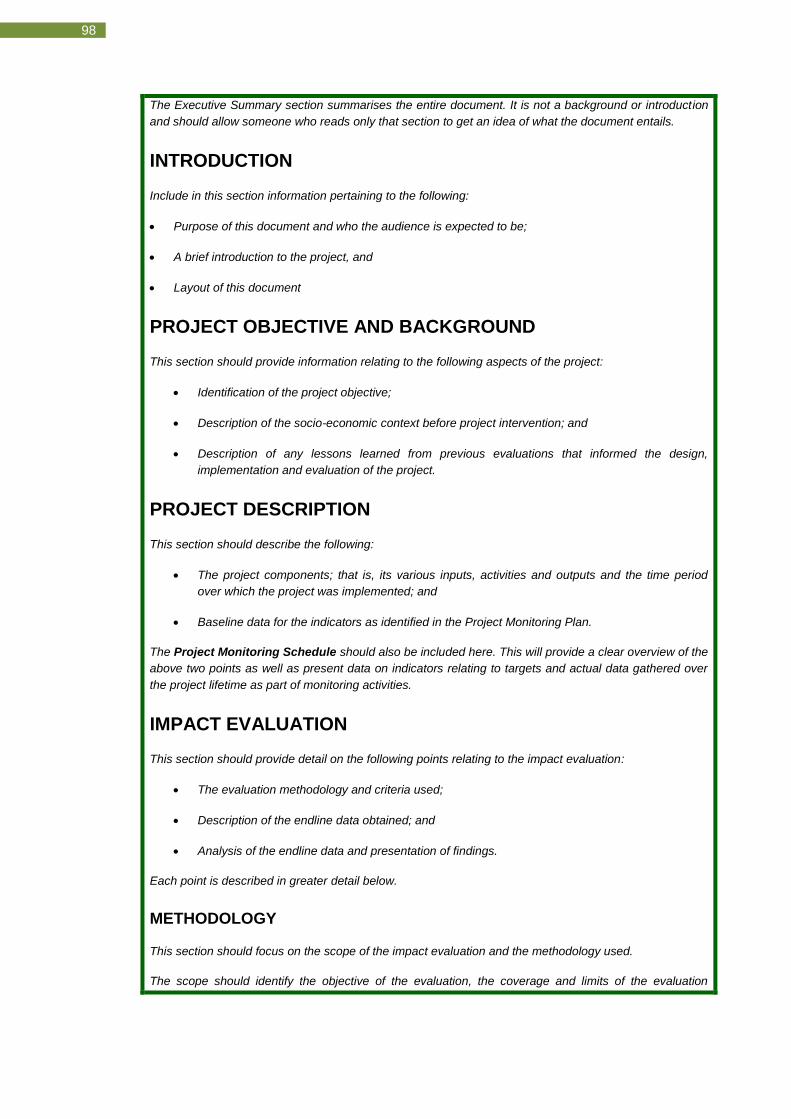
98
The Executive Summary section summarises the entire document. It is not a background or introduction
and should allow someone who reads only that section to get an idea of what the document entails.
INTRODUCTION
Include in this section information pertaining to the following:
Purpose of this document and who the audience is expected to be;
A brief introduction to the project, and
Layout of this document
PROJECT OBJECTIVE AND BACKGROUND
This section should provide information relating to the following aspects of the project:
Identification of the project objective;
Description of the socio-economic context before project intervention; and
Description of any lessons learned from previous evaluations that informed the design,
implementation and evaluation of the project.
PROJECT DESCRIPTION
This section should describe the following:
The project components; that is, its various inputs, activities and outputs and the time period
over which the project was implemented; and
Baseline data for the indicators as identified in the Project Monitoring Plan.
The Project Monitoring Schedule should also be included here. This will provide a clear overview of the
above two points as well as present data on indicators relating to targets and actual data gathered over
the project lifetime as part of monitoring activities.
IMPACT EVALUATION
This section should provide detail on the following points relating to the impact evaluation:
The evaluation methodology and criteria used;
Description of the endline data obtained; and
Analysis of the endline data and presentation of findings.
Each point is described in greater detail below.
METHODOLOGY
This section should focus on the scope of the impact evaluation and the methodology used.
The scope should identify the objective of the evaluation, the coverage and limits of the evaluation

99
methodology, and the evaluation questions being asked.
The methodology should include, but not be limited to, descriptions of the following:
Data sources and collection and sampling methods;
Indicators and their baseline and target values;
Criteria used in the evaluation (e.g. efficiency, effectiveness, impact, value-for-money,
sustainability, performance standards, and benchmarks);
Description of evaluation team, including roles of each member;
The evaluation plan;
Key limitations and constraints; and
The role of stakeholder participation and other ethical considerations.
DESCRIPTION OF ENDLINE DATA
This section should present the endline data obtained for the indicators used in the evaluation. It is
important that these indicators presented here correspond to those developed as part of the Monitoring
Plan.
ANALYSIS OF ENDLINE DATA AND FINDINGS
Analysis of the data should be presented, and findings should refer to the following:
Inputs: findings on the completion of project activities;
Outputs: findings on the goods/services that the project succeeded in providing;
Outcomes / Impacts: effects the project’s provision of goods/services had on society, including
any unintended effects (both positive and negative); and
Value for Money Assessment the project.
Where possible, the findings should make the link between implementation and results and clearly
specify any caveats and assumptions. Data does not need to be presented in full; only data supporting
findings needs to be presented, while all data can be contained in the Annex.
CONCLUSION
The conclusion should contain the following:
A brief summary of the key findings;
Limitations of the study (e.g. with regards to criteria and methodology used)
Whether findings and lessons learned can be generalised for future project design and
implementation; and
Recommendations on a way forward, if appropriate.

100
ANNEXES
The Annex completes the report with relevant information and increases its usability and credibility. It
may include the following:
List of persons interviewed and sites visited;
Data collection instruments;
Full data collected;
The original terms of reference of the evaluation.
The Ex-Post Impact Evaluation represents the final step in the project life cycle. Once this is
done, the project process, from concept through to implementation, is completed.

101
ABBREVIATIONS AND ACRONYMS
CBA Cost Benefit Analysis
DFS Detailed Feasibility Study
GRZ Government of the Republic of Zambia
IDM Investments and Debt Management Department
IMP Implementation and Monitoring Plan
M&E Monitoring and Evaluation
MOF Ministry of Finance
MPSAs Ministries, Provinces and other Spending Agencies
MTEF Medium-Term Expenditure Framework
NDP National Development Plan
NPPID National Policy and Programme Implementation Department
PAC Policy Analysis and Coordination Division
PAS Project Assessment Sheet
PCN Project Concept Note
PFS Pre-Feasibility Study
PIS Project Information Sheet
PPP Public-Private Partnership
SAG Sector Advisory Group
SNDP Sixth National Development Plant
VfM Value for Money

102
KEY TERMS
Activities Actions taken through which project inputs are mobilised to produce
specific outputs
Appraisal Systematic assessment of a project’s viability/ ability to meet its
objective through an examination of its financial, economic, social,
environmental, technical and other aspects.
Bankability When a project structure is prepared, such that the project shows
sufficient financial and/or economic returns, a supportive legal and
regulatory environment as well as a feasible technical solution.
Cost Benefit Analysis Methodology for appraising financial and economic value of investing
in a project and gives an indication of whether the project will result in
a net positive impact on society in both financial and economic terms.
The CBA is the main method used to assess a project’s viability.
Detailed Feasibility Fourth stage of project development, involves the development of a
detailed feasibility study for the project and an appraisal to determine
whether project should be invested in. Output is a Short List of
projects to be financed
Ex-Post Evaluation Seventh and final stage of project life cycle, involves conducting an
impact evaluation of the project to assess whether it has achieved it
objectives and to determine the impact it had on society
Financial Closure The point in the project preparation process where all the financial
aspects of the deal have been agreed, the financing documents have
been signed and project implementation can proceed.
Financing Fifth stage in the project life cycle, involves identifying different
mechanisms and sources of financing available for the project and
brining the project to financial closure
Gateway Usually a department or group of selected personnel in the Ministry of
Finance which acts as a common authority that takes responsibility for
assessing all projects that are being developed. As a dedicated
institutional structure, it has the authority and expertise to ensure that
the appraisal process is conducted consistently and thoroughly and to
make recommendations on the project structure going forward
Impact Actual or intended changes in human development measured by
people’s well-being; improvements in people’s lives
Impact Evaluation Impact Evaluation constitutes a thorough investigation into the
programme’s performance on targeted indicators over a period of
time. This type of evaluation typically involves baseline and endline

103
measurement of these indicators, after which analysis is conducted to
establish the programme’s impact
Implementation and
Monitoring
Sixth stage of project life cycle, involves the actual implementation of
the project and ongoing assessment of its progress
Implementing Agent Institution(s) appointed during the project structuring process which is
contracted to carry out and oversee the implementation of the project.
It will be appointed in line with the project’s procurement choice
Inputs The financial, human, and material resources used for a development
intervention
Long List Final Long List is the final tool in the Project Definition stage of project
development, and lists those projects which have been approved by
the Gateway to undergo feasibility studies and appraisal
Monitoring Monitoring is designed to extract a constant stream of feedback on
the ongoing performance of the programme. This allows for
immediate action to resolve challenges as they arise, and constantly
improved the programme on the basis of the feedback received
Outcomes The short and medium-term effects of an intervention’s outputs; the
change in development conditions
Outputs The products, capital goods, and services that results from a
development intervention
Policy A statement of goals, objectives and courses of action outlined by the
Government to provide guidance for its intended actions
Pre-Feasibility Third stage of project development, involves development of a pre-
feasibility study for the project and an appraisal of whether it exhibits
sufficient value to continue onto a full detailed feasibility study
Procurement Contracting of service providers to provide goods and services to
physically implement the project
Procurement Choice Also known as the Implementation Model, involves determining the
optimal mix of public and private participation in the project and
represents the organisational structure through which the project will
be implemented. This choice will inform the appointment of the
implementing agent
Programme A programme is a portfolio comprised of multiple projects that are
managed and coordinated as one unit with the objective of achieving
(often intangible) outcomes and benefits for the organisation.
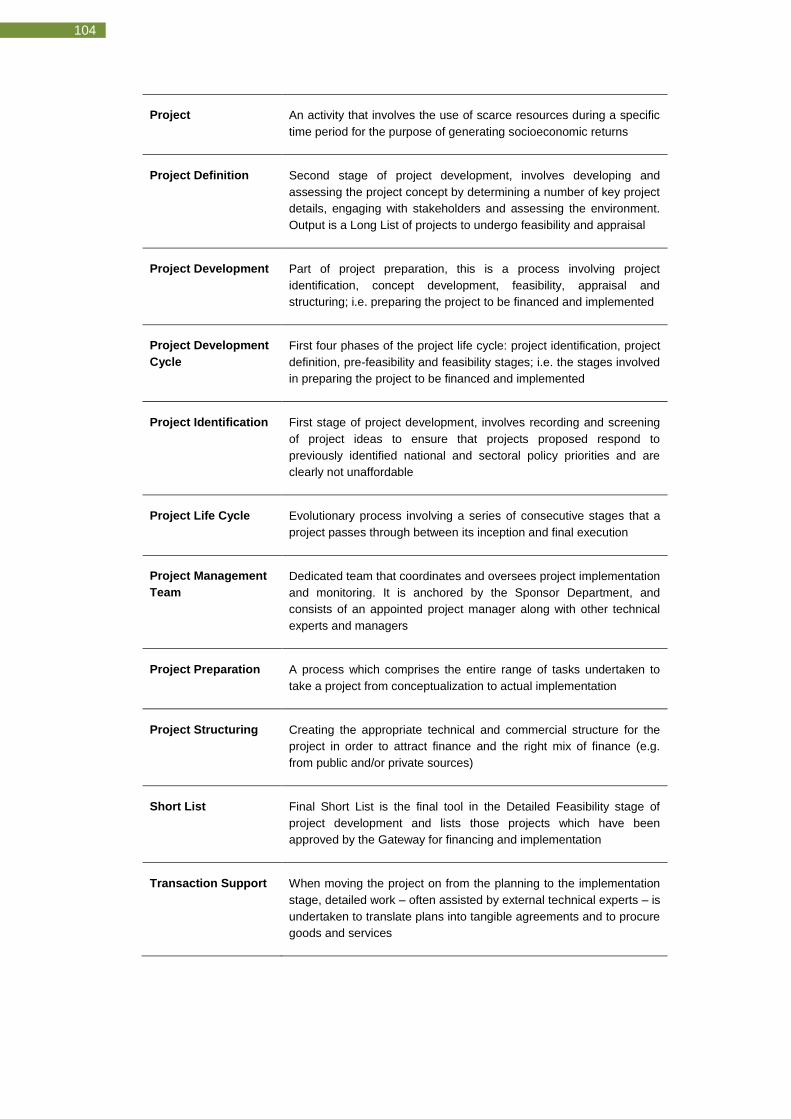
104
Project An activity that involves the use of scarce resources during a specific
time period for the purpose of generating socioeconomic returns
Project Definition Second stage of project development, involves developing and
assessing the project concept by determining a number of key project
details, engaging with stakeholders and assessing the environment.
Output is a Long List of projects to undergo feasibility and appraisal
Project Development Part of project preparation, this is a process involving project
identification, concept development, feasibility, appraisal and
structuring; i.e. preparing the project to be financed and implemented
Project Development
Cycle
First four phases of the project life cycle: project identification, project
definition, pre-feasibility and feasibility stages; i.e. the stages involved
in preparing the project to be financed and implemented
Project Identification First stage of project development, involves recording and screening
of project ideas to ensure that projects proposed respond to
previously identified national and sectoral policy priorities and are
clearly not unaffordable
Project Life Cycle Evolutionary process involving a series of consecutive stages that a
project passes through between its inception and final execution
Project Management
Team
Dedicated team that coordinates and oversees project implementation
and monitoring. It is anchored by the Sponsor Department, and
consists of an appointed project manager along with other technical
experts and managers
Project Preparation A process which comprises the entire range of tasks undertaken to
take a project from conceptualization to actual implementation
Project Structuring Creating the appropriate technical and commercial structure for the
project in order to attract finance and the right mix of finance (e.g.
from public and/or private sources)
Short List Final Short List is the final tool in the Detailed Feasibility stage of
project development and lists those projects which have been
approved by the Gateway for financing and implementation
Transaction Support When moving the project on from the planning to the implementation
stage, detailed work – often assisted by external technical experts – is
undertaken to translate plans into tangible agreements and to procure
goods and services

105
TEMPLATE REFERENCE SHEET
STAGE OUTPUTS AUTHORITY RESPONSIBLE PAGE
1. Project
Identification 1.1 Project Information Sheet Sponsor Dept., MPSA 12
1.2 Project Assessment Sheet Planning Directorate, MPSA & Ministry of Finance
13
1.3 Draft Long List Ministry of Finance 16
2. Project Definition 2.1 Project Concept Note Sponsor Dept., MPSA 21
2.2 Project Checklist Sponsor Dept., MPSA 25
2.3 Project Concept Assessment Sheet
Ministry of Finance 26
2.4 Final Long List Ministry of Finance 27
3. Pre-Feasibility 3.1 Cost Benefit Analysis Outline
Ministry of Finance 35
3.2 CBA Executive Summary Template
Sponsor Department, MPSA 36
3.3 Pre-Feasibility Study Sponsor Dept., MPSA 38
3.4 Pre-Feasibility Appraisal Form
Gateway 45
3.5 Draft Short List Gateway 47
4. Detailed 4.1 Detailed Feasibility Study Sponsor Department, MPSA 52
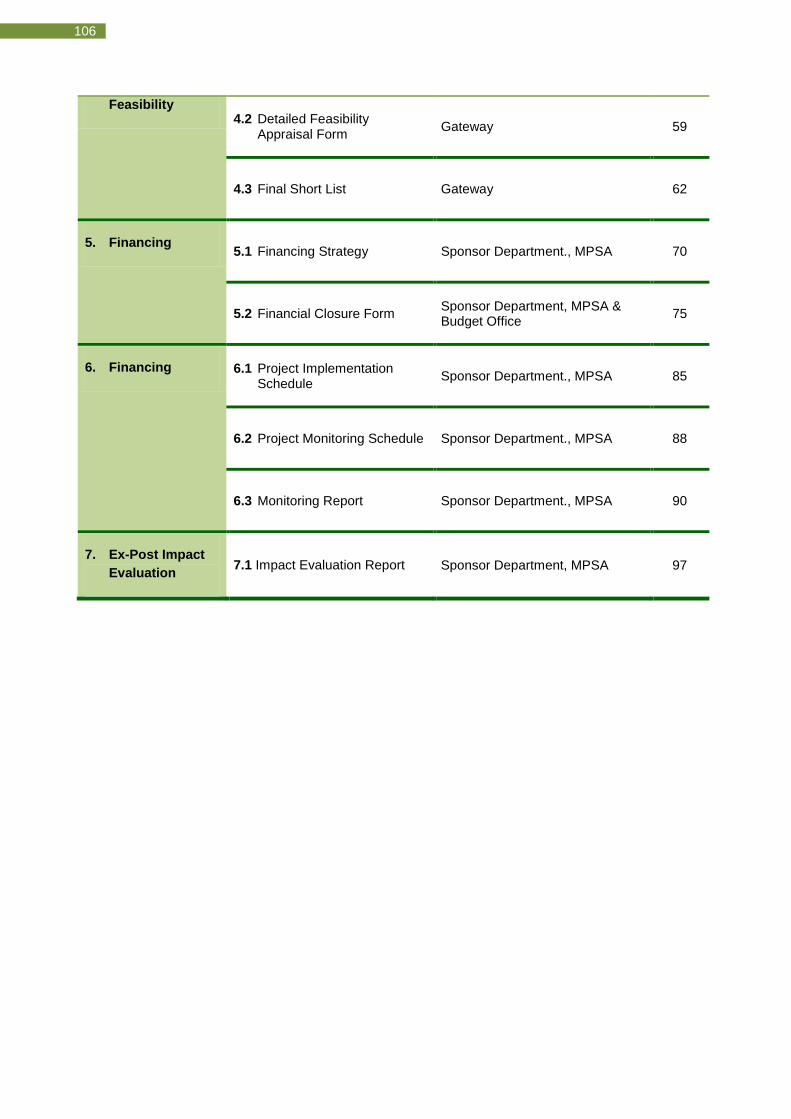
106
Feasibility 4.2 Detailed Feasibility
Appraisal Form Gateway 59
4.3 Final Short List Gateway 62
5. Financing 5.1 Financing Strategy Sponsor Department., MPSA 70
5.2 Financial Closure Form Sponsor Department, MPSA & Budget Office
75
6. Financing 6.1 Project Implementation Schedule
Sponsor Department., MPSA 85
6.2 Project Monitoring Schedule Sponsor Department., MPSA 88
6.3 Monitoring Report Sponsor Department., MPSA 90
7. Ex-Post Impact
Evaluation 7.1 Impact Evaluation Report Sponsor Department, MPSA 97

107
ANNEXURE I: SAMPLE CBA
In this section, a full sample Cost Benefit Analysis Report done for a hypothetical irrigation project in Southern
Africa is presented.
EXECUTIVE SUMMARY
The proposed irrigation scheme, located in District A of Province B in Country C, aims to mitigate the increasing
incidences of crop failure arising from declining and/or volatile rainfall trends, and increase the food security of
the target population which consists of 1200 households (5400 individuals). This report provides an analysis of
the financial and economic viability of the project through a Cost Benefit Analysis (CBA) framework.
CBA is a methodology that involves weighing up the implicit and explicit positive and negative impacts (costs
and benefits) of a project, in terms of its contribution to social welfare. Given that profit is not always the primary
objective, CBA serves to indicate whether there is an economic rationale for the public provision of a
good/service (the project) – i.e. because it will generate a positive net social benefit – even when a project may
not necessarily be financially profitable.
There are two distinct components of the project, which are assessed separately given that they are at different
stages in terms of project development.
1. The irrigation scheme
The irrigation scheme involves the construction and implementation of infrastructure to pump water from the
Dam to a storage reservoir, and a gravity-fed distribution network to irrigate 126ha identified in four blocks of
land. The total investment cost for the irrigation scheme is estimated to be USD 3,205,189 (includes capital
costs and start-up costs).
2. Improved water supply and sanitation (WASH)
In addition to the irrigation scheme, preliminary investigations have been made into the best option for improving
the domestic water supply and sanitation of the target communities. The preferred option for domestic water
supply is to construct 15 new, and refurbish two existing, boreholes. The sanitation solution chosen is the
construction of 1008 new Ventilated-Improved Pit latrines – 1000 at beneficiary households, and an additional
two at each of the four irrigation areas. The total investment cost for the WASH component is estimated to be
USD 339,740, of which the community is expected to contribute a total of USD 105,600 in labour, sand, stone
and draught power.
The analysis finds the irrigation scheme to be both financially and economically viable. The financial analysis,
conducted from the perspective of the beneficiaries, considers in the analysis capital, start-up and operation &
maintenance costs. The revenue considered is the income received as a result of the implementation of the new
agronomic model. The results are a positive Financial Net Present Value (FNPV) (USD 2,095,634) - meaning
the discounted benefits (income streams) over the project life exceed the discounted costs (expenditures). This
indicates that the project is financially viable. Furthermore, the analysis finds that the Financial Internal Rate of
Return (FIRR) of the project is equal to 15%, which exceeds the financial opportunity cost of capital (6.9%). This
indicates that the project is commercially desirable (i.e. preferable to the alternative of not investing in the
project). The sensitivity analysis shows that these results remain positive when costs increase by 15%, benefits
decrease by 15%, and both happen simultaneously. However, considering the current vulnerability of the
beneficiary communities and the challenge of accessing microfinance, it is recommended that an investment
grant be sourced to cover the capital and start-up costs, and that the beneficiary communities take responsibility
for on-going operation & maintenance (O&M).

108
The Economic Analysis of the irrigation component includes the additional benefits of food security and the real
value of the water supplied. Financial prices are also converted to economic prices through the application of
relevant conversion factors. The analysis indicates that the project is economically viable and desirable with
attractive economic indicators: the Economic Net Present Value (ENPV) is positive (USD 4,422,953) indicating
that the overall benefits to society exceed the costs; and the Economic Internal Rate of Return (ERR) is equal to
31% which, although viewed with caution due to potential issues in capturing re-investing economic returns,
proves significantly attractive.
The Water Supply and Sanitation (WASH) component is at an earlier stage of project development. The
objective is primarily to decrease distances to, and increase the availability of, safe (uncontaminated) water
sources. The preferred technical option is the refurbishment of existing, and sinking of new boreholes. The
viability of boreholes at the proposed locations has not however been confirmed. Further work is still required to
conduct yield tests, and based on the results explore the option of a piped water system from on high-yielding
boreholes to villages in those areas where the ground water occurrence is poor. This analysis is therefore
conducted on the assumption that the proposed borehole locations are indeed viable.
As there are no tariffs or charges associated with the provision of the boreholes and VIP latrines, the financial
analysis only shows the negative FNPV of (USD 234,781); there can be no FIRR because the project does not
generate any revenues. The WASH component alone is obviously not commercially viable. If it is assumed that
an external grant will address the upfront investment costs, the sustainability of the facilities will depend on the
communities’ ability to meet the on-going O&M. Given that the WASH O&M costs are negligible and in the form
of (own) labour (USD 60 per annum which translates into USD 0.05 per households a year), it is recommended
that the necessary training and organisational arrangements be made at the community level to facilitate the
O&M.
The Economic Analysis of the WASH component includes the additional benefits of time saved from improved
access to safe water sources, and the benefit of improved health as result of safe water supply and sanitation.
The ENPV is positive with a significantly high EIRR and an attractive B/C ratio. These results provide an
economic justification for the WASH component, even though it is not commercially viable.
For a project to be sustainable it must be both financially and economically viable and have sufficient cash flow
to meet O&M and financing costs at a minimum. Both the irrigation scheme and WASH component are
economically viable and desirable; the financial analyses show that the irrigation scheme is financially viable but
the WASH component negative. Given the current financial and social vulnerability of the communities and
challenges around accessing financing in the current economic climate, it is recommended that a grant be
sought for upfront investment costs of the whole project.
Assuming then that investment costs will be financed through an upfront grant, the sustainability of the project
will depend on whether or not the beneficiary communities can adequately manage, and cover the expenditures
for O&M. The financial analysis of the Irrigation component shows that the expected increase in crop income
can adequately cover the irrigation system O&M requirements. The O&M costs for the type of facilities installed
for the WASH component (hand pumps) will consist of own labour provided in kind by the communities. It is
however necessary to ensure that the project includes adequate training so the communities have the capacity
to take responsibility for the O&M, and that institutional / organisational arrangements are implemented to
manage the process. An investigation into the potential role of microfinance institutions in implementing
institutional arrangements necessary to facilitate O&M is therefore also intended, should the project be signed
off for further development.

109
Executive Summary Table
Budget
Capital investment Irrigation Component: USD 3,205,189 WASH Component: USD 339,740 (community to provide USD 105,600) TOTAL: USD 3,544,929
Beneficiaries
Direct beneficiary households A number of village communities, consisting of approximately 1200 households (5400 individuals).
Indirect beneficiary households Broader District residents
Assumed number of people per household 4.5
Lifespan of benefits 20 years
Direct & Indirect Economic Costs & Benefits
Economic investment cost Irrigation: USD 2,671,491 WASH: USD 300,689
Economic O&M costs Irrigation: USD 239,125 WASH: USD 24
Incremental water supply value USD 19,630.76 per year
Decrease in diarrhoea prevalence USD 832.5 per year
Time saved USD 90,176.10 per year
Food security USD 22,500 per year
Total Quantified Direct Net Economic Benefits
3.5% Discount Rate 10% Discount Rate
Irrigation: USD 15,241,890 WASH: USD 1,293,451
Irrigation: USD 9,130,250 WASH: USD 774,808
Description of Qualitative Impacts – Direct and Indirect
Education & labour productivity
The direct and indirect benefits of health, time, and food security compound each other over the long term. A healthier population, and time saved due to closer access as well as less illness, translate into higher labour productivity and improved educational outcomes. In terms of labour productivity, the World Health Organisation notes that a 0.3% increase in investment in household access to safe water is associated with a 1% increase in GDP. Such a ratio implies that the USD 3,450,303 investment in the project will lead to an ultimate increase in GDP three times that size. While this estimate is generic and general to the entire economy, it is recognised that the economic knock-on effects of the project will be largely felt in the communities itself, as opposed to national income. In terms of educational outcomes, less illness, improved nutrition and closer water access result in better attendance and ability to learn.
Economic opportunity – increased incomes
The food production derived from the irrigation scheme has exponential economic benefits, such as:
Increased activity in markets through the greater selling of produce; and
Attracting skills and the subsequent transfer of knowledge in farming practices.
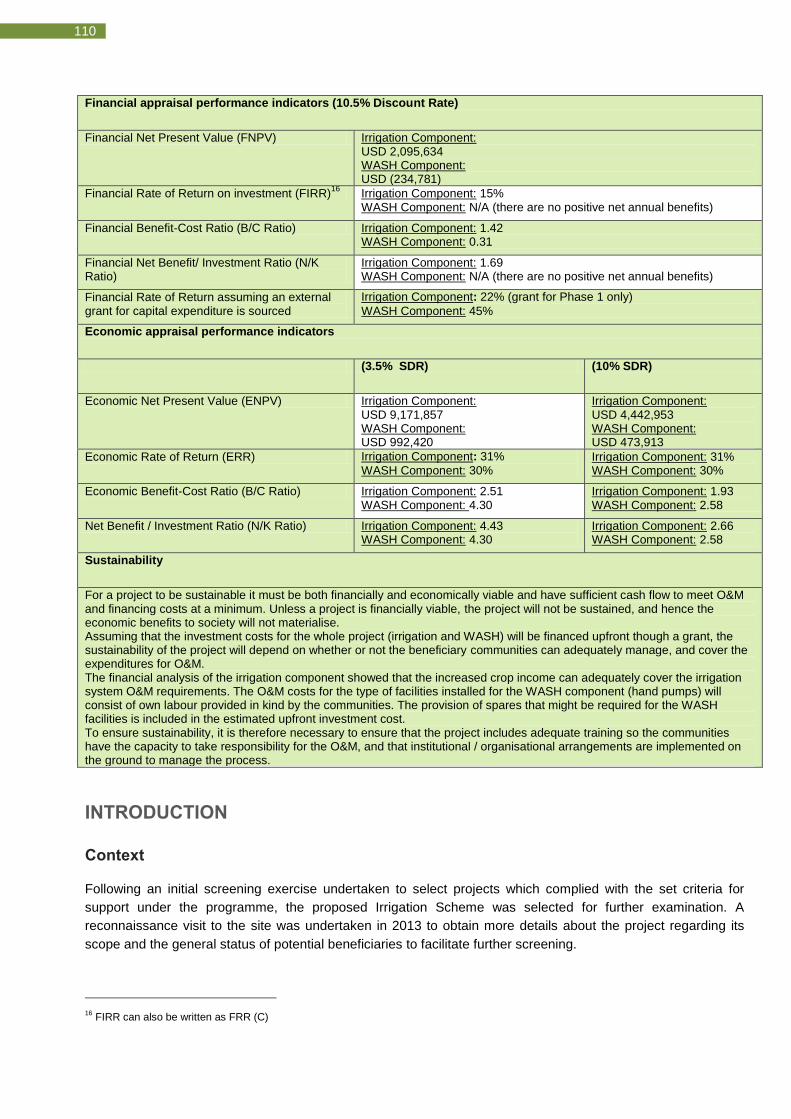
110
Financial appraisal performance indicators (10.5% Discount Rate)
Financial Net Present Value (FNPV) Irrigation Component: USD 2,095,634 WASH Component: USD (234,781)
Financial Rate of Return on investment (FIRR)16
Irrigation Component: 15% WASH Component: N/A (there are no positive net annual benefits)
Financial Benefit-Cost Ratio (B/C Ratio) Irrigation Component: 1.42 WASH Component: 0.31
Financial Net Benefit/ Investment Ratio (N/K Ratio)
Irrigation Component: 1.69 WASH Component: N/A (there are no positive net annual benefits)
Financial Rate of Return assuming an external grant for capital expenditure is sourced
Irrigation Component: 22% (grant for Phase 1 only)
WASH Component: 45%
Economic appraisal performance indicators
(3.5% SDR) (10% SDR)
Economic Net Present Value (ENPV) Irrigation Component: USD 9,171,857 WASH Component: USD 992,420
Irrigation Component: USD 4,442,953 WASH Component: USD 473,913
Economic Rate of Return (ERR) Irrigation Component: 31%
WASH Component: 30% Irrigation Component: 31% WASH Component: 30%
Economic Benefit-Cost Ratio (B/C Ratio) Irrigation Component: 2.51 WASH Component: 4.30
Irrigation Component: 1.93 WASH Component: 2.58
Net Benefit / Investment Ratio (N/K Ratio) Irrigation Component: 4.43 WASH Component: 4.30
Irrigation Component: 2.66 WASH Component: 2.58
Sustainability
For a project to be sustainable it must be both financially and economically viable and have sufficient cash flow to meet O&M and financing costs at a minimum. Unless a project is financially viable, the project will not be sustained, and hence the economic benefits to society will not materialise. Assuming that the investment costs for the whole project (irrigation and WASH) will be financed upfront though a grant, the sustainability of the project will depend on whether or not the beneficiary communities can adequately manage, and cover the expenditures for O&M. The financial analysis of the irrigation component showed that the increased crop income can adequately cover the irrigation system O&M requirements. The O&M costs for the type of facilities installed for the WASH component (hand pumps) will consist of own labour provided in kind by the communities. The provision of spares that might be required for the WASH facilities is included in the estimated upfront investment cost. To ensure sustainability, it is therefore necessary to ensure that the project includes adequate training so the communities have the capacity to take responsibility for the O&M, and that institutional / organisational arrangements are implemented on the ground to manage the process.
INTRODUCTION
Context
Following an initial screening exercise undertaken to select projects which complied with the set criteria for
support under the programme, the proposed Irrigation Scheme was selected for further examination. A
reconnaissance visit to the site was undertaken in 2013 to obtain more details about the project regarding its
scope and the general status of potential beneficiaries to facilitate further screening.
16
FIRR can also be written as FRR (C)

111
The proposed irrigation scheme is located on communal land in District A of Province B. The general climate is
hot and dry, with below average rainfall. Agriculture is subsistence, most areas are exhausted by the repeated
farming of maize crops for food supply, and there are no nearby irrigation schemes in the area. District A
experiences high malnutrition and food insecurity in comparison to other districts as a result of poor agricultural
production and high staple food prices. In addition, there is an inadequate supply of clean water (many
boreholes have dried up) and most livestock (which are a key livelihood and cultural asset) are dying as a result
of extended drought spells.
Economic and financial analysis
This report provides an analysis of the financial and economic viability of the scheme through a Cost Benefit
Analysis (CBA) framework.
The primary objective of the Irrigation Scheme is to mitigate the increasing incidences of crop failure arising
from decreasing and/or volatile rainfall trends, and to increase the food security of the target population. The
target population consists of 1200 households (estimated 5400 people).
There are two distinct components of the project.
1. The irrigation scheme
The irrigation scheme involves the construction and implementation of infrastructure to pump water from the
Dam to a storage reservoir, and a gravity-fed distribution network to irrigate 126ha identified in four blocks of
land.
2. Improved water supply and sanitation (WASH)
In addition to the irrigation scheme, preliminary investigations have been made into the best option for improving
the domestic water supply and sanitation of the target communities. For water supply, the preferred option is to
construct 15 new, and refurbish two existing, boreholes. Although sites for the boreholes have been identified,
further investigation is still required into their technical feasibility and potential yield. The sanitation solution
chosen is the construction of 1008 new Ventilated-Improved Pit latrines – 1000 at beneficiary households, and
an additional two at each of the four irrigation areas.
Given the difference in the stage of development the above two project components are at, the following
analysis looks first at the irrigation scheme as a distinct project, and then at the proposed WASH interventions.
Methodology
Cost Benefit Analysis (CBA) is a framework for appraising the viability of capital projects. It involves weighing up
the implicit and explicit positive and negative impacts (costs and benefits) of a project in terms of its overall
economic and financial contribution. Given that profit is not always the primary objective, CBA serves to indicate
whether there is an economic rationale for the public provision of a good/service (the project) – i.e. because it
will generate a positive net social benefit – even when a project may not necessarily be financially profitable.
The steps described below explain the approach that was followed to assess the economic and financial viability
of the project.
The CBA analysis consists of three major sections: the irrigation component; the water supply and sanitation
component; and the overall sustainability of the entire project. For each project component four key steps were
followed:

112
1. Demand analysis
This section looks at the extent of the need for irrigation and WASH facilities in the target areas, in order to
determine the scope of the project.
2. Least cost analysis/Options analysis
A least cost analysis is about choosing the most technically appropriate option to achieve the demand identified
in the demand analysis (step 1). In addition to being the most technically appropriate, the selection should
consider the social, economic and environmental impacts associated with each option, so that the chosen one
leads to the highest value for money in terms of efficiency and effectiveness.
3. Financial analysis
Once the preferred option has been chosen, the related financial costs and potential revenue streams can be
estimated. This analysis looks at the financial flows over the economic life of the project, and calculates the
Financial Net Present Value (FNPV) of the investment, the Financial Internal Rate of Return (FIRR), and the
Financial Benefit-Cost Ratio (FBCR). These financial indicators specify whether the project is financially viable
and commercially attractive.
4. Economic analysis
The economic analysis goes a step further by looking at the costs and benefits from the perspective of the
economy as a whole. While the financial analysis is limited to the costs and benefits in terms of project
expenditures and incomes at market prices (cash flows, profitability, and application of funds); the economic
analysis looks at a wider spectrum of costs and benefits than in the case of pure profit determination, and does
so at monetary values that reflect the real scarcity of project costs and benefits, as opposed to market prices.
Conversion factors are used to convert the financial costs into economic costs, representing the true economic
value of those flows to society. Other benefits arising from the implementation of the project that don’t
necessarily result in direct financial flows are also accounted for in this analysis. The outcome of this analysis is
the calculation of the Economic Net Present Value (ENPV), Economic Rate of Return (ERR), and Economic
Benefit-Cost Ratio (EBCR) of the project, which indicate whether the project results in a net social benefit to
society.
The final section is the sustainability analysis. This section looks at the sustainability of the whole project by
exploring the ability of the beneficiaries to cover on-going operation and maintenance, should the upfront
investment be covered by a grant. The potential role of micro-finance institutions, to provide access to finance
and institutional support to the communities, is also explored.
Assumptions
Time frame
With the appropriate maintenance, it is expected that the project will have an economic life of 20 years. The
analysis is therefore conducted for a 20 year timeframe.
Discount rate
The discount rate represents the rate at which the value of costs and benefits decrease in the future compared
to the present. The rate can be based on the alternative return that would be achieved in alternative uses given
113
up by committing resources to a particular project, or on society’s preference for benefits today rather than later.
The discount rate is used to determine the present value of future cost and benefit streams.
The financial analysis is conducted using an inflation adjusted discount rate of 6.9%. This rate was calculated by
adjusting the financial opportunity cost of capital, assumed to be 14%, by an average inflation rate for Sub-
Saharan Africa.
The Financial Opportunity Cost of Capital (FOCC) is the opportunity cost of using investment resources at
market prices in a project. This is often taken as the weighted average cost of capital used in the project. The
interest rate is reported by the Reserve Bank of Country C. The interest rate averaged 13.39% from 2011 until
2014, reaching an all-time high of 16.04% in March of 2012 and a record low of 9.50% in February of 2011. The
benchmark interest rate in Country C was last recorded at 14.11%. The inflation rate used (6.6%) is the
estimated average inflation rate for Sub-Saharan Africa between 2000 and 2012.
For the economic analyses, the social discount rate used is 10%. This discount rate was chosen in line with the
World Bank and European Bank for Research and Development’s standard conventional cut-off rate. The cut-off
rate is the rate of return below which a project is considered unacceptable; in the economic analysis the cut-off
rate is the Economic Opportunity Cost of Capital (EOCC). This rate is already adjusted for inflation.
Constant versus current prices
Prices used in all the analyses are for 2014, and do not take into consideration changes because of inflation. In
the analyses it is assumed that inflation is general, meaning that all prices rise at the same rate; hence adjusting
prices for inflation would mean compounding all the costs and benefits by the same factor.
Accordingly, the price level is taken at the beginning of the investment and assumed to remain constant through
the lifetime of the project – making all prices constant to the year the project begins. The discount rates used
are consequently adjusted for inflation for consistency as described above.
THE IRRIGATION SCHEME
Demand Analysis
Currently the communities rely on rain-fed subsistence agriculture. The downward trend and volatility in annual
rainfall and increasing incidences of crop failure has amplified the communities’ social vulnerability and
presented significant challenges to food security.
Given the yields of the Dam, a maximum 126ha can be irrigated each year. Based on industry accepted
standards for the region, this equates to a volume of 1,982,905 m3.
Least Costs Analysis
Three technical options for the delivery of bulk water to the four irrigation blocks of land were developed based
on the distribution of land and design flows.
For all options, the general approach is to gravitate water from the Dam to a pump station located on the left
bank of River D, approximately 500 m from the dam wall, on level ground at an elevation of 825.m. The water is
then pumped to a high level storage tank from where it is distributed to the four blocks.
The essential difference between the options is the position of the high level storage tank, and the
corresponding distribution pipeline routes. The pipeline routes for all of the options traverse through disturbed
areas with no likelihood of displacing communities along the route. All the three sites for the night storage

114
reservoir are rocky, and un-vegetated. There are therefore no obvious social and environmental impacts
associated with each option, nor any variation in what each of the options delivers in terms of benefits. The
overriding factor in the selection of the preferred option was therefore investment costs, and corresponding
operation & maintenance costs. A hydraulic analysis program was used to analyse and size components of the
systems under each option. On this basis the Option 1 was identified to have the lowest capital costs and
annual operating costs.
In addition, two alternatives for the best implementation model of the preferred option were assessed. Looking
at the proposed first phase of implementation, it is apparent that Direct Labour is preferable to the traditional
Conventional Engineering Procurement Contract (EPC) in terms of costs. The project costs for preferred option
1 under the direct labour implementation model are shown in the table below.
Investment and O&M costs for the Irrigation Scheme preferred option
Project Component USD
Total Irrigation Construction Costs 3,037,649
Pipeline 783,535
Reservoir 879,115
Pump Station 165,000
Infield Works 439,690
Environmental 14,437
Subtotal 2,281,777
Contingencies (10%) 228,178
Direct Labour (2%) 45,635
Management Contractor costs (3%) 68,453
Subtotal 2,624,043
VAT (15%) 393,606
Technical Support Costs (training & extension services) 20, 000
Start-up costs / Annual variable costs 176,094
Pumping costs (USD 0.07/kWh) 58,092
Maintenance costs 12,785
Water (USD 9.90 / ML) 4,890
Agricultural inputs 102,746

115
Financial Analysis
The financial analysis is conducted from the perspective of the beneficiary communities, who are both
responsible for the operation and maintenance of the irrigation facilities, and are the direct recipients of the
increased revenues from the irrigation scheme. The costs considered in the analysis include capital, start-up
and operation & maintenance costs. The revenue considered in the analysis is the income received as a result
of the implementation of the new agronomic model. A possible investment grant has not been factored into the
financial analysis at this stage.
The financial analysis is summarised in the table below. The analysis shows that the Financial Net Present
Value (FNPV) of the scheme is positive (USD 2,095,634) indicating that the discounted benefits (income
streams) over the project life exceed the discounted costs (expenditures); the project is therefore financially
viable. Furthermore, the analysis finds that the Financial Internal Rate of Return (FIRR) of the project is equal to
15%. The FIRR is the rate of return that is achieved on all project costs, where costs are measured in financial
prices and where revenues represent the financial revenues that would accrue to the main project participant.
As the FIRR exceeds the inflation adjusted financial opportunity cost of capital (6.9%), it can be concluded that
the project is commercially desirable (i.e. preferable to the alternative of not investing in the project).
Project Costs
The table above contains the financial costs of the project, under the Direct Labour model of delivery, estimated
for the full 126ha (phase 1 & phase 2).
In the first year, the start-up costs include annual operation and maintenance costs of the irrigation facility, as
well as the charges for water supply from the Dam to the irrigation scheme (tariff – USD 9.90/ML). In the years
following the start-up year, these Operation & Maintenance costs and Water Charges are incorporated into the
variable costs included in the agronomic model and net income from the land.
Revenues
The revised agronomic model, indicates a net income expected for Block A (34ha) of USD 95,148 per annum.
Expanded to the full 126ha, the table below shows an expected net annual income of USD 480,786 for the
whole scheme.
Annual Net Income for 126 ha
Season Crop Gross Income (USD)
Variable Costs (USD)
Net Income (USD)
Summer Maize 89,700 30,229 59,912
Groundnuts 44,400 10,078 34,678
Soya Beans 40,700 27,238 13,817
Cabbage/Rape 48,000 11,383 36,675
Winter Wheat 152,000 63,474 89,256
Potatoes 146,250 8,053 138,269
Sugar Beans 83,250 22,759 60,846
Tomatoes 55,000 5,300 49,753
Total 659,300 178,514 480,786

116
The table below summarises the financial analysis of the irrigation scheme.
Irrigation Scheme Financial Analysis Summary (USD)
Year Capital Costs
Start-up Costs Annual Variable Costs
Gross Annual Income
Net Benefit
0 (3,037,649) (3,037,647)
1 (178,514) 659,300 480,786
2 (178,514) 659,300 480,786
3 (178,514) 659,300 480,786
4 (178,514) 659,300 480,786
5 (178,514) 659,300 480,786
6 (178,514) 659,300 480,786
7 (178,514) 659,300 480,786
8 (178,514) 659,300 480,786
9 (178,514) 659,300 480,786
10 (178,514) 659,300 480,786
11 (178,514) 659,300 480,786
12 (178,514) 659,300 480,786
13 (178,514) 659,300 480,786
14 (178,514) 659,300 480,786
15 (178,514) 659,300 480,786
16 (178,514) 659,300 480,786
17 (178,514) 659,300 480,786
18 (178,514) 659,300 480,786
19 (178,514) 659,300 480,786
20 (178,514) 659,300 480,786
FNPV (6.9%)
2,095,634
FIRR 15%
B/C Ratio 1.42
N/K Ratio 1.69
SENSITIVITY ANALYSIS
Parameter Change NPV before change
NPV after change
FIRR befor
e chang
e
FIRR after
change
B/C befor
e chang
e
B/C after
change
N/K befor
e chang
e
N/K after
change
Increase in capital costs
+ 15% 2,095,634
1,639,986 15% 12% 1.42 1.30 1.69 1.47
Increase in capital costs
+ 30% 2,095,634
1,184,338 15% 11% 1.42 1.20 1.69 1.30
Increase in O&M Costs
+15% 2,095,634
1,809,738 15% 14% 1.42 1.35 1.69 1.60
Increase in O&M Costs
+30% 2,095,634
1,523,843 15% 13% 1.42 1.28 1.69 1.50
Increase in both capital and O&M costs
+15%; +15% 2,095,634
1,354,091 15% 12% 1.42 1.24 1.69 1.39
Increase in both capital and O&M costs
+30%; +30% 2,095,634
612,548 15% 9% 1.42 1.10 1.69 1.16
Decrease in gross income
-15% 2,095,634
1,039,746 15% 11% 1.42 1.21 1.69 1.34
Decrease in -30% 2,095,63 -16,141 15% 7% 1.42 1.00 1.69 0.99

117
gross income 4
Increase in both investment and O&M costs & decrease in gross income
+15%; +15%; -15%
2,095,634
298,203 15% 8% 1.42 1.05 1.69 1.09
Change in discount rate
Discount rate = 26.6%
2,095,634
(1,246,341) 15% 15% 1.42 0.66 1.69 0.59
Including grant for Phase 1
USD 861,889 (Grant for
investment costs)
2,095,634
2,952,505 15% 22% 1.42 1.60 1.69 2.31
Including grant for Phase 1 @ cost of capital of 26.6%
USD 861,889 grant and
discount rate = 26.6%
2,095,634
(400,784) 15% 15% 1.42 0.89 1.69 0.82
Funding
The above analysis indicates that the scheme is financially viable, given that the FIRR of 15% is significantly
higher than the cost of capital (6.69%), and the FNPV is positive.
The sensitivity analysis presents results from the model when changes are made to the underlying parameters.
In almost all cases where costs are increased or revenues are decreased, the positive results from the financial
analysis remain; the only exception being a marginally negative result in the relatively extreme case where
gross revenues decrease by 30%. Revenue variability is seen to have a greater impact on the financial viability
of the project than cost variability, as even in the case where both investment and O&M costs increase by 30%
the model still indicates that the project is financially viable.
However, engagements with stakeholders found that the beneficiaries are resource poor (financially stressed)
and cannot access loans to invest in the irrigation scheme. A majority of farmers including local leadership
rejected the idea of credit loans. A consensus was therefore reached, that the project should provide starter
inputs and suitable tools for use during the first year of cropping, after which a cost recovery process should
commence during the second year of cropping (however this should be supported by binding documents
indicating such a recovery plan). On the basis of the above engagement, it is recommended that an investment
grant be sourced to cover the capital and start-up costs.
It is however recognised that given the expected income flows from the irrigation scheme, the scheme is
theoretically viable without any grant. Preliminary investigations into access to finance for the communities,
found that MFIs are currently charging interest rates of approximately 35%. If the analysis uses this cost of
capital adjusted for inflation as the discount rate (thus, 26.6%), the project does not appear to be financially
viable, with a negative FNPV and unattractive financial indicators.
Even when the potential grant in included, if a discount rate of 26.6% is used, the financial analysis indicates
that the project is not financially viable. Therefore, in light of the high costs of finance from MFIs in Country C
then, the recommendation of an upfront grant for the entire project investment is reinforced.
While it is expected that the potential for communities to access finance will be limited, microfinance institutions
might still play a fundamental role in assisting with the institutional arrangements necessary to facilitate the
execution of O&M and the recovery plan referred to in the engagements. The on-going financial sustainability of
the project is dependent on the ability of the beneficiaries to cover annual operation and maintenance costs. As
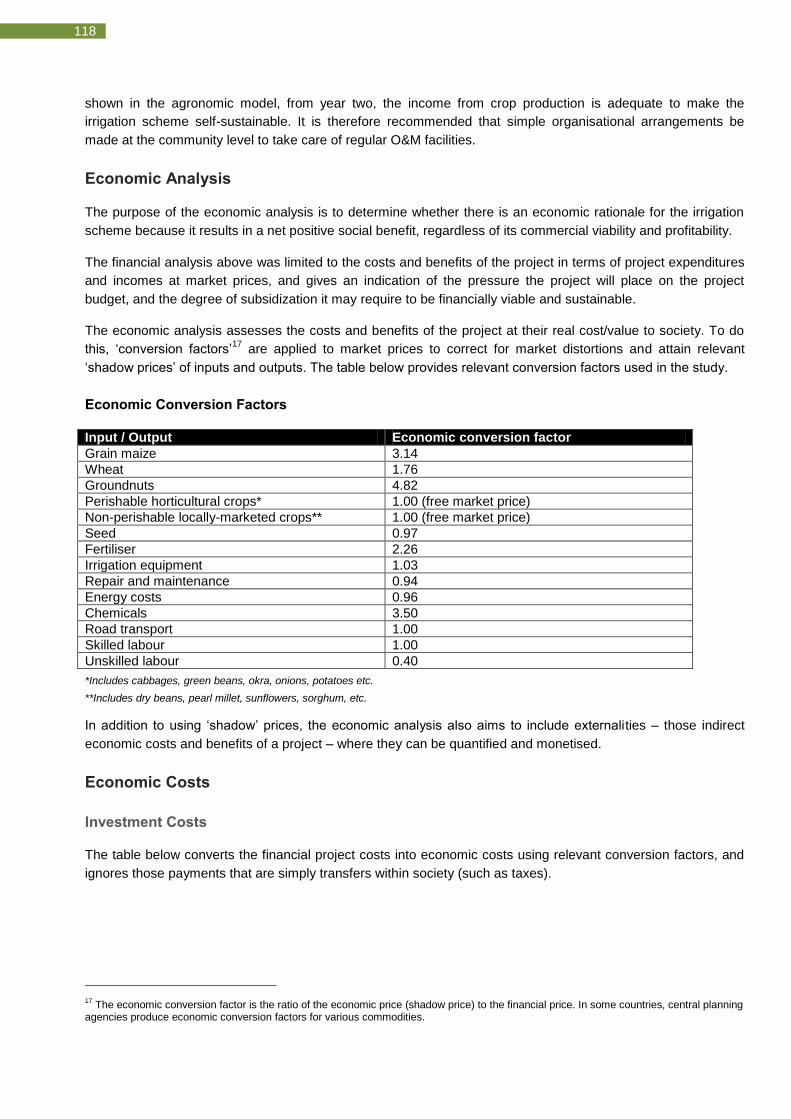
118
shown in the agronomic model, from year two, the income from crop production is adequate to make the
irrigation scheme self-sustainable. It is therefore recommended that simple organisational arrangements be
made at the community level to take care of regular O&M facilities.
Economic Analysis
The purpose of the economic analysis is to determine whether there is an economic rationale for the irrigation
scheme because it results in a net positive social benefit, regardless of its commercial viability and profitability.
The financial analysis above was limited to the costs and benefits of the project in terms of project expenditures
and incomes at market prices, and gives an indication of the pressure the project will place on the project
budget, and the degree of subsidization it may require to be financially viable and sustainable.
The economic analysis assesses the costs and benefits of the project at their real cost/value to society. To do
this, ‘conversion factors’17
are applied to market prices to correct for market distortions and attain relevant
‘shadow prices’ of inputs and outputs. The table below provides relevant conversion factors used in the study.
Economic Conversion Factors
Input / Output Economic conversion factor
Grain maize 3.14
Wheat 1.76
Groundnuts 4.82
Perishable horticultural crops* 1.00 (free market price)
Non-perishable locally-marketed crops** 1.00 (free market price)
Seed 0.97
Fertiliser 2.26
Irrigation equipment 1.03
Repair and maintenance 0.94
Energy costs 0.96
Chemicals 3.50
Road transport 1.00
Skilled labour 1.00
Unskilled labour 0.40
*Includes cabbages, green beans, okra, onions, potatoes etc.
**Includes dry beans, pearl millet, sunflowers, sorghum, etc.
In addition to using ‘shadow’ prices, the economic analysis also aims to include externalities – those indirect
economic costs and benefits of a project – where they can be quantified and monetised.
Economic Costs
Investment Costs
The table below converts the financial project costs into economic costs using relevant conversion factors, and
ignores those payments that are simply transfers within society (such as taxes).
17
The economic conversion factor is the ratio of the economic price (shadow price) to the financial price. In some countries, central planning agencies produce economic conversion factors for various commodities.

119
Economic Investment Costs
Project Component Financial cost
(USD)
Conversion
factor
Economic cost
(USD)
Total Irrigation Construction Costs 3,037,649 2,671,491.50
Pipeline 783,535 1.03 807,041.05
Reservoir 879,115 1.03 905,488.45
Pump Station 165,000 1.03 169,950
Infield Works 439,690 1.00 439,690
Environmental 14,437 1.00 14,437
Contingencies (10%) 228,178 1.00 228,178
Direct Labour (2%) 45,635 0.40 18,254
Management Contractor costs (3%) 68,453 1.00 68,453
VAT (15%) 393,606 n/a (transfer payment)
Technical Support Costs (training & extension services)
20,000 1.00 20,000
Start-up costs / Annual variable costs 178,514 239,125
Pumping costs (USD 0.07/kWh) 58,092 0.96 55768
Maintenance costs 12,785 0.94 12,018
Water costs (USD 9.90 / ML) 4,890 1.00 4,890
Agricultural Inputs 102,746 1.6218
166,449
Opportunity cost of water
The opportunity cost of the water supplied to the irrigation scheme is the foregone benefit that would accrue
should the water be available for the alternative uses. In the case of the Dam, it has been identified that the risk
of decreased yield to downstream users as a result of the irrigation scheme. However, an alternative source of
water has been identified for provision to these users; hence the Dam is solely for the use of the irrigation
scheme.
The opportunity cost of the water used in the Irrigation Scheme is therefore assumed to be zero for the sake of
this analysis. Future potential uses, such as a bulk domestic water supply, may need to be incorporated into the
analysis should further investigations into domestic water supply sources indicate it is a viable option.
Economic Benefits
The economic benefits that are included in the analysis are:
The value of the water produced for irrigation
Improved livelihoods as a result of the irrigation scheme
Increased food security
The value of the water produced
The incremental supply of water needs to be assessed to determine the value added by the project. Given that
there are currently no irrigation schemes in the area, the entire volume of water produced by the project is
incremental. The annual volume of water that will be supplied by the scheme is approximately 1,982,905 m3.
Assuming for the purposes of this analysis, that the real economic value of such raw water, is equal to its
18
The conversion factor of 1.62, is the average of that for seed and fertiliser.

120
market price for communal farmers of USD 9.90/ML, the annual economic benefit of the water supplied for
irrigation is USD 19,630.76.
By including in the economic analysis the benefit of the water supplied, with the assumption that the real value
of the irrigation water is equal to the market price (USD 9.90/ML), in effect neutralises the payment for water
supplied from the Dam as a transfer payment in the economy (i.e. the cost of water is equal to the benefit of
water, therefore net cost/benefit equals zero).
Improved Livelihoods
The benefit of improved livelihoods created by the Irrigation scheme is measured by the increased yield of the
126ha and associated income from the crops. This benefit is calculated as the incremental net income
compared to the without-project situation.
The current situation is defined by subsistence agriculture in which farmers traditionally grow a restricted range
of subsistence crops comprising maize and small grains. Most land has been exhausted by the repeated
farming of maize crops for food supply; and the current yield for a maize crop is 0.75 – 2t/ha. For the without-
project situation, the continued farming of maize is assumed with an average yield of 1.375t/ha. At the current
price of USD 390/t, as used in the agronomic model, the average financial value of yield in the without-project
situation is USD 536.25/ha.
Given that maize crops are failing almost perennially, it is assumed that this income is halved to
USD 268.125/ha19
. Applying the relevant conversion factor of 3.14, results in an economic value of yield per
hectare in the without-project situation of USD 841.91/ha; or USD 106,080.975 for 126 ha.
In the with-project situation, the table above shows the expected financial value of crops. Applying the relevant
conversion factors to the gross income and variable cost estimates, gives the net economic value of the crops
produced, as indicated in table below.
19
The analysis makes the assumption of a 50% failure rate for maize crops in the with-out project situation.

121
Economic value of crops for 126ha with project
Season Crop Gross Financial
Income (USD)
Conversion Factor
Gross Economic
Benefit (USD)
Financial Variable Costs breakdown
Conversion Factor
Economic Variable
Costs
Net Economic
Benefit
Summer
Maize 89,700 3.14 281,658 Pumping 58,092 0.96 55,768.32
Groundnuts 44,400 4.82 214,008
Soya Beans
40,700 1.00 40,700 Maintenance
12,785 0.94 12,017.90
Cabbage/ Rape
48,000 1.00 48,000
Winter Wheat 152,000 1.76 267,520 Water 4,980 1.00 4,980
Potatoes 146,250 1.00 146,250
Sugar Beans
83,250 1.00 83,250 Agricultural Inputs
102,746 1.62 166,448.52
Tomatoes 55,000 1.00 55,000
Total 659,300 1,136,386 178,514 239,125 897,261
Hence the analysis finds that
1. The gross (economic) annual income in year one will be equal to USD 1,030,305.03 (USD 1,136,386 - USD 106,081)
2. The net (economic) annual income is therefore USD 791,180 (USD 1,030,305 – USD 239,125)
.
122
Increased Food Security
A key objective of the Irrigation Scheme is to increase the resilience of the target communities to the impacts of
climate change and improve their food security. The economic value of food security can be estimated by the
avoided cost that government / the economy would have to incur through the provision of social protection or
food aid.
Although, in the current situation, government has been largely ineffective in providing such required assistance,
the Social Services Department at the District A Council spoke of a bi-monthly government cash transfer
commitment to provide a maximum of USD 50 to feed poor households who cannot work.
Assuming conservatively that 25% of the households would need this social protection grant in the without-
project situation, and 25% of the maximum grant (of USD 25/month) is given, savings to the government of
Country C of USD 22,500 per year will be achieved in the with-project situation.
It should be noted that this estimate of savings to government does not monetise other benefits that result from
food security such as improved health and nutrition, increased school attendance, and improved labour
productivity.
The table below summarises the economic analysis of the irrigation project.
The results of this analysis show that the project is economically viable and desirable at both a 10% and 3.5%
discount rate: the economic net present value is positive, indicating that the overall benefits to society from the
project are expected to exceed the costs. Although the EIRR must be used with caution20
, its high level
indicates a favourable return for the project. This is reinforced by the relatively attractive B/C ratios presented
under both discount rates; although the B/C ratio value of 1.87 under the 10% discount rates may indicate the
need for further discussion on the value of the project.
The sensitivity analysis goes on to test changes in underlying parameters and assumptions on the results of the
model; this is done at both a 10% and 3.5% discount rate. It can be seen that even relatively large increases in
all project costs and decreases in expected incremental income do not make the project economically unviable;
indeed, it is only under the relatively extreme scenario where all costs (investment and O&M) increase by 30%
and gross incremental income decreases by 30% (and when using a discount rate of 10%) that the project
appears only marginally beneficial. The same holds true when using a discount rate of 3.5%.
Overall, the sensitivity analysis indicates that the model is relatively robust to changes in underlying parameters.
Further, it can be seen that reductions in gross incremental income appear to have a significantly bigger impact
on the economic viability of the project than increases in costs of a similar magnitude.
20
This rate implies that annual benefits are continuously reinvested at the EIRR rate, a potentially problematic assumption to make given that economic returns can be difficult to capture in the same manner in which financial returns are captured.

123
Irrigation Scheme Economic Analysis Summary (USD)
Year Capital Costs
Start-up costs/ Annual variable costs
Incremental Crop Production (including O&M from year 2)
Water Supply
Food Security
Net Benefit
0 (2,671,491.50)
(2,671,491.50)
1 (239,125) 1,030,305.03 19,630.76 22,500 833,310.79
2 (239,125) 1,030,305.03 19,630.76 22,500 833,310.79
3 (239,125) 1,030,305.03 19,630.76 22,500 833,310.79
4 (239,125) 1,030,305.03 19,630.76 22,500 833,310.79
5 (239,125) 1,030,305.03 19,630.76 22,500 833,310.79
6 (239,125) 1,030,305.03 19,630.76 22,500 833,310.79
7 (239,125) 1,030,305.03 19,630.76 22,500 833,310.79
8 (239,125) 1,030,305.03 19,630.76 22,500 833,310.79
9 (239,125) 1,030,305.03 19,630.76 22,500 833,310.79
10 (239,125) 1,030,305.03 19,630.76 22,500 833,310.79
11 (239,125) 1,030,305.03 19,630.76 22,500 833,310.79
12 (239,125) 1,030,305.03 19,630.76 22,500 833,310.79
13 (239,125) 1,030,305.03 19,630.76 22,500 833,310.79
14 (239,125) 1,030,305.03 19,630.76 22,500 833,310.79
15 (239,125) 1,030,305.03 19,630.76 22,500 833,310.79
16 (239,125) 1,030,305.03 19,630.76 22,500 833,310.79
17 (239,125) 1,030,305.03 19,630.76 22,500 833,310.79
18 (239,125) 1,030,305.03 19,630.76 22,500 833,310.79
19 (239,125) 1,030,305.03 19,630.76 22,500 833,310.79
20 (239,125) 1,030,305.03 19,630.76 22,500 833,310.79
ENPV (10%) 4,442,953
B/C ratio (10%) 1.93
E-N/K ratio (10%)
2.66
ENPV (3.5%) 9,171,857
B/C ratio (3.5%) 2.51
E-N/K ratio (3.5%)
4.43
EIRR 31%
Sensitivity Analysis (10% discount rate)
Parameter % chang
e
NPV before change
NPV after
change
ERR before chang
e
ERR after
change
B/C befor
e chang
e
B/C after
change
N/K befor
e chang
e
N/K after
change
Increase in both investment & O&M costs
+15; +15
4,442,953 3,716,858
31% 26% 1.93 1.69 2.66 2.21
Increase in both investment & O&M costs
+30; +30
4,442,953 3,010,763
31% 21% 1.93 1.49 2.66 1.87
Reduction in gross incremental income
-15 4,442,953 3,107,217
31% 25% 1.93 1.66 2.66 2.16
Reduction in gross incremental income
-30 4,442,953 1,791,482
31% 19% 1.93 1.38 2.66 1.67
Increase in both +15; 4,442,953 2,401,1 31% 20% 1.93 1.44 2.66 1.78

124
investment and O&M costs & Reduction in gross incremental income
+15;-15
23
Increase in both investment and O&M costs & Reduction in gross incremental income
+30; +30; -
30
4,442,953 379,293 31% 12% 1.93 1.06 2.66 1.11
Sensitivity Analysis (3.5% discount rate)
Parameter % change
NPV before change
NPV after
change
ERR before chang
e
ERR after
change
B/C befor
e chang
e
B/C after
change
N/K befor
e chang
e
N/K after
change
Increase in both investment & O&M costs
+15; +15
9,171,857
8,261,352
31% 26% 2.41 2.18 4.43 3.69
Increase in both investment & O&M costs
+30; +30
9,171,857
7,350,847
31% 21% 2.41 1.93 4.43 3.12
Reduction in gross incremental income
-15 9,171,857
6,975,390
31% 25% 2.41 2.15 4.43 3.61
Reduction in gross incremental income
-30 9,171,857
4,778,924
31% 19% 2.41 1.79 4.43 2.79
Increase in both investment and O&M costs & Reduction in gross incremental income
+15; +15;-15
9,171,857
6,064,886
31% 20% 2.41 1.87 4.43 2.97
Increase in both investment and O&M costs & Reduction in gross incremental income
+30; +30; -30
9,171,857
2,957,914
31% 12% 2.41 1.38 4.43 1.85
WATER AND SANITATION
Demand Analysis
Water supply
The same target population of 1200 households (5400 individuals) currently demand approximately 108 m3 per
day, assuming a per capita minimum allocation of 20l/day. In addition, demand from livestock is assumed to be
approximately 192 m3 per day.
Current supply is attained from three boreholes, a well, and digging the dry river bed. In order to attain the
volume of water demanded, the target population currently has to walk far distances, queue for a long time, and
risk contamination from unsafe sources.
The demand assessed in this analysis is therefore that for closer access to safe sources without a high risk of
contamination (such as dry river bed).

125
Once further investigations are completed into the precise volume of water that is currently supplied, and can be
supplied from project interventions, a more comprehensive analysis can be done which includes projected
future demand and supply in terms of volume.
Sanitation
Sanitation coverage is currently low, with less than 25% of the target population with a toilet at home. The
demand for sanitation facilities is therefore assumed to be for household facilities in at least 75% of the 1200
households.
Least Cost Analysis
Water supply
The objective of the improvement is primarily to decrease distances to, and increase the availability of, safe
water sources. The two sources considered were the Dam and ground water.
The treatment and distribution of raw water from the Dam was rejected on the basis of the cost of a sand filter
for treatment; the limited availability of water from the dam; and the lack of institutional structures to operate and
manage such works.
The sinking of new boreholes and rehabilitation of existing ones, to reduce walking distances to a maximum of
500m for all beneficiaries, is the preferred option. This option was found to be preferable in terms of cost;
institutional requirements; and ease of implementation.
The viability of boreholes at the proposed locations has not however been confirmed. Water quality and yield
aspects are largely unknown and will influence the exact locations of the proposed boreholes. Further work is
required to conduct yield tests, and based on the results, explore the option of a piped water system from high-
yielding boreholes, to villages in those areas where the ground water occurrence is poor.
Sanitation
The ventilated-improved pit (VIP) latrine is chosen as the long term solution for sanitation in rural communities.
The latrine is designed to reduce odour and flies that carry disease pathogens.
Investment and O&M costs for WASH component
Project Component USD
Boreholes Investment Cost 82,940
New boreholes & hand-pumps 75,000
Refurbishment of existing boreholes 3,000
Upfront allowance for borehole spares 4,940
Annual Labour for O&M 60
VIP Investment Cost 256,800
Building materials 151,200
Bricks, stones, sand draught power 30,000
Labour 75,600
Annual VIP O&M costs n/a

126
Financial Analysis
The costs included in the analysis are the capital and O&M costs associated with the boreholes for water supply
and VIP latrines for sanitation. The results of the financial analysis summarised in the table below, show a
negative FNPV of USD 234,781. This FNPV decreases further to negative USD 285,839 when project costs
increase by 15%. No FIRR has been calculated as there is no revenue stream associated with the WASH
component.
Project costs
Water Supply
Assuming that the chosen borehole sites are found to be technically viable, the table above shows that that the
construction of 15 new boreholes and refurbishment of two, results in an investment cost of USD 78,000. In
addition, an upfront estimate of USD 4,940 is made for spares required for operation and maintenance. The
annual labour cost required for on-going operation and maintenance is minimal in comparison to the cost of
spares, and has been estimated at one day required per month, at USD 5.00/day, amounting to USD 60 per
year. The total investment cost for the water supply is therefore USD 82,940, and annual labour cost USD 60.
It is important to note that in this preliminary analysis of the WASH component, it has also been assumed that
project funds will not be used for future investments that will be necessary as a result of population growth,
therefore only the initial investment and O&M costs have been taken into account.
It is strongly recommended that further technical investigations into the optimal water supply investment (i.e. the
yields of the chosen borehole sites), should take into consideration the volume available from various supply
options against future demand as a result of expected population growth.
Sanitation
The investment cost for the construction of 1008 VIP latrines shown in the table above, is estimated to be USD
150/per latrine for building materials (which includes cement, roofing, reinforcement and miscellaneous items,
including transport to site). In addition, the community is expected to contribute the bricks, stone, sand, draught
power and labour. Labour is estimated to cost USD 75 per VIP latrine, and the other community inputs USD
30,000 in total.
The total investment cost for the VIPs is therefore USD 256,800. There are no operation and maintenance costs
associated with the VIP latrines.
Revenues
Water supply
There will be no charges or tariffs for the water supplied by the boreholes.
Sanitation
Similarly, there will be no associated charges for the VIP latrines.
The community beneficiaries’ however will make an upfront contribution to the investment cost of USD 105,600
in the form of labour, brick, sand, stone and draught power. It is common practice in Country C for communities
to provide such inputs.

127
WASH component Financial Analysis Summary (USD)
Year Borehole Investment Cost
O&M - Labour
VIP Investment Cost
Total Costs Community Contribution
Net Benefit
0 (82,940) (256,800) (339,740) 105,600 (234,140)
1 (60) (60) (60)
2 (60) (60) (60)
3 (60) (60) (60)
4 (60) (60) (60)
5 (60) (60) (60)
6 (60) (60) (60)
7 (60) (60) (60)
8 (60) (60) (60)
9 (60) (60) (60)
10 (60) (60) (60)
11 (60) (60) (60)
12 (60) (60) (60)
13 (60) (60) (60)
14 (60) (60) (60)
15 (60) (60) (60)
16 (60) (60) (60)
17 (60) (60) (60)
18 (60) (60) (60)
19 (60) (60) (60)
20 (60) (60) (60)
FNPV (6.9%)
(234,781)
B/C Ratio 0.31
N/K ratio N/A21
Sensitivity Analysis
Parameter Percentage change
FNPV before
change
FNPV after
change
B/C before
Change
B/C after
change
FIRR before
change
FIRR after
change
Increase in all costs +15% (234,781) (285,838) 0.31 0.27 N/A N/A
Decrease in community contribution
-15% (234,781) (250,620) 0.31 0.26 N/A N/A
Grant to cover investment costs
USD 339,740
(234,781) 83,030 0.31 1.24 N/A 45%
Funding
The financial analysis indicates that the WASH project alone is not financially viable. This is expected as the
project does not generate any fixed revenues and can therefore not have a positive internal rate of return. The
brief sensitivity analysis indicates that increases in VIP investment costs and decreases in the community’s
contribution of the same magnitude have similar negative impacts on the model’s results. For a project to be
sustainable, it must be both economically (positive ENPV) and financially viable (have sufficient cash flow to
meet O&M and financing costs at a minimum). Unless the project is financially viable, the project will not be
sustained, and hence economic benefits will not materialise.
After the community contribution to the sanitation investment, the outstanding total investment amounts to
USD 234,140. Assuming an external grant is sourced to cover the outstanding investment cost, the
sustainability of the project will then depend on the communities’ ability to meet the on-going O&M. Given that
21
Cannot be calculated as there are no positive net benefit flows

128
the WASH O&M costs are negligible and in the form of (own) labour (USD60 per annum translate into USD 0.05
per households a year), it is recommended that the necessary training and organisational arrangements be
made at the community level to facilitate the O&M. It is also recommended that such training costs and technical
assistance be estimated and incorporated in the upfront grant application.
Economic Analysis
Economic Costs
The economic costs of the WASH project are shown in the table below. It is assumed there are no further
indirect costs associated with the project.
Economic Investment and O&M costs
Project Component Financial cost (USD) Conversion
factor
Economic cost
(USD)
Boreholes Investment Cost 82,940 84,713.60
New boreholes & hand-pumps 75,000 1.03 77,250
Refurbishment of existing boreholes 3,000 0.94 2,820
Upfront allowance for borehole spares
4,940 0.94 4,643.60
Annual Labour for O&M 60 0.40 24
VIP Investment Cost 256,800 215,976
Building materials 151,200 1.03 155,736
Bricks, stones, sand, draught power 30,000 1.00 30,000
Labour 75,600 0.40 30,240
Annual VIP O&M costs n/a n/a
Economic Benefits
The economic benefits associated with the borehole development and provision of VIPs, are namely
the time saved relative to the current situation where households walk up to 3km and queue for up 4.5 hours to
collect water; and
The improved health of the community as a result of better sanitation and water supply.
In addition to the above, it is important to recognise qualitatively the gender benefit associated with the project.
Given that women are predominantly responsible for fetching water, it will be their time that is saved. Moreover,
improved sanitation facilities will also address women’s’ sanitation needs more.
Time savings
The target population currently walk distances of up to 3km to water sources, and queue between 0.5 – 4.5
hours. The purpose of the new and refurbished boreholes is to ensure beneficiaries are a maximum distance of
500m from functional water sources. Average distances from protected well/boreholes in District A are shown in
the table below.

129
District A average distances to water supply sources – protected wells / boreholes
On premises 2%
Less than 500m 17.8%
500m – 1km 43.2%
>1km 35.9%
Missing 1.1%
Using these proportions, it is assumed that the project will decrease walking distances for approximately 80%
(43.2% + 35.9%) of the target population to a distance of 500m.
Estimated Time Savings from Decreased Distances
Distance from source
% of population
Number of households (1200 total)
Average distance saved under project (return trip)
Time saved per household at average walking speed of 5km/hr
Total time saved (hours/day)
500m – 1km 43.2% 518.4 500m (250m*2) 0.1 hours 51.84
>1km (1km-3km)
35.9% 478.8 3km (1.5km *2) 0.6 hours 287.28
339.12
The Asian Development Bank estimates the opportunity cost of time used for collecting water to be 64% of the
relevant minimum wage. The current minimum agricultural wage in Country C, effective August 2013, is USD95.
Given the unemployment rate of 90% in the target population, it is necessary to convert this wage into a shadow
wage.
The shadow minimum wage is therefore USD38 (0.40 * USD 95)
The opportunity cost of time – 64% of the shadow minimum wage – is therefore USD 24.32 per month
Assuming 20 working days a month, the opportunity cost of time per day is USD1.216 / day
339.12hrs shown in Table 13 above equates to 42.39 working days will be saved in the target
communities per day
42.39 days * USD 1.235/day = USD 51.55 saved per day
Assuming 240 working days a year, the total annual value of walking time saved under the project can
be estimated as USD 12,371.10
In addition to this, it is expected that the current queuing time of 0.5-4.5 hours will decreased due to the provision of another 17 functional boreholes. Assuming the average queuing time of 2.5 hours will be halved, 1.75 hours are expected to be saved per family per day.
1.75 hours * 1200 households = 2100 hours
2100 / 8 = 262.5 days
262.5 days * USD1.235/day = USD 324.19

130
Assuming 240 working days a year, the total annual value of queuing time saved under the project
can be estimated as USD 77,805
The estimated value of total time saved under the project is therefore of USD 90,176.10 per annum.
Health Benefits
Country C’s Demographic & Health survey (2010/2011) states that diarrhoea is more prevalent in children
whose households do not have improved sources of drinking water, and in children whose households do not
have an improved toilet facility, or who share a facility with other households. The implementation of household
VIP latrines and the use of boreholes instead of digging in dry riverbeds are expected to improve the health of
the target communities. This health benefit can be quantified by the savings from avoided direct treatment costs
for diarrhoea, as a result of reduced incidences of the illness. The estimated cost for treatment of diarrhoea in
low income countries is USD 5.50. Further, patients incur travel costs: A round trip to nearest health centre from
the two wards in District A is estimated to at USD 2.00. 100% of cases visiting District A’s hospital are assumed
to be incurring transport costs. The estimated total cost of treatment is thus USD 7.50 per case.
As a conservative estimate, the analysis looks only at the potential avoided incidences of diarrhoea in children
below five. 15.8% of the population in District A is below five years old. It is therefore assumed that (15.8% of
5400) 853.2 of the target population is below five years old. The Demographic and Health Survey indicated a
13% diarrhoea prevalence rate in rural children below five. 13% of the target population below five years of age
equates to 111 cases of diarrhoea that will be avoided under the project, should children become sick once a
year in the without-project situation.
The savings associated with 111 avoided cases of diarrhoea (at a treatment cost of USD 7.50 per case) is equal
to USD 832.50 per annum. A further benefit of improved health – that has not been quantified in this analysis,
given that only illness in children below five was monetised – is the increased productivity that would result from
avoided illness.
Analysis of the Economic Model
The economic analysis indicates that the WASH component of the project alone is economically viable at both a
10% and 3.5% discount rate. The ENPV is positive, the B/C Ratio is significantly large and the project generates
an attractive rate of return. As mentioned before, this latter figure must be assessed with caution; nonetheless,
taken together, these indicators present favourable economic results for the project, indicating that the WASH
component alone is economically viable and generates a positive net return to society, even if it is not
commercially viable as indicated in the financial analysis above.
The sensitivity analysis presented uses a 10% discount rate only; the use of a 3.5% discount rate would only
enhance the positive nature of the results. It can be seen that even very large changes in the parameters do not
change the economic viability of the WASH project component; a 50% increase in VIP investment costs (by far
the largest cost factor) or a 50% decrease in the time-saved benefits (by far the largest benefit factor) both still
result in positive economic outcomes for the project, and changes in the range of 20% to both simultaneously
indicate the same. It must be noted, though, that changes in time-saved benefits have a larger impact on the
models’ results than changes in investment costs.

131
WASH Component Economic Analysis Summary (USD)
Year Borehole Cost
O&M - Labour VIP Investment Cost
Total Costs
Time Saved Health Benefits
Total Benefit
Net Benefit
0 84,713.60 215,976 300,689.60 0 0 0 (300,689.60)
1 24 24 90,176.10 832.50 91,008.60 90,984.60
2 24 24 90,176.10 832.50 91,008.60 90,984.60
3 24 24 90,176.10 832.50 91,008.60 90,984.60
4 24 24 90,176.10 832.50 91,008.60 90,984.60
5 24 24 90,176.10 832.50 91,008.60 90,984.60
6 24 24 90,176.10 832.50 91,008.60 90,984.60
7 24 24 90,176.10 832.50 91,008.60 90,984.60
8 24 24 90,176.10 832.50 91,008.60 90,984.60
9 24 24 90,176.10 832.50 91,008.60 90,984.60
10 24 24 90,176.10 832.50 91,008.60 90,984.60
11 24 24 90,176.10 832.50 91,008.60 90,984.60
12 24 24 90,176.10 832.50 91,008.60 90,984.60
13 24 24 90,176.10 832.50 91,008.60 90,984.60
14 24 24 90,176.10 832.50 91,008.60 90,984.60
15 24 24 90,176.10 832.50 91,008.60 90,984.60
16 24 24 90,176.10 832.50 91,008.60 90,984.60
17 24 24 90,176.10 832.50 91,008.60 90,984.60
18 24 24 90,176.10 832.50 91,008.60 90,984.60
19 24 24 90,176.10 832.50 91,008.60 90,984.60
20 24 24 90,176.10 832.50 91,008.60 90,984.60
ENPV (10%) 473,913
B/C Ratio (10%) 2.58
N/K Ratio (10%) 2.58
ENPV (3.5%) 992,420
B/C Ratio (3.5%) 4.30
N/K Ratio (3.5%) 4.30
ERR 30%
Sensitivity Analysis (10% discount rate)
Parameter %
change NPV before
change NPV after
change ERR before
change ERR after
change B/C before
change B/C after
change
Increase in VIP +20 473,913 430,687 30% 26% 2.58 2.25

132
investment costs
Increase in VIP investment costs
+50 473,913 365,894 30% 22% 2.58 1.89
Reduction in time-saved benefits
-20 473,913 320,369 30% 24% 2.58 2.06
Reduction in time-saved benefits
-50 473,913 90,053 30% 14% 2.58 1.30
Increase in investment costs & Reduction in time-
saved benefits
+20; -20 473,913 277,174 30% 21% 2.58 1.81
Note: i) Results for the B/C and N/K ratios were nearly identical in this sensitivity analysis given the relatively small ongoing O&M costs; hence the N/K ratio is not presented here; ii) Sensitivity analysis using a 3.5% discount rate was also conducted but, given the positive results indicated at a higher discount rate of 10%,were not included.
133
SUSTAINABILITY ANALYSIS
For a project to be sustainable it must be both financially and economically viable and have
sufficient cash flow to meet O&M and financing costs at a minimum. Unless a project is
financially viable, the project will not be sustained, and hence the economic benefits to society
will not materialise.
Assuming that the investment costs for the whole project (irrigation and WASH) will be
financed upfront though a grant, the sustainability of the project will depend on whether or not
the beneficiary communities can adequately manage, and cover the expenditures for O&M.
The financial analysis of the irrigation component showed that the increased crop income can
adequately cover the irrigation system O&M requirements. The O&M costs for the type of
facilities installed for the WASH component (hand pumps) will consist of own labour provided
in kind by the communities. The provision of spares that might be required for the WASH
facilities is included in the estimated upfront investment cost.
To ensure sustainability, it is therefore necessary to ensure that the project includes adequate
training so the communities have the capacity to take responsibility for the O&M, and that
institutional / organisational arrangements are implemented on the ground to manage the
process.
RECOMMENDATIONS
The analysis indicates that both the irrigation and WASH components of the project are
economically viable. The irrigation scheme component of the project is also financially viability,
but that of the WASH component is not. Given the economic justification for the project
however, the financial analysis serves to indicate the level of need for a grant.
The relatively high per unit costs of the project (as compared to other developing regions), as
shown by the cost-effectiveness indicators, should be considered in the context of the project,
and a decision taken as to whether the per unit costs are acceptable, in light of the positive
CBA results.
Given the immediate vulnerability of the beneficiary community and high cost of microfinance,
it is recommended that grant funding be sourced for the investment costs of both components
of the project (irrigation and WASH), despite the irrigation component being commercially
viable.
A total grant amount of USD 3,450,303.
USD 3,216,163 for the irrigation component
USD 234,140 for the WASH component
It is recommended that this outstanding investment amount be met through external donors;
with the possibility of a community investment contribution should they be willing and able to
access finance. The sustainability of the project thereafter will be the responsibility of the
community, and can be met by resources generated under the project, as shown in the
analysis. It is however recommended that the investment grant include necessary training for
O&M. Moreover, the institutional capacity of the community needs to be ensured.