program vulnerability analysis using dbi - …deok9...2011.7.2 ...
TRANSCRIPT
Program Vulnerability AnalysisUsing DBI
CodeEngn [email protected]
2011.7.2
www.CodeEngn.comCodeEngn ReverseEngineering Conference

Outline
• What is DBI ?
• Before that
• How ?
• A simple example
• Demo !
2

What is DBI ?
• InstrumentationKeyword : To gather information, insert code
• Dynamic Binary Instrumentation Keyword : Running program, special purpose, insert code
Running
Arbitrary Code
3

Static Analysis
• Summary
- Without running
- Considering all execution paths in a program
- Tools : Sonar, cppcheck, Prevent, KlockWork
4

Static Analysis
5
Check Out
Coding
Modify
Compile Error
Defect
Check In

Dynamic Analysis
• Summary
- Running
- Considering single execution path
- Input dependency
6

Winner
• Dynamic Analysis
More precise
Because > works with real values in the run-time
• if ( you think Ollydbg & IDA Disassembler )
Easy to understand
7

Source Analysis
• Source Analysis
- Language dependency
- Access high-level information
- Tools : Source insight
8

Binary Analysis
• Binary Analysis
- Platform dependency
- Access low-level information ex) register
- Complexity, Lack of Higher-level semantics, Code Obfuscation
9

DRAW
• Binary Analysis
Original source code is not needed
• Source Analysis
Just you look at source
10

SBI
• Static Binary Instrumentation
- Before the program is run
- Rewrites object code or executable code
- Disassemble -> instrumentation
11
DBI
• Dynamic Binary Instrumentation
- Run-time
- By external process, grafted onto the client process
12

Winner
• DBI
1. Client program doesn’t require to be prepared
2. Naturally covers all client code
13

Usefulness of DBI
• Do not need Recompiling and Relinking
• Find the specific code during execution
• Handle dynamically generated code
• Analyzing running process
14

Use
• Trace procedure generating
• Fault tolerance studies
• Emulating new instructions
• Code coverage -> t / all * 100
• Memory-leak detection
• Thread profiling
• And so on . . .
15

Before that
• Taint AnalysisKind of information flow
To see the flow from the external input effect
16

Taint propagation
Tainted
Untainted
Tainted
17

Taint propagation
18
Untrusted source 1 Untrusted source 2

Use
• Detecting flawsif ( tracking user data == available )
I see where untrusted code swimming
• Data Lifetime Analysis
19

How ?
• Dynamic Binary Instrumentation ToolsPin : Win & Linux & MAC, Intermediate Language
DynamoRIO : Win & Linux & MAC
TEMU : Win & Linux, QEMU based
Valgrind : Linux
20

How ?
• Use PIN ToolWindows, Linux, MAC OSX
Custom Code ( C or C++ )
Attach the running file
Extensive API
Pinheads
21

Pin ?
• http://pintool.orgOne of JIT ( Just In Time ) compiler
Not input bytecode, but a regular executable
Intercept instruction and generates more code and execute
22

Pin : Instrumentation EnginePintool : Instrumentation Tool
Application : Target Program or Process
23
Pin ?

24
Pin ?

25
Pin ?

26
Pin ?

27
Pin ?

28
Pin ?

Install
• if ( Install window ) you need to visual c++
• else if ( install linux ) you need to gcc-c++
• else if ( install mac 64bit ) not available
29

A Simple Example
30
• Inscount & Itrace & Pinatrace
• Step by modify code
Inscount M
ItraceM
Pinatrace

Inscount- count the total number of instructions executed
31

Modify Inscount
32

Itrace
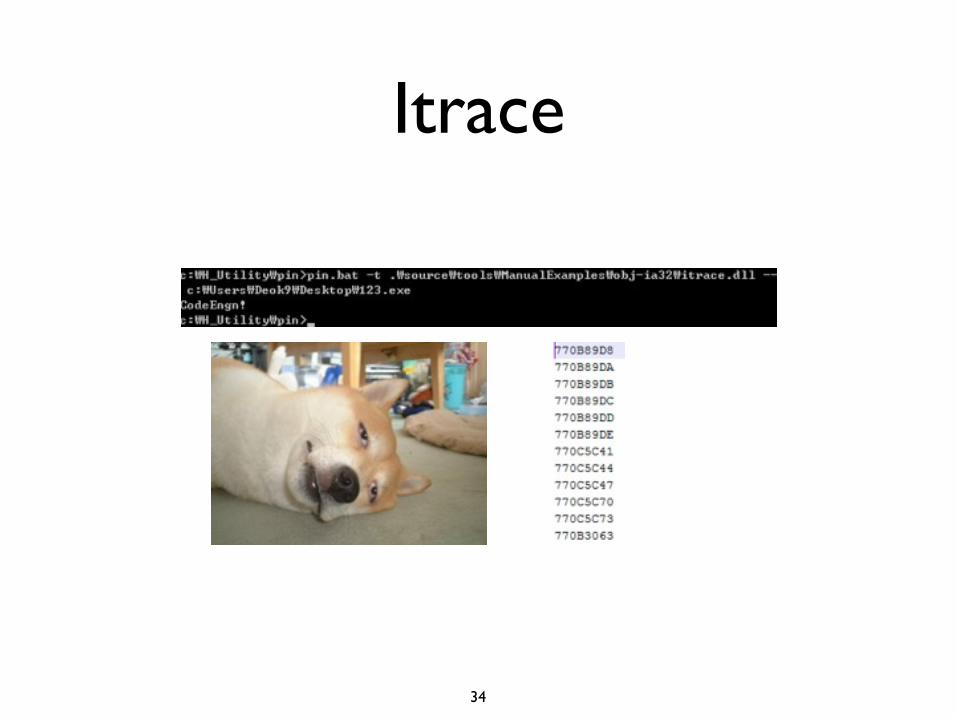
• ItraceInstruction Address Trace
How to pass arguments
Useful understanding the control flow of a program for debugging
33
Itrace
34

Modify Itrace
35

insertPredicatedCall ?
36
To avoid generating references to instructions that are predicated when the predicate is false
Predication is a general architectural feature of the IA-64

Pinatrace
• PinatraceMemory Reference Trace
Useful debugging and for simulating a data cache in processor
37

Pinatrace
38
770B89DA : Instrumentation PointsR/W : Access Type0023F434 : &Address4 : R/W Size0x01 : *Address

Vera
• Use vera !Shmoocon 2011 Danny Quist
Visualizing Executables for Reversing & Analysis
Better OEP detection & IDA Pro Plugin
39

Demo !
• if ( Use DBI with Vera ) you will see the memory flow ( easily )
• And
you will see the pattern of vulnerable program and patched program
40

Demo !
41

Zero-day !
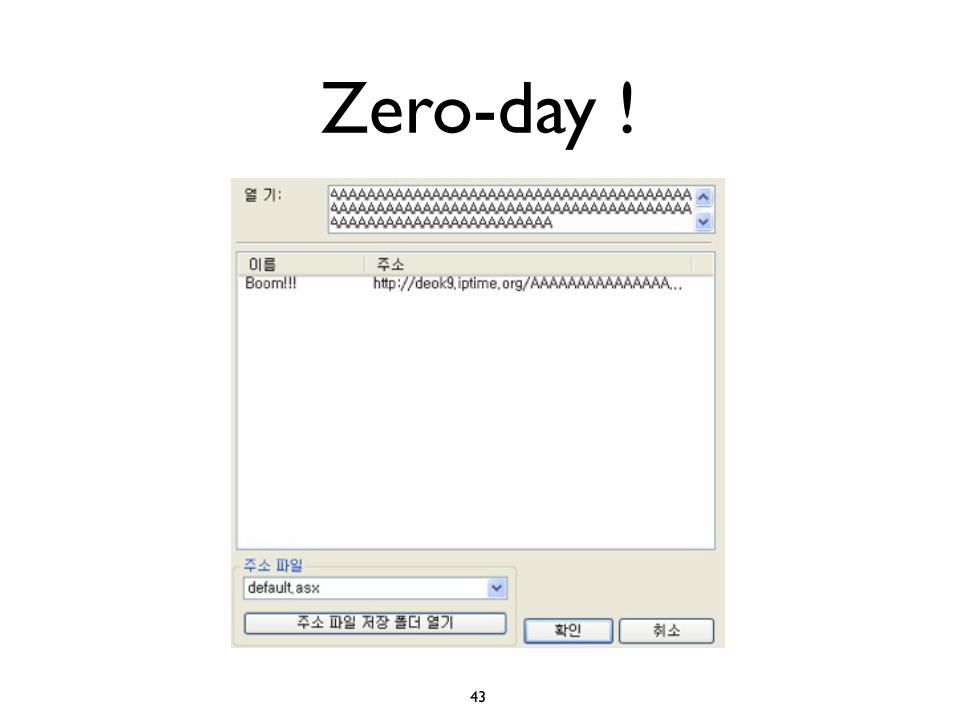
1. Hook Vulnerability Function
strcpy, strcat, sprintf, scanf, fscanf, strstr, strchr
2. And monitoring ESI
3. Olleh! It’s possible to modify the parameters
42
Zero-day !
43

Zero-day !
44

reference
• http://translate.google.co.kr/?hl=ko&tab=wT
• http://www.pintool.org/
• http://www.youtube.com/watch?v=9nlWbDdxKjw
45
Q & A
46
www.CodeEngn.comCodeEngn ReverseEngineering Conference

Quiz
47
OR, XOR 연산에서A 가 Taint 된 값( 1 ) 이라고 가정했을 때
B 의 값이 무엇일 때 “Taint 되었다”
라고 할까요 ??답과 간단한 이유를 말해주세용
hint ) AND 연산일때 B 가 1일때 Taint 되었다.