program on housing and urban policy - …urbanpolicy.berkeley.edu/pdf/gq0403.pdf · ·...
TRANSCRIPT

Institute of Business and Economic Research
Fisher Center for Real Estate and Urban Economics
PROGRAM ON HOUSING AND URBAN POLICY WORKING PAPER SERIES
These pain naturestimulatecommento be citepublicatipermissi
WORKING PAPER NO. W02-004
HOUSING SUBSIDIES AND THE TAX CODE:THE CASE OF MORTGAGE CREDIT CERTIFICATES
By
Erica GreulichJohn M. Quigley
April 2003
UNIVERSITY OF CALIFORNIA, BERKELEY
pers are preliminary : their purpose is to discussion and
t. Therefore, they are not d or quoted in any on without the express on of the author.

Housing Subsidies and the Tax Code:
The Case of Mortgage Credit Certificates
Erica Greulich University of California
Berkeley, CA [email protected]
John M. Quigley University of California
Berkeley, CA [email protected]
April 2003
Abstract
The most significant U.S. housing subsidy programs are funded by tax expenditures through the Internal Revenue Code (IRC). Beyond the subsidy to homeownership provided to all owner occupants through the personal income tax, the IRC provides additional subsidies to specific groups of homeowners. The Mortgage Revenue Bond program (MRB) permits lower levels of government to issue tax-exempt debt, using the proceeds to supply mortgages at below-market interest rates to deserving households. States are also permitted to issue and distribute Mortgage Credit Certificates (MCCs) which entitle recipient homeowners to claim a tax credit for some portion of the mortgage interest paid rather than the tax deduction claimed by other homeowners.
This paper documents the wide variations in reliance upon MCCs and MRBs across U.S. states and the emergence of Mortgage Credit Certificates as the largest housing program administered by the State of California. The paper provides an economic analysis of the MCC program using micro data on more than 12 thousand program recipients in California during the period 1996-1998. We estimate the extent and distribution of MCC subsidies across income and demographic groups, measuring the dollar amount of federal subsidies and their effects upon the user cost of residential capital and the demand price of housing. We analyze the geographic incidence of MCC subsidies across neighborhoods of varying socio-demographic composition and deprivation. Finally, we note important differences in the administrative and programmatic costs of MCCs and MRBs, suggesting that there are clear reasons to favor Mortgage Credit Certificates as a means of subsidizing deserving households.
Keywords: Housing subsidy, mortgage credit certificates

1
I. Introduction
The most significant housing subsidy programs in the U.S. are funded by tax
expenditures through the Internal Revenue Code. The special status of owner-occupied housing
under the personal income tax is well-known: interest payments for home mortgages are
deductible as personal expenses for the first and second homes of taxpayers, up to a limit of
$1,000,000; ad valorem property taxes on owner-occupied houses are also deductible as personal
expenses; the implicit rental income from occupying the house (the �dividend�) is excluded from
gross income; and capital gains are essentially untaxed.
Beyond these subsidies to home ownership, which apply to all owner-occupants, the tax
code provides additional subsidies to specific groups of homeowners. These programs are
managed by the states, but the source of the subsidy is federal tax expenditures. The tax code
permits lower levels of government to issue tax-exempt debt and to use the proceeds for the
benefit of specific mortgage holders through the Mortgage Revenue Bond (MRB) program.
Recipients benefit by obtaining mortgages at a lower tax-exempt interest rate, rather than the
market rate.
Finally, states are permitted to issue and distribute Mortgage Credit Certificates (MCCs),
which entitle recipient homeowners to claim a tax credit for some portion of the mortgage
interest paid, rather than the tax deduction claimed by other homeowners. Subsidies distributed
by states and civil divisions of states under the MRB and MCC programs are subject to an
aggregate cap prescribed in the Internal Revenue Code (IRC).
There is a rather extensive literature documenting the economics of income tax subsidies
to homeowners (e.g. Berkovec and Fullerton, 1992), and there is a smaller literature on the
operation of the MRB subsidy program (e.g. Ling and Smith, 1998). There is little economic

2
analysis of the MCC program. (Indeed we were only able to find one paper describing the
program in any detail; see Stegman and Stebbens, 1992. There is a fleeting reference to the
program in Green, 2001.) The MCC program is smaller, but it is by no means unimportant. For
example, in the most populous state, California, Mortgage Credit Certificates represent the
largest of all state-administered housing programs.
This paper analyzes the operation of the Mortgage Credit Certificate program using
microeconomic data on program beneficiaries in California. We analyze data on recipients of
subsidies under California�s MCC program during the period from 1996 to 1998. The micro data
include information on the characteristics of recipient households, their dwellings, and their
residential locations. We analyze the geographical distribution of homeowner subsidies and the
magnitude and distribution of benefits by location and demographic group.
Our analysis suggests that there would be substantial benefits to expanding the MCC
program at the expense of the MRB program. The former program involves very low
transactions costs and can be targeted in the same manner s the more complex bond subsidy
program. Credit certificates offer considerable advantages in terms of flexibility and
responsiveness to local needs. We suggest that with one minor change, the credit certificate
program would unambiguously dominate the bond program.
Section II below reports the extent and distribution of private purpose subsidies permitted
under the Internal Revenue Code, including MRBs, MCCs, and multifamily housing bonds.
Section III describes the salient features of the MCC program�the substitution of a tax credit for
a deduction � and its effect on consumers and on the costs of housing to recipients. Section IV
presents a geographical and demographic analysis of the MCC program in California. Section V
is a brief conclusion.

3
II. MCCs and private activity bonds
The MCC Program was established by the Deficit Reduction Act of 1984 and was
modified by the Tax Reform Act of 1986. Under the law, states are awarded annual Private
Activity Bond (PAB) allocations. The allocation to any state provides a cap on the volume of
tax-exempt bonds that can be issued for �private purposes,� e.g. those issued to benefit specific
private entities, such as individual homeowners. The available cap for these subsidies was
increased once since 1986. For 2002, the cap is set at the larger of $225 million per state or $75
for each resident of the state. Beginning in calendar year 2003, however, this ceiling is to be
adjusted annually for inflation.
The private activity bond cap awarded to each state may be used to subsidize a variety of
eligible programs specified in Sections 141 through 147 of the IRC. Eligible programs include
Tax Exempt Facilities (to benefit public enterprises such as airports, sewage disposal facilities,
etc.), Industrial Development Agencies (to develop industrial or commercial properties for the
benefit of private owners), Student Loans (to finance higher education), and Housing Bonds.
The latter can include bonds issued for the construction of multifamily housing as well as the
MRB and MCC programs for homeowners described above. The allocation of the PAB bond
cap among these programs is undertaken by each state, and the priorities among states may vary
substantially.
Table 1 reports the national distribution of Private Activity Bonds between housing and
other programs during the past decade. As the table indicates, of $134 B in newly available bond
authority, about $51 B was allocated to uses other than housing, and about $35 B was
unallocated by state authorities. The remainder, about $48 B, was allocated to housing

4
programs�45 percent to multifamily housing and 55 percent to homeownership programs. A
third of the subsidy to homeownership, about $6.4 B, has been allocated through MCCs.
As the table indicates, the allocation of bond authority among programs has varied quite
substantially over time. The division between housing programs and other qualified activities
has gyrated, as has the division between multifamily housing programs and those supporting
homeownership. Annual allocations to Mortgage Revenue Bonds have ranged between $496 M
and $3,636 M across years; allocations to Mortgage Credit Certificates have ranged between
$345 M and $1,413 M.1
This considerable variation over time is less pronounced than the geographical variation
in the utilization of these forms of bond authority. Appendix Table A1 disaggregates reliance
upon Mortgage Credit Certificates by state during this same period. Only 24 states allocated any
PAB authority to MCCs. Five states�California, Indiana, Michigan, Oklahoma, and Texas�
accounted for eighty percent of the MCCs issued during the period. One state, California,
accounted for more than half the dollar value of all MCCs issued during 1992-2000.
III. MCCs and homeowner subsidies
As indicated above, MCCs and MRBs are substitutes in providing assistance to home
purchasers. An MRB awarded to a �deserving� homebuyer permits the recipient to obtain a
mortgage at a lower rate using the proceeds from the sale of tax exempt bonds; an MCC awarded
to a �deserving� home buyer permits the recipient to claim some fraction of the interest paid on
1 PAB authority is allocated to issuers of revenue bonds or credit certificates by state governments. Issuers of MCCs issue certificates whose aggregate authority-use value is one-fourth of the debt allocation received. (See IRC 26d.) The authority-use value of each certificate is its loan amount multiplied by its eligible tax credit rate. The rule of one fourth is a rough approximation to aggregate tax loss from a newly awarded certificate. (The annual subsidy declines as the loan is amortized, and the weighted average maturity of mortgage loans is 6-8 years.)

5
the first mortgage as a tax credit rather than a tax deduction. If the recipient itemizes deductions
in filing federal income taxes, she must reduce her itemized deductions by the amount of interest
claimed as a credit. Although most homeowners (especially recent purchasers) do itemize
deductions, it is important to note that the credit can be claimed by any taxpayer in possession of
an MCC, and it is not confined to households who itemize deductions.
Eligibility�the definition of a �deserving� homebuyer�is the same under the MRB and
MCC programs. Eligible households may not have been homeowners within the three years
prior to the award of an MRB or MCC. Their incomes may not generally exceed 115 percent of
the area median income (100 percent for one- or two-person households); the value of the house
purchased may not exceed 90 percent of the average home price in the area. Eligible households
may buy single-family housing, multifamily housing (for up to four families), condominiums, or
certain forms of cooperative housing.
These household eligibility standards may be relaxed for MCCs used to purchase
dwellings in �target� areas.2 Targeted areas are defined by income criteria published by HUD at
the census tract level or are designated by state governments.
Mortgage Credit Certificates may be granted to provide federal tax credits at rates
varying from 10 to 50 percent of the mortgage interest paid per year. At rates exceeding 20
percent, the credit for any homeowner is capped at $2,000 per year. The credit is non-refundable
but may be carried forward by a recipient taxpayer for up to three years.
The subsidy provided to a recipient of an MCC depends on the size of the mortgage
obligation incurred, the mortgage details (the interest rate and term, which determine the
schedule of interest payments for a level payment mortgage), and on the income of the recipient

6
(which determines the relevant marginal tax rate, τ). The arithmetic is slightly complicated by
the self-amortizing feature of home mortgage. The appendix indicates how the subsidy provided
by an MCC in any month j, after mortgage origination can be calculated for a taxpayer who
itemizes deductions.
This subsidy has income and substitution effects. An MCC reduces the net out-of-pocket
costs for a given gross monthly expenditure on housing. This increases demand and also permits
households to qualify for larger mortgages and thus to afford to spend more on housing.3 An
MCC also reduces the net price of housing to the recipient, the user cost of housing capital. The
user cost represents the net after-tax cost of a dollar of housing capital used by a recipient in any
period. (See Poterba, 1992, or Quigley, 1998.) Absent taxes, depreciation and dynamics, the
annual user cost of a unit of capital is the real interest rate, i. The value of the periodic flow of
housing services, R, is related to the value of the home, V, by the equation
(1) iVR = .
Housing rent, R, is the opportunity costs of using capital for one period, iV; alternatively,
the capitalized value of Rent, R/I, equals the value of the property, V. With mortgage interest
deductible at the marginal tax rate, τ,
(2) V])1[i(R τ−= .
The term in parentheses, the user cost, represents the after-tax cost of the homeowner�s
mortgage payment and the after-tax opportunity cost of the homeowner�s equity. Suppose L is
2 For certificates issued for these areas, the houses purchased may have values up to 110 percent of the area average. Up to one-third of MCCs issued for targeted areas need not be subject to income restrictions; the other two-thirds can go to households whose incomes are 140 percent of the area median. 3 This arises because lenders typically use rules of thumb in determining the largest mortgage for which a household may be entitled. A standard underwriting rule specifies a maximum a net housing-payment-to-income ratio. Thus, households with MCCs qualify for larger mortgages.

7
the initial loan-to-value ratio of a mortgage. If the homeowner�s mortgage is not amortized, then
the expression in parentheses can be disaggregated
(3) V])L1[]1[iL]1[i(R −τ−+τ−= ,
where the first term in the parentheses is the after-tax cost of the mortgage payment of iL. With
an MCC, some fraction x of the annual mortgage payment is a tax credit, not a tax deduction.
Thus the user cost of housing capital is reduced by the difference between the credit gained
(xLV) and the deduction lost (τxLV).
(4) V])L1[]1[iL]x1[]1[i(R −τ−+−τ−= ,
= (i[1-τ] [1-xL]) V
If instead, the mortgage is self-amortizing, the arithmetic is slightly more complicated;
the user cost varies as the loan is amortized.4 Finally, the user cost of capital is affected by the
deductibility of property taxes, by depreciation, capital gains, and inflation.5
Tables 2 and 3 illustrate the effects of a Mortgage Credit Certificate on the annual
housing payments and the user costs of capital for various homeowners. Table 2 reports the
effects for a household with an annual income of $31,900; Table 3 reports the effects for a
household with an annual income of $46,750. For each household we simulate the effects for
house purchases valued at $105,000, $130,000, and $160,000 with a mortgage for eighty percent
of the purchase price of the house.6
4 Using the notation in the appendix, the user cost in any month j after mortgage is (N1) [ ]( )V})j,T,i{LP1()j(I)x1(]1[iR −+−τ−= . 5 With deductible property taxes (at rate t), depreciation (at rate d), inflation (at rate a) and untaxed capital gains (at rate g), the expression for the user cost of capital in period j is (N2) R = (i [1-τ] [(1-x) I(j) + {1-LP(i, T ,j)}]) + t[1-τ] + d � g � a) V. See Green and Malpezzi (2003, 55-60) for a detailed discussion. 6 The house values reported in the tables approximate the 25th, 50th, and 75th percentiles of the sample of micro data for California analyzed in Section IV below. The income levels in Tables 2 and 3 are the 25th and 75th percentiles, respectively, of the micro data.

8
The next three columns present the value of the subsidy provided by the MCC at current
federal income tax rates and at three credit rates: 10, 20 and 40 percent of interest paid.
Amounts are reported for the first year of the subsidy and also for the present value of the
subsidy over 30 years. (The latter calculation assumes constant incomes and tax rates over the
period, with a discount rate of 7.45 percent, the mean market rate for 30-year mortgages during
the 1996-1998 period7). These calculations are based upon equation (A6) in the appendix. As
the tables indicate, possession of a Mortgage Credit Certificate represents a substantial housing
subsidy for recipient households. Depending upon the interest rate, house value, and MCC credit
rate, the subsidy in the first year varies from $415 to $1,660 for the lower income household and
slightly more for the higher-income household. The present value of the subsidy varies from
$4,000 to $19,000 for the lower-income household, and up to $18,500 for the higher income
household. In general, the MCC subsidy increases with the MCC credit rate,8 the mortgage
interest rate, and the purchase price.
The tables also report the effects of an MCC on the user cost of housing capital.9 These
calculations are based on equation (N2) above. The tables confirm the substantial house price
reductions associated with the award of an MCC. Under reasonable conditions, user costs in the
first year are reduced by at least 15 percent and up to 90 percent, depending upon the MCC rate,
7 This calculation overstates the value of the subsidy since homeowners do move, on average, every eight years. But, with self amortizing mortgages, the subsidy is front loaded, and receipt of an MCC probably reduces the subsequent mobility of homeowners. This effect is even less important in the empirical analysis presented in Section IV since Proposition 13 has substantially reduced homeowner mobility in California, increasing mortgage duration. 8 Without the caps and carry-forward provisions described above, the subsidy would vary linearly with the credit rate. 9 These calculations assume an initial loan to value ratio of 80% on a 30-year mortgage with annual property tax rates of 1 percent, depreciation rates of 1 percent, capital gains of 3 percent and inflation rates of 2 percent. The calculations reported are similar to those illustrated in equation (N1), except that the camp and three-year carry-forward are accounted for.

9
the mortgage interest rate, income and house value. Because interest payments are larger in the
early years of a mortgage, the amounts of the subsidy and the reductions in user cost are larger in
the early years.
These hypothetical calculations suggest that the MCC program can have large effects
upon the circumstances of recipient households and their housing consumption.
IV. The MCC program in California
As noted in Section II, decisions about the use of MRBs, MCCs and other Private
Activity Bonds are decentralized; they are made by state authorities, or by local authorities under
the oversight of state governments. Thus, understanding the net effect of MCC subsidies on
households and locations is complicated by these institutional features of the program. Decisions
relating to the extent of subsidies, their geographical coverage, and the rates at which credits are
awarded are made by state and local housing finance agencies or state tax credit allocation
commissions; agencies and commissions may make very different decisions within the
framework of eligible programs specified in the Internal Revenue Code. Recall that in 2000, 39
states chose not to issue MCCs at all, preferring to allocate tax credit subsidies to housing
through MRBs and multifamily housing bonds.
California has been the largest state sponsor of MCCs during the past decade; about 55
percent of the volume of MCC activity in the U.S. during the 1990s was authorized in California.
Table 4 reports the distribution of Private Activity Bond authority in California during the period
1990-1999. During the 1990s, the California Debt Limit Allocation Commission (CDLAC, an
agency of the State�s Treasury Department) allocated some $15.5 B in bond authority. More
than two-thirds, about $11.9 B, was allocated to housing. The allocation varied substantially

10
over time among the MRB, MCC and the Multifamily Bond programs. In total, about $4.3 B
was allocated to MRBs, $4.1 B to MCCs and $3.5 B to multifamily housing. A third of the PAB
authority used for housing in California went to MCCs.
For the state of California, we were able to obtain raw data on the individual households
assisted by the MCC program between 1996 and 1998. The raw data contain observations on
12,617 recipients of MCCs in California during the period; the ten cities and 28 counties with
CDLAC-approved MCC programs during this three-year period originally supplied these data to
the CDLAC.10 The raw data contained errors, and some information was simply missing. The
most important limitations for the analyses reported below were missing or undecipherable
census tract numbers, which preclude matching a recipient to geographical and neighborhood
information, and missing or inaccurate mortgage terms and interest rates, which preclude
computing the subsidy actually provided to an MCC recipient. While this is the most complete
data set assembled on the MCC program for any state, the coverage is not perfect.
We use these data to analyze the two key justifications presented for the MCC program.
First, we examine the extent and distribution of subsidies among recipients, and thus the
distribution of public subsidies among �deserving� households. We then analyze the spatial
distribution of subsidies and the implicit targeting of benefits to �deserving� geographical areas.
A. The distribution of subsidies among households
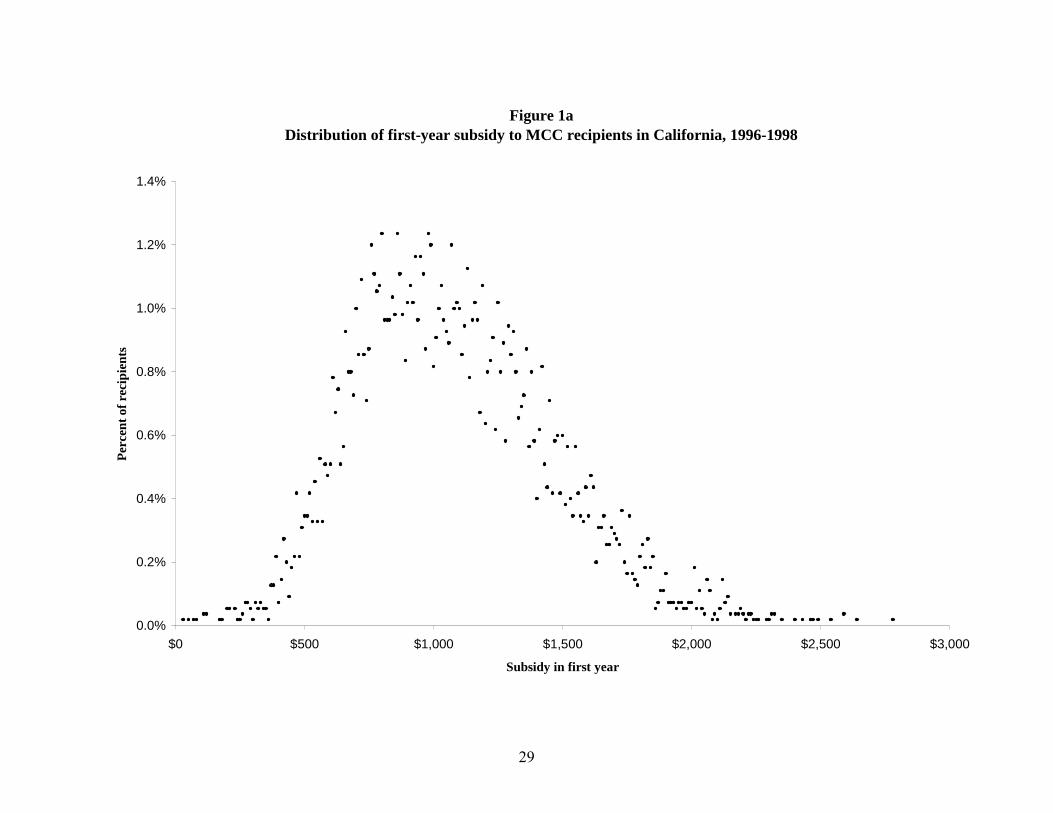
Figures 1 and 2 summarize the distribution of subsidies provided by the California MCC
program across recipient households. These figures are based upon the 5,566 MCCs issued
during 1996-1998 for which information about transactions prices, mortgage terms and interest
10 The data were assembled by Michael Smith-Heimer, who kindly supplied us with the data.

11
rates was available.11 Figure 1 reports the distribution of the first-year subsidy and the present
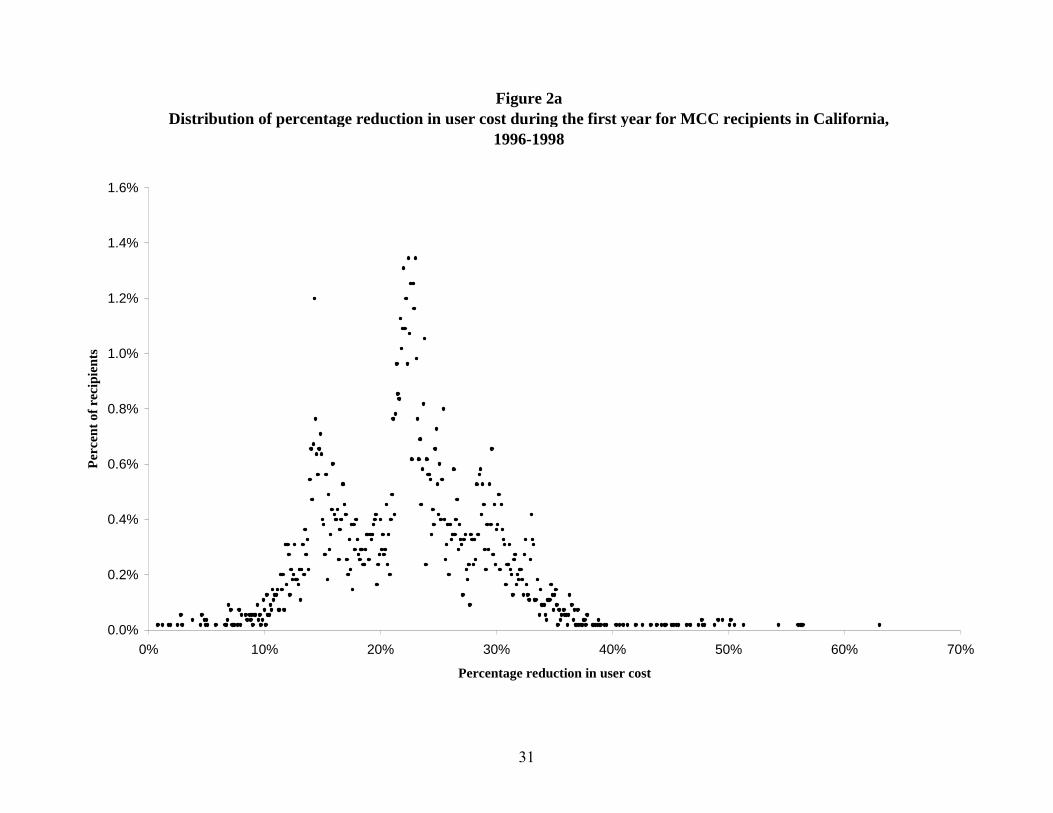
discounted value of the annual stream of the MCC subsidy, respectively; Figure 2 indicates the
effect of the MCC subsidy program on the user cost of capital to recipient home purchasers.
As depicted in Figure 1, the mean first-year subsidy to MCC recipients is about one
thousand dollars ($1,068), while the mean present discounted value of the entire subsidy is more
than ten thousand dollars ($10,407) per recipient household. The two distributions are similar,
slightly skewed toward the lower bound of zero, and both have a maximum value ($2,782 and
$27,458, respectively) slightly exceeding 250 percent of the mean. It is clear that MCC program
recipients in California receive substantial benefits. The distributions for the reductions in user
cost shown in Figure 2 are tri-modal: the first-year reduction has maxima near 15, 22 and 30
percent, while the overall percent reduction is more compressed, peaking near 10, 15 and 20
percent. The median recipient household gets a reduction of almost one-fifth in the user cost of
residential capital.
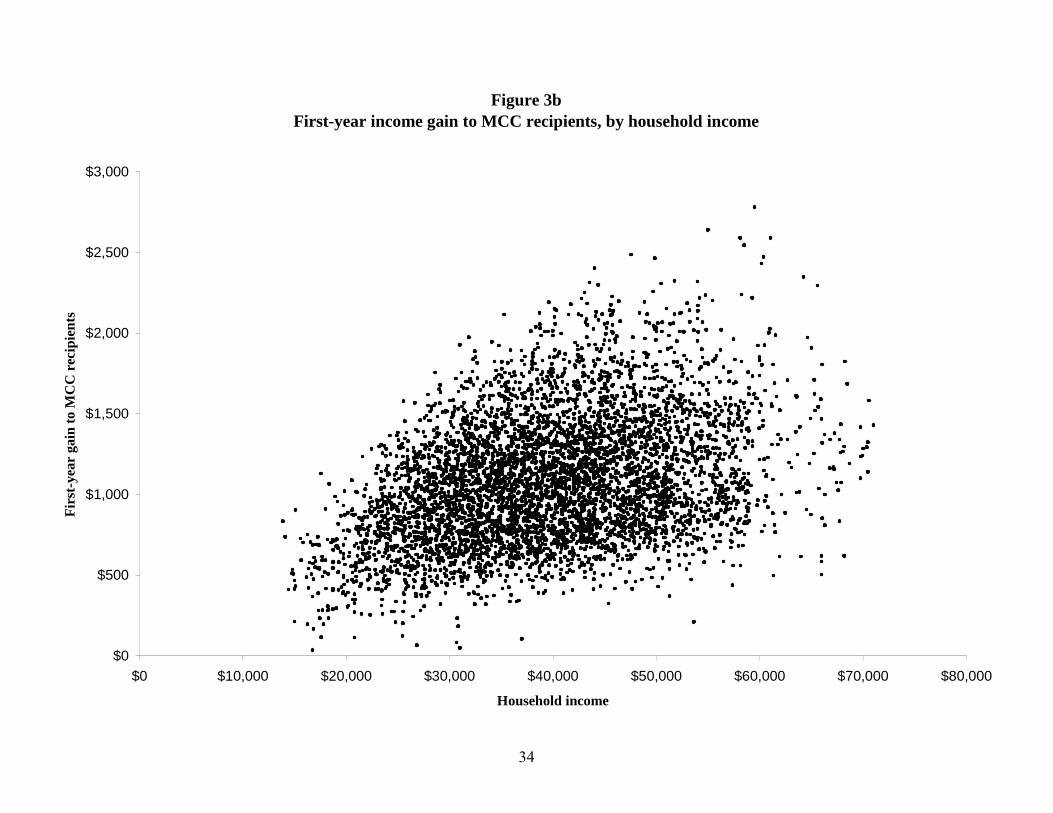
Figure 3 presents scatter diagrams of the relationship between the subsidies provided to
households and their annual incomes. Figure 3a graphs the subsidy as a fraction of income. By
this measure, the subsidy declines with income and the variance in the subsidies is reduced as
income increases. Figure 3b indicates quite clearly that the amount of the subsidy to California
recipients increases with income (within eligibility limits), and the variance of the subsidy also
increases.
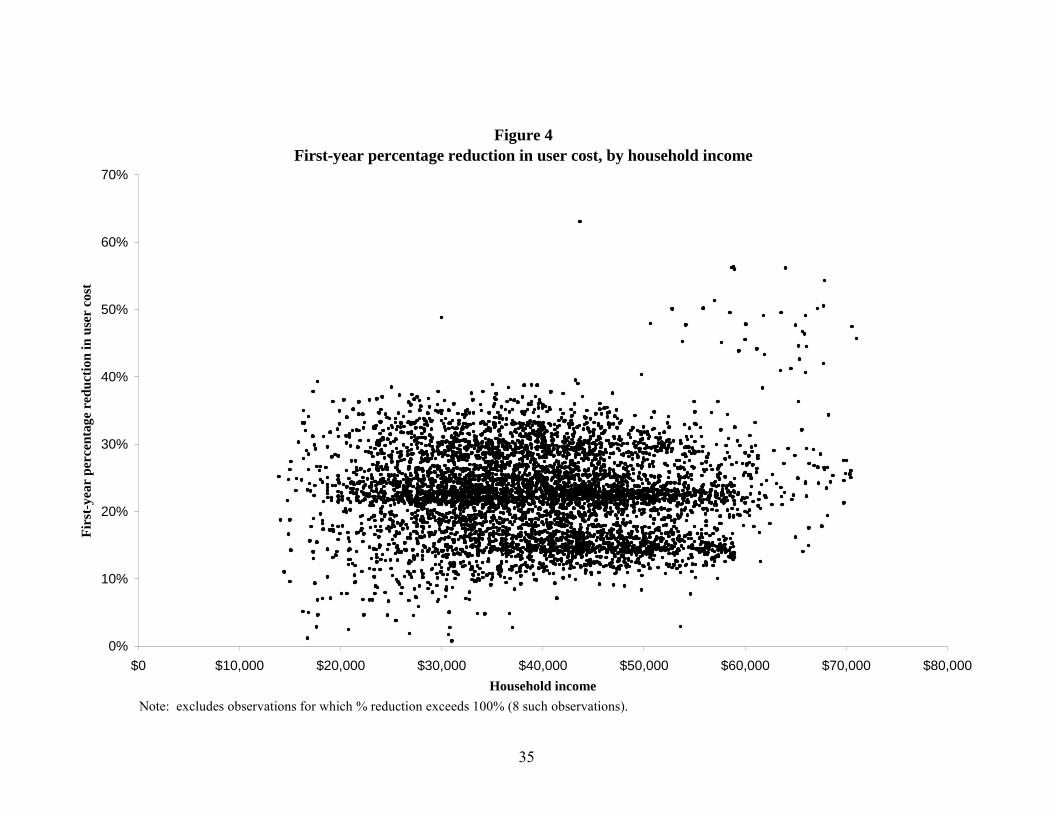
Figure 4 reports the relation between the percentage reduction in user costs of recipients
and their annual incomes. These is little difference in average user cost reductions with income,
11 The figures also make the same assumptions about property taxes, capital gains, inflation, and depreciation used in providing the estimates in Tables 2 and 3.

12
but recipient households of the same income can receive very different reductions in their
housing costs through the program.
Table 5 presents summary regressions of the relationship between incomes, family size
and subsidy amounts by race. As noted in the table, there are small differences in the average
MCC subsidy by income � about $150 for an additional ten thousand dollars in household
income. Ceteris paribus, larger family sizes receive larger subsidies. Other things constant, on
average white households receive slightly larger MCC subsidies. Appendix Table A2 presents
more detail on the distribution of MCC subsidies. It presents the means of selected household
characteristics and MCC benefits by race and household size.
B. The distribution of subsidies across neighborhoods
We matched the neighborhood (census tract) of the dwelling qualifying for a Mortgage
Credit Certificate for the observations on California MCC subsidies during 1996-1998. This
permits us to analyze the link between the extent of MCC program subsidies in a neighborhood
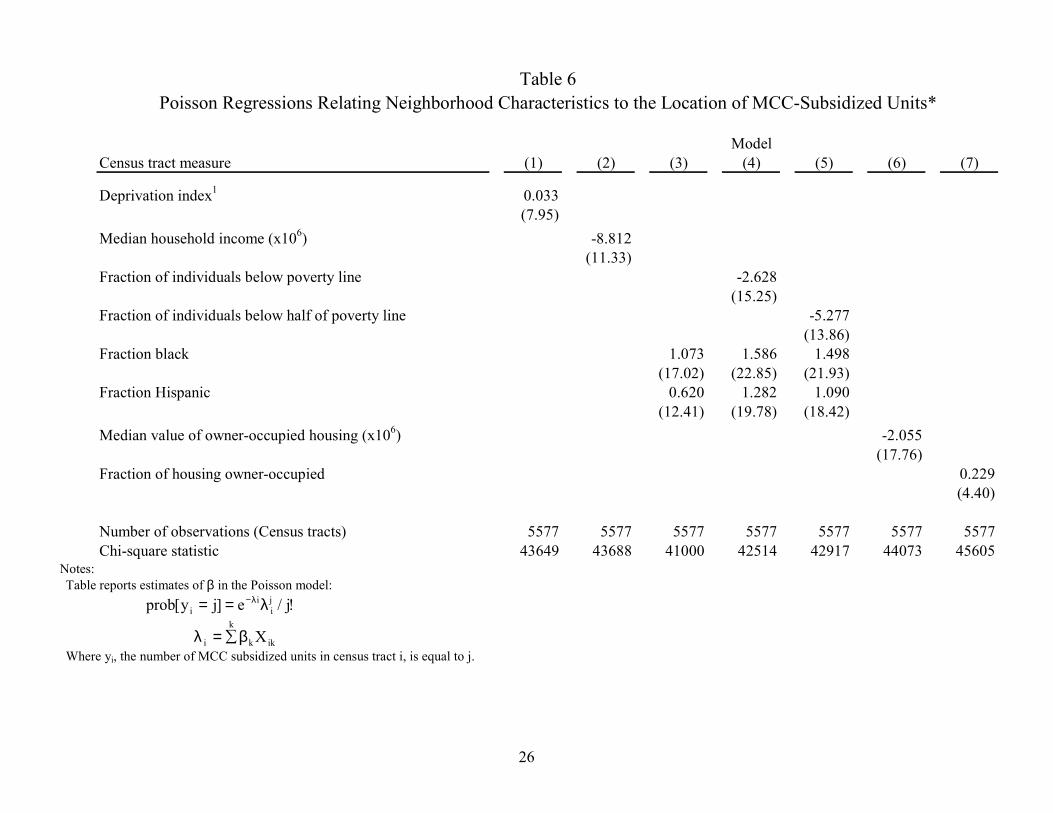
and the characteristics of that neighborhood. Table 6 reports the estimates of a series of count
models relating the probability distribution of the number of subsidized dwellings to
neighborhood characteristics. The Table reports the estimated coefficients, β, of poisson models
relating the probability, that the count iy of MCC-subsidized units in census tract i is equal to j,
to neighborhood characteristics x:
(5) !j/e]jy[prob ji
ii λ== λ− .
where
ikk
k
i Xβ∑=λ

13
The models are estimated using the 6,816 California MCCs issued during 1996-1998 for
which the street address or sensus tract was available. Street addresses were matched to 1990
census tracts, and the poisson regressions are based upon census tract data for 1990.
Model (1) includes of a single variable introduced by Mincy, et al. (1990) to measure the
relative deprivation of a census tract.12 The incidence of MCC-subsidized units is higher in more
deprived census tracts. Model (2) reports that the incidence of subsidized units is higher in
census tracts with lower household incomes. The results of models (3), (4), and (5) suggest that
the incidence of MCC-subsidized units is higher in census tracts with a larger percentage of
minority households, but is lower in census tracts which have the highest concentrations of the
very poorest households. Models (6) and (7) indicate the incidence of MCCs is higher in census
with lower valued housing but with larger factions of homeowners.
Overall, these results are consistent with state and local policies that target MCC benefits
at least implicitly to neighborhoods of lower income, with lower house values, and with larger
fractions of minority residents. But these programs are not targeted to the worst neighborhoods
with the highest poverty rates. MCC subsidies are more likely to be exercised in lower-income
neighborhoods with higher homeownership rates, presumably where the quality of
neighborhoods are less likely to decline over the term of the mortgage (and where the subsidy
may help to stabilize a neighborhood). MCC subsidies are highly concentrated by census tract.13
12 This deprivation index is composed of normalized indicators of four census tract percentages: adults who have not completed high school; working age males not regularly employed; households on public assistance; female-headed households. 13 Of the 5,577 California census tracts, 3,714( 67 percent) had no recorded MCCs during 1996-1998, 671 had one MCC, and only 29 census tracts had 5 or more MCCs. But 4,086 (60 percent) of the MCCs issued during the period were directed to census tracts with 5 or more MCCs.

14
C. Transactions costs and administrative costs
The transactions costs of distributing MCCs and administering the program in California
are remarkably low. All dollars of PAB authority allocated by the debt allocation commission
(CDLAC) go into home finance in the form of issued certificates. Local governments who issue
MCCs incur some administrative costs (e.g., staff time, advertising, application to CDLAC, etc.).
These are financed from two sources: fees from MCC applicants, and fees from mortgage
lenders. Fees from MCC applicants, called �reservation fees,� may average $150 with the same
fee charged upon refinancing a mortgage. Fees from lenders may average $300.14 In the
aggregate, these administrative costs amount to more than about 4 percent of benefits to
recipients.
In contrast, the administrative and transactions costs of the mortgage revenue bond
program are substantial. All dollars of PAB authority allocated by CDLAC for MRBs do not go
into direct home finance. As specified in the Internal Revenue Code (IRC, Section
1439(a)2A(i)), these proceeds may be allocated into three categories: direct home finance,
reserves, and issuance costs.
Issuance costs may include: �underwriters� spread; counsel fees; financial advisory fees;
rating agency fees; trustee fees; paying agent fees; bond registrar, certification and authentication
fees; accounting fees; printing costs for bond and offering documents; public approval process
costs; engineering and feasibility study costs; guarantee fees, other than for qualified
guarantees�and similar costs� (IRC, Sec. 124).
In the aggregate, for bonds to qualify for PAB status, these fees must be limited to 2
percent of the proceeds of the issue (3.5 percent for small issues under $20 M). In California, the
14 These fees are representative. The specific fees noted above are charged by the County of Sacramento Tax Credit Program in 2002. (Conversation with Carla Christina, Program Administrator.)
15
issuer typically includes a covenant in the origination agreement with investors not to exceed this
statutory cap.
Note that this restriction does not apply to all administrative costs. For example, HUDs
regulations governing the use of Community Development Block Grant funds specifically allow
such funds to be used for various �program administrative costs,� including �the cost of issuance
and administration of mortgage revenue bonds used to finance the acquisition, rehabilitation or
construction of housing� (24 CFR 570.206(g)(5)).
Note, finally, that a transactions cost of one percent on the proceeds of the issue under the
MRB program is not comparable to a transactions cost of four-tenths of a percent of the subsidy
under the MCC program. At an interest rate of 7 percent and a 3 percent spread between the
taxable and tax exempt bond rates, a one percent issuance cost reduces the net subsidy by almost
32 percent.
V. Implications
During the period 1992-2000, states and localities used about $26 billion in private
activity bond authority to subsidize particular homeowners. About a quarter of this was used to
supply Mortgage Credit Certificates under state and locally designed programs.
Our analysis of the largest state-organized MCC program suggests that it provides
substantial benefits to recipient households � averaging about $1,100 in the first year and
$10,400 in present value terms over the life of a thirty-year mortgage. These subsidies decreased
the user cost of housing to recipients by an average of more than twenty percent.
Recipients of MCCs have household incomes that tare about twenty percent lower than
that of the population as a whole. 10.3 percent of recipient households were black and 38

16
percent were Hispanic. In the population as a whole, 7.6 percent of households are black and
23.6 percent are Hispanic. Amongst recipient households, the subsidies are larger for those of
higher incomes and family sizes. Ceteris paribus, minority recipients receive subsidies in the
first year that are lower by about $100, or nine percent.
The price reduction afforded by the program leads to a substantial increase in the housing
consumption of recipients. With a price elasticity of housing demand of �1 or �2/3 (See
Goodman, 1989), these subsidies increase the uncompensated demand for housing by 20 percent
or 14 percent among the recipients of MCCs. These are sizeable effects.
An analysis of the census tracts in which MCCs have been awarded suggests that they
have been targeted to neighborhoods with lower incomes and housing prices, but not to
neighborhoods with the highest poverty rates. MCCs are more likely to be awarded in
neighborhoods with higher fractions of minority households and higher rates of homeownership.
It is worth comparing the salient features of the MCC program with the better-known
program which distributes the proceeds of Mortgage Revenue Bonds. Both programs have
similar eligibility rules, and both are administered by state governments or by local governments
under state oversight. Both programs reduce the net cost of housing to recipients, increasing
their demand for housing. The net housing expenditures of recipients are easily computed by
lenders under both program, and this permits recipients of lower gross incomes to qualify for
homeownership. Outreach for either program can be accomplished by state and local
governments and by private lenders, real estate agents and other market participants. Our
empirical analysis suggests that the proceeds of the MCC program are well-targeted by income
and neighborhood.
17
The principal difference between the programs appears to be in transactions costs and in
the flexibility to carry forward subsidies. Under the MRB program, governmental entities must
bring bond issues to market � employing bond counsel and underwriters, establishing public
funds and paying agents and providing oversight. These functions are quite expensive. In
contrast, under the MCC program all that is required is the award by government of a
�certificate� to a household verifying eligibility, based on income, homeowner status, and the
location of the property. Armed with this certificate, the recipient household need only check
line 49 of IRS Form 1040 and complete the one-page Form 8396 to receive an annual tax credit.
The contrast in transactions costs is striking.
The other difference between the programs is in the ability to carry forward the subsidy.
Under the MRB program, the recipient household obtains the benefit of lower mortgage interest
rates contemporaneously. Under the MCC program, households without tax liabilities in any
year receive no benefit in that year. They may carry forward the tax credit, but only for three
years. It would seem that an extension of the carry forward provision would improve the equity
of the MCC program relative to revenue bonds.
If the credit were simply made refundable (in the same manner as the Earned Income Tax
Credit), the MCC program would unambiguously dominate the more costly program of issuing
revenue bonds to subsidize housing purchases by qualifying households.

18
References
Berkovec, James and Don Fullerton, �A General Equilibrium Model of Housing Taxes, and
Portfolio Choice,� Journal of Political Economy, 100(2), 1992: 390-429. Durning, Danny W., ed., Mortgage Revenue Bonds: Housing Markets, Home Buyers and Public
Policy. Boston: Kluwer Academic Publishers, 1992. Goodman, Allan C., �Topics in Empirical Housing Demand,� Allan C. Goodman and Richard F
Muth, eds., The Economics of Housing Markets. London: Harwood Academic Publishers, 1989.
Green, Richard K., �Homeowning Social Outcomes, Tenure Choice, and U. S. Housing Policy,�
Cityscape Journal of Policy Development and Research, 5(2), 2001: 21-29. Green, Richard K., and Stephen Malpezzi, A Primer on U. S. Housing Markets and Housing
Policy. Washington: The Urban Institute Press, 2003. Kinnander, Ola, �Single-Family Surge: Housing Captures More of Volume Cap in 2000,� The
Bond Buyer, July 9, 2001: 1, 34-35. Ling, David, and Marc T. Smith, �Another Look at Mortgage Revenue Bonds,� Journal of
Policy Analysis and Management, Spring 1988. Mincy, Ronald B., Isabel V. Sawhill, and Douglas A. Wolf, �The Underclass: Definition and
Measurement,� Science, 248(4954), 1990: 450-453. Poterba, James M., �Taxation and Housing: Old Questions, New Answers,� American Economic
Review, 82(2), 1992: 237-242. Quigley, John M., �The Taxation of Owner-Occupied Housing,� The Encyclopedia of Housing.
New York: Sage Publications, 1998: 579-581. Stegman, Michael, with David Stebbens, �An Alternative to Mortgage Revenue Bonds: An
Evaluation of the Mortgage Credit Certificate Program in North Carolina,� in Mortgage Revenue Bonds: Housing Markets, Home Buyers and Public Policy, edited by Danny W. During, Boston: Kluver Academic Publishing, 1992: 135-160.
19
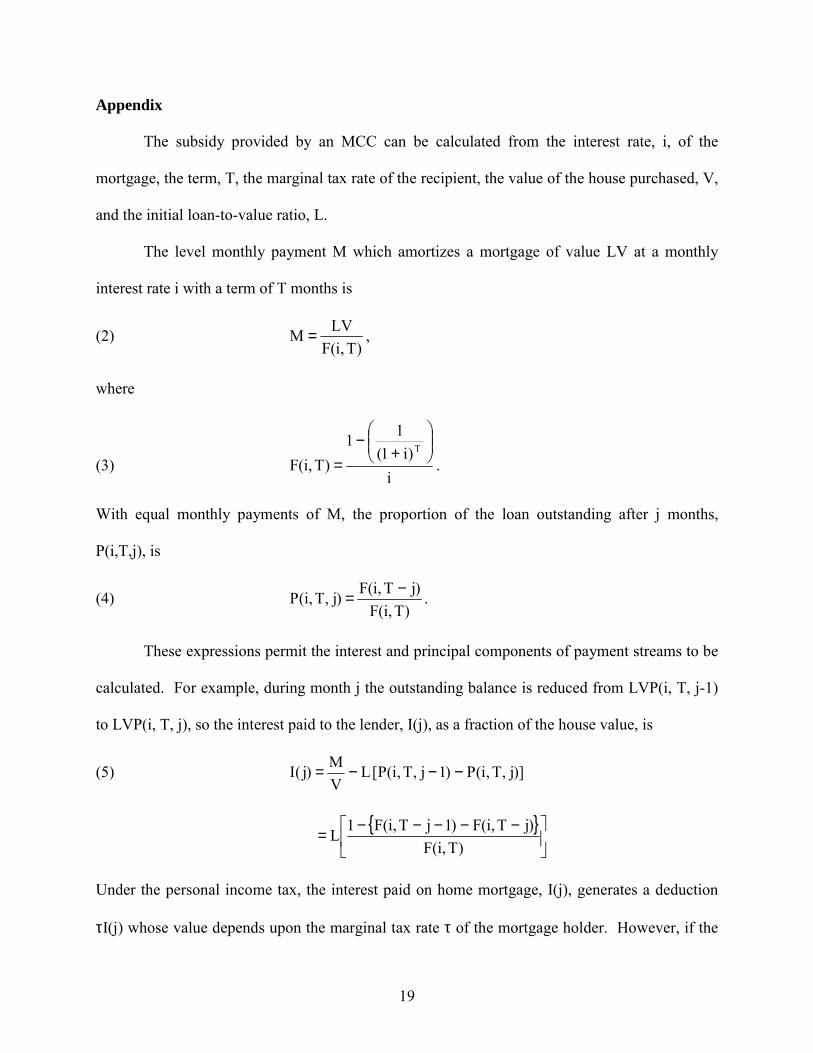
Appendix
The subsidy provided by an MCC can be calculated from the interest rate, i, of the
mortgage, the term, T, the marginal tax rate of the recipient, the value of the house purchased, V,
and the initial loan-to-value ratio, L.
The level monthly payment M which amortizes a mortgage of value LV at a monthly
interest rate i with a term of T months is
(2) )T,i(F
LVM = ,
where
(3) i
)i1(11
)T,i(FT
+
−= .
With equal monthly payments of M, the proportion of the loan outstanding after j months,
P(i,T,j), is
(4) )T,i(F
)jT,i(F)j,T,i(P −= .
These expressions permit the interest and principal components of payment streams to be
calculated. For example, during month j the outstanding balance is reduced from LVP(i, T, j-1)
to LVP(i, T, j), so the interest paid to the lender, I(j), as a fraction of the house value, is
(5) )]j,T,i(P)1j,T,i(P[LVM)j(I −−−=
{ }
−−−−−=)T,i(F
)jT,i(F)1jT,i(F1L
Under the personal income tax, the interest paid on home mortgage, I(j), generates a deduction
τI(j) whose value depends upon the marginal tax rate τ of the mortgage holder. However, if the

20
mortgage holder possesses an MCC, she receives an annual tax credit of x percent of interest
paid and loses the tax deduction associated with that fraction of the mortgage interest. The
subsidy, S is:
(6) V)j(I)1(xS τ−=
)x,j,,T,i,LV(s τ= .
S is the amount by which tax liabilities are reduced through possession of an MCC.

21
Table 1
State Allocations of New Private Activity Bond Authority, Millions of Current 1992-2000Dollars
Housing Bonds
Year Annual
Bond Cap MRB MCC Other*
Non-Housing Bonds**
1992 $14,532 $2,052 $702 $735 $5,649 1993 14,594 496 1,149 954 5,391 1994 14,711 1,777 1,413 650 3,571 1995 14,827 2,573 719 1,883 6,818 1996 14,827 2,708 789 2,277 5,783 1997 15,044 2,731 542 3,109 5,403 1998 15,148 2,387 345 3,191 6,128 1999 15,261 1,814 388 4,063 5,849 2000 15,376 3,636 393 4,635 6,712
Total $134,320 $20,174 $6,391 $21,497 $51,304
Notes: *
"Other Housing Bonds" include multifamily housing and housing bonds not elsewhere classified.
* "Non Housing Bonds" include Industrial Development Bonds, Exempt
Facilities Bonds and Student Loans.
Source:
Compiled by Chris Neale from The Bond Buyer, various years. Some corrections to the data reported in The Bond Buyer were obtained from the Office of the Treasurer, State of California. The most recent data appear in Kinnander, 2001.

22
Table 2 MCC Subsidy Amounts and Reductions in User Costs
For Households with Income of $31,900 MCC RATE 0.1 0.2 0.4 0.1 0.2 0.4
Purchase Price Mortgage
Rate
Annual Mortgage Payment Amount of Subsidy Percent Reduction in User Cost
A. Subsidy in first year $105,000 6% 6,043 416 832 1,660 21.9% 43.8% 87.3% 7% 6,706 486 972 1,660 17.5% 35.1% 57.8% 8% 7,396 556 1,111 1,660 15.3% 30.5% 42.4% $130,000 6% 7,482 515 1,030 1,660 21.9% 43.8% 67.1% 7% 8,303 601 1,203 1,660 17.5% 35.1% 43.9% 8% 9,157 688 1,376 1,660 15.3% 30.5% 31.8% $160,000 6% 9,209 634 1,268 1,660 21.9% 43.8% 51.1% 7% 10,219 740 1,481 1,660 17.5% 35.1% 33.0% 8% 11,271 847 1,693 1,660 15.3% 30.5% 23.5% B. Present discounted value of subsidy $105,000 6% 6,043 3,934 7,868 15,731 14.1% 28.3% 56.6% 7% 6,706 4,687 9,373 17,461 11.7% 23.4% 44.3% 8% 7,396 5,459 10,917 18,221 10.5% 20.9% 35.8% $130,000 6% 7,482 4,870 9,741 17,526 14.1% 28.3% 52.1% 7% 8,303 5,802 11,605 18,288 11.7% 23.4% 37.9% 8% 9,157 6,758 13,517 18,701 10.5% 20.9% 29.4% $160,000 6% 9,209 5,994 11,989 18,262 14.1% 28.3% 44.4% 7% 10,219 7,141 14,283 18,714 11.7% 23.4% 31.1% 8% 11,271 8,318 16,636 18,978 10.5% 20.9% 23.5% Note: These computations assume an 80% initial loan-to-value ratio on a 30-year mortgage with t=1% (property tax), g=3% (captial gains), a=2% (inflation), d=1% (depreciation). The computations are similar to those illustrated in equation (N1) except that the cap and the three-year carry-forward provision are accounted for.

23
Table 3 MCC Subsidy Amounts and Reductions in User Costs
For Household with Income of $46,750 MCC RATE 0.1 0.2 0.4 0.1 0.2 0.4
Purchase Price Mortgage
Rate
Annual Mortgage Payment Amount of Subsidy Percent Reduction in User Cost
A. Subsidy in first year $105,000 6% 6,043 406 812 1,620 23.2% 46.3% 92.3% 7% 6,706 474 948 1,620 18.2% 36.4% 59.7% 8% 7,396 542 1,085 1,620 15.7% 31.4% 43.2% $130,000 6% 7,482 503 1,005 1,620 23.2% 46.3% 70.4% 7% 8,303 587 1,174 1,620 18.2% 36.4% 45.0% 8% 9,157 671 1,343 1,620 15.7% 31.4% 32.0% $160,000 6% 9,209 619 1,237 1,620 23.2% 46.3% 53.1% 7% 10,219 722 1,445 1,620 18.2% 36.4% 33.3% 8% 11,271 826 1,653 1,620 15.7% 31.4% 23.3% B. Present discounted value of subsidy $105,000 6% 6,043 3,839 7,678 15,352 15.0% 30.0% 60.0% 7% 6,706 4,574 9,147 17,040 12.4% 24.5% 46.1% 8% 7,396 5,327 10,654 17,781 10.8% 21.5% 36.9% $130,000 6% 7,482 4,753 9,506 17,104 15.0% 29.9% 55.0% 7% 8,303 5,663 11,325 17,847 12.1% 24.3% 39.1% 8% 9,157 6,595 13,191 18,250 10.8% 21.5% 30.0% $160,000 6% 9,209 5,850 11,700 17,822 15.0% 29.9% 46.7% 7% 10,219 6,969 13,939 18,263 12.1% 24.3% 31.9% 8% 11,271 8,117 16,235 18,521 10.8% 21.5% 23.7% Note: These computations assume an 80% initial loan-to-value ratio on a 30-year mortgage with t=1% (property tax), g=3% (captial gains), a=2% (inflation), d=1% (depreciation). The computations are similar to those illustrated in equation (N1) except that the cap and the three-year carry-forward provision are accounted for.

24
Table 4
California Allocation of Private Activity Bond Authority 1990-1999
Millions of Current Dollars
Housing Bonds
Year Annual
Bond Cap MRB MCC Other*
Non-Housing Bonds**
1990 $1,453 $760 $263 $167 $264 1991 1,453 679 363 273 138 1992 1,519 52 565 136 766 1993 1,543 198 614 75 655 1994 1,560 355 1,004 56 145 1995 1,572 658 356 172 386 1996 1,572 499 427 353 293 1997 1,594 455 253 516 370 1998 1,613 330 99 853 332 1999 1,633 319 150 892 272
Total $15,512 $4,305 $4,094 $3,493 $3,621
Notes: * "Other Housing Bonds" include multifamily housing. **
"Non Housing Bonds" include Industrial Development Bonds, Exempt Facilities Bonds, and Student Loans.
Source: http://www.treasurer.ca.gov/cdlac/news/awards1990-1999.pdf

25
Table 5
Summary of MCC Subsidies by Income, Family Size and Race
Mean Values* Regressions**
Dependent variable: First Year Subsidy
1 2 3
Income 39.439 14.801 14.801 14.249 (thousands) (10.31) (29.61) (29.61) (28.40) Household 2.949 -0.013 9.035 Size (1.70) (0.00) (8.77) White 41.520 (Percent) Black 10.295 -103.041 (Percent) (6.14) Hispanic 38.052 -98.970 (Percent) (8.26) Asian -81.730 (Percent) (3.75) Constant 484.543 484.563 535.070 (19.218) (19.80) (20.41) Observations 5566 5566 5566 5566 on MCCs R2 0.150 0.151 0.164 Notes: *Standard deviations in parentheses. **t-ratios in parentheses.
26
Census tract measure (1) (2) (3) (4) (5) (6) (7)
Deprivation index1 0.033(7.95)
Median household income (x106) -8.812(11.33)
Fraction of individuals below poverty line -2.628(15.25)
Fraction of individuals below half of poverty line -5.277(13.86)
Fraction black 1.073 1.586 1.498(17.02) (22.85) (21.93)
Fraction Hispanic 0.620 1.282 1.090(12.41) (19.78) (18.42)
Median value of owner-occupied housing (x106) -2.055(17.76)
Fraction of housing owner-occupied 0.229(4.40)
Number of observations (Census tracts) 5577 5577 5577 5577 5577 5577 5577Chi-square statistic 43649 43688 41000 42514 42917 44073 45605
Table 6Poisson Regressions Relating Neighborhood Characteristics to the Location of MCC-Subsidized Units*
Model
Notes: Table reports estimates of β in the Poisson model: !j/e]jy[prob j
ii
i λ== λ−
ikk
k
i Xβ∑=λ Where yi, the number of MCC subsidized units in census tract i, is equal to j.

27
1The deprivation index is composed of four normalized Census tract percentages: adults who have not completed high school; working-age males not regularly employed; households on public assistance, and female-headed households. See Miney, et al., 1990, for details. *t-ratios in parentheses.

28
Appendix Table A1States Using Mortgage Credit Certificates, 1992-2000
Millions of Current Dollars
State 1992 1993 1994 1995 1996 1997 1998 1999 2000 TotalAlabama 1 $1Arizona 73 59 46 20 $197Arkansas 44 $44California 565 615 1,004 356 427 253 99 150 106 $3,574Colorado 32 91 8 4 3 3 $140Hawaii 12 $12Idaho 3 $3Indiana 66 79 50 48 18 25 58 45 $389Iowa 65 44 0 40 31 0 $180Kansas 55 $55Kentucky 18 6 $24Louisiana 10 5 $15Michigan 75 40 110 49 107 $381Minnesota 100 21 14 8 5 8 $156Mississippi 1 $1Missouri 12 $12Ohio 100 24 3 95 $222Oklahoma 25 107 39 24 19 33 29 33 33 $341Oregon 8 $8Pennsylvania 4 10 $14Rhode Island 40 23 $63Texas 61 30 55 39 64 40 47 32 $368Vermont 8 $8West Virginia 50 5 74 50 $180Total $702 $1,147 $1,413 $719 $789 $541 $346 $338 $392 $6,386
Source: See Table 1.
29
Figure 1aDistribution of first-year subsidy to MCC recipients in California, 1996-1998
0.0%
0.2%
0.4%
0.6%
0.8%
1.0%
1.2%
1.4%
$0 $500 $1,000 $1,500 $2,000 $2,500 $3,000
Subsidy in first year
Perc
ent o
f rec
ipie
nts

30
Figure 1bDistribution of PDV of subsidy to MCC recipients in California, 1996-1998
0.0%
0.2%
0.4%
0.6%
0.8%
1.0%
1.2%
1.4%
1.6%
1.8%
$0 $5,000 $10,000 $15,000 $20,000 $25,000 $30,000
Present value of subsidy
Perc
ent o
f rec
ipie
nts
31
Figure 2aDistribution of percentage reduction in user cost during the first year for MCC recipients in California,
1996-1998
0.0%
0.2%
0.4%
0.6%
0.8%
1.0%
1.2%
1.4%
1.6%
0% 10% 20% 30% 40% 50% 60% 70%
Percentage reduction in user cost
Perc
ent o
f rec
ipie
nts

32
Figure 2bDistribution of percentage reduction in user cost during the entire mortgage term for MCC recipients in
California, 1996-1998
0.0%
0.5%
1.0%
1.5%
2.0%
2.5%
0% 10% 20% 30% 40% 50% 60% 70%
Percentage reduction in user cost
Perc
ent o
f rec
ipie
nts

33
Figure 3aFirst-year Percentage gain in income to MCC recipients, by household income
0%
1%
2%
3%
4%
5%
6%
7%
$0 $10,000 $20,000 $30,000 $40,000 $50,000 $60,000 $70,000 $80,000
Household income
Firs
t-ye
ar p
erce
nt g
ain
34
Figure 3bFirst-year income gain to MCC recipients, by household income
$0
$500
$1,000
$1,500
$2,000
$2,500
$3,000
$0 $10,000 $20,000 $30,000 $40,000 $50,000 $60,000 $70,000 $80,000
Household income
Firs
t-ye
ar g
ain
to M
CC
rec
ipie
nts
35
Figure 4First-year percentage reduction in user cost, by household income
0%
10%
20%
30%
40%
50%
60%
70%
$0 $10,000 $20,000 $30,000 $40,000 $50,000 $60,000 $70,000 $80,000Household income
Firs
t-yea
r pe
rcen
tage
red
uctio
n in
use
r co
st
Note: excludes observations for which % reduction exceeds 100% (8 such observations).