program for vehicle regulatory reform: assessing life
TRANSCRIPT

UC DavisResearch Reports
TitleProgram for Vehicle Regulatory Reform: Assessing Life Cycle-Based Greenhouse Gas Standards
Permalinkhttps://escholarship.org/uc/item/49g4h212
AuthorsKendall, AlissaAmbrose, HanjiroMaroney, Eriket al.
Publication Date2018-08-01
eScholarship.org Powered by the California Digital LibraryUniversity of California

Program for Vehicle Regulatory Reform: Assessing Life Cycle-Based Greenhouse Gas Standards
August 2018 A Research Report from the National Center for Sustainable Transportation
Alissa Kendall, University of California, Davis
Hanjiro Ambrose, University of California, Davis
Erik Maroney, University of California, Davis
Huijing Deng, University of California, Davis
i
About the National Center for Sustainable Transportation
The National Center for Sustainable Transportation is a consortium of leading universities committed to advancing an environmentally sustainable transportation system through cutting-edge research, direct policy engagement, and education of our future leaders. Consortium members include: University of California, Davis; University of California, Riverside; University of Southern California; California State University, Long Beach; Georgia Institute of Technology; and University of Vermont. More information can be found at: ncst.ucdavis.edu.
U.S. Department of Transportation (USDOT) Disclaimer
The contents of this report reflect the views of the authors, who are responsible for the facts and the accuracy of the information presented herein. This document is disseminated under the sponsorship of the United States Department of Transportation’s University Transportation Centers program, in the interest of information exchange. The U.S. Government assumes no liability for the contents or use thereof.
Acknowledgments
This study was funded by a grant from the National Center for Sustainable Transportation (NCST), supported by USDOT through the University Transportation Centers program. The authors would like to thank the NCST and USDOT for their support of university-based research in transportation, and especially for the funding provided in support of this project. The authors would also like to acknowledge graduate student Huijing Deng for her contributions to research on the Chinese market, undergraduate researcher Michelle Bahn for her work on lithium recycling technologies, and Prof. Dan Sperling for his significant contributions and assistance in convening of workshops and meetings.

ii
Program for Vehicle Regulatory Reform: Assessing Life Cycle-Based Greenhouse Gas
Standards A National Center for Sustainable Transportation Research Report
August 2018
Alissa Kendall, Department of Civil and Environmental Engineering, University of California, Davis
Hanjiro Ambrose, Institute of Transportation Studies, University of California, Davis
Erik Maroney, Department of Civil and Environmental Engineering, University of California, Davis
Huijing Deng, Institute of Transportation Studies, University of California, Davis

iii
[page left intentionally blank]
iv
TABLE OF CONTENTS
EXECUTIVE SUMMARY ................................................................................................................... vii
Introduction .................................................................................................................................... 1
Life Cycle GHG Emissions from PEVs: Developing Models of Space, Time, and Technology ......... 4
Materials and Methods............................................................................................................... 4
Results ......................................................................................................................................... 5
Conclusions ................................................................................................................................. 8
The Global Market for EVs: Implications for Materials, Manufacturing, and Climate ................... 9
Background ................................................................................................................................. 9
PEV Manufacturing and Operation in China and the United States......................................... 12
Materials and Vehicle Supply Chains ........................................................................................ 15
Conclusion and Future Research .............................................................................................. 16
Development of Supporting Data for LCA of PEV Materials and Understanding the Robustness of Estimates of Changing Demand and Background Systems ...................................................... 17
Methods .................................................................................................................................... 18
Results ....................................................................................................................................... 19
Conclusions ............................................................................................................................... 20
Future Work .............................................................................................................................. 21
Life-cycle Based Regulatory Reform for the LDV Sector ............................................................... 22
Review of Life Cycle-Based Policies .......................................................................................... 22
Labels and Certifications ........................................................................................................... 28
Discussion ................................................................................................................................. 29
Current U.S. Vehicle Emissions Policies and their Relation to Life Cycle Emissions ................. 30
Conclusions ............................................................................................................................... 31
References .................................................................................................................................... 32
Appendix: TRB Workshop Summary and Materials ...................................................................... 40

v
List of Tables
Table 1. Previous LCAs of EDVs ....................................................................................................... 2
Table 2. PEV Sales in China from 2011 to September 2014 ......................................................... 11
Table 3. The production of PEVs and HEVs in China in 2012 and 2013 [39] ................................ 12
Table 4. Raw data for production of 1 ton of REO from ion-absorption clays ............................. 18
Table 5. Impact assessment results for producing 1 kg of heavy REO ......................................... 19
Table 6. Current and future electricity grid mix in Jiangxi, China (in percentage) ....................... 20
Table 7. Energy and GWP100 for light and heavy REO production .............................................. 20

vi
List of Figures
Figure 1. Uncertainty and variability in PEV emissions - reproduced from [3], synthesizing modeling and data from [3, 4] ................................................................................................. 6
Figure 2. Comparing estimates for PEV and battery production emissions from previous studies [11, 12, 17-22], reproduced from [3] ....................................................................................... 6
Figure 3. Comparing average emissions rates across 2015 PEV models, including battery production emissions. Note the 2025 CAFE standard is 160 g CO2e/mi ................................. 8
Figure 4. Cumulative U.S. sales of PEVs by manufacturer, millions of vehicles 2012 – 2018 [32] ........................................................................................................................................... 9
Figure 5. Published PEV sales forecasts in millions of vehicles, 2011-2020 [29, 31, 33] .............. 10
Figure 6. Electricity generation by primary energy source and region in China 2005 – 2010 [56] ......................................................................................................................................... 14
Figure A1. Potential Sources of Error Related to Functional Unit. Adapted from Reap et al. (2004) ..................................................................................................................................... 42

vii
Program for Vehicle Regulatory Reform: Assessing Life Cycle-Based Greenhouse Gas Standards
EXECUTIVE SUMMARY
In the United States, the transportation sector is responsible for 36% of greenhouse gas (GHG) emissions, with light-duty vehicles (LDVs) comprising the largest contribution [1]. Globally, transportation is responsible for approximately 24% of energy-related GHG emissions, of which road transport constitutes over 70% [2]. In addition to other measures, rapid and extensive deployment of renewable and energy-efficient technologies is seen as a crucial intervention necessary to reduce transportation sector emissions in coming decades.
Current GHG emissions and fuel economy standards for passenger vehicles only address vehicle operation, omitting non-operation emissions such as those associated with vehicle production and other life cycle emissions. Plug-in electric vehicles (PEVs) and many other advanced technology vehicles are often promoted as means for achieving significant GHG reductions from the light-duty vehicle (LDV) sector. However, non-operation emissions for these vehicles tend to be higher than for conventional internal combustion engine vehicles (ICEVs), which means the singular focus on operation emissions could be insufficient to achieve reduction targets. The overarching goals of this research project are to examine (i) the effect of including or excluding life cycle vehicle emissions in LDV GHG emissions standards, and (ii) the potential strategies that might be pursued to effectively incorporate life cycle emissions in LDV GHG policy. The research approach applies coupled system dynamics and life cycle assessment (LCA) modeling for vehicles and fleets.
This report documents the cumulative results of the project and presents both published findings and ongoing research. To understand the potential for developing and implementing life cycle-based policies for LDVs we must first develop the appropriate modeling tools, and we must understand how LCA or life cycle thinking has been implemented in policy contexts in the past. Thus, the rest of this report is divided into sections that summarize the work conducted on (i) developing LCA sub-models that will be integrated in the coupled system dynamics and LCA model, (ii) a review of the global market for PEVs with a focus on U.S. and China and implications for materials and manufacturing, (iii) a review of LCA and life cycle thinking in policy in the United States and around the world, and implications for life cycle-based vehicle policy, and (iv) the development of a new life cycle inventory to demonstrate the feasibility of a summary of findings from a Transportation Research Board (TRB) workshop on this topic conducted in January 2017.
The LCA modeling activities to date have focused on the spatial and temporal heterogeneity of PEV emissions, as well as the effect of battery chemistry and technology on life cycle PEV emissions, which has often been overlooked in previous studies. Previous studies concluded that the electricity fuel mix used to charge PEVs is a significant driver of performance, and in

viii
some cases, where grid mixes depend on coal and other carbon-intensive fuels, reverse the preference for a PEV over a gasoline vehicle. The research conducted here confirms those findings, but also augments them with additional spatial and temporal factors including ambient climate and seasonal grid variability. Ambient conditions, especially cold weather, increase the per-mile energy demand during electric driving, but had never previously been considered in a life cycle context. Cold climate effects were shown to be as important as grid differences. Results demonstrate a wide range of estimates for emissions from PEV mobility, leading to a reduction when compared to conventional vehicles of as low as 1.5 tons/year, to an increase of 0.5 tons per year.
Our modeling also examined the effect of battery chemistry selection on PEV life cycle performance. Similar to the ambient climate issues, battery chemistry has essentially never been modeled in a life cycle context. Results from this work showed that there are important trade-offs among battery chemistries. Comparing operating emissions to battery production emissions, we estimate that traction batteries represent 5%–15% of per-mile operating CO2e emissions for average U.S. PEVs.
The review of the global PEV market illustrated the importance of considering the diffusion of PEV technology in China in particular. Like the U.S. electricity grid, China’s grid has regional variability in its fuel mix. Overall, China’s grid fuel mix is more carbon intensive than the U.S. or European grids. Moreover, the grid mix in China has global implications for the production impacts of all vehicles, and especially PEVs, because of the country’s dominance in parts manufacturing and batteries in particular.
A global review of life cycle-based policies or policies that explicitly included life cycle thinking yielded at least two insights that may inform future policy development. If we are to look to past experiences to guide a life cycle-based policy framework for vehicles, there seem to be two potential approaches for creating estimates of vehicle life cycle emissions. The first approach builds on biofuel policy and particularly California’s Low Carbon Fuel Standard, where a government-sanctioned model supplies either default values or underlying emissions factors to be used in producer-generated life cycle GHG intensity estimates. The second approach looks to Environmental Product Declarations (EPDs) coupled with some of Europe’s existing mechanisms for extended producer responsibility for vehicles. This alternative approach would require EPDs generated throughout the automotive supply chain or at least by supplier companies and original equipment manufacturers.
In the first year of this project, the team produced two peer-reviewed journal manuscripts [3, 4] and two conference posters [5, 6], and convened meetings that engaged regulators and external stakeholders in ongoing conversations on the development of life cycle-based policies for vehicles and fuels.

1
Introduction
In conventional internal combustion engine vehicles (ICEVs) the operation, or use phase, of vehicles accounts for approximately 83%–95% of total life cycle greenhouse gas (GHG) emissions [1-5]. Light-duty vehicle (LDV) energy and emissions standards, such as the U.S. Corporate Average Fuel Economy (CAFE) standard, have rightly focused on vehicle operation and specifically fuel use and tailpipe emissions. However, two trends related to deploying new vehicle technologies and increased vehicle efficiency are changing the sources and magnitude of GHG emissions from the passenger vehicle sector. First, changes in powertrain technology and vehicle weight reduction achieve reduced CO2 emissions during operation, but typically increase the material and manufacturing burdens for vehicles. This shifts a greater portion of life cycle emissions to non-operation stages, namely vehicle production. Second, the use of alternative energy carriers such as low carbon liquid transportation fuels, electricity, or hydrogen (H2) may reduce or eliminate tailpipe emissions, and require that the energy carrier’s life cycle emissions be accounted for to capture the majority of life cycle emissions. Both these trends can undermine the effectiveness of policies targeting tailpipe emissions. This research focuses specifically on the first trend, the future adoption of new vehicle technology, which is intertwined with the use of alternative energy carriers. In particular, the United States, China, and some European countries have developed policies to increase the deployment and rate of technology maturation for electric-drive vehicles (EDVs), with a focus on plug-in electric vehicles (PEVs), a category that includes plug-in hybrid electric vehicles (PHEVs) and all-electric vehicles (AEVs).
Life cycle assessment (LCA) is a widely accepted methodology for evaluating the full burden of environmental impacts associated with a product or system. The name and an initiative to develop guidelines were first formalized in 1989 by the Society for Environmental Toxicology and Chemistry (SETAC), along with a code of practice a few years later. Its methods were first codified in international standards in the mid-1990s [7], and since then have undergone continued improvement and elaboration [8, 9]. LCA is intended to characterize the full environmental and resource implications of a particular system, which means examining a suite of environmental impact categories and including analysis of some of the uncertainties inherent in such modeling (e.g., standards require the inclusion of sensitivity and scenario analysis). As will be demonstrated in this report, the most common form of LCA in regulatory and policy contexts, and especially those relevant to the transport sector, is a narrow (and some would argue incomplete) form of LCA, the carbon footprint. Carbon footprints, or carbon intensity calculations, apply LCA methods only to GHG emissions, reporting the outcome of the study in carbon dioxide equivalents (CO2e). This research focuses on this narrow form of LCA.
LCAs of PEVs have consistently shown an increase in vehicle production emissions, and sometimes vehicle disposal emissions as well, and frequently, though not always, shown a reduction in operation emissions relative to ICEVs. Hawkins et al. (2013) found that production emissions comprise approximately 40% of an AEV’s life cycle CO2e emissions when vehicles are charged on European average electricity [10]. They also found these results are highly sensitive

2
to assumptions about vehicle lifetime and the electricity grid used to charge the vehicles. Others have found similar results; Samaras and Meisterling (2008) found that production emissions increased modestly for hybrid electric vehicles (HEVs) versus ICEVs, but increased more dramatically for PHEVs [11]. Notter et al. (2010) found that the proportion of life cycle emissions attributable to production doubled to more than 30% of life cycle emission for AEVs compared to ICEVs [12]. The results of these studies are summarized in Table 1.
Table 1. Previous LCAs of EDVs
Source Powertrain (Electric drive distance)
Production Use % of total life cycle attributable to production*
kg CO2e per vehicle (unless noted)
kg CO2e per vehicle (unless noted)
[11] ICEV 8,500 40,350 17% HEV 8,800 28,800 23% PHEV (30 km)
10,100 27,450 27%
PHEV (60 km)
11,600 27,150 30%
PHEV (90 km)
13,100 27,450 32%
[12] ICEV 5,200 30,200 15% AEV 6,890 15,200 31%
[10] AEV 72-81 g CO2e/km 104 g CO2e/km (European grid)
~40%
*End-of-life emissions not shown, but accounted for in % of total
In addition to the increasing importance of production emissions for PEVs, there are additional regulatory complications that have not yet been fully addressed in policy. Charging PEVs on different grids [10], and different patterns of charging [13], can significantly alter the GHG intensity of PEV operation, and presents new challenges for rating and regulating vehicle GHG emissions. Assumptions about what electricity sources should be attributed to vehicle charging, marginal or average, can also significantly change GHG intensity [4].
Previous research has shown that only regulating tailpipe emissions can lead to perverse outcomes for future vehicles, where vehicles with higher life cycle emissions but lower tailpipe emissions are preferred over vehicles with lower total emissions. Kendall and Price (2012) illustrated the risk of such an outcome in a case study of a future HEV. Their study showed a future HEV with higher life cycle emissions could be preferred over a vehicle with lower life cycle emissions simply due to the effects of lightweight materials [14] Hawkins et al. (2013) arrived at a similar conclusion for AEVs, suggesting life cycle-based emissions standards are required [10], and highlighting the additional problem of estimating AEV operation emissions given the heterogeneity of electricity grids over space and time; a conclusion other researchers

3
have arrived as well. Non-operation emissions in the vehicle life cycle has not yet been explicitly addressed in LDV policies anywhere in the world, though some agencies have acknowledged the issue.
In summary, the shift from conventional ICEVs to electric powertrains and from petroleum fuels towards electricity and biofuels requires a rethinking of how emissions are evaluated and thus how they should be regulated. This shift is necessary both because the total fuel cycle is important to consider and because battery electric powertrains, fuel cell powertrains, other advanced powertrains, and vehicle lightweight materials tend to have higher production-related emissions than components of conventional ICEVs. Given the global rise in PEVs and their inclusion in policies intended to mitigate GHG emissions from the on-road transport sector, policies that address LDVs may require a life cycle perspective and, for the benefit of vehicle producers (to minimize compliance burden and maximize policy effectiveness), a global perspective.
The research conducted in this project intends to develop tools and methods to assist responsible agencies and other decision-makers in (i) understanding the effectiveness of future LDV GHG standards with and without life cycle emissions, (ii) examining life cycle-based policies devised at different scopes and scales in terms of effectiveness and feasibility, and (iii) modeling plausible designs for life cycle-based emissions regulations to identify issues and potential solutions. Ordinary LCA modeling on its own cannot test the potential effects of policy strategies on life cycle emissions from vehicles, particularly at the scale of a national or global LDV fleet. Thus a coupled system dynamics and LCA model will be developed. The model will include dynamic representations of vehicle fleets and simplified representation of new vehicle offerings and sales under different regulatory frameworks and standards. In addition, the life cycle impacts of vehicle production and operation will be represented dynamically over time, with changing impacts for materials and technologies as well as fuels and energy carriers. As will become evident later in this report, changing electricity fuel mixes, for example, are crucial for determining a future PEV’s operation emissions.
The rest of this report is organized with the following rationale: To understand the potential for developing and implementing life cycle-based policies for LDVs we must first develop the appropriate modeling tools, and we must understand how LCA or life cycle thinking has been implemented in policy contexts in the past. Thus, the rest of this report is divided into sections that summarize the work conducted on (i) developing LCA sub-models that will be integrated in the coupled system dynamics and LCA model, (ii) a review of the global market for PEVs with a focus on the United States and China, and implications for materials and manufacturing, (iii) a review of LCA and life cycle thinking in both U.S. policy and around the world, and implications for life cycle-based vehicle policy, and (iv) a summary of continuing and future research.

4
Life Cycle GHG Emissions from PEVs: Developing Models of Space, Time, and Technology
A number of life cycle studies have illustrated the spatial and temporal heterogeneity of PEV emissions; these studies have found differences so large that they can reverse the preference for a PEV over a gasoline vehicle. Several factors can significantly influence the emissions reduction potential of PEVs, including methodological decisions in the study and the electricity grid used for charging. In addition to the GHG intensity of electricity used for charging, ambient climate conditions, marginal electricity generators, and battery chemistry selection can all impact the emissions from vehicle operation. This research assesses a suite of factors affecting PEV emissions, and AEVs in particular, on a life cycle basis, and discusses their relative importance as well as potential interactions.
As indicated previously, a number of enabling technologies for PEVs may increase production-related environmental effects when compared to conventional vehicles [12]. These include use of lightweight materials and the production of electric powertrain components including batteries and traction motors, which contribute to higher energy use, GHG emissions, and resource consumption. Manufacturing processes and use of primary energy can influence emission from production, and can also have strong regional variation.
In addition, the emissions and energy use associated with PEV operation depends not only on the efficiency of the vehicle, but also on the electricity generation source. For example, if the generation source is coal driven, air pollution is likely to be exacerbated and GHGs are likely to increase. Taken together, the effect of energy source on both production and vehicle operation indicate the need to consider where PEVs are manufactured and deployed in order to assess their emissions reductions potential compared to ICEVs.
This section summarizes and synthesizes the research published in two articles generated as work products from this project, one focuses on characterizing the impacts of production and the durability and performance of battery chemistries (a topic that has been essentially absent from the PEV LCA literature) [3], and the other focusing on spatial and temporal conditions that effect AEV GHG performance in use, most importantly grid electricity modeling (addressing marginal versus average fuel mix with seasonal and spatial specificity) and vehicle performance under different ambient climate conditions [4].
Materials and Methods
This section synthesizes the results from two distinct modeling activities whose methods are described in detail in their respective publications [3, 4]. For this study, process-based modelling for PEVs and traction battery production was undertaken based on publically available data, industry reporting, and published studies. Some vehicle data and material inventories were taken from the Greenhouse Gases, Regulated Emissions, and Energy Use in Transportation (GREET) model [15], and others from life cycle inventory databases available through the GaBi software system [16].

5
Results
Variability and Uncertainty in Life Cycle PEV Emissions as a Function of Space and Time
The fuel mix of an electricity grid used to charge a vehicle battery, regardless of whether electricity demand for charging is assumed to be average or marginal, will always remain a key determinant of the carbon intensity of electric mobility, but previously other spatial effects such as ambient climates have only rarely, or never, been considered. Hot climates can reduce battery life, and cold climates have a large direct impact on vehicle efficiency through less efficient charge and discharge from the battery and due to battery energy demand for cabin heating.
We modeled the effects of marginal electricity fuels by grid region, timing of charge (day or night), and the effect of ambient climate in the continental United States and found that climate effects on PEV performance can be as important as the electricity fuel mix in determining life cycle GHG emissions intensity. In particular, cold ambient conditions significantly reduce the energy efficiency (kWh/mi) of AEVs.
When averaged across the country, the combined effects of fuel mix and climate lead to AEVs slightly reducing GHG emissions compared to an equivalent ICEV. However, spatially and temporally explicit modeling reveals very high variability in EV GHG performance; from just over 80 g CO2e/km for a vehicle charged on fall evenings in Florida, to nearly 370 g CO2e/km for a vehicle charged on winter evenings in Minnesota [4].
Figure 1 summarizes the combined effect of several factors that can affect the life cycle GHG emissions from PEVs. Operating grid intensity (i.e., fuel mix for electricity generation), auxiliary loads from climate conditions, and charge/discharge efficiency were again the most significant factors affecting life cycle GHG emissions. Production of lithium traction batteries was also found to be a significant contributor, but emissions are dependent on the number of effective battery cycles (i.e., charge cycles or distance driven), and to a lesser extent the intensity of battery production processes. Climate conditions also impact battery lifetimes; climate capacity loss refers to battery degradation due to operating climate conditions, while calendar and cycle loss refers to battery degradation due to storage at a state of charge and effective throughput during the use phase.

6
Figure 1. Uncertainty and variability in PEV emissions - reproduced from [3], synthesizing modeling and data from [3, 4]
Variability and Uncertainty in Life Cycle PEV Emissions as a Function of Battery Chemistry
Battery chemistry and performance is another often overlooked source of variability in life cycle studies of PEVs. Battery lifetimes in automotive service can vary by an order of magnitude, and the range of lithium chemistries currently in use have other performance tradeoffs including energy density, specific power, and cost. Battery production and performance can also have significant impact on vehicle emissions through charge efficiency and lifetime. Comparing operating emissions to battery production emissions, we estimate that traction batteries represent 5%–15% of per-mile operating CO2e emissions for average U.S. PEVs (Figure 2).
Figure 2. Comparing estimates for PEV and battery production emissions from previous studies [11, 12, 17-22], reproduced from [3]
75 100 125 150 175
Operating Grid Intensity
Climate Load
Charge Efficiency
Battery Cycles
Climate Capacity Loss
Material Emissions
Calendar/Cycle Loss
g CO2e/e-VKT
Maximum
Minimum

7
To understand the potential for PEVs to reduce GHG emissions from the LDV sector on a life cycle basis, these distinct variables, space, time, and technology choice, must be considered in a dependent context. To understand the importance of these variables, results from this research can provide a rank ordering of significant issues affecting PEV emissions accounting and emissions reduction uncertainty. In the United States, spatial disparities in the emissions factors for utility-generated electricity lead to a wide range of estimates for PEV emissions reduction when compared to conventional vehicles; from a reduction of 1.5 tons/year, to an increase of 0.5 tons per year (See Figure 3 in [4] for additional detail). Differences between regional and state policies designed to increase the share of renewable generation may exacerbate these disparities.
Implications for Policy
Two main types of policy instruments are being used to drive increased PEV deployment [23]. Programs like the multi-state Zero Emission Vehicle (ZEV) Action Plan provide direct incentives for ZEV technologies, while California’s ZEV mandate spurs ZEV deployment dominated by PEVs. Vehicle efficiency and emissions policy, such as the CAFE and the EPA’s mobile source rules, are also encouraging PEV deployment through increasingly stringent efficiency standards that can not only be met with ZEVs, but incentivize ZEVs by assigning zero emissions per mile and providing multiplier credits.
However, while PEVs in general, and AEVs in particular, are often referred to as ZEVs, PEVs can have similar (or higher) emissions than ICEVs over the entire vehicle and energy carrier life cycle. Figure 3 considers just use-phase emissions from charging and battery production emissions for U.S. PEV models in 2015 reported to the U.S. DOE. Comparing emissions rates to U.S. fleet fuel economy and emissions targets, we can see that no currently marketed PEVs charged on today’s grid can even meet the 2025 CAFE target for passenger cars of 54 miles per gallon (MPG) or 160 grams CO2 per mile. This is not to say that electricity is not a viable low-carbon transportation pathway, but rather it indicates that life cycle impacts should be considered in order to maximize potential benefits in any vehicle transition scenario.

8
Figure 3. Comparing average emissions rates across 2015 PEV models, including battery production emissions. Note the 2025 CAFE standard is 160 g CO2e/mi
Conclusions
Our findings suggest LDV emissions will increasingly depend on the location of vehicle production and operation, particularly as vehicles achieve higher use-phase efficiencies and switch to PEV technologies. In addition, when emissions reduction credits are given for ZEV vehicles or specific technologies, the entire life cycle of vehicles and fuels should be considered. Disparities across vehicle technologies, including potential increases in emissions impacts from upstream material choices, can add to the uncertainty of potential emissions reductions from PEV adoption.
While this work focused on PEVs deployed in the U.S. context, we must also consider the issues of space and time in a global context, considering both the location of vehicle manufacturing and the region of operation (considering the background electricity grids and the influence of vehicle operating conditions such as ambient climate). The next section explores demand for and production of PEVs in the global context.

9
The Global Market for Electric Vehicles: Implications for Materials, Manufacturing, and Climate
Electric powertrain vehicles, including HEVs and PEVs, are a growing share of the on-road and new vehicle fleet in the United States and globally. Growth in this market will, in turn, increase demand for some automotive raw materials, particularly those in lithium-ion batteries and traction motors (for PEVs) and materials used in traction motors for both HEVs and PEVs. Life cycle GHG emissions from PEVs vary widely depending on the source of primary energy used to charge the vehicle during the use-phase, in addition to production process and material choices in vehicle manufacture. To fully understand the impacts of vehicle electrification and increased deployment of PEVs globally, we consider vehicle production and operations in the two largest vehicle markets, China and the United States. Note that data from China often includes HEVs in the EDV sector, and does not always break out PEVs, and this is reflected in some of the reviewed data.
Background
A number of academic publications [24-26], government reports [27-29], and consulting firm case studies [30, 31], point to strong growth in the sales of EDVs in markets across Asia, North America, and Europe. The United States, for example, has been enjoying an annual growth rate of 200% for EDVs; U.S. EDV stock (including all plug-in types), surpassed half a million vehicles in 2016. More recently, the US has experienced growth in the sales of PEVs with larger battery capacities and longer ranges (Figure 4); the US stock of all-electric PEVs will likely surpass a half million vehicles by 2019 (28), as the costs of Lithium batteries for PEVs continue to fall.
Figure 4. Cumulative U.S. sales of PEVs by manufacturer, millions of vehicles 2012 – 2018 [32]
0
5
10
15
20
25
30
35
0
100
200
300
400
500
Q1-2012 Q1-2013 Q1-2014 Q1-2015 Q1-2016 Q1-2017 Q1-2018
CumulativeLithiumBatteryDeploym
ents(GWh)
CumulativeUSEV
Sales(ThousandsofVehicles)
EVs<50kWhBattery EVs>50kWhBattery CumulativeUSEVSales
10
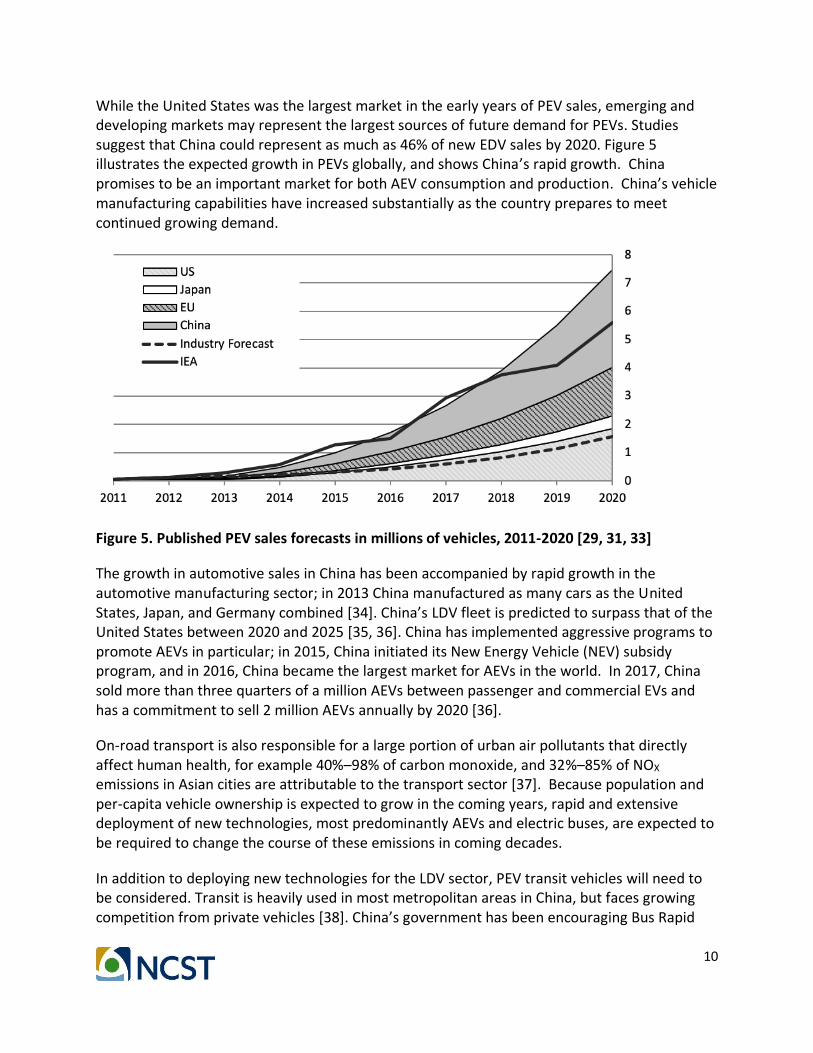
While the United States was the largest market in the early years of PEV sales, emerging and developing markets may represent the largest sources of future demand for PEVs. Studies suggest that China could represent as much as 46% of new EDV sales by 2020. Figure 5 illustrates the expected growth in PEVs globally, and shows China’s rapid growth. China promises to be an important market for both AEV consumption and production. China’s vehicle manufacturing capabilities have increased substantially as the country prepares to meet continued growing demand.
Figure 5. Published PEV sales forecasts in millions of vehicles, 2011-2020 [29, 31, 33]
The growth in automotive sales in China has been accompanied by rapid growth in the automotive manufacturing sector; in 2013 China manufactured as many cars as the United States, Japan, and Germany combined [34]. China’s LDV fleet is predicted to surpass that of the United States between 2020 and 2025 [35, 36]. China has implemented aggressive programs to promote AEVs in particular; in 2015, China initiated its New Energy Vehicle (NEV) subsidy program, and in 2016, China became the largest market for AEVs in the world. In 2017, China sold more than three quarters of a million AEVs between passenger and commercial EVs and has a commitment to sell 2 million AEVs annually by 2020 [36].
On-road transport is also responsible for a large portion of urban air pollutants that directly affect human health, for example 40%–98% of carbon monoxide, and 32%–85% of NOX emissions in Asian cities are attributable to the transport sector [37]. Because population and per-capita vehicle ownership is expected to grow in the coming years, rapid and extensive deployment of new technologies, most predominantly AEVs and electric buses, are expected to be required to change the course of these emissions in coming decades.
In addition to deploying new technologies for the LDV sector, PEV transit vehicles will need to be considered. Transit is heavily used in most metropolitan areas in China, but faces growing competition from private vehicles [38]. China’s government has been encouraging Bus Rapid

11
Transit as a viable mode alternative. Greater diesel bus use could increase transport-related PM and NOx pollution in urban areas, and electrifying the bus fleet has become an important policy goal in China, as evidenced by growth in all-electric bus sales over recent years. China was the primary initial mover into the market for electric buses. In 2010, China adopted a progressive target for bus electrification which increased to 9.9% in 2012 [39-41]. In 2015, China began to rapidly accelerate e-Bus deployments and there are now in excess of 380 thousand electric buses in operation, over 95% of Global e-Bus deployments, in China. While this research focuses on the LDV sector, the availability and impacts of battery materials and technology will certainly be influenced by demand in the non-LDV sector for the same materials.
Both passenger and transit PEV sales have been increasing dramatically year over year since 2011. Between 2011 and September 2014 a total of 76,755 PEVs were sold in China, consisting of 53,816 AEVs (including buses), and 22,939 PHEVs [40, 42]. Table 2 shows annual sales for PEVs (broken down between all-electric and plug-in hybrids, and including buses) for the year 2011-2013. In 2011, PEV sales constituted 0.04% of new car sales [43]. 2012 showed a 57% increase over 2011, followed by an additional 38% increase in 2013, and a 116% increase in just the first nine months of 2014. Though complete data for the 2014 is not available, by the end of September 2014, PEV sales reached a record market share of 0.22% out of the 17 million new cars sold [42].
Table 2. PEV Sales in China from 2011 to September 2014
All-electric Plug-in hybrids
Total % Increase from previous year
Sources
2011 5579 2,580 8,159 -- [44]
2012 11,375 1,416 12,791 57% [45]
2013 14,604 3,038 17,642 38% [46, 47]
2014 (up to Sept.) 22,258 15,905 38,163 116% [40, 48, 49]
These increased sales are matched with significant increases in EDV production in China. As shown in Table 3, EDV production has also increased dramatically in recent years; in 2013, domestic production was more than double imports. Production of EDVs between January and August of 2014 reached 31,137 units, up 328% from the same period of 2013. This growth has been propelled in part by government support and new incentives offered in the last year [50].

12
Table 3. The production of PEVs and HEVs in China in 2012 and 2013 [39]
Type of vehicle 2012 2013 % Increase from previous year
all vehicles 28,311 35,730 26%
E-buses 1,682 1,695 0.8%
E-Sedan/Passenger 9,555 14,253 49% E-Trucks 1,872 2,009 7%
plug-in hybrid buses 5,786 8,315 44%
hybrid cars 8,454 9,458 12%
hybrid trucks 962
--
total production
16,631 --
This upward trend in EDV adoption is expected to continue; the Chinese government’s 2020 goal is to have five million AEVs on the road, and produce one million annually [51]. According to a report from the Ministry of Industry and Information Technology of China, the number of PEVs on the road in 2015 and 2020 is projected to be 2.25 million and 15 million. This could have important implications for the both the deployment of AEVs globally, and their emissions reduction potential compared on a life cycle basis with conventional vehicles [10].
Penetration of all types of PEVs into the Chinese market could significantly impact both the total deployed stock and global manufacturing capacity. This could in turn have important implications for the both the market penetration of PEVs, the demand for automotive materials, and the environmental impacts of vehicle use globally. Thus, not only is China important for understanding deployment, but China is also critical for understanding the contribution of manufacturing emissions from the vehicle life cycle. Recognizing the global significance of PEV manufacturing and consumption in China, this research focuses on the Chinese PEV manufacturing for domestic consumption.
PEV Manufacturing and Operation in China and the United States
Manufacturing in China not only provides goods for consumers worldwide, but also accounts for a significant portion of employment and economic activity [52]. In 2002, the value-added by the Chinese automotive sector was $19.1 billion, constituting 6% of all value added from manufacturing [53]. And since then, the annual growth rate for the industry has been on the order of 10%–20%. Demand for vehicles has been growing rapidly in China over the last decade, with 20% annual growth since 2009. Worldwide, total primary energy consumption in 2011 was 520 quadrillion Btu (quads), with the United States and China constituting 39% of global energy consumption, including 98 quads in the United States and 104 quads in China [54]. The industrial sectors of each country constituted a large fraction of total energy consumption; 31% of total U.S. delivered energy [55], and approximately 70% of total primary energy consumption in China [56, 57]. On its own, the automotive manufacturing sector merits research, but it also has a cascade effect that may serve as a multiplier for environmental

13
sustainability, because it affects many supplier industries and leads the way for innovations in other manufacturing sectors.
China’s electric power and industrial sectors exhibit a great deal of heterogeneity across regions in terms of primary energy consumption [58] and emissions factors for air pollutants [59]. This is due in part to regional variability in the energy resources used and in the implementation of emission control technologies [60]. This heterogeneity will lead to effects across the supply chain and vehicle life cycle, with particularly strong effects for PEV manufacturing and operation. While heterogeneity complicates modelling, it also is an opportunity to identify preferable sites for production and deployment, or the most effective strategies for reducing impacts over the entire life cycle. This is particularly true if we consider the changing electricity fuel mix and that vehicle operation will continue for at least a decade or more after a vehicle enters the fleet. Thus a life cycle-based, spatially explicit, and temporally dynamic model of China’s electricity grid is required to support life cycle modelling of PEV manufacturing globally and PEV use in China. Regional variation in the emissions intensity of grid electricity makes assessing the reduction potential of grid-tied EDVs challenging [61].
14
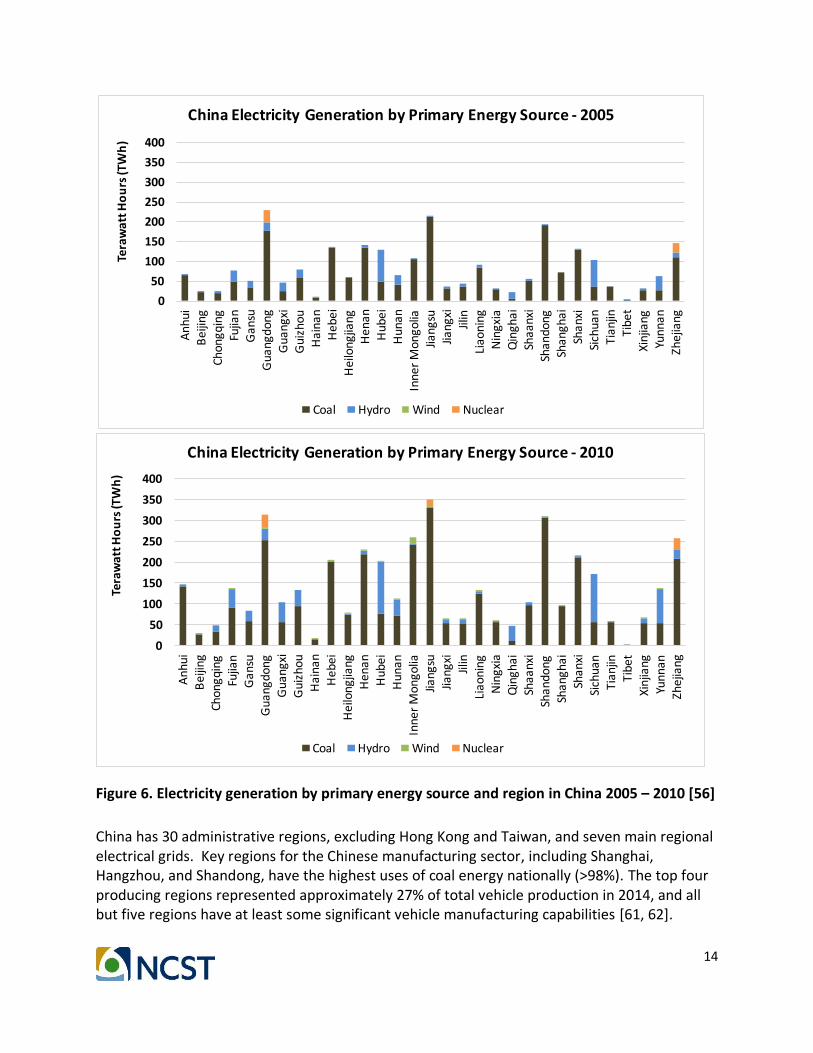
Figure 6. Electricity generation by primary energy source and region in China 2005 – 2010 [56]
China has 30 administrative regions, excluding Hong Kong and Taiwan, and seven main regional electrical grids. Key regions for the Chinese manufacturing sector, including Shanghai, Hangzhou, and Shandong, have the highest uses of coal energy nationally (>98%). The top four producing regions represented approximately 27% of total vehicle production in 2014, and all but five regions have at least some significant vehicle manufacturing capabilities [61, 62].
0
50
100
150
200
250
300
350
400
Anhui
Beijing
Chongqing
Fujian
Gansu
Guangdong
Guangxi
Guizhou
Hainan
Hebei
Heilongjiang
Henan
Hubei
Hunan
InnerMongolia
Jiangsu
Jiangxi
Jilin
Liaoning
Ningxia
Qinghai
Shaanxi
Shandong
Shanghai
Shanxi
Sichuan
Tianjin
Tibet
Xinjiang
Yunnan
Zhejiang
TerawattHours(TWh)
ChinaElectricityGenerationbyPrimaryEnergySource- 2005
Coal Hydro Wind Nuclear
0
50
100
150
200
250
300
350
400
Anhui
Beijing
Chongqing
Fujian
Gansu
Guangdong
Guangxi
Guizhou
Hainan
Hebei
Heilongjiang
Henan
Hubei
Hunan
InnerMongolia
Jiangsu
Jiangxi
Jilin
Liaoning
Ningxia
Qinghai
Shaanxi
Shandong
Shanghai
Shanxi
Sichuan
Tianjin
Tibet
Xinjiang
Yunnan
Zhejiang
TerawattHours(TWh)
ChinaElectricityGenerationbyPrimaryEnergySource- 2010
Coal Hydro Wind Nuclear

15
Increased energy demands for vehicle production, combined with high-carbon electricity for vehicle charging, is unlikely to deliver any climate reductions. That being said, many Chinese cities may pursue electrification due to the local environmental quality benefits.
Due to the rapid growth of the Chinese economy and energy demand, we can observe the share of coal generation in China growing even as hundreds of gigawatts of renewable generating units were brought on line (Figure 6). Just as in the United States, regional variation in electricity grid emissions could significantly affect the potential for PEV deployment to achieve GHG emissions reduction targets. Emissions reductions are likely dependent on significant penetration of renewables into the utility grid [63]; even on the U.S. grid, which likely has a much lower average emissions factor than China’s, PEVs will have little impact on transportation emissions nationally without significant policy intervention to change electricity fuel mixes [64-66].
Materials and Vehicle Supply Chains
Chinese automotive manufacturing is a very significant share of global vehicle manufacturing capabilities, and is also a vital part of the global automotive supply chain. Chinese automotive manufacturing could significantly determine the burdens of a future global fleet.
Environmental damage and resource shortages are significant risks for automotive supply chains in China [53], and may be exacerbated in the case of PEV production due to the reliance on specific materials for battery production, including cobalt, graphite and lithium, and traction motors which rely on rare earths including neodymium and dysprosium (important for all EDVs). The potential reserves of lithium and cobalt in China are approximately 1.1 and 0.47 million metric tons, respectively. Based on the current utilization of these metals, the future demand for lithium can be expected to reach 0.5 and 0.75 million metric tons in 2020 and 2030, respectively (though imports from South America are common even today), and the cumulative demand of cobalt will exceed domestic reserves by 2018 [67, 68]. Graphite, which is a relatively abundant mineral, may not face shortages due natural resources, but it is responsible for air quality issues that have led to restrictions on production in China [69, 70].
Recycling of PEV batteries is one way to address future material shortages, reduce the quantity of waste generated during PEV retirement, and reduce the long-term environmental impacts of PEV adoption. Yet it is unclear when recycling will become economically viable, or even when recycling becomes viable for some components of PEV batteries, indicating some components may not be economically recovered and used. Currently, nickel and cobalt are the two valuable metals recovered in Li-ion battery recycling, while lithium is lost to slag. Today, the only beneficial use for recovered lithium is as a low-value additive in concrete, eliminating it as a resource for battery production or other higher value uses does is not economically viable in the short term. Though it is possible to use the hydrometallurgy process to recover lithium, the costs of the process, relative to the price of primary lithium, are much higher [71].

16
Conclusion and Future Research
This research on China is being integrated into the coupled system dynamics and LCA model in two important ways:
(1) Modeling the Chinese PEV fleet over time is crucial because of its large global market share, and because operating emissions are dependent on electricity grid composition. Modeling regional electricity grids over time is also of critical importance.
(2) Because of China’s dominance in automotive component manufacturing and vehicle batteries in particular, the LCA models for vehicle production require the representation of supply chain productions stages that occur in China

17
Development of Supporting Data for LCA of PEV Materials and Understanding the Robustness of Estimates of Changing Demand and Background Systems1
A number of enabling technologies for PEVs may increase production-related environmental effects when compared to ICEVs [8]. These include use of lightweight materials and the production of electric powertrain components including batteries and electric motors, which contribute to higher energy use, GHG emissions, and resource consumption. A life cycle perspective is required to understand the importance of manufacturing, and hotspots for impact and cost.
Two rare earth elements (REEs) – neodymium (Nd), a light REE (LREE), and dysprosium (Dy), a heavy REE (HREE) – are used in electric drive motors within neodymium iron boron (NdFeB) permanent magnets. Few LCAs have been conducted on REEs, and especially HREEs. This research developed the key underlying datasets to support PEV LCA modeling. At the time this research was completed, only one previously published LCA study existed for HREE production. This study collected primary data from producers and made improvements to modeling of current and future electricity generation in the producing regions.
China is the world’s largest REE producer, and while most production is concentrated in the Bayan Obo mine, Bayan Obo produces mostly LREEs. Among China’s rare earth reserves only one of them is rich in HREEs, namely the ion-adsorption clay deposits in southern China. These are also the world’s primary source of HREEs, accounting for more than 80% of world’s total production of HREEs [72, 73]. The ion-adsorption deposits were first discovered in Ganzhou, China, in the 1970s. This particular type of deposit is sparsely distributed across seven adjacent provinces of southern China, including Jiangxi, Guangdong, Fujian, Zhejiang, Hunan, Guangxi, and Yunnan. Unlike other rare earth minerals which exist in a solid state phase, the HREEs in ion-adsorption ores are simply adsorbed on the surface of clay minerals with rare earth oxide (REO) concentrations ranging from 0.05%–0.2% and they are readily extractable by simple chemical leaching techniques. Though the grade of ion-adsorption ores seems low, the ion state of REEs in these ores makes extraction and processing easier and more economical than mining from traditional HREE ores (bastnaesite and monazite) [74-76]. Despite the low concentration in these clays, a large amount of ion-adsorption clay minerals have been mined due to the increasing demand of HREEs, by both China and the rest of the world. REOs from ion-adsorption clays have accounted for 35% of the China’s total rare earth production since 2009 [75].
Though LCA has been widely used as an assessment tool for many economically important materials, only a handful of recent studies investigate the environmental impacts of REO/REE production, most of which are based on the Bayan Obo mine [77-80]. In general, few studies
1 This research was conducted by Huijing Deng under combined funding from the National Science Foundation. This research is fully documented in her dissertation, which was filed in Fall 2017. What is provided here is a summary of the work highlighting findings that are important to this project.

18
have focused on the mine production of medium and heavy REOs, though they have more applications and are of higher value than LREEs. In fact, only one study has previously characterized heavy REO production using LCA [81]. Other studies have considered the process route for heavy REO and environmental impacts caused from producing heavy REO, but not from a LCA perspective [75, 82-84].
This study provides a new publicly available life cycle inventory (LCI) and LCA results to the small but growing body of work characterizing the life cycle impacts of heavy REO production based on primary data collected at four rare earth mining sites in Jiangxi Province, southern China.
Methods
Primary data on REO production from ion-adsorption clays were collected in a field study conducted in October 2016 in southern China with the goal of creating an original LCI dataset for HREEs. Data from four mining sites in Ganzhou city, Jiangxi Province were collected. The data provided by cooperating companies included chemical, water, and energy inputs. Four sets of data (one from each site) were then compiled into range values, with the lowest number presenting the lower range and likewise for higher range. Some data were provided in terms of monetary costs and were converted to quantity using the current market price. For example, electricity use for producing one ton of REO is 2,600 Chinese dollars (RMB), which is then converted to 4,300 kWh given the electricity price for industrial use in Jiangxi Province is 0.6 RMB per kWh. Table 4 presents data collected for producing 1 ton of REO from ion-adsorption clays in the field survey.
Table 4. Raw data for production of 1 ton of REO from ion-absorption clays
Site 1 Site 2 Site 3 Site 4 unit
ammonia sulfate 4-6 7-8 6.5-6.8 10 t
ammonia bicarbonate
6 6 3.3-3.6 5 t
sulfate acid 1 1 0.2-0.4 0.5 t
oxalic acid 2 2 2.5 t
Water 1000 2500 t
Electricity 4300 kWh Calcination 4500 kWh
*market price for electricity in industrial use is 0.6 RMB per kWh
Since the mining happens in China, the Chinese Lifecycle Database (CLCD) [85] was the preferred database for life cycle inventory (LCI) dataset acquisition, though some datasets were taken from Ecoinvent, a common commercial LCI database, when not available in the CLCD. Process emissions were not available as primary data from producers. Instead, process emissions to air and water were estimated. Estimation of direct process emissions are based on the regulated upper limit in the Emission Standards of Pollutants from Rare Earth Industry

19
published by the Ministry of Environmental Protection, the People’s Republic of China [86]. While many environmental impacts were included in the LCA, only primary energy consumption and GWP are included in this report.
Results
Results in this study are reported as a higher and lower bound that reflect the range of results for the reporting sites, since specific data points cannot be reported due to confidentiality agreements with reporting companies. These results are compared to the one other published study that considered a similar production system, but relied entirely on modeled rather than primary data from producers (Table 5). The contributions to these impacts are dominated by the mining and extraction stage.
Table 5. Impact assessment results for producing 1 kg of heavy REO
Impact Category Unit This study Vahidi et al.
Low range High range
Study details
Functional unit 1 kg of REO from ion-adsorption clays, 90% purity
1 kg of REO from ion-adsorption clays, 90%– 92% purity
LCI Database CLCD Ecoinvent 3
Primary energy MJ 269.67 442.60 255 – 388
Non-renewable energy
MJ 247.66 408.00
GWP100 kg CO2 eq 18.80 33.11 20.9-35.5
The results for Vahidi et al. [81], estimated based on theoretical calculations, are surprisingly similar to this study’s findings. The confirmation based on primary data is heartening, since it means that simulated or calculated data may reasonably represent actual production activities. However, as one of the goals of this work is to ensure that the temporal and spatial heterogeneity can be reasonably handled when LCA is used in a regulatory environment, the effect of China’s rapidly changing electricity grid was also tested. Table 6 shows the expected changes to Jiangxi, China’s electricity mix over time.
20
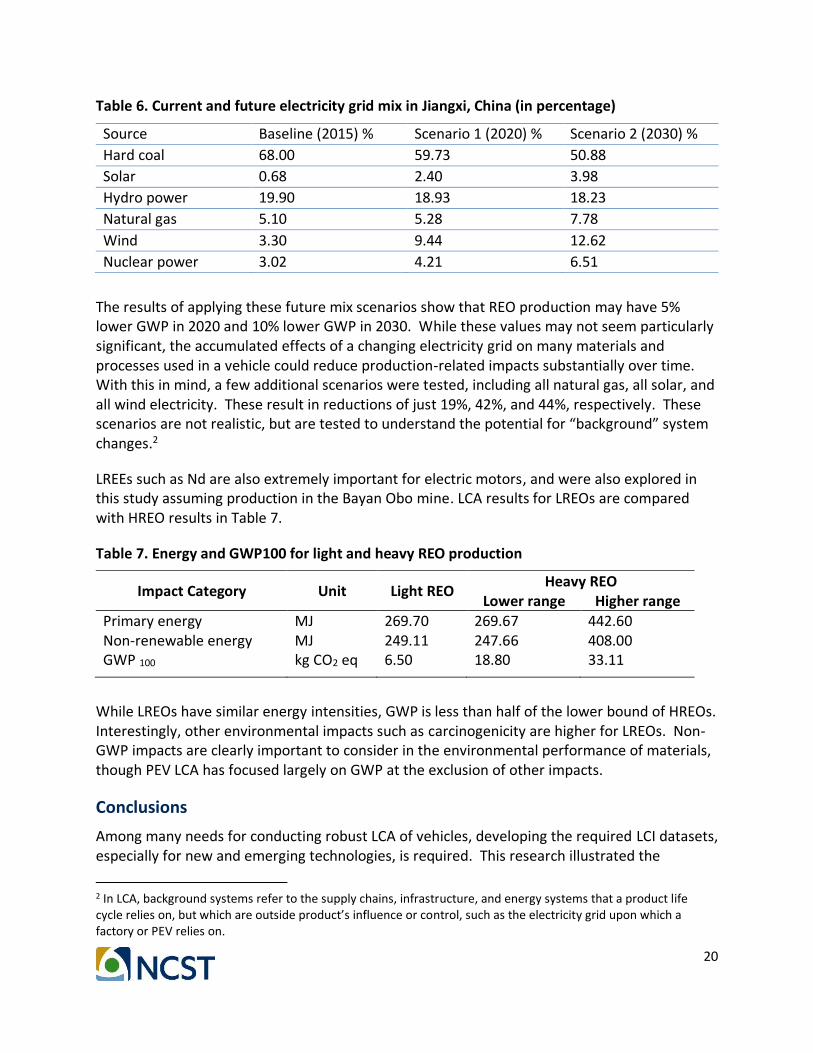
Table 6. Current and future electricity grid mix in Jiangxi, China (in percentage)
Source Baseline (2015) % Scenario 1 (2020) % Scenario 2 (2030) %
Hard coal 68.00 59.73 50.88
Solar 0.68 2.40 3.98
Hydro power 19.90 18.93 18.23
Natural gas 5.10 5.28 7.78
Wind 3.30 9.44 12.62
Nuclear power 3.02 4.21 6.51
The results of applying these future mix scenarios show that REO production may have 5% lower GWP in 2020 and 10% lower GWP in 2030. While these values may not seem particularly significant, the accumulated effects of a changing electricity grid on many materials and processes used in a vehicle could reduce production-related impacts substantially over time. With this in mind, a few additional scenarios were tested, including all natural gas, all solar, and all wind electricity. These result in reductions of just 19%, 42%, and 44%, respectively. These scenarios are not realistic, but are tested to understand the potential for “background” system changes.2
LREEs such as Nd are also extremely important for electric motors, and were also explored in this study assuming production in the Bayan Obo mine. LCA results for LREOs are compared with HREO results in Table 7.
Table 7. Energy and GWP100 for light and heavy REO production
Impact Category Unit Light REO Heavy REO
Lower range Higher range Primary energy MJ 269.70 269.67 442.60 Non-renewable energy MJ 249.11 247.66 408.00 GWP 100 kg CO2 eq 6.50 18.80 33.11
While LREOs have similar energy intensities, GWP is less than half of the lower bound of HREOs. Interestingly, other environmental impacts such as carcinogenicity are higher for LREOs. Non-GWP impacts are clearly important to consider in the environmental performance of materials, though PEV LCA has focused largely on GWP at the exclusion of other impacts.
Conclusions
Among many needs for conducting robust LCA of vehicles, developing the required LCI datasets, especially for new and emerging technologies, is required. This research illustrated the
2 In LCA, background systems refer to the supply chains, infrastructure, and energy systems that a product life cycle relies on, but which are outside product’s influence or control, such as the electricity grid upon which a factory or PEV relies on.

21
feasibility of developing the needed data and tested the effects of expected changes over time, such as those from changing electricity grids. The changes resulted in only modest shifts in GWP, though scenarios involving improbable changes to electricity provision showed more significant changes. REEs are just one category of materials among many that must be modeled for robust LCA. Other materials with less concentrated production will have to content with spatial heterogeneity of production in the determination of an appropriate LCI. Some more conventional materials, such as magnesium and aluminum, suffer from dramatic differences in LCIs depending on the technology and location of production, for example. Agreement on how to model these (such as using global averages, versus carbon intensity values for company-specific sourcing) will need to be developed.
Future Work
LCA requires that a comprehensive group of environmental impacts be considered. Increasingly, the issue of “conflict minerals” has come to light, and particularly in the context of cobalt used in battery chemistries ([87-89], among others). The life cycle-based regulatory reform for vehicles as typically conceived, is just focused on carbon intensity. There may be demand from consumers (and an ethical duty on the part of companies and governments) to consider issues of environmental justice and social impact. So-called “social LCA” may be an appropriate, complementary tool to consider in addressing the issue of mineral supply chains. From the standpoint of developing better life cycle data, mineral and resource traceability may better support supply chain modeling in the context of environmentally-oriented LCA.

22
Life-cycle Based Regulatory Reform for the LDV Sector
To achieve deep reductions in GHG emissions, we need new policies that consider emissions in a systemic and systematic way. For vehicle emissions regulation, the challenge is to reconcile the tension between a need for simplicity and transparency in developing implementable and enforceable policy, and the desire for scientific accuracy in emissions accounting (for the purpose of verifying that real reductions in GHG emissions are achieved). As indicated previously, the historical regulatory focus on fuel economy, tailpipe emissions, and, more recently, low carbon fuels, has reflected the reality that vehicle operation dominates GHG emissions from ICEVs. However, as vehicles become more efficient in operation and as new vehicle powertrain technologies, new fuels, and new energy carriers (e.g., electricity or hydrogen) become common, the long-standing focus on the operation life cycle stage of vehicle emissions may be insufficient for successful policy. Instead, future policy may need to consider the entire life cycle of both vehicles and transportation fuels to achieve real emissions reductions.
We review previous attempts at integrating LCA or life cycle thinking in policies and standards to assess the mechanisms used and their successes and failures.
Review of Life Cycle-Based Policies
LCA has emerged as a tool to quantitatively assess the environmental impacts of a product over its entire value chain [90]. It has historically been used to assess and compare the environmental impacts of products, or has been used to improve product environmental performance by identifying hotspots and informing the product development process. LCA and life cycle-based policies have begun to gain traction in Europe, but less so in the United States. However, in 2009, California adopted the Low Carbon Fuel Standard (LCFS), which regulates the liquid transportation fuels sold in the state and was the first regulation anywhere to use life cycle-based calculations to limit GHG emissions. As is evident in this review, biofuel-related policies, such as the LCFS and many other GHG mitigation policies for the transport sector, have been instrumental in implementing life cycle thinking or life cycle regulations in the United States and around the world. Many biofuel policies began with a focus on volumetric targets, only to be amended to reflect the need for life cycle GHG intensity factors to actually achieve the GHG mitigation goals these policies were developed to address.
This study reviews current policies that employ LCA or life cycle thinking in the United States, Europe, and other countries. Both voluntary and mandatory policies are analyzed, but only policies and labeling programs developed with, or sponsored by, governments or governmental bodies (i.e., the European Commission) are considered. Labeling programs or certificate programs that employ life cycle methods are also reviewed. Though the scope of this review is intended to be comprehensive, policies or regulations not available in English have been excluded.

23
United States
Renewable Fuel Standard
The Energy and Independence Act of 2007 (EISA) expanded existing federal biofuels mandates and elaborated the Renewable Fuel Standard (RFS), which was initially passed in 2005 [91]. The RFS was created to reduce GHG emissions, lower the country’s dependence on foreign oil, and strengthen the renewable fuels sector [92]. Volume requirements to replace or reduce the amount of petroleum transportation fuel were created. EISA extended RFS requirements out to the year 2022, expanded the volumetric requirement to 36 billion gallons, clearly defined the criteria for a fuel to be labeled a renewable fuel, and specified allowances and types of waivers [92]. As part of the evolution of RFS, biofuel categories were developed, driven in part by a reliance on corn starch ethanol which was shown to have minimal GHG benefits over gasoline, or even increase GHG emissions.
The biofuel categories developed include: advanced, total renewable, biomass-diesel, and cellulosic biofuels [93]. To qualify for particular biofuel categories, different life cycle GHG reduction requirements relative to 2005 petroleum-based fuels are required [94, 95]. For example, for a fuel to be labeled an advanced biofuel, it must reduce GHG emissions by 50% on a life cycle basis. The EPA calculates the life cycle GHG emissions from various biofuels to determine the feasibility of the threshold requirements. In addition to considering the full supply chain emissions of biofuels, consequential or indirect emissions are also required to be considered in the context of land use change. Both direct land use change (LUC) and indirect land use change (iLUC) emissions are included in EPA estimates [95]. This is an important development because it provides precedence for including indirect emissions, not derived directly from a product’s supply chain, in a regulatory framework. As with many biofuel policies and standards, new fuels or pathways can be proposed by producers and a life cycle GHG assessment is performed by the producer or responsible agency, here the EPA, to determine the category it belongs under [96].
The Low Carbon Fuel Standard
The Low Carbon Fuel Standard (LCFS) is a market-based life cycle GHG policy for transportation fuels enacted in California in 2009. It is administered by the California Air Resources Board (CARB) and requires transportation fuel providers to reduce the sales-weighted carbon intensity of fuels by 10% by 2020. A 2018 amendment proposes a 20% carbon intensity reduction by 2030. For each fuel considered by the LCFS, a life cycle-based GHG estimate per MJ of fuel, or carbon intensity, is required.
CARB selected the CA GREET model, developed by the Argonne National Laboratory, as the primary calculation method for estimating carbon intensity [97]. As with the RFS, updates since its inception include a method for implementing iLUC “adders” for some biofuel feedstocks, and allowing gasoline and diesel fuel producers to gain credits for emission reductions [98]. Producers can self-report their carbon intensity values based on a pathway analysis [99], but they also have the option to use the assigned values for the fuel pathways that CARB

24
calculates using the CA GREET model. LCFS crediting has also been expanded to included electricity and hydrogen refueling stations and aviation fuels. As evident in this review, the option to take default values versus presenting independent, product-specific carbon intensity estimates is a common feature in similar policies in the United States and elsewhere.
The LCFS features a credit trading system to give flexibility to the producers. Other states and countries are working on or currently enforcing a low carbon fuel standard such as Oregon’s Clean Fuels Program [100], and a LCFS in British Columbia [101].
LCA in Other U.S. Policies and Communications
Several U.S. government agencies have started to use LCA to inform their decisions and to communicate with the public. The California Environmental Protection Agency uses LCA to calculate the impacts of different hazardous waste management systems [91]. In 2009, the California Oil Recycling Enhancement Act was passed and required a LCA to be performed on California’s “used lubricating and industrial oil management process”. The Oregon Department of Environmental Quality created an inventory of GHG emissions from the consumption of goods and services by Oregon households and governments [100], they also conducted a life cycle inventory for packaging options for shipments [91, 102].
The EPA Safer Choice Program has implemented LCAs to communicate the environmental and health impacts of desktop computer displays, soldering equipment, lithium-ion batteries, and wire cable insulating and jacketing [92].
Europe
Environmental policies in Europe began including life cycle thinking throughout the 2000s. In 2001, the European Commission adopted the green paper on Integrated Product Policy (IPP) [103]. IPP is not a specific policy, but a framework for allowing policies minimizing the environmental impacts of a product’s life cycle to be created. Later communications from the European Commission established the relationship between IPP and life cycle thinking [103]. The IPP concept began to gain momentum and policies under this overarching directive were passed. One such policy was the development of Product Category Rules (PCRs) and Environmental Product Declarations (EPDs), which provide standardized methods and reporting for characterizing the life cycle performance of products. PCRs are a specific set of requirements and guidelines that any EPD must follow for one or more product categories [104], and the EPD is the outcome of a PCR applied to a particular product.
The method for producing and reporting an EPD, or Type III environmental declaration, is defined in the International Organization for Standardization (ISO) 14025 standard. There are five steps in creating an EPD. First, a simplified or streamlined LCA is conducted to identify the relevant hotspots. Stakeholders then formulate the product category rules and then a certified third party conducts a review. This could include prescribing what data is required and how it must be collected and reported and what impact categories should be considered. A detailed
25
LCA is done and an EPD is drafted by the program operator. An independent verification of both the associated LCA and the EPD is then completed [105].
EPDs have been adopted reasonably widely in the European Union and in Japan, and regulators have begun to set goals for requiring EPDs on consumer goods such as France’s Grenelle Environmental [106]. A criticism of EPDs has been the existence of overlapping and duplicate PCRs supervised by different program operators, because program operators are private sector entities that do not need to coordinate activities [107]. In addition to overlapping PCRs in a single region, the regionalization of PCRs means there is an absence of coordination on an international level as well. In fact, there is no current structure for PCR alignment or harmonization [108]. The resulting confusion has led to the PCR and EPD framework to be used less than initially expected [109]. Getting companies or industry groups to agree and pay the cost of developing a PCR is also a difficult barrier to overcome [110], not to mention the cost to a particular company of generating product-specific EPDs.
Further complicating the landscape of uncoordinated PCR development, the European Commission has laid out new plans for two environmental footprint labels with requirements beginning by the year 2020 [111]. Both the product environmental footprint (PEF) and the organization environmental footprint (OEF) perform a consequential LCA on the product or organization being studied. The PEF program seemingly evolved from the concept of EPDs. In this scheme however, the European Commission takes the place of the program operators in the EU [110]. PEF category rules (PEFCRs) are established to guide the development of PEFs, similar to the EPD/PCR system. Currently, the PEF method is in the last year of its pilot program. The development of the PEF however, has led to criticism [112, 113] primarily due to further confusion and lack of harmonization with the ISO standards for both LCA and EPDs.
One conclusion from the European PCR and EPD experience may be that a single governing body must be developed to ensure coordination of PCR development, at least at the national scale, but preferably international as well. For regions that are just beginning to develop PCRs and EPDs, such as in the Americas, there may be an opportunity to prevent the lack of coordination experienced in Europe.
Fuel Quality Directive and Renewable Energy Directive
Regulations regarding energy production and transportation fuels have begun to incorporate life cycle metrics in Europe. The European Union Renewable Energy Directive (RED) was passed in 2009 to promote the use of renewable resources in both the energy and transportation sector [114]. European Union members are required to meet 20% of their total energy needs through the use of renewables by 2020 [115]. Each country is required to create an Energy Action Plan (EAP) for how they will meet these targets [116]. European Union countries are also required to supply 10% of their transportation fuels from renewable sources under the RED. Different renewable fuel pathways however, are issued different numbers of credits based on their carbon intensity. For example, advanced biofuels are given 2 credits while electricity from renewable energy sources for road transportation are given 2.5 credits [117]. Life cycle carbon

26
intensity calculations are required under the current iteration of the RED. These calculations are performed in the same way for the Fuel Quality Directive described below.
The Fuel Quality Directive was amended to introduce life cycle carbon intensity targets for European transport fuel suppliers. This policy requires a 6% reduction of GHG emissions in fuels by 2020, an additional 2% GHG reduction through supplying PEVs or using GHG reduction technologies such as carbon capture, and another 2% through purchasing of credits from the Clean Developing Mechanism under the Kyoto Protocol [118]. The Fuel Quality Directive is a performance-based standard that uses life cycle GHG emissions calculations to establish a fuel’s carbon intensity; it is essentially the same method and approach as California’s LCFS. Similar to the LCFS, producers can use the average European Union default values or report their own values using a methodology provided by the European Commission.
The conversion of land used for biofuel production and the cascading price effects of using crops for biofuels was found to increase GHG emissions when biofuels were used to replace gasoline, making iLUC a necessary consideration in European biofuel policy (and indeed policy in the United States, as well) [119]. In 2015, the European Commission voted to approve the “iLUC Directive” to account for indirect land use changes from biofuels. To avoid complications from different calculation methods of iLUC, a cap of 7% was placed on biofuels from food crops, meaning only 70% of the renewable fuel target could be met with food crop-based fuels [120].
As with the inclusion of iLUC effects in U.S. policies for biofuels, it would seem that Europe also faced the issue of indirect or consequential emissions that occur outside the supply chain of the regulated product. While the European solution is different than the U.S. solution, it still suggests that complex and indirect processes can be handled in a life cycle-based policy context.
Renewable Transport Fuel Obligation
While a number of European policies and directives exist, countries within Europe can also implement their own policies and regulations. The United Kingdom passed a mandate in 2007 called the Renewable Transport Fuel Obligation (RTFO), which required 5% of all the fuel sold to consist of biofuels. Biofuel producers are required to report their greenhouse gas balance and the environmental impacts of their biofuels. Suppliers must produce a minimum amount of “sustainable” biofuel. Any supplier that provides over 450,000 liters of fuel must meet their obligation. This can be done by supplying biofuels, buying certificates from other biofuel producers, or paying a “buy out” price [121]. In 2010, the RFTO was amended to include biofuels that meet the RED’s Carbon and Sustainability Criteria.
For a biofuel to be considered sustainable, it must achieve 35% GHG emissions savings compared to the petroleum baseline fuel it is presumed to displace and may not be made from raw material obtained from land with a high biodiversity value or a high carbon stock [115]. The savings requirements will shift to 50% in 2017 and 60% in 2018 [115]. These savings are calculated by a carbon calculator created by the U.K. government. The fuel supply chain is

27
defined by the producer and the carbon calculator is used to find the carbon intensity of the fuel. Different modules are provided in the RTFO guidance documents to illustrate the life cycle calculations. A default value is assigned to producers if they do not want to perform these calculations.
End-of-Life Policies
Other life cycle-based policies in Europe focus on end-of-life management for products. Many of these policies emerge from the concept of extended producer responsibility (EPR). These types of policies put the responsibility for a product, in particular a product’s disposal, on the producer to provide an incentive for considering environmental impacts of a product after it leaves their production facility. The goal is to encourage improvements during the design stage where reductions can be made easily. While these policies do not explicitly require an LCA, they mandate the consideration of future life cycle stages (after the product has moved into consumers’ hands) forcing life cycle thinking on the designer or producer.
The End of Life Vehicle (ELV) Directive is an EPR policy for the automotive sector throughout Europe. It sets out to prevent waste and mandates that vehicles be made up of 95% materials that are recoverable and 85% that are recyclable [122]. All of the components and materials under the directive’s influence are labeled using ISO standards. Manufacturers must also eliminate the use of specific hazardous materials, pay the costs for delivery to waste treatment centers, and provide systems to collect retired vehicles.
In 2006, the Battery Directive was passed and sought to reduce hazardous materials such as mercury in batteries [123]. It required minimum battery recycling collection rates which would increase in stringency over time. Labeling requirements included the chemical symbols on the battery and a capacity label. LCA studies were used to support this directive and help communicate the environmental and health impacts to the end-users of the batteries.
Another important EPR in Europe is the Waste Electrical & Electronic Equipment (WEEE) Directive, which began in 2003. It has been revised several times and the current iteration became effective in 2014. The goals as stated in the WEEE directive are to prevent electrical and electronic equipment waste and “improve the environmental performance of all operators involved in the life cycle of electrical and electronic equipment” [124]. New collection targets have been established by the current WEEE regulation, with minimum requirements of 45% of the average weight of the EEE placed in the market for 2016, and 65% by 2019.
A similar directive was also developed for packaging and packaging waste. Targets for recovery and recycling were set and require the design of reusable and recoverable packaging. By 2017, the legislation requires the Commission to “assess life cycle impacts on different options to reduce the consumption of lightweight plastic carrier bags and present a legislative proposal together” [115]. These waste policies work together towards the European Union’s goals on waste management and increase the responsibility for producers to multiple life cycle

28
stages. While some LCA studies support these directives, no LCA is directly required for any these policies.
The Eco-Design directive was established by the European Union in 2009 and created a framework for minimum eco-design requirements. All the stages of a product’s life cycle are taken into account and manufacturers must develop an ecological profile. Similar to IPP, the eco-design directive itself does not set efficiency standards, but calls for the creation of new measures specific to each product under regulation. Measures to date have regulated air conditioners, boilers, ovens and refrigerators [125]. This directive was harmonized with the energy labeling directive which was adopted in 2010 and which provided customers with energy consumption information [126].
Labels and Certifications
Through regulation or voluntary measures, environmental labeling has potential to inform and affect consumer choice. It also has the ability to distort environmental information communicated to the consumer. In 2010, 6,902 products sold in the United States had some type of environmental claim, with 89 of them claiming carbon neutrality [127]. Many types of environmental labels exist, all with different requirements and system boundaries such as the European Union Ecolabel, Blue Angel. Of the many labeling schemes that exist, only carbon labeling is discussed here to narrow the focus of discussion.
Carbon labeling schemes have become more popular in the last decade. The Carbon Reduction Label was the first carbon label created. It was implemented in 2006 by the Carbon Trust. Currently, the United Kingdom has two types of carbon footprint labels: a label that reports CO2 emissions and a label that verifies that CO2 emissions have been reduced [128]. The Carbon Footprint label reports life cycle GHG of a given product. In 2013, ISO standard 14067 detailed the requirements for the calculation reporting of the carbon footprint of a product [129]. There are a variety carbon labels with different frameworks, however. For example, in France the Indice Carbone reports emissions on the basis of 100 g of product, regardless of the product [128].
Many other guidelines follow those outlined in PAS 2050, a specification for the assessment of GHG emissions developed by the British Standards Institution, such as the German Product Carbon Footprint and the Korean Carbon Footprint. PAS 2050 predates that ISO standard for carbon footprinting. Some have developed their own system like Japan’s Carbon Label which created the TSQ001 [128]. Not all carbon labels are transparent in their methods. Both the Timberland Green Index and Climate Conscious Label do not reveal their calculation methods [128]. A study by Vanclay et al. in 2011 concluded if carbon labels communicated their emission information in a different format, consumers would be more likely to use them [130].
Carbon labels may be relevant for vehicles, especially because labeling in the United States and elsewhere already includes emissions (though not on a life cycle basis) and fuel economy or energy efficiency. As with other policies, determining a standardized method for conducting
29
and reporting outcomes seems to be an area that requires continued evolution and improvement.
Discussion
Despite the prevalence of policies that encourage life cycle thinking, no life cycle-based emissions policies for vehicles were found during this review. Policies that have been implemented with life cycle thinking have largely focused on fuels or vehicle end-of-life. A majority of end-of-life (or waste and disposal oriented) policies do not really provide any significant insights towards the development of a LCA-based standard for vehicles. However, the limited success of these programs can help demonstrate the feasibility or acceptability of particular policy mechanisms. For example, the ELV directive requires the labeling of specific vehicle parts and the effective implementation of recycling performance targets for vehicles. The labeling and careful tracking of parts suggests that accompanying life cycle impact information, for example from EPDs, could be a potential mechanism for estimating life cycle vehicle production emissions.
The Grenelle II was the only legislation found to require EPDs, but voluntary labeling and certification systems, such as the U.S. Green Building Council’s LEED certification system, have helped promote the use of EPDs outside of a purely governmental policy. The emergence of PEF and the associated category rules could undermine the existing progress made by EPDs, but also signals the challenge of developing standardized LCA methods and reporting for products in the absence of a single entity to oversee the system. If efforts to use EPDs in a vehicle policy are made, but a switch to PEFs is made in Europe, an EPD-based vehicle policy could face significant hurdles due to the global supply chain and global market for vehicles. If life cycle-based policies emerge that rely on EPDs, it is imperative that the emergence of PEF or any other framework that competes with or replaces EPDs be considered.
Transportation fuel policies analyzed in this study are the most common example of life cycle-based performance standards. The LCFS in particular illustrates a potential framework for estimating life cycle emissions that conform to common methods and underlying data. Further, the commonly observed trend of allowing producers to opt for default values assigned by government models and estimates, or allowing producers to develop their own analyses (subject to review and verification) illustrates a compromise that can minimize compliance burden for companies or producers unwilling or unable to perform such calculations on their own. There are limitations to applying learnings from fuel policies, and particularly biofuels, to vehicles. First, biofuel production occurs at a smaller scale, and many smaller companies and feedstock producers are involved in the supply chain. Feedstock production in particular is highly variable due to climate and ecology and done at the scale of a farm. On the other hand, vehicles are much more complex than biofuels in terms of the number of parts and suppliers involved in the supply chain, but all are produced at large industrial scales.
Two frameworks for a vehicle policy can be envisioned from the policies reviewed, one that is similar to a LCFS and another that uses EPDs or a similar framework. In the LCFS analogy,

30
default values could be assigned to specific vehicles based on particular characteristics (e.g., weight, powertrain type, etc.) and if manufacturers provided proof of a lower life cycle impact, they could submit their product’s pathway to certify at a lower level. The GREET 2 model could be used once the bill of materials is collected from each manufacturer to calculate the different environmental impacts.
The other framework would require a PCR to be developed for passenger vehicles. This would outline the data requirements and the system boundary. An EPD could then be constructed from the PCR for passenger vehicles, which would be made up of EPDs from the various vehicle parts. Both of these frameworks could require immense data collection efforts. In both cases uncertainty should be addressed because unintended consequences could result in product’s emitting significantly more emissions than reported, especially where producers can opt for a default value. Studies have proposed using a weighted mean or a specific percentile of a product’s probability distribution of emitting more emissions than the baseline [99, 131].
Current U.S. Vehicle Emissions Policies and their Relation to Life Cycle Emissions
Conventional vehicle emissions policies in the United States predominately focus on stimulating technological change; they function by subsidizing research and development of new technologies (e.g., technology push/forcing), and creating new markets by subsidizing consumer adoption (e.g., technology pull). California’s ZEV program, federal plug-in vehicle tax credits, state rebates, and HOV lane access for vehicles incorporating particular technologies were all designed with the goal of leveraging early technology development and market deployment. While CAFE and fuel blending policies are cited as measures to increase efficiency and energy independence, increasingly the goal of these policies is to decrease the carbon intensity of passenger vehicle travel. The next generation of vehicle emissions policies will have to transition from a focus on stimulating technology development and deployment to a focus on technologies that result in real emissions reductions, which may require life cycle-based policies.
The current harmonized U.S. CAFE and EPA GHG standards require reductions of per mile CO2
emissions of about 4% per year through 2025 for the LDV fleet. This policy is expected to produce a 50% reduction in emissions rates for new vehicles. Because the standards are based on vehicle size (footprint), a shift in the vehicle mix towards larger vehicles could reduce the magnitude of potential improvement. Credits for alternative fuel and advanced technology vehicles that consider these technologies as true ZEVs, may further reduce the overall emissions reduction potential of CAFE.
To accomplish an 80% reduction in LDV emissions by 2050, vehicles will likely need to shift mostly to electric propulsion, using batteries and electricity, and hydrogen and fuel cells. Companion rules for criteria emissions (LEVIII/Tier3) and ZEVs already require aggressive reductions in pollution emissions and, in California and a few other U.S. states, a cumulative target of 3.3 million ZEVs on the road by 2025. New suppliers have emerged, Tesla being the most notable, despite the significant barriers to entry into the vehicle manufacturing market.

31
While these disruptions are likely to continue, existing manufacturers and fuel suppliers are likely to play a dominant role in future ZEV production.
A key question for future policy is the extent to which life cycle approaches are integrated in to vehicle emissions assessment. Vehicle manufacturers alone are unlikely to bear the entire burden of compliance for decreasing the environmental impacts of material provision or fuel production. But policy still needs to incentivize innovation in the transportation fuels space, and encourage vehicles that take advantage of low carbon fuels. Policy may also want to consider technologies that affect the way and the extent to which vehicles are used. Increasing load factors, or decreased VMT, may be another viable emissions mitigation strategy, but one that lies outside the scope of current regulation.
There are considerable logistic and administrative challenges to regulating on-road vehicle performance and vehicle production pathways in a consolidated context. Credit systems are likely to be integral to any life cycle-based policy, particularly for addressing product changes near to or outside the system boundary of the policy. In life cycle analysis, displacement is a technique used when system expansion is infeasible or unavailable; it involves giving credit for co-products of a system that have value or displace other inputs from another product system. Displacement is generally viewed as a less desirable method, and encounters similar issues to those raised above for credit systems; system expansion is always preferred [9]. The main challenge is that in a policy setting, system expansion can come up against exponentially increasing costs of verification and jurisdictional boundaries across sectors.
A broad set of policies are needed to orchestrate a transition to low carbon vehicles, and performance-based evaluation with comparison to a relative or evolving scale is critical. This requires appropriate measurement and verification, understanding of the relevant system boundaries for consequential impacts, and technology agnostic functional unit. The strategies OEMs will use to identify major drivers of emissions and cost effective reductions in their product’s value chain, need to be incorporated into LCA models that start with policy action and end with environmental performance of the vehicle system. In order to be agnostic to technological innovation in the vehicle and fuels market, all technologies need a level playing field and a clear set of targets to achieve. The progressive benchmark or performance standard from a policy perspective is the main accountability or control measure; the “stick” that compels change. Policy may play an important role in initiating data collection, or managing data such that regulators can get a clearer picture of how vehicles are used.
Conclusions
The need for incorporating life cycle thinking into vehicle emissions policy is increasingly clear. LCA allows for comparison of tradeoffs between inputs and outputs of product systems across important policy metrics. Consideration of the entire lifecycle of both vehicle systems and transportation fuel pathways is essential to achieving emissions reductions from continued technological development.

32
References
1. EPA. Greenhouse Gas Invetnory Data Explorer. 2015 4/30/2015 [cited 2016 July 29]; Available from: https://www3.epa.gov/climatechange/ghgemissions/inventoryexplorer/chartindex.html.
2. Sims, R., et al., Transport, in Climate Change 2014: Mitigation of Climate Change. Working Group III Contribution to the IPCC 5th Assessment Report. 2014, The Intergovernmental Panel on Climate Change: Brussels.
3. Ambrose, H. and A. Kendall, Effects of battery chemistry and performance on the life cycle greenhouse gas intensity of electric mobility. Transportation Research Part D: Transport and Environment, 2016. 47: p. 182-194.
4. Archsmith, J., A. Kendall, and D. Rapson, From cradle to junkyard: assessing the life cycle greenhouse gas benefits of electric vehicles. Research in Transportation Economics, 2015. 52: p. 72-90.
5. Ambrose, H., Effects of cycle-life on the life cycle of EV traction batteries, in International Society of Industrial Ecology Biennial Conference. 2015: Guildford, England.
6. Price, L., Using uncertainty analysis to guide LCA System boundary selection: Passenger vehicle GHG emissions as case study, in International Society of Industrial Ecology Biennial Conference. 2015: Guildford, England.
7. International Organization for Standardization, ISO 14040: 1997, I.T.S. 5, Editor. 1997: Geneva.
8. Guinee, J.B., et al., Life cycle assessment: past, present, and future†. Environmental science & technology, 2010. 45(1): p. 90-96.
9. International Organization for Standardization, ISO 14040 Series: 2006, I.T.S. 5, Editor. 2006: Geneva.
10. Hawkins, T.R., et al., Comparative environmental life cycle assessment of conventional and electric vehicles. Journal of Industrial Ecology, 2013. 17(1): p. 53-64.
11. Samaras, C. and K. Meisterling, Life cycle assessment of greenhouse gas emissions from plug-in hybrid vehicles: implications for policy. Environmental science & technology, 2008. 42(9): p. 3170-3176.
12. Notter, D.A., et al., Contribution of Li-Ion Batteries to the Environmental Impact of Electric Vehicles. Environmental Science & Technology, 2010. 44(17): p. 6550-6556.
13. Lutsey, N. and D. Sperling, Regulatory adaptation: Accommodating electric vehicles in a petroleum world. Energy Policy, 2012. 45: p. 308-316.
14. Kendall, A. and L. Price, Incorporating time-corrected life cycle greenhouse gas emissions in vehicle regulations. Environmental science & technology, 2012. 46(5): p. 2557-2563.
15. Wang, M., The Greenhouse Gases, Regulated Emissions, and Energy Use in Transportation (GREET) Model: Version 1.5. Center for Transportation Research, Argonne National Laboratory, 2008.
16. PE International, GaBi 5. 2013: Leinfelden-Echterdingen, Germany.

33
17. Dunn, J., et al., Material and energy flows in the materials production, assembly, and end-of-life stages of the automotive lithium-ion battery life cycle. 2012, Argonne National Laboratory (ANL).
18. Ellingsen, L.A.W., et al., Life Cycle Assessment of a Lithium‐Ion Battery Vehicle Pack. Journal of Industrial Ecology, 2014. 18(1): p. 113-124.
19. Graff Zivin, J.S., M.J. Kotchen, and E.T. Mansur, Spatial and temporal heterogeneity of marginal emissions: implications for electric cars and other electricity-shifting policies. Journal of Economic Behavior & Organization, 2014.
20. Majeau-Bettez, G., T.R. Hawkins, and A.H. Strømman, Life cycle environmental assessment of lithium-ion and nickel metal hydride batteries for plug-in hybrid and battery electric vehicles. Environmental science & technology, 2011. 45: p. 4548-54.
21. Yuksel, T. and J.J. Michalek, Effects of Regional Temperature on Electric Vehicle Efficiency, Range, and Emissions in the United States. Environmental science & technology, 2015. 49(6): p. 3974-3980.
22. Zackrisson, M., L. Avellán, and J. Orlenius, Life cycle assessment of lithium-ion batteries for plug-in hybrid electric vehicles – Critical issues. Journal of Cleaner Production, 2010. 18: p. 1519-1529.
23. Center, A.F.D. Key Federal Legislation. 2014; Available from: http://www.afdc.energy.gov/laws/key_legislation.
24. Al-Alawi, B.M. and T.H. Bradley, Review of hybrid, plug-in hybrid, and electric vehicle market modeling Studies. Renewable and Sustainable Energy Reviews, 2013. 21: p. 190-203.
25. Becker, T.A., I. Sidhu, and B. Tenderich, Electric vehicles in the United States: a new model with forecasts to 2030. Center for Entrepreneurship & Technology (CET) Technical Brief, 2009(2009.1).
26. Gruber, P.W., et al., Global Lithium Availability. Journal of Industrial Ecology, 2011. 15: p. 760-775.
27. US Department of Energy, One million electric vehicles by 2015 - Status Report. 2011, US Department of Energy. p. 1-11.
28. IEA, EV City Casebook. 2012, International Energy Agency.
29. IEA, Global EV Outlook 2013. 2013, International Energy Agency: Paris, France.
30. Pike, Electric Vehicle Geographic Forecasts. 2012, Pike Research: Boulder, CO.
31. Koslowski, T., Strategic market considerations for electric vehicle adoption in the U.S. 2011, Gartner Publications: Stamford, CT.
32. Center, A.F.D. U.S. Plug-in Electric Vehicle Sales by Model. 2014; Available from: http://www.afdc.energy.gov/data/.
33. Ambrose, H., et al., Driving rural energy access: a second-life application for electric-vehicle batteries. Environmental Research Letters, 2014. 9(9): p. 094004.

34
34. OICA. The International Organization of Motor Vehicle Manufacturers. 2014 [cited 2014 October 26]; Available from: http://www.oica.net.
35. van der Hoven, M., World energy outlook. Paris: International Energy Agency, 2012.
36. Wang, Y., J. Teter, and D. Sperling, China’s soaring vehicle population: Even greater than forecasted? Energy Policy, 2011. 39(6): p. 3296-3306.
37. Dora, C., et al., Sustainable transport: sourcebook for policy makers in developing cities, module 5g. 2011, World Health Organization: Eschborn, Germany.
38. Schipper, L. and W.-S. Ng, Rapid Motorization in China: Environmental and Social Challenges. 2004, Commissioned by the ADB-JBIC World Bank East Asia and Pacific Infrastructure Flagship Study. p. 48.
39. Luo, Y., The domestic and international development and trend of electric vehicles, and its impact to vehicle fuels. International Petroleum Economics, 2014. 5.
40. Junan, G., Automotive industry: September new car sales growth accelerated energy. Wantinews.com, 2014.
41. Gong, H., M.Q. Wang, and H. Wang, New energy vehicles in China: policies, demonstration, and progress. Mitigation and Adaptation Strategies for Global Change, 2013. 18(2): p. 207-228.
42. Xinhua, China auto sales slow, new energy cars outshine. People Daily, 2014.
43. Cars21.com, EV sales increase 103.9% in China in 2012. Electric China Weekly, 2013. Cars21.com(No 17).
44. Manufacturers, C.A.o.A., 5,579 electric cars sold in China in 2011. Wind Energy and Electric Vehicle Review, 2012.
45. Crowne, P. China To Sell Over 4 Million Electrified Vehicles in 2020. 2012 November 23, 2012; Available from: http://www.hybridcars.com/china-set-sell-over-4-million-evs-2020-62718/.
46. Xueqing, J., New-energy vehicles 'turning the corner'. China Daily, 2014.
47. China Auto Web. Plug-in EV Sales in China Rose 37.9% to 17,600 in 2013. 2014 JAnuary 10, 2014; Available from: http://chinaautoweb.com/2014/01/plug-in-ev-sales-in-china-rose-37-9-to-17600-in-2013/.
48. Xinhua, China Focus: Auto sales up 8.4 percent in first half. People Daily, 2014.
49. China BAK Battery Inc. Delegation of Dalian Municipal People's Congress visited China BAK's R&D and Production Base in Dalian. 2014; Available from: http://www.prnewswire.com/news-releases/delegation-of-dalian-municipal-peoples-congress-visited-china-baks-rd-and-production-base-in-dalian-273454041.html.
50. Liping, G., China's Jan.-Aug. NEV production up 328 percent. Xinhua(ECNS), 2014.
51. Reuters, China electric vehicles to hit 1 million by 2020: report, in Reutiers. 2010, reuters.com: Beijing.
52. Duflou, J.R., et al., Towards energy and resource efficient manufacturing: A processes and systems approach. CIRP Annals - Manufacturing Technology, 2012. 61(2): p. 587-609.

35
53. Zhu, Q., J. Sarkis, and K.-h. Lai, Green supply chain management: pressures, practices and performance within the Chinese automobile industry. Journal of Cleaner Production, 2007. 15(11): p. 1041-1052.
54. EIA. International Energy Statistics. 2014 [cited 2014 October 12]; Available from: http://www.eia.gov/cfapps/ipdbproject/IEDIndex3.cfm?tid=44&pid=44&aid=2.
55. EIA. Annual Energy Review. 2013 April 19, 2013; Available from: http://www.eia.gov/totalenergy/data/annual/pdf/sec2.pdf.
56. NBS (National Bureau of Statistics), China Energy Statistical Yearbook. 2010, Beijing: China Statistics Press.
57. Zhao, Y., et al., A comparative study of energy consumption and efficiency of Japanese and Chinese manufacturing industry. Energy Policy, 2014. 70(0): p. 45-56.
58. Kurokawa, J., et al., Emissions of air pollutants and greenhouse gases over Asian regions during 2000–2008: Regional Emission inventory in ASia (REAS) version 2. Atmospheric Chemistry and Physics, 2013. 13(21): p. 11019-11058.
59. Zhao, B., et al., A high-resolution emission inventory of primary pollutants for the Huabei region, China. Atmospheric Chemistry and Physics, 2012. 12(1): p. 481-501.
60. Streets, D. and S. Waldhoff, Present and future emissions of air pollutants in China:: SO2, NOx, and CO. Atmospheric Environment, 2000. 34(3): p. 363-374.
61. MacPherson, N.D., G.A. Keoleian, and J.C. Kelly, Evaluation of a Regional Approach to
Standards for Plug‐in Battery Electric Vehicles in Future Light‐Duty Vehicle Greenhouse
Gas Regulations. Journal of Industrial Ecology, 2014.
62. Veloso, F. and R. Kumar, The automotive supply chain: global trends and Asian perspectives. 2002.
63. Kammen, D.M., et al., Cost-effectiveness of greenhouse gas emission reductions from plug-in hybrid electric vehicles. Environment, 2002. 7(2): p. 155-62.
64. Carley, S., Decarbonization of the US electricity sector: Are state energy policy portfolios the solution? Energy Economics, 2011. 33(5): p. 1004-1023.
65. Babaee, S., A.S. Nagpure, and J.F. Decarolis, How much do electric drive vehicles matter to future u.s. Emissions? Environ Sci Technol, 2014. 48(3): p. 1382-90.
66. Jansen, K.H., T.M. Brown, and G.S. Samuelsen, Emissions impacts of plug-in hybrid electric vehicle deployment on the U.S. western grid. Journal of Power Sources, 2010. 195(16): p. 5409-5416.
67. Zeng, X. and J. Li, Implications for the carrying capacity of lithium reserve in China. Resources, Conservation and Recycling, 2013. 80: p. 58-63.
68. Zeng, X. and J. Li, On the Sustainability of Cobalt Utilization in China. Environmental Science & Technology, Under Review.
69. Behrmann, E., Green Batteries’ Graphite Adds to China Pollution, in Bloomberg, A. Hobbs, et al., Editors. 2014, Bloomberg L.P.: New York, NY.
70. Olson, D.O., 2012 Minerals Yearbook: Graphite [Advance Release]. 2013

36
USGS: Washington, DC.
71. Gaines, L., et al., Life-Cycle Analysis for Lithium-Ion Battery Production and Recycling, in 90th Annual Meeting of the Transportation Research Board 2011, Transportation Research Board: Washington, DC.
72. Chi, R., et al., The basic research on the weathered crust elution-deposited rare earth ores. Nonferrous Metals Science and Engineering, 2012. 3(4): p. 1-13.
73. Su, W., Economic and policy analysis of China's rare earth industry. China Financial and Economic Publishing House, Beijing, 2009.
74. Gambogi, J., 2014 Minerals Yearbook in Rare Earths [Advance Release]. 2016, U.S. Geological Survey.
75. Yang, X., et al., China's ion-adsorption rare earth resources, mining consequences and preservation. Environmental Development, 2013. 8: p. 131-136.
76. Yang, F., Situation and policies for China’s rare earth industry. Accessed July, 2012. 7: p. 2012-06.
77. Zaimes, G., et al., Environmental Life Cycle Perspective on Rare Earth Oxide Production. ACS Sustainable Chemistry & Engineering, 2015. 3(2): p. 237-244.
78. Koltun, P. and A. Tharumarajah, Life cycle impact of rare earth elements. ISRN Metallurgy, 2014. 2014.
79. Sprecher, B., et al., Life cycle inventory of the production of rare earths and the subsequent production of NdFeB rare earth permanent magnets. Environmental science & technology, 2014. 48(7): p. 3951-3958.
80. Nuss, P. and M. Eckelman, Life cycle assessment of metals: a scientific synthesis. PLoS One, 2014. 9(7): p. e101298.
81. Vahidi, E., J. Navarro, and F. Zhao, An initial life cycle assessment of rare earth oxides production from ion-adsorption clays. Resources, Conservation and Recycling, 2016. 113: p. 1-11.
82. Zou, G.-l., A comparative study of the different mining and separating technologies of ion-absorbed rare earth from the perspective of production costs. Nonferrous Metals Science and Engineering, 2012. 4: p. 011.
83. Papangelakis, V. and G. Moldoveanu. Recovery of rare earth elements from clay minerals. in European Rare Earth Resource Conference. 2014.
84. Liao, Z., et al., Quality assessment of geological environment of ion-absorbed rare-earth mine in Longnan County. Nonferrous Metals Science and Engineering, 2014. 4: p. 020.
85. Liu, X.W., Hongtao;Chen, Jian, Method and basic model for development of Chinese reference life cycle database. Journal of Environmental Sciences, 2010. 30(10): p. 2136-2144.
86. MEP, Emission Standards of Pollutants from Rare Earths Industry. 2011: Ministry of Environmental Protection of the People's Republic of China.

37
87. Frankel, T.C., The Hidden Cost of Cobalt Mining, in The Washington Post. 2018: Washington, D.C.
88. Frankel, T.C., Companies respond to questions about their cobalt supply chains, in The Washington Post. 2016: Washington D.C.
89. Banza, C.L.N., et al., High human exposure to cobalt and other metals in Katanga, a mining area of the Democratic Republic of Congo. Environmental Research, 2009. 109(6): p. 745-752.
90. Hellweg, S. and L.M.i. Canals, Emerging Approaches, Challenges, and Ppportunities in Life Cycle Assessment. Science, 2014. 244.
91. Reed, D., Life-Cycle Assessment in Government Policy in the United States. 2012, University of Tennessee, Knoxville.
92. EPA. Fuel Pathways under the Renewable Fuel Standard Program. 2015; Available from: https://www.epa.gov/renewable-fuel-standard-program/fuel-pathways-under-renewable-fuel-standard-program.
93. Stock, J., Renewable Fuel Standard:A Path Foward. 2015, Columbia University.
94. Schnepf, R. and B.D. Yacobucci, Renewable Fuel Standard (RFS) Overview and Issues. 2013, Congressional Research Service.
95. Yacobucci, B.D. and K. Bracmort, Calculation of Lifecycle Greenhouse Gas Emissions for the Renewable Fuel Standard. 2009.
96. Christensen, S.S.A., How the Renewable Fuel Standard Works. 2014, International Council on Clean Transportation (ICCT).
97. Argonne National Laboratory, GREET Model: The Greenhouse Gases, Regulated Emissions, and Energy Use in Tranportation Model. 2015: Argonne National Laboratory, Chicago, IL.
98. Lade, G.E. and C.Y.C. Lin Lawell, The design and economics of low carbon fuel standards. Research in Transportation Economics, 2015. 52: p. 91-99.
99. Kocoloski, M., et al., Addressing uncertainty in life-cycle carbon intensity in a national low-carbon fuel standard. Energy Policy, 2013. 56: p. 41-50.
100. Oregon Department of Environmental Quality, Oregon’s 2005 –2014 Consumption -Based Greenhouse Gas Emissions 2016.
101. Yeh, S., et al., National Low Carbon Fuel Standard: Policy Design Recommendations. SSRN Electronic Journal, 2012.
102. Franklin Associates, Life Cycle Inventory of Packaging Options for Shipment of Retail Mail-Order Soft Goods. 2004, Oregon Dept. of Environmental Quality
103. European Commission. Developments Leading to the Green Paper in 2001. 2016; Available from: http://ec.europa.eu/environment/ipp/2001developments.htm.
104. International Organization for Standardization, Environmental labels and declarations — Type III environmental declarations — Principles and procedures. 2006: Geneva.
105. Zackrisson, M., et al., Stepwise environmental product declarations: ten SME case studies. Journal of Cleaner Production, 2008. 16(17): p. 1872-1886.

38
106. Schenck, R., A Roadmap to Environmental Product Declarations in the United States. 2010, ACLCA.
107. Minkov, N., et al., Type III Environmental Declaration Programmes and harmonization of product category rules: status quo and practical challenges. Journal of Cleaner Production, 2015. 94: p. 235-246.
108. Ingwersen, W.W. and M.J. Stevenson, Can we compare the environmental performance of this product to that one? An update on the development of product category rules and future challenges toward alignment. Journal of Cleaner Production, 2012. 24: p. 102-108.
109. Steen, B., et al., Development of interpretation keys for environmental product declarations. Journal of Cleaner Production, 2008. 16(5): p. 598-604.
110. Schenck, R., Status and Opportunities to Support Product Category Rules in the U.S., D.o. Commerce, Editor. 2013, National Institute of Standards and Technology.
111. Galatola, M., Product Environmental Footprint Pilot Phase. 2015, European Comission.
112. Finkbeiner, M., Product environmental footprint—breakthrough or breakdown for policy implementation of life cycle assessment? International Journal of Life Cycle Assessment, 2014. 19.
113. Lehmann, A., V. Bach, and M. Finkbeiner, Product environmental footprint in policy and market decisions: Applicability and impact assessment. Integr Environ Assess Manag, 2015. 11(3): p. 417-24.
114. Whittaker, C., et al., The renewable energy directive and cereal residues. Applied Energy, 2014. 122: p. 207-215.
115. European Commission, Directive (EU) 2015/720 of the European Parliament and of the Council. 2015, Official Journal of the European Union.
116. Kanellakis, M., G. Martinopoulos, and T. Zachariadis, European energy policy—A review. Energy Policy, 2013. 62: p. 1020-1030.
117. Grinsven, A.v. and B. Kampman, Assessing progress towards implementation of the ILUC Directive. 2015, CE Delft: ICCT.
118. Commission, E. Fuel Quality. 2016; Available from: http://ec.europa.eu/clima/policies/transport/fuel/index_en.htm.
119. Searchinger, T., et al., Use of US croplands for biofuels increases greenhouse gases through emissions from land-use change. Science, 2008. 319(5867): p. 1238-1240.
120. EBPT. Biofuels Policy and Legislation. 2015; Available from: http://biofuelstp.eu/biofuels-legislation.html.
121. Hood, J. UK experience of the Renewable Transport Fuel Obligation (RTFO) and policies to promote the development of waste-derived and advanced biofuels. in European Biofuels Technology Platform 6th Stakeholder Plenary Meeting. 2014. Brussels: Dept. for Transportation of the United Kingdom.
122. Gerrard, J. and M. Kandlikar, Is European end-of-life vehicle legislation living up to expectations? Assessing the impact of the ELV Directive on ‘green’ innovation and vehicle recovery. Journal of Cleaner Production, 2007. 15(1): p. 17-27.

39
123. European Commission. Batteries & Accumulators. 2016; Available from: http://ec.europa.eu/environment/waste/batteries/legislation.htm.
124. European Commission, Directive 2012/19/EU of the European Parliament and of the Council, E. Commission, Editor. 2012: Official Journal of the European Union.
125. European Commission. Eco Design and Energy Labelling. 2016; Available from: http://ec.europa.eu/growth/single-market/european-standards/harmonised-standards/ecodesign/index_en.htm.
126. Nash, H.A., The European Commission's sustainable consumption and production and sustainable industrial policy action plan. Journal of Cleaner Production, 2009. 17(4): p. 496-498.
127. Cohen, M.A. and M.P. Vandenbergh, The potential role of carbon labeling in a green economy. Energy Economics, 2012. 34: p. S53-S63.
128. Liu, T., Q. Wang, and B. Su, A review of carbon labeling: Standards, implementation, and impact. Renewable and Sustainable Energy Reviews, 2016. 53: p. 68-79.
129. International Organization for Standardization, Greenhouse gases — Carbon footprint of products — Requirements and guidelines for quantification and communication. 2013: Geneva.
130. Vanclay, J.K., et al., Customer response to carbon labelling of groceries. Journal of Consumer Policy, 2011. 34(1): p. 153-160.
131. Kim, M.-K. and B.A. McCarl, Uncertainty discounting for land-based carbon sequestration. Journal of Agricultural and Applied Economics, 2009. 41(01): p. 1-11.
132. Rebitzer, G., et al., Life cycle assessment: Part 1: Framework, goal and scope definition, inventory analysis, and applications. Environment international, 2004. 30(5): p. 701-720.
133. !!! INVALID CITATION !!! (2-5).
134. International Organization for Standardization, ISO 14040: Environmental management — Life cycle assessment — Principles and framework. 2006.
135. Reap, J., et al., A survey of unresolved problems in life cycle assessment-Part I. The International Journal of Life Cycle Assessment, 2008. 13(4): p. 290-300.
136. Delucchi, M., Beyond lifecycle analysis: developing a better tool for simulating policy impacts. Sustainable transportation energy pathways, 2011.
137. Wardenaar, T., et al., Differences between LCA for analysis and LCA for policy: a case study on the consequences of allocation choices in bio-energy policies. The International Journal of Life Cycle Assessment, 2012. 17(8): p. 1059-1067.
40
Appendix: TRB Workshop Summary and Materials
Life-Cycle Based Regulatory Reform for the Light Duty Vehicle Sector January 8, 2017
Introduction
In 2016, Hanjiro Ambrose led a proposal for, and was granted, a workshop at the 2017 Transportation Research Board Conference in Washington D.C. entitled Life-Cycle Based Regulatory Reform for the Light Duty Vehicle Sector. The workshop brought together federal and state agencies, automobile manufacturers, academic researchers, and non-governmental organizations. This included representatives from the Environmental Protection Agency, Department of Energy, California Air Resources Board, Ford Motor Company, Volvo North America, and Green Roads, as well as students and faculty from UC Davis, Georgia Tech, Georgetown, Yale, MIT, Portland state, Illinois College of Engineering, and University of Vermont. 3
During the workshop, the scope of technologies, processes, and performance metrics policy should consider to achieve deep de-carbonization of the transportation sector were discussed. The objective was to highlight opportunities for foundational research on economic, environmental, and behavioral aspects of new vehicle technologies with vehicle emissions policies, and perhaps the new ways that personal mobility and vehicles will function. The
3 Partial List of Workshop Attendees:
• John Viera, Ford Motor Company
• Timothy Wallingford, Ford Motor Company
• Karl Simon, EPA
• Sharyn Lie, EPA
• John Mikulin, EPA
• Ann Xu, Department of Energy ARPA-E
• Reid Heffner, Department of Energy ARPA-E
• Steve Cliff, California Air Resources Board
• Daniel Sperling, California Air Resources Board
• Chris Ganson, CA Governors Office of Planning and Research
• Randall Guensler, Georgia Tech
• Britt Holmen, University of Vermont
• Jenny Liu, Portland State University
• Andrew Veysey, Georgetown Law
• Hasan Ozer, Illinois College of Engineering
• Lew Fulton, University of California Davis
• Jera Lee, Green Roads
• Peter Damrosch, Yale Law School
41
workshop format was premised on three issue statement abstracts that were discussed during the workshop by two groups. This report provides the three issue statements and summarizes the notes from the two discussion groups, as well as a few key research questions identified by the groups.
Workshop Materials
The following section contains the background materials provided to participants and the issue statements used as a basis for small group discussion. This section was intended to provide background information for the breakout group discussions. It contains a description of LCA terminology, selected literature relevant to each issue statement, as well as an example policy brief.
Defining LCA
Life cycle assessment (LCA) is a methodology for assessing the environmental impacts attributable to the inputs and outputs of a product system. LCA is also used as a decision support tool to promote sustainable design and product selection. A life cycle encompasses the relevant stages of the life of a product.
“Starting with the design/development of the product, followed by resource extraction, production (production of materials, as well as manufacturing/provision of the product), use/consumption, and finally end-of-life activities (collection/sorting, reuse, recycling, waste disposal) … All activities, or processes, in a product’s life result in environmental impacts due to consumption of resources, emissions of substances into the natural environment, and other environmental exchanges.” [132]
Traditionally, the scope of an LCA is limited to environmental impacts. But, the life-cycle framework is also used to assess costs and social impacts through life cycle costing and social life cycle assessment. Taken together, the three techniques are referred to as Life Cycle Sustainability Assessment. [133].
The goal and scope of the LCA are critical to describing the product performance requirements and making smart comparisons. In order to set the scope of an LCA, it is necessary to quantify the performance requirements of the product; the functional unit measures the performance of the product system. It “provides a reference to which the inputs and outputs are related... [and] ...to ensure comparability of LCA results,” [134]. “Thus, adequately selecting a functional unit is of prime importance because different functional units could lead to different results for the same product systems,” [135].

42
Figure A1. Potential Sources of Error Related to Functional Unit. Adapted from Reap et al. (2004)
A functional unit is similar to a regulatory metric; both assess the performance of the system, and the selection of an appropriate metric is critical to achieving stated goals.
History of LCA
UC Davis played an important role in connecting LCA to vehicles and fuels. Mark Delucchi began exploring some of the methodological issues for LCA of vehicles and fuels over 20 years ago. Michael Wang, who was a PhD student with Dr.’s Delucchi and Sperling, then built on this work in developing the GREET model used widely today.
“Current LCAs of transportation and climate change can be traced back to “net energy” analyses done in the late 1970s and early 1980s in response to the energy crises of the 1970s, which had motivated a search for alternatives to petroleum. These were relatively straightforward, generic, partial engineering analyses of the amount of energy required to produce and distribute energy feedstocks and finished fuels. Their objective was to compare alternatives to conventional gasoline and diesel fuel according to total life-cycle use of energy, fossil fuels, or petroleum. In the late 1980s, analysts, policy makers, and the public began to worry that burning coal, oil, and gas would affect the global climate. Interest in alternative transportation fuels, which had subsided with the low oil prices of the mid-1980s, was renewed. Motivated now by global (and also local) environmental concerns, engineers again analyzed alternative transportation life cycles. Unsurprisingly, they adopted the methods of their net-energy engineering predecessors, except that they took the additional step of estimating net carbon dioxide content of fuels,” [136].
Conclusions
LCA has a critical role to play in comparing alternatives for vehicle design, fuel pathways, and use cases. But, policymakers are faced with many methodological decisions that are central to LCA. There is clearly need for further “discussion on distinguishing LCAs for the purpose of analysis (finding hotspots, monitoring, process optimization, etc.) and LCAs for policy purposes (banning, subsidizing, certifying, etc.),” [137].
Step1:Identify&prioritizefunctions
Potentialerrorfrom:• missed,• mispecified,or• misprioritized functions
Productsystem
Step2:Definefunctionalunit
Step3:Definereferenceflow
Potentialerrorfrom:• Assigningfunctional
unitstomultipleordifficulttoquantifyfunctions
• Makingstrict,functionally-equivalentcomparisons
Potentialerrorfrom:• Differentwaysof
handlingmultiplefunctions,and/or
• Uncertaintyinproductusescenariosandsystemdependencies
Identified&prioritizedfunctions
Functionalunit(s)
Referenceflow

43
Issue statements provided to participants
Issue Statement #1 Measuring beyond the tailpipe: GHGs per what?
Historically, tailpipe regulations have served as an effective proxy for managing emissions from passenger vehicles; vehicle operation dominated emissions and fleets relied largely on a single fuel. An increasing proportion of vehicles are relying on electricity and biofuel pathways, where emissions occur upstream of the vehicle tail-pipe. Regulators need appropriate and enforceable metrics that capture the upstream emissions associated with vehicle fuels of the future: electricity, hydrogen, and biofuels. The choice of metric is central to decisions about the design of policy mechanisms, data requirements, and testing and enforcement protocol, and has important implications for how emissions are reduced across communities.
Issue Statement #2 Accounting for the shared use-phase in vehicle GHG regulations
In the shared-autonomous future, a small percentage of the vehicle fleet begins to generate a significant share of all light-duty VMT. This could be a problem for many urban regions across the country. Changing use cases enabled by vehicle autonomy and vehicle sharing services could have significant impacts on emissions from and demand for vehicles. These technologies are already here; many have suggested that the choice between heaven or hell scenarios depends on the degree and direction of policy intervention. The majority of vehicle GHG and criteria emissions are still attributable to the vehicle use phase, even for vehicles fueled by electricity or biofuels. By partnering with ride-hailing apps or developing their own shared use platforms, vehicle OEMs are also capitalizing on changing models of vehicle ownership and vehicle mobility. What is the role of vehicle emissions policy in avoiding the heaven v. hell of shared-autonomous vehicles?
Issue Statement #3 Assessing the impacts of vehicle production
Our historic focus on tailpipe regulation means that current vehicle emission policy only incentivizes technologies that increase new vehicle fuel economy. Vehicles are using more lightweight materials, electric motors, and batteries that shift an increasing proportion of greenhouse gas (GHG) emissions from vehicles to the vehicle production phase. In most cases, research has identified more and less preferable scenarios for material choices, production processes, and production energy systems, combinations of which lead to a wide range of emissions outcomes. Vehicle OEMs usually rely on multi-tiered supply chains, which creates additional challenges for the measurement or control of emissions from production processes. To what extent should future vehicle emissions regulation include impacts from vehicle production?
44
Workshop Summary Results
Issue Statement #1: Measuring beyond the tailpipe:
Group Breakout Notes
• The system boundary for any new regulatory framework is very important: Are we just
talking cars, or are we talking transportation as a whole?
• There is already a lot of research siloed in the vehicle, fuel, and infrastructure sector;
the key is to use LCA as a consistent framework for all efforts.
• The panel observed that the usage of electricity and liquid fuel vehicles needs to be
continuously tracked to understand the benefits and improve on the sector.
• Management is an issue; who has control over what data? Coverage across all sectors is ideal, but is problematic from jurisdiction and administration standpoints.
• In order to effectively compare and communicate policy impacts across sectors, modes, or technologies, some type of economic normalization unit is needed. Dollars are key for connecting to policy.
• Economic framework also makes it easier to consider deployment.
• Any metric should consider infrastructure systems, particularly as they relate to new fuel systems or production pathways.
• Construction impacts for new vehicle development are currently not captured in estimating the potential benefit of new technologies, but can be substantial.
• If we consider infrastructure, should we also include vehicle weight? Same scale for freight and light duty vehicles may penalize electric vehicles with higher weights from batteries.
• Tracking vehicle load factor is very important, but will have high temporal and regional variability; should there be some type of geofenced or hour of the day standard?
• NEPA and CEQA implications need to be understood, particularly as they relate to infrastructure considerations.
• Coverage across all sectors is important for avoiding leakage, but overlapping jurisdictions and agencies interested in getting involved (i.e., cities want revenue or control) may create systems of double counting; difficult to avoid.
• There may be tradeoffs with collecting granular, real-time data. Dimensions of data involved create real impacts for data processing and storage in the cloud (considerable and growing upstream energy use for data processing).
• But, panel agrees that reliability and quality of data is currently a barrier to improved assessment.
• Any metric will be challenged by the horizontal structure of sectors and technologies, as well as the disjointed vertical integration across agencies and jurisdictions.
Research Questions That Emerge from Issue Statement #1
1. How do we integrate infrastructure and supply chains into regulatory metrics? a. What are the implications? What is administrable?

45
2. How does measuring load factor intersect with personal data and privacy? 3. What are the impacts of different regulatory metrics on data needs and administrative
costs? 4. How are different regulatory metrics perceived by the public? Labelling? 5. How should commercial service fleets be regulated, particularly if they become a larger
portion of the fleet? 6. What are the equity considerations of different regulatory metrics? 7. What are the impacts of different regulatory metrics on the costs of modes or
technologies? Are we picking winners/losers?
Issue Statement #2: Dealing with Automated and Connected Vehicles:
Group Breakout Notes
• Formulating appropriate research questions around vehicle automation and
connectivity requires a set of common definitions
o Autonomous vs. automated and connected
▪ Vehicles will not operate independently, but rather full automation will
be enabled by vehicle/infrastructure communication systems
o The panel defined “driverless” vehicles as vehicles needing no license nor
steering wheel.
▪ Who gets to own these vehicles?
▪ The policy approach toward these vehicles has to connect user fee to the
VMT.
• Commercial ride-sharing has concerns about sharing the cab space with strangers,
raising privacy and personal security concerns
o Vehicle automation may enable passenger centric vehicle design, including the
removal of steering and navigation components, and segmented vehicle interiors
(i.e., private interior compartments).
o Different countries and communities have different perception of personal space
and varied privacy concerns. One size might not fit all.
• Agencies and municipalities will have overlapping and competing jurisdictions and
objectives for policy.
• Moving to user fee (instead of gas fee), where the user pays for use of road capacity,
could be integral to avoiding the autonomous vehicle “hell scenario”: (i.e., vehicles with
zero occupants becoming a significant portion of the fleet).
• The panel stresses on the need to decrease dependence on car ownership as a key part
of effective autonomous vehicle strategies and management.
• The panel moved on to the topic of privacy from the individually owned private cars and
how much and what kind of information might be needed from them. It noted that
there could be issues with sharing of some data from the public.
46
• The panel noted that while incentivizing load factors, targeting average vehicle
performance does not produce effective incentives.
• VMT and load factor were agreed as two necessary factors to be measured.
• The panel wondered and questioned the availability of a healthy commercial market for
selling sharing based vehicles for manufacturers.
• The panel stressed that the duty of academia is to find the best conditions for vehicle
production with different materials for the best case scenario.
• The panel also questioned the importance of data according to the agency, and as such
what kind of data would be important to what kind of agency.
• The panel highlighted the need for focusing on factors beyond CO2 while considering
transportation such as availability and usage of water, social conditions etc.
Research Questions That Emerge from Issue Statement #2
1. In the connected and automated vehicle future, How will a shift from driver centric to
passenger centric vehicles affect vehicle design from the perspective of right sizing?
Attitudes towards Sharing?
2. What are the opportunities for using smartphones to deal with personal privacy issues?
How have attitudes about personal privacy changed? Across demographics?
3. What are the infrastructure needs for automation?
a. Planning and development of the roadways to accommodate to the automation.
b. Where does the data about the vehicles and the needs come from?
4. What are the existing policies that hinder the development of self-driving or driverless
vehicles?
a. Current discussion mostly dominated by safety; need to look beyond once
satisfactory safety achieved
5. What are the unintended consequences of ride sharing and vehicle automation?
a. What is policy’s role? At what administrative level?
6. What are the equity considerations of ride sharing?
a. How do access to vehicle automation and ride sharing differ across
demographics? Their impacts?
7. What are the impacts of different incentive structures across different stakeholders
(OEMs, Providers, Users)?
a. Multipliers for higher load factors or direct incentives, what is effective?
8. How to administer and at what level is administrable and implementable?
9. How can LCA be used to better consider the vehicle use phase in emissions regulation? 10. How can policy provide special treatment for vehicles that are used more or less?
47
Issue Statement #3: Assessing impacts of vehicle production
Group Breakout Notes
• Vehicle production as a share of vehicle emissions is growing, but there is clearly a need for better data on trends in absolute emissions from vehicle production.
• Emissions from materials or components with high energy use in production (i.e., batteries and lightweight materials), vary strongly based on production pathway. This indicates room for improvement given proper incentives for material selection/substitution.
• The panel agrees that the current system does a poor job of incentivizing better upstream design decisions by vehicle OEMS.
• Data availability and quality is currently a key hurdle.
• The European system of environmental product declarations (EPDs) and product category rules (PCRs) was discussed as a potential framework for improving data about vehicle manufacturing processes.
• Vehicle OEMs are willing to consider upstream processes, but just shouldn’t be singled out as the only stage in the value chain or sector to be addressed.
Research Questions That Emerge from Issue Statement #3
1. What is the role of government/policy in creating standards for measurement, data reporting, and data quality in vehicle LCA?
2. What are cost / barriers to / challenges for implementing LCA in a vehicle supply chain compared to the magnitude of emissions reduction?
3. How can policy incentivize increased LCA integration into vehicle design decisions? 4. Materials in the life cycle substitution for what? How about vehicle substitution 5. How do we design a EPD system for vehicle design? 6. Incentivizing better supply chain decisions? Resolving competing claims for products in
the supply chain? How are LCAs being implemented by vehicle OEMs? 7. For the regulators, what information is important to decisions makers in regards to
regulating vehicle production? What metrics are important for OEMS? 8. And therefore, what are the metrics that can be used to incentivize the correct
decisions? 9. Where are the overlaps of social metrics with vehicle production LCA? 10. Jurisdiction carbon tax or one-offs regulating vehicle production?
Conclusions
All participants agreed there is a growing need for life cycle assessment in the regulatory apparatus for vehicle emissions. Charting a path forward remains challenging due to jurisdictional issues, system complexities, and political will. Workshop discussion revealed several opportunities for improving emissions accounting from vehicle production and vehicle use.

48
For vehicle use, moving towards a modal or real-time emissions accounting system would enable new performance based and life cycle regulatory metrics. Discussants identified including the vehicle load factor (e.g., passengers per vehicle) as a key opportunity. Crediting load factor for use-phase emissions could be used to differentiate between similar footprint cargo and passenger vehicles in different in high and low annual mileage use cases. These credits could then become powerful incentives for end-users, such as fleets or service operators, as has been the case for GHG and ZEV credit systems.
For vehicle production, data sharing and transparency is a critical issue in accounting for marginal changes in production emissions attributable to design decisions, and setting regulatory or voluntary benchmarks. There may be a chicken and egg aspect to reaching critical mass to anonymize production data, and the risks of exposing supply chain information to reverse analytics. This might also signal a clear role for policy, as a governmental body or organization could become the clearing-house for production data. This could then allow for setting empirically and methodologically robust targets.
Another noted take-away was the potential intersection with growing use of on-demand ride sharing services and need for life cycle based accounting principles. High mileage vehicles would be penalized under a system that took real-world or annual mileage generation into account, which could increase costs for ride sharing drivers. If service vehicles are displacing other trips through ride consolidation (e.g., a high average load factor), this might result in lower life cycle emissions from the standpoint of overall travel demand measured in person miles or person miles travelled. As on-demand ride hailing and sharing services expand, operators are expecting to see value in being credited for high load factor use patterns that displace single occupancy vehicle trips.
Finally, discussants noted that further research and more public data is required in this area. Particularly for new vehicle technologies that offer climate benefits, but may have very different supply chains, end of life pathways, or pathways for environmental impact. While the focus of discussion was on climate forcing emissions, it was noted that pollution was also a key concern for regulation and for the comparison of alternatives.