program and demographic characteristics of supplemental
TRANSCRIPT
Program and Demographic Characteristics of Supplemental Security Income
Recipients, December 1985 By Arthur L. Kahn*
The federally administered Supplemental Security Income (SSI) program, created by the provisions of the 1972 Amendments to the Social Security Act, es- tablished uniform national eligibility criteria and pay- ment standards for the Nation’s needy population who, in addition to being poor, were also aged, blind, or disabled. It replaced the previous State- administered programs of Old-Age Assistance (OAA), Aid to the Blind (AB), and Aid to the Permanently and Totally Disabled (APTD). When the SSI pro-
*Division of Statistics Analysis, Office of Research and Statistics, Office of Policy, Social Security Administration.
gram began making payments in January 1974, 3.2 million recipients were on the rolls. By the end of 1985, this figure had reached 4.1 million. The proportion of disabled persons increased from 40 per- cent in 1974 to 60 percent by the end of 1985.
This article examines selected characteristics of the SSI population. The analysis focuses on a series of demographic variables: reasons for eligibility, pay- ment distribution, sex, age, race, income, resources, living arrangements, and metropolitan residency. Pro- visions of the federally administered program, includ- ing the basic eligibility requirements-updated through January 1987-are also presented.
Social Security Bulletin, May 1987/Vol. 50, No. 5 23
When Congress enacted Public Law 92-603 (the By the end of 1985, the total number of persons 1972 Amendments to the Social Security Act), it receiving federally administered SSI payments had provided in one program-the Supplemental Security increased by 108,700 from the December 1984 total. Income (SSI) program-what had previously been Three categories of recipients were responsible for the carried out through Federal grants to the States for increase: disabled adults, blind adults, and blind and their multiple programs of Old-Age Assistance disabled children. The number of disabled adults had (OAA), Aid to the Blind (AB), and Aid to the Per- increased by 116,500, reaching 2,294,300 by the end of manently and Totally Disabled (APTD). The new SSI the 12-month period; among blind adults, the program established uniform national eligibility increase was 1,300, bringing the year-end total to criteria and a Federal “floor” of income to supple- 74,000; and the number of blind and disabled chil- ment the existing basic social insurance program. dren had increased by 16,700 to 265,300. Only
In its first month of operation-January 1974-the among aged SSI recipients had the number of new SSI program made payments to more than 3.2 million recipients decreased: From December 1984 to Decem- individuals. By December 1985, the number of SSI ber 1985, 25,800 fewer aged recipients were added to recipients exceeded 4.1 million (table 1). These SSI the SSI rolls than in the preceding year, bringing the payments are made by the Federal Government, a year-end total to 1,504,500 aged recipients. State government, or both. The Federal payment is Federal and State SSI program payments totaled based on uniform national standards; the State $11.1 billion in calendar year 1985, up $668.7 million supplementary payment varies from State to State and from 1984. This increase resulted, in part, from a may be administered by the State or by the January 1985 cost-of-living adjustment that raised the Federal Government. Further, State supplementation Federal payment rates by 3.5 percent and made the of the Federal SSI payments may be mandatory or new maximum monthly payment amount $325 for an optional. The mandatory payments are required to individual recipient and $488 for a couple. maintain the income levels of SSI recipients who had Federal SSI payments accounted for 79 percent of been under State assistance programs before 1974. total SSI payments. In the 12-month period, the The optional State supplementary payments are amount expended for Federal payments increased by provided to augment the payment levels of all or $496.3 million to a total of $8.8 billion. State sup- selected categories of recipients. The optional pay- plementation payments were federally administered, ments are provided at the discretion of the individual in payments, an increase of $192.4 million from the States and they vary widely among the States. previous year’s total. Nearly $2.0 billion of sup-
Of the 4,138,OOO persons receiving federally plementation payments were federally administered, administered SSI payments at the end of 1985, and $310.5 million were State administered. disability was the basis of entitlement for 62 percent, Only 22 percent of the persons receiving an SSI age for 36 percent, and blindness for 2 percent of the payment in December 1985 had been receiving recipients. payments from the State assistance programs (OAA,
Nearly half of these 4 million recipients were aged AB, and APTD) and had had their payment status 65 or older. In addition to the recipients categorized converted in 1974.’ More than 1 in 3 of the currently as aged, this group also included 31 percent of the entitled blind recipients, 1 in 4 of the aged, and 1 in blind adult recipient population and 22 percent of the 5 of the disabled had been in the precursor programs disabled adult recipients. and were brought under the SSI program in 1974.
‘See section on program provisions as of January 1987, page 29.
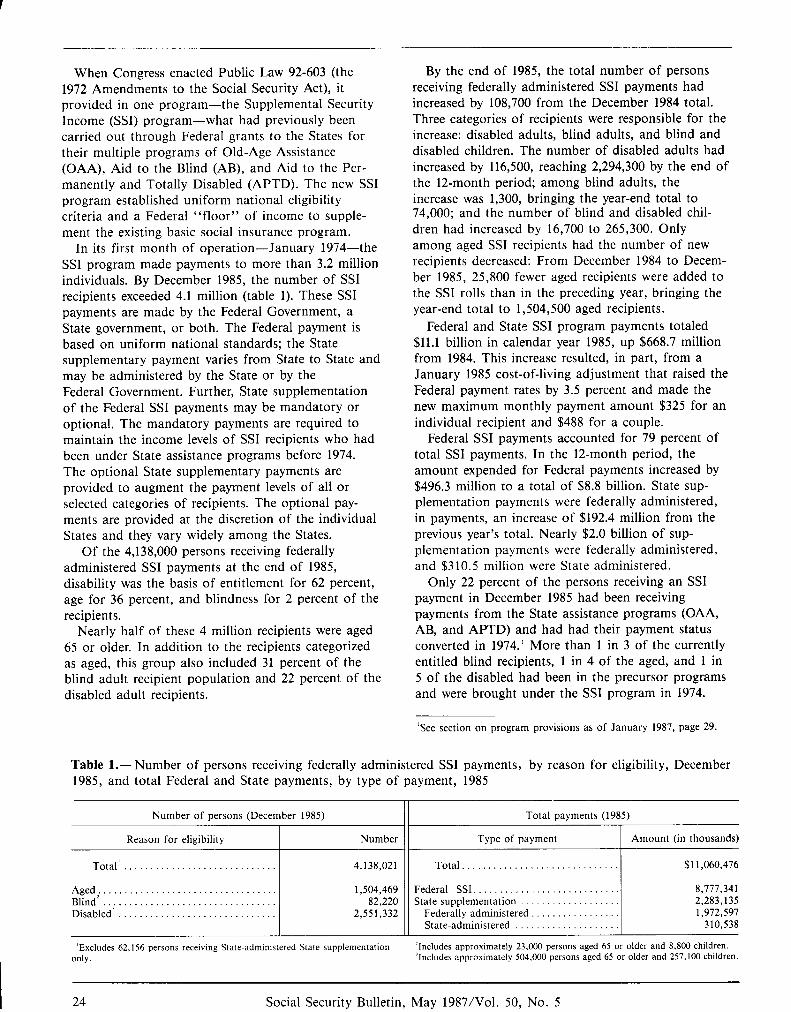
Table l.- Number of persons receiving federally administered SSI payments, by reason for eligibility, December 1985, and total Federal and State payments, by type of payment, 1985
Number of persons (December 1985) Total payments (1985)
Reason for eligibility Number Type of payment Amount (in thousands)
Total’ 4,138,021 Total.............................. $11,060,476
Aged.................................. 1,504,469 Federal SSI............................ 8,777,341 Blind’ . . . . . . . . . . .._.._._.__.._ 82,220 State supplementation 2,283,135 Disabled’ 2,551,332 Federally administered 1,972,597
State-administered 310,538
‘Excludes 62,156 persons receiving State-administered State supplementation ‘Includes approximately 23,000 persons aged 65 or older and 8,800 children. Only. ‘Includes approximately 504,000 persons aged 65 or older and 257,100 children.
24 Social Security Bulletin, May 1987/Vol. 50, No. 5
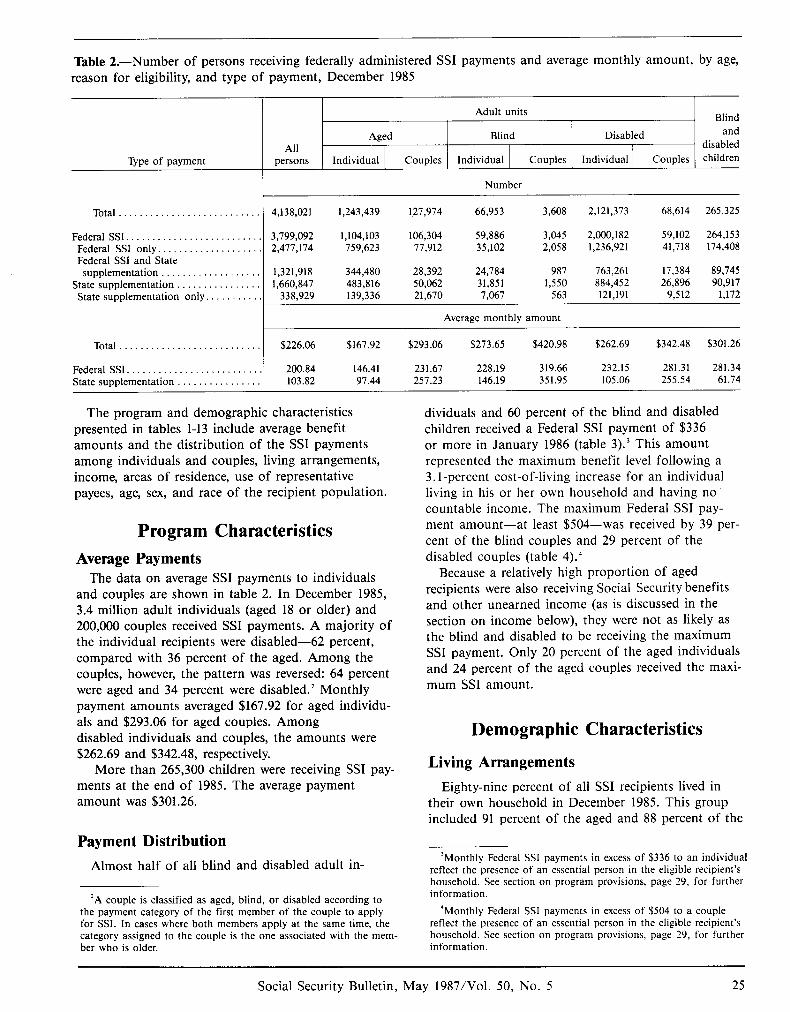
Table 2.-Number of persons receiving federally administered SSI payments and average monthly amount, by age, reason for eligibility, and type of payment, December 1985
Adult units Blind
Type of payment All
persons
Aged Blind Disabled and disabled
Individual Couples Individual Couples Individual Couples children
Number
Total ........................... 4,138,021 1,243,439 127,974 66,953 3,608 2,121,373 68,614 265,325
Federal SSI. ......................... 3,799,092 1,104,103 106,304 59,886 3,045 2,000,182 59,102 264,153 Federal SSI only. ................... 2,477,174 759,623 77,912 35,102 2,058 1,236,921 41,718 174,408 Federal SSI and State
supplementation ................... 1,321,918 344,480 28,392 24,784 987 763,261 17,384 89,745 State supplementation ................ 1,660,847 483,816 50,062 31,851 1,550 884,452 26,896 90,917
State supplementation only ........... 338,929 139,336 21,670 7,067 563 121,191 9,512 1,172
Average monthly amount
Total ........................... $226.06 $167.92 $293.06 $273.65 $420.98 $262.69 $342.48 $301.26
Federal SSI .......................... 200.84 146.41 231.67 228.19 319.66 232.15 281.31 281.34 State supplementation ................ 103.82 97.44 257.23 146.19 351.95 105.06 255.54 61.74
The program and demographic characteristics presented in tables 1-13 include average benefit amounts and the distribution of the SSI payments among individuals and couples, living arrangements, income, areas of residence, use of representative payees, age, sex, and race of the recipient population.
Program Characteristics Average Payments
The data on average SSI payments to individuals and couples are shown in table 2. In December 1985, 3.4 million adult individuals (aged 18 or older) and 200,000 couples received SSI payments. A majority of the individual recipients were disabled-62 percent, compared with 36 percent of the aged. Among the couples, however, the pattern was reversed: 64 percent were aged and 34 percent were disabled.’ Monthly payment amounts averaged $167.92 for aged individu- als and $293.06 for aged couples. Among disabled individuals and couples, the amounts were $262.69 and $342.48, respectively.
More than 265,300 children were receiving SSI pay- ments at the end of 1985. The average payment amount was $301.26.
Payment Distribution
Almost half of all blind and disabled adult in-
*A couple is classified as aged, blind, or disabled according to the payment category of the first member of the couple to apply for SSI. In cases where both members apply at the same time, the category assigned to the couple is the one associated with the mem- ber who is older.
dividuals and 60 percent of the blind and disabled children received a Federal SSI payment of $336 or more in January 1986 (table 3).3 This amount represented the maximum benefit level following a 3. l-percent cost-of-living increase for an individual living in his or her own household and having no countable income. The maximum Federal SSI pay- ment amount-at least $504-was received by 39 per- cent of the blind couples and 29 percent of the disabled couples (table 4).”
Because a relatively high proportion of aged recipients were also receiving Social Security benefits and other unearned income (as is discussed in the section on income below), they were not as likely as the blind and disabled to be receiving the maximum SSI payment. Only 20 percent of the aged individuals and 24 percent of the aged couples received the maxi- mum SSI amount.
Demographic Characteristics
Living Arrangements
Eighty-nine percent of all SSI recipients lived in their own household in December 1985. This group included 91 percent of the aged and 88 percent of the
‘Monthly Federal SSI payments in excess of $336 to an individual reflect the presence of an essential person in the eligible recipient’s household. See section on program provisions, page 29, for further information.
‘Monthly Federal SSI payments in excess of $504 to a couple reflect the presence of an essential person in the eligible recipient’s household. See section on program provisions, page 29, for further information.
Social Security Bulletin, May 1987/Vol. 50, No. 5 25
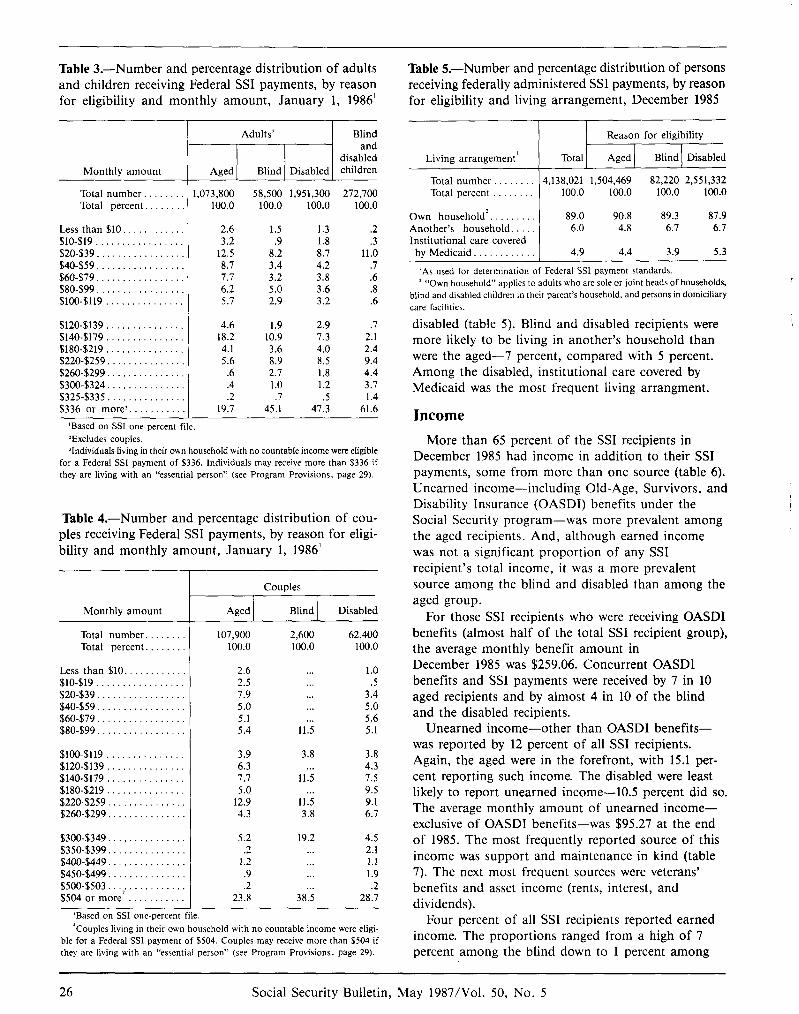
Table 3.-Number and percentage distribution of adults Table S.-Number and percentage distribution of persons and children receiving Federal SSI payments, by reason receiving federally administered SSI payments, by reason for eligibility and monthly amount, January 1, 1986’ for eligibility and living arrangement, December 1985
Adults* Blind and
disabled Monthly amount Aged Blind Disabled children
Total number. 1,073,800 58,500 1,951,300 272,700 Total percent. 100.0 100.0 100.0 100.0
Reason for eligibility
Less than $10.. 2.6 1.5 1.3 .2 $lO-$19 3.2 .9 1.8 .3 $20-$39 12.5 8.2 8.7 11.0 $40-$59 . 8.7 3.4 4.2 .7 $60-$79. 7.7 3.2 3.8 .6 $80-$99 6.2 5.0 3.6 .8 $lOO-$119 . 5.7 2.9 3.2 .6
Living arrangement’ Total Aged Blind Disabled
Total number.. 4,138,021 1,504,469 82,220 2,551,332 Total percent . 100.0 100.0 100.0 100.0
Own household’. 89.0 90.8 89.3 87.9 Another’s household. 6.0 4.8 6.7 6.7 Institutional care covered
by Medicaid 4.9 4.4 3.9 5.3
‘As used for determination of Federal SSI payment standards. ’ “Own household” applies to adults who are sole or joint heads of households,
blind and disabled children in their parent’s household, and persons in domiciliary care facilities.
$120-$139 $140-$179 . $180-$219 $220-$259. $260-$299. $300-$324............... $325-$335. $336 or more”.
‘Based on SSI one-percent file.
‘Excludes couples.
4.6 1.9 2.9 .7 18.2 10.9 7.3 2.1 4.1 3.6 4.0 2.4 5.6 8.9 8.5 9.4
.6 2.7 1.8 4.4
.4 1.0 1.2 3.7
.2 .7 .5 1.4 19.7 45.1 47.3 61.6
disabled (table 5). Blind and disabled recipients were more likely to be living in another’s household than were the aged-7 percent, compared with 5 percent. Among the disabled, institutional care covered by Medicaid was the most frequent living arrangment.
Income
‘Individuals living in their own household with no countable income were eligible for a Federal SSI payment of $336. Individuals may receive more than $336 if they are living with an “essential person” (see Program Provisions, page 29).
Table 4.-Number and percentage distribution of cou- ples receiving Federal SSI payments, by reason for eligi- bility and monthly amount, January 1, 1986’
More than 65 percent of the SSI recipients in December 1985 had income in addition to their SSI payments, some from more than one source (table 6). Unearned income-including Old-Age, Survivors, and Disability Insurance (OASDI) benefits under the Social Security program-was more prevalent among the aged recipients. And, although earned income was not a significant proportion of any SSI recipient’s total income, it was a more prevalent source among the blind and disabled than among the aged group.
r Monthly amount Aged Blind Disabled
Total number. ....... Total percent. .......
107,900 2,600 62,400 100.0 100.0 100.0
Less than $10 ............ 2.6 1.0 NO-$19 ................. 2.5 .5 $20-$39. ................ 7.9 . . . 3.4 $40-$59. ................ 5.0 . 5.0 $60~$79. ................ 5.1 . . . 5.6 $80-$99 ................. 5.4 11.5 5.1
$100~$119 ............... $120~$139 ............... $140~$179 ............... $180-$219 ............... $220-$259 ............... $260-$299. ..............
3.9 3.8 3.8 6.3 . 4.3 7.7 11.5 7.5 5.0 . 9.5
12.9 11.5 9.1 4.3 3.8 6.7
$300-$349. .............. $350-$399. .............. $400~$449. .............. $450-$499. .............. $500-$503 ............... $504 or more* ...........
‘Based on SSI one-percent I
5.2 19.2 4.5 .2 . . . 2.1
1.2 . . . 1.1 .9 1.. 1.9 .2 .2
23.8 38.5 28.7 L
‘ile.
Couples
‘Couples living in their own household with no countable income were eligi- ble for a Federal SSI payment of $504. Couples may receive more than $504 if they are living with an “essential person” (see Program Provisions, page 29).
For those SSI recipients who were receiving OASDI benefits (almost half of the total SSI recipient group), the average monthly benefit amount in December 1985 was $259.06. Concurrent OASDI benefits and SSI payments were received by 7 in 10 aged recipients and by almost 4 in 10 of the blind and the disabled recipients.
Unearned income-other than OASDI benefits- was reported by 12 percent of all SSI recipients. Again, the aged were in the forefront, with 15.1 per- cent reporting such income. The disabled were least likely to report unearned income-lo.5 percent did so. The average monthly amount of unearned income- exclusive of OASDI benefits-was $95.27 at the end of 1985. The most frequently reported source of this income was support and maintenance in kind (table 7). The next most frequent sources were veterans’ benefits and asset income (rents, interest, and dividends).
Four percent of all SSI recipients reported earned income. The proportions ranged from a high of 7 percent among the blind down to 1 percent among
26 Social Security Bulletin, May 1987/Vol. 50, No. 5
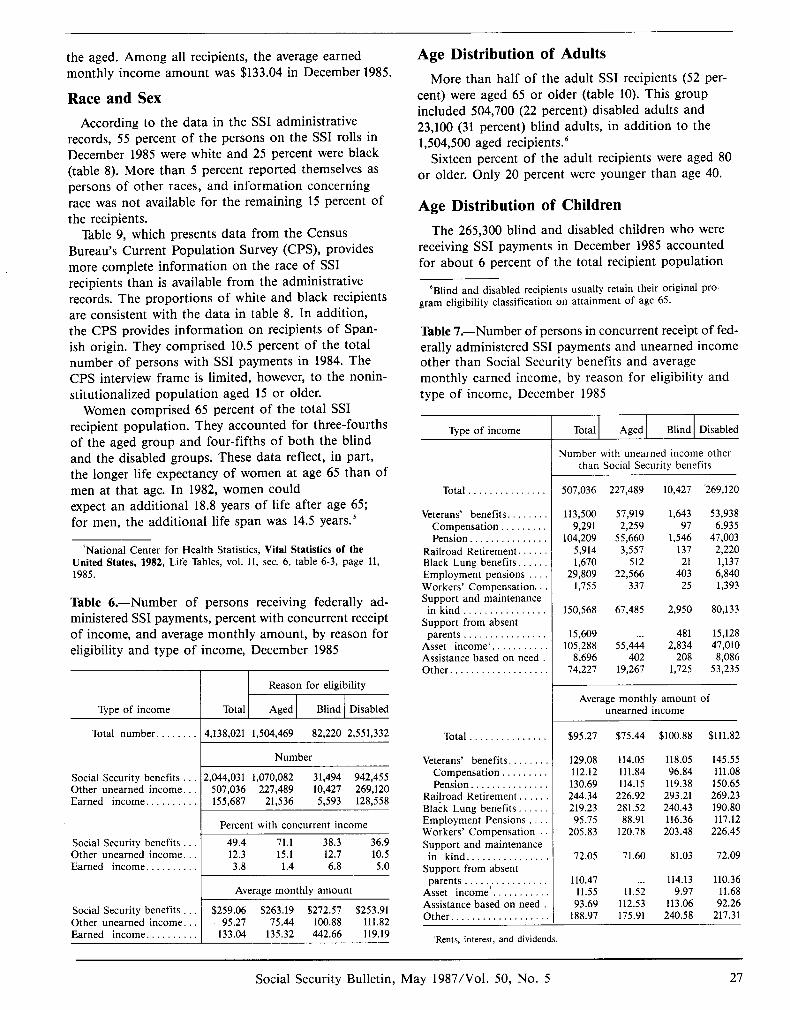
the aged. Among all recipients, the average earned monthly income amount was $133.04 in December 1985.
Race and Sex
According to the data in the SSI administrative records, 55 percent of the persons on the SSI rolls in December 1985 were white and 25 percent were black (table 8). More than 5 percent reported themselves as persons of other races, and information concerning race was not available for the remaining 15 percent of the recipients.
Table 9, which presents data from the Census Bureau’s Current Population Survey (CPS), provides more complete information on the race of SSI recipients than is available from the administrative records. The proportions of white and black recipients are consistent with the data in table 8. In addition, the CPS provides information on recipients of Span- ish origin. They comprised 10.5 percent of the total number of persons with SSI payments in 1984. The CPS interview frame is limited, however, to the nonin- stitutionalized population aged 15 or older.
Women comprised 65 percent of the total SSI recipient population. They accounted for three-fourths of the aged group and four-fifths of both the blind and the disabled groups. These data reflect, in part, the longer life expectancy of women at age 65 than of men at that age. In 1982, women could expect an additional 18.8 years of life after age 65; for men, the additional life span was 14.5 years.’
‘National Center for Health Statistics, Vital Statistics of the United States, 1982, Life Tables, vol. II, sec. 6, table 6-3, page 11, 1985.
Table 6.-Number of persons receiving federally ad- ministered SSI payments, percent with concurrent receipt of income, and average monthly amount, by reason for eligibility and type of income, December 1985
Reason for eligibility
Type of income Total Aged Blind Disabled
Total number, 4,138,021 1,504,469 82,220 2,551,332
Number
Social Security benefits 2,044,031 1,070,082 31,494 942,455 Other unearned income. 507,036 227,489 10,427 269,120 Earned income.......... 155,687 21,536 5,593 128,558
Percent with concurrent income
Social Security benefits 49.4 71.1 38.3 36.9 Other unearned income. 12.3 15.1 12.7 10.5 Earned income.......... 3.8 1.4 6.8 5.0
Average monthly amount
Social Security benefits $259.06 $263.19 $272.57 $253.91 Other unearned income. 95.27 75.44 100.88 111.82 Earned income. 133.04 135.32 442.66 119.19
Age Distribution of Adults
More than half of the adult SSI recipients (52 per- cent) were aged 65 or older (table 10). This group included 504,700 (22 percent) disabled adults and 23,100 (31 percent) blind adults, in addition to the 1,504,500 aged recipients.6
Sixteen percent of the adult recipients were aged 80 or older. Only 20 percent were younger than age 40.
Age Distribution of Children
The 265,300 blind and disabled children who were receiving SSI payments in December 1985 accounted for about 6 percent of the total recipient population
“Blind and disabled recipients usually retain their original Pro- gram eligibility classification on attainment of age 65.
Table 7.-Number of persons in concurrent receipt of fed- erally administered SSI payments and unearned income other than Social Security benefits and average monthly earned income, by reason for eligibility and type of income, December 1985
Type of income
Total
Veterans’ benefits. Compensation . Pension.
Railroad Retirement. Black Lung benefits. Employment pensions Workers’ Compensation. Support and maintenance
in kind . Support from absent
parents Asset income’. Assistance based on need Other. . .
Total .
Veterans’ benefits. Compensation Pension. .
Raiiroad Retirement. . Black Lung benefits. Employment Pensions Workers’ Compensation Support and maintenance
in kind.. Support from absent
parents . . Asset income’. . Assistance based on need Other..................
‘Rents, interest, and dividends.
-
Total Aged Blind Disabled
Number with unearned income other than Social Security benefits
507,036 227,489 10,427 ‘269,120
113,500 57,919 1,643 53,938 9,291 2,259 97 6,935
104,209 55,660 1,546 47,003 5,914 3,557 137 2,220 1,670 512 21 1,137
29,809 22,566 403 6,840 1,755 337 25 1,393
150,568 67,485 2,950 80,133
15,609 . . . 481 15,128 105,288 55,444 2,834 47,010
8,696 402 208 8,086 74,227 19,267 1,725 53,235
Average monthly amount of unearned income
$95.27 $75.44 $100.88 $111.82
129.08 114.05 118.05 145.55 112.12 111.84 96.84 111.08 130.69 114.15 119.38 150.65 244.34 226.92 293.21 269.23 219.23 281.52 240.43 190.80 95.75 88.91 116.36 117.12
205.83 120.78 203.48 226.45
72.05 71.60 81.03 72.09
110.47 . 114.13 110.36 11.55 11.52 9.97 11.68 93.69 112.53 113.06 92.26
188.97 175.91 240.58 217.31
Social Security Bulletin, May 1987/Vol. 50, No. 5 27
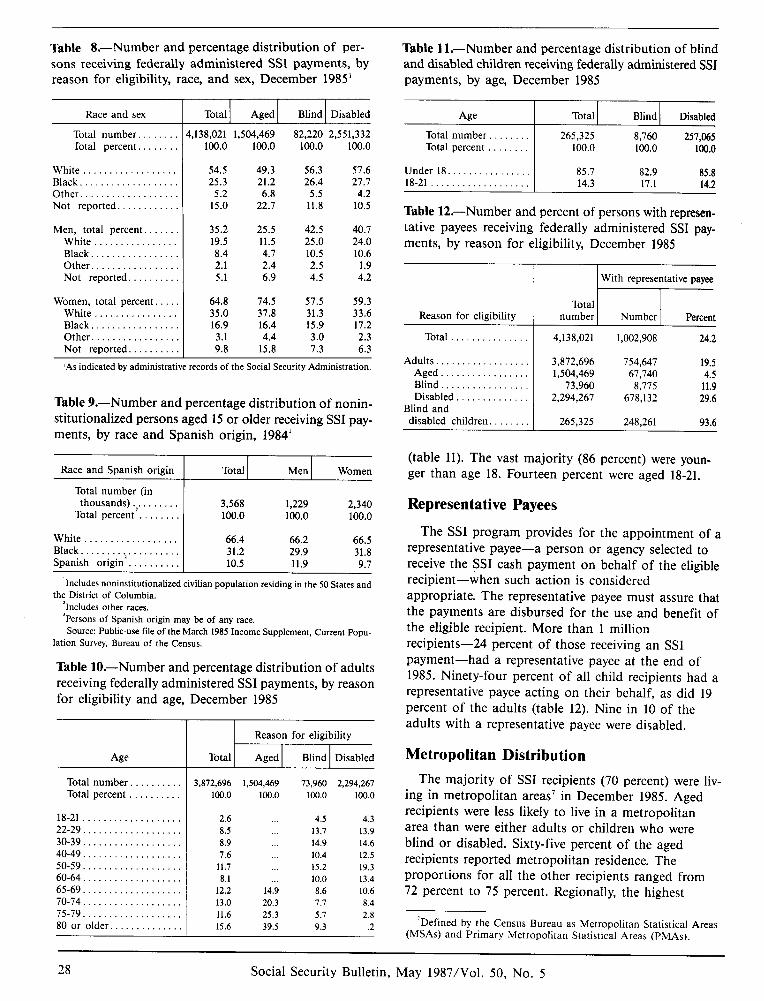
Table 8.-Number and percentage distribution of per- sons receiving federally administered SSI payments, by reason for eligibility, race, and sex, December 1985’
Race and sex
Total number. ....... Total percent. .......
White .................. Black ................... Other. .................. Not reported. ...........
Men, total percent ....... White ................ Black ................. Other. ................ Not reported. .........
Women, total percent. .... White ................ Black ................. Other ................. Not reported. .........
L
Total Aged Blind Disabled
1,138,021 1,504,469 82,220 2,551,332 100.0 100.0 100.0 100.0
54.5 49.3 56.3 51.6 25.3 21.2 26.4 21.1
5.2 6.8 5.5 4.2 15.0 22.1 11.8 10.5
35.2 25.5 42.5 40.7 19.5 11.5 25.0 24.0 8.4 4.1 10.5 10.6 2.1 2.4 2.5 1.9 5.1 6.9 4.5 4.2
64.8 74.5 57.5 59.3 35.0 31.8 31.3 33.6 16.9 16.4 15.9 17.2 3.1 4.4 3.0 2.3 9.8 15.8 1.3 6.3
‘As indicated by administrative records of the Social Security Administration.
Table 9.-Number and percentage distribution of nonin- stitutionalized persons aged 15 or older receiving SSI pay- ments, by race and Spanish origin, 1984’
Race and Spanish origin Total Men Women
Total number (in thousands) .*. .
Total percent . . 3,568 1,229 2,340 100.0 100.0 100.0
White ......... . . 66.4 66.2 66.5 Black. ......... . . . . . . 31.2 Spanish origin’.
29.9 31.8 ......... 10.5 11.9 9.7
‘Includes noninstitutional&d civilian population residing in the 50 States and the District of Columbia.
‘Includes other races. ‘Persons of Spanish origin may be of any race.
Source: Public-use file of the March 1985 Income Supplement, Current Popu- lation Survey, Bureau of the Census.
Table lO.-Number and percentage distribution of adults receiving federally administered SSI payments, by reason for eligibility and age, December 1985
Age
Total number Total percent
. .
18-21 22-29. 30-39. . . 40-49. 50-59..... 60-64. 65-69. . . 70-74. . 75-79..... 80 or older
. . . . .
. . ,.....
X872,696 1.504.469 73,960 2,294,267 loo.0 100.0 100.0 100.0
2.6 4.5 4.3 8.5 13.7 13.9 8.9 14.9 14.6 7.6 10.4 12.5
11.7 15.2 19.3 8.1 10.0 13.4
12.2 14.9 8.6 10.6 13.0 20.3 7.7 8.4 11.6 25.3 5.1 2.8 15.6 39.5 9.3 .2
Table Il.-Number and percentage distribution of blind and disabled children receiving federally administered SSI payments, by age, December 1985
~
Table 12.-Number and percent of persons with represen- tative payees receiving federally administered SSI pay- ments, by reason for eligibility, December 1985
Reason for eligibility
Total .
Adults. Aged . Blind . Disabled .
Blind and disabled children.
m
4,138,021 1,002,908 24.2
3,872,696 154,641 19.5 1,504,469 67,740 4.5
73,960 8,175 11.9 2,294,267 678,132 29.6
265,325 248,261 93.6
(table 11). The vast majority (86 percent) were youn- ger than age 18. Fourteen percent were aged 18-21.
Representative Payees
The SSI program provides for the appointment of a representative payee-a person or agency selected to receive the SSI cash payment on behalf of the eligible recipient-when such action is considered appropriate. The representative payee must assure that the payments are disbursed for the use and benefit of the eligible recipient. More than 1 million recipients-24 percent of those receiving an SSI payment-had a representative payee at the end of 1985. Ninety-four percent of all child recipients had a representative payee acting on their behalf, as did 19 percent of the adults (table 12). Nine in 10 of the adults with a representative payee were disabled.
Metropolitan Distribution
The majority of SSI recipients (70 percent) were liv- ing in metropolitan areas’ in December 1985. Aged recipients were less likely to live in a metropolitan area than were either adults or children who were blind or disabled. Sixty-five percent of the aged recipients reported metropolitan residence. The proportions for all the other recipients ranged from 72 percent to 75 percent. Regionally, the highest
‘Defined by the Census Bureau as Metropolitan Statistical Areas (MSAs) and Primary Metropolitan Statistical Areas (PMAs).
28 Social Security Bulletin, May 1987/Vol. 50, No. 5
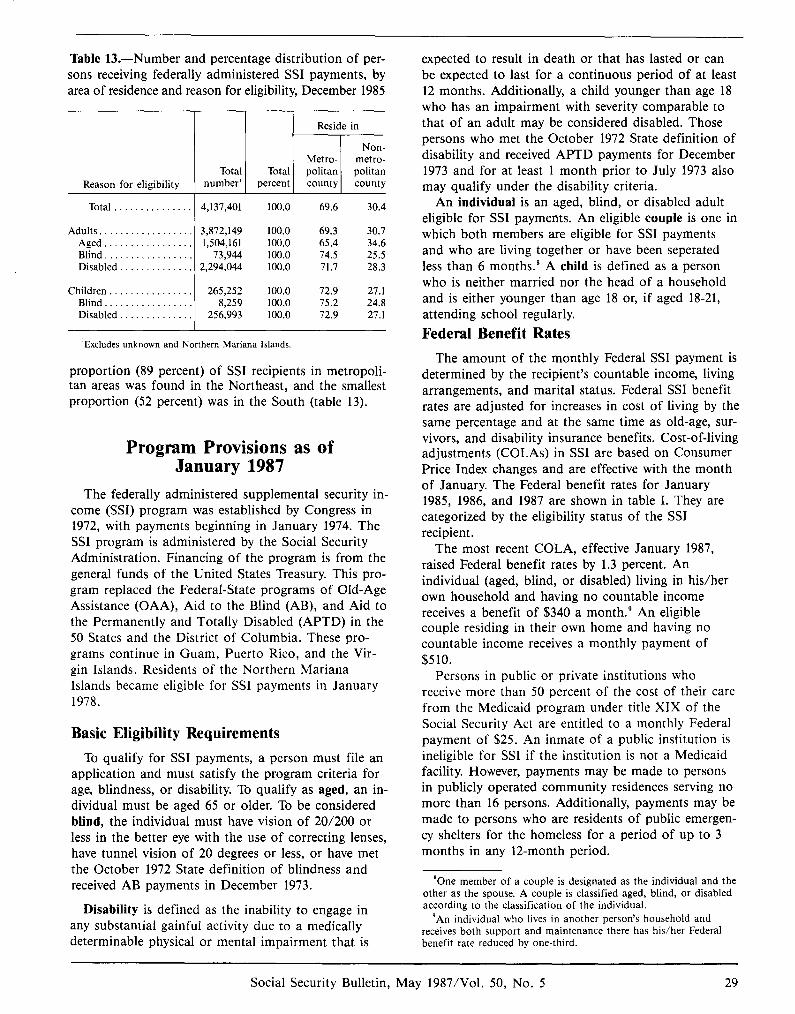
Reason for eligibility z
Total . . . 4,137,401 100.0 69.6 30.4
...... 3,872,149 100.0 69.3 30.7
...... 1,504,161 100.0 65.4 34.6
...... 73,944 100.0 74.5 25.5
...... 2,294,044 100.0 71.7 28.3
265,252 100.0 12.9 27.1 8,259 100.0 75.2 24.8
256,993 100.0 12.9 21.1
Adults. Aged. Blind. Disabled
Children Blind. Disabled
......
......
......
Table 13.-Number and percentage distribution of per- sons receiving federally administered SSI payments, by area of residence and reason for eligibility, December 1985
‘Excludes unknown and Northern Mariana Islands.
proportion (89 percent) of SSI recipients in metropoli- tan areas was found in the Northeast, and the smallest proportion (52 percent) was in the South (table 13).
Program Provisions as of January 1987
The federally administered supplemental security in- come (SSI) program was established by Congress in 1972, with payments beginning in January 1974. The SSI program is administered by the Social Security Administration. Financing of the program is from the general funds of the United States Treasury. This pro- gram replaced the Federal-State programs of Old-Age Assistance (OAA), Aid to the Blind (AB), and Aid to the Permanently and Totally Disabled (APTD) in the 50 States and the District of Columbia. These pro- grams continue in Guam, Puerto Rico, and the Vir- gin Islands. Residents of the Northern Mariana Islands became eligible for SSI payments in January 1978.
Basic Eligibility Requirements
To qualify for SSI payments, a person must file an application and must satisfy the program criteria for age, blindness, or disability. To qualify as aged, an in- dividual must be aged 65 or older. To be considered blind, the individual must have vision of 20/200 or less in the better eye with the use of correcting lenses, have tunnel vision of 20 degrees or less, or have met the October 1972 State definition of blindness and received AB payments in December 1973.
Disability is defined as the inability to engage in any substantial gainful activity due to a medically determinable physical or mental impairment that is
expected to result in death or that has lasted or can be expected to last for a continuous period of at least 12 months. Additionally, a child younger than age 18 who has an impairment with severity comparable to that of an adult may be considered disabled. Those persons who met the October 1972 State definition of disability and received APTD payments for December 1973 and for at least 1 month prior to July 1973 also may qualify under the disability criteria.
An individual is an aged, blind, or disabled adult eligible for SSI payments. An eligible couple is one in which both members are eligible for SSI payments and who are living together or have been seperated less than 6 months.8 A child is defined as a person who is neither married nor the head of a household and is either younger than age 18 or, if aged 18-21, attending school regularly.
Federal Benefit Rates
The amount of the monthly Federal SSI payment is determined by the recipient’s countable income, living arrangements, and marital status. Federal SSI benefit rates are adjusted for increases in cost of living by the same percentage and at the same time as old-age, sur- vivors, and disability insurance benefits. Cost-of-living adjustments (COLAS) in SSI are based on Consumer Price Index changes and are effective with the month of January. The Federal benefit rates for January 1985, 1986, and 1987 are shown in table I. They are categorized by the eligibility status of the SSI recipient.
The most recent COLA, effective January 1987, raised Federal benefit rates by 1.3 percent. An individual (aged, blind, or disabled) living in his/her own household and having no countable income receives a benefit of $340 a month.9 An eligible couple residing in their own home and having no countable income receives a monthly payment of $510.
Persons in public or private institutions who receive more than 50 percent of the cost of their care from the Medicaid program under title XIX of the Social Security Act are entitled to a monthly Federal payment of $25. An inmate of a public institution is ineligible for SSI if the institution is not a Medicaid facility. However, payments may be made to persons in publicly operated community residences serving no more than 16 persons. Additionally, payments may be made to persons who are residents of public emergen- cy shelters for the homeless for a period of up to 3 months in any 12-month period.
“One member of a couple is designated as the individual and the other as the spouse. A couple is classified aged, blind, or disabled according to the classification of the individual.
‘An individual who lives in another person’s household and receives both support and maintenance there has his/her Federal benefit rate reduced by one-third.
Social Security Bulletin, May 1987/Vol. 50, No. 5 29
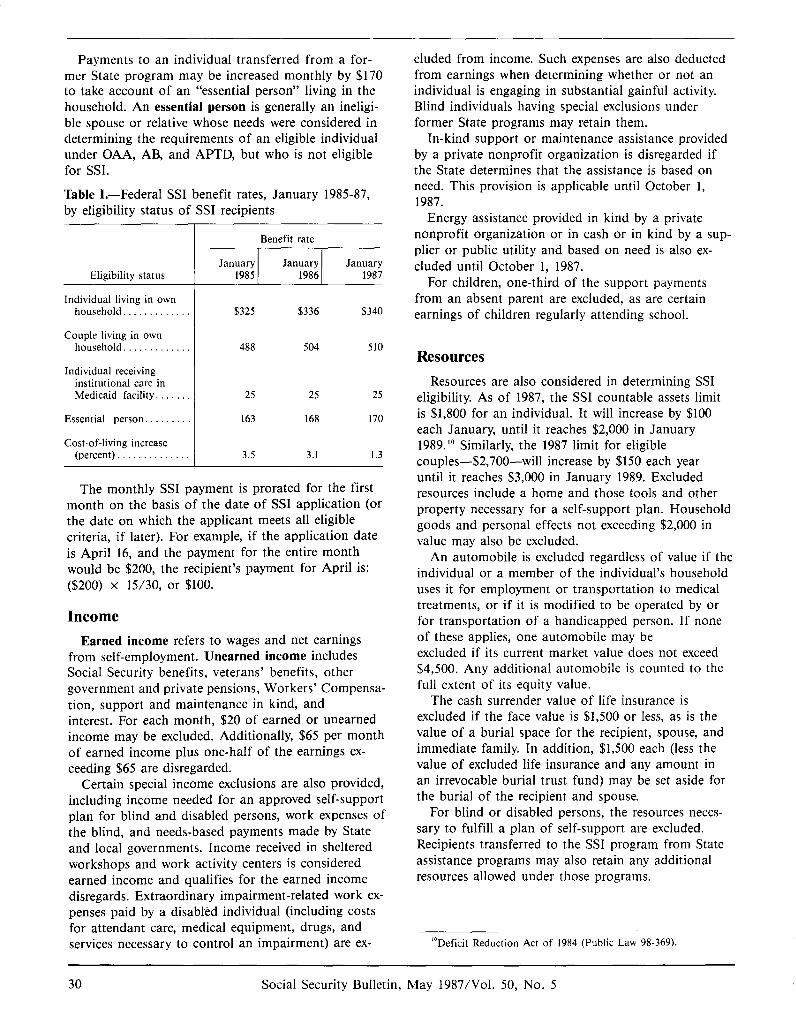
Payments to an individual transferred from a for- mer State program may be increased monthly by $170 to take account of an “essential person” living in the household. An essential person is generally an ineligi- ble spouse or relative whose needs were considered in determining the requirements of an eligible individual under OAA, AB, and APTD, but who is not eligible for SSI.
Table I.-Federal SSI benefit rates, January 1985-87, by eligibility status of SSI recipients
Benefit rate
Eligibility status
Individual living in own household. .
Couple living in own household. .
Individual receiving institutional care in Medicaid facility.
Essential person.
Cost-of-living increase (percent) . .
January January January 1985 1986 1987
$325 $336 $340
488 504 510
25 25 25
163 168 170
3.5 3.1 1.3
The monthly SSI payment is prorated for the first month on the basis of the date of SSI application (or the date on which the applicant meets all eligible criteria, if later). For example, if the application date is April 16, and the payment for the entire month would be $200, the recipient’s payment for April is: ($200) x 15/30, or $100.
Income
Earned income refers to wages and net earnings from self-employment. Unearned income includes Social Security benefits, veterans’ benefits, other government and private pensions, Workers’ Compensa- tion, support and maintenance in kind, and interest. For each month, $20 of earned or unearned income may be excluded. Additionally, $65 per month of earned income plus one-half of the earnings ex- ceeding $65 are disregarded.
Certain special income exclusions are also provided, including income needed for an approved self-support plan for blind and disabled persons, work expenses of the blind, and needs-based payments made by State and local governments. Income received in sheltered workshops and work activity centers is considered earned income and qualifies for the earned income disregards. Extraordinary impairment-related work ex- penses paid by a disabled individual (including costs for attendant care, medical equipment, drugs, and services necessary to control an impairment) are ex-
eluded from income. Such expenses are also deducted from earnings when determining whether or not an individual is engaging in substantial gainful activity. Blind individuals having special exclusions under former State programs may retain them.
In-kind support or maintenance assistance provided by a private nonprofit organization is disregarded if the State determines that the assistance is based on need. This provision is applicable until October 1, 1987.
Energy assistance provided in kind by a private nonprofit organization or in cash or in kind by a sup- plier or public utility and based on need is also ex- cluded until October 1, 1987.
For children, one-third of the support payments from an absent parent are excluded, as are certain earnings of children regularly attending school.
Resources
Resources are also considered in determining SSI eligibility. As of 1987, the SSI countable assets limit is $1,800 for an individual. It will increase by $100 each January, until it reaches $2,000 in January 1989.“’ Similarly, the 1987 limit for eligible couples-$2,700-will increase by $150 each year until it reaches $3,000 in January 1989. Excluded resources include a home and those tools and other property necessary for a self-support plan. Household goods and personal effects not exceeding $2,000 in value may also be excluded.
An automobile is excluded regardless of value if the individual or a member of the individual’s household uses it for employment or transportation to medical treatments, or if it is modified to be operated by or for transportation of a handicapped person. If none of these applies, one automobile may be excluded if its current market value does not exceed $4,500. Any additional automobile is counted to the full extent of its equity value.
The cash surrender value of life insurance is excluded if the face value is $1,500 or less, as is the value of a burial space for the recipient, spouse, and immediate family. In addition, $1,500 each (less the value of excluded life insurance and any amount in an irrevocable burial trust fund) may be set aside for the burial of the recipient and spouse.
For blind or disabled persons, the resources neces- sary to fulfill a plan of self-support are excluded. Recipients transferred to the SSI program from State assistance programs may also retain any additional resources allowed under those programs.
“Deficit Reduction Act of 1984 (Public Law 98-369).
30 Social Security Bulletin, May 1987/Vol. 50, No. 5
Deeming of Income and Resources
The income and resources of an ineligible spouse who lives with an adult recipient or those of a parent living with a child recipient younger than age 18 are considered in determining the amount of payment. If the income of the ineligible spouse exceeds $170 monthly, all of it is deemed, combined with the income of the eligible person, and treated as the in- come of an eligible couple.
If the income is earned, $65 per month and an income exclusion of $20 are deducted, along with one-half of the remaining earnings. If the income is all unearned, the $20 income exclusion is deducted. The remainder is subtracted from the Federal benefit rate for an eligible couple, currently $510. No more than $340 can be paid, however, when only one person is eligible.
When a child younger than age 18 is living with parents and their entire income is earned, the deem- ing procedure is: From the total income, subtract $170 for each ineligible child in the family (less the child’s own income), the earnings deduction of $65, and the $20 income exclusion. Next, subtract twice the in- dividual’s Federal benefit rate (in a one-parent family) or twice the couple’s Federal benefit rate (in a two- parent family). Any income remaining is unearned in- come to the child. If the income of the parents is all unearned, the $65 earnings exclusion is not applicable and the parental allocation is one Federal benefit rate.
Resources of the spouse or parent may also be deemed to a recipient when these resources are in excess of the amount that would be excluded if the spouse or parent were applying for SSI payments. Parental resources are not deemed to a child who has attained age 18.
If the applicant is an alien, the income and resources of the immigrant sponsor are considered in determining the amount of the SSI payment. After al- lowances are made for the needs of the sponsor and his or her family, the remaining income and resources are deemed available for the support of the SSI appli- cant for a 3-year period after the individual’s entry into the United States. This provision does not apply to those persons who become blind and/or disabled after entry, to refugees, or to persons granted political asylum.
State Supplementation
State supplementation payments-mandatory and optional-are made to persons eligible under State provisions. Mandatory State supplementation refers to payments required by Public Law 93-66 to maintain the income levels of former public assistance recipients at the same level that had been in effect be-
fore they were transferred to the SSI program. Optional State supplementation includes additional amounts provided by the States at their discretion to raise the payment levels of either former recipients OT persons with new awards under the SSI program
A State may choose to administer these payments or have the Social Security Administration (SSA) ad- minister the payments on its behalf. In the latter case, SSA assumes the administrative cost and is reim- bursed by the State for payment amounts. Under fed- erally administered supplementation, eligibility and payment determinations are made by SSA.
To ensure that SSI recipients gain the financial advantage intended by the annual cost-of-living increases, the States are generally required to maintain the level of their supplementation payment whenever the Federal payment level is increased. In particular, the Federal pass-through law specifies that States must maintain the State supplementary payment levels that were in effect in March 1983.
Special Monthly Benefits
A disabled recipient who becomes ineligible for Federal SSI payments because of earnings in excess of the substantial gainful activity level will continue to receive a special SSI payment or an equal amount and retain eligibility for Medicaid under title XIX of the Social Security Act. This special benefit status may continue as long as the recipient has the dis- abling impairment and earnings do not exceed the amount that would reduce the cash benefit to zero. States have the option of supplementing this special benefit.
Retention of Medicaid Eligibility
Blind and disabled recipients younger than age 65 who are no longer eligilble for either regular or special SSI benefits because the level of their earnings or other income exceeds the allowed level may retain eligibility for Medicaid. To qualify for such extended Medicaid coverage, the recipient must:
(a) continue to meet the medical criteria for disa- bility or blindness;
(b) continue to meet all other SSI eligibility standards except for earned income;
(c) be seriously inhibited from continuing em- ployment if the Medicare services were lost; and
(d) have insufficient earnings to provide a reason- able equivalent of SSI benefits (including State supplementation) and Medicaid.
These two provisions-special cash benefits and continued Medicaid eligibility-were part of the Social Security Disability Amendments of 1980 (Public Law 96-265), and were in effect from January
Social Security Bulletin, May 1987/Vol. 50, No. 5 31
1981 through December 1983. Beginning in 1984, un- Amendments of 1984 (Public Law 98-460) extended der a l-year demonstration project, these provisions the provisions through June 30, 1987. They were were continued for persons eligibile for either regular made permanent with the enactment of the Employ- or special SSI payments or continuation of Medicaid ment Opportunities for Disabled Americans Act (Pub- eligibility. The Social Security Disability Reform lit Law 99-643), November 10, 1986.
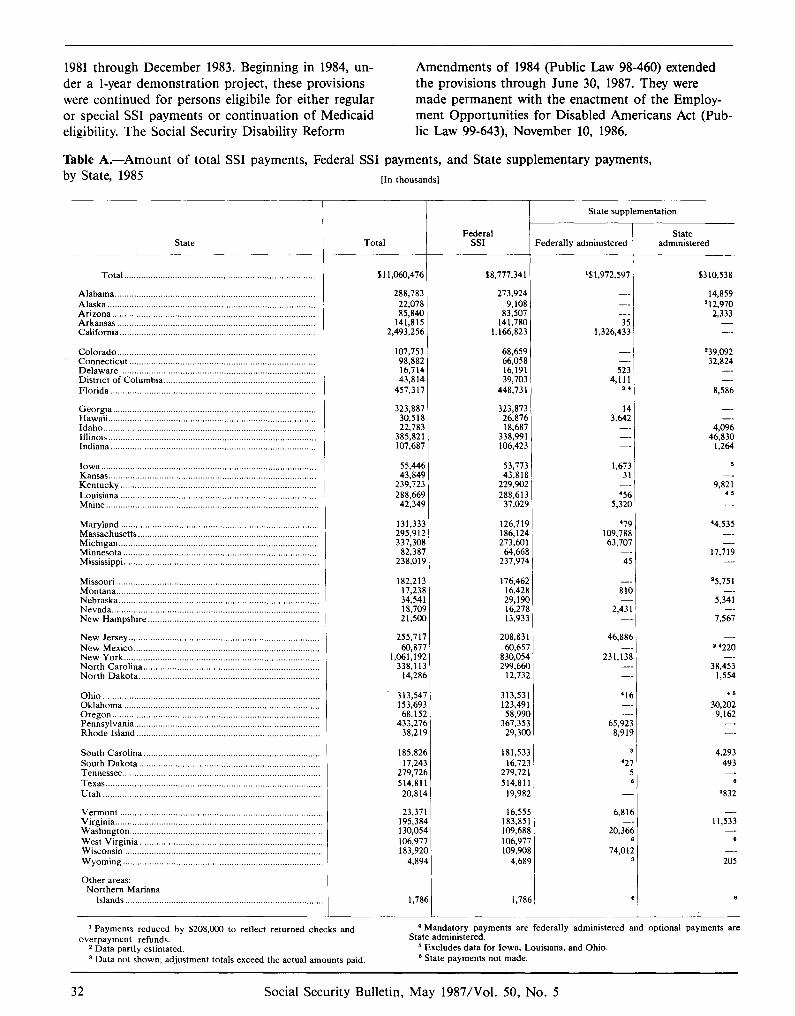
Table A.-Amount of total SSI payments, Federal SSI payments, and State supplementary payments, by State, 1985 [In thousands]
r State supplementation
ederally administered State
administered Total Federal
SSI I state
$11,060,476 58,777,341 Total.. .............................................................................
Alabama.. ................................................................................. Alaska ...................................................................................... Arizona.. .................................................................................. Arkansas .................................................................................. California.. ...............................................................................
Colorado.. ................................................................................ Connecticut .............................................................................
%1,972,597 $310,538
288,783 273,924 22,078 9,108 85,840 83,507
141,815 141,780 29493,256 1,166,823
107,751 68,659 98,882 66,058 16,714 16,191 43,814 39,703
457,317 448,731
323,887 323,873 30,518 26,876 22,783 18,687
385,821 338,991 107,687 106,423
55,446 53,713 43,849 43,818
239,723 229,902 288,669 288,613
42,349 37,029
131,333 126,719 295,912 186,124 337,308 273,601
82,387 64,668 238,019 231,974
182,213 176,462 17,238 16,428 34,541 29,19C 18,709 16,278 21,500 13,933
255,717 208,831 60,877 60,65i
1,061,192 830,054 338,113 299,66C
14,286 12,731
. 313,547 313,531 153,693 123,491 68,152 58,99(
433,276 367,352 38,219 29,30(
185,826 181,53: 17,243 16,72:
279,726 279.721 514,811 514.81: 20,814 19,98;
23,371 195,384 130,054 106,977 183,920
4,894
16,551 183,85 109,681
t :%A; 4:68’
L,786 1,781
14,859 1 12,970
2,333 -_ s
1,326,433
239,092 32,824
Delaware ................................................................................. District of Columbia.. .............................................................
8.586 Florida .....................................................................................
Georgia.. .................................................................................. Hawaii.. .................................................................................... Idaho.. ...................................................................................... Illinois ...................................................................................... Indiana .....................................................................................
IOW3.. ....................................................................................... Kansas.. ................................................................................. . .. Kentucky.. ............................................................................ . .. Louisiana ................................................................................. Maine.. .....................................................................................
4,096 46,830
1,264
1,673 31
-. ‘56
5,32C
*75 109,78E 63,707
7;
‘4,535 -_
17,719 -.
25,751 -_
5,341 -_
7,561
= ‘220
38,453 1,554
45 30,202
9,162
Massachusetts ........................................................................... Michigan.. ................................................................................ Minnesota ................................................................................. Mississippi.. ...............................................................................
Missouri.. .................................................................................. Montana.. .................................................................................. Nebraska.. ................................................................................. Nevada.. .................................................................................... New Hampshire .......................................................................
New Jersey.. ............................................................................. New Mexico.. ........................................................................... New York.. ............................................................................... North Carolina.. ....................................................................... North Dakota ...........................................................................
Ohio .......................................................................................... Oklahoma ................................................................................. Oregon.. .................................................................................... Pennsylvania ............................................................................. Rhode Island ............................................................................
South Carolina ......................................................................... South Dakota ........................................................................... T~llll~SS~‘?.. ............................................................................... Texas.. ...................................................................................... Utah ..........................................................................................
Vermont .................................................................................. Virginia.. .................................................................................. Washington .............................................................................. West Virginia .......................................................................... Wisconsin ................................................................................ Wyoming.. ...............................................................................
Other areas: Northern Mariana
Islands.. ....................................................................
8; )
2,431 ;
46,88t
231,1?-l - -
‘11 -
65.92: 8.91’
4,293 493 ‘2
6
‘832
6,811
20,3; 11,533
B
-_
205
B e
I
1 Payments reduced by S208,ooO to reflect returned checks and overpayment refunds.
* Data partly estimated. 3 Data not shown; adjustment totals exceed the actual amounts paid
’ Mandatory payments are federally administered and optional payments are State administered.
5 Excludes data for Iowa, Louisiana, and Ohio. e State payments not made.
32 Social Security Bulletin, May 1987/Vol. 50, No. 5
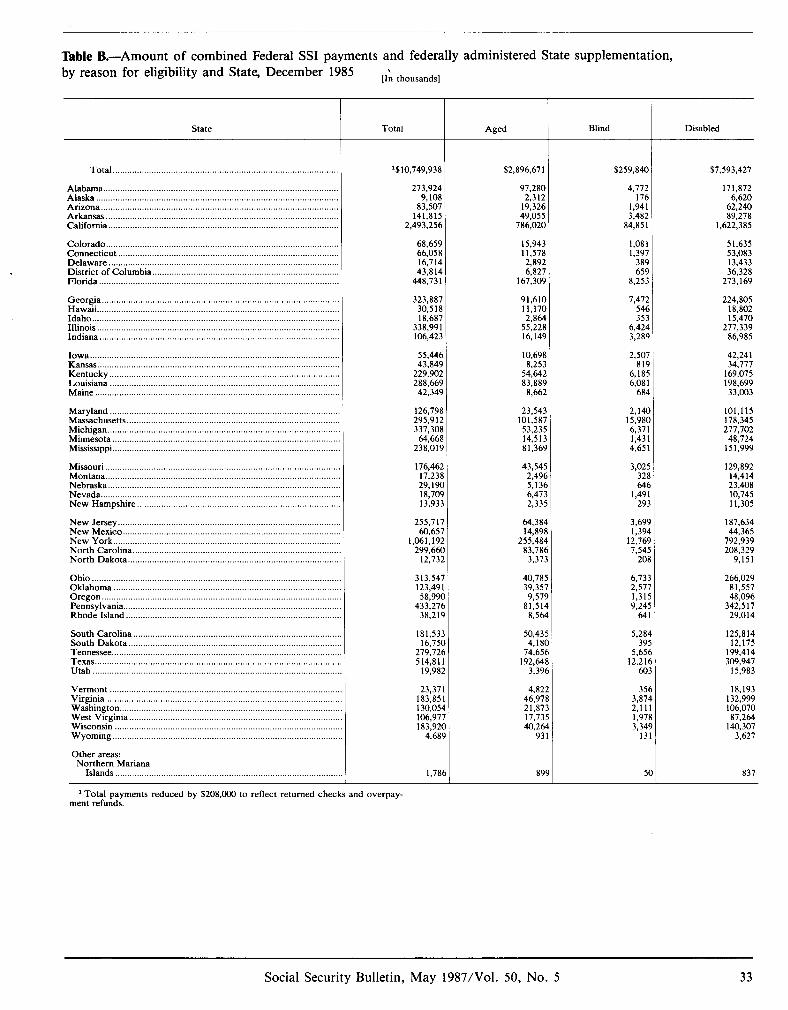
Table B.-Amount of combined Federal SSI payments and federally administered State supplementation, by reason for eligibility and State, December 1985 [I‘, thousands]
state Total Aged Blind
Total .............................................................................................
Alabama.. ............................................................................................... Alaska .................................................................................................... Arizona.. ................................................................................................ Arkansas ................................................................................................ California ...............................................................................................
Colorado.. .............................................................................................. Connecticut ........................................................................................... Delaware ............................................................................................... District of Columbia ............................................................................. Florida ...................................................................................................
Georgia .................................................................................................. Hawaii.. .................................................................................................. Idaho.. .................................................................................................... Illinois .................................................................................................... Indiana.. .................................................................................................
Iowa.. ..................................................................................................... Kansas .................................................................................................... Kentucky.. ............................................................................................. Louisiana ............................................................................................... Maine .....................................................................................................
Maryland ............................................................................................... Massachusetts.. ...................................................................................... Michigan.. .............................................................................................. Minnesota ............................................................................................. Mississippi ..............................................................................................
Missouri.. ............................................................................................... Montana.. ............................................................................................... Nebraska ................................................................................................ Nevada ................................................................................................... New Hampshire ....................................................................................
New Jersey.. ......................................................................................... New Mexico.. ....................................................................................... New York.. ........................................................................................... North Carolina.. ................................................................................... North Dakota.. .....................................................................................
Ohio ...................................................................................................... Oklahoma ............................................................................................. Oregon .................................................................................................. Pennsylvania ......................................................................................... Rhode Island ........................................................................................
South Carolina ..................................................................................... South Dakota ....................................................................................... Tennessee.. ............................................................................................ Texas.. ................................................................................................... Utah ......................................................................................................
Vermont ............................................................................................... Virginia.. ............................................................................................... Washington.. ......................................................................................... West Virginia.. ..................................................................................... Wisconsin ............................................................................................. Wyoming ..............................................................................................
Other areas: Northern Mariana
Islands .............................................................................................
.I
:I
‘510,749,938 $2,896,671 5259,840 57,593,427
273,924 97,280 9,108 2,312
83,507 19,326 141,815 49,055
2,493,256 786,020
4.772 171.872 ‘176
1,941 3.482
84,851
6;620 62,240 89,278
1,622,385
68,659 66,058 16.714 43:814
448,731
323,887 91,610 7,472 30,518 11,170 546 18,687 2,864 353
338,991 55,228 6,424 106,423 16,149 3,289
55,446 43,849
229,902 288,669
42,349
10,698 8.253
54;642 83,889
8,662
126,798 23,543 295,912 101,587 337,308 53,235
64,668 14,513 238,019 81,369
176.462 43.545 17;238 29,190 18,709 13,933
255.717 60,657
1,061,192 299,660
12,732
313,547 123,491 58,990
433,276 38,219
181,533 16,75C
279,726 514,811
19,982
23,371 183.851 130;054
i% 41685
1,78(
1 Total payments reduced by 16208,COO to reflect returned checks and overpay- ment refunds.
15,943 1,081 11,578 1,397 2,892 389 6,827 659
167,309 8,253
2;496 5,136 6.47: 2;335
64,384 14,89I
255,484 83,78t
3,37:
40,781 39,35; 9,575
81,514 8,56r
50,43! 4,18(
74,65t 192,641
3.39t
4,82: 46,971 21,87: 17,73! 40,26
93
89’
2,507 815
6,18f 6,081
684
2,14i 15,98( 6,371 1,431 4,65 I
3,021 321 64(
1,491 29:
3.69’ 1,391
12,76! 7,54!
201
6,731 2,57’ 1,31: 9,24:
64
5.28, 39
5,651 12,211
60
35’ 3,87, 2,11 1,97 3,34
13
51.635 53,083 13.433 36;328
273,169
224,805 18,802 15,470
277,339 86,985
42,241 34,777
169,075 198,699 33,003
101,115 178,345 277,702
48,724 151,999
129.892 14;414 23,408 10.745 11;305
187,634 44,365
792,939 208,329
9,151
266,029 81,557 48,096
342,517 29,014
125,814 12.175
199;414 309,947
15,983
18,193 132,999 106,070 87.264 ,~~
140,307 3,627
837
Social Security Bulletin, May 1987/Vol. 50, No. 5 33
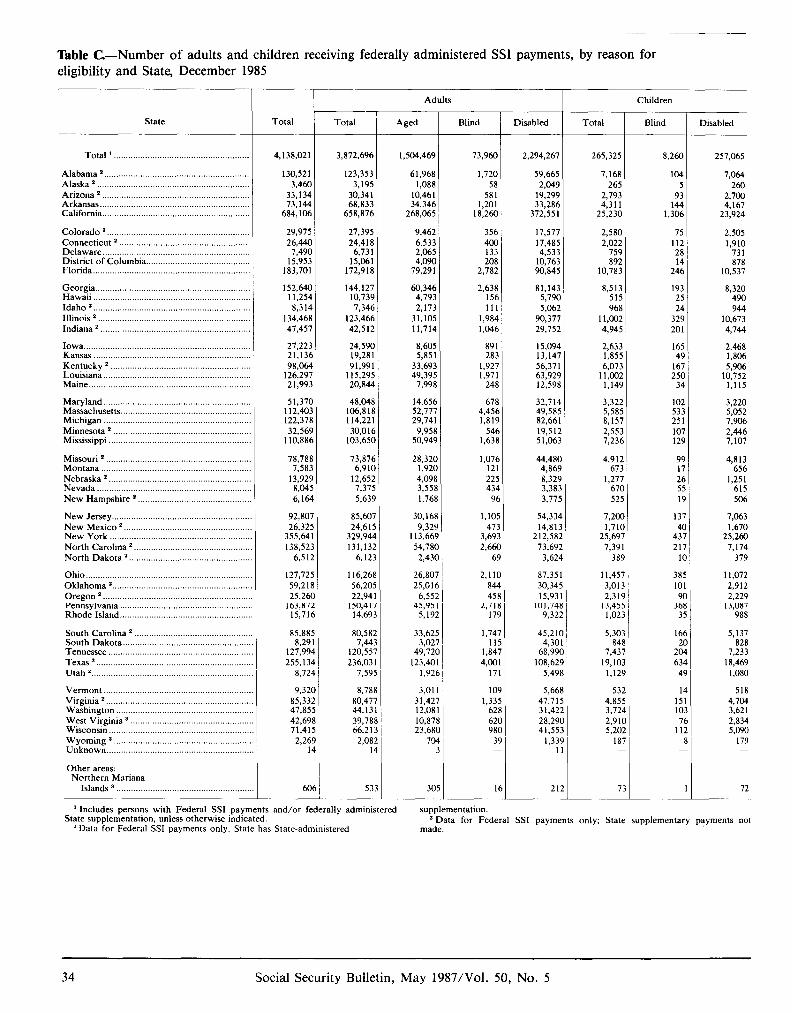
Table C-Number of adults and children receiving federally administered SSI payments, by reason for eligibility and State, December 1985
state Total Total Aged Blind
Total 1 _,..........._.._.__..........................,.,,......
Alabama z ............................................................ Alaska * ............................................................... Arizona 2 ............................................................. Arkansas .............................................................. California .............................................................
Colorado z ........................................................... Connecticut * ...................................................... Delaware.. ........................................................... District of Columbia.. ......................................... Florida.. ...............................................................
Georgia ................................................................ Hawaii ................................................................. Idaho 2 ................................................................. Illinois * ............................................................... Indiana * ..............................................................
Iowa.. ................................................................... Kansas ................................................................. Kentucky = .......................................................... Louisiana ............................................................. Maine.. .................................................................
Maryland ............................................................. Massachusetts.. .................................................... Michigan ............................................................. Minnesota * ......................................................... Mississippi ...........................................................
Missouri 2 ............................................................ Montana .............................................................. Nebraska * ........................................................... Nevada ............................................................... New Hampshire * ..............................................
New Jersey ......................................................... New Mexico * .................................................... New York .......................................................... North Carolina * ................................................ North Dakota 2.. ................................................
Ohio. ................................................................... Oklahoma 2 ......................................................... Oregon * ............................................................. Pennsylvania ...................................................... Rhode Island.. ....................................................
South Carolina * ................................................ South Dakota.. ................................................... Tennessee ........................................................... Texas 3 ................................................................ Utah * ..................................................................
Vermont ............................................................. Virginia 2 ............................................................ Washington ....................................................... West Virginia 3 ................................................. Wisconsin .......................................................... Wyoming * ........................................................ Unknown ...........................................................
Other areas: Northern Mariana
r Adults
4,138,021 3,872,696 1,504,469 73,960 2,294,267 265,325 8,260 257,065
130,521 123,353 61,968 1,720 3.460 3,195 1,088 58
33,134 30,341 10,461 581 73,144 68,833 34,346 1,201
684,106 658,876 268,065 18,260
59,665 2,049
19.299 33;286
372,551
7,168 265
2,793 4,311
25,230
104 5
93
1,::
7,064 260
2,700 4,167
23,924
29,975 21,395 9,462 356 26,440 24,418 6,533 400
7,490 6,731 2,065 133 15,953 15,061 4,090 208
183,701 172,918 79,291 2,782
17,577 I 17,485 4,533
10,763 90,845
2,580 75 2,505 2,022 112 1,910
759 28 731 892 14 878
10,783 246 10,537
152,610 144,127 60,346 2,638 81,143 1 8,513 193 8,320 11,254 10,739 4,793 156 5,790 515 25 490 8,3 14 7,346 2,173 111 5,062 968 24 944
134,468 123,466 31,105 1,984 90,377 11,002 329 10,673 47,451 42,512 11,714 1,046 29,752 4,945 201 4,744
21,223 24,590 8,605 891 21,13( 19,281 5,851 283 98,064 91,991 33,693 1,927
126,291 115,295 49,395 1,971 21,992 20,844 7,998 248
15,094 13,147 56.371 63;929 12,598
2,633 165 2,468 1,855 49 1,806 6,073 167 5,906
11,002 250 10,752 1,149 34 1,115
51,37C ;;y;
321561 110,88(
48,048 14,656 678 32,714 1 3,322 102 3,220 106,818 52,777 4,45f 49,585 5,585 533 5,052 114,221 29,741 1,815 82,661 8,157 251 7,906 30,016 9,958 54f 19,512 2,553 107 2,446
103,650 50,949 1,63E 5 1,063 7,236 129 7,107
78,78E 73,876 28,32C 1.07t 44,480 4,912 99 4,813 7,58: 6,910 1,92C 121 4,869 673 17 656
13,925 12,652 4,098 22: 8,329 1,271 26 1,251 8,04! 7,315 3,558 43r 3,383 67C 55 615 6,16‘ 5,639 1,76E 9( 3,775 525 19 506
92,80 85,607 30,16f 1,101 54,334 7,2oC 137 7,063 26,32! 24,615 9,325 47: 14,813 1,71c 40 1,670
355,64 329,944 113,665 3,69. 212,582 25969; 437 25,260 138,52. 131,132 54,78( 2,66( 73,692 7,391 217 7,174
6,51: 6,122 2,43( 6’ 3,624 385 10 379
127,72: 59.211 25,26(
163,87: 15,711
116,26E 56,205 22,941
‘;2;;;
26,80: 25,01(
6,55: 45,95
5,19:
87,351 30,345 15.931
101;748 9,322
11,45; 385 11,072 3,01: 101 2,912 2,311 90 2,229
13,451 368 13,087 1,021 35 988
85,88 80,58; 33,621 1,74 45,210 5,30: 166 5,137 8,29 7,44: 3,02’ 11 4,301 841 20 828
127,99, 120,55: 49,721 I ,84 68,990 7,43’ 204 7,233 255,13, 236,03 1 123.40 4@ 108,629 19.10: 634 18,469
8,72 7,591 1,921 17 5,498 1.12’ 49 1,080
9,321 8,781 85,33 80,47- 47,85 44,13 42.69 39,781 71.41 66,21.
2.26 2,08: I 11
3,Ol 10 31,42’ 1,33 12,08 62 10,87, 62 23,681 98
7@ 3
5,668 53: 47,715 4,851 31,422 3,72‘ 28,290 2,91( 41,553 5,20:
1,339 18’ 11 -
14 151 103
lE 8
518 4,704 3,621 2,834 5,090
179
60 53 30 1 212 7 1 72
Children
TGTpzc
‘Includes persons with Federal SSI payments and/or federally administered supplementation State supplementation, unless otherwise indicated.
* Data for Federal SSI payments only. State has State-administered 3 Data for Federal SSI payments only; State supplementary payments not
made.
34 Social Security Bulletin, May 1987/Vol. 50, No. 5
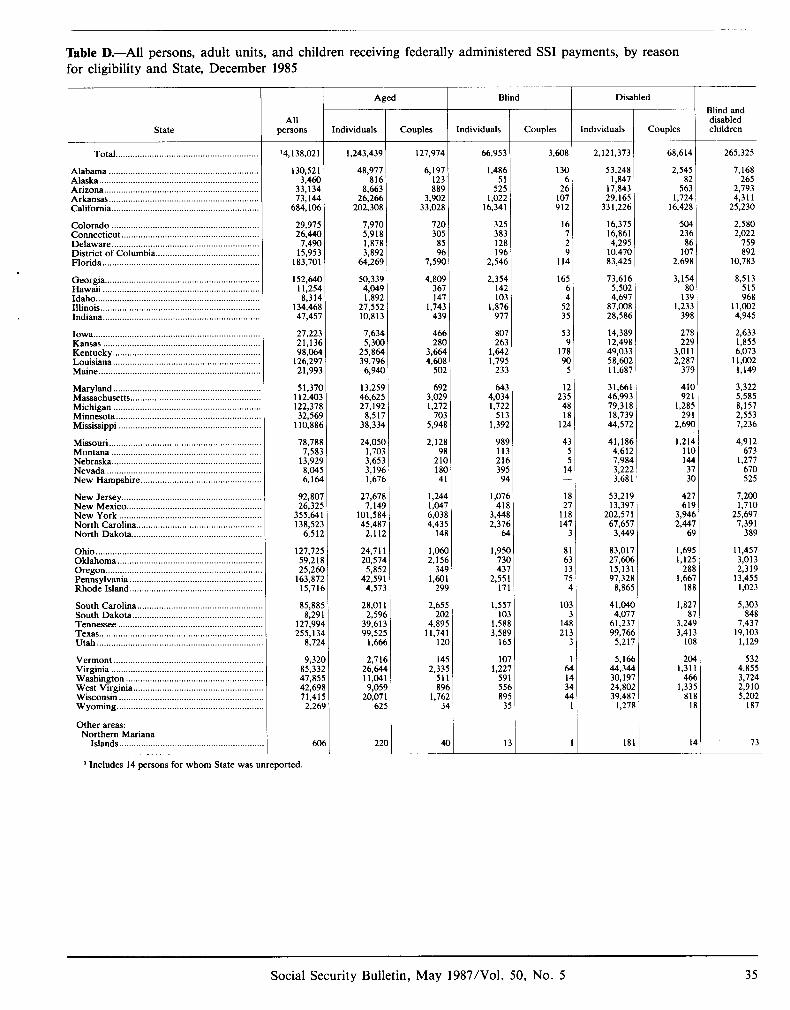
Table D.-All persons, adult units, and children receiving federally administered SSI payments, by reason for eligibility and State, December 1985
r r Blind I
Disabled
Blind and disabled children Couples ndividuals 1 Couples 1 Individuals ’
66,953 3,608 2,‘2’,373
Couples State
Total ...........................................................
Alabama .............................................................. Alaska.. ................................................................ Arizona.. .............................................................. Arkansas .............................................................. California .............................................................
Colorado ............................................................ Connecticut.. ......................................................
t ‘,243,439 ’ ‘27,974 68,614 265,325
2,545
5:: 1.724
‘6;428
7,168 265
2,793 4,311
25,230
504 236
1:; 2,698
2,580 2,022
759 892
‘0,783
3,154 8,513 80 5’5
‘39 968 1,233 II,002
398 4,945
278 229
3,Ol I 2,287
379
2,633 1,855 6,073
‘1,002 1,149
410 92’
1,285 29’
2,69C
3,322 5,585 8,157 2,553 1,236
1,214 I la ‘44
:z
4,912 673
1,277 670 525
427 6’9
3,946 2,447
65
7,200 1,710
25,697 7,391
389
1,695 l,l2i
288 I ,66i
l8f
‘1,457 3,013 2,319
‘3,455 1,023
1,82:
3,2:i 3.41:
101
5,303 848
7,437 19,103
1,129
5,‘6t i 2@ 44,34r 1 1.3’ 30,19: 1 461 24,80: , 1,33: 39.48’ 1 8’1
1,271 3 I1
532 4,855 3,724 2,910 5,202
‘87
73
‘4,138,02 I
‘30,521 48,977 3,460 8’6
33,134 8,663 73,144 26,266
684, ‘06 202,308
6,197 ‘23
130 61
26 ‘07 9’2
53,248 1,847
17,843 29,165
331,226
‘6,375 ‘6,861 4,295
‘0,470 83,425
73,616 5,502 4.697
1,486 51
525 1,022
‘6,341
889 3,902
33,028
29,975 7,970 26,440 5,918
7,490 1,878 15,953 3,892
‘83,701 64,269
720 305
85
325 383 128 ‘96’
2,546
‘6 7 2 9
“4
‘65
Delaware.. .......................................................... District of Columbia.. ........................................ 96
7,590
4,809 2,354 367 ‘42 147 ‘03
1,743 1,876 439 977
Florida ................................................................
Georgia ............................................................... Hawaii ................................................................ Idaho ................................................................... Illinois ................................................................. Indiana ................................................................
Iowa.. .................................................................. Kansas ................................................................ Kentucky ............................................................ Louisiana ............................................................ Maine ..................................................................
Maryland.. .......................................................... Massachusetts ..................................................... Michigan ............................................................ Minnesota ........................................................... Mississippi ..........................................................
Missouri .............................................................. Montana ............................................................. Nebraska.. .......................................................... Nevada .............................................................. New Hampshire.. ..............................................
New Jersey.. ...................................................... New Mexico.. ....................................................
. 152,640
11,254 8,314
134,468 41,457
50.339 4;049 1,892
27.552
6 4
lo;813 52 87;008 35 28,586
27,223 21,136 98,064
‘26,297 21,993
7,634 5.300
25;864 39,796
6,940
466 280
3,664 4,608
502
807 263
1,642 1.795 ‘233
53
‘7;: 90
5
‘4,389 ‘2,498 49,033 58,602 ‘1,687
51,370 13,259 692 643 ‘2 31,661 112,403 46,625 3,029 4,034 235 46,993 ‘22,378 27,192 1,272 1,722 48 79,318 32,569 8,517 703 5’3 ‘8 18,739
“0,886 38,334 5,948 1,392 ‘24 44,572
78,788 24,050 2,128 7,583 1,703 98
‘3,929 3,653 2’0 8,045 3,196 l8C 6,164 1,676 4’
92,807 21,678 26,325 7,149
355,641 101,584 ‘38,523 45,481
6,512 2,112
989 ‘13 216 395
94
43 5
1: -
41,186 4,612 7,984 3,222 3,681
1.244 I;047 6,03E 4.43:
1,076 4’8
3,448 2,376
64
‘8 27
“8 ‘47
53,219 ‘3,397
202,571 67,651
3,449
127,725 24.7’ I 59,218 20,574 25,260 5,852
163,872 42,591 ‘5,716 4,573
New York ......................................................... North Carolina.. ................................................ North Dakota.. .................................................. “41 3 ,
8’ 83,011 63 27,606 ‘3 ‘5,131 75 97,32E
4 8,865
4’,04( 4,077
61.23; 99,76(
5.2’;
18 I
‘,06( 2.15t
1,950 730 437
2,551 ‘7’
1,557 103
1,588 3,589
‘65
Ohio. .................................................................. Oklahoma.. ........................................................ Oregon ............................................................... Pennsylvania ..................................................... Rhode Island.. ...................................................
South Carolina .................................................. South Dakota.. .................................................. Tennessee .......................................................... Texas .................................................................. Utah.. .................................................................
Vermont.. .......................................................... Virginia ............................................................. Washington ....................................................... West Virginia.. .................................................. Wisconsin .......................................................... Wyoming.. .........................................................
Other areas: Northern Mariana
Islands .........................................................
‘34: 1,601
291
85,885 28.0” 8,291 2,59t
‘27.994 39.6’2
2,651 20:
4,891 ‘1.74’
l2(
‘03
14e 255;134 99;52f
8,724 1,66t
9,32C 2,71t 85,332 26,64r 47,855 ‘1,041 42,698 9,05! 71,4’! 20.07 1
2.26s 62f
‘41 ‘01 2,331
51 1,221
59’ 556 895
35
61 14
2 I
6ot 22(
’ Includes I4 persons for whom State was unreported
Social Security Bulletin, May 1987/Vol. 50, No. 5 35
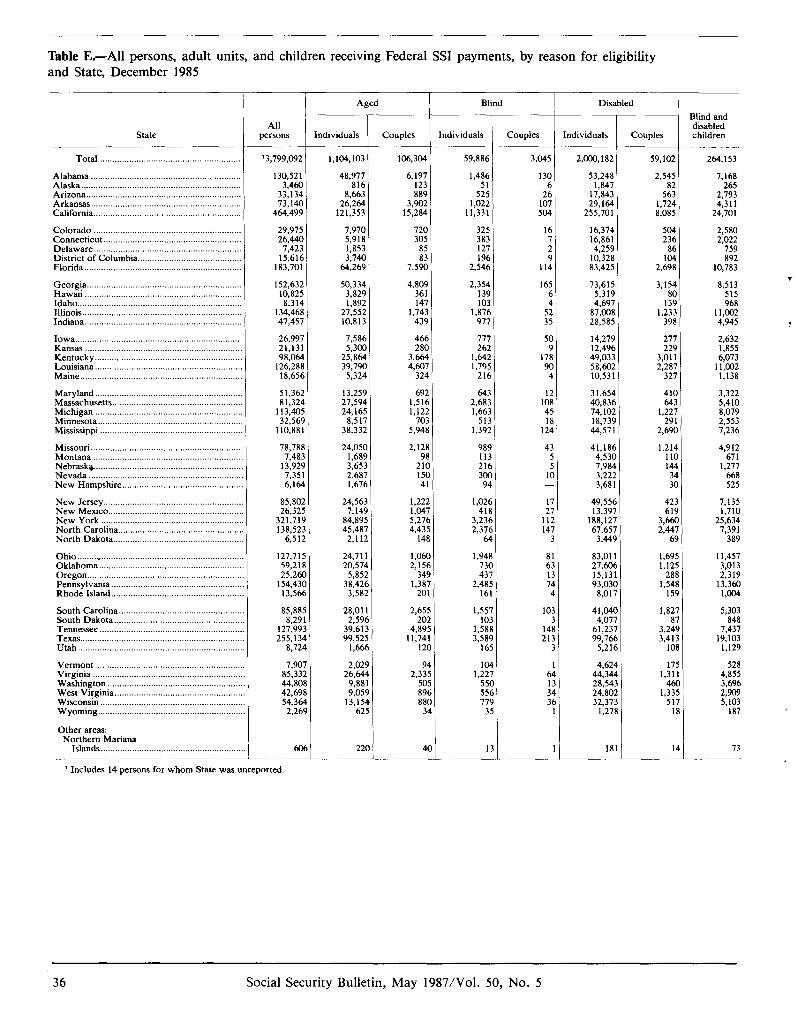
Table E.-All persons, adult units, and children receiving Federal SSI payments, by reason for eligibility and State, December 1985
state
Total.. .........................................................
Alabama .............................................................. Alaska.. ................................................................ Arizona.. .............................................................. Arkansas .............................................................. Californ’ la. ............................................................ Colorado ............................................................. Connecticut.. ....................................................... Delaware.. ........................................................... District of Columbia.. ......................................... Florida. ................................................................
Georgia.. .............................................................. Hawaii ................................................................. Idaho .................................................................... Illinois.. ................................................................ Indiana .................................................................
Iowa ..................................................................... Kansas ................................................................. Kentucky.. ........................................................... Louisiana.. ........................................................... Maine.. .................................................................
Maryland ............................................................. Massachusetts ...................................................... Michigan ............................................................. Minnesota ............................................................ Mississippi ...........................................................
Missouri ............................................................... Montana .............................................................. Nebrasks.. ........................................................... Nevada ................................................................ New Hampshire ..................................................
New Jersey. ......................................................... New Mexico ........................................................ New York ........................................................... North Carolina ................................................... North Dakota ......................................................
Ohio.. .... ..” .......................................................... Oklahoma.. ......................................................... Oregon ................................................................ Pennsylvania ...................................................... Rhode Island.. ....................................................
South Carolina ................................................... South Dakota ..................................................... Tennessee ........................................................... Texas ................................................................... Utah ....................................................................
Vermont ............................................................. Virainia .............................................................. WaShington ........................................................ West Vireinia.. ................................................... Wisconsin .._............. .._. ._.._...... Wyoming .._......................................................
Other areas: Northern Mariana
Islands . .._____._...._............................................
All peEO”S 1 1 ndividuals Couples Individuals
- I I I ‘3,799$X2 1,104,‘03 ‘06,304 59,886 3,045
‘30,521 48,977 6,197 1,486 3,460 8’6 123 5’
33,134 8,663 889 525 73,140 26,264 3,902 1,022
464,499 ‘21,353 15,284 11,331
‘30 6
26 ‘07 504
29,975 7,970 26,440 5,918
7,423 1,853 ‘5,616 3,740
‘83,701 64,269
720 305
i: 7,590
325 ‘6 383 7 127 2 ‘96 9
2,546 “4
‘52,632 50,334 4,809 2,354 ‘0,825 3,829 36’ ‘39 8,314 1,892 ‘47 ‘03
134,468 27,552 1,743 1,876 47,457 10,813 439 977
‘65 6
5’: 35
26,997 7,586 466 777 50 21,131 5,300 280 262 9 98,064 25,864 3,664 1,642 ‘78
126,288 39,790 4,607 1,795 90 ‘8,656 5,324 324 2’6 4
51,362 81,324
“3,405 32,569
‘10,881
‘3,259 692 643 27,594 1,516 2,682 24, ‘65 1,122 I.663
8,517 703 51: 38,332 5,948 1,392
12 108 45 I8
‘24
78,788 7,482
‘3,925 7,351 6,164
24,050 2,128 985 I 1,689 98 11: I 3,653 210 2lf i 2,681 ‘50 30( ) 1,676 4’ 94 I
43 5 5
IO
85,802 , 24,563 1,222 I ,02t i ‘7 26,321 , 7,149 1,047 4’1 1 27
321,715 P 84,895 5,276 3,23( 5 “2 ‘38.52: ) 45,487 4,435 2,37( 5 ‘47
6,512 , 2,112 ‘48 gr 1 3
127,711 5 24,7l I 1,060 1,941 59,211 3 20,574 2,156 73( 25,26( 1 5,852 349 43’
‘54,43( 1 38,426 1,387 2.48: 13,56( 5 3,582 201 ‘6
:: I3 74 4
85,881 8,29
‘27,99: 255,13~
8,72L
28,ol I 2,655 I,55 2,596 202 10.
39,613 4,895 1,581 99,525 11,741 3,S8’
1,666 ‘20 16:
IO! ?
14; 211
7.90 85,33: 44.80 42,691 54,3&
2,26(
2,029 94 26,644 2,335
9.88 I 505 9,059 896
13,154 880 625 34
: 1 5 I
7 3 E 9 5
0 7 0 6 9 5
3
IO I,22
551 551 77’
3
1
64 Ii 34 3f
60
’ Includes I4 persons for whom State was unreported.
r Disabled I
individuals
2,OCQl82
53,248 1,847
‘7,843 29,164
255,701
‘6,374 ‘6,861 4,259
‘0,328 83,425
73,615 5,319 4,697
87,008 28,585
‘4,279 12,496 49,033 58,602 ‘0,531
31,654 40,836 74,102 ‘8,739 44,571
41.186 4;53c 7,984 3.222 3;681
49,556 ‘3,397
‘;y’
3:44;
83,ol I 27,606 ‘5,131 93,03(
8,Ol;
4’,04( 1
4,07: 7 61.23’ 7 99,76( 5
5,21( 5
4,62r 44.34 28,541 24,80: 32.37:
1,271
18
r
/
59,102
2,545 82
563 1,724 8,085
504 236
86
2,E
3,154 80
‘39 1,233
398
277 229
3,011 2,287
327
410 643
1,227 29’
2,690
1,214 ‘10 ‘44 34 30
423 6’9
3,660 2,447
69
1,695 1,125
288 1,548
‘59
1,827
3.2:; 3,413
‘08
‘75 1,311
460 1,335
5’7 ia
264,153
7,168 265
2,793 4,311
24,701
2.580 2;022
759 892
‘0,783 l
8,513 5’5 968
‘1,002 4,945 9
2,632 1,855 6,073
‘1,002 1,138
3,322 5,410 8,079 2,553 7,236
4.9’2 ‘671
1,277 668 525
7,135 1,710
25,634 7,391
389
‘1,457 3,013 2,319
‘3,360 I.004
5,303 848
7,437 ‘9,103
1,129
528 4,855 3,696 2.909 5;,03
187
Social Security Bulletin, May 1987/Vol. 50, No. 5

Table F.-All persons, adult units, and children receiving Federal SSI and federally administered State supplementary payments, by reason for eligibility and State, December 1985
T Disabled
iiIz7 Couples
Ad I Blind and
disabled children
L
All persons Individuals Couples State Individuals ! Couples
Total 1 .......................................................
Arkansas.. ........................................................... California.. .......................................................... Delaware.. .......................................................... District of Columbia.. ........................................ Florida s .............................................................
Georgia.. ............................................................. Hawaii ................................................................
1,321,9’8 344,480 28,392 24,784
126 448,648
357 14,750
6
117,8E 15,2:;
3,3z 8: -- -_
ll,O5’: 25
‘89
9,2:: 1,740
4;:
/
,
,
, I ,
I I i 1 i I
3,,:: 120
36:
33; 11
12
5,006
26.3;; 22,830
72
324 2
1,515 1,119
3
2,6:: 149 22,929 1,218 77,971 5,268
33 3
35,213 1,380 3,240 20’
22 2
1.90: 9i 9,292 499
‘1,875 a79
987
503
9
763,261
246.5:: 249
9,912
17,384
8,062
lo: -_
89,745
22,662 ‘4
818
42s ‘42
5
1,042
5,d 7,536
I
‘45 45
6,645 23,345
4
‘2,603 942
-.
26 4,603
606 72 25
I 78 IO
I
-. 6
43 Kansas ................................................................ Louisiana ............................................................
Maine.. ................................................................ Maryland.. .......................................................... Massachusetts ..................................................... Michigan ............................................................ Mississippi ..........................................................
Montana ............................................................. Nevada ............................................................... New Jersey. ........................................................ New York ..........................................................
-. -.
‘7,706 224
77,063 ‘08.031
‘2’6
205
2,d 1,620
5
‘0,036 ‘67
38,332 70,927
78
327
642 1,221
4 I
107 45
-.
781 3,295
81,012 302,066
‘53
145,431 12,4Oi
7:
7 607 I5
47,024 ‘78,032
9’
rc 1;
lli -.
293 988
3,138 4
42’ 3,649
5
1,544 159
2 I
175 456 5’3
Pennsylvania ...................................................... Rhode Island.. .................................................... South Dakota.. .................................................. Tennessee .......................................................... Vermont ............................................................. Washington ........................................................ Wisconsin.. ........................................................
2,3+X l5!
1 I
E 67i
88,385 7,290
43 1’
4,426 26.58’ 28;953
7,5:1 41,596 48,801 I 484
3,267 4,549
1 Includes 8 persons for whom State was unreported. * Data not available by reason for eligibility.
Social Security Bulletin, May 1987/Vol. 50, No. 5 37
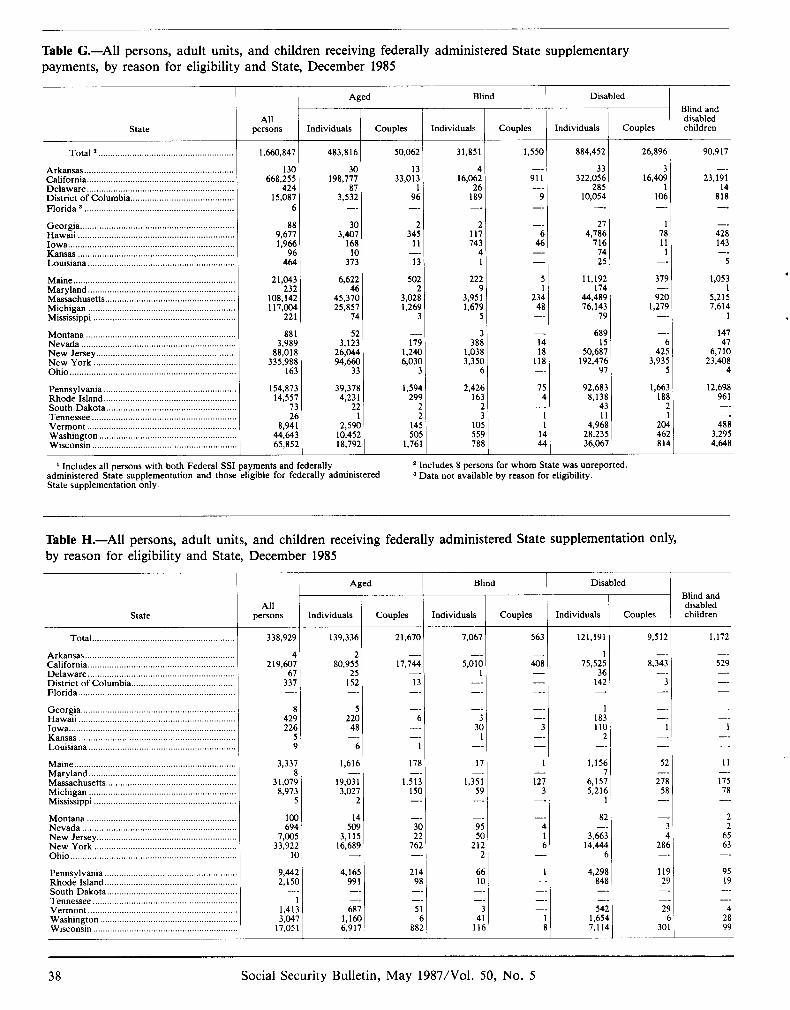
Table G.-All persons, adult units, and children receiving federally administered State supplementary payments, by reason for eligibility and State, December 1985
I I Aged I Blind I Disabled
Couples Individuals Couples
Blind and disabled children
884,452 26,896
1 78
379
920 1,279
-_
428 143 -_
5
1,053
5,21: 7,614
1
689 -_ 15 6
50,687 425 192,476 3,935
97 5
147 47
6,710 23,408
4
1,663 12,698 188 961
1
24 462 814
488 3,295 4,648
: state
All peBO”S Individuals Couples Individuals
Total * ..t....... 1,660,847 483,816 50,062 31,851
4 16,062
26 189
2 117 743
4
1,550
911 -_
9
130 668,255
424 15.087
33,01: 1
96 6
30 198,777
3,5:: -_ -_
9,6;!: 1,966
96 464
34: 11
Ti
21,043 6,622 232 46
108,142 45,370 117,004 25,851
221 74
502 222
3,0*: 3,95; 1,269 1,679
3 5
881 3,989
88,018 335,988
163
3,1:: 179 26,044 1,240 94,660 6,030
33 3
38f 1,038 3,35(
t
154,873 39,378 1,594 14,557 4,231 299
73 22 2
8,9:; 2,5; 14: 44,643 10,452 505 65,852 18,792 1,761
2,42t 161
10: 551 781
Arkansas.. ............................................................ California.. ........................................................... 322,O::
285 10,054
-_
Delaware.. ........................................................... District of Columbia.. ......................................... Florida 3 ..............................................................
Georgia.. .............................................................. Hawaii .................................................................
716
:‘:
IOW3 .....................................................................
Kansas ................................................................. Louisiana .............................................................
Maine.. ................................................................. Maryland ............................................................. Massachusetts.. .................................................... Michigan ............................................................. Mississippi ...........................................................
Montana ..............................................................
11,192 174
44,489 76,143
79
‘I 23: 48
‘I -_
92,683 8,138
43 11
4,968 28,235 36,067
14
4
Nevada ................................................................ New Jersey.. ........................................................ New York ........................................................... Ohio ..................................................................... -_
75 4
-_
t
:I
j 1 1 ! j f
Pennsylvania ....................................................... Rhode Island.. ..................................................... South Dakota ...................................................... Tennessee ............................................................ Vermont .............................................................. Washington ......................................................... Wisconsin ............................................................
1 Includes all persons with both Federal SSI payments and federally administered State supplementation and those eligible for federally administered State supplementation only.
z Includes 8 persons for whom State was unreported 3 Data not available by reason for eligibility.
Table H.-All persons, adult units, and children receiving federally administered State supplementation only, by reason for eligibility and State, December 1985
r r Aged I Blind
Blind and disabled children Couples Individuals Couples
All persons state Individuals
139,336
Couples Individuals
21,670 7,067
17,744 5,oTi 13 -. 1
-.
-. 6
-_ 3; -_ 1
1
178 17
1,513 1,375; 150 55
563 1,172
529
1 -_ -.
11
175 78
-_
2 2
::
95 19
-. -.
4
;i
Total _._......................,,..,.,,....,..................... 338,929
4 219,607
3::
121,191 9,512
1 75,525 8,343
36 -_ 142 3
-_
1 -_ 183 110 1
2 -_ --
Arkansas.. ............................................................ California.. ........................................................... 80,95:
1::. Delaware.. ........................................................... District of Columbia.. ......................................... Florida.. ...............................................................
Georgia.. .............................................................. Hawaii ................................................................. Iowa ..................................................................... Kansas ................................................................. Louisiana .............................................................
Maine ................................................................... Maryland ............................................................. Massachusetts ..................................................... Michigan ............................................................ Mississippi ..........................................................
Montana ............................................................. Nevada ............................................................... New Jersey ......................................................... New York .......................................................... Ohio.. ..................................................................
8 429 226
5 9
8;973 5
100 694
7,005 33,922
10
Pennsylvania ...................................................... 9,442 Rhode Island.. .................................................... 2,150 South Dakota -. .....................................................
-_
5 220 -_
3 -_
48
6
1,616
19,031 3,027
2
14
3,:: 16,689
4,165 991
,
,
-_
1,156 52 7 -_
1
127 3
6,157 278 5,216 58
‘I -.
82
3,663 3
14,444 28: 6
-_ -. -_
4 1 6
-_
214 6f 98 I(
-_ - ’ Tennessee ........................................................... Vermont ............................................................. Washington ........................................................ Wisconsin ...........................................................
1,413 687 3,047 1,16c
17,051 6,91;
Social Security Bulletin, May 1987IVol. 50, No. 5
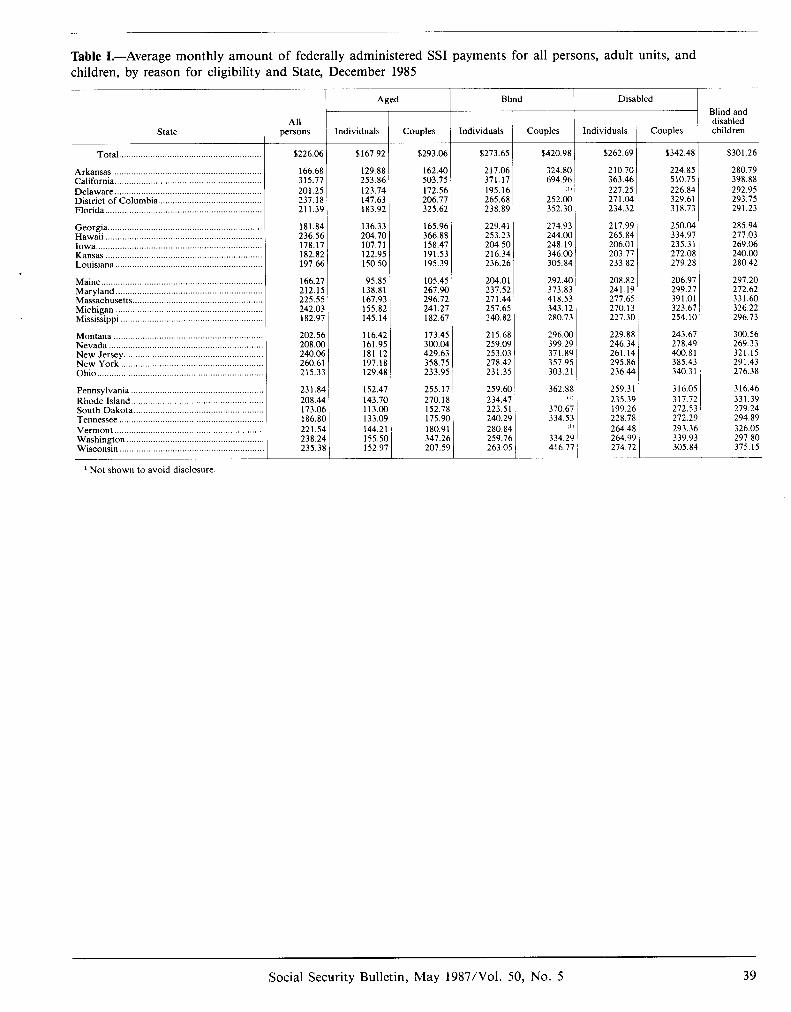
Table I.-Average monthly amount of federally administered SSI payments for all persons, adult units, and children, by reason for eligibility and State, December 1985
r Aged r Blind Disabled
Couples
Blind and disabled children
$342.48 $301.26
271.04; 234.32
224.85 280.79 510.75 398.88 226.84 292.95 329.61 293.75 318.73 291.23
217.99, 250.04 285.94 265.84 334.97 277.03 206.01 235.31 269.06 203.77 272.08 24a.cQ 233.82 279.28 280.42
208.82 241.191
227.30 !
206.97 297.20 299.27 272.62 391.0! 331.60 323.67 326.22 254.10 296.73
229.88 246.34 261.14 295.86 236.44
259.31 i 235.39 199.26, 228.78 264.48 264.99 274.72
243.67 300.56 278.49 269.33 400.81 321.15 385.43 29 I .43 340.31 276.38
316.05 316.46 317.72 331.39 272.53 279.24 272.29 294.89 293.36 326.05 339.93 297.80 305.84 375.15
r All persons state Individuals
$293.06
162.40 503.75 172.56 206.77 325.62
165.96 366.88 158.47 191.53 195.39
Couples
105.45 267.90 296.72 241.27 182.67
173.45 300.04 429.63 358.75 233.95
255.17 270.18 152.78 175.90 180.91 347.26 207.59
Individuals Couples
t $226.06 $167.92
Arkansas .............................................................. 166.68 California ............................................................. 315.77
201.25 237.18 211.39
129.88 253.86 123.74 147.63 183.92
181.84 136.33 236.56 204.70 178.17 107.71 182.82 122.95 197.66 150.5c
166.27 95.85 212.15 138.81 225.55 167.93 242.03 155.82 182.97 145.14
202.56 208.oC 240.06 260.61 215.33
116.4; 161.91 181.1; 197.1E 129.45
231.84 208.44 173.ot 186.8( 221.54 238.24 235.3E
152.4: 143.7( 113.a 133.0! 144.2 155.5( 152.9’
$273.65
217.06 371.17 195.16 265.68 238.89
$420.98
324.80 694.96
0) 252.00 352.30
229.41 274.93 253.23 244.00 204.50 248.19 216.34 346.00 236.26 305.84
204.01 237.52 271.44 257.65 240.82
292.40 373.83 418.53 343.12 280.73
215.68 259.09 253.03 278.42 231.35
296.M: 399.25 371.85 357.9’1 303.21
I 259.6C 234.47 223.51 240.2s 280.84 259.7t 263.01
I’ I ,
362.8f /I
370.6: 334.5:
,I 334.2’ 416.7’
Delaware ............................................................. District of Columbia ...........................................
Georgia ................................................................ Hawaii ................................................................. low*. .................................................................... Kansas ................................................................. Louisiana.. ...........................................................
Maine.. ................................................................. Maryland ............................................................. Massachusetts.. .................................................... Michigan ............................................................. Mississippi ...........................................................
Montana .............................................................. Nevada ................................................................ New Jersey.. ........................................................ New York ...........................................................
.
’ Pennsylvania .._..._.............,,,,,,,.,.,...................... Rhode Island.. ..................................................... South Dakota.. .................................................... Tennessee ............................................................ Vermont .............................................................. Washington ......................................................... Wisconsin.. .........................................................
’ Not shown to avoid disclosure.
I
Social Security Bulletin, May 1987/Vol. 50, No. 5 39
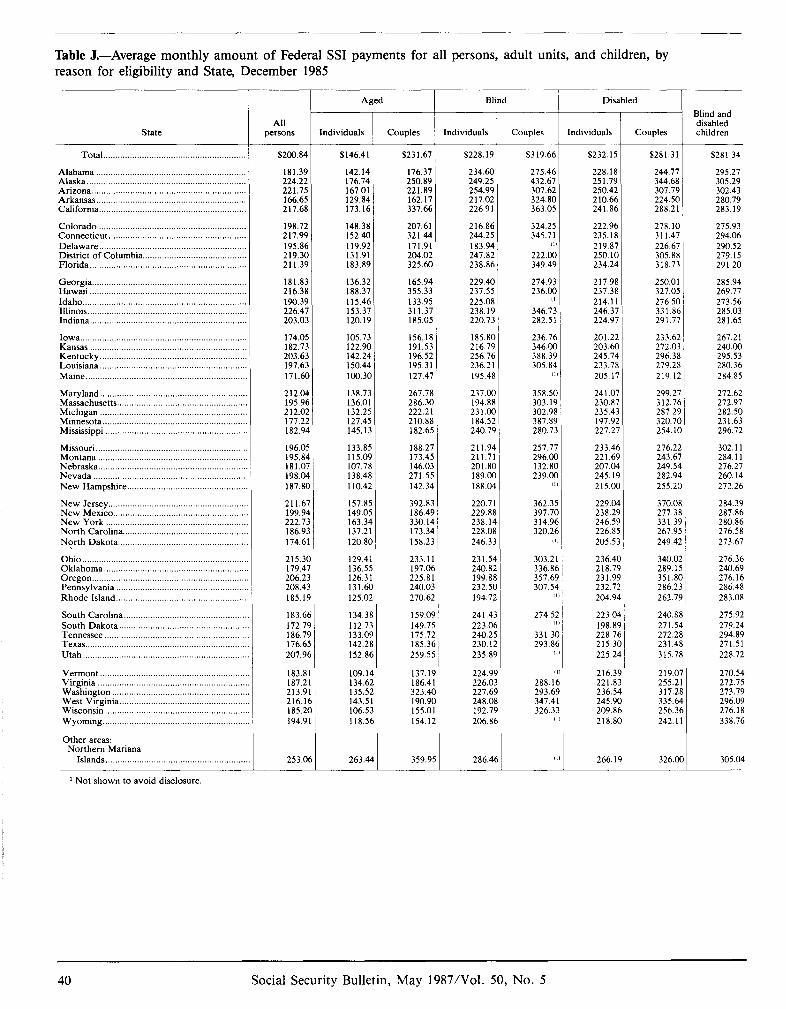
Table J.-Average monthly amount of Federal SSI payments for all persons, adult units, and children, by reason for eligibility and State, December 1985
state
Total ...........................................................
Alabama .............................................................. Alaska.. ................................................................ Arizona.. .............................................................. Arkansas.. ............................................................ California.. ...........................................................
Colorado ............................................................. Connecticut.. ....................................................... Delaware. ............................................................ District of Columbia.. ......................................... Florida .......................................................
Georgia ................................................................ Hawaii ................................................................. Idaho.. .................................................................. Illinois.. ................................................................ Indiana.. ...............................................................
Iowa.. ................................................................... Kansas ................................................................. Kentucky.. ........................................................... Louisiana ............................................................. Maine.. .................................................................
Maryland ............................................................. Massachusetts. ..................................................... Michigan ............................................................. Minnesota.. .......................................................... Mississippi ...........................................................
Missouri ............................................................... Montana .............................................................. Nebraska.. ............................................................ Nevada ................................................................ New Hampshire.. ................................................
New Jersey .......................................................... New Mexico ........................................................ New York ........................................................... North Carolina.. .................................................. North Dakota ......................................................
Ohio.. .................................................................. Oklahoma ........................................................... Oregon.. .............................................................. Pennsylvania ...................................................... Rhode Island ......................................................
South Carolina.. ................................................. South Dakota.. ................................................... Tennessee ........................................................... Texas ................................................................... Utah. ...................................................................
Vermont .................................................... Virginia .............................................................. Washinnton ........................................................ West Vyrginia .._._......_.....,.............,.,,.,,,,.,.... Wisconsin ,.,.,..._...._._.....,,,.,.,,,,.............,.,,.,,,,.,.... Wyoming .._._.......................................................
Other areas: Northern Mariana
Islands .,_,,............._........,.,....................,.,,,,...
1 Not shown to avoid disclosure.
All persons
$200.84
181.39 224.22 221.75 166.65 217.68
198.72 217.99 195.86 219.30 211.39
181.83 216.38 190.39 226.47 203.03
174.05 182.73 203.63 197.63 171.60
212.04 195.96 212.02 177.22 182.94
196.05 195.84 181.07 198.04 187.8C
:;;:E 222.7: 186.9: 174.61
215.3( 179.4:
$$$
185.1:
183.6t 172.7’ 186.7’ 176.61 207.9(
183.8 187.2 213.9 216.11 185.2( 194.9
253.01
Aged
:ndividuals
$146.41 $231.67 $228.19 $319.66 $232.15 $281.31 $281.34
142.14 176.37 234.60 275.46 228.18 244.77 295.27 176.74 250.89 249.25 432.67 251.79 344.68 305.29 167.01 221.89 254.99 307.62 250.42 307.79 302.43 129.84 162.17 2 17.02 324.80 210.66 224.50 280.79 173.16 337.66 226.9 1 363.05 241.86 288.21 283.19
148.38 207.61 216.86 324.25 222.96 152.40 321.44 244.25 345.71 235.18 119.92 171.91 183.94 ,/’ 219.81 131.91 204.02 247.82 222.00 250. IC 183.89 325.60 238.86 349.49 234.24
278.10 275.93 311.47 294.06 226.67 290.52 305.88 279.15 318.73 29 I .20
136.32 188.37 115.46 153.31 120.15
165.94 229.40 355.33 237.55 133.95 225.08 311.37 238.19 185.05 220.73
274.93 236.00
Cl 346.73 282.51
217.98 237.38 214.11 246.31 224.91
250.01 285.94 327.05 269.77 276.50 273.56 331.86 285.03 291.77 281.65
105.73 122.9C 142.24 150.44 100.3(
156.18 185.80 236.76 201.22 191.53 216.79 346.m 203.K 196.52 256.76 388.39 245.74 195.31 236.21 305.84 233.7F 127.47 195.48 ,I 205.1;
233.62 267.21 272.03 240.00 296.38 295.53 279.28 280.36 219.12 284.85
pm;
132.25 127.41 145.1:
267.78 237X 358.5C 286.30 194.88 303.15 222.21 231.W 302.98 210.88 184.52 387.85 182.65 240.79 280.71
299.27 272.62 312.76 ~ 272.97 287.29 282.50 320.70 231.63 254.10 296.72
133.81 115.E 107.71 138.42 110.4;
188.27 211.94 173.45 211.71 146.03 201.8C 271.55 189.OC 142.34 188.04
:;i:: 132.8( 239.M
,t
233.4t 221.6’ 207.0‘ 245.1’ 215.M
276.22 302.11 243.67 284.11 249.54 276.21 282.94 260.14 255.20 1 272.26
157.8: 149.0: 163.3r 137.2 120.8(
392.83 220.71 362.3: 2290 186.49 229.88 397.7( 238.2’ 330.14 238.14 314.9t 246.5’ 173.34 228.08 320.2t 226.8: 158.23 246.3: ,I 205.5.
303.2 336.81 357.6’ 307.5<
236.41 218.7’ 231.9’ 232.7. 204.9,
370.08 277.38, 331.39 I 267.95 249.42 I
340.02 i 289.15 351.80 286.23 262.79
284.39 287.86 280.86 276.58 273.67
129.4 136.5: 126.3 131.6l 125.0:
233.11 231.5’ 197.0( 240.8; 225.81 199.8E 240.0: 232.5( 270.62 194.7;
276.36 240.69 276.16 286.48 283.08
134.3: 112.7 133.0 142.2, 152.81
159.05 241.4: 149.7: 223.Of 175.7; 240.21 185.3t 230.1: 259.51 235.8’
274.5: I
331.31 293.81
,
223.0 198.8’ 228.7~ 215.31 225.2,
240.88 275.92 271.54 279.24 272.28 294.89 231.48 271.51 315.78 228.72
109.1, 134.6 135.5 143.5 106.5 118.5
137.1! 224.9’ 186.41 226.0. 323.4 227.6’ 190.9( 248.01 155.01 192.7’ 154.1; 206.8(
288.1’1 293.6’ 347.4 326.3
,
216.3 221.8 236.5 245.91 209.8 218.8’
219.07 270.54 255.21 272.75 317.28 273.79 335.64 296.09 256.36 276.18 242.11 338.76
263.4 4 1 359.91 286.41 , 266.1 326.00 305.04
I Couples Individuals Couples Individuals
r Blind r Disabled
I h Blind and
disabled Couples children
-
40 Social Security Bulletin, May 19871Vol. 50, No. 5
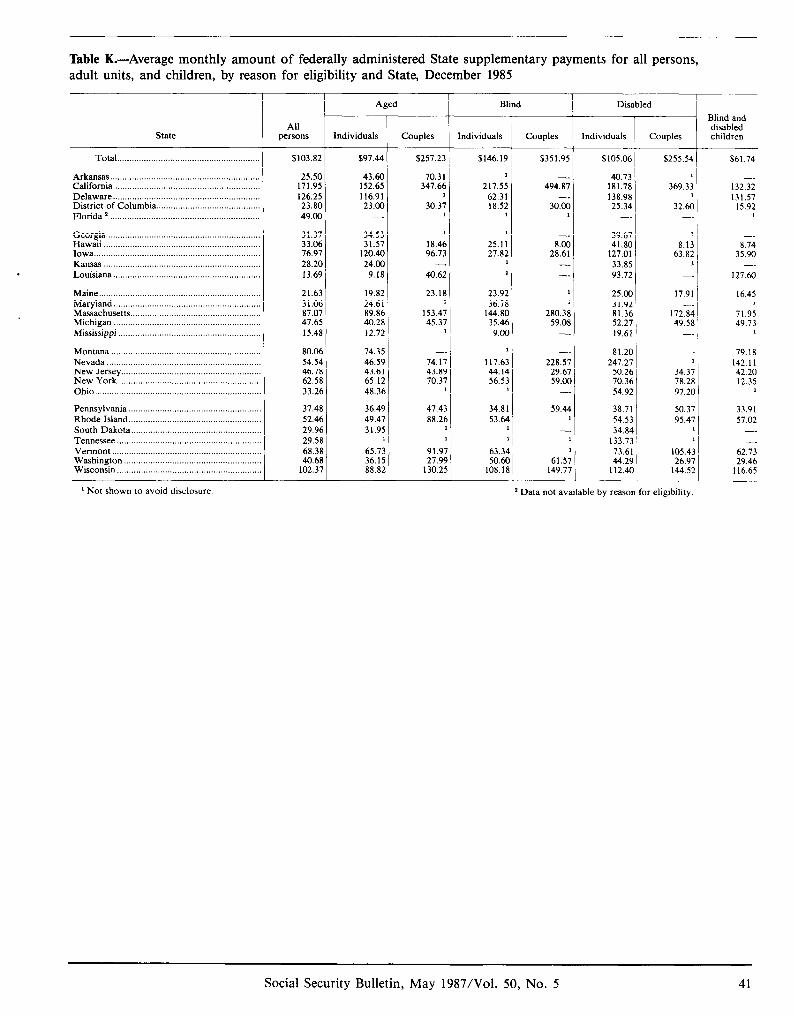
Table K.-Average monthly amount of federally administered State supplementary payments for all persons, adult units, and children, by reason for eligibility and State, December 1985
state
Total.. .........................................................
Arkansas.. ............................................................ California.. ........................................................... Delaware ............................................................. District of Columbia.. ......................................... Florida z ........................................................ 49.00
Georgia.. .............................................................. 31.37 Hawaii ................................................................. 33.06 Iowa.. ................................................................... 76.97 Kansas ................................................................. 28.20 Louisiana ............................................................. 13.69
Maine.. ................................................................. 21.63 19.82 23.18 31.06 24.61 1 87.07 89.86 153.47 47.65 40.28 45.37 15.48 12.72 1
Maryland.. ........................................................... Massachusetts.. .................................................... Michigan ............................................................. Mississippi ...........................................................
Montana .............................................................. Nevada ................................................................ New Jersey.. ........................................................ New York ........................................................... Ohio .....................................................................
Pennsylvania ....................................................... Rhode Island.. ..................................................... South Dakota.. .................................................... Tennessee ........................................................... Vermont ............................................................. Washington ......................................................... Wisconsin ............................................................
1 Not shown to avoid disclosure. * Data not available by reason for eligibility
r I Aged
t
All jX3SO”S
$103.82 597.44
25.50 43.60 171.95 152.65 126.25 116.91 23.80 23.00
70.31 347.66
30.3; 1
34.53 1 31.57 18.46
120.40 96.73 24.00 -_
9.18 40.62
80.06 14.35 -_ 54.54 46.59 74.17 46.78 43.61 43.89 62.58 65.12 70.37 33.26 48.36 I
37.48 52.46 29.96 29.58 68.38
36.49 49.47 31.95
1
65.73 36.15 88.82
47.43 88.26
1 1
91.97 27.99
130.25 40.68
102.37
r Couples
$257.23
Blind I Disabled
Individuals
$146.19
1
217.55 62.31 18.52
1
1
25.11 27.82
23.92 36.78
144.80 35.46
9.M;
1
117.63 44.14 56.5!
34.81 53.64
63.34 50.6(
108.1$
Couples Individuals
-T 16351.95 5105.06
494%
30% 1
8.00 28.61
-_ -_
39.67 41.80
127.01 33.85 93.72
1 25.00 1 31.92
280.38 81.36 59.08 52.27
-_ 19.61
-_ 81.20 228.57 247.27
29.61 50.26 59.00 70.36
-_ 54.92
59.44 1
-.
I
61.5; 149.77
40.73 181.78 138.98 25.34
-.
38.71 54.53 34.84
133.73 73.61 44.29
112.40 I
Couples
5255.54
369.3; 1
32.60
8.1; 63.82
I
17.91
172.84 49.58
I 34.37 78.28 97.20
so.37 95.47
1 I
105.43 26.97
144.52
Blind and disabled children
$61.74
132.32 131.57
15.92 1
8-74 35.90
-_ 127.60
16.45 1
71.95 49.73
1
79.18 142.11 42.20 12.35
L
33.91 57.02
-_ 62.73 29.46
116.65
Social Security Bulletin, May 1987/Vol. 50, No. 5 41
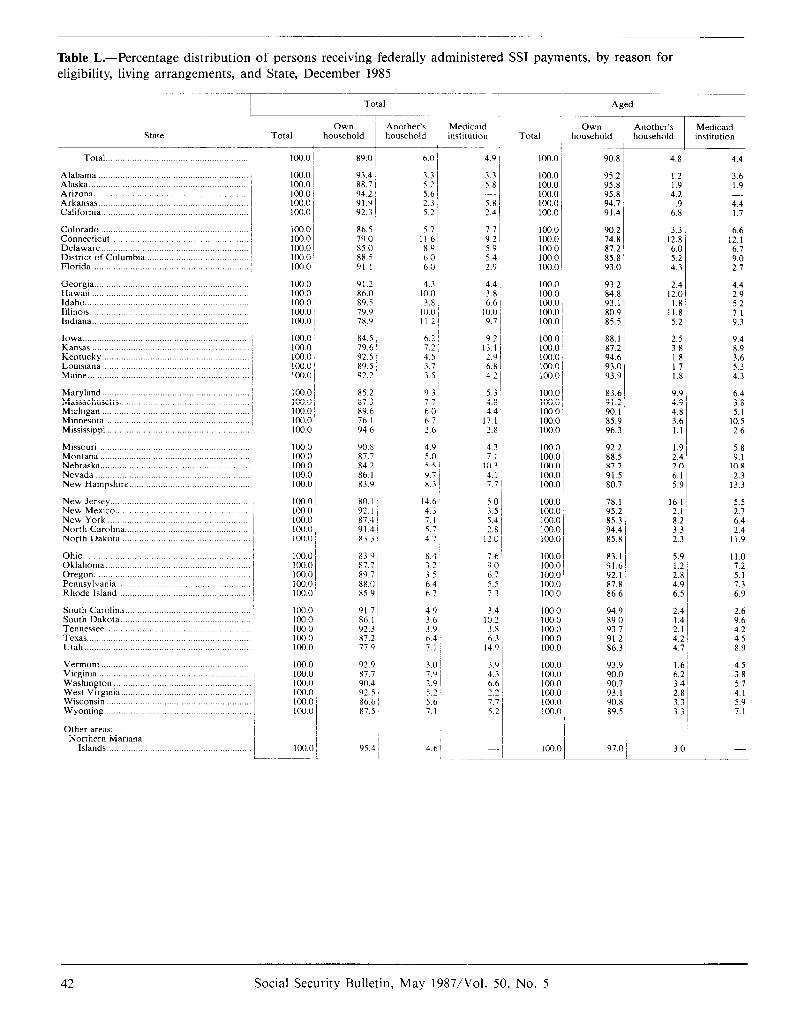
Table L.-Percentage distribution of persons receiving federally administered SSI payments, by reason for eligibility, living arrangements, and State, December 1985
c
state
-...-. -.--I~
Total.. .......................... ............. ........ 1
Alabama ......................................................... Alaska.. ...................................................... Arizona.. ..................................... .... ........ .,., Arkansas.. .................................................. 1 California.. .....................................................
Colorado ............................. ............. / .... Connecticut.. j ........................................ ........ ..... Delaware.. ......... .......................................... 1 District of Columbia.. ....................................... ~ Florida.. ......................................................... .....
Georgia.. ................................................ ,,, Hawaii .................... ......... ... ..................... Idaho.. ............................................ ...... .... .... Illinois ........... ................ ...... ......... ............. IndIana.. ................... .................... ..... .....
Iowa.. ............................................ ............ ....... Kansas ............................................... ........... Kentucky.. ...................... .......... ..... ........ .... Loulslana..
~ ....................................... .... .....
Maine .................................. ............. /
Maryland Massachusetts
I
Michigan ........................................... ....... Mmnesota.. ......... ............... .............................. Mississippi ...................... .......... ................ .....
Missouri ............................................................... Montana ............................................................. Nebraska.. .................................... ........ ... Nevada
~ ................. ...................... ...
New Hampshire.. ......................... ......
New Jersey.. .................... ............ ....... New Mexico.. ............................. .... ....... New York.. ............................. ...... : i North Carolina.. .................................. North Dakota
i ...... ...................................... ::. ,
Ohio. ... .................. ......................... ............. / Oklahoma.. .................................................. .... I Oregon. ......................................... .... ... Pennsylvama
1 ........... .... .............. ............
Rhode Island. ;
............................. ..........
South Carolina South Dakota .,.
Texas. Utah
Virgima Washmgton ,. .,. ,,.,,. West Virginia ,. .,,.,.,, ~ Wisconsin Wyoming !
Other areas: Northern Mariana
Islands I
Total Aged
Total OW” Another‘s
~ household household --~,
loo.0 ~
tE% ~ loo.0 ( 100.0, 100.0
100.0 100.0 100.0 100.0 ’ 100.0 ~
100.0 i 100.0 1000 100.0 100.0 1
loo.0 1000 loo.0 100.0 ~ loo.0 1
lCO.0 ~ lcG.0 1
tii:I: I loo.0 ~
loo.0 ~ 100.0 1000 100.0 lW.0,
1000~ loo.0 loo.0 100.0 100.0 ~
loo.0 ~ 1000 100.0 1 100.0, 100.0
100.0 ~ 100.0 100.0 100.0 100.0
100.0 100.0 ~ 100.0 loo.0 1000’ 100.0
lw.o / 1
93.4 3.3 88.7, 52 94.2 56 91.9 ~ 92.3 ~
2.3 5.2
I Medicaid institution ~
I 4.9!
33’ 58
5.x / 2.4
86.5
ii:! ~
Yl I/
9121 86.0 89.5 79.9 78.9
5.7 11.6 fl.Y 6.0 6.0
77 9.2, 5.9 5.4, 2.9 i
44) 38 6.6
10.0 ~ 9.7 I
x4.5, 6.2 ’ 9.2 79.6 1.2 13.1 i 92.5 4.5 2.9 I x9.5 3.7 6.8 1 92.2 35 42
85.2 87.3 89.6, ib. 1 1 94 6:
9.3 77 60 67 2.6
5.3 4.8 4.4
17.1 ~ 2.x
90.8 I 87.7 I 84 2 ~ X6 1 83.9
4.3
1:.: 4.1 771
80.1 92. I 87.4 ~ 91.4 83.3
14.6
5.7 4.7
83 Y 87.7 ~ 89.7
E 1
91.7 / Rb.1 i 92.3 87 2 ~ 77 9 ~
8.4 3.2 35 64 67
4.Y 36 3.4 b4 7.1
50 3.5, 5.4 2.8
12.0 ~
76' 9.0 6.7 5.5 7.3 ~
3.4 10.2 3.8 6.3,
14.9
92 9 87.7 90 4 92.5 X6.6 ~ 87 5
5.2 5.6 7.1
I 2 6.6 ’ 2.2 1 7.7 j 5.2 I
95.4 ~ 4.6
6.0
Another’s household
Medicald institution
90.8 4.8 4.4
95.2 95.8 95.8 94.7 91.4
1.2 1.9 4.2
6:;
3.6 1.9
4.4 1.7
90.2 3.3 6.6 74.8 12.8 12.1 87.2 6.0 6.1 85.8 5.2 9.0 93.0 4.3 2.7
93.2 84.8 93.1 80.9 85.5
2.4 12.c
1.8 11.8 5.2
4.4 2.9 5.2 7.1 9.3
88.1 87.2 94.6 93.c 93.9
2.5 1 3.8 1.8 1.7 I 1.8
9.4 8.9 3.6 5.3 4.3
83.6 91.2 90.1 85.9 i 96.3
9.9 6.4 4.9 3.8 4.8 5.1 3.6 10.5 1.1 2.6
92.2 88.5 87.2 91.5 80.7
78.1 95.2 85.3, 94.4 85.8
83.1 91.6, 92.1 87.8 86.6 ~
94.9 ’ 89.0 93.7 91.2 86.3
93.9 90.0 90.7 93.1 90.8, 89.5 1
97.0 ~
1.91 2.4 ’
5.8 9.1
2.0 ~ 10.8 6.1 2.3 5.9 13.3
16.1 ~ 2.1
i:: I 2.3
5.5 2.7 6.4 2.4
11.9
5.9 11.0 1.2 7.2 2.8 5.1 4.9 7.3 6.5 6.9
2.4 1.4 2.1, 4.2 4.7
1.6 6.2 ~ 3.4 1 2.8 3.3 3.3 ~
2.6 9.6 4.2 4.5 8.9
4.5 3.8 5.7 4.1 5.9 7.1
3.0 ~
Social Security Bulletin, May 1987/Vol. 50, No. 5
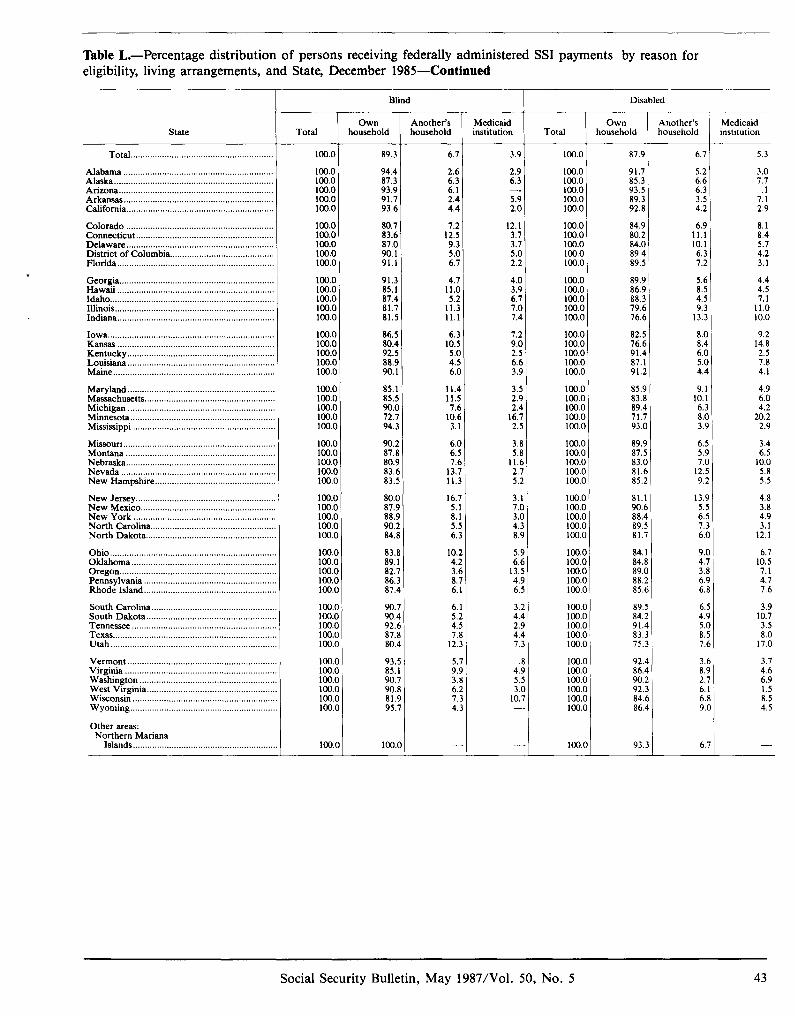
Table L.-Percentage distribution of persons receiving federally administered SSI payments by reason for eligibility, living arrangements, and State, December 1985-Continued
P r Blind Disabled
r Total
OWll household
Another’s Medicaid household institution
OWII Another’s household household
Medicaid institution state Total
Total ...........................................................
Alabama .............................................................. Alaska.. ................................................................ Arizona.. ..............................................................
80.7 83.6 87.0 90.1 91.1
91.3 85.1 87.4 81.7 81.5
86.5 80.4 92.5 88.9 90.1
85.1 85.5 90.a 72.1 94.3
90.2 87.8 8O.S 83.t 83.:
80.C 87.5 88.5 90.; 84.8
83.1 89. I 82.: 86.: 87.1
90.’ 90.r 92.t 87.1 80.1
93.:
;;;:
90.1 81.’ 95.’
100.l
6.7 ’ 3.9
i:;~ 6.1 2.4 4.4
2.9 6.3
5.9 2.0
7.2 12.5 9.3 5.0 6.7
12.1 3.7 3.7 5.0 2.2
4.7 11.0 5.2
11.3 11.1
4.0 3.9 6.7 7.0 7.4
6.3 7.2 10.5 9.0 5.0 2.5 4.5 6.6 6.0 3.9
100.0
loo.0 100.0 1cQ.o 100.0 100.0
100.0 100.0 100.0 loo.0 loo.0
100.0 1 cn.0 100.0 100.0 100.0
100.0 100.0 lc0.0 100.0 100.0
loo.0 1co.o 100.0 100.0 ima
ic0.a no.0 100x 1OO.c 100s
100s 1OO.c 1OO.c 1OO.C 1OO.t
100s 100x 100s 1cQ.c lOO.(
loo.( 100s 100s 1oa.c loo.(
100s 100x 1Cxl.t 100s lcn( 100s
100s
87.9 6.7 5.3
91.7 5.2 85.3 6.6 93.5 6.3 89.3 3.5 92.8 4.2
3.0 7.7
7:; 2.9
84.9 80.2 84.0 89.4 89.5
6.9 11.1 10.1 6.3 7.2
8.1 8.4 5.7 4.2 3.1
89.9 5.6 4.4 86.9 8.5 4.5 88.3 4.5 7.1 79.6 9.3 11.0 76.6 13.3 10.0
82.5 8.0 76.6 8.4 91.4 6.C 87.1 5.c 91.2 4.4
9.2 14.8 2.5 7.8 4.1
85.9 9.1 83.8 10.1 89.4 6.2 71.7 8.C 93.0 3.5
4.9 6.0 4.2
20.2 2.9
89.9 6.5 87.5 5.5 83.0 7.c 81.6 12.1 85.2 9.;
3.4 6.5
10.0 5.8 5.5
81.1 13.5 90.6 5.f 88.4 6.1 89.5 7.: 81.7 6.c
4.8 3.8 4.9 3.1
12.1
84.1 9.c 84.8 4.’ 89.0 3.1 88.2 6.’ 85.6 6.1
6.7 10.5 7.1 4.7 7.6
89.5 6.: 84.2 4.’ 91.4 5.1 83.3 8.: 75.3 7.1
3.9 10.7 3.5 8.0
17.0
92.4 86.4 90.2 92.3 84.6 86.4
3.1 8.’
i:’ 6., 9.1
3.7 4.6 6.9 1.5 8.5 4.5
93.3 6.
100.0
100.0 100.0 loo.0 100.0 100.0
loo.0 100.0 100.0 loo.0 100.0
100.0 loo.0 loo.0 100.0 100.0
100.0 1cQ.o 100.0 loo.0 100.0
loo.0 100.0 100.0 100.0 100.0
100.0 100.0 loo.0 100.0 100.0
loo.0 100.0 100.0 loo.0 loo.0
100.0 100.0 loo.0 100.0 100.0
100.0 100.0 100.0 100.0 100.0
100.0 100.0 loo.0 100.0 100.0 100.0
100.0
Arkansas.. ............................................................ California.. ...........................................................
Colorado ............................................................. Connecticut ......................................................... Delaware.. ........................................................... District of Columbia.. ......................................... Florida.. ...............................................................
Georgia ................................................................ Hawaii ................................................................. Idaho.. .................................................................. Illinois.. ................................................................ Indiana.. ...............................................................
Iowa.. ................................................................... Kansas ................................................................ Kentucky ............................................................ Louisiana ............................................................ Maine.. ................................................................
11.4 3.5 11.5 2.9 7.6 2.4
10.6 16.7 3.1 2.5
6.0 3.8 6.5 5.8 7.6 11.6
13.7 2.7 11.3 5.2
Mas&husetts.. ................................................... Michigan ............................................................ Minnesota.. ......................................................... Mississippi ..........................................................
Missouri.. ............................................................ Montana ............................................................. Nebraska ............................................................. Nevada ............................................................... New Hampshire.. ...............................................
New Jersey.. ....................................................... New Mexico.. ..................................................... New York .......................................................... North Carolina.. ................................................. North Dakota.. ...................................................
Ohio. ................................................................... Oklahoma.. ......................................................... Oregon ................................................................ Pennsylvania ...................................................... Rhode Island.. ....................................................
South Carolina.. ................................................ South Dakota.. ...................................................
16.7 5.1 8.1 5.5 6.3
3.1 7.0 3.a 4.3 8.9
5.9 6.6
13.5 4.5 6.:
10.2 4.2 3.6 8.7 6.1
6.1 5.2 4.5 7.8
12.3
5.7 9.9 3.8 6.2 7.3 4.3
Tennessee ........................................................... Texas., ................................................................
Vermont ............................................................ Virginia ............................................................. Washington ....................................................... West Virginia .................................................... Wisconsin .......................................................... Wyoming.. .........................................................
10.; -
Other areas: Northern Mariana
Islands . . . . ..____...... . . . . . . . . .._._._. i
-. -
Social Security Bulletin, May 1987/Vol. 50, No. 5 43
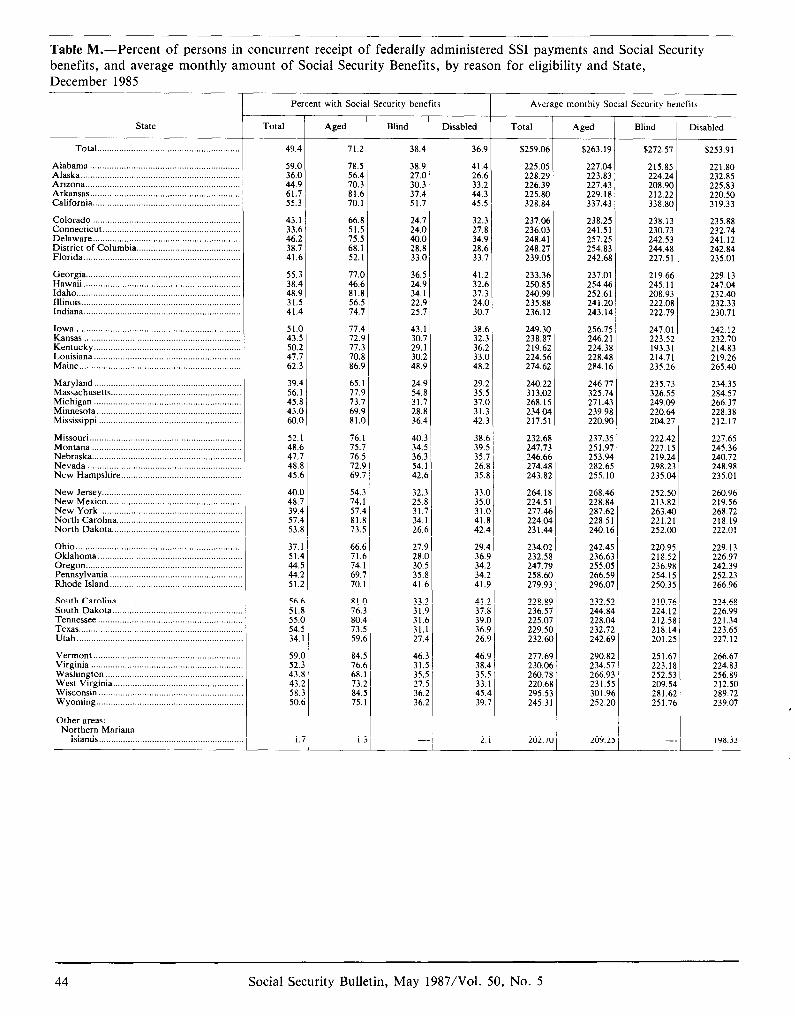
Table M.-Percent of persons in concurrent receipt of federally administered SSI payments and Social Security benefits, and average monthly amount of Social Security Benefits, by reason for eligibility and State, December 1985
r State
Total. ..........................................................
Alabama .............................................................. Alaska.. ................................................................ Artzona ................. .............................................. Arkansas.. ............................................................ California.. ...........................................................
Colorado ............................................................. Connecticut ......................................................... Delaware.. ........................................................... District of Columbia.. ......................................... Florida.. ...............................................................
Georgia.. .............................................................. Hawaii ................................................................. Idaho.. .................................................................. Illinois .................................................................. Indiana .................................................................
Iowa.. ................................................................... Kansas ................................................................. Kentucky.. ........................................................... Louisiana.. ........................................................... Maine ...................................................................
Maryland.. .......................................................... Massachusetts ..................................................... Michigan ............................................................ Minnesota.. ......................................................... Mississippi ..........................................................
Missouri.. ............................................................ Montana ............................................................. Nebraska.. ........................................................... Nevada ............................................................... New Hampshire .................................................
New Jersey ......................................................... New Mextco ....................................................... New York .......................................................... North Carolina.. ................................................. North Dakota .....................................................
Ohio.. .................................................................. Oklahoma.. .................... .................................... Oregon.. .............................................................. Pennsylvania ...................................................... Rhode Island.. ....................................................
South Carolina ................................................... South Dakota ..................................................... Tennessee ...........................................................
Virginia .............................................................. Washington ........................................................ West V%ginia .._...................................,,,.......... Wisconsin . .._................................................ Wyoming . . .._..............................................
Other areas: Northern Mariana
Islands .._.....................
Percent with Social Security benefits
Total Aged Blind Disabled Total Aged Blind
49.4 71.2 38.4 36.9 $259.06 $263.19 $272.57
59.0 36.0
E:: 55:3
78.5 38.9 56.4 27.0 70.3 30.3 81.6 37.4 70.1 51.7
41.4 26.6 33.2 44.3 45.5
225.05 227.04 215.85 228.29 223.83 224.24 226.39 227.43 208.90 225.80 229.18 212.22 328.84 337.43 338.80
43.1 66.8 24.7 32.3 237.06 238.25 238.13 33.6 51.5 24.0 27.8 236.03 241.51 230.73 46.2 75.5 40.0 34.9 248.41 257.25 242.53 38.7 68.1 28.8 28.6 248.27 254.83 244.48 41.6 52.1 33.0 33.7 239.05 242.68 227.51
55.3 77.0 36.5 38.4 46.6 24.9 48.9 81.8 34.1 31.5 56.5 22.9 41.4 74.7 25.7
51.0 77.4 43.1 72.9 30.7 77.3 29.1 70.8 30.2 86.9 48.9
43.5 50.2 47.7 62.3
39.4 56.1 45.8 43.0 60.0
65.1 77.9 73.7 69.9 81.0
24.9 54.8 31.7 28.8 36.4
29.2 240.22 246.77 235.73 35.5 3 13.02 325.74 326.55 37.0 268.15 271.43 249.09 31.3 234.04 239.98 220.64 42.3 217.51 220.90 204.27
, 234.35 284.57 266.37 228.38 212.17
52.1 76. I 40.3 38.6 232.68 237.35 48.6 75.7 34.1 39.5 247.73 251.91 47.7 76.5 36.2 35.7 246.66 253.94 48.8 72.9 54.1 26.8 274.48 282.65 45.6 69.7 42.t 35.8 243.82 255.lC
33.0
222.42 227.15 219.24
:;t::
227.65 245.36 240.72 248.98 235.01
40.0 54.3 32.: 48.7 74.1 25.f 39.4 57.4 31.: 57.4 81.8 34.1 53.8 73.5 26.t
35.0 31.0 41.8 42.4
264.18 268.46 252.5( 224.51 228.84 213.8; 277.46 287.62 263.4 224.04 228.51 221.21 231.44 240.16 252.M
260.96 219.56 268.72 218.19 222.01
37.1 66.6 27.5 29.4 234.02 242.4: 220.91 , 229.13 51.4 71.6 28S 36.9 232.58 236.6: 218.5; ) 226.97 44.5 74.1 30.1 34.2 247.19 255.0: 236.91 1 242.39 44.2 69.i 35.1 34.2 258.60 266.55 254. I! 5 252.23 51.2 70. I 41.t 41.9 279.93 296.0; 250.3! j 266.96
56.6 81S 33.: 41.2 228.89 232.5; 51.8 76.: 31.’ 37.8 236.57 244.8r 55.c 80.4 31.1 39.c 225.07 228.01 54.5 73.: 31. 36.9 229.50 232.7; 34.1 59.t 27.1 26.9 232.60 242.6!
210.7t 224. I: 212.51 218.1~ 201.2:
5 224.68 , 226.99 3 221.34 t 223.65 5 227.12
59.c 52.: 43.8 43.; 58.2 5o.t
84.1 76.t 68.1 73.; 84.f 75. I
46.. 31.: 35.: 27.: 36.: 36.:
46.9 38.4 35.5 33.1 45.4 39.7
277.69 290.8: 230.06 234.5: 260.78 266.9: 220.68 231.5: 295.53 301.9t 245.31 252.2(
252.5: 209.5‘ 281.6: 251.7(
266.67 224.83 256.89 212.50 289.72 239.07
1.; 1.: - 2.1 202.70 ~ 209.2: - 198.33
r
41.2 233.36 237.01 219.66 32.6 250.85 254.46 245.11 37.3 240.99 252.61 208.93 24.0 235.88 241.20 222.08 30.7 236.12 243.14 222.79
38.6 32.3 36.2 33.0 48.2
Average monthly Social Securitv benefits
$253.91
221.80 232.85 225.83 220.50 319.33
235.88 232.14 241.12 242.84 235.01
229.13 247.04 232.40 232.33 230.71
249.30 256.75 247.01 242.12 238.87 246.2 1 223.52 232.70 219.62 224.38 193.31 214.83 224.56 228.48 214.71 219.26 274.62 284.16 235.26 265.40
Disabled
Social Security Bulletin, May 1987/Vol. 50, No. 5
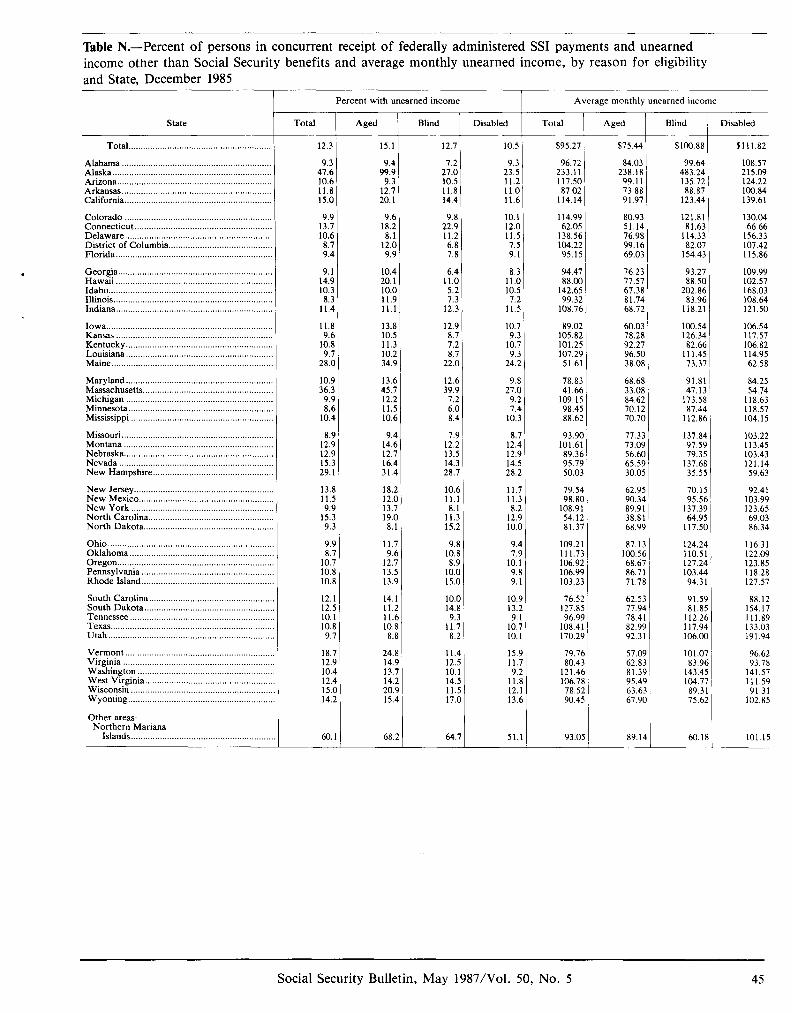
Table N.-Percent of persons in concurrent receipt of federally administered SSI payments and unearned income other than Social Security benefits and average monthly unearned income, by reason for eligibility and State, December 1985
r Average monthly unearned income Percent with unearned income
Total Aged Blind
I 12.3 15.1 12.7 10.5 $95.27 $75.44
/ I
/ Disabled Total State Aged Blind 1 Disabled c
Total ...........................................................
Alabama .............................................................. Alaska .................................................................. Arizona.. ..............................................................
$100.88 $111.82
9.3 9.4 1.2 9.3 96.72 84.03 99.64 108.57 47.6 99.9 27.0 23.5 233.11 238.18 483.24 215.09 10.6 9.3 10.5 11.2 117.50 99.11 135.72 124.22 11.8 12.7 11.8 11.0 87.02 73.88 88.87 100.84 15.0 20.1 14.4 11.6 114.14 91.97 123.44 139.61
9.9 9.6 9.8 10.1 114.99 80.93 13.7 18.2 22.9 12.0 62.05 51.14 10.6 8.1 11.2 Il.5 138.56 76.98 8.7 12.0 6.8 7.5 104.22 99.16 9.4 9.9 7.8 9.1 95.15 69.03
121.81 81.63
114.33 82.07
154.43
130.04 66.66
156.33 107.42 115.86
9.1 10.4 6.4 8.3 94.47 76.23 93.27 109.99 14.9 20. I 11.0 11.0 88sxl 77.51 88.50 102.57 10.3 10.0 5.2 10.5 142.65 67.38 202.86 168.03 8.3 11.9 7.3 7.2 99.32 81.74 83.96 108.64
11.4 Il.1 12.3 11.5 108.76 68.72 118.21 121.50
11.8 13.8 12.9 10.7 89.02 9.6 10.5 8.7 9.3 105.82
10.8 11.3 7.2 10.7 101.25 9.7 10.2 8.7 9.3 107.29
28.0 34.9 22.0 24.2 51.61
60.03 loo.54 106.54 78.28 126.34 117.57 92.27 82.66 106.82 96.50 111.45 114.95 38.08 73.37 62.58
10.9 13.6 12.6 9.8 36.3 45.7 39.9 27.0
9.9 12.2 7.2 9.2 8.6 11.5 6.0 7.4
10.4 10.6 8.4 10.3
, 78.83 41.66
109.15 98.45 88.62
,
68.68 91.81 84.25 33.08 47.13 54.74 84.62 173.58 118.63 70.12 87.44 118.57 70.70 112.86 104.15
8.9 9.4 12.9 14.6 12.9 12.7 15.3 16.4
7.9 8.7 12.2 12.4 13.5 12.9 14.3 14.5 28.7 28.2
)
29.1 31.4
93.9C 101.61 89.36 95.75 50.0:
77.33 137.84 103.22 73.09 97.59 113.45 56.60 79.35 103.43 65.59 137.68 121.14 30.05 35.55 59.63
13.8 18.2 10.6 11.1 11.5 12.0 11.1 Il.? 9.9 13.7 8.1 8.2
15.3 19.0 11.3 12.9 9.3 8.1 15.2 l0.C
I ),
79.5r 98.8(
108.91 54.1; 81.3;
62.95 70.15 90.34 95.56 89.91 137.39 38.81 64.95 68.99 117.50
92.41 103.99 123.65 69.03 86.34
9.9 11.7 9.8 8.7 9.6 10.8
10.7 12.7 8.9 10.8 13.5 10.0 10.8 13.9 15.0
1o.c 14.8 9.3
11.1 8.2
9.4 7.5
10.1 9.F 9.1
10.1 13.; 9.1
10.; 10.1
15.5 11.; 9.;
11.1 12.’ 13.t
51.
109.21 I 87.13 124.24 116.31 111.7: s 100.56 110.51 122.09 106.9; , 68.67 127.24 123.85 106.91 I 86.71 103.44 118.28 103.2: ! 71.78 94.31 127.57
12.1 12.5 10.1 10.8 9.7
14. I Il.2 11.6 10.8 8.8
76.5: 127.81 96.9’
YE;
62.53 91.59 77.94 81.85 78.41 112.26 82.99 117.94 92.31 106SX
88.12 154.17 111.89 133.03 191.94
18.7 12.9 10.4 12.4 15.0 14.2
24.8 14.9 13.7 14.2 20.9 15.4
,
60.1 68.2
11.4 12.2 10.1 14.5 11.: 17.C
64.;
79.7t 5 57.09 101.07 80.4: 1 62.83 83.96
l21.4( 5 81.39 143.4: 106.71 3 95.49 104.77 78.5: 2 63.63 89.31 90.41 5 67.9C 75.62
96.62 93.78
141.57 111.59 91.31
102.85
93.0: 89.14 60.16 I i
101.15
Arkansas.. ............................................................ California .............................................................
Colorado ............................................................. Connecticut.. ....................................................... Delaware ............................................................. District of Columbia.. ......................................... Florida.. ...............................................................
Georgia.. .............................................................. Hawaii ................................................................. Idaho.. .................................................................. Illinois.. ................................................................ Indiana.. ...............................................................
Iowa.. ................................................................... Kansas ................................................................. Kentucky ............................................................. Louisiana ............................................................. Maine.. .................................................................
Maryland.. ........................................................... Massachusetts ...................................................... Michigan ............................................................. Minnesota ............................................................ Mississippi ...........................................................
Missouri.. ............................................................. Montana .............................................................. Nebraska.. ............................................................ Nevada ................................................................ New Hampshire.. ................................................
New Jersey.. ........................................................ New Mexico.. ...................................................... New York ........................................................... North Carolina.. .................................................. North Dakota.. ....................................................
Ohio.. ................................................................... Oklahoma ............................................................ Oregon.. ............................................................... Pennsylvania ....................................................... Rhode Island .......................................................
South Carolina.. ................................................. South Dakota.. ................................................... Tennessee ........................................................... Texas.. ................................................................. Utah ....................................................................
Vermont ............................................................. Virginia . . ............................................................ Waihington ........................................................ West Virginia.. ................................................... Wiscons’ I” ........................................................... Wyoming ............................................................
Other areas: Northern Mariana
Islands ......................................................
Social Security Bulletin, May 1987/Vol. 50, No. 5
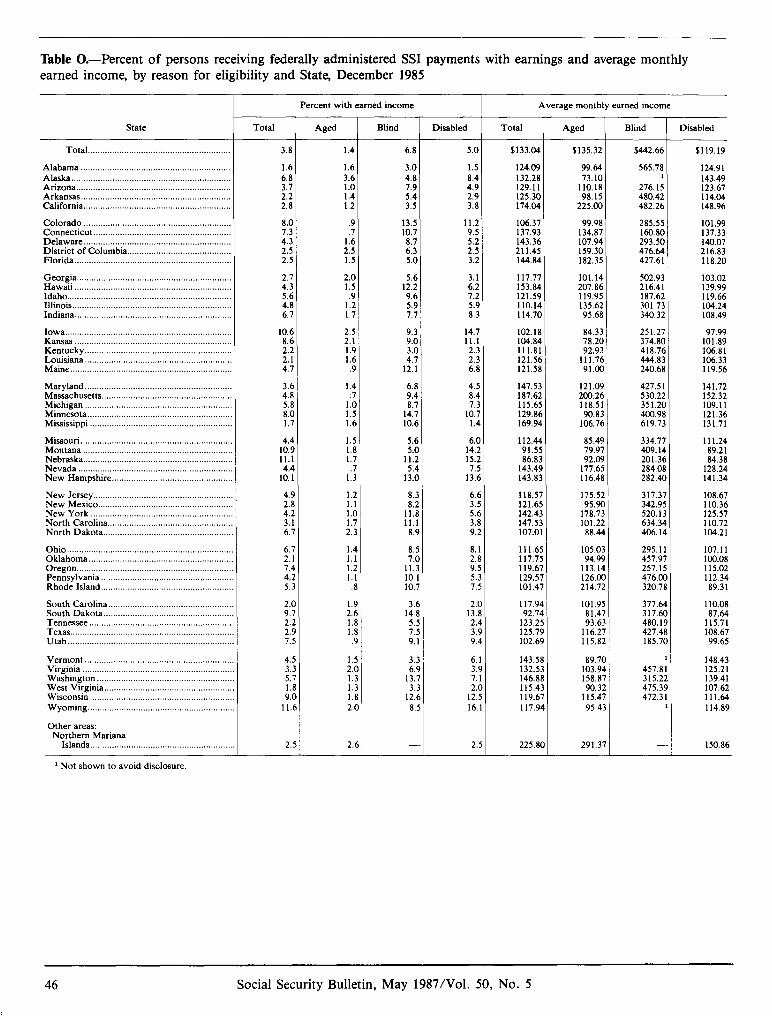
Table O.-Percent of persons receiving federally administered SSI payments with earnings and average monthly earned income, by reason for eligibility and State, December 1985
state
r Total ...........................................................
Alabama .............................................................. Alaska.. ................................................................ Ari%Xla.. .............................................................. Arkansas.. ............................................................ California.. ...........................................................
Colorado ............................................................. Connecticut.. ....................................................... Delaware.. ........................................................... District of Columbia ........................................... Florida.. ..............................................................
Georgia.. ............................................................. Hawaii ................................................................ Idaho.. ................................................................. Illinois.. ............................................................... Indiana.. ..............................................................
IOkW.. .................................................................. Kansas ................................................................ Kentucky.. .......................................................... Louisiana.. .......................................................... Maine.. ................................................................
Maryland.. .......................................................... Massachusetts.. ................................................... Michigan ............................................................ Minnesota.. ......................................................... Mississippi ..........................................................
Missouri.. ............................................................ Montana ............................................................. Nebraska.. ........................................................... Nevada ............................................................... New Hampshire.. ...............................................
New Jersey.. ....................................................... New Mexico.. ..................................................... New York .......................................................... North Carolina ................................................... North Dakota ,,,,....._..._.__...,.,............,,.,,............,
Ohio.. .................................................................. Oklahoma ........................................................... Oregon.. .............................................................. Pennsylvania ..................................................... Rhode Island.. ....................................................
South Carolina.. ................................................ South Dakota.. .................................................. Tennessee .......................................................... Texas.. ................................................................ Utah.. .................................................................
Vermont ............................................................ Virginia ............................................................. Washington ....................................................... West Virginia .................................................... Wisconsin .......................................................... Wyoming.. .........................................................
Other areas: Northern Mariana
Islands ...................................................
1 Not shown to avoid disclosure.
Percent with earned income
Total Aged Blind Disabled Total Aged
3.8
1.6 6.8 3.7 2.2 2.8
8.0 7.3 4.3 2.5 2.5
2.7 2.0 5.6 3.1 117.77 101.14 502.93 103.02 4.3 1.5 12.2 6.2 153.84 207.86 216.41 139.99 5.6 .9 9.6 1.2 121.59 119.95 187.62 119.66 4.8 1.2 5.9 5.9 110.14 135.62 301.73 104.24 6.7 1.7 7.7 8.3 114.70 95.68 340.32 108.49
10.6 8.6 2.2 2.1 4.7
3.6 4.8
2: 1:7
4.4 10.9 11.1 4.4
10.1
4.9 2.8 4.2
i::
6.7 2.1 7.4 4.i 5.:
2.c 9.; 2.; 2.! 7.f
4.1 3.:
:,I 9:(
11.t
2.1
1.4 6.8 5.0 $133.04 $135.32 5442.66 $119.19
1.6 3.0 1.5 124.09 99.64 3.6 4.8 8.4 132.28 73.10 1.0 7.9 4.9 129.11 110.18 1.4 5.4 2.9 125.30 98.15 1.2 3.5 3.8 174.04 225.00
565.78
276.15 480.42 482.26
124.91 143.49 123.67 114.04 148.96
:T 1.6 2.5 1.5
13.5 11.2 106.37 99.98 285.55 101.99 10.7 9.5 137.93 134.87 160.80 137.33 8.7 5.2 143.36 107.94 293.50 140.07 6.3 2.5 211.45 159.30 476.64 216.83 5.0 3.2 144.84 182.35 427.61 118.20
2.5 2.1 1.9 1.6 .9
9.3 9.c 3.c
1::;
14.7 102.18 84.33 251.27 97.99 11.1 104.84 78.20 374.80 101.89 2.3 111.81 92.93 418.76 106.81 2.3 121.56 111.76 444.83 106.33 6.8 121.58 9l.M: 240.68 119.56
1.4
,:S 1.5 1.6
6.8 4.5 147.53 121.09 427.51 141.72 9.4 8.4 187.62 200.26 530.22 152.32 8.; 7.3 115.65 118.51 351.20 109.11
14.; 10.7 129.86 90.83 400.98 121.36 1o.t 1.4 169.94 106.76 619.73 131.71
1.5 1.f 1.7 .i
1.3
5.t 5.c
11.:
1::;
6.0 112.44 85.45 334.71 111.24 14.2 91.55 19.97 409.14 89.21 15.2 86.83 92.05 201.36 84.38 7.5 143.49 177.6: 284.08 128.24
13.6 143.83 116.4( 282.40 141.34
1.; 1.1 1S
;:i
k; 1.; 1.’ .I
l.! 2.t 1.1 1.1 .’
1.: 2.f 1.. 1.. 1.1 2.1
2.1
8.:
1;:; 11. 8.’
6.6 118.5; 3.5 121.65 5.6 142.4: 3.8 147.52 9.2 107.01
175.5; 95.9(
Z:;’ ; 88.4r
317.37 342.95 520.13 634.34 406.14
108.67 110.36 125.57 110.72 104.21
8.: 8.1 7.1 2.8
11.: 9.5 10. 5.3 10.’ 7.5
111.6: 117.7!
;;‘9:;:
101.4:
3.1 14.1
:: 9.
2s 117.94 13.1 92.7~ 2.4 123.2: 3.5 125.71 9.4 102.6:
105.0: 295.11 107.11 94.9! 457.97 100.08
113.1’ 257.15 115.02 126.Ol 476.00 112.34 214.7: 320.78 89.31
2:’ 13.
1:: 8.
6.1 143.51 89.71 3.1 132.5: 103.9, 7.1 146.81 158.8 2s 115.4: 90.3:
12.f 119.6 115.4 16.’ 117.91 95.4
377.64 110.08 317.60 87.64 480.19 115.71 427.48 108.67 185.70 99.65
457.81 315.22 475.39 472.31
148.43 125.21 139.41 107.62 111.64 114.89
- 2.i 225.8t 291.3’ 150.86
r Average monthly earned income
r Blind Disabled
46 Social Security Bulletin, May 1987IVol. 50, No. 5
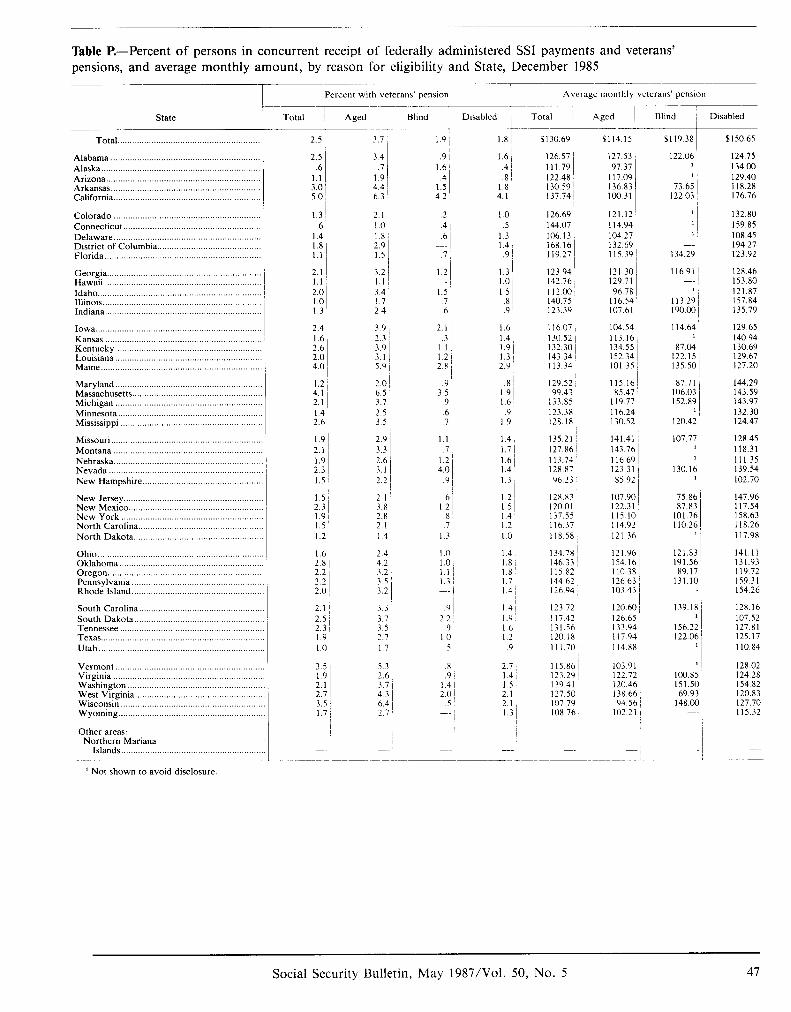
Table P.-Percent of persons in concurrent receipt of federally administered SSI payments and veterans’ pensions, and average monthly amount, by reason for eligibility and State, December 1985
state
Total.. .........................................................
Alabama .............................................................. Alaska .................................................................. Arizona ................................................................ Arkansas .............................................................. California .............................................................
Colorado ............................................................. Connecticut.. ....................................................... Delaware.. ........................................................... District of Columbia ...........................................
Georgia.. .............................................................. Hawaii ................................................................. Idaho ................................................................... Illinois.. ............................................................... Indiana.. ..............................................................
Iowa.. .................................................................. Kansas ................................................................ Kentucky.. .......................................................... Louisiana ............................................................ Maine.. ................................................................
Maryland.. .......................................................... Massachusetts ..................................................... Michigan ............................................................ Minnesota.. ......................................................... Mississippi ..........................................................
Missouri.. ............................................................ Montana ............................................................. Nebraska.. ........................................................... Nevada ............................................................... New Hampshire.. ...............................................
New Jersey.. ....................................................... New Mexico.. ..................................................... New York .......................................................... North Carolina.. ................................................. North Dakota.. ...................................................
Ohio.. .................................................................. Oklahoma.. ......................................................... Oregon.. ............................................................. Pennsylvania ..................................................... Rhode Island.. ...................................................
South Carolina.. ................................................ South Dakota.. .................................................. Tennessee ............................................. ........... Texas ................................................................ Utah.. .................................................................
Vermont ............................................................ Virginia ............................................................. Washington ....................................................... West Virginia .................................................... Wisconsin ........................................................... Wyoming.. ..........................................................
Other areas: Northern Mariana
Islands.. ......................................................... 1- I Not shown to avoid disclosure.
Percent with veterans’ pension
Total j Aged ~ I
Blind i Disabled
2.5 3.7,
2.5 .61
I.1 ~ 3.0, 5.0 i
3.4 .7
1.9 4.4 6.3
1.3 / .6’
1.4 1.8 1.1
2.1 i 1.0’ IS 2.9 1.5
2.1 I 1.1 2.0 1.0 1.3
2.4 1.6 2.6 2.0 4.0
1.2 4.1 2.1, 1.4 i 2.6
1.9 2.1 ’ I.9 2.3 1.5 ~
:::I 1.9 ~ 1.5 1.2 i
I.61 2.8 j 2.2 , 2.2 2.0 ~
2.1 ~ 2.5 i 2.3 1.9 1.0 1
3.5 1.9 2.1 2.7 3.5 1.7,
3.2 1.1, 3.4 1.7 2.4 ~
39 2.3,
::‘:I 5.9 ,
2.0 I 6.5 3.7 , 2.5 i 35
2.9 ~ 3.3 2.6, 3.1 / 2.2 1
21 3.8, 2.8 ~ 2.1 ~ 1.4
2.4 4.2~ 3.2 ’ 3.5 I 3.2 i
3.3 3.7 3.5 2.7, 1.7
5.3 i 2.6 3.1 431 6.4 ’ 2.7
1.9,
.91 1.6
.4 1.5
421
.2 ’
.4 ~
.6,
.7
“1
1.5 .7, .6
1.8
1.6 126.57 ’ .4 Ill 79 8 122.48
1.8 130591 4. I 137 74 i
2.1 .3
1 1 1.2 2.x ~
1.0 .5
I3 1.4 .$
I! 1.c 1.5 .E .(
I.( 1.r I.’ 1.: 2.’
.9 3.5 1
9i .6 .7
1.1 .7
1.2 i 4.0,
.y I
I I.$ 1.61 .9 i
l9l
1.4 135.21 ~ 141.41 ~ 1.7 I 127.86 143.76 1.6i 113.74 116.69 1.4’ 128.87 !23 31 / 1.3 96.23 85.92 ’
/
,::I 12’
.8’ I.51 1.4,
.7 1.2 1.3 1.0,
1.0 1.0 I 1 1.3~
.Y 22,
.9 1 0
.5,
1.4 1.8 ~ 1.8 1.7 1.4 ~
l4i
;::I I.2 ~ .9
.8 9’
1.4 I 201
.s
2.7 1.4 15 2.1 2.1 1.3~
c .L
Average monthly veterans’ penslo”
Total
$130.69 ~ $114.15 I $11938 $150.65
126.69 144.07 106.13 168 I6 119.27
127.53, 97.37
t :z I loo.31 1
121.12’ 114.94 i 104.27 ~ 132.69 11539~
123.94 121 30 142.76, 129.71 112.00 Y6.78 140.75 116.54’ 123.39 107 61,
116071 130.52 1 132.30 1 143.34, 113.34
129.52 99.43
133.85’ 123.38 1 128.18’
104.54 113.16 134.55 152.34
1o’.i5 i 115.16~ 85.47
119.77 116.24~ 130.52
128.83 12001 137.55 i 116.37~ 118.58
134.78 1 146.33 ’ 115.82 144.62 126.94
107.90, 75.86 1 147.96 122.31 87.83 117.54 115.10 i 101.76 158.63 114.92, 110.26 121.36’ II
118.26 117.98
123 72 11742, 131 56i 120. I8 I 11.70;
115.86 ~ 123.29, 139.41 127.50 107 79 108 76
121 96 154.16 110.38 1 12663, 103431
120.60 ~ 126.65 133.94, 11794; 114.88
103 91, 122.12 I 120.46 138.66 94.56:
102.21
122.06 L 1’
73.65 1 122.03
Ii
:/ I
134.29 i
11691 ~
1
113.29~ 190.00 1
114.64 ’ 11
87.04 122.15 135.50 ~
87.71 : 106.03 i 152.89 1
1 120.42
107.77
:I 130.16, 1
121.83, 191.56 89.17 ~
131.10,
139.18 ~ 1’
156.22,
1220fl
1: loo.85 151.50 69.93 i
148.00
124.75 134.00 129.40 118.28 176.76
132.80 159.85 108.45 194.27 123.92
128.46 153.80 121.87 157.84 135.79
129.65 140.94 130.69 129.61 127.20
14429 143.59 143.97 132.30 124.47
128.45 118.31 Ill 35 139.54 102.70
141.11 131.93 119.72 159.3 1 154.26
128.16 107.52 127.81 125.17 110.84
128.02 12428 154.82 120.83 127.70 115.32
Social Security Bulletin, May 1987/Vol. 50, No. 5 47
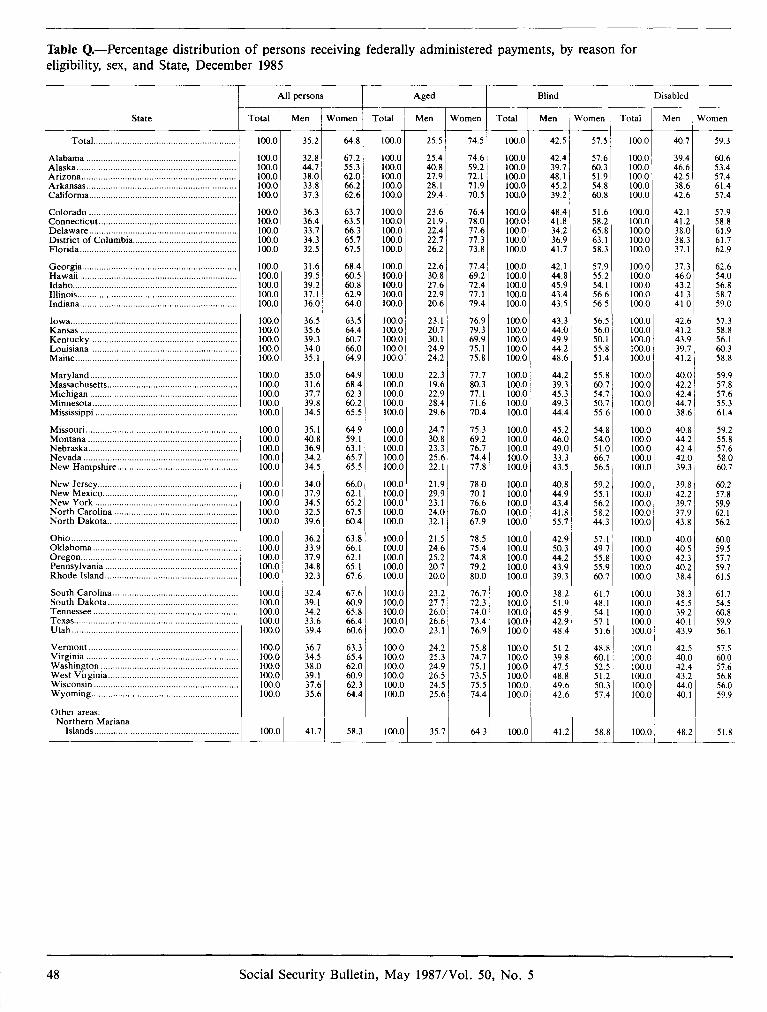
Table Q.-Percentage distribution of persons receiving federally administered payments, by reason for eligibility, sex, and State, December 1985
r state
Total ...........................................................
Alabama .............................................................. Alaska .................................................................. Arizona.. .............................................................. Arkansas.. ............................................................ California.. ...........................................................
Colorado ............................................................. Connecticut ......................................................... Del0l/are.. ........................................................... District of Columbia.. ......................................... Florida.. ...............................................................
Georgia ................................................................ Hawaii ................................................................. Idaho.. .................................................................. Illinois.. ................................................................ Indiana.. ...............................................................
Iowa.. ................................. ................................. Kansas ................................................................. Kentucky ............................................................. Louisiana .............................................................
Maryland ............................................................. Massachusetts ...................................................... Michigan ............................................................. Minnesota.. .......................................................... Mississippi ...........................................................
Missouri.. ............................................................. Montana .............................................................. Nebraska.. ............................................................ Nevada ................................................................ New Hampshire.. ................................................
New Jersey. ......................................................... New Mexico ........................................................ New York ........................................................... North Carolina.. .................................................. North Dakota ......................................................
Ohio.. ................................................................... Oklahoma ............................................................ Oregon.. ............................................................... Pennsylvania ....................................................... Rhode Island .......................................................
South Carolina.. .................................................. South Dakota ...................................................... Tennessee ............................................................ Texas.. .................................................................. Utah.. ...................................................................
Vermont .............................................................. Virginia ............................................................... Washinfcton ......................................................... West VGginia . . . . . . . . . . . . . . Wisconsin .._..........._....................................... Wyoming .._...............................................,,.,
Other areas: Northern Mariana
Islands . . . . . . . . . . . . . . . . . . . . . . . . . . . . . . . . . . . . . . . . . . . . . . . . . . . . . . . . . . .
Total 1 Men Homen
100.0
100.0 100.0 100.0 100.0 100.0
loo.0 100.0 100.0 100.0 100.0
1cQ.o loo.0 100.0 100.0 100.0
100.0 100.0 100.0 100.0 loo.0
loo.0 100.0 100.0 100.0 100.0
100.0 100.0 lcNl.0 1c0.0 lOil.0
100.0 100.0 loo.0 100.0 100.0
100.0 100.0 loo.0 loo.0 100.0
100.0 loo.0 lc0.0 loo.0 loo.0
100.0 100.0 100.0 100.0 100.0 100.0
100.0
35.2 64.8
32.8 67.2 44.7 55.3 38.0 62.0 33.8 66.2 37.3 62.6
36.3 63.7 36.4 63.5 33.7 66.3 34.3 65.7 32.5 67.5
31.6 68.4 39.5 60.5 39.2 60.8 37. I 62.9 36.0 64.0
36.5 63.5 35.6 64.4 39.3 60.7 34.c 66.0 35.1 64.9
3s.c 64.9 31.6 68.4 37.1 62.3 39.8 60.2 34.S 65.5
35.1 64.9 40.E 59.1 36,s 63.1 34.2 65.7 34.5 65.5
34.c 66.0 37.5 62.1 34.5 65.2 32.5 67.5 39.6 60.4
36.2 63.8 33.5 66.1 37.5 62.1 34.8 65.1 32.3 67.6
32.4 67.6 39.1 60.9 34.2 65.8 33.f 66.4 39.4 60.6
36.; 63.3 34.f 65.4 38s 62.0 39.1 60.9 37.t 62.3 35.t 64.4
41: 58.3
All persons
Total
100.0
100.0 100.0 100.0 100.0 100.0
100.0 100.0 100.0 100.0 100.0
100.0 100.0 100.0 100.0 100.0
100.0 100.0 100.0 loo.0 loo.0
loo.0 100.0 100.0 100.0 100.0
100.0 100.0 loo.0 100.0 loo.0
100.0 100.0 100.0 100.0 100.0
100.0 100.0 loo.0 100.0 100.0
100.0 100.0 100.0 loo.0 100.0
100.0 100.0 IMJ.0 100.0 100.0 100.0
loo.0
Aged
Men Vomen
25.5 74.5
25.4 74.6 40.8 59.2 27.9 72.1 28.1 71.9 29.4 70.5
23.6 76.4 21.9 78.0 22.4 77.6 22.7 77.3 26.2 73.8
22.6 77.4 30.8 69.2 27.6 72.4 22.9 77.1 20.6 79.4
23.1 76.9 20.7 79.3 30.1 69.9 24.9 75.1 24.2 75.8
22.3 77.7 19.6 80.3 22.9 77.1 28.4 71.6 29.6 70.4
24.7 15.3 30.8 69.2 23.3 76.1 25.6 74.4 22.1 77.8
21.9 78.0 29.9 70.1 23.1 76.6 24.0 76.0 32.1 67.9
21.5 78.5 24.6 15.4 25.2 74.8 20.7 79.2 20.0 80.0
23.2 76.1 27.7 72.3 26.0 74.c 26.6 73.4 23.1 76.5
24.2 25.3 24.9 26.5 24.5 25.6
35.7
75.8 74.7 15.1 73.5 15.: 14.4
64.1
r Blind I Disabled
Total 1 Men -
100.0
100.0 100.0 loo.0 loo.0 100.0
100.0 100.0 100.0 100.0 100.0
100.0 100.0 100.0 100.0 100.0
lOQ.0 100.0 loo.0 loo.0 1cQ.o
loo.0 loo.0 loo.0 loo.0 100.0
100.0 100.0 100.0 100.0 100.0
100.0 100.0 100.0 100.0 loo.0
loo.0 100.0 100.0 100.0 100.0
lOO.O! loo.0 100.0 100.0, 100.0
100.0 loo.0 loo.0 100.0 loo.0 lc0.0
100.0
Komen Total
42.5 57.5
42.4 57.6 39.7 60.3 48.1 51.9 45.2 54.8 39.2 60.8
48.4 51.6 41.8 58.2 34.2 65.8 36.9 63.1 41.7 58.3
42.1 57.9 44.8 55.2 45.9 54.1 43.4 56.6 43.5 56.5
43.3 44.C 49.9 44.2 48.6
56.5 56.0 so. 1 55.8 51.4
44.2 39.2 45.2 49.2 44.4
55.8 60.7 54.7 50.7 55.6
45.; 46.C 49.C 33.: 43.:
54.8 54.0 51.0 66.1 56.5
40.); 44.5 43.4 41.8 55.7
59.2 55.1 56.2 58.2 44.3
42.5 50.: 44.2 43.5 39.2
57. I 49.1 55.8 55.9 60.1
38.; 51.1 45.5 42.5 48.r
61.7 48.1 54.1 57.1 51.6
51.; 39.L 47.f 48.1 49.t 42.t
41.:
48.8 60.1 52.5 51.2 so.3 57.4
58.8
r 100.0
100.0 100.0 loo.0 100.0 lc0.0
loo.0 loo.0 loo.0 lcO.0 100.0
100.0 loo.0 100.0 100.0 loo.0
100.0 100.0 100.0 100.0 loo.0
loo.0 loo.0 loo.0 loo.0 lM).O
100.0 100.0 loo.0 loo.0 100.0
loo.0 100.0 loo.0 100.0 100.0
100.0 100.0 lC0.0 loo.0 loo.0
loo.0 100.0 100.0 100.0 loo.0
100.0 100.0 loo.0 100.0 loo.0 loo.0
100.0
r Me”
39.4 46.6 42.5 38.6 42.6
42.1 41.2 38.C 38.3 37.1
37.3 46.C 43.2 41.2 41s
42.t 41.; 43.5 39.; 41.;
4OS 42.; 42.~ 44.: 38.t
40.1 44.: 42.r 42.t 39.:
39.z 42.;
:;:; I 43.8
40x 40.1 42.: 40.; 38.L
38.: 45.1 39.; 40.! 43.’
42.: 40s 42.d 43.: 44.1 40.
48.:
r’omen
59.3
60.6 53.4 57.4 61.4 57.4
57.9 58.8 61.9 61.7 62.9
62.6 54.0 56.8 58.7 59.0
51.3 58.8 56.1 60.3 58.8
59.9 57.8 57.6 55.3 61.4
59.2 55.8 57.6 58.0 60.7
60.2 57.8 59.9 62.1 56.2
60.0 59.5 57.7 59.7 61.5
61.7 54.5 60.8 59.9 56.1
57.5 60.0 51.6 56.8 56.0 59.9
51.8
48 Social Security Bulletin, May 1987IVol. 50, No. 5
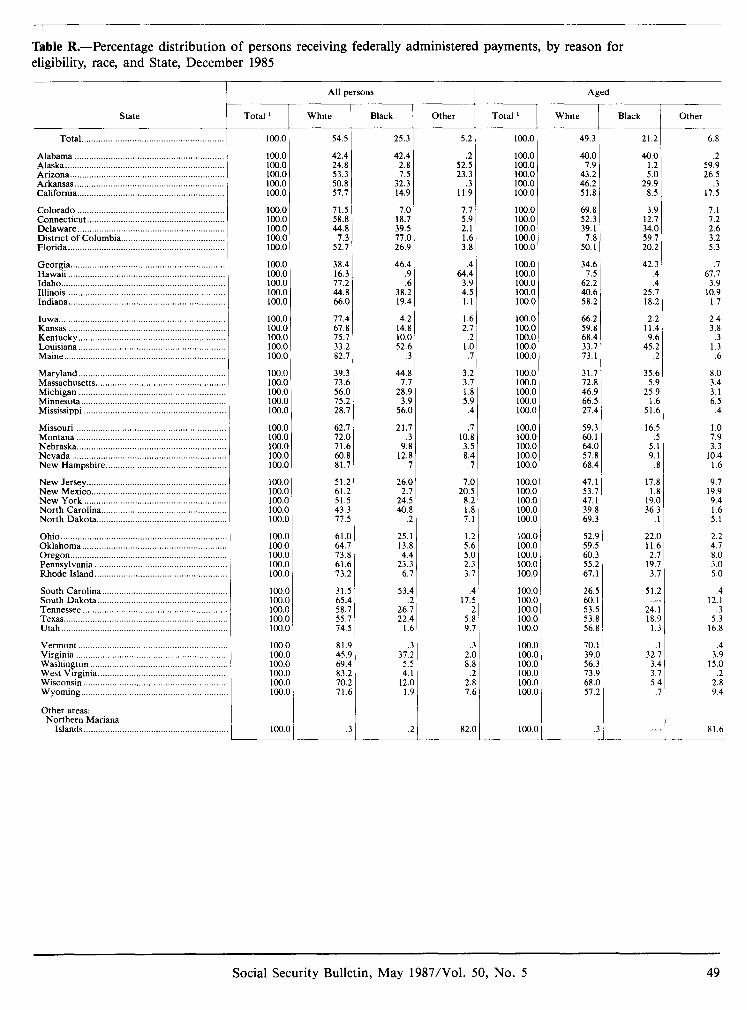
Table R.-Percentage distribution of persons receiving federally administered payments, by reason for eligibility, race, and State, December 1985
Aged All persons
Total I White Black -
r r Other Total ’ White Black Other
- 100.0
100.0 loo.0 100.0 lcQ.0 100.0
100.0 100.0 100.0 loo.0 100.0
100.0 IcQ.0 100.0 loo.0 100.0
100.0 100.0 1w.o 100.0 100.0
100.0 loo.0 100.0 loo.0 100.0
loo.0 100.0 100.0 100.0 100.0
llxl.0 100.0 100.0 100.0 lc0.0
100.0 loo.0 lc0.0 100.0 100.0
100.0 100.0 loo.0 100.0 lc0.0
loo.0 loo.0 100.0 100.0 100.0 loo.0
1w.o ’
Total.. ...........................................
Alabama .............................................................. Alaska .................................................................. Arizona ................................................................
54.5 25.3 5.2
42.4 42.4 .2 24.8 2.8 52.5 53.3 7.5 23.3 SO.8 32.3 .3 57.7 14.9 11.9
71.5 7.0 58.8 18.7 44.8 39.5
7.3 77.0 52.7 26.9
7.1 5.9 2.1 I.6 3.8
38.4 16.3 17.2 44.8 66.0
46.4
:i 38.2 19.4
64:: 3.9 4.5 1.1
77.4 4.2 67.8 14.8 75.7 10.0 33.2 52.6 82.7 .3
I.6 2.7
.2 1.0 .7
39.3 44.8 73.6 7.7 56.0 28.9 15.2 3.9 28.7 56.C
3.2 3.1 I.8 5.9
.4
62.1 21.7 72.0 1 71.6 9:E 60.8 12.8 81.7 .i
/
I , 1
I I
) I
, I ,
i
I 7
I 2 7
5
3 2 5 I 3 J
I 2
.7 10.8 3.5 8.4
.7
51.2 26.C 61.2 2.; 51.5 24.: 43.3 40.f 77.5 .‘
7.0 20.5
8.2 I.8 7.1
61.0 25.1 64.7 l3.j 73.8 4.r 61.6 23.: 13.2 6:
1.2 5.6 5.0 2.3 3.7
31.5 65.4 58.7 55.7 74.5
81.9 45.9 69.4 83.2 70.2 71.6
53.1
;$
1.;
37:; 5.: 4.
12.1 I.’
.4 17.5
5:; 9.7
2.c 8.@
.2 2.8 7.6
.3 82s
49.3 21.2 6.8
40.0 40.0 .2 7.9 1.2 59.9
43.2 5.0 26.5 46.2 29.9 .3 51.8 8.5 17.5
69.8 3.9 7.1 52.3 12.7 7.2 39. I 34.0 2.6
7.8 59.7 3.2 50.1 20.2 5.3
34.6 42.3 7.5 .4
62.2 .4 40.6 25.7 58.2 18.2
67:: 3.9
10.9 1.7
66.2 2.2 2.4 59.8 11.4 3.8 68.4 9.6 .3 33.7 45.2 I.3 73.1 .2 .6
31.7 35.6 72.8 5.9 46.9 25.9 66.5 I.6 27.4 51.6
8.0 3.4 3.1 6.5
.4
59.3 60.1 64.C 57.8 68.4
16.5
5:: 9.1
.I
1.0 7.9 3.3
10.4 1.6
47.1 53.7 47. I 39.8 69.2
17.1 I.$
19s 36.:
.I
9.7 19.9 9.4 I.6 5.1
52.5 59.5 60.: 55.; 67.1
22s II.( 2.:
19.: 3.:
51.: -
24.’ 18.’
1.:
2.2 4.7 8.0 3.0 5.0
26.t 60. I 53.: s3.t 56.f
70.: 39s 56.: 73.1 68S 51.:
.4 12.1
.3 5.3
16.8
.4 3.9
IS.0
2:; 9.4
81.6
100.0
100.0 100.0 loo.0 100.0 100.0
100.0 loo.0 100.0 100.0 loo.0
100.0 loo.0 100.0 100.0 100.0
loo.0 100.0 100.0 loo.0 loo.0
100.0 100.0 lcn3.0 100.0 loo.0
loo.0 loo.0 100.0 100.0 100.0
100.0 loo.0 100.0 loo.0 100.0
100.0 1w.o 100.0 loo.0 lcO.0
100.0 loo.0 100.0 loo.0 100.0
100.0 loo.0 100.0 100.0 100.0 loo.0
10.0 (
Arkansas .............................................................. California.. ...........................................................
Colorado ............................................................. Connecticut ......................................................... Delaware ............................................................. District of Columbia.. ......................................... Florida.. ...............................................................
Georgia.. .............................................................. Hawaii ................................................................. Idaho.. .................................................................. Illinois .................................................................. Indiana.. ...............................................................
Iowa.. ................................................................... Kansas ................................................................. Kentucky ............................................................. Louisiana ............................................................ Maine.. ................................................................
Maryland ............................................................. Massachusetts.. ................................................... Michigan ............................................................ Minnesota.. ......................................................... Mississippi ..........................................................
Missouri .............................................................. Montana ............................................................. Nebraska ............................................................. Nevada ............................................................... New Hampshire.. ...............................................
New Jersey ......................................................... New Mexico ....................................................... New York .......................................................... North Carolina.. ................................................. North Dakota ...........................................
Ohio.. .................................................................. Oklahoma.. ......................................................... Oregon.. .............................................................. Pennsylvania ...................................................... Rhode Island ......................................................
South Carolina.. ................................................. South Dakota ..................................................... Tennessee ........................................................... Texas.. ................................................................. Utah.. ..................................................................
Vermont ............................................................. Virginia .............................................................. Washington ........................................................ West Virginia ..................................................... Wisconsin .......................................................... Wyoming.. .........................................................
Other areas: Northern Mariana
Islands. ......................................................... I 1 /
Social Security Bulletin, May 1987/Vol. 50, No. 5
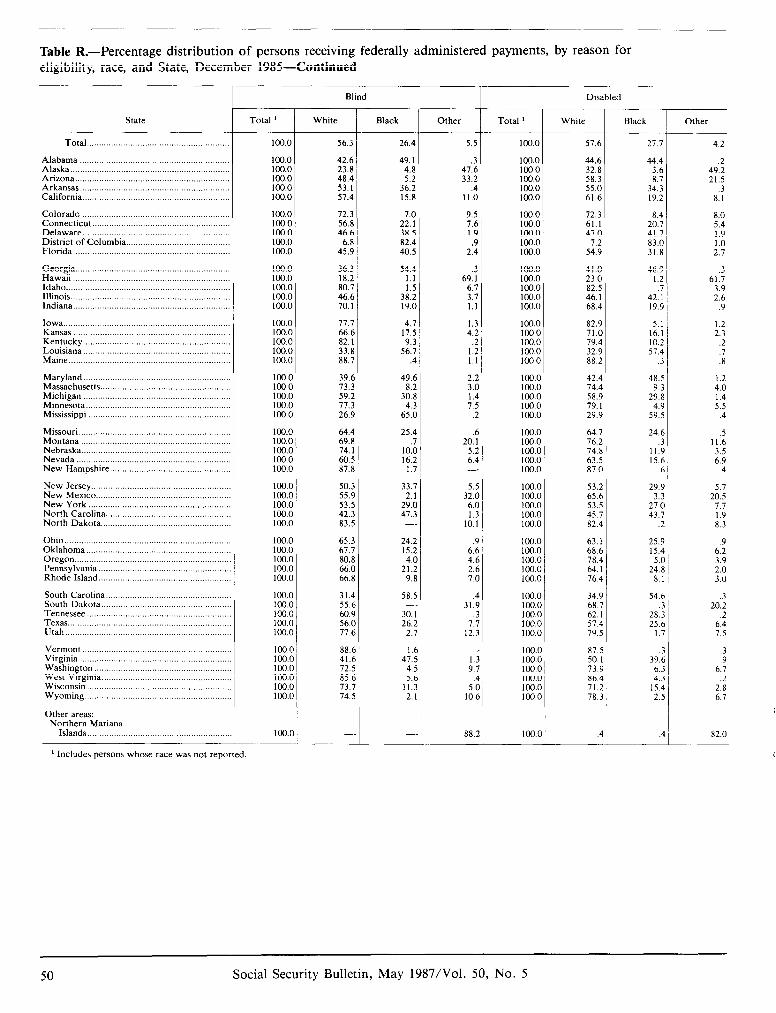
Table R.-Percentage distribution of persons receiving federally administered payments, by reason for eligibility, race, and State, December 1985-Continued
state F Total ............................................
Alabama .............................................................. Alaska.. ................................................................ Arizona.. .............................................................. Arkansas.. ............................................................ California ............................................................
Colorado ............................................................. Connecticut.. ....................................................... Delaware.. ........................................................... District of Columbia.. ......................................... Florida .................................................................
Georgia ................................................................ Hawaii ................................................................. Idaho .................................................................... Illinois ................................................................. Indiana.. ...............................................................
Iowa.. ................................................................... Kansas ................................................................. Kentucky ............................................................. Louisiana.. ........................................................... Maine.. .................................................................
Maryland ............................................................. Massachusetts.. .................................................... Michigan ............................................................. Minnesota.. .......................................................... Mississippi ..........................................................
Missouri.. ............................................................. Montana .............................................................. Nebraska ............................................................. Nevada ................................................................ New Hampshire.. ................................................
New Jersey.. ....................................................... New Mexico.. ..................................................... New York . . . . North Carolina .._.._...._.................................. North Dakota .._._._.._.......................................
Ohio. ................................................................... Oklahoma.. ......................................................... Oregon.. .............................................................. Pennsylvania ...................................................... Rhode Island.. ....................................................
South Carolina.. ................................................. South Dakota.. ................................................... Tennessee ........................................................... Texas.. ................................................................. IJtah.. ..................................................................
Vermont ............................................................. Virginia .............................................................. Washington ........................................................ West Virginia.. ................................................... - Wisconsin .._............_.........................,............,.,. Wyoming .._....................,,............,.,...,.........,,,..
Other areas: Northern Mariana
Islands .._................................ .._........
Total ’
100.0
100.0 loo.0 loo.0 ICQO loo.0
loo.0 100.0 loo.0 100.0 Iwo
lM).O 100.0 100.0 loo.0 loo.0
loo.0 100.0 100.0 100.0 100.0
100.0 100.0 100.0 100.0 100.0
lC0.0 lcO.0 loo.0 100.0 100.0
loo.0 lc0.0 loo.0 loo.0 loo.0
lW.0 100.0 loo.0 loo.0 loo.0
lcQ.0 100.0 loo.0 100.0 100.0
100.0 100.0 llx.0 100.0 loo.0 loo.0
100.0
1 Includes persons whose race was not reported
White Black
56.3 26.4 5.5
42.6 49.1 .3 23.8 4.8 47.6 48.4 5.2 33.2 53. I 36.2 .4 57.4 IS.8 II.0
72.3 7.0 9.5 56.8 22. I 7.6 46.6 38.5 1.9
6.8 82.4 .9 45.9 40.5 2.4
36.3 54.4 .3 18.2 I.1 69. I 80.7 I.5 6.7 46.6 38.2 3.7 70. I 19.0 I.1
77.1 4.7 I.3 66.6 17.5 4.2 82. I 9.3 .2 33.8 56.7 I.2 88.7 .4 1.1
39.6 49.6 2.2 73.3 8.2 3.0 59.2 30.8 1.4 77.3 4.3 7.5 26.9 65.0 .2
64.4 69.8 74. I 60.5 87.8
25.4
10:: 16.2
1.7
.6 20. I
5.2 6.4 -_
so.3 33.7 5.5 55.9 2.1 32.0 53.5 29.0 6.0 42.3 47.3 1.3 83.5 -. IO. I
65.3 24.2 .9 67.7 15.2 6.6 80.8 4.0 4.6 66.0 21.2 2.6 66.8 9.8 7.0
31.4 55.6 60.9 56.0 77.6
58.5
3z 26.2
2.7
31:;: 3
73 12.3
88.6 1.6 41.6 47.5 72.5 4.5 85.6 5.6 73.7 11.3’ 74.5 2.1 i
1.3 9.7
.4 5.0
10.6
88.2
I Other t L Total ’
loo.0
loo.0 loo.0 loo.0 100.0 100.0
100.0 loo.0 100.0 100.0 loo.0
loo.0 loo.0 100.0 100.0 100.0
100.0 loo.0 loo.0 100.0 100.0
100.0 100.0 loo.0 100.0 loo.0
loo.0 100.0 loo.0 loo.0 lOQ.0
100.0 loo.0 100.0 100.0 100.0
100.0 100.0 100.0 loo.0 100.0
lcKl.0 lcKl.0 loo.0 loo.0 lW.0
100.0 loo.0 100.0 100.0 loo.0 loo.0
100.0
White
57.6 27.7 4.2
44.6 44.4 .2 32.8 3.6 49.2 58.3 8.7 21.5 55.0 34.3 .3 61.6 19.2 8.1
72.3 8.4 8.0 61.1 20.7 5.4 47.0 41.7 1.9
7.2 83.0 1.0 54.9 31 8 2.7
41.0 48.9 .3 23.0 1.2 61.7 82.5 .7 3.9 46. I 42.1 2.6 68.4 19.9 .9
82.9 5.1 1.2 71.0 16.1 2.3 79.4 10.2 .2 32.9 57.4 .7 88.2 .3 .8
42.4 48.5 74.4 9.3 58.9 29.8 79. I 4.9 29.9 59.5
1.2 4.0 1.4 5.5
.4
64.7 76.2 74.8 63.5 87.0
24.6 .3
11.9 IS.6
.5 11.6 3.5 6.9
53.2 65.6 53.5 45.7 82.4
.6 .4
’ 29.9 5.7 3.3 20.5
27.0 7.7 43.7 1.9
.2 8.3
63.1 68.6 78.4 64.1 76.4
34.9 68 7 62.1 57.4 79.5
25.9 .9 15.4 6.2
5.0 ~ 3.9 24.8 1 2.0
8.1 ! 3.0
54:; / 20.2 .3
28.3 ’ .2 25.6 6.4
1.7 1 7.5
87.5 so. I 73.9 86.4 71.2
.3 .3 39.6 .9
6.3 6.7 4.3 .2
15.4 1 2.8 2.5 6.7 78.3
.4~ -1
Black Other
.41 82.0
50 Social Security Bulletin, May 1987/Vol. 50, No. 5
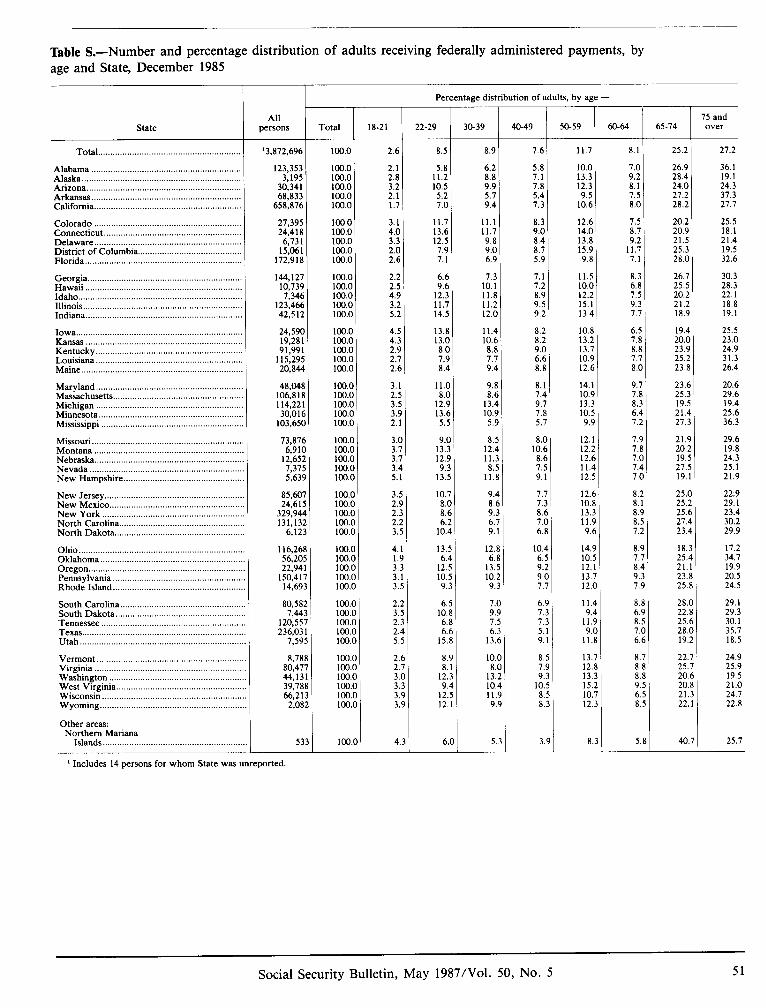
Table S.-Number and percentage distribution of adults receiving federally administered payments, by age and State, December 1985
r state
Total., .........................................................
Alabama .............................................................. Alaska .................................................................. Arizona ................................................................ Arkansas .............................................................. California .............................................................
Colorado ............................................................. Connecticut.. ....................................................... Delaware.. ........................................................... District of Columbia.. ......................................... Florida.. ...............................................................
Georgia ................................................................ Hawaii ................................................................. Idaho .................................................................... Illinois.. ................................................................ Indiana .................................................................
Iowa ..................................................................... Kansas ................................................................. Kentucky.. ........................................................... Louisiana ............................................................. Maine.. .................................................................
Maryland.. ........................................................... Massachusetts.. .................................................... Michigan ............................................................. Minnesota.. .......................................................... Mississippi ...........................................................
Missouri .............................................................. Montana ............................................................. Nebraska.. ........................................................... Nevada ............................................................... New Hampshire.. ...............................................
New Jersey.. ....................................................... New Mexico ....................................................... New York .......................................................... North Carolina ................................................... North Dakota .....................................................
Ohio.. .................................................................. Oklahoma ........................................................... Oregon ................................................................ Pennsylvania ...................................................... Rhode Island.. ....................................................
South Carolina ................................................... South Dakota.. ................................................... Tennessee ........................................................... Texas ................................................................... Utah.. .................................................................
Velmont ............................................................ Virginia ............................................................. WaLhington ........................................................ West Vireinia ..................................................... Wisconsin . . . . . . . . . . . . . . . . . . . . . . . . . . . . . Wyoming . . . . . . . . . . . . . . . . . . . . . . . . . . . . .
Other areas: Northern Mariana
Islands
Percentage distribution of adults, by age -
All persons Total 18-21 22-29 30-39 r '3,872,696
123,353 3,195
30,341 68,833
658,876
27,395 ~ 24,418
6,731 15,061
172,918
144,127 10,739 7.346
l23;466 42,512
24,590 19,281 91,991
115,295 20,844
48,048 106,818 114,221 30,016
103,650
73,876 6,910
12,652 7,375 5,639
85.607 24;6lS
329,944 131,132
6,123
116,268 56.205 22;941
150,417 14,693
80,582 7,443
120,557 236,03 I
7,592
8,788 so,47; 44,131 39,788 66,213
2,082
533
’ Includes 14 persons for whom State was unreported.
100.0
100.0 loo.0 loo.0 100.0 loo.0
100.0 loo.0 100.0 100.0 lrx.0
100.0 loo.0 100.0 100.0 lc0.0
100.0 100.0 loo.0 100.0 100.0
loo.0 100.0 loo.0 100.0 100.0
loo.0 100.0 100.0 100.0 100.0
100.0 100.0 loo.0 loo.0 100.0
100.0 100.0 loo.0 loo.0 100.0
loo.0 lc0.0 100.0 100.0 100.0
100.0 100.0 100.0 100.0 loo.0 100.0
1w.o
2.6 8.5 8.9 7.6 11.7 8.1
2.1 5.8 6.2 5.8 10.0 7.0 2.8 11.2 8.8 7.1 13.3 9.2 3.2 10.5 9.9 7.8 12.3 8.1 2.1 5.2 5.7 5.4 9.5 7.5 1.7 7.0 9.4 7.3 10.6 8.0
3.1 11.7 11.1 8.3 12.6 7.5 4.0 13.6 II.7 9.0 14.0 8.1 3.3 12.5 9.8 8.4 13.8 9.2 2.0 7.9 9.0 8.7 15.9 11.7 2.6 7.1 6.9 5.9 9.8 7.1
21.5 25.3 28.0
2.2 6.6 7.3 7.1 11.5 8.3 26.7 2.5 9.6 IO.1 7.2 10.0 6.8 25.5 4.9 12.3 11.8 8.9 12.2 7.5 20.2 3.2 11.7 11.2 9.5 15.1 9.3 21.2 5.2 14.5 12.0 9.2 13.4 7.7 18.9
4.5 13.8 11.4 8.2 10.8 6.5 19.4 4.3 13.0 10.6 8.2 13.2 7.8 20.0 2.9 8.0 8.8 9.0 13.7 8.8 23.9 2.7 1.9 1.7 6.6 10.9 7.7 25.2 2.6 8.4 9.4 8.8 12.6 8.0 23.8
3.1 11.0 9.8 2.5 8.0 8.6 3.5 12.9 13.4 3.9 13.6 10.9 2.1 5.5 5.9
8.1 14.1 9.7 23.6 7.4 10.9 7.8 25.3 9.7 13.3 8.3 19.5 7.8 IO.5 6.4 21.4 5.7 9.9 7.2 27.3
Z:!: 3.7 3.4 5.1
9.0 8.5 13.3 12.4 12.9 11.3 9.3 8.5
13.5 1l.Z
8.0 12.1 7.9 21.9 29.6 10.6 12.2 7.8 20.2 19.8 8.6 12.6 7.0 19.5 24.3 7.5 11.4 7.4 27.5 25. I 9.1 12.5 7.0 19.1 21.9
3.5 10.7 9.4 2.9 8.0 8.f 2.3 8.6 9.: 2.2 6.2 6.; 3.5 10.4 9.1
7.7 12.6 8.2 25.0 7.3 10.8 8.1 25.2 8.6 13.3 8.9 25.6 7.0 11.9 8.5 21.4 6.8 9.6 7.2 23.4
4.1 13.5 12.1 I.9 6.4 6.1 3.3 12.5 13.1 3.1 10.5 10.: 3.5 9.3 9.:
10.4 14.9 6.5 10.5 9.2 12.1 9.0 13.7 7.7 12.0
8.9 7.7 8.4 9.2 7.5
18.3 17.2 25.4 34.7 21.1 19.9 23.8 20.5 25.8 24.5
2.2 6.5 7.1 3.5 10.8 9.' 2.3 6.8 7.: 2.4 6.6 6.. 5.5 15.8 13.1
6.9 11.4 7.3 9.4 7.3 11.9 5.1 9.0 9.1. 11.8
8.t 6.1 8.: 7s 6.t
28.C 22.E 25.6 28.C 19.2
2.t : 2.7
3.c 3.3 3.9 3.9
4.3
8.9 8.1
12.3 9.4
12.5 12.1
IO.1 8.r
13.. 10.4 Il.9 9.5
8.5 7.9 9.3
10.5 8.5 8.3
3.9 I 13.7 12.8 13.3 15.2 10.7 12.3
8: 8.1 8.1 9.5 6.5 8.5
:::; 20.1 20.8 21.3 22.1
6.0 5.1 8.3 5.8 1
36.1 19.1 24.3 37.3 27.7
25.5 18.1 21.4 19.5 32.6
30.3 28.3 22. I 18.8 19.1
25.5 23.0 24.9 31.3 26.4
20.6 29.6 19.4 25.6 36.3
22.9 29.1 23.4 30.2 29.9
29. I 29.3 30.1 35.7 18.5
24.9 25.9 19.5 21.0 24.1 22.8
25.7
Social Security Bulletin, May 1987/Vol. 50, No. 5 51
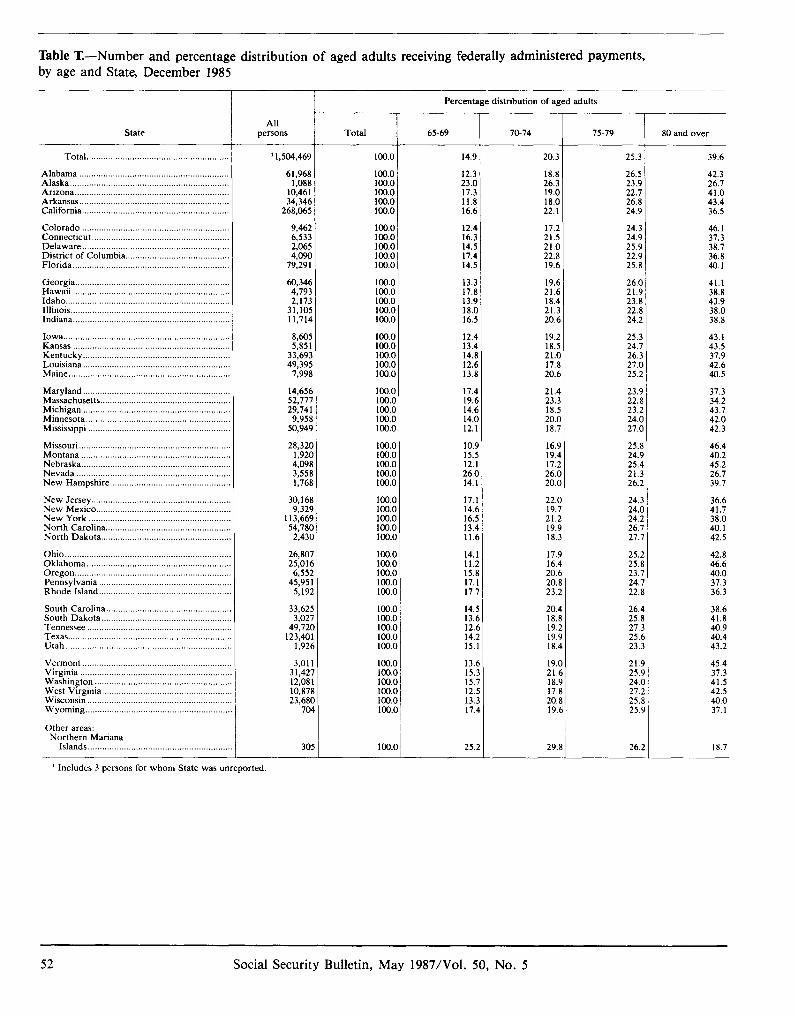
Table T.-Number and percentage distribution of aged adults receiving federally administered payments, by age and State, December 1985
state
Alabama .............................................................. Alaska .................................................................. Arizona ................................................................ Arkansas. ............................................................. California.. ...........................................................
Colorado ............................................................. Connecticut.. ....................................................... Delaware ............................................................. District of Columbia ........................................... Florida .................................................................
Georgia ................................................................ Hawaii ................................................................. Idaho.. .................................................................. Illinois.. ................................................................ Indiana.. ...............................................................
Iowa.. ................................................................... Kansas ................................................................. Kentucky ............................................................. Louisiana ............................................................. Maine. ..................................................................
Maryland ............................................................. Massachusetts ...................................................... Michigan ............................................................. Minnesota ............................................................ Mississippi ...........................................................
Missouri.. ............................................................. Montana .............................................................. Nebraska .............................................................. Nevada ................................................................ New Hampshire ..................................................
New Jersey.. ........................................................ New Mexico.. ...................................................... New York ........................................................... North Carolina.. .................................................. North Dakota.. ...................................................
Ohio.. .................................................................. Oklahoma ........................................................... Oregon.. .............................................................. Pennsylvania ...................................................... Rhode Island.. ....................................................
South Carolina.. ................................................. South Dakota.. ................................................... Tennessee ........................................................... Texas.. ........ ........................................................ Utah.. ..................................................................
Vermo”t .... ........................................................ Virginia .............................................................. Washington ........................................................ West Virginia.. ................................................... Wisconsin.. ......................................................... Wyoming.. ..........................................................
Other areas: Northern Mariana
Islands.. .........................................................
All persons
l&504,469 100.0 14.9 20.3 25.3 39.6
61,968 1,088
10,461 34,346
268,065
9,462 6.533 2;06S
7:EY
60,346 4,793 2,173
31,105 11,714
8.605 5;SSl
33,693 49,395
7,998
14,656 52,771 29,741
9,958 50,949
100.0 18.0 100.0 16.5
100.0 12.4 100.0 13.4 100.0 14.8 100.0 12.6 100.0 13.8
100.0 17.4 100.0 19.6 100.0 14.6 100.0 14s loo.0 12.1
21.4 23.9 37.3 23.3 22.8 34.2 18.5 23.2 43.1 20.0 24.0 42.0 18.7 27.0 42.3
28,320 loo.0 10.5 16.9 25.8 1,920 100.0 IS.! 19.4 24.9 4,098 loo.0 12.1 17.2 25.4 3,558 loo.0 26.C 26.0 21.3 1,768 loo.0 14.1 20.0 26.2
30.168 9;329
113.669 54;780
2,430
26,807 25.016
6,552 45,951
5,192
33,625 3,027
49,720 123,401
1,926
3.01 I 3 I;427 12,081 10,878 23,680
704
30s loo.0 1 25.: 29.8 26.; 18.7
Percentage distribution of aged adults
Total I 65-69 70-74 75-79 80 and over
100.0 12.3 100.0 23.0 100.0 17.3 100.0 11.8 100.0 16.6
100.0 12.4 100.0 16.3 100.0 14.5 100.0 17.4 100.0 14.5
100.0 13.3 100.0 17.8 100.0 13.9
loo.0 17.1 22.0 24.3 loo.0 14.t 19.7 24.a 100.0 16.1 21.2 24.2 100.0 13.4 19.9 26.7 100.0 1l.f 18.3 27.7
loo.0 14.1 100.0 11.; loo.0 15.5 100.0 17.1 lccl.0 17.:
loo.0 14.t 100.0 13.t 100.0 12.t 100.0 14.: 100.0 IS..
100.0 13.f loo.0 15.: 100.0 1s: 100.0 12.1 100.0 13.: 100.0 17.1
18.8 26.5 26.3 23.9 19.0 22.7 18.0 26.8 22.1 24.9
17.2 24.3 46.1 21.5 24.9 37.3 21.0 25.9 38.7 22.8 22.9 36.8 19.6 25.8 40.1
19.6 26.0 41.1 21.6 21.9 38.8 18.4 23.8 43.9 21.3 22.8 38.0 20.6 24.2 38.8
19.2 25.3 43.1 43.5 37.9 42.6 40.5
18.5 24.7 21.0 26.3 17.8 27.0 20.6 25
17.9 25.2 16.4 25.8 20.6 23.1 20.8 24.7 23.2 22.8
20.4 26.4 38.6 18.8 25.8 41.8 19.2 27.2 40.9 19.9 2s.t 40.4 18.4 23.2 43.2
19.0 21.6 18.9 17.8 20.8 l9.C
21,s 25.5 24.C 27.; 25.E 25.s
42.3 26.1 41.0 43.4 36.5
46.4 40.2 45.2 26.1 39.7
36.6 41.7 38.0 40. I 42.5
42.8 46.6 40.0 37.3 36.3
45.4 37.3 41.5 42.5 40.0 37.1
’ Includes 3 persons for whom State was unreported.
52 Social Security Bulletin, May 1987/Vol. 50, No. 5
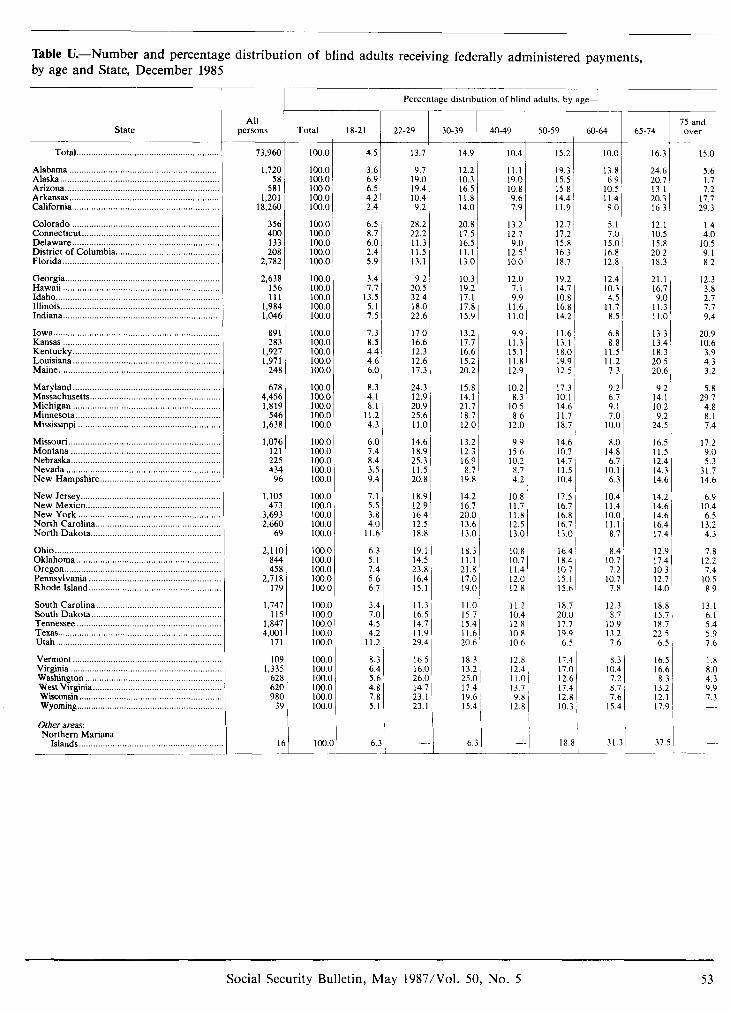
Table U.-Number and percentage distribution of blind adults receiving federally administered payments, by age and State, December 198s
i- r Percentage distribution of bhnd adults, by age-
I r Total IS-21
loo.0
100.0 100.0 loo.0 100.0 100.0
ICQO 100.0 100.0 100.0 100.0
100.0 loo.0 loo.0 100.0 loo.0
100.0 100.0 loo.0 Ic0.0 100.0
100.0 100.0 loo.0 100.0 100.0
loo.0 lc0.0 100.0 loo.0 100.0
loo.0 loo.0 100.0 100.0 llx.0
loo.0 lc0.0 loo.0 100.0 loo.0
100.0 100.0 loo.0 10x0 loo.0
100.0 100.0 lc0.0 100.0 100.0 loo.0
loo.(
3.4 9.2 10.3 7.7 20.5 19.2
13.5 32.4 17.1 5.1 18.0 17.8 7.5 22.6 15.9
8.3 4.1 8.1
11.2 4.3
7.1 5.5 3.8 4.C
Il.6
I 40-49 i 50-59 64-64
75 and O”U
All persons
73,960
1.720
state 22-29 30-39 65-74
c c 10.0 16.3 15.0
13.8 24.6 5.6 6.9 20.7 1.7
10.5 13.1 7.2 II.4 20.3 17.7 9.0 16.3 29.3
5.1 12.1 I.4 7.0 10.5 4.0
15.0 15.8 10.5 16.8 20.2 9.1 12.8 18.3 8.2
12.4 21.1 12.3 10.3 16.7 3.8 4.5 9.0 2.7
II.7 11.3 7.7 8.5 11.0 9.4
6.8 13.3 20.9 8.8 13.4 10.6
11.5 18.3 3.9 II.2 20.5 4.3 7.3 20.6 3.2
9.2 9.2 5.8 6.7 14.1 29.7 9.1 10.2 4.8 7.0 9.2 8.1
10.0 24.5 7.4
8.0 16.5 17.2 14.8 II.5 9.0 6.7 12.4 5.3
10.1 14.3 31.7 6.3 14.6 14.6
10.4 14.2 6.9 Il.4 14.6 10.4 10.0 14.6 6.5 11.1 16.4 13.2 8.7 17.4 4.3
8.4 12.9 7.8 10.7 17.4 12.2 7.2 IO.3 7.4
10.7 12.7 10.5 7.8 14.0 8.9
12.3 8.7
10 9
18.8 13.1 15.7 6. I 18.7 5.4 22.5 5.9
6.5 7.6
16.5 16.6 8.3
13.2 12.1 17.9
1.8 8.0 4.3 9.9 7.3
37.1
4.5 13.7 14.9
3.6 9.7 12.2 6.9 19.0 10.3 6.5 19.4 16.5 4.2 10.4 11.8 2.4 9.2 14.0
6.5 28.2 20.8 8.7 22.2 17.5 6.0 II.3 16.5 2.4 11.5 11.1 5.9 13.1 13.0
7.3 8.5 4.4 4.6 6.C
17.0 13.2 9.9 16.6 17.7 11.3 12.3 16.6 15.1 12.6 15.2 11.8 17.3 20.2 12.9
24.3 15.8 10.2 12.9 14.1 8.3 20.9 21.7 10.5 25.6 18.7 8.6 1l.C l2.C 12.0
6.C 7.4 8.4 3.: 9.4
14.6 13.2 18.9 12.3 25.3 16.9 II.5 8.7 20.E 19.8
18.9 12.5 16.4 12.2 18.1
g 1 13.6’ 13.0
6.: 5.1 1.L 5.t 6.:
19.1 14.: 23.E 16.4 15.1
3.6 7s 4.: 4.;
11.;
11.: 16.: 14.; 11.5 29.L
18.3 11.1 21.8 17.0 19.0,
11.0 15.7 ’ 15.4 II.6 20.6
8.: 6.t 5.1 4.1 7.1 5.
16.: 16.c 26.c 14: 23.’ 23.
18.3
:~:~ 1 17.4 I 19.6 i 15.4
6. - 6.3
c -d Total ...........................................................
Alabama .............................................................. Alaska.. ................................................................ Arizona ................................................................ Arkansas .............................................................. California .............................................................
Colorado ............................................................. Connecticut.. ....................................................... Delaware ............................................................. District of Columbia.. ......................................... Florida .................................................................
Georgia.. .......................................
15.2
19.3 IS.5 15.8 14.4 II.91
12.7 17.2 15.8 16.3: 18.7
19.2 14.7 10.8 16.8 14.2
11.6; 13.1 18.0’ 19.9 1 12.5,
17.3 IO. 1 14.6 11.7 18.7
1 14.6 10.7 14.7 11.5 10.4
17.5 16.7 16.8 16.7 13.0
16.4 18.4 10.7 15.1 15.6
18.7 2o.c 11.7 19.9 6.5
10.4
Il.1 19.0 10.8 9.6 7.9
13.2 12.7 9.0
12.5 10.0
12.0
;:;I 11.6: II.0
9.9 15.6 10.2 8.7 4.2
10.8 II.7 Il.8 12.5 l3.C
10.8 10.7 11.4 l2.C 12 E
I l.i 10.4 12.F IO.8 10.t
12.z 12.0 ! I.( 13.; 9.t
12.t
58 581
1,201 18,260
356 4ou 133 208
2,782
2,638 I56 Ill
1,984 1,046
891 283
1,927 1,971
248
-.. Hawa” Idaho .._............................................................. Illinois.. ................................................................ Indiana .................................................................
Iowa.. ................................................................... Kansas ................................................................. Kentucky ............................................................. Louisiana .............................................................
Maryland ............................................................. Massachusetts.. ....................................................
678 4.456 1,819
546 1,638
Michigan ............................................................. Minnesota.. .......................................................... Mississippi ..........................................................
1,076 I21 22s 434
96
Montana .............................................................. Nebraska.. ............................................................ Nevada ............................................................... New Hampshire.. ...............................................
New Jersey.. ........................................................ New Mexico.. ..................................................... New York .......................................................... North Carolina.. ................................................. North Dakota.. ...................................................
Ohio.. .................................................................. Oklahoma.. ................... ..................................... Oregon ................................................................ Pennsylvania ...................................................... Rhode Island.. ....................................................
1,105 473
3,693 2,660
69
2,1 IO 844 458
2,718 179
South Carolina.. ................................................. South Dakota.. ...................................................
1,747 115
1,847 4,001
171
Tennessee ........................................................... Texas.. ................................................................. Utah.. ..................................................................
Vermont ...................................................... Virginia .............................................................. Washington ........................................................ West Virginia ..................................................... Wisconsin ........................................................... Wyoming.. ..........................................................
Other areas: Northern Mariana
Islands ..............................................
109 1,335
628 620 980
39
17.4 170 12.6 17.4 12.8 10.3, I -I 18.8
Social Security Bulletin, May 1987/Vol. 50, No. 5 53
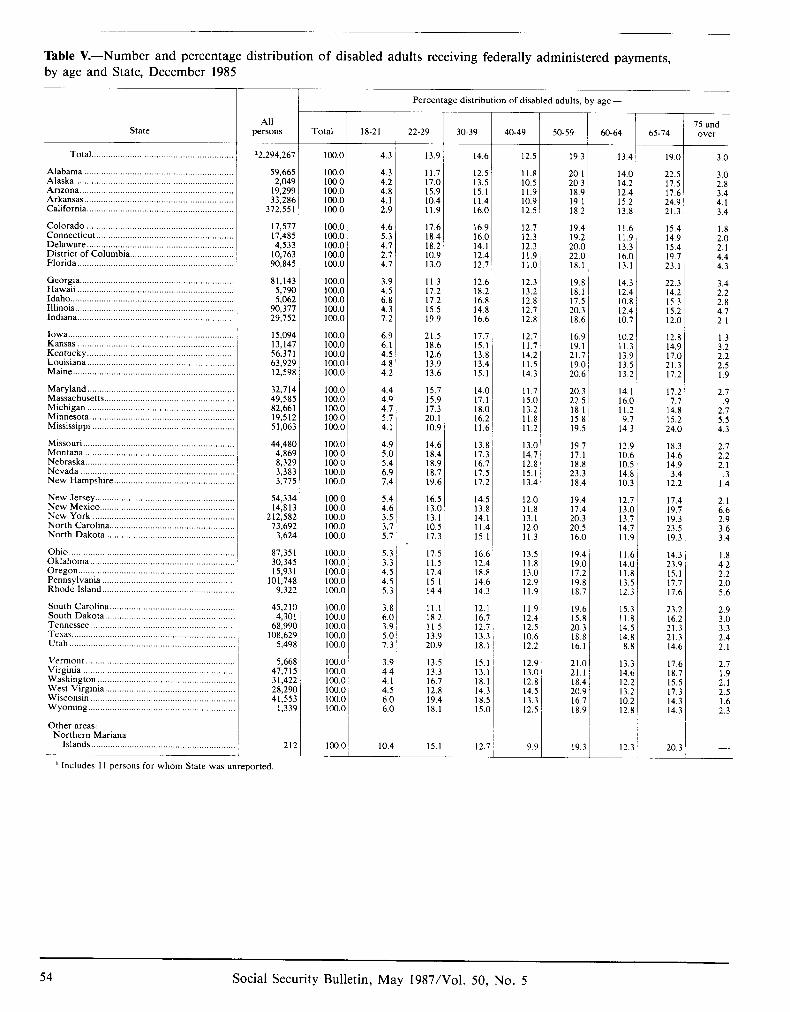
Table V.-Number and percentage distribution of disabled adults receiving federally administered payments, by age and State, December 1985
state
TOtal
Alabama ...... ....................................................... Alaska.. ................................................................ Arizona.. .............................................................. Arkansas.. ............................................................ California.. ...........................................................
Colorado ............................................................. Connecticut.. ....................................................... Delaware.. ........................................................... District of Columbia.. ......................................... Florida.. ...............................................................
Georgia.. .............................................................. Hawaii ................................................................. Idaho .................................................................... Illinois.. ................................................................ Indiana.. ...............................................................
Iowa.. ......................................... ......................... Kansas ................................................................. Kentucky.. ........................................................... Louisiana ............................................................. Maine ...................................................................
Maryland ........ Massachusetts.. .................................................... Michigan ............................................................. Minnesota.. .......................................................... Mississippi ...........................................................
Missouri. .............................................................. Montana .............................................................. Nebraska.. ............................................................ Nevada ................................................................ New Hampshire.. ................................................
New Jersey.. ........................................................ New Mexico ........................................................ New York ........................................................... North Carolina.. .................................................. North Dakota.. ....................................................
Ohio. .................................................................... Oklahoma ............................................................ Oregon.. ............................................................... Pennsylvania ....................................................... Rhode Island.. ....................................... .............
South Carolina.. .................................. ............... South Dakota.. ................................ ................... Tennessee ............................................................ Texas.. ............................................ ..................... Utah.. ...................................................................
Vermont Virginia ............................................................... Washington ......................................................... West Virgmia. .................................................... Wisconsin ............................................................ Wyoming.. ...........................................................
Other areas: Northern Mariana
Islands
All persons
‘2,294,267
59,665 2,049
19,299 33,286
372,551
17,577 17,485 4,533
10,763 90,845
81,143 5,790 5,062
90,377 29,752
15,094 13,147 56,371 63,929 12,598
32,714 49,585 82,661 19,512 5 1,063
44,480 4,869 8,329 3,383 3,775
54,334 14,813
212,582 73,692
3,624
87,351 30,345 15,931
101,748 9,322
45,210 4,301 ~
’ Includes 1 I persons for whom State was unreported.
18.21
100.0
103.0 loo.0 loo.0 100.0 ICO.0
100.0 100.0 100.0 100.0 loo.0
100.0 100.0 100.0 100.0 loo.0
100.0 loo.0 loo.0 100.0 100.0
loo.0 100.0 100.0 100.0 loo.0
loo.0 loo.0 100.0 loo.0 100.0
100.0 100.0 loo.0 100.0 loo.0
loo.0 100.0 100.0 100.0 100.0
100.0 100.0 loo.0 100.0 100.0
100.0 i ICC.0 100.0 100.0 100.0 ~ 100.0 1
100.0,
I 4.3 13.9 14.6 13.4
4.3 11.7 12.5 4.2 17.0 13.5 4.8 15.9 15.1 4.1 10.4 11.4 2.9 11.9 16.0
20 I 14.0 22.5 3.0 20.3 14.2 17.5 2.8 18.9 12.4 17.6 3.4 19.1 15.2 24.9 I 4.1 18.2 13.8 21.3 i 3.4
4.6 17.6 16.9 5.3 18.4 16.0 4.7 18.2 14.1 2.7 10.9 12.4 4.1 13.0 12.7
19.4 11.6 19.2 11.9 20.0 13.3 22.0 16.0 18.1 13.1
3.9 11.3 12.6 12.3 19.8 14.3 4.5 17.2 18.2 13.2 18.1 12.4 6.8 17.2 16.8 12.8 17.5 10.8 4.3 15.5 14.8 12.7 20.3 12.4 7.2 19.9 16.6 12.8 18.6 10.7
6.9 21.5 17.7 12.7 16.9 10.2 6.1 18.6 15.1 11.7’ 19.1 11.3 4.5 12.6 13.8 14.2 1 21.7 13.9 4.8 13.9 13.4 11.5 19.0 13.5 4.2 13.6 15.1 14.3 20.6 13.2
4.4 15.7 14.0 11.7 20.3 14.1 4.9 15.9 17.1 15.0 22.5 16.0 4.7 17.3 18.0 13.2 18.1 11.2 5.7 20.1 16.2 11.8 15.8 9.7 4.1 10.9 Il.61 11.2 19.5 14.3
4.9 14.6 13.8 1 13.0 5.0 18.4 17.3 14.7 5.4 18.9 16.7 12.8 6.9 18.7 17.5 15.1 7.4 19.6 17.2 13.4
5.4 16.5 14.5 12.0 4.6 13.0 13.8 11.8 3.5 13.1 14.1 13.1 3.7 10.5 11.4 12.0 5.7 17.3 15.1 11.3
19.7 17.1 1 18.8 23.3 ~ 18.4 ~
19.4 ~ 17.4 20.3, 20.5 1 16.0 ~
12.9 18.3 2.7 10.6 14.6 2.2 10.5 14.9 2.1 14.8 3.4 ! .3 10.3 12.2 I 1.4
12.7 17.4 2.1 13.c 19.7 6.6 13.7 19.3 2.9 14.1 23.5 3.6 11.9 19.3 3.4
5.3 1 17.5 16.6 3.3 11.5 12.4 4.5 17.4 18.8 4.5 15.1 14.6 5.3 14.4 14.3
13.5 11.8 13.0 12.9 11.9~
119: 12.4 12.5 10.6 12.2
19.4 II.6 14.3 1.8 19.0 14.c 23.9 4.2 17.2 Il.8 15.1 2.2 19.8 13.5 17.7 2.0 18.7 12.3 17.6 5.6
3.8 11.1 12.1 6.0 18.2 16.7 3.9 11.5 12.7, 5.0 13.9 13.3, 7.3 20.9 18.1 ~
19.6 15.3 23.2 2.9 15.8 Il.8 16.2 3.0 20.3 14.5 21.3 3.3 18.8 14.8 21.3 2.4 16.1 8.E 14.6 2.1
3.9 13.5 15.1 I 12.9 21.0 13.2 17.6 2.1 4.4 13.3 13.1 14.f 1.9 4.1 16.7
13.0 ~ 21.1 18.7 18.1 12.8 18.4 12.2 15.5 2.1
4.5 12.8 14.3 14.5 20.9 13.2 17.3 2.5 6.0 19.4 18.5 13.3 16.7 10.2 14.3 1.6 6.0 18.1 15.0 12.5 1 18.9 12.E 14.3 2.3
10.4 1 15.1 12.7 ~ 9.9 19.3 12.3
Percentage distribution of disabled adults, by age
22.29 c
60-64
r L
75 and 65-74 over
3.0
15.4 1.8 14.9 2.0 15.4 2.1 19.7 4.4 23.1 4.3
22.3 3.4 14.2 2.2 15 3 2.8 15.2 4.7 12.0 2.1
12.8 1.3 14.9 3.2 17.0 2.2 21.3 2.5 17.2 1.9
11.2 7.7
K ~ 24.0
2.1
2::: 5.5 4.3
20.3 ! -
Social Security Bulletin, May 1987IVol. 50, No. 5
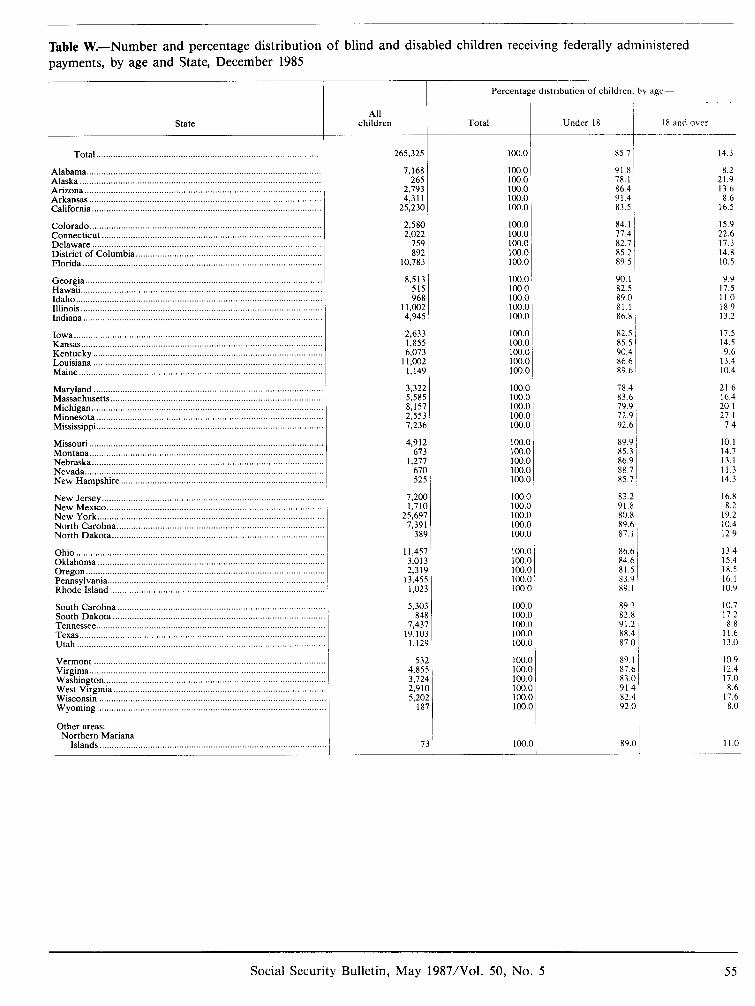
Percentage distribution of children, by age-
All children Total
I Under 18
I k 265,325 100.0 85.7
Table W.-Number and percentage distribution of blind and disabled children receiving federally administered payments, by age and State, December 1985
state
Total .............................................................................................
18 and over
Alabama ................................................................................................. Alaska .................................................................................................... Artzona .................................................................................................. Arkansas ................................................................................................ Califorma ...............................................................................................
7,168 91.8 ’ 265
loo.0 1 100.0 78.1
2,793 153.0 86.4 1 4,311 100.0 914~
25,230 100.0 83.5
14.3
Colorado ................................................................................................ Connecticut ........................................................................................... Delaware ............................................................................................... District of Columbia.. ........................................................................... Florida ...................................................................................................
8.2 21.9 13.6 8.6
16.5
Georgia .................................................................................................. Hawaii .................................................................................................... Idaho ...................................................................................................... Illinois .................................................................................................... Indiana ...................................................................................................
Iowa.. ..................................................................................................... Kansas.. .................................................................................................. Kentucky ............................................................................................... Louisiana .............................................................................................. Maine ....................................................................................................
2,580 1 loo.0 84.1 1 15.9 2,022 lW.0 77.4 22.6
759 100.0: 82.7 17 3 892 100.0 85.2 14.8
10,783 100.0 89.5 10.5
8,513 ’ loo.0 ! 90.1 515 100.0 82.5 i 968 100.0 89 0 1
11,002 100.0 81.1 4,945 100.0 86.8,
loo.0 X2.5 1 100.0 85.5 1 100.0 90.4 100.0 86.6 loo.0 89.6 ’
9.9 17.5 11.0 18.9 13.2
17.5 14.5 9.6
13.4 10.4
Maryland .............................................................................................. Massachusetts ...................................................................................... Michigan ............................................................................................... Minnesota ............................................................................................. Mississippi .............................................................................................
3,322 loo.0 78.4 I 5,585 100.0 83.6’ 8.157 100.0 79.9 2;553 100.0 72.9 7,236 loo.0 92.6 ~
Missouri ................................................................................................ Montana.. .............................................................................................. Nebraska ............................................................................................... Nevada .................................................................................................. New Hampshire ...................................................................................
4.912 ‘673
loo.0 I 89.9 / 100.0 85.3 ’
1,277 100.0 86.9 670 1cQ.o 88.7 525 103.0 j 85.7
21.6 16.4 20.1 27.1
7.4
10. I 14.7 13.1 11.3 14.3
New Jersey ........................................................................................... New Mexico ......................................................................................... New York ............................................................................................. North Carolina.. ................................................................................... North Dakota.. .....................................................................................
7,200 100.0 83.2 1.710 100.0 91.8
25;697 100.0 80.8 ~ 7,391 100.0 89.6
389 100.0 87.1
16.8 8.2
19.2 10.4 129
Ohio ...................................................................................................... Oklahoma ............................................................................................. Oregon.. ................................................................................................ Pennsylvania ......................................................................................... Rhode Island.. ......................................................................................
South Carolina ..................................................................................... South Dakota.. .................................................................................... Tennessee.. ........................................................................................... Texas.. .................................................................................................. Utah .....................................................................................................
11,457 100.0 i 3,013 100.0 2.319 loo.0 81.5
13:455 100.0 83.9 1,023 loo.0 89.1
5,303 100.0 89.3 ~ 848 100.0 82.8
7,437 100.0 91.2 i 19,103 100.0 88 4
1,129 100.0: 87 0
13.4 15.4 18.5 16.1 10.9
10.7 17.2 88
Il.6 13.0
Vermont .............................................................................................. Virginia.. .............................................................................................. Washington .......................................................................................... West Virginia.. .................................................................................... Wisconsin ............................................................................................ Wyoming.. ...........................................................................................
Other areas: Northern Mariana
Islands ............................................................................................
532 100.0 89.1 4.855 lCQ.0 87.6 3,724 loo.0 1 2,910 loo.0
83.0 ~ 91.4,
5.202 100.0 82.4 1 ‘187 100.0 92.0 i
10.9 12.4 17.0 8.6
17.6 8.0
73 100.0 ~ 89.0 1 11.0
Social Security Bulletin, May 1987/Vol. 50, No. 5 55
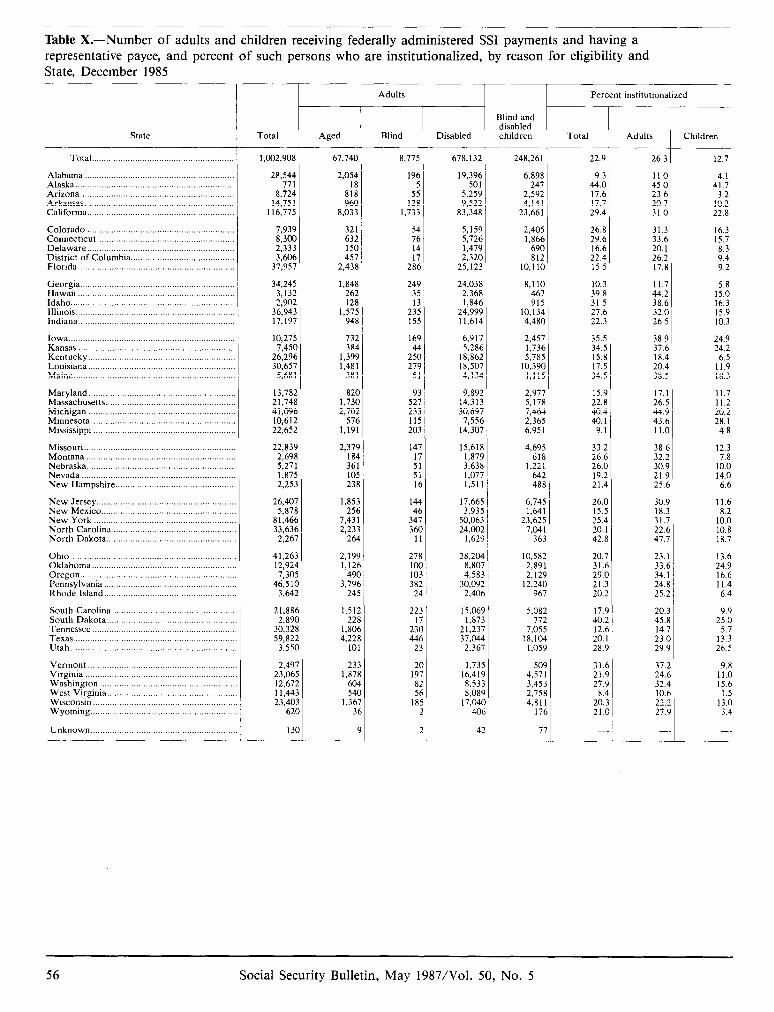
Table X.-Number of adults and children receiving federally administered SSI payments and having a representative payee, and percent of such persons who are institutionalized, by reason for eligibility and State, December 1985
state
Total
Alaska.. .......................................................... .... Arizona.. .............................................................. Arkansas.. ............................................................ California.. ...........................................................
Colorado ............................................................. Connecticut.. ....................................................... DelaWXe.. ........................................................... District of Columbia.. ......................................... FlorIda. ...............................................................
Georgia.. .............................................................. Hawail ................................................................. Idaho.. ................................................................ Illinois.. ............................................................... Indiana.. ...............................................................
Kansas ................................................................. Kentucky.. ........................................................... Louisiana.. ........................................................... Maine.. .................................................................
Maryland.. .......................................................... Massachusetts ...................................................... Michigan ............................................................ Minnesota.. .......................................................... Mississippi ...........................................................
Missouri ............................................................... Montana .............................................................. Nebraska.. ........................................................... Nevada ................................................................ New Hampshire.. .............................................
New Jersey.. ....................................................... New Mexico.. ..................................................... New York .......................................................... North Carolina.. ................................................ North Dakota .....................................................
Ohto ................................................................... Oklahoma ........................................................... Oregon.. ............................................................. Pennsylvania ...................................................... Rhode Island.. ....................................................
South Carolina.. ................................................. South Dakota.. ................... .............................. Tennessee ........................................................... Texas. ............ ................................................... Utah ....................................................................
Virginia ............................................................. Washington ........................................................ West Virgmia.. .................................................. Wisconsm .......... .............................................. Wyoming.. .........................................................
Unknown.. ..........................................................
rota1 Aged Blind Disabled
Blind and disabled children
1,002,908 67,740 8,775 678,132 248,261
28,544 2,054 196 19,396 6,898 771 18 5 501 247
8,724 818 55 5,259 2,592 14,751 960 128 9,522 4,141
116,775 8,033 1,733 83,348 23,661
7,939 321 54 5,159 2,405 8,3M) 632 76 5,726 1,866 2,333 150 14 I .479 690 3,606 457 17 2,320 812
37,957 2,438 286 25,123 10,llC
34,245 1,848 249 24,038 8,llC 3,132 262 35 2,368 467 2,902 128 13 1,846 915
36,943 1,575 235 24,999 10,134 17,197 948 155 11,614 4,48C
10,275 732 169 6,917 2,453 7,45c 384 44 5,286 1,73(
26,296 1,399 250 18,862 5,785 30,651 1,481 279 18.507 10,39C
5,681 381 51 4,134 l,ll!
13,781 820 93 9,892 2,97; 21,742 1,730 527 14,313 5,17I 41,09t 2,702 233 30,691 7,464 10,612 576 115 7,556 2,36f 22,652 1,191 203 14,307 6,95 1
22,835 2,379 147 15,611 4,691 2,698 184 17 1,87$ 61E 5,271 361 51 3,638 1,221 l,87f 105 51 1,077 64; 2,25: 238 16 I.511 481
26,40: 1,853 5,87t 256
8 1,46( 7,43 1 33,63t 2,233
2,26’ 264
144
3:; 36C
11
17,661 6,741 3,93f 1.64
50,06: 23,621 24.00; 7,04
1,625 36:
41,26: 2,199 278 28,201 10,58: 12,92~ 1,126 lo( 8,80 2,89 7,301 49c 10: 4,58: 2,121
46,51( 3,796 38; 30,09; 12,24( 3,64: 245 24 2,4Ot 96’
21.88( 1,512 22: 2,89( 228 1;
30,321 1,806 23( 59,82: 4,228 44
3,55( 101 2:
15,06’ 1,87:
2:: 2:36.
5.082 ~ 17,s 20.3 ’ 9.9 772 40.2 45.8 25.0
7,055 12.6 14.7 5.7 18,104 20. I 23.0 13.3
1,059 28.q 29.9 26.5
2,49’ 232 23,Ob. 1,87E 12,671 604 11,44 54c 23,40 1,36;
621 3f
2( 19: 8; 5f
18t
1.73: 509 31.6 16,41’ 4,571 21.5 8.53. 3,453 27.5 8,081 2,758 8.4
17,04( 4,811 20.: 401 176 21.C
131 4: 77
Adults
,
I
,
Percent institutionalized
Total
22.9 12.7
4-i.: 17.6 17.7 29.4
4.1 41.7
3.2 10.2 22.8
26.8 31.3 16.3 29.6 33.6 15.7 16.6 20. I 8.3 22.4 26.2 9.4 15.5 17 8 9.2
10.3 11.7 5.8 39.8 442 15.0 31.5 38.6 16.3 27.6 32.0 15.9 22.3 26.5 10.3
35.5 38.9 i 24.9 34.5 37.6 24.2 15.8 18.4 6.5 17.5 20.4 11.9 34.5 38.5 18.3
15.9 17.1 11.7 22.8 26.5 Il.2 40.4 44.9 20.2 40.1 43.6 28.1
9.1 11.0 4.8
33.2 38.6 12.3 26.6 32.2 7.8 26.0 30.9 10.0 19.2 21.9 14.0 21.4 25.6 6.6
26.0 30.9 11.6 15.5 18.3 8.2 25.4 31.7 10.0 20.1 22.6 10.8 42.8 47.7 18.7
20.7 31.6 29.C 21.3 20.2
23.1 33.6 34.1! 24.8 i 25.2 /
13.6 24.9 16.6 11.4 6.4
37.2 24.6 32.4 10.6 22.2 27.9
9.8 11.0 15.6
1.5 13.0 3.4
-.
56 Social Security Bulletin, May 1987/Vol. 50, No. 5
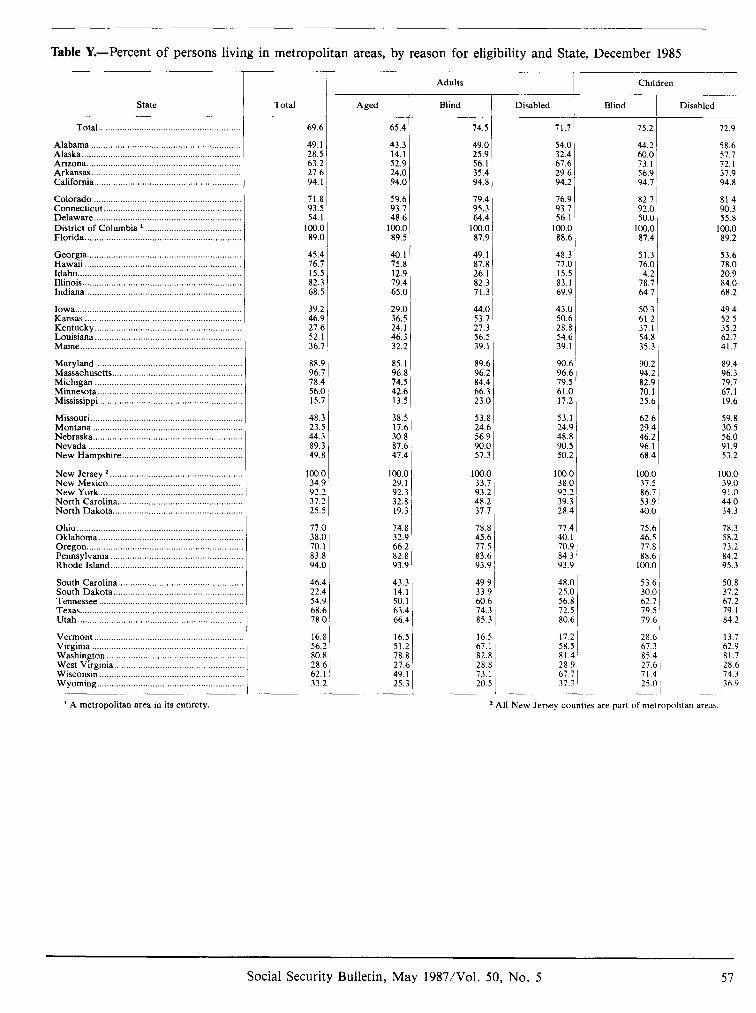
Table Y.-Percent of persons living in metropolitan areas, by reason for eligibility and State. December 1985
Adults
state Total Blind Disabled Blind
75.2
44.2 60.0 73.1 56.9
Disabled Aged
Total ...........................................................
Alabama .............................................................. Alaska. ................................................................. Arizona ................................................................ Arkansas.. ............................................................ California .............................................................
Colorado ............................................................. Connecticut ......................................................... Delaware.. ........................................................... District of Columbia ’ ........................................ Florida.. ...............................................................
Georgia ................................................................ Hawaii ................................................................. Idaho.. .................................................................. Illinois.. ................................................................ Indiana .................................................................
Iowa.. ................................................................... Kansas ................................................................. Kentucky ............................................................. Louisiana ............................................................. Maine.. .................................................................
Maryland ................ Massachusetts.. .................................................... Michigan ............................................................. Minnesota ............................................................ Mississippi ...........................................................
Missour’ I ............................................................... Montana .............................................................. Nebraska .............................................................. Nevada ................................................................ New Hampshire.. ................................................
New Jersey * ....................................................... New Mexico ........................................................ New York ........................................................... North Carolina.. .................................................. North Dakota.. ....................................................
Ohio.. ................................................................... Oklahoma ............................................................ Oregon ................................................................. Pennsylvania ....................................................... Rhode Island .......................................................
69.6
49.1 28.5 63.2 27.6 94. I
71.8 93.5 54.1
100.0 89.0
45.4 76.7 15.5 82.3 68.5
39.2 46.9 27.6 52.1 36.7
88.9 96.7 78.4 56.0 15.7
48.3 23.5 44.3 89.3 49.8
1cQ.c 34,s 92.; 37.2 25.5
77.c 38S 70.1 83.L 94.c
46.1 22.r 54.5 68.e 78.c
16.L 56.; 80.1 28.t 62. 33.:
65.4
43.3 49.0 25.9 56.1 35.4
54.0 32.4 67.6 29.6 94.2
76.9 93.7 56.1
103.0 88.6
48.3 77.0 15.5 83.1 69.9
72.9
94.7
58.6 57.7 72.1 37.9 94.8
82.7 92.0 50.0
loo.0 87.4
81.4 90.3 55.8
100.0 89.2
51.3 53.6 76.0 78.0
4.2 20.9 78.7 84.0 64.7 68.2
50.3 61.2 37.1 54.8 35.3
49.4 52.5 35.2 62.7 41.7
90.2 94.2 82.9 70.1 25.6
89.4 96.3 79.7 67. I 19.6
62.6 29.4 46.2 96. I 68.4
59.8 30.5 56.0 91.9 53.2
loo.0 37.5 86.7 53.9 40.0
100.0 39.0 91.0 44.0 34.3
75.6 46.5 77.8 88.6
loo.0
78.3 58.2 73.2 84.2 95.3
53.6 30.0 62.7 79.5 79.6
50.8 37.2 67.2 79.1 84.2
28.6, 67.3 ~ 85.4 27.6 ~ 714' 25.0 /
13.7 62.9 81.7 28.6 74.3 36 9
14.1 52.9 24.0 94.0 94.8
59.6 93.7 48.6
100.0 89.5
100.0 87.9
40.1 49.1 75.8 87.8 12.9 26.1 79.4 82.3 65.0 71.3
29.0 36.5 24.1 46.3 32.2
44.0 53.7 27.3 56.5 39.1
85.1 89.6 96.8 96.2 74.5 84.4 42.6 66.3 13.5 23.0
38.5 17.6 30.8 87.6
53.8 24.6 56.9 90.0 57.3
43.0 50.6 28.8 54.6 39.1
90.6 96.6 79.5 61.C 17.2
53.1 24.9 48.8 90.5 50.2
lcQ.( 38X
E 1 28.4
77.4 40. I 70.: 84.1 93.:
47.4
loo.0 1CHI.O 29. I 33.7 92.3 93.2 32.8 48.2 19.3 37.7
74.8 78.8 32.9 66.2 82.8
45.6 77.5 83.6
93.9 93.9
43.3 49.5 14.1 33.5 50.1 6o.t 63.4 74.: 66.4 85.:
16.5 16.f 51.2 67.1 78.8 82.E 27.6 28.t 49. I 73.1 25.3 20.2
South Carolina.. .................................................. South Dakota.. ....................................................
48.c 25S 56.1 72.1 80.t
17.: 58.1 81 1 28.' 67 37..
Tennessee ........................................................... Texas.. ................................................................. Utah.. ..................................................................
Virginia .............................................................. Washington ........................................................ West Virginia ..................................................... Wisconsin ........................................................... Wyoming.. ..........................................................
L
’ A metropolitan area in its entirety. 2 All New Jersey counties are part of metropohtan areas
Social Security Bulletin, May 1987IVol. 50, No. 5 57