profit optimization and value enhancement for the small to medium-size enterprise (“sme”)
TRANSCRIPT
Profit Optimization and
Value Enhancement
For the Small to Medium-Size Enterprise (“SME”)

Financial Management
Manage
Margins Cash Flow

Communication & Coordination
Accountants are from Mars
Are backward looking Are recording, organizing &
reporting what happened in the past
Have knowledge of what has happened
Can produce tremendous amounts of data
Can produce any type of report you want, but do not know what you need
Entrepreneurs are from Venus
Are forward looking Envisioning, planning & creating Have knowledge of what is
planned. Needs information for decision
making, not data Does not know what is available
therefore does not know what to request

Business Templates & Tools for SMEs
SME Business Owners and Officers need to analyze their businesses regularly using financial analysis tools that can give them insight into their firms just like Major Corporations.
Such as: Trends in Key Financial Measures Optimal Profit Available to the Firm Asset Financing “Z” Score Underwriting Risk Assessment Ratio Analysis Introduction Breakeven Concepts Trade-off of Cutting Costs vs.. Increasing Sales
Data Information Good Decision Making Success

CLIENT: CAPITALIST VENTURE, INC. Balance Sheet
PERIOD 2002 2001 2000
Cash 63,967 70,399 91,722 Receivables - Trade 89,665 47,513 - Receivables - OtherPrepaid InsuranceInventories 31,000 31,000 Other Current Assets 108,095 30,072 28,208
TOTAL CURRENT ASSETS 292,727 178,984 119,930
Net Fixed Assets 326,244 285,802 210,798 Deposits - Deferred ChargesOther Assets 8,966 8,966 8,966 TOTAL ASSETS 627,937 473,752 339,694
PERIOD 2002 2001 2000
Payables - Trade 15,486 19,264 - Other Current Liabilities 216,112 161,266 66,301 Loans from Shareholders - - 10,333 TOTAL CURRENT LIABILITIES 231,598 180,530 76,634
Long Term Debt - 22,972 TOTAL LIABILITIES 231,598 180,530 99,606
Common Stock 1,000 1,000 1,000 Retained Earnings 395,339 292,222 239,088 TOTAL LIABILITIES & EQUITY 627,937 473,752 339,694
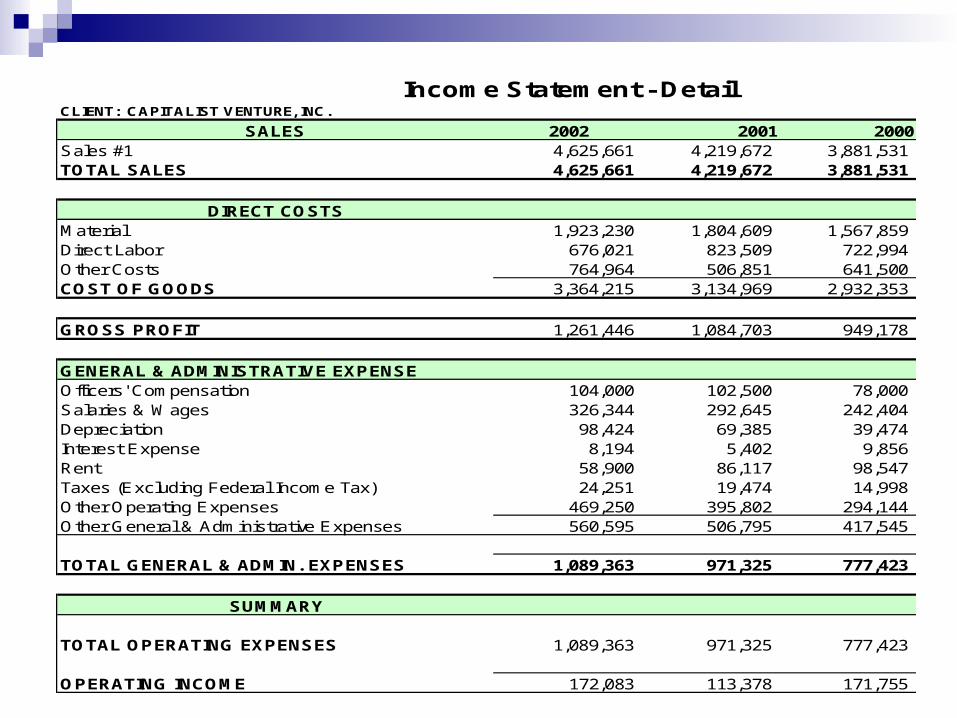
Income Statement - DetailCLIENT: CAPITALIST VENTURE, INC.
SALES 2002 2001 2000Sales #1 4,625,661 4,219,672 3,881,531TOTAL SALES 4,625,661 4,219,672 3,881,531
DIRECT COSTSMaterial 1,923,230 1,804,609 1,567,859Direct Labor 676,021 823,509 722,994Other Costs 764,964 506,851 641,500COST OF GOODS 3,364,215 3,134,969 2,932,353
GROSS PROFIT 1,261,446 1,084,703 949,178
GENERAL & ADMINISTRATIVE EXPENSEOfficers' Compensation 104,000 102,500 78,000Salaries & Wages 326,344 292,645 242,404Depreciation 98,424 69,385 39,474Interest Expense 8,194 5,402 9,856Rent 58,900 86,117 98,547Taxes (Excluding Federal Income Tax) 24,251 19,474 14,998Other Operating Expenses 469,250 395,802 294,144Other General & Administrative Expenses 560,595 506,795 417,545
TOTAL GENERAL & ADMIN. EXPENSES 1,089,363 971,325 777,423
SUMMARY
TOTAL OPERATING EXPENSES 1,089,363 971,325 777,423
OPERATING INCOME 172,083 113,378 171,755

Sales vs Gross Profit
$3,881,531
$4,219,672
$1,084,703
$4,625,661
$1,261,446
$949,178
$-
$500,000
$1,000,000
$1,500,000
$2,000,000
$2,500,000
$3,000,000
$3,500,000
$4,000,000
$4,500,000
$5,000,000
2000 2001 2002
Sales
Gross Profit

Net Sales vs Total Operating Expense
$3,881,531
$4,219,672
$4,625,661
$777,423$971,325
$1,089,363
$0
$500,000
$1,000,000
$1,500,000
$2,000,000
$2,500,000
$3,000,000
$3,500,000
$4,000,000
$4,500,000
$5,000,000
2000 2001 2002
Net Sales
Total Operating Ex

Sales vs Net Profit (NOI)
$3,881,531
$4,219,672
$113,378 $172,083
$4,625,661
$171,755
$-
$500,000
$1,000,000
$1,500,000
$2,000,000
$2,500,000
$3,000,000
$3,500,000
$4,000,000
$4,500,000
$5,000,000
2000 2001 2002
Sales
Net Profit

Net Worth
$240,088
$293,222
$396,339
$0
$50,000
$100,000
$150,000
$200,000
$250,000
$300,000
$350,000
$400,000
$450,000
2000 2001 2002
Net Worth

Working Capital
$(1,546)
$43,296
$61,129
$(10,000)
$-
$10,000
$20,000
$30,000
$40,000
$50,000
$60,000
$70,000
2000 2001 2002
Working Capital

Optimal Profitability Using Historical Income Statement Data for the
Most Recent 3 or 4 Years You Can Create an Optimal Income Statement Utilizing the Minimum Cost Line Item Expense-to-Sales Percentage Experienced by Your Company
The End Result is a Dramatic Difference in Current Year Profits vs. Optimal Profit Potential
As can be seen in the following real world example, the Company was recording a Pretax Profit of $172,083 when they could have been earning a Pretax of over $493,986 if they had achieved their “Optimal Performance”.
This equates to Profit Improvement of almost $322,000!

Income Statement - Summary CLIENT: CAPITALIST VENTURE, INC.
PERIOD 2002 2001 2000 OPTIMALSALES DOLLAR % DOLLAR % DOLLAR % DOLLAR %
Total Sales 4,625,661 100.0% 4,219,672 100.0% 3,881,531 100.0% 4,625,661 100.0%DIRECT COSTS
Material 1,923,230 41.6% 1,804,609 42.8% 1,567,859 40.4% 1,868,434 40.4%Direct Labor 676,021 14.6% 823,509 19.5% 722,994 18.6% 676,021 14.6%Other Direct & Subcontractor 764,964 16.5% 506,851 12.0% 641,500 16.5% 555,617 12.0%COST OF GOODS 3,364,215 72.7% 3,134,969 74.3% 2,932,353 75.5% 3,100,072 67.0%GROSS MARGIN 1,261,446 27.3% 1,084,703 25.7% 949,178 24.5% 1,525,589 33.0%
GENERAL & ADMIN EXPOfficer's Compensation 104,000 2.2% 102,500 2.4% 78,000 2.0% 104,000 2.2%Depreciation 98,424 2.1% 69,385 1.5% 39,474 1.0% 98,424 2.1%Interest Expense 8,194 0.2% 5,402 0.1% 9,856 0.3% 8,194 0.2%Rent 58,900 1.3% 86,117 1.9% 98,547 2.5% 58,900 1.3%Taxes (Exclude Federal Income) 24,251 0.5% 19,474 0.4% 14,998 0.4% 24,251 0.5%Salaries & Wages 326,344 7.1% 292,645 6.9% 242,404 6.2% 288,875 6.2%Other General & Admin Expense 469,250 10.1% 395,802 9.4% 294,144 7.6% 350,534 7.6%TOTAL GEN'L & ADMIN EXP 1,089,363 23.6% 971,325 23.0% 777,423 20.0% 1,031,603 22.3%
OPERATING INCOME 172,083 3.7% 113,378 2.7% 171,755 4.4% 493,986 10.7%

Optimal Profit Improvement
263,299292,601
321,903351,206
380,508
131,649 146,301 160,952 175,603 190,254
-100,000
0
100,000
200,000
300,000
400,000
500,000
600,000
700,000
800,000
80% 90% 100% 110% 120%
Percent of Normal
Do
llars
($)
Current ProfitOptimal ProfitOptimal Improve.50% Optimal Improve.

Asset Misfinancing
Many Firms erroneously use Short-Term Capital to finance Long-Term Assets. This is a big mistake.
The Results can be felt throughout the Firm.
Working Capital and Profitability are adversely affected when this is allowed to happen.

Asset Financing
$210,798
$285,802
$22,972
$326,244
$231,598
$76,634
$180,530
$-
$50,000
$100,000
$150,000
$200,000
$250,000
$300,000
$350,000
2000 2001 2002
Net Fixed Assets
Current Liabilities
Long TermLiabilities

Key Financial Ratios
Few Companies regularly pay attention to their financial ratios other than current ratio and net profit ratio.
A historical look at 14 Solvency, Safety, Profitability, Asset Management and Turnover Ratios can give you insight if you graph their trends.
Are these ratios moving in the right directions?...
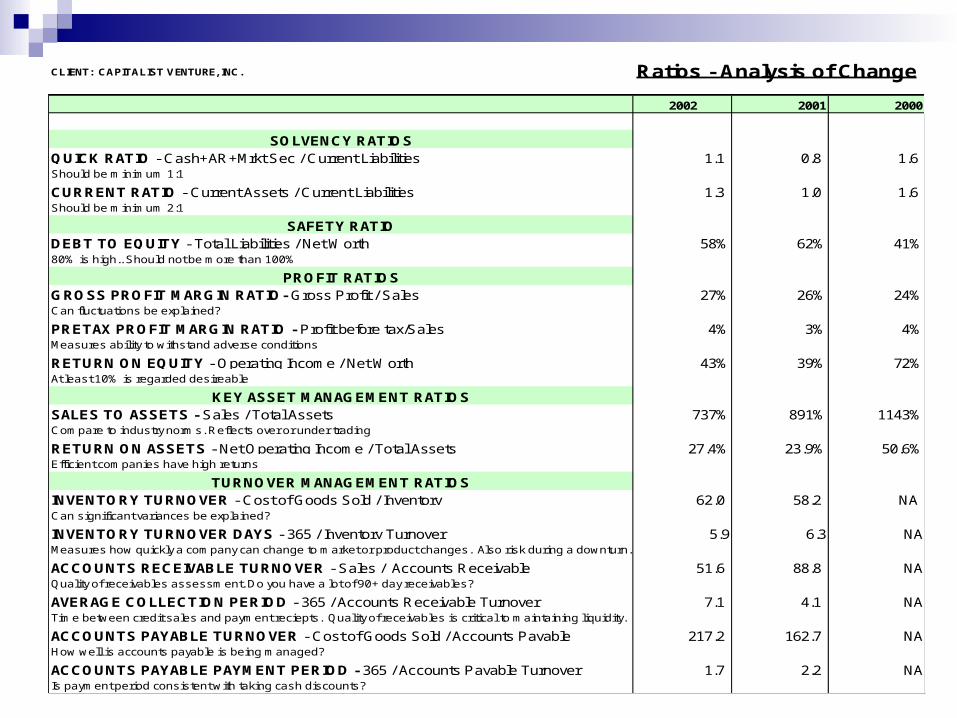
CLIENT: CAPITALIST VENTURE, INC. Ratios - Analysis of Change
2002 2001 2000
SOLVENCY RATIOSQUICK RATIO - Cash+AR+Mrkt Sec / Current Liabilities 1.1 0.8 1.6Should be minimum 1:1
CURRENT RATIO - Current Assets / Current Liabilities 1.3 1.0 1.6 Should be minimum 2:1
SAFETY RATIODEBT TO EQUITY - Total Liabilities / Net Worth 58% 62% 41%80% is high.. Should not be more than 100%
PROFIT RATIOSGROSS PROFIT MARGIN RATIO- Gross Profit / Sales 27% 26% 24%Can fluctuations be explained?
PRETAX PROFIT MARGIN RATIO - Profit before tax/Sales 4% 3% 4%Measures ability to withstand adverse conditions
RETURN ON EQUITY - Operating Income / Net Worth 43% 39% 72%At least 10% is regarded desireable
KEY ASSET MANAGEMENT RATIOSSALES TO ASSETS - Sales / Total Assets 737% 891% 1143%Compare to industry norms. Reflects over or under trading
RETURN ON ASSETS - Net Operating Income / Total Assets 27.4% 23.9% 50.6%Efficient companies have high returns
TURNOVER MANAGEMENT RATIOSINVENTORY TURNOVER - Cost of Goods Sold / Inventory 62.0 58.2 NACan significant variances be explained?
INVENTORY TURNOVER DAYS - 365 / Inventory Turnover 5.9 6.3 NAMeasures how quickly a company can change to market or product changes. Also risk during a downturn.
ACCOUNTS RECEIVABLE TURNOVER - Sales / Accounts Receivable 51.6 88.8 NAQuality of receivables assessment. Do you have a lot of 90+ day receivables?
AVERAGE COLLECTION PERIOD - 365 / Accounts Receivable Turnover 7.1 4.1 NATime between credit sales and payment reciepts. Quality of receivables is critical to maintaining liquidity.
ACCOUNTS PAYABLE TURNOVER - Cost of Goods Sold / Accounts Payable 217.2 162.7 NAHow well is accounts payable is being managed?
ACCOUNTS PAYABLE PAYMENT PERIOD - 365 / Accounts Payable Turnover 1.7 2.2 NAIs payment period consistent with taking cash discounts?
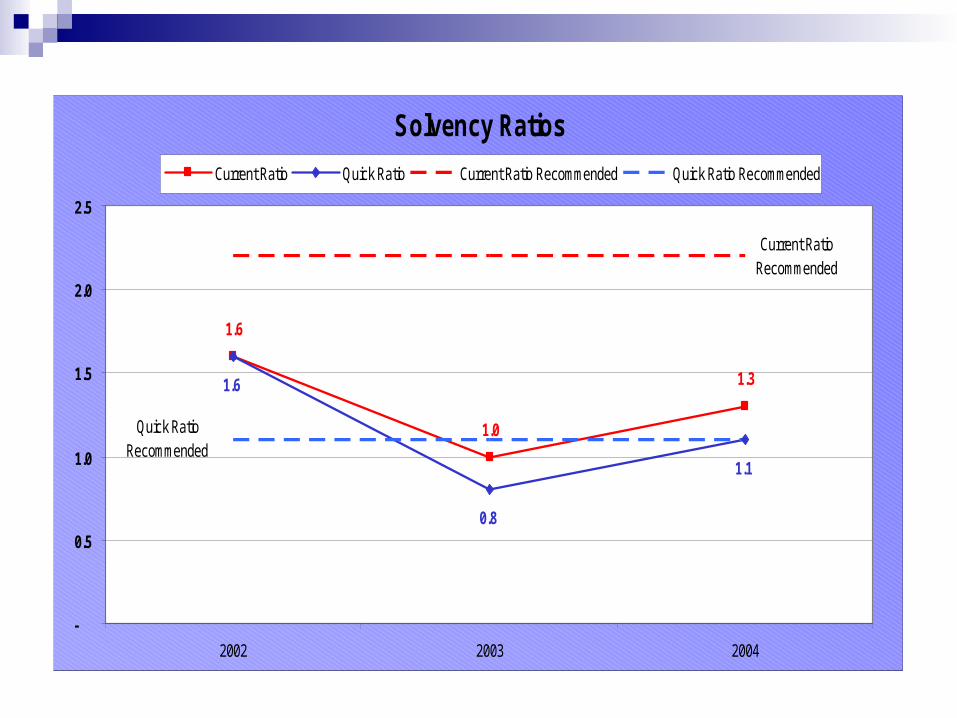
Solvency Ratios
1.6
1.0
1.31.6
0.8
1.1
Current Ratio Recommended
Quick Ratio Recommended
-
0.5
1.0
1.5
2.0
2.5
2002 2003 2004
Current Ratio Quick Ratio Current Ratio Recommended Quick Ratio Recommended

Z Score Financial Risk Assessment
Z Score Ratings are frequently used in the Banking Community to Assess Risks of Underwriting Loans or other financial instruments.
The 5 Ratios used in this analysis have been shown to be successful bankruptcy predictors.
Edward I. Altman, Professor at New York University.

Business Failure Potential Analysis - "Z" Score Rating CLIENT: CAPITALIST VENTURE, INC.
PERIOD 2002 2001 2000
1 Current Assets 292,727$ 178,984$ 119,930$
2 Current Liabilities 231,598$ 180,530$ 76,634$
3 Working Capital 61,129$ (1,546)$ 43,296$
4 Total Assets 627,937$ 473,752$ 339,694$
5 Total Liabilities 231,598$ 180,530$ 99,606$
6 Common Stock 1,000$ 1,000$ 1,000$
7 Preferred Stock -$ -$ -$
8 Treasury Stock -$ -$ -$
9 Value of Stock 1,000$ 1,000$ 1,000$
10 Retained Earnings 395,339$ 292,222$ 239,088$
11 Sales (annual) 4,625,661$ 4,219,672$ 3,881,531$
12 Operating Income 172,083$ 113,378$ 171,755$
Business Failure Potential Analysis - "Z" Score Calculations Below13 WC (3) / Assets (4) 0.097 -0.003 0.127
14 Importance Factor 1.2 1.2 1.2
15 Net (13x14) 0.12 0.00 0.15
16 RE (10) / Assets (4) 0.630 0.617 0.704
17 Importance Factor 1.4 1.4 1.4
18 Net (16x17) 0.88 0.86 0.99
19 Income (12) / Assets (4) 0.274 0.239 0.506
20 Importance Factor 3.3 3.3 3.3
21 Net (19x20) 0.90 0.79 1.67
22 Stock (9) /Liabilities (5) 0.00 0.01 0.01
23 Importance Factor 0.6 0.6 0.6
24 Net (22x23) 0.00 0.00 0.01
25 Sales (11) / Assets (4) 7.366 8.907 11.427
26 Importance Factor 1.0 1.0 1.0
27 Net (25x26) 7.37 8.91 11.43
Z" Score - Failure Potential 9.27 10.56 14.24
Most Recent 'Z' Score of: 9.27 Shows Business Failure Potential to be Low* Legend: Failure Potential Ranges: 1.8 or Less - Extremely High; 1.81 to 2.8 - Very High; 2.81 to 2.99 Possible; 3.0 or More - Low

Bankruptcy Risk
Risk Factor, 14.2
Risk Factor, 10.6
Risk Factor, 9.3
Extremely High Risk, 1.8
Possible, 3
0.0
2.0
4.0
6.0
8.0
10.0
12.0
14.0
16.0
2002 2003 2004
Key: <1.8 Extremely High Risk; 1.8 to 2.8 Very High Risk; 2.81 to 2.99 Possible; >3.0 Low Risk

Break Even Point Analysis
Many SME Firms have a limited Customer Base where a Single Client may account for 20% or more of the entire revenues of the Firm.
If the SME Firm should lose this Critical Customer, can the Firm still Break-Even, or does it know what cuts must be made to reclaim Breakeven?
Most Firms don’t know the answer to this question.

CLIENT: CAPITALIST VENTURE, INC. BREAKEVEN ANALYSIS
SALES CURRENT % OPTIMAL %1. NET SALES 4,625,661 100.0% 4,625,661 100.0%2. OPERATING PROFIT 172,083 3.7% 493,986 10.7%3. TOTAL OPERATING EXPENSES 4,453,578 96.3% 4,131,675 89.3%
FIXED EXPENSES CURRENT % OPTIMAL %4. DEPRECIATION 98,424 2.1% 98,424 2.1%5. INTEREST 8,194 0.2% 8,194 0.2%6. RENT 58,900 1.3% 58,900 1.3%7. OFFICER'S COMPENSATION 104,000 2.2% 104,000 2.2%8. TAXES (EXCLUDE FED INCOME) 24,251 0.5% 24,251 0.5%9. ALL OTHER FIXED EXPENSES - 0.0% - 0.0%10. TOTAL FIXED EXPENSES 293,769 6.4% 293,769 6.4%
VARIABLE EXPENSES CURRENT % OPTIMAL %11. DIRECT MATERIAL 1,923,230 41.6% 1,868,434 40.4%12. DIRECT LABOR 676,021 14.6% 676,021 14.6%13. SUBS & OTHER VARIABLE EXPENSES 764,964 16.5% 555,617 12.0%14. TOTAL VARIABLE EXPENSES 3,364,215 72.7% 3,100,072 67.0%
SEMI-VARIABLE EXPENSES CURRENT % OPTIMAL %15. SEMI-VARIABLE EXPENSES 795,594 17.2% 737,834 16.0%
SUMMARY CURRENT % OPTIMAL %16. FIXED EXPENSES 293,769 6.4% 293,769 6.4%17. 50% OF SEMI-VARIABLE EXPENSES 397,797 8.6% 368,917 8.0%18. TOTAL FIXED EXPENSES (16+17) 691,566 15.0% 662,686 14.3%19. TOTAL FIXED EXPENSES+PROFIT (18+2) 863,649 18.7% 1,156,672 25.0%20. BREAKEVEN % (18 / 19) 80.1% 57.3%21. BREAKEVEN VOLUME (1 X 20) 3,703,993 80.1% 2,650,155 57.3%22. MONTHLY BREAKEVEN VOLUME 308,666 220,846

Turnaround
Strategy and Plan

Optimal Income Statement Summary CLIENT: Texas Gulf Coast Medical GroupThe Medical Center
PERIOD 2003 2002 2001 2000 OPTIMAL
SALES DOLLAR % DOLLAR % DOLLAR % DOLLAR % DOLLAR %
TOTAL SALES 17,337,529 100.0% 13,576,065 100.0% 9,583,238 100.0% 11,071,120 100.0% 17,337,529 100.0%
DIRECT COSTS
Salaries & Wages Other Than Partners 7,669,594 44.2% 5,143,587 37.9% 3,581,070 37.4% 3,927,957 35.5% 6,151,236 35.5%
Guaranteed Payments to Partners 3,836,580 22.1% 3,550,887 26.2% 2,602,218 27.2% 2,247,154 20.3% 3,519,075 20.3%
COST OF SERVICES 11,506,174 66.4% 8,694,474 64.0% 6,183,288 64.5% 6,175,111 55.8% 9,670,310 55.8%
GROSS MARGIN 5,831,355 33.6% 4,881,591 36.0% 3,399,950 35.5% 4,896,009 44.2% 7,667,219 44.2%
SALES, GENERAL & ADMIN EXP
Interest Expense 181,560 1.0% 144,717 1.1% 43,029 0.3% 104,104 0.9% 181,560 1.0%
Rent 1,044,191 6.0% 756,340 5.6% 646,364 4.8% 1,338,914 12.1% 1,044,191 6.0%
Other Operating Costs (2003 Dep Est @ $400k) 5,258,858 30.3% 5,002,823 36.9% 2,882,944 30.1% 3,492,741 31.5% 5,215,682 30.1%
TOTAL S, G & A EXPENSES 6,484,609 37.4% 5,903,880 43.5% 3,572,337 37.3% 4,935,759 44.6% 6,441,433 37.2%
SUMMARY
TOTAL OPERATING EXPENSES 6,484,609 37.4% 5,903,880 43.5% 3,572,337 37.3% 4,935,759 44.6% 6,441,433 37.2%
EARNINGS BEFORE TAX (653,254) -3.8% (1,022,289) -7.5% (172,387) -1.8% (39,750) -0.4% 1,225,786 7.1%

Sales vs Gross Profit
$11,071,120
$9,583,238
$17,337,529
$3,399,950
5,831,355
$13,576,065
$4,881,591$4,896,009
$-
$2,000,000
$4,000,000
$6,000,000
$8,000,000
$10,000,000
$12,000,000
$14,000,000
$16,000,000
$18,000,000
$20,000,000
2000 2001 2002 2003
Sales
Gross Profit

Gross Profit vs Salaries & Wages vs Guaranteed Payments to Partners as % of Sales
33.6%36.0%35.5%
44.2% 44.2%35.5%
37.9%37.4%
22.1%
26.2%27.2%
20.3%
0%
10%
20%
30%
40%
50%
2000 2001 2002 2003
Year
% o
f Sal
esGP %
Salaries & Wages Other Than P artners
Guaranteed P ayments to P artners

Net Sales vs Total Operating Expense
$11,071,120
$9,583,238
$13,576,065
$17,337,529
$4,935,759
$3,572,337
$6,484,609$5,903,880
$0
$2,000,000
$4,000,000
$6,000,000
$8,000,000
$10,000,000
$12,000,000
$14,000,000
$16,000,000
$18,000,000
$20,000,000
2000 2001 2002 2003
Net Sales
Total Operating Ex

Sales vs Earnings Before Tax ("EBT")
$11,071,120
$9,583,238
$(172,387)$(1,022,289) (653,254)
$13,576,065
$17,337,529
$(39,750)
$(5,000,000)
$-
$5,000,000
$10,000,000
$15,000,000
$20,000,000
2000 2001 2002 2003
Sales EBT
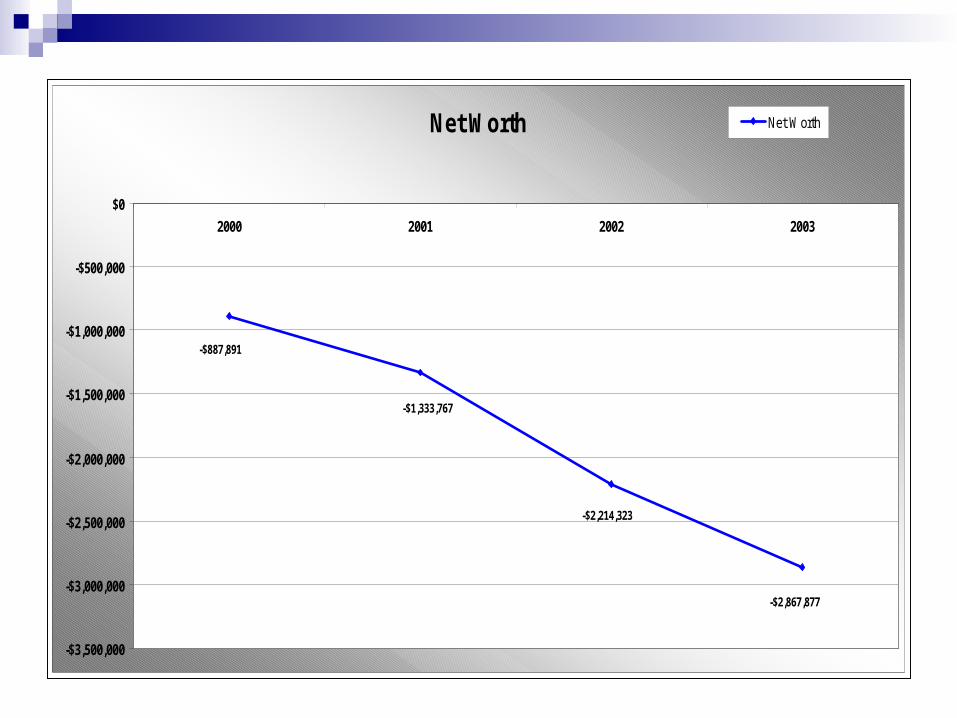
Net Worth
-$887,891
-$1,333,767
-$2,214,323
-$2,867,877
-$3,500,000
-$3,000,000
-$2,500,000
-$2,000,000
-$1,500,000
-$1,000,000
-$500,000
$0
2000 2001 2002 2003
Net Worth

Weekly Cash Management
Details
7-May 14-MayPlan Actual Plan Actual
Beginning Cash (307,583) (307,583) (139,989) (139,989) Collections 300,000 295,032 300,000 0 Loan Proceeds 0 0 100,000Total Cash Inflow 300,000 295,032 400,000 0
Cash Available (7,583) (12,551) 260,011 (139,989)
Planned Current Expenditures Salaries & Wages 0 2,500 213,000 0 Past Due Payables 45,240 26,249 2,000 0 Note Payments 193,995 98,689 58,176 0Total Cash Outflow 239,235 127,438 273,176 0
Ending Cash (246,818) (139,989) (13,165) (139,989)

2003 Seasonal Sales Chart for The Medical Center
7.8% 7.9%
9.5%
9.0%
8.4%
9.0%
8.0%
7.4%
7.9%7.8%
8.6%8.6%
6.0%
6.5%
7.0%
7.5%
8.0%
8.5%
9.0%
9.5%
10.0%
JAN FEB MAR APR MAY JUN JUL AUG SEP OCT NOV DEC
Months
Pe
rce
nt

The Medical Center
Budget by Line Item
Annualized 2004 % of TotalResults Adjustments Budget Revenues
Revenue Professional Revenue 15,493,503 (1,365,204) 14,128,299 89.37% Refunds (66,297) (66,297) -0.42% Ancillary Income 1,814,726 (154,252) 1,660,474 10.50% Other Income 94,614 (8,042) 86,572 0.55%Total Revenues 17,336,546 (1,527,498) 15,809,048 100.00%
Cost of Labor Non-Physicians 6,331,377 (1,623,834) 4,707,543 29.78% Mid-Level Providers 444,036 (444,036) 0 0.00% Salaried Physicians 954,191 (88,971) 865,220 5.48%Subtotal Cost of Labor 7,729,604 (2,156,841) 5,572,763 0.00%
Other Labor Burden Expenses 222,528 (22,081) 200,447 1.27%
Total Cost of Sales 7,952,132 (2,178,922) 5,773,210 36.52%
Gross Profit 9,384,415 651,424 10,035,839 63.48%
General & Administrative (In Total) 5,946,508 (919,275) 5,027,233 0.00%
EBITDA 3,437,907 1,570,699 5,008,606 0.00%
Interest 181,560 0 181,560 1.15%
Guaranty Payments 3,836,582 (636,580) 3,200,002 20.24%
Net Income (580,234) 2,207,279 1,627,045 0.00%

Profit Optimization and
Value Enhancement
For the Small to Medium-Size Enterprise (“SME”)