profiles of 1
TRANSCRIPT


Founded in 1893, the American Society for Engineering Education (ASEE) is a global society of individual, institutional, and
corporate members. ASEE’s vision is excellent and broadly accessible education empowering students and engineering pro-
fessionals to create a better world. We work toward achieving that vision by advancing innovation, excellence, and access
at all levels of education for the engineering profession. We engage with engineering faculty, business leaders, college and
high school students, parents, and teachers to enhance the engineering workforce of the nation. We are the only profes-
sional society addressing opportunities and challenges spanning all engineering disciplines, working across the breadth of
academic education including teaching, research, and public service.
• We support education at the institutional level by linking faculty and staff across disciplines to create enhanced
student learning and discovery.
• We support education across institutions by identifying opportunities to share proven and promising practices.
• We support education locally, regionally, and nationally by forging and reinforcing connections between academia,
business, industry, and government.
• We support discovery and scholarship among education researchers by providing opportunities to share and build
upon findings.
• We support innovation by fostering the translation of research into improved practices.
• We support disciplinary technical researchers by disseminating best research management practices.
www.asee.org
Profiles of Engineering and Engineering Technology, 2020
©2021 by the American Society for Engineering Education. All rights reserved.
American Society for Engineering Education
1818 N Street NW, Suite 600
Washington, DC 20036
This report is available for download at www.asee.org.
Suggested Citation[only for reference] American Society for Engineering Education. (2021). Profiles of Engineering and Engineering Technology. Washington, DC.
ISBN # 978-0-578-99268-6
ASEE Profiles Survey TeamJoseph Roy, Ph.D. Director, Institutional Research & AnalyticsAngela Erdiaw-Kwasie, Sr. Data AnalystCharles Stuppard, Data Analyst IITimothy King, Data Collections Support Specialist

The future of innovation and entrepreneurshipIntroducing the Kummer Institute for Student Success, Research and Economic Development at Missouri S&T
Established through a transformational gift of $300 million from June and Fred Kummer in 2020, the Institute cultivates innovation, nurtures entrepreneurial mindsets, builds academic and industry partnerships, and grows the economy.
Learn more at kummerinstitute.mst.edu.

Engineering & Engineering Technology by the Numbers 2020
Contents1 ENGINEERING BACHELORS 3
1.1 ENGINEERING Bachelors DEGREES . . . . . . . . . . . . . . . . . . . . . . . . . . . . . . . . . . . . . . . . . . . . . . . . 31.1.1 Total Bachelors Degrees Awarded by Engineering Discipline . . . . . . . . . . . . . . . . . . . . . . . . . . . . . . . . 31.1.2 Total Bachelors Degrees Awarded to Underrepresented Minorities by Engineering Discipline . . . . . . . . . . . . . . . . 41.1.3 Percentage of Bachelors Degrees Awarded to Underrepresented Minorities by Discipline . . . . . . . . . . . . . . . . . . 41.1.4 Percentage of Bachelors Degrees Awarded to Women by Discipline . . . . . . . . . . . . . . . . . . . . . . . . . . . . 41.1.5 Institutions Awarding the Highest Number of Engineering Bachelor’s Degrees . . . . . . . . . . . . . . . . . . . . . . . . 51.1.6 Bachelors Degrees Awarded by Gender . . . . . . . . . . . . . . . . . . . . . . . . . . . . . . . . . . . . . . . . . . 61.1.7 Bachelors Degrees Awarded by Race and Ethnicity . . . . . . . . . . . . . . . . . . . . . . . . . . . . . . . . . . . . . 61.1.8 Bachelors Degrees Awarded by Residency . . . . . . . . . . . . . . . . . . . . . . . . . . . . . . . . . . . . . . . . . 71.1.9 Bachelors Degrees Awarded by Race, Ethnicity and Gender . . . . . . . . . . . . . . . . . . . . . . . . . . . . . . . . 81.1.10 Top 50 Institutions by Total Bachelors Degrees awarded to Underrepresented Minorities . . . . . . . . . . . . . . . . . . 81.1.11 Top 50 Institutions by Total Bachelors Degrees awarded to Women . . . . . . . . . . . . . . . . . . . . . . . . . . . . . 91.1.12 Top 50 Institutions by Percentage of Bachelors Degrees awarded to Underrepresented Minorities . . . . . . . . . . . . . . 101.1.13 Top 20 Institutions by Percentage of Bachelors Degrees awarded to Women . . . . . . . . . . . . . . . . . . . . . . . . 111.1.14 Top 20 Institutions by Total Bachelors Degrees awarded to African Americans . . . . . . . . . . . . . . . . . . . . . . . . 111.1.15 Top 20 Institutions by Total Bachelors Degrees awarded to Asian Americans . . . . . . . . . . . . . . . . . . . . . . . . 111.1.16 Top 20 Institutions by Total Bachelors Degrees awarded to Hispanics . . . . . . . . . . . . . . . . . . . . . . . . . . . . 121.1.17 Top 20 Institutions by Total Bachelors Degrees awarded in Aerospace Engineering . . . . . . . . . . . . . . . . . . . . . 121.1.18 Top 20 Institutions by Total Bachelors Degrees awarded in Biomedical Engineering . . . . . . . . . . . . . . . . . . . . . 121.1.19 Top 50 Institutions by Total Bachelors Degrees awarded in Chemical Engineering . . . . . . . . . . . . . . . . . . . . . . 131.1.20 Top 50 Institutions by Total Bachelors Degrees awarded in Civil Engineering . . . . . . . . . . . . . . . . . . . . . . . . 131.1.21 Top 50 Institutions by Total Bachelors Degrees awarded in Industrial/Manufacturing Engineering . . . . . . . . . . . . . . 141.1.22 Top 50 Institutions by Total Bachelors Degrees awarded in Mechanical Engineering . . . . . . . . . . . . . . . . . . . . . 151.1.23 Top 50 Institutions by Total Bachelors Degrees awarded in Electrical Engineering . . . . . . . . . . . . . . . . . . . . . . 161.1.24 Top 50 Institutions by Total Bachelors Degrees awarded in Computer Engineering . . . . . . . . . . . . . . . . . . . . . 161.1.25 Top 20 Institutions by Total Bachelors Degrees awarded in Electrical/Computer Engineering . . . . . . . . . . . . . . . . . 171.1.26 Top 20 Institutions by Total Bachelors Degrees awarded in Computer Science (outside engineering) . . . . . . . . . . . . 181.1.27 Top 50 Institutions by Total Bachelors Degrees awarded in Computer Science (inside engineering) . . . . . . . . . . . . . 181.1.28 Top 50 Institutions by Total Bachelors Degrees awarded in Engineering (General) . . . . . . . . . . . . . . . . . . . . . . 19
1.2 ENGINEERING UNDERGRADUATE ENROLLMENT, FALL 2020 . . . . . . . . . . . . . . . . . . . . . . . . . . . . . . . . . . . 201.2.1 Undergraduate Enrollment by Race, Ethnicity, and Gender . . . . . . . . . . . . . . . . . . . . . . . . . . . . . . . . . 201.2.2 Engineering Undergraduate Enrollment by Institutions . . . . . . . . . . . . . . . . . . . . . . . . . . . . . . . . . . . 201.2.3 Undergraduate Enrollment by Engineering Discipline . . . . . . . . . . . . . . . . . . . . . . . . . . . . . . . . . . . . 211.2.4 Undergraduate Enrollment by Engineering Discipline:(Full time and Part time) . . . . . . . . . . . . . . . . . . . . . . . . 221.2.5 Undergraduate Enrollment by Gender . . . . . . . . . . . . . . . . . . . . . . . . . . . . . . . . . . . . . . . . . . . 221.2.6 Undergraduate Enrollment by Race and Ethnicity . . . . . . . . . . . . . . . . . . . . . . . . . . . . . . . . . . . . . . 231.2.7 Undergraduate Enrollment by Residency . . . . . . . . . . . . . . . . . . . . . . . . . . . . . . . . . . . . . . . . . . 23
2 ENGINEERING MASTERS 252.1 ENGINEERING MASTERS DEGREE . . . . . . . . . . . . . . . . . . . . . . . . . . . . . . . . . . . . . . . . . . . . . . . . 25
2.1.1 Masters Degrees Awarded by Engineering Discipline . . . . . . . . . . . . . . . . . . . . . . . . . . . . . . . . . . . . 252.1.2 Total Masters Degrees Awarded to Underrepresented Minorities by Engineering Discipline . . . . . . . . . . . . . . . . . 262.1.3 Percentage of Masters Degrees Awarded to Underrepresented Minorities by Discipline . . . . . . . . . . . . . . . . . . . 262.1.4 Percentage of Masters Degrees Awarded to Women by Discipline . . . . . . . . . . . . . . . . . . . . . . . . . . . . . 262.1.5 Masters Degrees Awarded by Gender . . . . . . . . . . . . . . . . . . . . . . . . . . . . . . . . . . . . . . . . . . . 272.1.6 Masters Degrees Awarded by Race and Ethnicity . . . . . . . . . . . . . . . . . . . . . . . . . . . . . . . . . . . . . . 282.1.7 Masters Degrees Awarded by Residency . . . . . . . . . . . . . . . . . . . . . . . . . . . . . . . . . . . . . . . . . . 282.1.8 Masters Degrees Awarded by Race, Ethnicity, and Gender . . . . . . . . . . . . . . . . . . . . . . . . . . . . . . . . . 292.1.9 Top 50 Institutions Awarding Engineering Masters Degrees . . . . . . . . . . . . . . . . . . . . . . . . . . . . . . . . . 292.1.10 Top 20 Institutions by Total Masters Degrees awarded to Underrepresented Minorities . . . . . . . . . . . . . . . . . . . 302.1.11 Top 50 Institutions by Percentage of Masters Degrees awarded to Underrepresented Minorities . . . . . . . . . . . . . . . 302.1.12 Top 20 Institutions Awarding Highest Percentage of Masters Degrees to Women . . . . . . . . . . . . . . . . . . . . . . 312.1.13 Top 20 Institutions by Total Masters Degrees awarded in Engineering (General) . . . . . . . . . . . . . . . . . . . . . . . 31
2.2 ENGINEERING MASTERS ENROLLMENT . . . . . . . . . . . . . . . . . . . . . . . . . . . . . . . . . . . . . . . . . . . . . 322.2.1 Masters Enrollment by Race, Ethnicity, and Gender . . . . . . . . . . . . . . . . . . . . . . . . . . . . . . . . . . . . . 322.2.2 Top 50 Institutions with Highest Graduate Enrollment . . . . . . . . . . . . . . . . . . . . . . . . . . . . . . . . . . . . 332.2.3 Masters Enrollment by Engineering Discipline:(Full time and Part time) . . . . . . . . . . . . . . . . . . . . . . . . . . . 342.2.4 Masters Enrollment by Gender . . . . . . . . . . . . . . . . . . . . . . . . . . . . . . . . . . . . . . . . . . . . . . . 342.2.5 Masters Enrollment by Race and Ethnicity . . . . . . . . . . . . . . . . . . . . . . . . . . . . . . . . . . . . . . . . . 352.2.6 Masters Enrollment by Residency . . . . . . . . . . . . . . . . . . . . . . . . . . . . . . . . . . . . . . . . . . . . . 35
3 ENGINEERING DOCTORAL 363.1 ENGINEERING DOCTORAL DEGREES . . . . . . . . . . . . . . . . . . . . . . . . . . . . . . . . . . . . . . . . . . . . . . . 36
3.1.1 Doctoral Degrees Awarded by Engineering Discipline . . . . . . . . . . . . . . . . . . . . . . . . . . . . . . . . . . . . 363.1.2 Total Doctoral Degrees Awarded to Underrepresented Minorities by Engineering Discipline . . . . . . . . . . . . . . . . . 373.1.3 Percentage of Doctoral Degrees Awarded to Underrepresented Minorities by Discipline . . . . . . . . . . . . . . . . . . . 373.1.4 Percentage of Doctoral Degrees Awarded to Women by Discipline . . . . . . . . . . . . . . . . . . . . . . . . . . . . . 383.1.5 Doctoral Degrees Awarded by Gender . . . . . . . . . . . . . . . . . . . . . . . . . . . . . . . . . . . . . . . . . . . 383.1.6 Doctoral Degrees Awarded by Race and Ethnicity . . . . . . . . . . . . . . . . . . . . . . . . . . . . . . . . . . . . . 393.1.7 Doctoral Degrees Awarded by Residency . . . . . . . . . . . . . . . . . . . . . . . . . . . . . . . . . . . . . . . . . . 403.1.8 Doctoral Degrees Awarded by Race, Ethnicity, and Gender . . . . . . . . . . . . . . . . . . . . . . . . . . . . . . . . . 403.1.9 Top 50 Institutions Awarding Engineering Doctoral Degrees . . . . . . . . . . . . . . . . . . . . . . . . . . . . . . . . . 413.1.10 Top 20 Institutions by Total Doctoral Degrees awarded to Underrepresented Minorities . . . . . . . . . . . . . . . . . . . 42
1

3.1.11 Top 50 Institutions by Percentage of Doctoral Degrees awarded to Underrepresented Minorities . . . . . . . . . . . . . . . 423.1.12 Top 20 Institutions Awarding Highest Percentage of Doctoral Degrees to Women . . . . . . . . . . . . . . . . . . . . . . 433.1.13 Top 50 Institutions Awarding Doctoral Degrees to Foreign Nationals . . . . . . . . . . . . . . . . . . . . . . . . . . . . . 433.1.14 Top 50 Institutions Awarding Bachelors Degrees (excluding computer science both inside and outside Engineering) . . . . . 443.1.15 Top 50 Institutions Awarding Masters Degrees (excluding computer science both inside and outside Engineering) . . . . . . 463.1.16 Top 50 Institutions Awarding Doctoral Degrees (excluding computer science both inside and outside Engineering ) . . . . . 463.1.17 Institutions with the Highest Percentage of Doctoral Degrees to Foreign Nationals . . . . . . . . . . . . . . . . . . . . . . 473.1.18 Institutions with the Lowest Percentage of Doctoral Degrees to Foreign Nationals . . . . . . . . . . . . . . . . . . . . . . 483.1.19 Top 10 Institutions by Total Doctoral Degrees awarded in Engineering (General) . . . . . . . . . . . . . . . . . . . . . . 48
3.2 ENGINEERING DOCTORAL ENROLLMENT . . . . . . . . . . . . . . . . . . . . . . . . . . . . . . . . . . . . . . . . . . . . . 493.2.1 Doctoral Enrollment by Race, Ethnicity, and Gender . . . . . . . . . . . . . . . . . . . . . . . . . . . . . . . . . . . . 493.2.2 Doctoral Enrollment by Engineering Discipline:(Full time and Part time) . . . . . . . . . . . . . . . . . . . . . . . . . . . 503.2.3 Doctoral Enrollment by Gender . . . . . . . . . . . . . . . . . . . . . . . . . . . . . . . . . . . . . . . . . . . . . . . 503.2.4 Doctoral Enrollment by Race and Ethnicity . . . . . . . . . . . . . . . . . . . . . . . . . . . . . . . . . . . . . . . . . 503.2.5 Doctoral Enrollment by Residency . . . . . . . . . . . . . . . . . . . . . . . . . . . . . . . . . . . . . . . . . . . . . 51
4 ENGINEERING FACULTY , FALL 2020 524.1 Number of Tenured/TenureTrack Faculty by Engineering Discipline . . . . . . . . . . . . . . . . . . . . . . . . . . . . . . . . . 524.2 Percentage of Female Tenured/TenureTrack Faculty by Discipline . . . . . . . . . . . . . . . . . . . . . . . . . . . . . . . . . . 534.3 Top 50 Institutions by Number of Tenured/TenureTrack Faculty . . . . . . . . . . . . . . . . . . . . . . . . . . . . . . . . . . . 534.4 Top 20 Institutions by Number of Underrepresented Minorities Tenured/TenureTrack Faculty . . . . . . . . . . . . . . . . . . . . . 544.5 Top 20 Institutions by Percentage of Underrepresented Minorities Tenured/TenureTrack Faculty . . . . . . . . . . . . . . . . . . . 554.6 Number of Engineering Teaching Personnel by Rank . . . . . . . . . . . . . . . . . . . . . . . . . . . . . . . . . . . . . . . . . 554.7 Percentage of Female Tenured/TenureTrack Faculty by Rank . . . . . . . . . . . . . . . . . . . . . . . . . . . . . . . . . . . . 564.8 Top 50 Institutions with Highest Percentage of Female Tenured/Tenure Track Faculty . . . . . . . . . . . . . . . . . . . . . . . . . 574.9 Top 20 Institutions with Highest Number of Female Tenured/TenureTrack Faculty . . . . . . . . . . . . . . . . . . . . . . . . . . 584.10 Percentage of Women and Minority Faculty Members . . . . . . . . . . . . . . . . . . . . . . . . . . . . . . . . . . . . . . . . 584.11 Number of Full Professors by Race/Ethnicity . . . . . . . . . . . . . . . . . . . . . . . . . . . . . . . . . . . . . . . . . . . . . 594.12 Number of Assistant Professors by Race/Ethnicity . . . . . . . . . . . . . . . . . . . . . . . . . . . . . . . . . . . . . . . . . . 594.13 Number of Associate Professors by Race/Ethnicity . . . . . . . . . . . . . . . . . . . . . . . . . . . . . . . . . . . . . . . . . . 604.14 Percentage of Black/African American Tenured/TenureTrack Faculty by Rank . . . . . . . . . . . . . . . . . . . . . . . . . . . . 614.15 Percentage of Asian Tenured/TenureTrack Faculty by Rank . . . . . . . . . . . . . . . . . . . . . . . . . . . . . . . . . . . . . 614.16 Percentage of Hispanic Tenured/TenureTrack Faculty by Rank . . . . . . . . . . . . . . . . . . . . . . . . . . . . . . . . . . . . 624.17 African American Tenured/Tenure Track Faculty by Institutions . . . . . . . . . . . . . . . . . . . . . . . . . . . . . . . . . . . . 624.18 Asian Tenured/Tenure Track Faculty by Institutions . . . . . . . . . . . . . . . . . . . . . . . . . . . . . . . . . . . . . . . . . . 634.19 Hispanic Tenured/Tenure Track Faculty by Institutions . . . . . . . . . . . . . . . . . . . . . . . . . . . . . . . . . . . . . . . . 634.20 Percentage of African American Tenured/TenureTrack Faculty by Discipline . . . . . . . . . . . . . . . . . . . . . . . . . . . . . 644.21 Percentage of Hispanic Tenured/TenureTrack Faculty by Discipline . . . . . . . . . . . . . . . . . . . . . . . . . . . . . . . . . 654.22 Percentage of Asian Tenured/TenureTrack Faculty by Discipline . . . . . . . . . . . . . . . . . . . . . . . . . . . . . . . . . . . 66
5 ENGINEERING RESEARCH EXPENDITURES, FISCAL YEAR 2020 675.1 Top 50 Research Expenditure By Institutions . . . . . . . . . . . . . . . . . . . . . . . . . . . . . . . . . . . . . . . . . . . . . 675.2 Research Expenditures By Source in Millions of Dollars . . . . . . . . . . . . . . . . . . . . . . . . . . . . . . . . . . . . . . . 675.3 Computer Science Research Expenditures Located Outside of Engineering By Institutions . . . . . . . . . . . . . . . . . . . . . . 68
6 CANADIAN ENGINEERING 696.1 Engineering Bachelors Degree by Canadian Institutions . . . . . . . . . . . . . . . . . . . . . . . . . . . . . . . . . . . . . . . 696.2 Engineering Masters Degree by Canadian Institutions . . . . . . . . . . . . . . . . . . . . . . . . . . . . . . . . . . . . . . . . 696.3 Engineering Doctoral Degree by Canadian Institutions . . . . . . . . . . . . . . . . . . . . . . . . . . . . . . . . . . . . . . . . 696.4 Bachelors Degrees Awarded by Gender Canadian Institutions . . . . . . . . . . . . . . . . . . . . . . . . . . . . . . . . . . . . 696.5 Masters Degrees Awarded by Gender Canadian . . . . . . . . . . . . . . . . . . . . . . . . . . . . . . . . . . . . . . . . . . . 706.6 Doctoral Degrees Awarded by Gender Canadian Institutions . . . . . . . . . . . . . . . . . . . . . . . . . . . . . . . . . . . . . 706.7 Tenured/TenureTrack Faculty Members by Institutions . . . . . . . . . . . . . . . . . . . . . . . . . . . . . . . . . . . . . . . . 716.8 Percentage of Female Tenured/TenureTrack Faculty by Rank Canadian Institutions . . . . . . . . . . . . . . . . . . . . . . . . . 71
7 ENGINEERING TECHNOLOGY 727.1 ENGINEERING TECHNOLOGY DEGREES . . . . . . . . . . . . . . . . . . . . . . . . . . . . . . . . . . . . . . . . . . . . . 72
7.1.1 Engineering Technology Degrees Awarded by Discipline . . . . . . . . . . . . . . . . . . . . . . . . . . . . . . . . . . 727.1.2 Engineering Technology Degrees Awarded to Underrepresented Minorities by Discipline . . . . . . . . . . . . . . . . . . 727.1.3 Percentage of Engineering Technology Degrees Awarded to Underrepresented Minorities by Discipline . . . . . . . . . . . 737.1.4 Engineering Technology Bachelors Degrees Awarded by Gender . . . . . . . . . . . . . . . . . . . . . . . . . . . . . . 737.1.5 Engineering Technology Bachelors Degrees Awarded by Race and Ethnicity . . . . . . . . . . . . . . . . . . . . . . . . 737.1.6 Engineering Technology Bachelors Degrees Awarded by Residency . . . . . . . . . . . . . . . . . . . . . . . . . . . . 747.1.7 Top 50 Institutions Awarding Highest Number of ET Degrees . . . . . . . . . . . . . . . . . . . . . . . . . . . . . . . . 757.1.8 Top 50 Institutions by Engineering Technology Degrees awarded to Underrepresented Minorities . . . . . . . . . . . . . . 757.1.9 Top 50 Institutions by Percentage of Engineering Technology Degrees awarded to Underrepresented Minorities . . . . . . . 767.1.10 Top 50 Institutions Awarding Engineering Technology Degrees to Women . . . . . . . . . . . . . . . . . . . . . . . . . . 77
7.2 ENGINEERING TECHNOLOGY ENROLLMENT, FALL 2019 . . . . . . . . . . . . . . . . . . . . . . . . . . . . . . . . . . . . . 787.2.1 Full time Engineering Technology Enrollment by Discipline . . . . . . . . . . . . . . . . . . . . . . . . . . . . . . . . . 787.2.2 Top 50 Institutions by Engineering Technology Enrollment . . . . . . . . . . . . . . . . . . . . . . . . . . . . . . . . . . 787.2.3 Engineering Technology Enrollment by Gender . . . . . . . . . . . . . . . . . . . . . . . . . . . . . . . . . . . . . . . 797.2.4 Engineering Technology Enrollment by Race and Ethnicity . . . . . . . . . . . . . . . . . . . . . . . . . . . . . . . . . 807.2.5 Engineering Technology Enrollment by Residency . . . . . . . . . . . . . . . . . . . . . . . . . . . . . . . . . . . . . 81
2

1 ENGINEERING BACHELORS
1.1 ENGINEERING Bachelors DEGREES1.1.1 Total Bachelors Degrees Awarded by Engineering Discipline
Table 1: Bachelors Degrees by Discipline: 147,425*
Discipline Name Degrees Awarded
Mechanical 35,518Computer Sci. (inside Eng.) 22,916Computer Sci. (outside Engr.) 15,058Electrical 13,744Civil 13,515Chemical 10,348Computer 7,815Other 7,562Biomedical 7,515Industrial/Manufacturing/Systems 6,809Aerospace 4,852Electrical/Computer 4,135Engineering (General) 2,635Metallurgical and Matrls. 2,163Civil/Environmental 1,604Biological and Agricultural 1,437Envr. Eng 1,206Petroleum 1,008Engr. Science and Engr. Physics 731Engineering Management 668Architectural 638Nuclear 383Mining 223* Total does not include computer science (outside engineering).
35,518
22,916
15,05813,74413,515
10,348
7,815 7,562 7,515 6,8094,852 4,135
2,635 2,163 1,604 1,437 1,206 1,008 731 668 638 383 2230
10,000
20,000
30,000
Mec
hani
cal
Com
pute
r Sci
. (in
side
Eng
.)
Com
pute
r Sci
. (ou
tsid
e E
ngr.)
Ele
ctric
al
Civ
ilC
hem
ical
Com
pute
rO
ther
Bio
med
ical
Indu
stria
l/Man
ufac
turin
g/S
yste
ms
Aer
ospa
ceE
lect
rical
/Com
pute
rE
ngin
eerin
g (G
ener
al)
Met
allu
rgic
al a
nd M
atrls
.C
ivil/
Env
ironm
enta
l
Bio
logi
cal a
nd A
gric
ultu
ral
Env
r. E
ngP
etro
leum
Eng
r. S
cien
ce a
nd E
ngr.
Phy
sics
Eng
inee
ring
Man
agem
ent
Arc
hite
ctur
alN
ucle
arM
inin
gBachelors Degrees Awarded by Engineering Discipline
3

1.1.2 Total Bachelors Degrees Awarded to Underrepresented Minorities by Engineering Discipline
Table 2: Bachelors Degrees Awarded to Underrepresented Minorities by Engineering Discipline: 23,792
Discipline Name Degrees Awarded
Mechanical 5,652Computer Sci. (inside Eng.) 3,356Civil 2,800Electrical 2,636Computer Sci. (outside Engr.) 1,929Chemical 1,487Computer 1,347Other 1,177Biomedical 1,152Industrial/Manufacturing/Systems 1,131Aerospace 755Electrical/Computer 493Engineering (General) 356Metallurgical and Matrls. 257Civil/Environmental 246Petroleum 181Envr. Eng 180Biological and Agricultural 160Architectural 122Engineering Management 108Engr. Science and Engr. Physics 105Nuclear 62Mining 29
1.1.3 Percentage of Bachelors Degrees Awarded to Underrepresented Minorities by Discipline
Table 3: Percentage of Bachelors Degrees Awarded to Underrepresented Minorities by Discipline 15.7 % of Total
Discipline Name Degrees Awarded
Civil 20.7%Electrical 19.2%Architectural 19.1%Petroleum 18%Computer 17.2%Industrial/Manufacturing/Systems 16.6%Engineering Management 16.2%Nuclear 16.2%Mechanical 15.9%Aerospace 15.6%Other 15.6%Biomedical 15.3%Civil/Environmental 15.3%Envr. Eng 14.9%Computer Sci. (inside Eng.) 14.6%Chemical 14.4%Engr. Science and Engr. Physics 14.4%Engineering (General) 13.5%Mining 13%Computer Sci. (outside Engr.) 12.8%Electrical/Computer 11.9%Metallurgical and Matrls. 11.9%Biological and Agricultural 11.1%
1.1.4 Percentage of Bachelors Degrees Awarded to Women by Discipline
Table 4: Percentage of Bachelors Degrees Awarded to Women byDiscipline 23.1 % of Total
Discipline Name Percent Women
Envr. Eng 53.3%Biomedical 50%Biological and Agricultural 40%Chemical 37.7%Industrial/Manufacturing/Systems 33.3%Metallurgical and Matrls. 32.5%Architectural 30.4%Civil/Environmental 28.9%Civil 27.6%Engineering Management 27.5%Engineering (General) 26.3%
4

Table 4: Percentage of Bachelors Degrees Awarded to Women byDiscipline 23.1 % of Total (continued)
Discipline Name Percent Women
Other 24.5%Engr. Science and Engr. Physics 22.7%Computer Sci. (outside Engr.) 20.4%Computer Sci. (inside Eng.) 19.2%Nuclear 18.8%Electrical/Computer 18.7%Petroleum 16.8%Mechanical 16.5%Electrical 15.5%Aerospace 15%Computer 14.5%Mining 13.5%
53.3%50%
40%37.7%
33.3% 32.5%30.4% 28.9% 27.6% 27.5%
26.3%24.5% 22.7%
20.4% 19.2% 18.8%18.7%16.8% 16.5%15.5% 15% 14.5%
13.5%
0%
10%
20%
30%
40%
50%
60%
Env
r. E
ngB
iom
edic
al
Bio
logi
cal a
nd A
gric
ultu
ral
Che
mic
al
Indu
stria
l/Man
ufac
turin
g/S
yste
ms
Met
allu
rgic
al a
nd M
atrls
.A
rchi
tect
ural
Civ
il/E
nviro
nmen
tal
Civ
il
Eng
inee
ring
Man
agem
ent
Eng
inee
ring
(Gen
eral
)O
ther
Eng
r. S
cien
ce a
nd E
ngr.
Phy
sics
Com
pute
r Sci
. (ou
tsid
e E
ngr.)
Com
pute
r Sci
. (in
side
Eng
.)
Ele
ctric
al/C
ompu
ter
Nuc
lear
Petro
leum
Ele
ctric
alM
echa
nica
lA
eros
pace
Com
pute
rM
inin
g
Percentage of Bachelors Degrees Awarded to Women by Discipline
1.1.5 Institutions Awarding the Highest Number of Engineering Bachelor’s Degrees
Table 5: Institutions Awarding the Highest Number of EngineeringBachelor’s Degrees
No Institutions Degrees Awarded1 Georgia Institute of Technology 2,9822 Purdue University 2,4583 Arizona State University 2,2984 Texas A&M University 2,2945 University of Illinois at UrbanaChampaign 2,2476 University of Michigan 2,1727 University of California, Irvine 2,0258 The Ohio State University 1,9339 Iowa State University 1,850
10 The University of Texas at Austin 1,84411 Virginia Polytechnic Institute and State University 1,82712 University of Maryland, College Park 1,73813 University of California, Berkeley 1,72614 University of Central Florida 1,68815 Oregon State University 1,67216 University of WisconsinMadison 1,64217 University of Florida 1,63418 North Carolina State University 1,60019 Rutgers, The State University of New Jersey, School of Engineering 1,56020 California Polytechnic State University, San Luis Obispo 1,45821 University of California, San Diego 1,40122 University of Washington in Seattle 1,37823 University of Colorado Boulder 1,31324 Stony Brook University 1,24825 Florida International University 1,23826 Michigan State University 1,19527 Missouri University of Science and Technology 1,17928 The University of Texas at Dallas 1,16129 Rensselaer Polytechnic Institute 1,16030 University of Minnesota Twin Cities 1,14731 Northeastern University 1,11532 New Jersey Institute of Technology 1,110
5

Table 5: Institutions Awarding the Highest Number of EngineeringBachelor’s Degrees (continued)
No Institutions Degrees Awarded33 University at Buffalo, SUNY 1,10434 Clemson University 1,09235 Auburn University 1,08536 The University of Alabama 1,08137 George Mason University 1,07438 California State University, Long Beach 1,04139 Colorado School of Mines 1,02039 Louisiana State University 1,02041 University of CaliforniaSanta Cruz 1,01642 California State Polytechnic University, Pomona 1,00243 Texas Tech University 99744 San Jose State University 98445 University of South Florida 97946 University of California, Los Angeles 95347 University of Virginia 92448 Rochester Institute of Technology 91249 University of Pittsburgh 88750 Worcester Polytechnic Institute 884* 429 Institutions included
1.1.6 Bachelors Degrees Awarded by Gender
Table 6: Bachelors Degrees Awarded by Gender
Gender 2010 2011 2012 2013 2014 2015 2016 2017 2018 2019 2020
Female 17.80% 18.10% 18.40% 18.90% 19.10% 19.90% 20.90% 21.30% 21.90% 22.40% 23.10%Male 82.20% 81.90% 81.60% 81.10% 80.90% 80.10% 79.10% 78.70% 78.10% 77.60% 76.90%
76.9%
23.1%
0%
10%
20%
30%
40%
50%
60%
70%
80%
90%
100%
Mal
e
Fem
ale
Bachelors Degrees Awarded by Gender
1.1.7 Bachelors Degrees Awarded by Race and Ethnicity
Table 7: Bachelors Degrees Awarded by Ethnicity
Ethnicity 2010 2011 2012 2013 2014 2015 2016 2017 2018 2019 2020Black or Afr. American 4.5% 4.2% 4.2% 4.3% 3.5% 4.0% 3.9% 4.1% 4.2% 4.3% 4.5%Hispanic 7.0% 8.5% 9.0% 9.3% 10.1% 10.7% 10.7% 11.1% 11.4% 12.1% 13.1%Other 1.2% 1.6% 2.0% 2.3% 2.9% 3.1% 3.6% 3.8% 3.5% 4.3% 4.4%Asian American 12.2% 12.2% 12.2% 12.9% 13.1% 13.4% 14.2% 14.6% 14.7% 14.7% 14.9%White 69.8% 66.6% 66.2% 65.7% 65.9% 64.9% 63.4% 62.3% 61.5% 60.8% 59.4%Unknown 5.3% 6.9% 6.5% 5.6% 4.5% 3.9% 4.2% 4.1% 4.2% 3.8% 3.7%
*Data on ethnicity does not include foreign nationals. American Indian/Alaska Native (0.3%), Native Hawaiian/Other Pacfic Islander(0.2%) andMultiracial (3.9%) are combined under Other.
6

4.5%
13.1%
4.4%
14.9%
59.4%
3.7%
0%
10%
20%
30%
40%
50%
60%
70%
80%
90%
100%B
lack
or A
fr. A
mer
ican
His
pani
c
Oth
er
Asi
an A
mer
ican
Whi
te
Unk
now
n
Bachelors Degrees Awarded by Race and Ethnicity
1.1.8 Bachelors Degrees Awarded by Residency
Table 8: Bachelors Degrees Awarded by Residency
Nationality 2010 2011 2012 2013 2014 2015 2016 2017 2018 2019 2020Foreign 6.2% 6.2% 6.7% 7.5% 7.8% 8.5% 9.1% 9.6% 10.1% 11.2% 11.1%Domestic 94.0% 93.8% 93.3% 92.5% 92.2% 91.5% 90.9% 90.4% 89.9% 88.8% 88.9%
11.1%
88.9%
0%
10%
20%
30%
40%
50%
60%
70%
80%
90%
100%
Dom
estic
Fore
ign
Bachelors Degrees Awarded by Residency
7
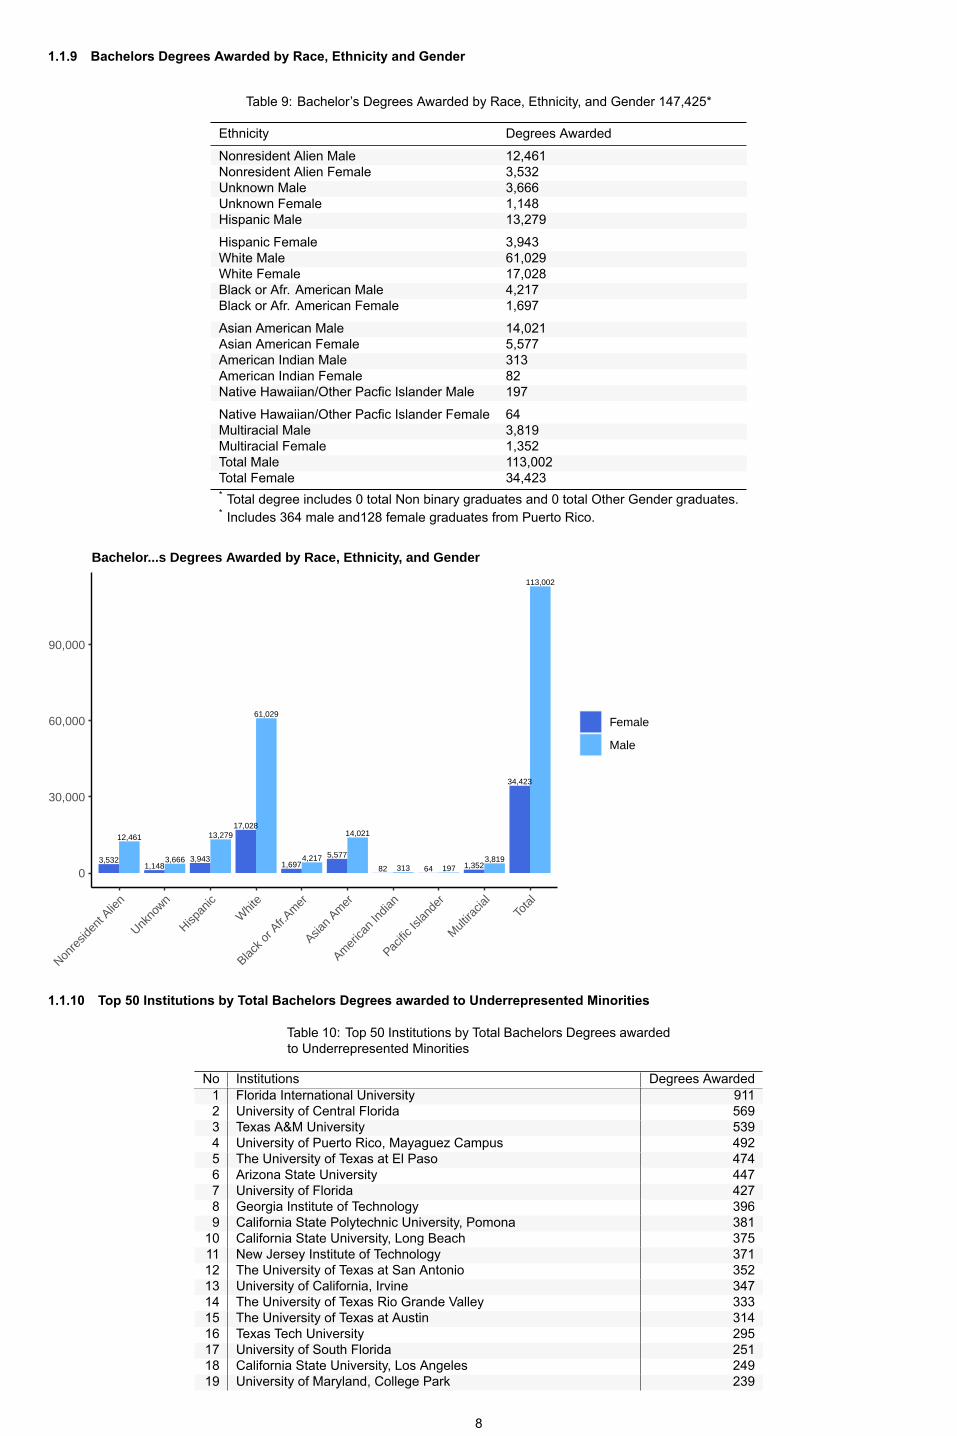
1.1.9 Bachelors Degrees Awarded by Race, Ethnicity and Gender
Table 9: Bachelor’s Degrees Awarded by Race, Ethnicity, and Gender 147,425*
Ethnicity Degrees Awarded
Nonresident Alien Male 12,461Nonresident Alien Female 3,532Unknown Male 3,666Unknown Female 1,148Hispanic Male 13,279Hispanic Female 3,943White Male 61,029White Female 17,028Black or Afr. American Male 4,217Black or Afr. American Female 1,697Asian American Male 14,021Asian American Female 5,577American Indian Male 313American Indian Female 82Native Hawaiian/Other Pacfic Islander Male 197Native Hawaiian/Other Pacfic Islander Female 64Multiracial Male 3,819Multiracial Female 1,352Total Male 113,002Total Female 34,423* Total degree includes 0 total Non binary graduates and 0 total Other Gender graduates.* Includes 364 male and128 female graduates from Puerto Rico.
12,461
3,532 3,6661,148
13,279
3,943
61,029
17,028
4,2171,697
14,021
5,577
31382 197643,819
1,352
113,002
34,423
0
30,000
60,000
90,000
Nonre
siden
t Alie
n
Unkno
wn
Hispan
ic
Whit
e
Black o
r Afr.
Amer
Asian
Amer
Amer
ican
India
n
Pacific
Islan
der
Mult
iracia
lTo
tal
Female
Male
Bachelor...s Degrees Awarded by Race, Ethnicity, and Gender
1.1.10 Top 50 Institutions by Total Bachelors Degrees awarded to Underrepresented Minorities
Table 10: Top 50 Institutions by Total Bachelors Degrees awardedto Underrepresented Minorities
No Institutions Degrees Awarded1 Florida International University 9112 University of Central Florida 5693 Texas A&M University 5394 University of Puerto Rico, Mayaguez Campus 4925 The University of Texas at El Paso 4746 Arizona State University 4477 University of Florida 4278 Georgia Institute of Technology 3969 California State Polytechnic University, Pomona 381
10 California State University, Long Beach 37511 New Jersey Institute of Technology 37112 The University of Texas at San Antonio 35213 University of California, Irvine 34714 The University of Texas Rio Grande Valley 33315 The University of Texas at Austin 31416 Texas Tech University 29517 University of South Florida 25118 California State University, Los Angeles 24919 University of Maryland, College Park 239
8

Table 10: Top 50 Institutions by Total Bachelors Degrees awardedto Underrepresented Minorities (continued)
No Institutions Degrees Awarded20 California State University, Northridge 23821 San Jose State University 22922 The University of Texas at Dallas 22023 California State University, Fullerton 21723 Texas A&M University Kingsville 21725 California Polytechnic State University, San Luis Obispo 21426 George Mason University 21126 University of Arizona 21128 University of California, Riverside 21029 The University of Texas at Arlington 20830 California State University, Sacramento 20631 North Carolina A&T State University 20531 San Diego State University 20533 Rutgers, The State University of New Jersey, School of Engineering 19634 University of Illinois at Chicago 19335 University of Illinois at UrbanaChampaign 18536 Florida Atlantic University 18437 FAMUFSU College of Engineering 18038 New Mexico State University 17839 Massachusetts Institute of Technology 16740 University of Colorado Boulder 16541 University of CaliforniaSanta Cruz 16442 University of California, Davis 16343 Texas State University 16044 Kennesaw State University 15945 Stanford University 15646 Oregon State University 15546 University of Maryland, Baltimore County 15546 University of Michigan 15549 Rensselaer Polytechnic Institute 15450 University of California, Merced 149* 429 Institutions included
1.1.11 Top 50 Institutions by Total Bachelors Degrees awarded to Women
Table 11: Top 50 Institutions by Total Bachelors Degrees awardedto Women
No Institutions Degrees Awarded1 Georgia Institute of Technology 9612 Purdue University 5833 University of Michigan 5784 Texas A&M University 5745 University of Illinois at UrbanaChampaign 5086 University of California, Irvine 5027 The University of Texas at Austin 4988 University of California, Berkeley 4779 University of Florida 459
10 The Ohio State University 43111 Arizona State University 42812 Virginia Polytechnic Institute and State University 42213 California Polytechnic State University, San Luis Obispo 41914 University of Maryland, College Park 41815 University of Washington in Seattle 40216 Cornell University 39017 North Carolina State University 37218 Massachusetts Institute of Technology 36719 University of WisconsinMadison 36120 University of California, San Diego 35221 Oregon State University 34022 Rensselaer Polytechnic Institute 33923 Rutgers, The State University of New Jersey, School of Engineering 33723 Stony Brook University 33725 University of Colorado Boulder 32426 Northeastern University 32327 University of Central Florida 30828 University of Virginia 30729 Colorado School of Mines 30130 University of Minnesota Twin Cities 28831 Iowa State University 28732 Missouri University of Science and Technology 28533 Clemson University 28434 Stanford University 28134 Worcester Polytechnic Institute 28136 Michigan State University 28037 University of California, Davis 27038 University of Pittsburgh 25839 Florida International University 25140 Carnegie Mellon University 24641 California State Polytechnic University, Pomona 245
9

Table 11: Top 50 Institutions by Total Bachelors Degrees awardedto Women (continued)
No Institutions Degrees Awarded42 The University of Alabama 24443 Auburn University 23244 Boston University 23044 New Jersey Institute of Technology 23044 University of California, Los Angeles 23047 Louisiana State University 22848 George Mason University 22549 University of Southern California 21850 California State University, Long Beach 209* 429 Institutions included
1.1.12 Top 50 Institutions by Percentage of Bachelors Degrees awarded to Underrepresented Minorities
Table 12: Top 50 Institutions by Percentage of Bachelors Degreesawarded to Underrepresented Minorities
No Institutions Percent Underrepresented Minorities1 Navajo Technical University 100%1 University of Puerto Rico, Mayaguez Campus 100%3 Hampton University 96.9%4 Texas A & M International University 94.6%5 Alabama A & M University 93.5%6 Central State University 91.7%7 The University of Texas Rio Grande Valley 87.2%8 Tuskegee University 85.7%9 Norfolk State University 81.8%
10 South Carolina State University 80%11 Jackson State University 75.3%12 The University of Texas at El Paso 74.6%13 Florida International University 73.6%14 Prairie View A & M University 70.9%15 North Carolina A&T State University 70.7%16 Texas A&M University Kingsville 60.1%17 Howard University 59%18 University of Texas of the Permian Basin 57.8%19 California State University, Los Angeles 57.6%20 The University of Texas at San Antonio 53.9%21 New Mexico State University 52.2%22 California State UniversitySan Bernardino 48.3%23 Morgan State University 48%24 California State UniversityBakersfield 47.8%25 St. Mary’s University 47.3%26 University of California, Merced 45.2%27 University of HoustonClear Lake 45.1%28 The University of New Mexico 44.6%29 BethuneCookman University 42.9%30 University of Maryland Eastern Shore 42.1%31 New Mexico Institute of Mining and Technology 41.3%32 Florida Atlantic University 40.9%33 Texas State University 40.5%34 Tennessee State University 38.9%35 California State Polytechnic University, Pomona 38%36 University of the District of Columbia 37.4%37 Walla Walla University 37.3%38 Virginia State University 37.3%39 California State UniversityFresno 37.1%40 The University of Texas at Tyler 36.3%41 California State University, Long Beach 36%42 Tarleton State University 35.3%43 West Texas A & M University 35.1%44 California Baptist University 34.1%45 University of Central Florida 33.7%46 New Jersey Institute of Technology 33.4%47 Colorado State University, Pueblo 33.3%47 Fairleigh Dickinson UniversityMetropolitan Campus 33.3%47 Fort Lewis College 33.3%47 Lamar University 33.3%* 429 Institutions included
10

1.1.13 Top 20 Institutions by Percentage of Bachelors Degrees awarded to Women
Table 13: Top 20 Institutions by Percentage of Bachelors Degreesawarded to Women
No Institutions Percent Women1 Smith College 100%1 Sweet Briar College 100%3 Central State University 58.3%4 Trinity College 54.5%5 University of South CarolinaAiken 53.3%6 Loyola University Chicago 52.4%7 Bates College 50%7 Navajo Technical University 50%9 Massachusetts Institute of Technology 46%
10 Olin College of Engineering 45.6%11 Cornell University 44.6%12 Carnegie Mellon University 43.2%13 University of Portland 42.7%14 California Institute of Technology 42.6%15 Stanford University 42%16 Swarthmore College 41.7%17 The George Washington University 41.6%18 Brown University 41.2%19 Lafayette College 41.1%20 U.S. Coast Guard Academy 40.2%* 429 Institutions included
1.1.14 Top 20 Institutions by Total Bachelors Degrees awarded to African Americans
Table 14: Top 20 Institutions by Total Bachelors Degrees awardedto African Americans
No Institutions Degrees Awarded1 New Jersey Institute of Technology 2862 North Carolina A&T State University 1963 Georgia Institute of Technology 1714 University of Maryland, College Park 1235 University of Central Florida 1176 Prairie View A & M University 1147 Kennesaw State University 1038 University of Maryland, Baltimore County 1029 George Mason University 96
10 Tuskegee University 9511 Florida International University 9311 Morgan State University 9313 Alabama A & M University 8414 Texas Tech University 7515 Louisiana State University 6716 Georgia Southern University 6617 Florida Atlantic University 6318 Mississippi State University 6019 FAMUFSU College of Engineering 5920 Clemson University 56* 429 Institutions included
1.1.15 Top 20 Institutions by Total Bachelors Degrees awarded to Asian Americans
Table 15: Top 20 Institutions by Total Bachelors Degrees awardedto Asian Americans
No Institutions Degrees Awarded1 University of California, Berkeley 9362 University of California, Irvine 8413 Georgia Institute of Technology 6624 University of Illinois at UrbanaChampaign 6435 The University of Texas at Austin 6206 Rutgers, The State University of New Jersey, School of Engineering 5717 University of Michigan 4748 University of California, San Diego 4569 University of Maryland, College Park 419
10 Stony Brook University 41211 University of California, Los Angeles 41112 University of CaliforniaSanta Cruz 39613 University of Washington in Seattle 38214 San Jose State University 38015 George Mason University 37416 The University of Texas at Dallas 36517 Purdue University 30418 California State University, Long Beach 30219 Texas A&M University 29020 University of California, Davis 280* 429 Institutions included
11

1.1.16 Top 20 Institutions by Total Bachelors Degrees awarded to Hispanics
Table 16: Top 20 Institutions by Total Bachelors Degrees awardedto Hispanics
No Institutions Degrees Awarded1 Florida International University 8182 University of Puerto Rico, Mayaguez Campus 4923 Texas A&M University 4744 The University of Texas at El Paso 4705 University of Central Florida 4506 Arizona State University 3917 University of Florida 3728 California State Polytechnic University, Pomona 3549 California State University, Long Beach 347
10 The University of Texas Rio Grande Valley 33311 University of California, Irvine 32012 The University of Texas at San Antonio 31513 The University of Texas at Austin 26714 California State University, Los Angeles 23815 California State University, Northridge 22916 Georgia Institute of Technology 22317 Texas Tech University 21718 California State University, Fullerton 21119 San Jose State University 21020 Texas A&M University Kingsville 205* 429 Institutions included
1.1.17 Top 20 Institutions by Total Bachelors Degrees awarded in Aerospace Engineering
Table 17: Top 20 Institutions by Total Bachelors Degrees awardedin Aerospace Engineering
No Institutions Degrees Awarded1 Purdue University 2502 West Virginia University 2383 University of Colorado Boulder 2204 Embry Riddle Aeronautical UniversityDaytona Beach 2065 Georgia Institute of Technology 1976 The University of Texas at Austin 1897 University of Central Florida 1848 Embry Riddle Aeronautical University, Prescott 1509 Iowa State University 148
10 University of Maryland, College Park 14511 Texas A&M University 14312 Virginia Polytechnic Institute and State University 13813 University of Florida 13314 University of Michigan 13215 University of Southern California 12416 California Polytechnic State University, San Luis Obispo 11617 California State Polytechnic University, Pomona 10918 University of Illinois at UrbanaChampaign 9519 The University of Alabama 8819 Wichita State University 88* 64 Institutions included
1.1.18 Top 20 Institutions by Total Bachelors Degrees awarded in Biomedical Engineering
Table 18: Top 20 Institutions by Total Bachelors Degrees awardedin Biomedical Engineering
No Institutions Degrees Awarded1 Georgia Institute of Technology 2462 University of California, San Diego 1513 Texas A&M University 1494 Boston University 1425 The University of Texas at Austin 1316 The Johns Hopkins University 1307 North Carolina State University 1278 Arizona State University 1239 Rutgers, The State University of New Jersey, School of Engineering 1209 University of California, Irvine 12011 Clemson University 11711 University of Maryland, College Park 11713 The University of Iowa 11214 Rensselaer Polytechnic Institute 10214 The University of Texas at Dallas 10216 Drexel University 9917 California Polytechnic State University, San Luis Obispo 9817 University of Michigan 9817 Worcester Polytechnic Institute 9820 University of Connecticut 94* 168 Institutions included
12

1.1.19 Top 50 Institutions by Total Bachelors Degrees awarded in Chemical Engineering
Table 19: Top 50 Institutions by Total Bachelors Degrees awardedin Chemical Engineering
No Institutions Degrees Awarded1 Texas A&M University 2232 The University of Alabama 1993 Georgia Institute of Technology 1934 The Ohio State University 1835 The University of Texas at Austin 1806 Arizona State University 1647 Purdue University 1618 Michigan State University 1449 University of Illinois at UrbanaChampaign 143
10 Colorado School of Mines 14011 Auburn University 13612 University of South Florida 13213 North Carolina State University 13114 University of California, Davis 13015 Iowa State University 12815 Montana State University 12815 Northeastern University 12818 Louisiana State University 12719 Oregon State University 11820 University of Kentucky 11721 University of Michigan 11321 University of WisconsinMadison 11323 University of California, Berkeley 11023 University of Minnesota Twin Cities 11023 Virginia Polytechnic Institute and State University 11026 Mississippi State University 10926 Rensselaer Polytechnic Institute 10928 University of California, San Diego 10728 University of Florida 10730 University of Cincinnati 10631 Missouri University of Science and Technology 10132 Texas Tech University 9833 Brigham Young University 9733 Colorado State University 9733 University of Pittsburgh 9736 University of Oklahoma, Gallogly College of Engineering 9337 University of Massachusetts Amherst 9238 California State University, Long Beach 9138 West Virginia University 9140 Michigan Technological University 9040 University of Kansas 9042 University of Arkansas 8843 University of Maryland, College Park 8544 University of Notre Dame 8445 University of Massachusetts Lowell 8346 NYU Tandon School of Engineering 8046 University at Buffalo, SUNY 8048 California State Polytechnic University, Pomona 7948 University of Colorado Boulder 7950 Drexel University 77* 160 Institutions included
1.1.20 Top 50 Institutions by Total Bachelors Degrees awarded in Civil Engineering
Table 20: Top 50 Institutions by Total Bachelors Degrees awardedin Civil Engineering
No Institutions Degrees Awarded1 California State Polytechnic University, Pomona 2612 Texas A&M University 2543 Iowa State University 1974 San Diego State University 1915 Purdue University 1885 Virginia Polytechnic Institute and State University 1887 University of Illinois at UrbanaChampaign 1808 California State University, Long Beach 1769 New Jersey Institute of Technology 169
10 North Carolina State University 16111 California State University, Northridge 15912 California Polytechnic State University, San Luis Obispo 15413 California State University, Sacramento 14614 University of Florida 14515 The University of Texas at Austin 14416 The University of Texas at Arlington 14117 Georgia Institute of Technology 14018 Clemson University 13818 San Jose State University 13820 University of Washington in Seattle 135
13

Table 20: Top 50 Institutions by Total Bachelors Degrees awardedin Civil Engineering (continued)
No Institutions Degrees Awarded21 The University of Alabama 13222 University of South Florida 12923 Florida International University 12823 Michigan State University 12823 University at Buffalo, SUNY 12826 Oregon State University 12726 University of Central Florida 12728 University of California, Davis 12629 Auburn University 12530 Louisiana State University 11931 California State University, Fullerton 11332 Kennesaw State University 11233 University of Nebraska, Lincoln 11134 University of WisconsinMadison 10835 Manhattan College 10536 Missouri University of Science and Technology 10437 Colorado State University 10037 University of California, San Diego 10039 University of Maryland, College Park 9940 Washington State University 9741 University of Missouri 9542 City College of the City University of New York 9342 FAMUFSU College of Engineering 9342 University of California, Irvine 9345 Mississippi State University 9245 Texas A&M University Kingsville 9245 University of Arkansas 9245 University of Nevada, Reno 9245 University of Tennessee, Knoxville 9250 Rutgers, The State University of New Jersey, School of Engineering 91* 240 Institutions included
1.1.21 Top 50 Institutions by Total Bachelors Degrees awarded in Industrial/Manufacturing Engineering
Table 21: Top 50 Institutions by Total Bachelors Degrees awardedin Industrial/Manufacturing Engineering
No Institutions Degrees Awarded1 Georgia Institute of Technology 3952 Purdue University 2783 Arizona State University 1944 University of Michigan 1844 Virginia Polytechnic Institute and State University 1846 Texas A&M University 1627 Clemson University 1598 University of Central Florida 1459 Oregon State University 132
10 Auburn University 13011 University of Illinois at UrbanaChampaign 12912 Lehigh University 12813 Iowa State University 12613 University of Virginia 12615 The Ohio State University 12216 University of Florida 11917 University of WisconsinMadison 11618 California Polytechnic State University, San Luis Obispo 11118 California State Polytechnic University, Pomona 11118 University of Arizona 11121 West Virginia University 9922 Cornell University 9023 Northwestern University 8924 North Carolina State University 8424 University of Pittsburgh 8424 Wichita State University 8427 University of Minnesota Twin Cities 8128 University of South Florida 8029 Stanford University 7630 Texas State University 7330 Texas Tech University 7330 The State University of New York at Binghamton 7330 The University of Texas at El Paso 7334 Rochester Institute of Technology 7034 Rutgers, The State University of New Jersey, School of Engineering 7036 University of Arkansas 6837 University of Puerto Rico, Mayaguez Campus 6737 Washington University in St. Louis 6739 Kansas State University 6439 Louisiana State University 6441 San Jose State University 6142 University of Washington in Seattle 58
14

Table 21: Top 50 Institutions by Total Bachelors Degrees awardedin Industrial/Manufacturing Engineering (continued)
No Institutions Degrees Awarded43 Rensselaer Polytechnic Institute 5443 University of California, Berkeley 5443 University of Southern California 5443 University of Wisconsin, Platteville 5447 Mississippi State University 5348 University of Oklahoma, Gallogly College of Engineering 5249 University at Buffalo, SUNY 5149 University of Louisville 51* 141 Institutions included
1.1.22 Top 50 Institutions by Total Bachelors Degrees awarded in Mechanical Engineering
Table 22: Top 50 Institutions by Total Bachelors Degrees awardedin Mechanical Engineering
No Institutions Degrees Awarded1 Georgia Institute of Technology 5722 University of Central Florida 4613 Texas A&M University 4374 Iowa State University 4295 The University of Alabama 4075 Virginia Polytechnic Institute and State University 4077 Purdue University 3758 Rensselaer Polytechnic Institute 3649 Texas Tech University 356
10 University at Buffalo, SUNY 34111 University of Maryland, College Park 33612 University of Florida 32113 Northeastern University 31814 Colorado School of Mines 31415 Michigan State University 30616 California Polytechnic State University, San Luis Obispo 30317 San Diego State University 30218 Washington State University 29919 University of Colorado Boulder 29220 University of Michigan 28921 Oregon State University 28422 North Carolina State University 28323 Michigan Technological University 28124 Missouri University of Science and Technology 27925 The University of Texas at Austin 27326 Arizona State University 26427 University of California, Irvine 26328 Rutgers, The State University of New Jersey, School of Engineering 25829 Kettering University 25530 Oklahoma State University 25431 The Ohio State University 24832 Auburn University 24233 Worcester Polytechnic Institute 23534 California State University, Fullerton 23035 Clemson University 22836 Kennesaw State University 22537 California State University, Northridge 22438 California State Polytechnic University, Pomona 22139 Colorado State University 21840 The University of Texas at Dallas 21741 The University of Texas at Arlington 21642 Kansas State University 21343 University of South Florida 20844 California State University, Sacramento 20645 Mississippi State University 20346 The University of Alabama in Huntsville 20146 University of Illinois at UrbanaChampaign 20148 University of Massachusetts Lowell 19949 University of Minnesota Twin Cities 19849 University of North Carolina at Charlotte 198* 324 Institutions included
15
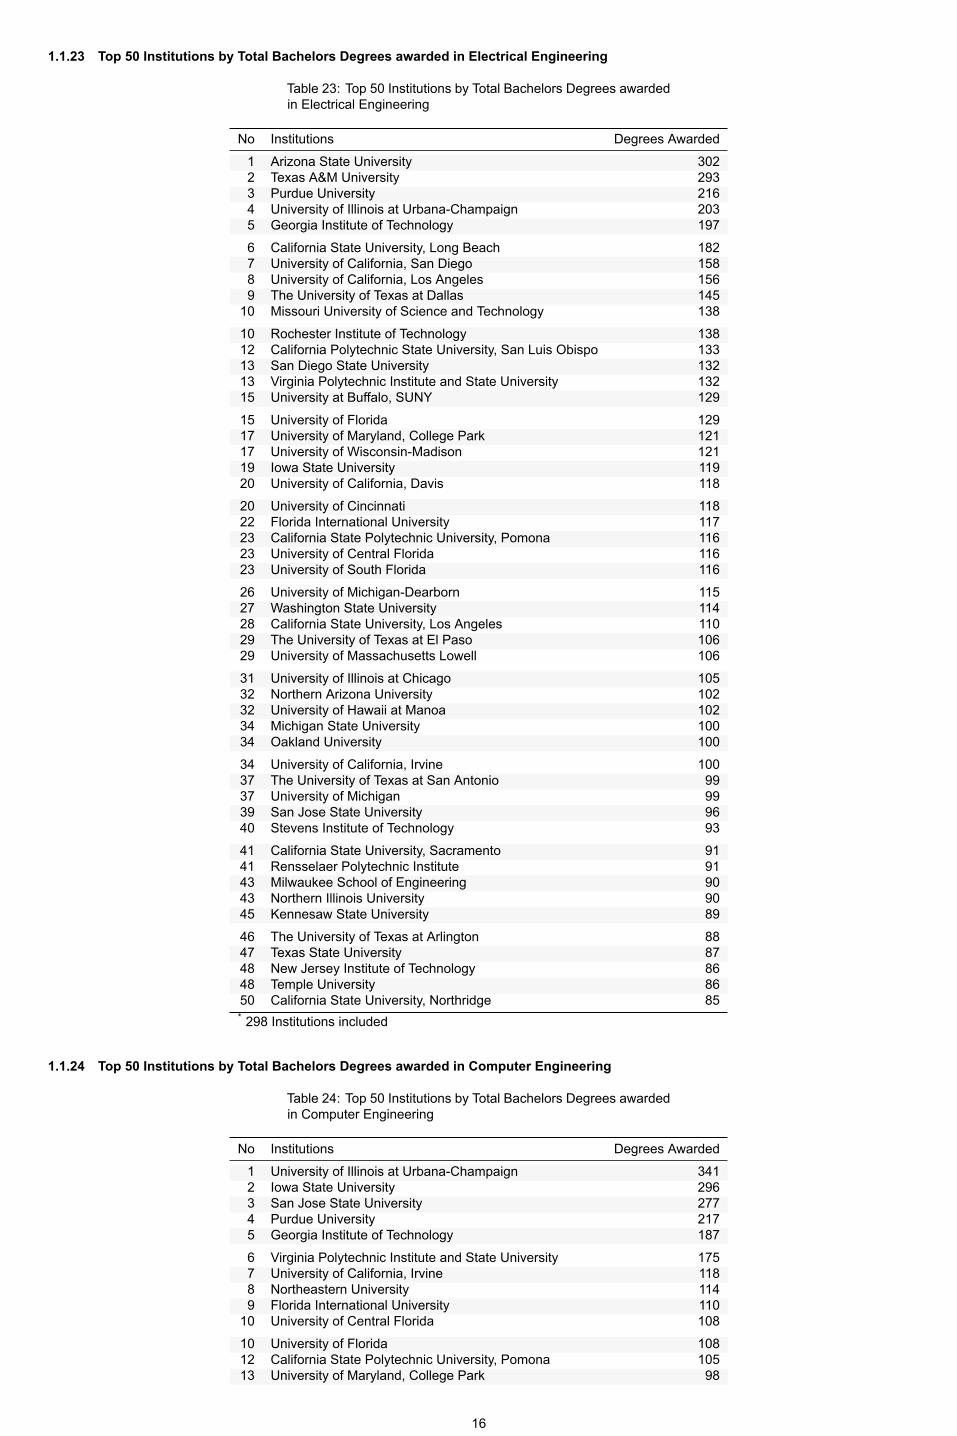
1.1.23 Top 50 Institutions by Total Bachelors Degrees awarded in Electrical Engineering
Table 23: Top 50 Institutions by Total Bachelors Degrees awardedin Electrical Engineering
No Institutions Degrees Awarded
1 Arizona State University 3022 Texas A&M University 2933 Purdue University 2164 University of Illinois at UrbanaChampaign 2035 Georgia Institute of Technology 1976 California State University, Long Beach 1827 University of California, San Diego 1588 University of California, Los Angeles 1569 The University of Texas at Dallas 145
10 Missouri University of Science and Technology 13810 Rochester Institute of Technology 13812 California Polytechnic State University, San Luis Obispo 13313 San Diego State University 13213 Virginia Polytechnic Institute and State University 13215 University at Buffalo, SUNY 12915 University of Florida 12917 University of Maryland, College Park 12117 University of WisconsinMadison 12119 Iowa State University 11920 University of California, Davis 11820 University of Cincinnati 11822 Florida International University 11723 California State Polytechnic University, Pomona 11623 University of Central Florida 11623 University of South Florida 11626 University of MichiganDearborn 11527 Washington State University 11428 California State University, Los Angeles 11029 The University of Texas at El Paso 10629 University of Massachusetts Lowell 10631 University of Illinois at Chicago 10532 Northern Arizona University 10232 University of Hawaii at Manoa 10234 Michigan State University 10034 Oakland University 10034 University of California, Irvine 10037 The University of Texas at San Antonio 9937 University of Michigan 9939 San Jose State University 9640 Stevens Institute of Technology 9341 California State University, Sacramento 9141 Rensselaer Polytechnic Institute 9143 Milwaukee School of Engineering 9043 Northern Illinois University 9045 Kennesaw State University 8946 The University of Texas at Arlington 8847 Texas State University 8748 New Jersey Institute of Technology 8648 Temple University 8650 California State University, Northridge 85* 298 Institutions included
1.1.24 Top 50 Institutions by Total Bachelors Degrees awarded in Computer Engineering
Table 24: Top 50 Institutions by Total Bachelors Degrees awardedin Computer Engineering
No Institutions Degrees Awarded
1 University of Illinois at UrbanaChampaign 3412 Iowa State University 2963 San Jose State University 2774 Purdue University 2175 Georgia Institute of Technology 1876 Virginia Polytechnic Institute and State University 1757 University of California, Irvine 1188 Northeastern University 1149 Florida International University 110
10 University of Central Florida 10810 University of Florida 10812 California State Polytechnic University, Pomona 10513 University of Maryland, College Park 98
16
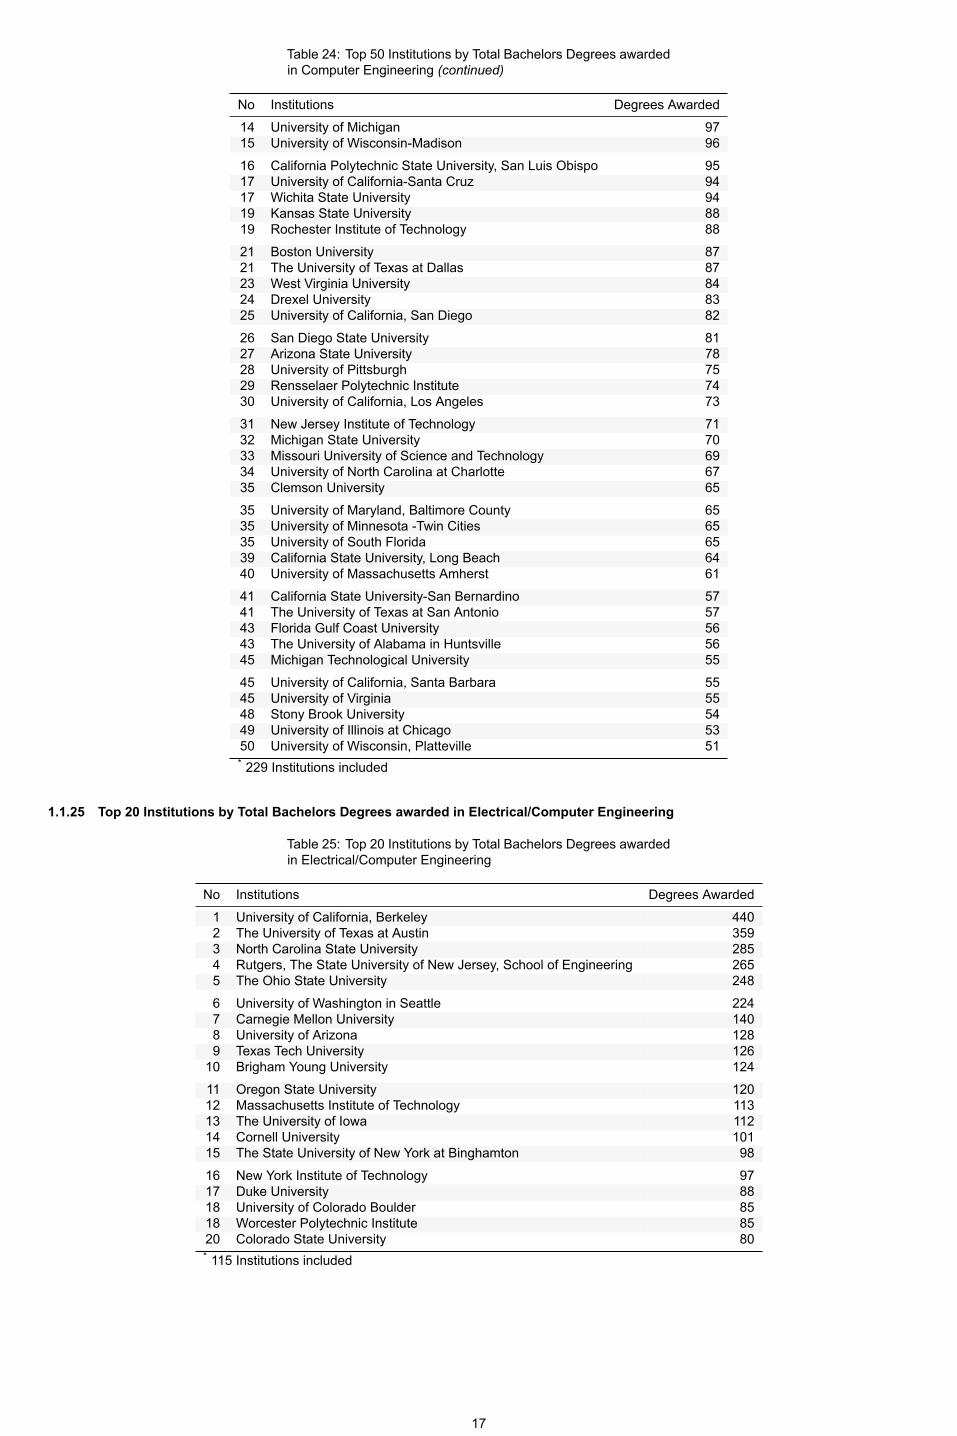
Table 24: Top 50 Institutions by Total Bachelors Degrees awardedin Computer Engineering (continued)
No Institutions Degrees Awarded
14 University of Michigan 9715 University of WisconsinMadison 9616 California Polytechnic State University, San Luis Obispo 9517 University of CaliforniaSanta Cruz 9417 Wichita State University 9419 Kansas State University 8819 Rochester Institute of Technology 8821 Boston University 8721 The University of Texas at Dallas 8723 West Virginia University 8424 Drexel University 8325 University of California, San Diego 8226 San Diego State University 8127 Arizona State University 7828 University of Pittsburgh 7529 Rensselaer Polytechnic Institute 7430 University of California, Los Angeles 7331 New Jersey Institute of Technology 7132 Michigan State University 7033 Missouri University of Science and Technology 6934 University of North Carolina at Charlotte 6735 Clemson University 6535 University of Maryland, Baltimore County 6535 University of Minnesota Twin Cities 6535 University of South Florida 6539 California State University, Long Beach 6440 University of Massachusetts Amherst 6141 California State UniversitySan Bernardino 5741 The University of Texas at San Antonio 5743 Florida Gulf Coast University 5643 The University of Alabama in Huntsville 5645 Michigan Technological University 5545 University of California, Santa Barbara 5545 University of Virginia 5548 Stony Brook University 5449 University of Illinois at Chicago 5350 University of Wisconsin, Platteville 51* 229 Institutions included
1.1.25 Top 20 Institutions by Total Bachelors Degrees awarded in Electrical/Computer Engineering
Table 25: Top 20 Institutions by Total Bachelors Degrees awardedin Electrical/Computer Engineering
No Institutions Degrees Awarded
1 University of California, Berkeley 4402 The University of Texas at Austin 3593 North Carolina State University 2854 Rutgers, The State University of New Jersey, School of Engineering 2655 The Ohio State University 2486 University of Washington in Seattle 2247 Carnegie Mellon University 1408 University of Arizona 1289 Texas Tech University 126
10 Brigham Young University 12411 Oregon State University 12012 Massachusetts Institute of Technology 11313 The University of Iowa 11214 Cornell University 10115 The State University of New York at Binghamton 9816 New York Institute of Technology 9717 Duke University 8818 University of Colorado Boulder 8518 Worcester Polytechnic Institute 8520 Colorado State University 80* 115 Institutions included
17

1.1.26 Top 20 Institutions by Total Bachelors Degrees awarded in Computer Science (outside engineering)
Table 26: Top 20 Institutions by Total Bachelors Degrees awardedin Computer Science (outside engineering)
No Institutions Degrees Awarded
1 University of California, Irvine 1,1422 University of California, Berkeley 7133 Georgia Institute of Technology 7064 University of Maryland, College Park 6615 University of WisconsinMadison 6356 Rutgers, The State University of New Jersey, School of Engineering 5727 Purdue University 4538 The University of Texas at Austin 4459 New Jersey Institute of Technology 407
10 University of Michigan 39911 University of North Carolina at Chapel Hill 37912 University of Massachusetts Amherst 33713 Northeastern University 33014 San Francisco State University 26515 Rensselaer Polytechnic Institute 25516 University of Virginia 25017 FAMUFSU College of Engineering 23818 Texas State University 23219 Duke University 21620 University of Pittsburgh 203* 156 Institutions included
1.1.27 Top 50 Institutions by Total Bachelors Degrees awarded in Computer Science (inside engineering)
Table 27: Top 50 Institutions by Total Bachelors Degrees awardedin Computer Science (inside engineering)
No Institutions Degrees Awarded1 Oregon State University 6512 Arizona State University 6233 The University of Texas at Dallas 6104 University of Michigan 5685 University of CaliforniaSanta Cruz 5506 Florida International University 5237 University of Central Florida 5198 University of Illinois at UrbanaChampaign 5089 University of California, San Diego 472
10 The Ohio State University 42111 University of Washington in Seattle 37512 Stony Brook University 34813 Texas A&M University 33614 Massachusetts Institute of Technology 33215 University of Minnesota Twin Cities 32916 Virginia Polytechnic Institute and State University 31017 Stanford University 30718 George Mason University 30419 University of California, Los Angeles 28220 University at Buffalo, SUNY 27921 Michigan State University 27522 University of Southern California 27323 Cornell University 26224 California State University, Fullerton 25925 University of Illinois at Chicago 25826 The University of Texas at Arlington 24926 University of Maryland, Baltimore County 24928 California Polytechnic State University, San Luis Obispo 24529 University of Colorado Boulder 23430 California State University, Northridge 23331 North Carolina State University 23232 University of Pennsylvania 23133 University of North Texas 22434 California State University, Long Beach 22035 California State University, Sacramento 21736 Auburn University 216
18

Table 27: Top 50 Institutions by Total Bachelors Degrees awardedin Computer Science (inside engineering) (continued)
No Institutions Degrees Awarded
37 University of Utah 20838 University of Florida 19639 Harvard University 19140 University of California, Riverside 18541 University of Virginia 18442 Portland State University 17942 Washington University in St. Louis 17944 Washington State University 17745 University of Arizona 16746 NYU Tandon School of Engineering 15846 Princeton University 15848 Clemson University 15748 University of WashingtonTacoma 15750 Oakland University 155* 159 Institutions included
1.1.28 Top 50 Institutions by Total Bachelors Degrees awarded in Engineering (General)
Table 28: Top 50 Institutions by Total Bachelors Degrees awardedin Engineering (General)
No Institutions Degrees Awarded
1 Dartmouth College 2262 Arizona State University 1903 Mercer University 1464 East Carolina University 1345 University of Wisconsin Stout 1146 McNeese State University 947 Stanford University 928 Calvin College 839 Olivet Nazarene University 79
10 James Madison University 7811 Geneva College 7212 Harvey Mudd College 6813 Messiah College 6114 Walla Walla University 5915 Hope College 5715 Montana Technological University 5717 Texas Christian University 5517 Vanderbilt University 5519 Wentworth Institute of Technology 5020 Smith College 4821 Loyola University Maryland 3921 Minnesota State UniversityMankato 3923 Frostburg State University 3823 North Carolina State University 3823 University of North Carolina at Asheville 3826 The University of TennesseeMartin 3727 Olin College of Engineering 3528 Western Carolina University 3429 Oral Roberts University 3330 University of Detroit Mercy 2831 University of Southern Indiana 2732 Elizabethtown College 2432 Fort Lewis College 2432 Swarthmore College 2435 Marshall University 2336 Trinity College 2237 Loyola University Chicago 2138 Bob Jones University 1938 Seattle Pacific University 1938 University of Maryland Eastern Shore 1941 Abilene Christian University 1741 California Polytechnic State University, San Luis Obispo 1741 The University of Mississippi 1744 Andrews University 1645 University of Rochester 1346 Brown University 1246 Northwest Nazarene University 1248 Hampton University 1048 Oklahoma State University 1048 Western Illinois University 10* 123 Institutions included
19

1.2 ENGINEERING UNDERGRADUATE ENROLLMENT, FALL 20201.2.1 Undergraduate Enrollment by Race, Ethnicity, and Gender
Table 29: Undergraduate Enrollment Awarded by Race, Ethnicity, and Gender 617,171*
Ethnicity Enrollments
Nonresident Alien Male 39,852Nonresident Alien Female 11,478Unknown Male 15,412Unknown Female 5,597Hispanic Male 66,093Hispanic Female 21,265White Male 242,095White Female 69,614Black or Afr. American Male 21,358Black or Afr. American Female 8,669Asian American Male 62,443Asian American Female 25,275American Indian Male 1,206American Indian Female 381Native Hawaiian/Other Pacfic Islander Male 720Native Hawaiian/Other Pacfic Islander Female 269Multiracial Male 18,568Multiracial Female 6,876Total Male 467,747Total Female 149,424* Total Enrollment includes is for full time students* Includes 3,245 male and 1,267 female.
39,852
11,478 15,4125,597
66,093
21,265
242,095
69,614
21,3588,669
62,443
25,275
1,206381 72026918,568
6,876
467,747
149,424
0
100,000
200,000
300,000
400,000
Nonre
siden
t Alie
n
Unkno
wn
Hispan
ic
Whit
e
Black o
r Afr.
Amer
Asian
Amer
Amer
ican
India
n
Pacific
Islan
der
Mult
iracia
lTo
tal
Female
Male
Undergraduate Enrollment by Race, Ethnicity, and Gender
1.2.2 Engineering Undergraduate Enrollment by Institutions
Table 30: Top 50 Engineering Undergraduate Enrollment by Institutions
No Institutions Enrollment
1 Texas A&M University 14,8082 Arizona State University 14,4433 University of Central Florida 11,2964 Purdue University 10,0465 Virginia Polytechnic Institute and State University 9,3266 University of Illinois at UrbanaChampaign 9,0527 Oregon State University 8,3228 Georgia Institute of Technology 8,2759 The Pennsylvania State University 7,982
10 Iowa State University 7,81411 The Ohio State University 7,71712 North Carolina State University 7,19313 University of Michigan 6,84314 George Mason University 6,69215 Florida International University 6,47916 The University of Texas at Dallas 6,442
20
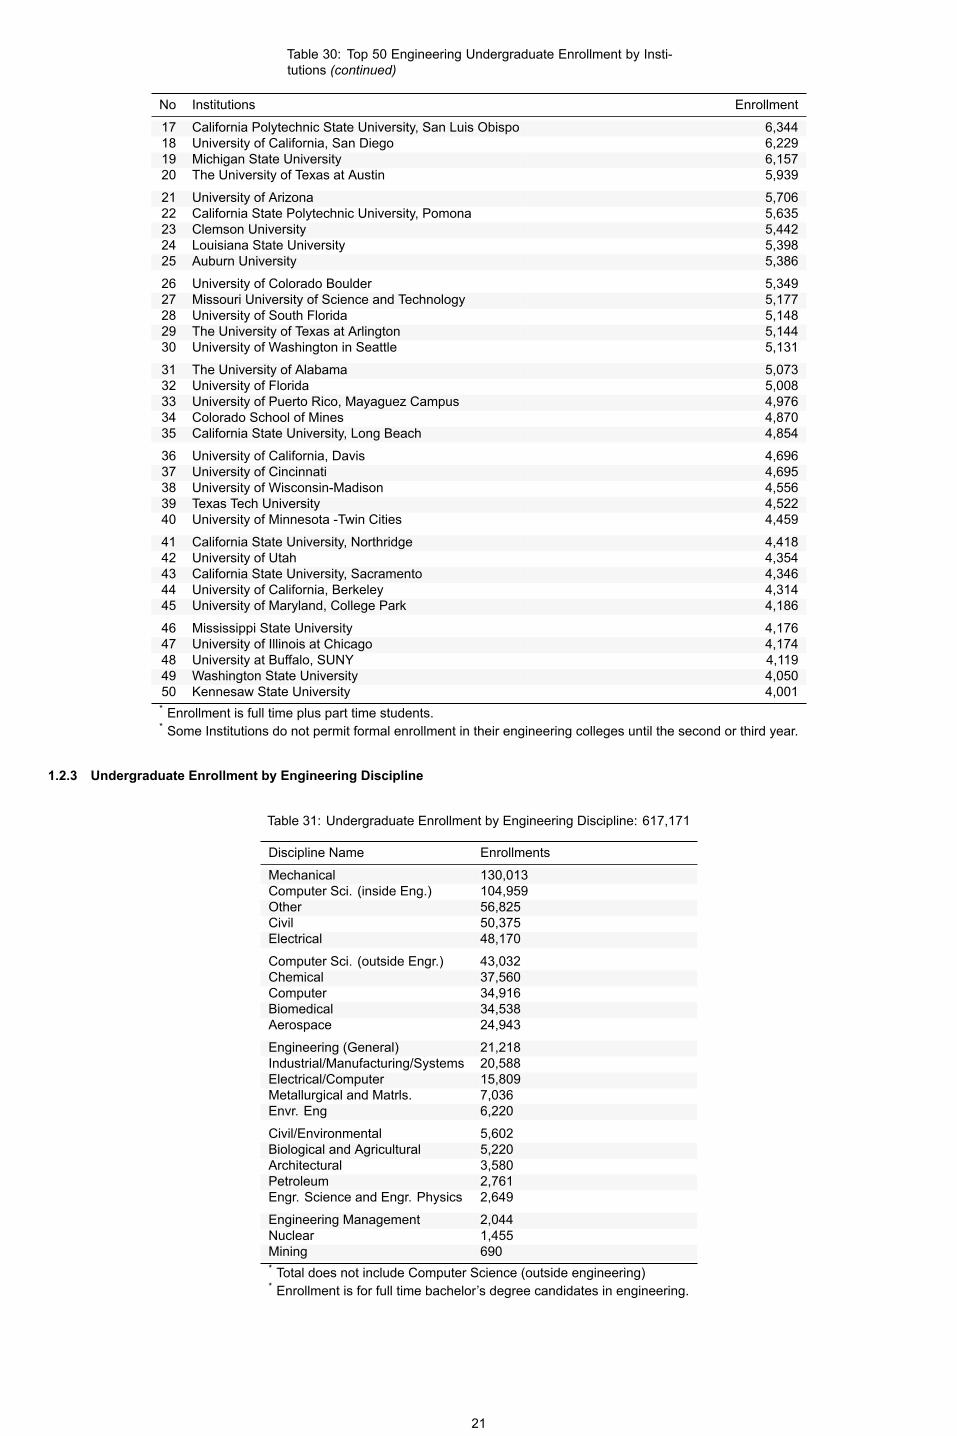
Table 30: Top 50 Engineering Undergraduate Enrollment by Institutions (continued)
No Institutions Enrollment
17 California Polytechnic State University, San Luis Obispo 6,34418 University of California, San Diego 6,22919 Michigan State University 6,15720 The University of Texas at Austin 5,93921 University of Arizona 5,70622 California State Polytechnic University, Pomona 5,63523 Clemson University 5,44224 Louisiana State University 5,39825 Auburn University 5,38626 University of Colorado Boulder 5,34927 Missouri University of Science and Technology 5,17728 University of South Florida 5,14829 The University of Texas at Arlington 5,14430 University of Washington in Seattle 5,13131 The University of Alabama 5,07332 University of Florida 5,00833 University of Puerto Rico, Mayaguez Campus 4,97634 Colorado School of Mines 4,87035 California State University, Long Beach 4,85436 University of California, Davis 4,69637 University of Cincinnati 4,69538 University of WisconsinMadison 4,55639 Texas Tech University 4,52240 University of Minnesota Twin Cities 4,45941 California State University, Northridge 4,41842 University of Utah 4,35443 California State University, Sacramento 4,34644 University of California, Berkeley 4,31445 University of Maryland, College Park 4,18646 Mississippi State University 4,17647 University of Illinois at Chicago 4,17448 University at Buffalo, SUNY 4,11949 Washington State University 4,05050 Kennesaw State University 4,001* Enrollment is full time plus part time students.* Some Institutions do not permit formal enrollment in their engineering colleges until the second or third year.
1.2.3 Undergraduate Enrollment by Engineering Discipline
Table 31: Undergraduate Enrollment by Engineering Discipline: 617,171
Discipline Name Enrollments
Mechanical 130,013Computer Sci. (inside Eng.) 104,959Other 56,825Civil 50,375Electrical 48,170Computer Sci. (outside Engr.) 43,032Chemical 37,560Computer 34,916Biomedical 34,538Aerospace 24,943Engineering (General) 21,218Industrial/Manufacturing/Systems 20,588Electrical/Computer 15,809Metallurgical and Matrls. 7,036Envr. Eng 6,220Civil/Environmental 5,602Biological and Agricultural 5,220Architectural 3,580Petroleum 2,761Engr. Science and Engr. Physics 2,649Engineering Management 2,044Nuclear 1,455Mining 690* Total does not include Computer Science (outside engineering)* Enrollment is for full time bachelor’s degree candidates in engineering.
21

130,013
104,959
56,82550,37548,170
43,03237,56034,91634,538
24,94321,21820,588
15,809
7,036 6,220 5,602 5,220 3,580 2,761 2,649 2,044 1,455 6900
50,000
100,000
Mec
hani
cal
Com
pute
r Sci
. (in
side
Eng
.)O
ther
Civ
ilE
lect
rical
Com
pute
r Sci
. (ou
tsid
e E
ngr.)
Che
mic
alC
ompu
ter
Bio
med
ical
Aer
ospa
ceE
ngin
eerin
g (G
ener
al)
Indu
stria
l/Man
ufac
turin
g/S
yste
ms
Ele
ctric
al/C
ompu
ter
Met
allu
rgic
al a
nd M
atrls
.E
nvr.
Eng
Civ
il/E
nviro
nmen
tal
Bio
logi
cal a
nd A
gric
ultu
ral
Arc
hite
ctur
alP
etro
leum
Eng
r. S
cien
ce a
nd E
ngr.
Phy
sics
Eng
inee
ring
Man
agem
ent
Nuc
lear
Min
ing
Undergraduate Enrollment by Engineering Discipline
1.2.4 Undergraduate Enrollment by Engineering Discipline:(Full time and Part time)
Table 32: Undergraduate Enrollment by Engineering Discipline:(Full time and Part time)
Discipline Name Full Time Part Time
Aerospace 24,943 1,425Architectural 3,580 159Biological and Agricultural 5,220 236Biomedical 34,538 1,487Chemical 37,560 2,344Civil 50,375 5,337Civil/Environmental 5,602 600Computer 34,916 3,446Computer Sci. (inside Eng.) 104,959 16,973Electrical 48,170 8,282Electrical/Computer 15,809 1,413Engineering (General) 21,218 1,169Engineering Management 2,044 185Engr. Science and Engr. Physics 2,649 184Envr. Eng 6,220 385Industrial/Manufacturing/Systems 20,588 2,145Mechanical 130,013 14,621Metallurgical and Matrls. 7,036 463Mining 690 82Nuclear 1,455 84Other 56,825 5,707Petroleum 2,761 266
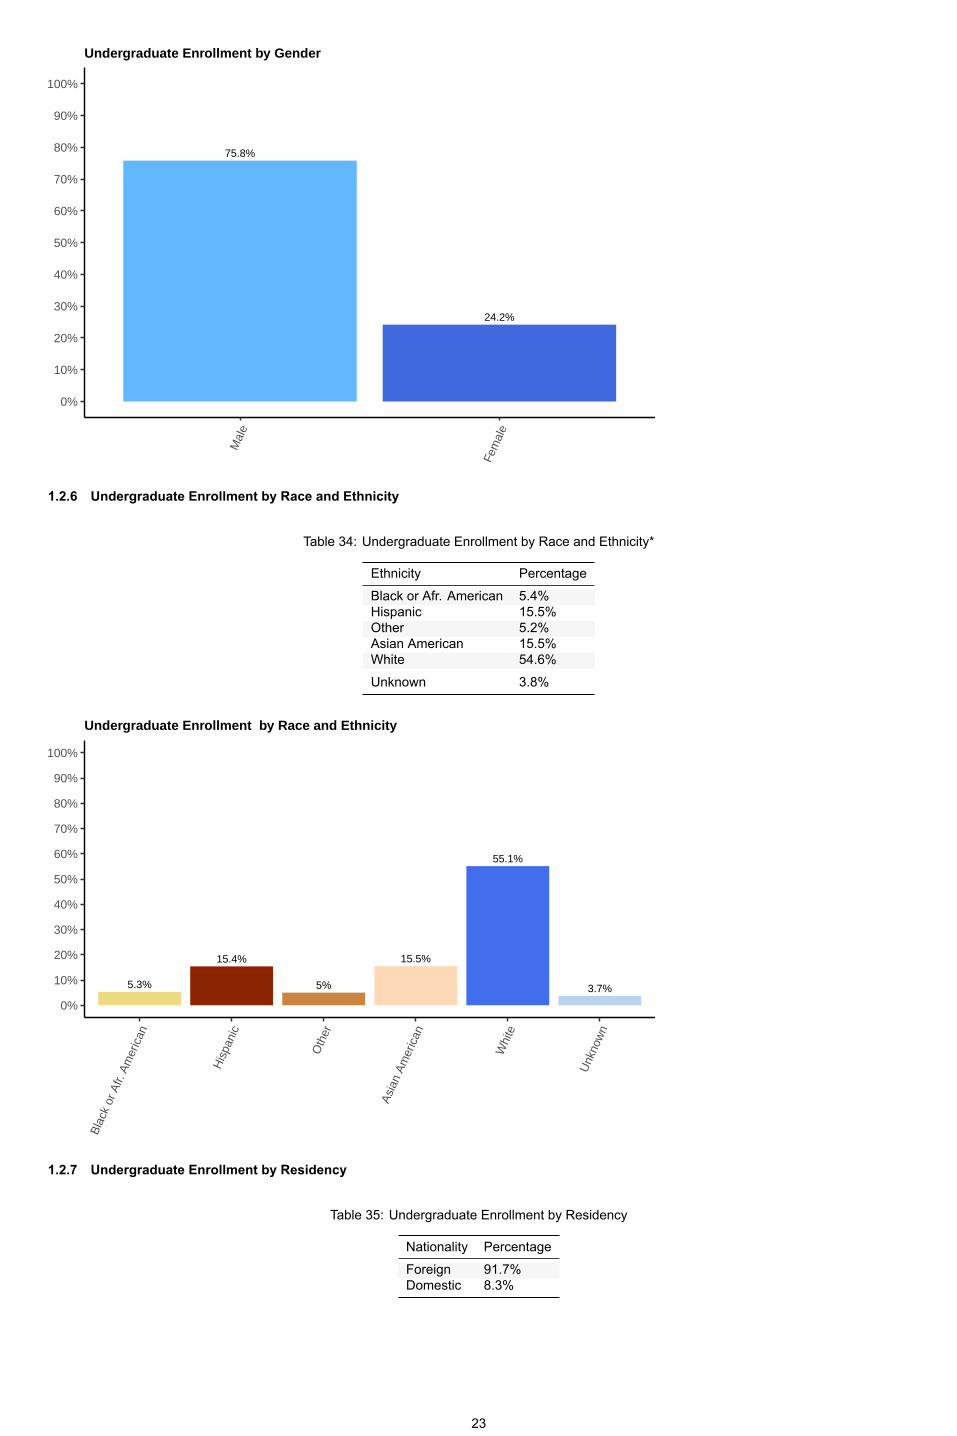
1.2.5 Undergraduate Enrollment by Gender
Table 33: Undergraduate Enrollment by Gender
Gender Percentage
Female 24.5%Male 75.5%
22
75.8%
24.2%
0%
10%
20%
30%
40%
50%
60%
70%
80%
90%
100%
Mal
e
Fem
ale
Undergraduate Enrollment by Gender
1.2.6 Undergraduate Enrollment by Race and Ethnicity
Table 34: Undergraduate Enrollment by Race and Ethnicity*
Ethnicity Percentage
Black or Afr. American 5.4%Hispanic 15.5%Other 5.2%Asian American 15.5%White 54.6%Unknown 3.8%
5.3%
15.4%
5%
15.5%
55.1%
3.7%
0%
10%
20%
30%
40%
50%
60%
70%
80%
90%
100%
Bla
ck o
r Afr.
Am
eric
an
His
pani
c
Oth
er
Asi
an A
mer
ican
Whi
te
Unk
now
n
Undergraduate Enrollment by Race and Ethnicity
1.2.7 Undergraduate Enrollment by Residency
Table 35: Undergraduate Enrollment by Residency
Nationality Percentage
Foreign 91.7%Domestic 8.3%
23

8.3%
91.7%
0%
10%
20%
30%
40%
50%
60%
70%
80%
90%
100%
Dom
estic
Fore
ign
Undergraduate Enrollment by Residency
24

2 ENGINEERING MASTERS
2.1 ENGINEERING MASTERS DEGREE2.1.1 Masters Degrees Awarded by Engineering Discipline
Table 36: Masters Degrees by discipline: 62,053
Discipline Name Degrees AwardedComputer Sci. (inside Eng.) 12,349Other 7,870Mechanical 7,863Electrical 5,440Electrical/Computer 4,857Civil 4,702Computer Sci. (outside Engr.) 4,649Industrial/Manufacturing/Systems 4,398Biomedical 2,538Engineering Management 2,164Computer 1,935Chemical 1,798Aerospace 1,501Metallurgical and Matrls. 1,295Engineering (General) 887Civil/Environmental 858Envr. Eng 561Nuclear 229Petroleum 221Engr. Science and Engr. Physics 211Biological and Agricultural 201Architectural 127Mining 48* Total does not include computer science (outside engineering).
12,349
7,870 7,863
5,440 4,857 4,702 4,649 4,398
2,538 2,164 1,935 1,798
1,501 1,295 887 858
561 229 221 211 201 127 48
0
4,000
8,000
12,000
Com
pute
r Sci
. (in
side
Eng
.)O
ther
Mec
hani
cal
Ele
ctric
alE
lect
rical
/Com
pute
r
Civ
il
Com
pute
r Sci
. (ou
tsid
e E
ngr.)
Indu
stria
l/Man
ufac
turin
g/S
yste
ms
Bio
med
ical
Eng
inee
ring
Man
agem
ent
Com
pute
rC
hem
ical
Aer
ospa
ce
Met
allu
rgic
al a
nd M
atrls
.E
ngin
eerin
g (G
ener
al)
Civ
il/E
nviro
nmen
tal
Env
r. E
ngN
ucle
arP
etro
leum
Eng
r. S
cien
ce a
nd E
ngr.
Phy
sics
Bio
logi
cal a
nd A
gric
ultu
ral
Arc
hite
ctur
alM
inin
gMasters Degrees Awarded by Engineering Discipline
25

2.1.2 Total Masters Degrees Awarded to Underrepresented Minorities by Engineering Discipline
Table 37: Masters Degrees Awarded to Underrepresented Minorities by Engineering Discipline: 4,403
Discipline Name Degrees Awarded
Mechanical 622Computer Sci. (inside Eng.) 601Other 591Civil 494Industrial/Manufacturing/Systems 308Electrical 275Engineering Management 259Electrical/Computer 256Biomedical 249Computer Sci. (outside Engr.) 244Chemical 116Engineering (General) 115Aerospace 106Civil/Environmental 102Computer 96Metallurgical and Matrls. 96Envr. Eng 46Nuclear 21Biological and Agricultural 14Petroleum 14Engr. Science and Engr. Physics 12Mining 6Architectural 4* Total does not include computer science (outside engineering).
2.1.3 Percentage of Masters Degrees Awarded to Underrepresented Minorities by Discipline
Table 38: Percentage of Masters Degrees Awarded to Underrepresented Minorities by Discipline 6.9 % of Total
Discipline Name Percent Women
Engineering (General) 13%Mining 12.5%Engineering Management 12%Civil/Environmental 11.9%Civil 10.5%Biomedical 9.8%Nuclear 9.2%Envr. Eng 8.2%Mechanical 7.9%Other 7.5%Metallurgical and Matrls. 7.4%Aerospace 7.1%Biological and Agricultural 7%Industrial/Manufacturing/Systems 7%Chemical 6.5%Petroleum 6.3%Engr. Science and Engr. Physics 5.7%Electrical/Computer 5.3%Computer Sci. (outside Engr.) 5.2%Electrical 5.1%Computer 5%Computer Sci. (inside Eng.) 4.9%Architectural 3.1%
2.1.4 Percentage of Masters Degrees Awarded to Women by Discipline
Table 39: Percentage of Masters Degrees Awarded to Women byDiscipline 28.1 % of Total
Discipline Name Percent Women
Envr. Eng 46.3%Biomedical 45.9%Civil/Environmental 43.4%Biological and Agricultural 40.3%Architectural 38.6%Chemical 33%Other 32.5%Industrial/Manufacturing/Systems 31.6%Engineering Management 30.5%Civil 30.3%
26

Table 39: Percentage of Masters Degrees Awarded to Women byDiscipline 28.1 % of Total (continued)
Discipline Name Percent Women
Computer Sci. (inside Eng.) 29.3%Computer Sci. (outside Engr.) 28.7%Metallurgical and Matrls. 28.5%Computer 27.7%Mining 25%Electrical/Computer 24.1%Electrical 23.1%Engineering (General) 20.3%Aerospace 18.1%Petroleum 17.2%Mechanical 17.1%Nuclear 17%Engr. Science and Engr. Physics 16.1%
46.3%45.9%43.4%
40.3% 38.6%
33% 32.5%31.6%30.5%30.3% 29.3% 28.7% 28.5%27.7%
25% 24.1% 23.1%20.3%
18.1% 17.2%17.1% 17% 16.1%
0%
10%
20%
30%
40%
50%
60%
Bio
med
ical
Env
r. E
ngC
ivil/
Env
ironm
enta
l
Bio
logi
cal a
nd A
gric
ultu
ral
Arc
hite
ctur
alC
hem
ical
Indu
stria
l/Man
ufac
turin
g/S
yste
ms
Oth
erC
ivil
Eng
inee
ring
Man
agem
ent
Com
pute
r Sci
. (in
side
Eng
.)
Com
pute
r Sci
. (ou
tsid
e E
ngr.)
Com
pute
r
Met
allu
rgic
al a
nd M
atrls
.M
inin
gE
lect
rical
/Com
pute
rE
lect
rical
Eng
inee
ring
(Gen
eral
)A
eros
pace
Mec
hani
cal
Nuc
lear
Petro
leum
Eng
r. S
cien
ce a
nd E
ngr.
Phy
sics
Percentage of Masters Degrees Awarded to Women by Discipline
2.1.5 Masters Degrees Awarded by Gender
Table 40: Masters Degrees Awarded by Gender
Gender 2010 2011 2012 2013 2014 2015 2016 2017 2018 2019 2020Female 23.00% 22.60% 22.60% 23.10% 23.90% 24.20% 25.40% 25.70% 26.70% 27.30% 28.10%Male 77.00% 77.40% 81.60% 76.90% 76.10% 75.80% 74.60% 74.30% 73.30% 72.70% 71.90%
71.9%
28.1%
0%
10%
20%
30%
40%
50%
60%
70%
80%
90%
100%
Mal
e
Fem
ale
Masters Degrees Awarded by Gender
27

2.1.6 Masters Degrees Awarded by Race and Ethnicity
Table 41: Masters Degrees Awarded by Ethnicity
Ethnicity 2010 2011 2012 2013 2014 2015 2016 2017 2018 2019 2020
Black or Afr. American 4.7% 5.1% 4.9% 4.7% 4.7% 4.4% 4.7% 4.7% 4.8% 4.8% 5.0%Hispanic 5.3% 6.0% 6.3% 7.3% 7.6% 7.7% 8.3% 8.5% 8.8% 9.2% 9.4%Other 17.4% 1.4% 1.5% 2.0% 2.2% 2.6% 3.0% 3.1% 3.8% 3.9% 3.6%Asian American 15.1% 14.9% 15.5% 14.5% 15.0% 14.5% 15.1% 15.1% 15.8% 16.3% 15.8%White 57.5% 60.9% 58.2% 59.7% 59.5% 60.2% 59.5% 60.1% 58.2% 55.4% 55.2%Unknown 0% 11.7% 13.6% 11.8% 11.0% 10.6% 9.4% 8.4% 8.6% 10.4% 10.9%
*Data on ethnicity does not include foreign nationals. American Indian/Alaska Native (0.2%), Native Hawaiian/Other Pacfic Islander(0.2%) andMultiracial (3.3%) are combined under Other.
5%9.4%
3.6%
15.8%
55.2%
10.9%
0%
10%
20%
30%
40%
50%
60%
70%
80%
90%
100%
Bla
ck o
r Afr.
Am
eric
an
His
pani
c
Oth
er
Asi
an A
mer
ican
Whi
te
Unk
now
n
Masters Degrees Awarded by Race and Ethnicity
2.1.7 Masters Degrees Awarded by Residency
Table 42: Masters Degrees Awarded by Residency
Nationality 2010 2011 2012 2013 2014 2015 2016 2017 2018 2019 2020
Foreign 46.1% 44.4% 43.3% 45.3% 47.5% 52.6% 58.1% 59.2% 57.1% 53.6% 53.2%Domestic 53.9% 55.6% 56.7% 54.7% 52.5% 47.4% 41.9% 40.8% 42.9% 46.4% 46.8%
53.2%
46.8%
0%
10%
20%
30%
40%
50%
60%
70%
80%
90%
100%
Dom
estic
Fore
ign
Masters Degrees Awarded by Residency
28

2.1.8 Masters Degrees Awarded by Race, Ethnicity, and Gender
Table 43: Masters Degrees Awarded by Race, Ethnicity, and Gender 62,053*
Ethnicity Degrees Awarded
Nonresident Alien Male 22,880Nonresident Alien Female 9,422Unknown Male 2,143Unknown Female 1,092Hispanic Male 2,068Hispanic Female 740White Male 12,463White Female 3,966Black or Afr. American Male 1,044Black or Afr. American Female 440Asian American Male 3,260Asian American Female 1,451American Indian Male 48American Indian Female 18Native Hawaiian/Other Pacfic Islander Male 36Native Hawaiian/Other Pacfic Islander Female 9Multiracial Male 692Multiracial Female 281Total Male 44,634Total Female 17,419* Total degree includes 0 total Non binary graduates and 0 total Other Gender graduates.* Includes 44 male and 13 female graduates from Puerto Rico.
22,880
9,422
2,1431,092
2,068740
12,463
3,966
1,044440
3,260
1,4514818 369 692281
44,634
17,419
0
10,000
20,000
30,000
40,000
Nonre
siden
t Alie
n
Unkno
wn
Hispan
ic
Whit
e
Black o
r Afr.
Amer
Asian
Amer
Amer
ican
India
n
Pacific
Islan
der
Mult
iracia
lTo
tal
Female
Male
Master...s Degrees Awarded by Race, Ethnicity, and Gender
2.1.9 Top 50 Institutions Awarding Engineering Masters Degrees
Table 44: Top 50 Institutions Awarding Engineering Masters Degrees
No Institutions Degrees Awarded1 University of Southern California 2,6022 Northeastern University 2,3373 Carnegie Mellon University 1,7834 Fu Foundation School of Engineering and Applied Science Columbia University 1,7165 Georgia Institute of Technology 1,4696 Arizona State University 1,3087 Cornell University 1,1898 University of Michigan 1,1509 Stanford University 1,143
10 University of Illinois at UrbanaChampaign 1,05311 North Carolina State University 1,01712 University of California, San Diego 1,01113 The University of Texas at Arlington 92814 NYU Tandon School of Engineering 92615 University of California, Berkeley 910
29

Table 44: Top 50 Institutions Awarding Engineering Masters Degr(continued)
No Institutions Degrees Awarded16 University at Buffalo, SUNY 88717 San Jose State University 85918 Texas A&M University 85419 The George Washington University 83520 University of Washington in Seattle 82921 New Jersey Institute of Technology 82622 The University of Texas at Dallas 80123 Massachusetts Institute of Technology 76824 University of Florida 73325 Northwestern University 72626 University of Pennsylvania 70627 University of Colorado Boulder 65728 Purdue University 63229 The Johns Hopkins University 62230 George Mason University 59431 University of California, Los Angeles 58232 Illinois Institute of Technology 51933 University of Maryland, College Park 51434 University of California, Irvine 50835 Stony Brook University 48036 Duke University 47537 Washington University in St. Louis 47338 University of WisconsinMadison 46939 Syracuse University 46340 Boston University 45240 University of MichiganDearborn 45242 The University of Texas at Austin 45043 University of Central Florida 44244 Virginia Polytechnic Institute and State University 44045 Rochester Institute of Technology 43446 Clemson University 42947 University of Cincinnati 42048 The Ohio State University 41149 The State University of New York at Binghamton 41050 University of Maryland, Baltimore County 384* 429 Institutions included
2.1.10 Top 20 Institutions by Total Masters Degrees awarded to Underrepresented Minorities
Table 45: Top 20 Institutions by Total Masters Degrees awarded toUnderrepresented Minorities
No Institutions Degrees Awarded1 New Jersey Institute of Technology 1812 Florida International University 1553 The University of Texas at El Paso 1434 The George Washington University 995 University of Central Florida 976 University of Southern California 887 Stanford University 878 Arizona State University 718 Georgia Institute of Technology 71
10 Massachusetts Institute of Technology 7011 Carnegie Mellon University 6711 Cornell University 6713 University of Florida 6414 George Mason University 6014 University of Washington in Seattle 6016 Southern Methodist University 5716 University of Puerto Rico, Mayaguez Campus 5718 University of Maryland, Baltimore County 5519 The University of Texas at Arlington 5420 Texas A&M University 53* 429 Institutions included
2.1.11 Top 50 Institutions by Percentage of Masters Degrees awarded to Underrepresented Minorities
Table 46: Top 50 Institutions by Percentage of Masters Degreesawarded to Underrepresented Minorities
No Institutions Percent Underrepresented Minorities1 Hampton University 100%1 University of Puerto Rico, Mayaguez Campus 100%3 Alabama A & M University 86.7%4 The University of Texas Rio Grande Valley 81.4%5 The University of Texas at El Paso 66.8%6 North Carolina A&T State University 56.5%7 Virginia State University 52.9%8 Prairie View A & M University 51.5%
30

Table 46: Top 50 Institutions by Percentage of Masters Degreesawarded to Underrepresented Minorities (continued)
No Institutions Percent Underrepresented Minorities9 Morgan State University 50%9 Tuskegee University 50%9 West Texas A & M University 50%
12 Florida International University 44.3%13 Thomas Jefferson University 42.9%14 Christian Brothers University 36.4%15 New Mexico State University 35.3%16 East Carolina University 33.3%16 Florida Polytechnic University 33.3%16 Howard University 33.3%16 University of the District of Columbia 33.3%16 Wentworth Institute of Technology 33.3%21 St. Mary’s University 31.8%22 Norwich University 31%23 University of Nevada, Las Vegas 30.6%24 Florida Atlantic University 29.3%25 Tennessee State University 28%26 California State University, Los Angeles 27.1%27 Kennesaw State University 27%28 Loyola Marymount University 26.5%29 The University of Texas at Tyler 26.3%30 University of Tennessee, Chattanooga 26.1%31 The University of New Mexico 25.8%32 Jackson State University 25%32 New Mexico Institute of Mining and Technology 25%34 University of Hartford 22.5%35 California State University, Long Beach 22.2%35 Princeton University 22.2%37 University of Central Florida 21.9%38 New Jersey Institute of Technology 21.9%39 Idaho State University 21.4%40 The University of Texas at San Antonio 21.2%41 Arkansas State University 20%41 Florida Gulf Coast University 20%41 University of Hawaii at Manoa 20%41 Western Kentucky University 20%45 University of the Pacific 19.6%46 Georgia Southern University 19.2%47 Manhattan College 19%48 University of Miami 19%49 University of St. Thomas 18.3%50 Oregon Institute of Technology 18.2%* 429 Institutions included
2.1.12 Top 20 Institutions Awarding Highest Percentage of Masters Degrees to Women
Table 47: Top 20 Highest Percentage of Masters Degrees toWomen
No Institutions Percent Women
1 Thomas Jefferson University 71.4%2 University of South Dakota 66.7%2 Wentworth Institute of Technology 66.7%4 Tulane University 54.8%5 University of WashingtonTacoma 52.2%6 Fairleigh Dickinson UniversityMetropolitan Campus 50%6 Frostburg State University 50%6 University of Southern Mississippi 50%9 Virginia State University 49%
10 Princeton University 48.1%11 Alabama A & M University 46.7%12 State University of New York at New Paltz 46.2%13 Fairfield University 46%14 California State UniversityEast Bay 45.7%15 North Carolina A&T State University 45.2%16 Texas State University 42.9%17 University of HoustonClear Lake 40.5%18 The Catholic University of America 40.3%19 Bucknell University 40%20 Fu Foundation School of Engineering and Applied Science Columbia University 39.6%* 429 included
2.1.13 Top 20 Institutions by Total Masters Degrees awarded in Engineering (General)
31
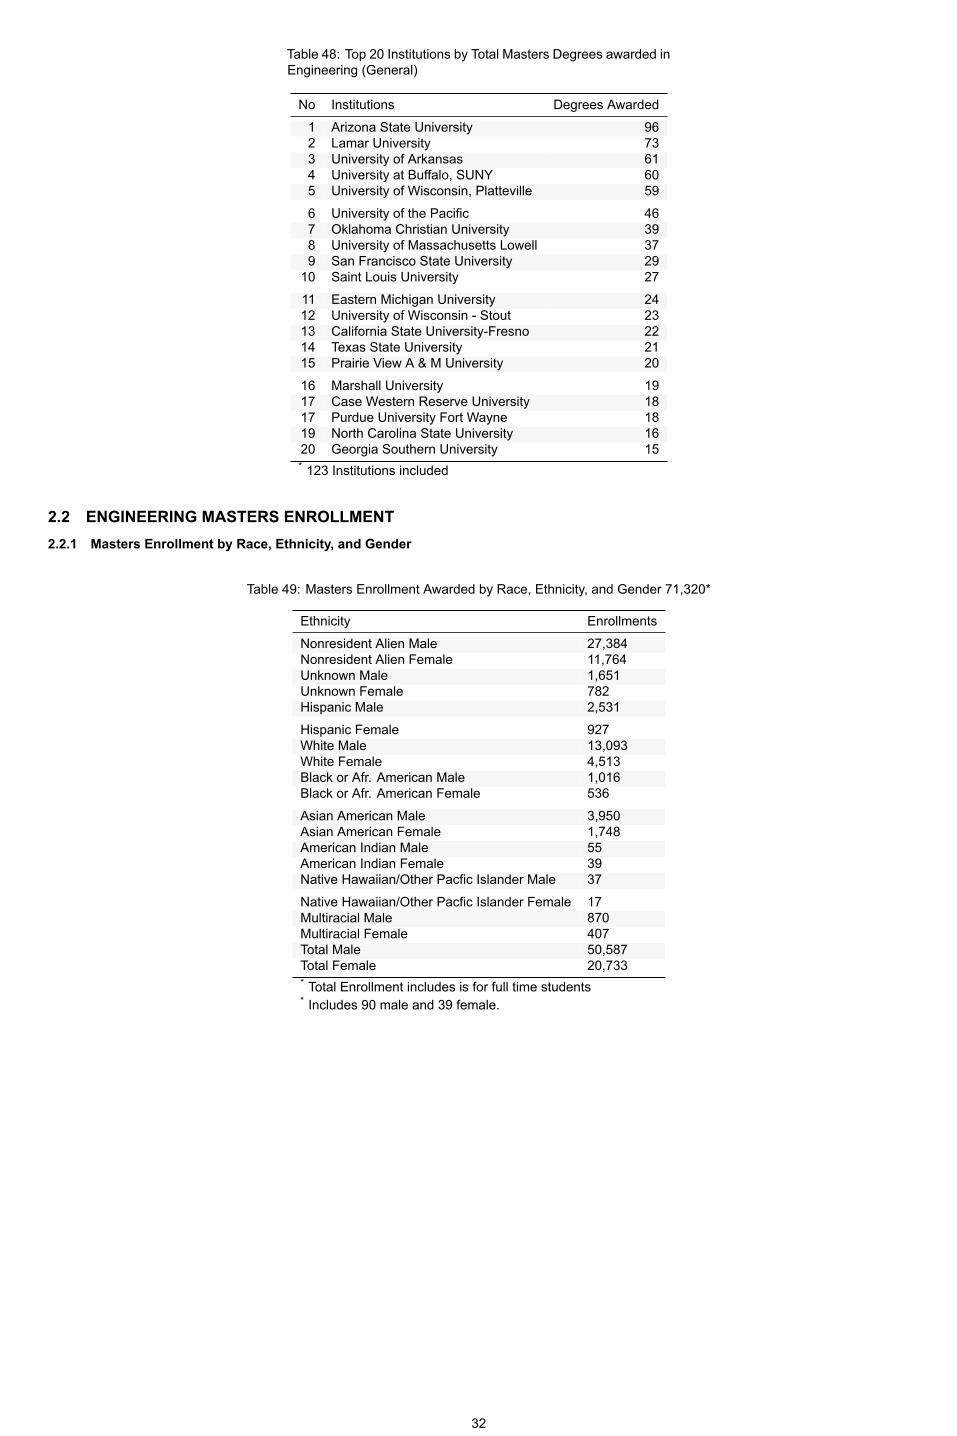
Table 48: Top 20 Institutions by Total Masters Degrees awarded inEngineering (General)
No Institutions Degrees Awarded
1 Arizona State University 962 Lamar University 733 University of Arkansas 614 University at Buffalo, SUNY 605 University of Wisconsin, Platteville 596 University of the Pacific 467 Oklahoma Christian University 398 University of Massachusetts Lowell 379 San Francisco State University 29
10 Saint Louis University 2711 Eastern Michigan University 2412 University of Wisconsin Stout 2313 California State UniversityFresno 2214 Texas State University 2115 Prairie View A & M University 2016 Marshall University 1917 Case Western Reserve University 1817 Purdue University Fort Wayne 1819 North Carolina State University 1620 Georgia Southern University 15* 123 Institutions included
2.2 ENGINEERING MASTERS ENROLLMENT2.2.1 Masters Enrollment by Race, Ethnicity, and Gender
Table 49: Masters Enrollment Awarded by Race, Ethnicity, and Gender 71,320*
Ethnicity Enrollments
Nonresident Alien Male 27,384Nonresident Alien Female 11,764Unknown Male 1,651Unknown Female 782Hispanic Male 2,531Hispanic Female 927White Male 13,093White Female 4,513Black or Afr. American Male 1,016Black or Afr. American Female 536Asian American Male 3,950Asian American Female 1,748American Indian Male 55American Indian Female 39Native Hawaiian/Other Pacfic Islander Male 37Native Hawaiian/Other Pacfic Islander Female 17Multiracial Male 870Multiracial Female 407Total Male 50,587Total Female 20,733* Total Enrollment includes is for full time students* Includes 90 male and 39 female.
32

27,384
11,764
1,651782
2,531927
13,093
4,513
1,016536
3,950
1,7485539 3717
870407
50,587
20,733
0
10,000
20,000
30,000
40,000
50,000
Nonre
siden
t Alie
n
Unkno
wn
Hispan
ic
Whit
e
Black o
r Afr.
Amer
Asian
Amer
Amer
ican
India
n
Pacific
Islan
der
Mult
iracia
lTo
tal
Female
Male
Masters Enrollment by Race, Ethnicity, and Gender
2.2.2 Top 50 Institutions with Highest Graduate Enrollment
Table 50: Top 50 Institutions with Highest Graduate Enrollment*
No Institutions Enrollment
1 University of Southern California 5,4872 University of Illinois at UrbanaChampaign 4,8143 Arizona State University 4,3744 Fu Foundation School of Engineering and Applied Science Columbia University 4,0795 Georgia Institute of Technology 3,9466 Northeastern University 3,9167 University of Michigan 3,4368 Texas A&M University 3,3269 Stanford University 3,307
10 Massachusetts Institute of Technology 3,16811 University of Pennsylvania 3,06312 NYU Tandon School of Engineering 3,06113 Purdue University 2,92614 University of California, San Diego 2,87915 North Carolina State University 2,87416 University of Washington in Seattle 2,86417 University of Arizona 2,68718 Cornell University 2,56819 University of Florida 2,45520 Carnegie Mellon University 2,34521 The Pennsylvania State University 2,20922 Northwestern University 2,20523 University of California, Los Angeles 2,18624 Virginia Polytechnic Institute and State University 2,16825 The University of Texas at Arlington 2,14326 University of California, Berkeley 2,11727 University of Colorado Boulder 2,07028 The University of Texas at Austin 2,00229 University at Buffalo, SUNY 1,95330 The Johns Hopkins University 1,91431 University of Central Florida 1,84532 The University of Texas at Dallas 1,80633 George Mason University 1,77434 University of Minnesota Twin Cities 1,71135 The Ohio State University 1,70236 San Jose State University 1,66337 The George Washington University 1,50638 University of Maryland, College Park 1,48939 University of WisconsinMadison 1,46340 Washington University in St. Louis 1,40941 Stony Brook University 1,40142 Colorado School of Mines 1,33543 Clemson University 1,33244 University of Utah 1,29945 University of California, Davis 1,24846 University of Maryland, Baltimore County 1,24047 Oregon State University 1,218
33

Table 50: Top 50 Institutions with Highest Graduate Enrollment*(continued)
No Institutions Enrollment
48 University of Illinois at Chicago 1,17549 University of MichiganDearborn 1,15250 University of Cincinnati 1,139* 50 Institutions reported.Includes both part time and full time.
2.2.3 Masters Enrollment by Engineering Discipline:(Full time and Part time)
Table 51: Masters Enrollment by Engineering Discipline:(Full time and Part time)
Discipline Name Full Time Part Time
Aerospace 2,197 1,160Architectural 151 17Biological and Agricultural 334 85Biomedical 3,398 924Chemical 1,944 617Civil 4,818 3,168Civil/Environmental 1,162 421Computer 2,529 1,068Computer Sci. (inside Eng.) 15,042 9,930Electrical 5,441 3,787Electrical/Computer 5,500 2,225Engineering (General) 663 1,090Engineering Management 2,215 3,116Engr. Science and Engr. Physics 151 109Envr. Eng 709 385Industrial/Manufacturing/Systems 4,072 4,219Mechanical 9,096 4,878Metallurgical and Matrls. 1,342 577Mining 107 69Nuclear 307 102Other 9,872 5,918Petroleum 270 122
2.2.4 Masters Enrollment by Gender
Table 52: Masters Enrollment by Gender
Gender Percentage
Female 29.5%Male 70.5%
70.9%
29.1%
0%
10%
20%
30%
40%
50%
60%
70%
80%
90%
100%
Mal
e
Fem
ale
Masters Enrollment Degrees Awarded by Gender
34

2.2.5 Masters Enrollment by Race and Ethnicity
Table 53: Masters Enrollment by Race and Ethnicity*
Ethnicity Percentage
Black or Afr. American 5.1%Hispanic 10.8%Other 5.6%Asian American 17.6%White 53.1%Unknown 7.7%
4.8%10.7%
4.4%
17.7%
54.7%
7.6%
0%
10%
20%
30%
40%
50%
60%
70%
80%
90%
100%
Bla
ck o
r Afr.
Am
eric
an
His
pani
c
Oth
er
Asi
an A
mer
ican
Whi
te
Unk
now
n
Masters Enrollment by Race and Ethnicity
2.2.6 Masters Enrollment by Residency
Table 54: Masters Enrollment by Residency
Nationality Percentage
Foreign 54%Domestic 46%
54.9%
45.1%
0%
10%
20%
30%
40%
50%
60%
70%
80%
90%
100%
Dom
estic
Fore
ign
Masters Enrollment by Residency
35

3 ENGINEERING DOCTORAL
3.1 ENGINEERING DOCTORAL DEGREES3.1.1 Doctoral Degrees Awarded by Engineering Discipline
Table 55: Doctoral Degrees by discipline: 12,380
Discipline Name Degrees AwardedMechanical 1,686Electrical/Computer 1,334Computer Sci. (inside Eng.) 1,273Electrical 1,138Chemical 1,085Biomedical 991Civil 899Metallurgical and Matrls. 721Other 720Industrial/Manufacturing/Systems 561Computer Sci. (outside Engr.) 540Aerospace 466Civil/Environmental 307Computer 235Nuclear 174Envr. Eng 156Biological and Agricultural 151Engr. Science and Engr. Physics 142Petroleum 137Engineering (General) 123Engr. Management 47Mining 24Architectural 10* Total does not include computer science (outside engineering).
1,686
1,3341,273
1,1381,085
991 899
721 720
561 540 466
307 235
174 156 151 142 137 123 47 24 10
0
500
1,000
1,500
Mec
hani
cal
Ele
ctric
al/C
ompu
ter
Com
pute
r Sci
. (in
side
Eng
.)E
lect
rical
Che
mic
alB
iom
edic
al
Civ
il
Met
allu
rgic
al a
nd M
atrls
.O
ther
Indu
stria
l/Man
ufac
turin
g/S
yste
ms
Com
pute
r Sci
. (ou
tsid
e E
ngr.)
Aer
ospa
ceC
ivil/
Env
ironm
enta
lC
ompu
ter
Nuc
lear
Env
r. E
ng
Bio
logi
cal a
nd A
gric
ultu
ral
Eng
r. S
cien
ce a
nd E
ngr.
Phy
sics
Pet
role
umE
ngin
eerin
g (G
ener
al)
Eng
r. M
anag
emen
tM
inin
gA
rchi
tect
ural
Doctoral Degrees Awarded by Engineering Discipline
36
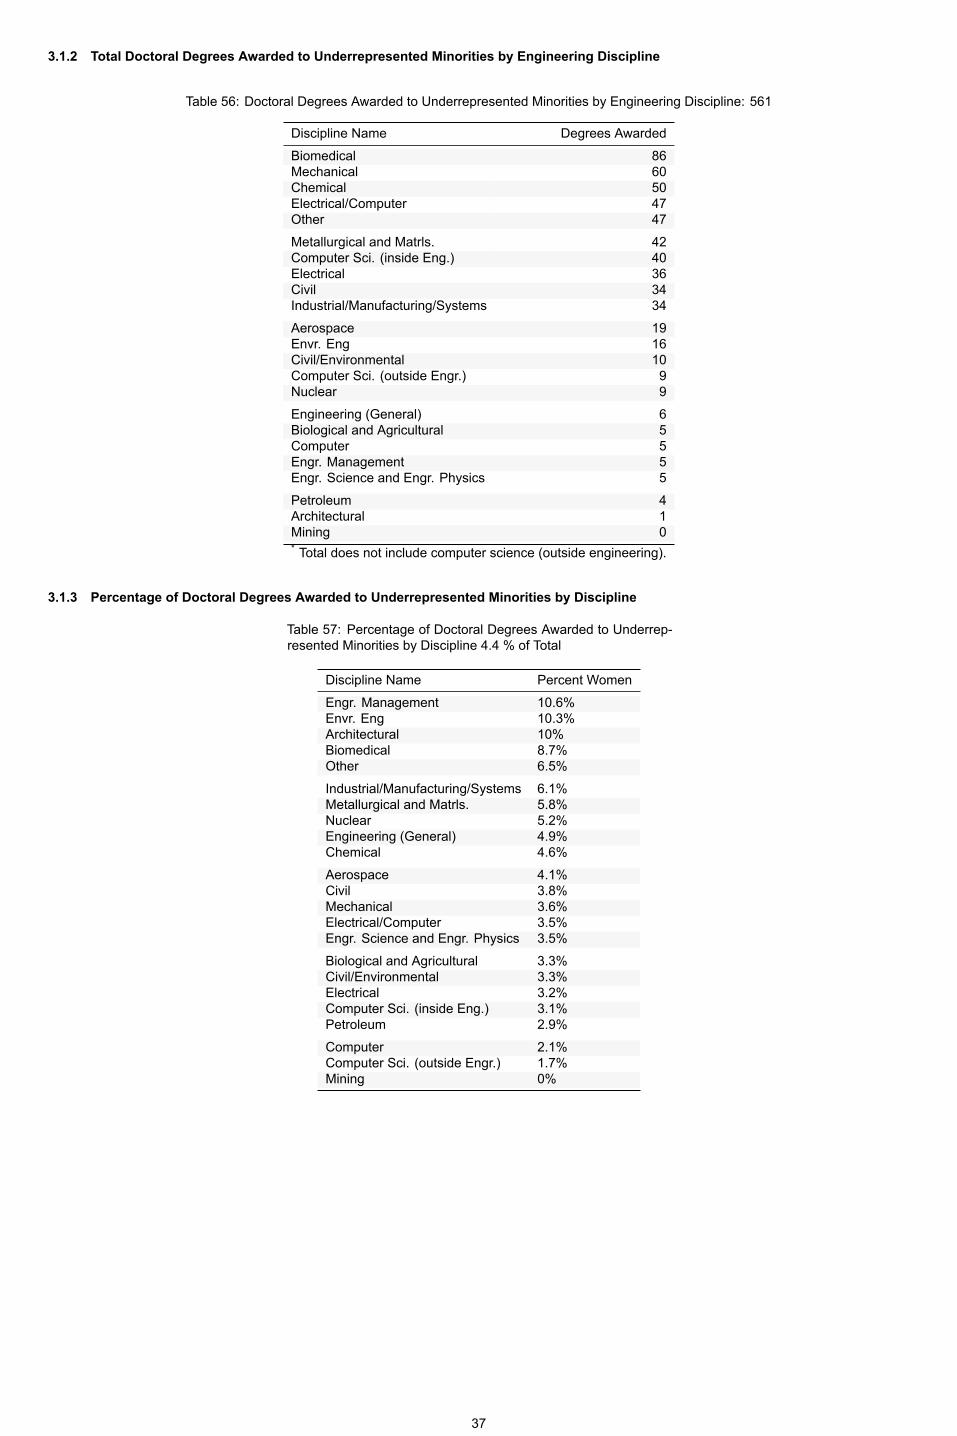
3.1.2 Total Doctoral Degrees Awarded to Underrepresented Minorities by Engineering Discipline
Table 56: Doctoral Degrees Awarded to Underrepresented Minorities by Engineering Discipline: 561
Discipline Name Degrees Awarded
Biomedical 86Mechanical 60Chemical 50Electrical/Computer 47Other 47Metallurgical and Matrls. 42Computer Sci. (inside Eng.) 40Electrical 36Civil 34Industrial/Manufacturing/Systems 34Aerospace 19Envr. Eng 16Civil/Environmental 10Computer Sci. (outside Engr.) 9Nuclear 9Engineering (General) 6Biological and Agricultural 5Computer 5Engr. Management 5Engr. Science and Engr. Physics 5Petroleum 4Architectural 1Mining 0* Total does not include computer science (outside engineering).
3.1.3 Percentage of Doctoral Degrees Awarded to Underrepresented Minorities by Discipline
Table 57: Percentage of Doctoral Degrees Awarded to Underrepresented Minorities by Discipline 4.4 % of Total
Discipline Name Percent Women
Engr. Management 10.6%Envr. Eng 10.3%Architectural 10%Biomedical 8.7%Other 6.5%Industrial/Manufacturing/Systems 6.1%Metallurgical and Matrls. 5.8%Nuclear 5.2%Engineering (General) 4.9%Chemical 4.6%Aerospace 4.1%Civil 3.8%Mechanical 3.6%Electrical/Computer 3.5%Engr. Science and Engr. Physics 3.5%Biological and Agricultural 3.3%Civil/Environmental 3.3%Electrical 3.2%Computer Sci. (inside Eng.) 3.1%Petroleum 2.9%Computer 2.1%Computer Sci. (outside Engr.) 1.7%Mining 0%
37

3.1.4 Percentage of Doctoral Degrees Awarded to Women by Discipline
Table 58: Percentage of Doctoral Degrees Awarded to Women byDiscipline 24 % of Total
Discipline Name Percent WomenEnvr. Eng 43.6%Biological and Agricultural 39.1%Biomedical 39.1%Civil/Environmental 32.2%Industrial/Manufacturing/Systems 31.2%Engineering (General) 30.1%Engr. Management 29.8%Chemical 29.4%Metallurgical and Matrls. 29.3%Other 29.2%Engr. Science and Engr. Physics 28.9%Civil 26.8%Computer 25.1%Nuclear 21.8%Computer Sci. (inside Eng.) 19.7%Computer Sci. (outside Engr.) 19.4%Electrical 18.3%Electrical/Computer 16.9%Aerospace 16.1%Mechanical 15.7%Petroleum 10.2%Architectural 10%Mining 8.3%
43.6%
39.1% 39.1%
32.2% 31.2% 30.1% 29.8% 29.4% 29.3% 29.2%28.9%26.8%
25.1%21.8%
19.7% 19.4% 18.3% 16.9% 16.1% 15.7%
10.2%10%8.3%
0%
10%
20%
30%
40%
50%
60%
Env
r. E
ng
Bio
logi
cal a
nd A
gric
ultu
ral
Bio
med
ical
Civ
il/E
nviro
nmen
tal
Indu
stria
l/Man
ufac
turin
g/S
yste
ms
Eng
inee
ring
(Gen
eral
)E
ngr.
Man
agem
ent
Che
mic
al
Eng
r. S
cien
ce a
nd E
ngr.
Phy
sics
Met
allu
rgic
al a
nd M
atrls
.O
ther
Civ
ilC
ompu
ter
Nuc
lear
Com
pute
r Sci
. (in
side
Eng
.)
Com
pute
r Sci
. (ou
tsid
e E
ngr.)
Ele
ctric
al
Ele
ctric
al/C
ompu
ter
Aer
ospa
ceM
echa
nica
lA
rchi
tect
ural
Petro
leum
Min
ing
Percentage of Doctoral Degrees Awarded to Women by Discipline
3.1.5 Doctoral Degrees Awarded by Gender
Table 59: Doctoral Degrees Awarded by Gender
Gender 2010 2011 2012 2013 2014 2015 2016 2017 2018 2019 2020
Female 21.20% 22.90% 21.80% 22.20% 22.40% 22.20% 23.30% 23.50% 23.60% 24.10% 76.00%Male 78.80% 77.10% 78.20% 77.80% 77.60% 77.80% 76.70% 76.50% 76.40% 75.90% 24.00%
38

76%
24%
0%
10%
20%
30%
40%
50%
60%
70%
80%
90%
100%
Mal
e
Fem
ale
Doctoral Degrees Awarded by Gender
3.1.6 Doctoral Degrees Awarded by Race and Ethnicity
Table 60: Doctoral Degrees Awarded by Ethnicity
Ethnicity 2010 2011 2012 2013 2014 2015 2016 2017 2018 2019 2020
Black or Afr. American 4.4% 3.5% 4.1% 4.1% 3.6% 3.2% 4.4% 3.8% 4.2% 3.9% 3.6%Hispanic 5.2% 4.2% 4.1% 4.7% 5.1% 6.1% 5.7% 6.3% 6.0% 6.1% 6.9%Other 1.0% 1.6% 1.7% 1.7% 1.6% 2.2% 3.1% 2.9% 2.9% 2.8% 3.6%Asian American 14.0% 15.1% 14.1% 13.5% 10.4% 14.1% 14.9% 14.8% 13.9% 15.3% 15.4%White 65.7% 60.3% 61.1% 61.8% 65.1% 62.9% 62.0% 62.2% 62.0% 61.1% 60.8%Unknown 9.7% 15.3% 14.9% 14.2% 14.2% 11.5% 9.9% 10.0% 11.1% 10.8% 9.7%
3.6%6.9%
3.6%
15.4%
60.8%
9.7%
0%
10%
20%
30%
40%
50%
60%
70%
80%
90%
100%
Bla
ck o
r Afr.
Am
eric
an
His
pani
c
Oth
er
Asi
an A
mer
ican
Whi
te
Unk
now
n
Doctoral Degrees Awarded by Race and Ethnicity
39

3.1.7 Doctoral Degrees Awarded by Residency
Table 61: Doctoral Degrees Awarded by Residency
Nationality 2010 2011 2012 2013 2014 2015 2016 2017 2018 2019 2020
Foreign 54.2% 54.2% 53.3% 55.1% 54.8% 54.7% 54.8% 55.7% 56.3% 56.5% 58.7%Domestic 45.8% 45.8% 46.7% 44.9% 45.2% 45.3% 45.2% 44.3% 43.7% 43.5% 41.3%
58.7%
41.3%
0%
10%
20%
30%
40%
50%
60%
70%
80%
90%
100%
Dom
estic
Fore
ign
Doctoral Degrees Awarded by Residency
3.1.8 Doctoral Degrees Awarded by Race, Ethnicity, and Gender
Table 62: Doctoral Degrees Awarded by Race, Ethnicity, and Gender 12,380*
Ethnicity Degrees
Nonresident Alien Male 5,564Nonresident Alien Female 1,646Unknown Male 371Unknown Female 128Hispanic Male 249Hispanic Female 109White Male 2,368White Female 776Black or Afr. American Male 120Black or Afr. American Female 66Asian American Male 566Asian American Female 232American Indian Male 8American Indian Female 4Native Hawaiian/Other Pacfic Islander Male 4Native Hawaiian/Other Pacfic Islander Female 1Multiracial Male 132Multiracial Female 36Total Male 9,382Total Female 2,998* Total degree includes 0 total Non binary graduates and 0 total Other Gender graduates.* Includes 7 male and2 female graduates from Puerto Rico.
40

5,564
1,646
371128 249109
2,368
776
12066
566232
84 41 13236
9,382
2,998
0
2,500
5,000
7,500
Nonre
siden
t Alie
n
Unkno
wn
Hispan
ic
Whit
e
Black o
r Afr.
Amer
Asian
Amer
Amer
ican
India
n
Pacific
Islan
der
Mult
iracia
lTo
tal
Female
Male
Doctoral Degrees Awarded by Race, Ethnicity, and Gender
3.1.9 Top 50 Institutions Awarding Engineering Doctoral Degrees
Table 63: Top 50 Institutions Awarding Engineering Doctoral Degrees
No Institutions Degrees Awarded1 Georgia Institute of Technology 3972 Purdue University 3803 University of Illinois at UrbanaChampaign 3434 Stanford University 3265 University of Michigan 3166 Massachusetts Institute of Technology 2887 Texas A&M University 2838 Virginia Polytechnic Institute and State University 2439 University of California, Berkeley 238
10 The University of Texas at Austin 23611 North Carolina State University 22312 University of California, San Diego 22013 Carnegie Mellon University 21114 Cornell University 17815 The Ohio State University 17716 Arizona State University 17417 University of Washington in Seattle 16818 University of Maryland, College Park 16318 University of Southern California 16320 University of California, Los Angeles 16121 Missouri University of Science and Technology 15322 Iowa State University 15223 Northwestern University 14824 University of Florida 14725 University of Minnesota Twin Cities 14526 University of Idaho 14327 University of WisconsinMadison 14028 University of Central Florida 12929 The Johns Hopkins University 12130 Colorado School of Mines 12031 University of Colorado Boulder 11632 University of California, Irvine 11533 University of California, Davis 11134 The University of Texas at Arlington 10835 Stony Brook University 10735 The University of Texas at Dallas 10737 Washington State University 10438 Boston University 9839 Oregon State University 9340 University at Buffalo, SUNY 9240 University of California, Santa Barbara 9242 University of Illinois at Chicago 90
41

Table 63: Top 50 Institutions Awarding Engineering Doctoral Degrees (continued)
No Institutions Degrees Awarded42 William Marsh Rice University 9044 The George Washington University 8944 University of Massachusetts Amherst 8944 University of Tennessee, Knoxville 8947 Clemson University 8748 Rutgers, The State University of New Jersey, School of Engineering 8548 University of Arizona 8548 University of Utah 85* 429 Institutions reported.Includes both part time and full time
3.1.10 Top 20 Institutions by Total Doctoral Degrees awarded to Underrepresented Minorities
Table 64: Top 20 Institutions by Total Doctoral Degrees awardedto Underrepresented Minorities
No Institutions Degrees Awarded1 University of Michigan 272 Georgia Institute of Technology 213 The University of Texas at El Paso 184 University of California, Berkeley 164 Virginia Polytechnic Institute and State University 166 Stanford University 156 University of Florida 158 Arizona State University 148 Purdue University 14
10 University of California, Davis 1111 Northwestern University 1011 Texas A&M University 1011 University of Arizona 1014 Massachusetts Institute of Technology 914 University of California, San Diego 914 University of Puerto Rico, Mayaguez Campus 917 The Johns Hopkins University 817 The University of Texas at Dallas 817 University of California, Riverside 817 University of Colorado Boulder 8* 429 Institutions included
3.1.11 Top 50 Institutions by Percentage of Doctoral Degrees awarded to Underrepresented Minorities
Table 65: Top 50 Institutions by Percentage of Doctoral Degreesawarded to Underrepresented Minorities
No Institutions Percent Underrepresented Minorities1 University of Puerto Rico, Mayaguez Campus 100%2 University of Tennessee, Chattanooga 50%3 The University of Texas at El Paso 42.9%4 Rowan University 40%5 Tennessee State University 33.3%6 Prairie View A & M University 28.6%7 Morgan State University 23.1%8 Marquette University 20%8 University of Bridgeport 20%
10 Temple University 16.7%11 Boise State University 15.4%11 University of Rhode Island 15.4%13 Old Dominion University 14.7%14 Texas State University 14.3%14 University of North Dakota 14.3%16 North Carolina A&T State University 13.8%17 Florida Institute of Technology 12.8%18 Baylor University 12.5%18 California State University, Long Beach 12.5%18 Louisiana Tech University 12.5%21 University of Arizona 11.8%22 New Mexico Institute of Mining and Technology 11.1%22 Portland State University 11.1%22 University of Maine 11.1%25 University of Miami 10.7%26 University of California, Merced 10.5%27 University of Florida 10.2%28 Jackson State University 10%29 University of California, Davis 9.9%
42

Table 65: Top 50 Institutions by Percentage of Doctoral Degreesawarded to Underrepresented Minorities (continued)
No Institutions Percent Underrepresented Minorities30 University of California, Riverside 9.9%31 FAMUFSU College of Engineering 9.8%31 Mississippi State University 9.8%33 Florida International University 9.3%34 Ohio University 9.1%35 Brown University 8.7%36 University of Michigan 8.5%37 University of Virginia 8.5%38 Arizona State University 8%39 The George Washington University 7.9%40 Texas A&M University Kingsville 7.7%40 University of Massachusetts Dartmouth 7.7%40 University of Nevada, Las Vegas 7.7%43 The University of Texas at Dallas 7.5%44 Clarkson University 7.1%44 Embry Riddle Aeronautical UniversityDaytona Beach 7.1%46 The University of Texas at San Antonio 6.9%46 University of Colorado Boulder 6.9%48 Northwestern University 6.8%49 University of California, Berkeley 6.7%50 Southern Illinois University Carbondale 6.7%* 429 Institutions included
3.1.12 Top 20 Institutions Awarding Highest Percentage of Doctoral Degrees to Women
Table 66: Top 20 Highest Percentage of Doctoral Degrees toWomen
No Institutions Percent Women1 Alfred University 100%1 Alfred University, NY State College of Ceramics 100%1 Central Michigan University 100%1 Lawrence Technological University 100%5 Rowan University 80%6 University of Massachusetts Dartmouth 61.5%7 Idaho State University 60%8 The Catholic University of America 58.3%9 SUNY Polytechnic Institute 50%9 University of Colorado Denver 50%11 South Dakota School of Mines and Technology 45.5%11 University of New Hampshire 45.5%13 Texas State University 42.9%13 University of MassachusettsBoston 42.9%15 Jackson State University 40%15 Southern Illinois University Carbondale 40%17 Boston University 38.8%18 New Jersey Institute of Technology 37.8%19 Louisiana Tech University 37.5%19 South Dakota State University 37.5%* 429 Institutions included
3.1.13 Top 50 Institutions Awarding Doctoral Degrees to Foreign Nationals
Table 67: Top 50 Institutions Awarding Doctoral Degrees to Foreign Nationals
No Institutions Degrees Awarded1 Purdue University 2772 University of Illinois at UrbanaChampaign 2203 Georgia Institute of Technology 2174 Texas A&M University 2075 University of Michigan 1596 The University of Texas at Austin 1537 Massachusetts Institute of Technology 1498 North Carolina State University 1428 Virginia Polytechnic Institute and State University 142
10 Carnegie Mellon University 13710 Stanford University 13712 University of California, San Diego 12212 University of Southern California 12214 The Ohio State University 12115 Arizona State University 10915 Iowa State University 10917 University of California, Los Angeles 10418 University of California, Berkeley 9719 University of Minnesota Twin Cities 9420 Cornell University 90
43

Table 67: Top 50 Institutions Awarding Doctoral Degrees to Foreign Nationals (continued)
No Institutions Degrees Awarded21 University of Central Florida 8921 University of Maryland, College Park 8923 The University of Texas at Arlington 8524 University of California, Irvine 8324 University of WisconsinMadison 8326 Stony Brook University 8227 Washington State University 7928 University of Idaho 7829 The University of Texas at Dallas 7430 University of Florida 7331 Northwestern University 7232 Michigan State University 7133 University at Buffalo, SUNY 7034 Missouri University of Science and Technology 6935 University of Washington in Seattle 6636 University of Massachusetts Amherst 6437 Rutgers, The State University of New Jersey, School of Engineering 6238 University of Illinois at Chicago 6139 Northeastern University 5739 The Johns Hopkins University 5741 Boston University 5542 Clemson University 5443 Auburn University 5343 University of Pittsburgh 5345 Rensselaer Polytechnic Institute 5145 Texas Tech University 5145 University of Nebraska, Lincoln 5148 Duke University 5048 University of South Florida 5050 University of California, Santa Barbara 49* 429 Institutions included
3.1.14 Top 50 Institutions Awarding Bachelors Degrees (excluding computer science both inside and outside Engineering)
Table 68: Top 50 Institutions Awarding Bachelors Degrees (excluding computer science)
No Institutions Degrees Awarded1 Georgia Institute of Technology 2,2762 Purdue University 2,0053 Texas A&M University 1,9584 University of Illinois at UrbanaChampaign 1,7395 Iowa State University 1,7266 Arizona State University 1,6757 Virginia Polytechnic Institute and State University 1,5178 The University of Texas at Austin 1,3999 The Ohio State University 1,397
10 North Carolina State University 1,36811 University of Florida 1,30512 California Polytechnic State University, San Luis Obispo 1,21313 University of Michigan 1,20514 University of Central Florida 1,16915 University of Colorado Boulder 1,07916 University of Maryland, College Park 1,07717 Missouri University of Science and Technology 1,05818 Oregon State University 1,02119 University of California, Berkeley 1,01320 University of WisconsinMadison 1,00721 University of Washington in Seattle 1,00322 California State Polytechnic University, Pomona 1,00223 Rutgers, The State University of New Jersey, School of Engineering 98824 San Jose State University 98425 The University of Alabama 97626 Clemson University 93527 University of California, San Diego 92928 Michigan State University 92029 Rensselaer Polytechnic Institute 90530 Stony Brook University 90031 Louisiana State University 89832 Colorado School of Mines 89533 University of California, Irvine 883
44

Table 68: Top 50 Institutions Awarding Bachelors Degrees (excluding computer science) (continued)
No Institutions Degrees Awarded34 Texas Tech University 87735 Auburn University 86936 University of South Florida 84537 San Diego State University 82738 University at Buffalo, SUNY 82539 California State University, Long Beach 82140 University of Minnesota Twin Cities 81841 Northeastern University 78542 University of California, Davis 77643 George Mason University 77043 West Virginia University 77045 Michigan Technological University 73246 Rochester Institute of Technology 72447 Worcester Polytechnic Institute 71648 Florida International University 71549 University of North Carolina at Charlotte 70750 New Jersey Institute of Technology 703* 424 Institutions included
45

3.1.15 Top 50 Institutions Awarding Masters Degrees (excluding computer science both inside and outside Engineering)
Table 69: Top 50 Institutions Awarding Masters Degrees (excluding computer science)
No Institutions Degrees Awarded1 Northeastern University 1,7372 University of Southern California 1,3653 Fu Foundation School of Engineering and Applied Science Columbia University 1,2744 Carnegie Mellon University 1,2215 Georgia Institute of Technology 1,1436 University of Michigan 1,0077 University of California, Berkeley 8928 Cornell University 8629 San Jose State University 859
10 Arizona State University 85511 Stanford University 83712 University of Washington in Seattle 82913 Massachusetts Institute of Technology 76714 Texas A&M University 74115 North Carolina State University 72816 University of Illinois at UrbanaChampaign 66717 University of California, San Diego 66518 Northwestern University 64619 NYU Tandon School of Engineering 61220 Purdue University 57721 University of Florida 54422 The University of Texas at Arlington 54023 University of Pennsylvania 50524 University of Colorado Boulder 50125 University at Buffalo, SUNY 48526 The Johns Hopkins University 47127 University of Maryland, College Park 45328 Duke University 45229 University of California, Los Angeles 45030 The George Washington University 44831 George Mason University 43932 New Jersey Institute of Technology 41233 Virginia Polytechnic Institute and State University 39134 The University of Texas at Austin 38335 University of MichiganDearborn 37836 Clemson University 37037 University of WisconsinMadison 36338 Boston University 35639 The Ohio State University 35340 Santa Clara University 35141 Washington University in St. Louis 34742 The Pennsylvania State University 34643 Missouri University of Science and Technology 34344 Worcester Polytechnic Institute 32445 University of South Florida 32046 Wayne State University 31447 Colorado School of Mines 30648 University of Central Florida 30249 Drexel University 29950 Illinois Institute of Technology 293* 424 Institutions included
3.1.16 Top 50 Institutions Awarding Doctoral Degrees (excluding computer science both inside and outside Engineering )
Table 70: Top 50 Institutions Awarding Doctoral Degrees (excluding computer science)
No Institutions Degrees Awarded1 Georgia Institute of Technology 3552 Purdue University 3523 University of Illinois at UrbanaChampaign 2954 Stanford University 2945 Massachusetts Institute of Technology 2886 University of Michigan 2847 Texas A&M University 2628 The University of Texas at Austin 2209 Virginia Polytechnic Institute and State University 215
10 University of California, Berkeley 19811 North Carolina State University 19412 University of California, San Diego 18213 University of Washington in Seattle 16814 Cornell University 15115 Missouri University of Science and Technology 14916 The Ohio State University 14617 Iowa State University 14317 University of California, Los Angeles 14319 Arizona State University 14119 University of Idaho 141
46

Table 70: Top 50 Institutions Awarding Doctoral Degrees (excluding computer science) (continued)
No Institutions Degrees Awarded21 University of Florida 13622 Northwestern University 13423 University of Southern California 13224 University of Maryland, College Park 13125 Carnegie Mellon University 12926 University of Minnesota Twin Cities 12327 Colorado School of Mines 11827 University of WisconsinMadison 11829 The Johns Hopkins University 10330 University of Central Florida 10031 University of Colorado Boulder 9832 Washington State University 9233 University of California, Davis 9034 Boston University 8835 The University of Texas at Arlington 8536 University of Tennessee, Knoxville 8437 University of Arizona 8238 Clemson University 8038 University of California, Irvine 8038 William Marsh Rice University 8041 Oregon State University 7642 Stony Brook University 7542 University of Illinois at Chicago 7542 University of Pittsburgh 7545 Duke University 7446 Michigan State University 7246 University at Buffalo, SUNY 7248 Rutgers, The State University of New Jersey, School of Engineering 7148 The University of Texas at Dallas 7148 University of South Florida 71* 424 Institutions included
3.1.17 Institutions with the Highest Percentage of Doctoral Degrees to Foreign Nationals
Table 71: Highest Percentage of Doctoral Degrees to Foreign Nationals (min 25 awarded)
No Institutions Percentage
1 Howard University 100%1 Lamar University 100%1 San Diego State University 100%1 The University of Mississippi 100%1 University of MichiganDearborn 100%6 Embry Riddle Aeronautical UniversityDaytona Beach 92.9%7 University of North Texas 90.3%8 University of Georgia 88.2%9 South Dakota State University 87.5%9 The University of Toledo 87.5%11 Pace University 85.7%11 University of MassachusettsBoston 85.7%13 Illinois Institute of Technology 85%14 Oakland University 84.6%14 Texas A&M University Kingsville 84.6%16 Michigan State University 84.5%17 The State University of New York at Binghamton 81.4%18 New Jersey Institute of Technology 81.1%19 University of Nebraska, Lincoln 81%20 University of Louisville 80%21 University of Missouri 79.3%22 Florida Atlantic University 79.2%23 Oklahoma State University 78.8%24 The University of Texas at Arlington 78.7%25 The University of Tulsa 78.3%26 Florida International University 77.8%26 New Mexico Institute of Mining and Technology 77.8%26 Villanova University 77.8%29 Ohio University 77.3%29 Texas Tech University 77.3%31 Western Michigan University 76.9%32 Stony Brook University 76.6%33 NYU Tandon School of Engineering 76.3%34 University at Buffalo, SUNY 76.1%35 Washington State University 76%36 University of Oklahoma, Gallogly College of Engineering 75.6%37 Syracuse University 75%37 The Catholic University of America 75%
47

Table 71: Highest Percentage of Doctoral Degrees to Foreign Nationals (min 25 awarded) (continued)
No Institutions Percentage
37 University of Colorado Colorado Springs 75%37 University of Connecticut 75%37 University of Hawaii at Manoa 75%37 University of Miami 75%37 Wichita State University 75%44 University of Southern California 74.8%45 Auburn University 74.6%46 University of Arkansas at Little Rock 73.7%47 Southern Illinois University Carbondale 73.3%48 Texas A&M University 73.1%49 Purdue University 72.9%49 Rutgers, The State University of New Jersey, School of Engineering 72.9%* 429 Institutions included
3.1.18 Institutions with the Lowest Percentage of Doctoral Degrees to Foreign Nationals
Table 72: Institutions with the Lowest Percentage of Doctoral Degrees to Foreign Nationals (min 25 awarded)
No Institutions Percentage
1 University of Washington in Seattle 39.3%2 University of CaliforniaSanta Cruz 40%2 University of New Orleans 40%4 The University of Alabama in Huntsville 40.5%4 University of California, Davis 40.5%6 University of California, Berkeley 40.8%7 The George Washington University 41.6%8 Stanford University 42%9 Vanderbilt University 43.9%
10 University of Maine 44.4%11 The University of New Mexico 44.7%12 Missouri University of Science and Technology 45.1%13 The University of Memphis 45.5%14 University of Rhode Island 46.2%15 Tulane University 46.7%16 New Mexico State University 47.1%16 Old Dominion University 47.1%16 The Johns Hopkins University 47.1%19 Oregon State University 47.3%20 University of Pennsylvania 47.4%21 Brown University 47.8%22 University of Delaware 47.9%22 University of Virginia 47.9%24 George Mason University 48.5%25 Northwestern University 48.6%* 429 Institutions included
3.1.19 Top 10 Institutions by Total Doctoral Degrees awarded in Engineering (General)
Table 73: Top 10 Institutions by Total Doctoral Degrees awardedin Engineering (General)
No Institutions Degrees Awarded
1 Dartmouth College 231 University of Nebraska, Lincoln 233 Villanova University 184 Morgan State University 135 Arizona State University 96 Lamar University 77 Wright State University 68 Rochester Institute of Technology 59 Saint Louis University 4
10 Jackson State University 3* 123 Institutions included
48

3.2 ENGINEERING DOCTORAL ENROLLMENT3.2.1 Doctoral Enrollment by Race, Ethnicity, and Gender
Table 74: Doctoral Enrollment by Race, Ethnicity, and Gender 75,033*
Ethnicity Enrollments
Nonresident Alien Male 31,659Nonresident Alien Female 10,882Unknown Male 2,276Unknown Female 936Hispanic Male 2,004Hispanic Female 916White Male 13,191White Female 5,379Black or Afr. American Male 940Black or Afr. American Female 561Asian American Male 3,331Asian American Female 1,685American Indian Male 61American Indian Female 23Native Hawaiian/Other Pacfic Islander Male 21Native Hawaiian/Other Pacfic Islander Female 15Multiracial Male 757Multiracial Female 396Total Male 54,240Total Female 20,793* Includes 73 male and37 female enrolled students from Institutions in Puerto Rico.
31,659
10,882
2,276936
2,004916
13,191
5,379
940561
3,3311,685
6123 2115 757396
54,240
20,793
0
20,000
40,000
Nonre
siden
t Alie
n
Unkno
wn
Hispan
ic
Whit
e
Black o
r Afr.
Amer
Asian
Amer
Amer
ican
India
n
Pacific
Islan
der
Mult
iracia
lTo
tal
Female
Male
Doctoral Enrollment by Race, Ethnicity, and Gender
49

3.2.2 Doctoral Enrollment by Engineering Discipline:(Full time and Part time)
Table 75: Doctoral Enrollment by Engineering Discipline:(Full time and Part time)
Discipline Name Full Time Part Time
Aerospace 2,694 231Architectural 100 1Biological and Agricultural 669 90Biomedical 7,403 498Chemical 6,555 268Civil 4,418 598Civil/Environmental 1,661 206Computer 1,575 220Computer Sci. (inside Eng.) 9,496 1,142Computer Sci. (outside Engr.) 3,946 375Electrical 6,102 646Electrical/Computer 7,972 883Engineering (General) 602 116Engineering Management 134 155Engr. Science and Engr. Physics 899 65Envr. Eng 850 71Industrial/Manufacturing/Systems 3,101 731Mechanical 10,126 980Metallurgical and Matrls. 4,781 214Mining 97 17Nuclear 824 79Other 4,537 887Petroleum 437 49
3.2.3 Doctoral Enrollment by Gender
Table 76: Doctoral Enrollment by Gender
Gender Percentage
Female 28.1%Male 71.9%
72.3%
27.7%
0%
10%
20%
30%
40%
50%
60%
70%
80%
90%
100%
Mal
e
Fem
ale
Doctoral Enrollment by Gender
3.2.4 Doctoral Enrollment by Race and Ethnicity
Table 77: Doctoral Enrollment by Race and Ethnicity*
Ethnicity Percentage
Black or Afr. American 4.9%Hispanic 9.1%Other 5.1%Asian American 15.4%White 55.5%Unknown 10%
50
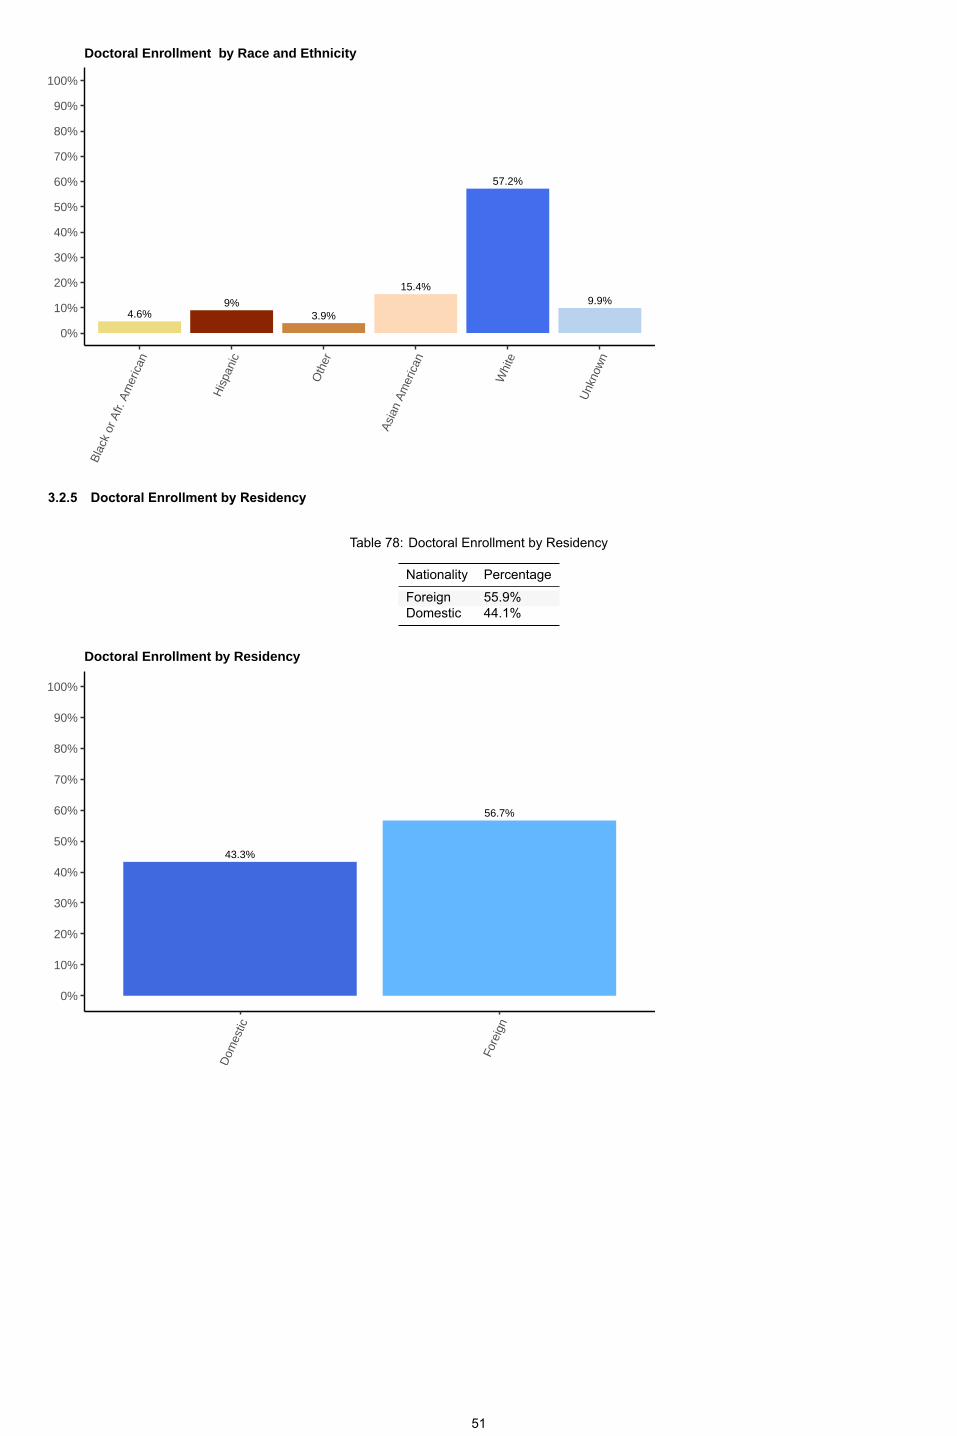
4.6%9%
3.9%
15.4%
57.2%
9.9%
0%
10%
20%
30%
40%
50%
60%
70%
80%
90%
100%B
lack
or A
fr. A
mer
ican
His
pani
c
Oth
er
Asi
an A
mer
ican
Whi
te
Unk
now
n
Doctoral Enrollment by Race and Ethnicity
3.2.5 Doctoral Enrollment by Residency
Table 78: Doctoral Enrollment by Residency
Nationality PercentageForeign 55.9%Domestic 44.1%
56.7%
43.3%
0%
10%
20%
30%
40%
50%
60%
70%
80%
90%
100%
Dom
estic
Fore
ign
Doctoral Enrollment by Residency
51

4 ENGINEERING FACULTY , FALL 2020
4.1 Number of Tenured/TenureTrack Faculty by Engineering Discipline
Table 79: Number of Tenured/TenureTrack Faculty by Engineering Discipline: 29,003
Discipline Name Number of Faculty
Mechanical 4,946Electrical/Computer 4,349Comp Sci. (inside Eng.) 3,182Chemical 2,178Civil 1,906Biomedical 1,729Civil/Environmental 1,673Other 1,597Computer Sci. (outside Engr.) 1,355Electrical 1,298Industrial/Manufacturing/Systems 1,218Metallurgical and Matrls. 1,116Engineering (General) 858Aerospace 804Biological and Agricultural 560Computer 373Engr. Science and Engr. Physics 258Envr. Eng 238Nuclear 231Petroleum 171Engr. Management 136Architectural 99Mining 83* Total does not include computer science (outside engineering).
4,946
4,349
3,182
2,1781,906
1,729 1,673 1,5971,355 1,298 1,218 1,116
858 804 560
373 258 238 231 171 136 99 83
0
1,000
2,000
3,000
4,000
5,000
Mec
hani
cal
Ele
ctric
al/C
ompu
ter
Com
p S
ci. (
insi
de E
ng.)
Che
mic
al
Civ
ilB
iom
edic
alC
ivil/
Env
ironm
enta
lO
ther
Com
pute
r Sci
. (ou
tsid
e E
ngr.)
Ele
ctric
al
Indu
stria
l/Man
ufac
turin
g/S
yste
ms
Met
allu
rgic
al a
nd M
atrls
.E
ngin
eerin
g (G
ener
al)
Aer
ospa
ce
Bio
logi
cal a
nd A
gric
ultu
ral
Com
pute
r
Eng
r. S
cien
ce a
nd E
ngr.
Phy
sics
Env
r. E
ngN
ucle
arP
etro
leum
Eng
r. M
anag
emen
tA
rchi
tect
ural
Min
ing
Number of Tenured/Tenure−Track Faculty by Engineering Discipline
52

4.2 Percentage of Female Tenured/TenureTrack Faculty by Discipline
Table 80: Percentage of Female Tenured/TenureTrack Faculty byDiscipline: 18.5 % of Total
Discipline Name Percent Women
Envr. Eng 27.7%Biomedical 25.7%Engineering (General) 24.5%Biological and Agricultural 23.2%Civil/Environmental 22.7%Chemical 21.5%Other 20.9%Civil 20.8%Industrial/Manufacturing/Systems 20.8%Engr. Management 20.6%Architectural 20.2%Computer 20.1%Metallurgical and Matrls. 19.9%Computer Sci. (outside Engr.) 19.8%Mining 19.3%Comp Sci. (inside Eng.) 17.9%Engr. Science and Engr. Physics 17.8%Petroleum 17%Nuclear 16.5%Electrical 14.7%Mechanical 14.7%Electrical/Computer 14.3%Aerospace 12.2%
27.7%
25.7%
24.5%23.2% 22.7%
21.5%20.9%20.8% 20.8%20.6%
20.2% 20.1% 19.9%19.8%19.3%
17.9% 17.8%17%
16.5%14.7% 14.7%
14.3%
12.2%
0%
10%
20%
30%
Env
r. E
ngB
iom
edic
al
Eng
inee
ring
(Gen
eral
)
Bio
logi
cal a
nd A
gric
ultu
ral
Civ
il/E
nviro
nmen
tal
Che
mic
alC
ivil
Eng
r. M
anag
emen
t
Indu
stria
l/Man
ufac
turin
g/S
yste
ms
Oth
erA
rchi
tect
ural
Com
pute
r
Com
pute
r Sci
. (ou
tsid
e E
ngr.)
Met
allu
rgic
al a
nd M
atrls
.M
inin
g
Com
p S
ci. (
insi
de E
ng.)
Eng
r. S
cien
ce a
nd E
ngr.
Phy
sics
Petro
leum
Nuc
lear
Ele
ctric
alM
echa
nica
l
Ele
ctric
al/C
ompu
ter
Aer
ospa
ce
Percentage of Female Tenured/Tenure−Track Faculty by Discipline
4.3 Top 50 Institutions by Number of Tenured/TenureTrack Faculty
Table 81: Top 50 Institutions by Number of Tenured/TenureTrackFaculty
No Institutions Number of Faculty1 Georgia Institute of Technology 5832 University of Illinois at UrbanaChampaign 4743 Texas A&M University 4484 University of Michigan 4295 The Pennsylvania State University 4006 Purdue University 3947 Massachusetts Institute of Technology 3938 Virginia Polytechnic Institute and State University 3899 North Carolina State University 377
10 Arizona State University 32611 The University of Texas at Austin 31712 Florida Atlantic University 31612 University of Florida 31614 Carnegie Mellon University 30115 Rensselaer Polytechnic Institute 29516 The Ohio State University 29417 Stanford University 286
53

Table 81: Top 50 Institutions by Number of Tenured/TenureTrackFaculty (continued)
No Institutions Number of Faculty18 University of Washington in Seattle 28319 Cornell University 27520 University of WisconsinMadison 26421 University of Maryland, College Park 26322 Iowa State University 25923 University of California, Berkeley 25724 Clemson University 24424 University of California, San Diego 24426 University of Notre Dame 24027 University of Minnesota Twin Cities 23828 Michigan State University 23529 University of California, Irvine 23330 University of Utah 22331 The Johns Hopkins University 22232 Northeastern University 22033 Northwestern University 20734 University of California, Davis 20635 Fu Foundation School of Engineering and Applied Science Columbia University 20535 Oregon State University 20537 University of Pittsburgh 19838 University of Nebraska, Lincoln 19639 University of Massachusetts Amherst 19240 Colorado School of Mines 18940 University of Southern California 18942 University of California, Los Angeles 18743 University of Colorado Boulder 18644 University of Tennessee, Knoxville 18345 Duke University 17845 University of Arizona 17847 University at Buffalo, SUNY 17648 University of Central Florida 17549 Auburn University 17450 The University of Texas at Arlington 172* 310 Institutions included
4.4 Top 20 Institutions by Number of Underrepresented Minorities Tenured/TenureTrack Faculty
Table 82: Top 20 Institutions by Number of Underrepresented Minorities Tenured/TenureTrack Faculty
No Institutions Number of Faculty1 University of Puerto Rico, Mayaguez Campus 1382 Texas A&M University 473 Florida Atlantic University 454 University of Florida 375 Georgia Institute of Technology 356 Massachusetts Institute of Technology 347 The University of Texas at El Paso 318 Virginia Polytechnic Institute and State University 309 Purdue University 29
10 University of Illinois at UrbanaChampaign 2810 University of Miami 2812 Howard University 2613 North Carolina State University 2414 University of California, San Diego 2215 Morgan State University 2115 North Carolina A&T State University 2115 Rensselaer Polytechnic Institute 2115 The Pennsylvania State University 2115 University of Michigan 2120 Arizona State University 20* 310 Institutions included
54

4.5 Top 20 Institutions by Percentage of Underrepresented Minorities Tenured/TenureTrack Faculty
Table 83: Top 20 Institutions by Percentage of UnderrepresentedMinorities Tenured/TenureTrack Faculty
No Institutions Percent Underrepresented Minorities1 University of Puerto Rico, Mayaguez Campus 93.2%2 Virginia State University 60%3 Howard University 57.8%4 Morgan State University 51.2%5 The University of Texas at El Paso 35.6%6 Jackson State University 31.2%7 Central State University 30.8%8 University of Tennessee, Chattanooga 29.9%9 North Carolina A&T State University 27.6%
10 University of Miami 26.2%11 Tuskegee University 25.8%12 Loyola University Chicago 25%13 St. Mary’s University 23.1%14 University of TennesseeChattanooga 22.7%15 Texas State University 22.2%16 Kennesaw State University 22%17 John Brown University 20%17 Winona State University 20%19 Florida Institute of Technology 19.6%20 The University of Texas Rio Grande Valley 19%* 310 Institutions included
4.6 Number of Engineering Teaching Personnel by Rank
Table 84: Number of Engineering Teaching Personnel by Rank 38,534
Rank Number of Faculty
Full Professor 14,590Associate Professor 7,840Assistant Professor 7,928NonTenureTrack Personnel 5578.5FTE of All PT Personnel 2,598
14,590
7,840 7,928
5578.5
2,598
0
5,000
10,000
15,000
Full
Pro
fess
or
Ass
ocia
te P
rofe
ssor
Ass
ista
nt P
rofe
ssor
Non
−Ten
ure−
Trac
k P
erso
nnel
FTE
of A
ll P
T P
erso
nnel
Number of Engineering Teaching Personnel by Rank
55

4.7 Percentage of Female Tenured/TenureTrack Faculty by Rank
Table 85: Percentage of Female Tenured/TenureTrack Faculty by Rank
Rank Percent
All Faculty 18.5%Full Professor 13.6%Associate Professor 20.9%Assistant Professor 25.4%
18.5%
13.6%
20.9%
25.4%
0%
10%
20%
30%
All
Facu
lty
Full
Pro
fess
or
Ass
ocia
te P
rofe
ssor
Ass
ista
nt P
rofe
ssor
Percentage of Female Tenured/Tenure−Track Faculty by Rank
56

4.8 Top 50 Institutions with Highest Percentage of Female Tenured/Tenure Track Faculty
Table 86: Top 50 Institutions with Highest Percentage of FemaleTenured Tenure Track Faculty
No Institutions Percent Women1 Smith College 70%2 Sweet Briar College 66.7%3 Humboldt State University 62.5%4 Cameron University 60%4 Campbell University 60%4 Saint Ambrose University 60%7 Olin College of Engineering 47.6%8 Seattle University 42.9%9 University of Bridgeport 38.9%
10 U.S. Coast Guard Academy 35.3%11 University of Portland 35%12 Middle Tennessee State University 33.3%12 Santa Clara University 33.3%12 Swarthmore College 33.3%12 University of San Diego 33.3%16 San Jose State University 32.6%17 Lafayette College 32.6%18 Mercer University 32.4%19 California State University, Long Beach 31.6%20 University of St. Thomas 31.4%21 California Baptist University 31%22 Loyola Marymount University 30%22 Union College 30%24 Roger Williams University 29.4%25 University of Massachusetts Lowell 29.3%26 Texas Christian University 28.6%27 University of Wisconsin, Platteville 28.3%28 University of California, Merced 28.3%29 University of Hartford 28%30 University of New Haven 27.8%31 Wentworth Institute of Technology 27.5%32 Fairfield University 27.3%33 University of Puerto Rico, Mayaguez Campus 27%34 Gannon University 26.9%34 Trine University 26.9%36 Gonzaga University 26.7%36 New York Institute of Technology 26.7%38 University of Washington in Seattle 26.5%39 Rowan University 26.5%40 Harvey Mudd College 26.3%41 Tufts University 26.1%42 Valparaiso University 25.9%43 Oregon State University 25.9%44 University of Maryland, Baltimore County 25.8%45 Bucknell University 25.8%46 University of California, Irvine 25.8%47 Stevens Institute of Technology 25.7%48 Carnegie Mellon University 25.2%49 Abilene Christian University 25%49 Baker College 25%* 310 Institutions included
57
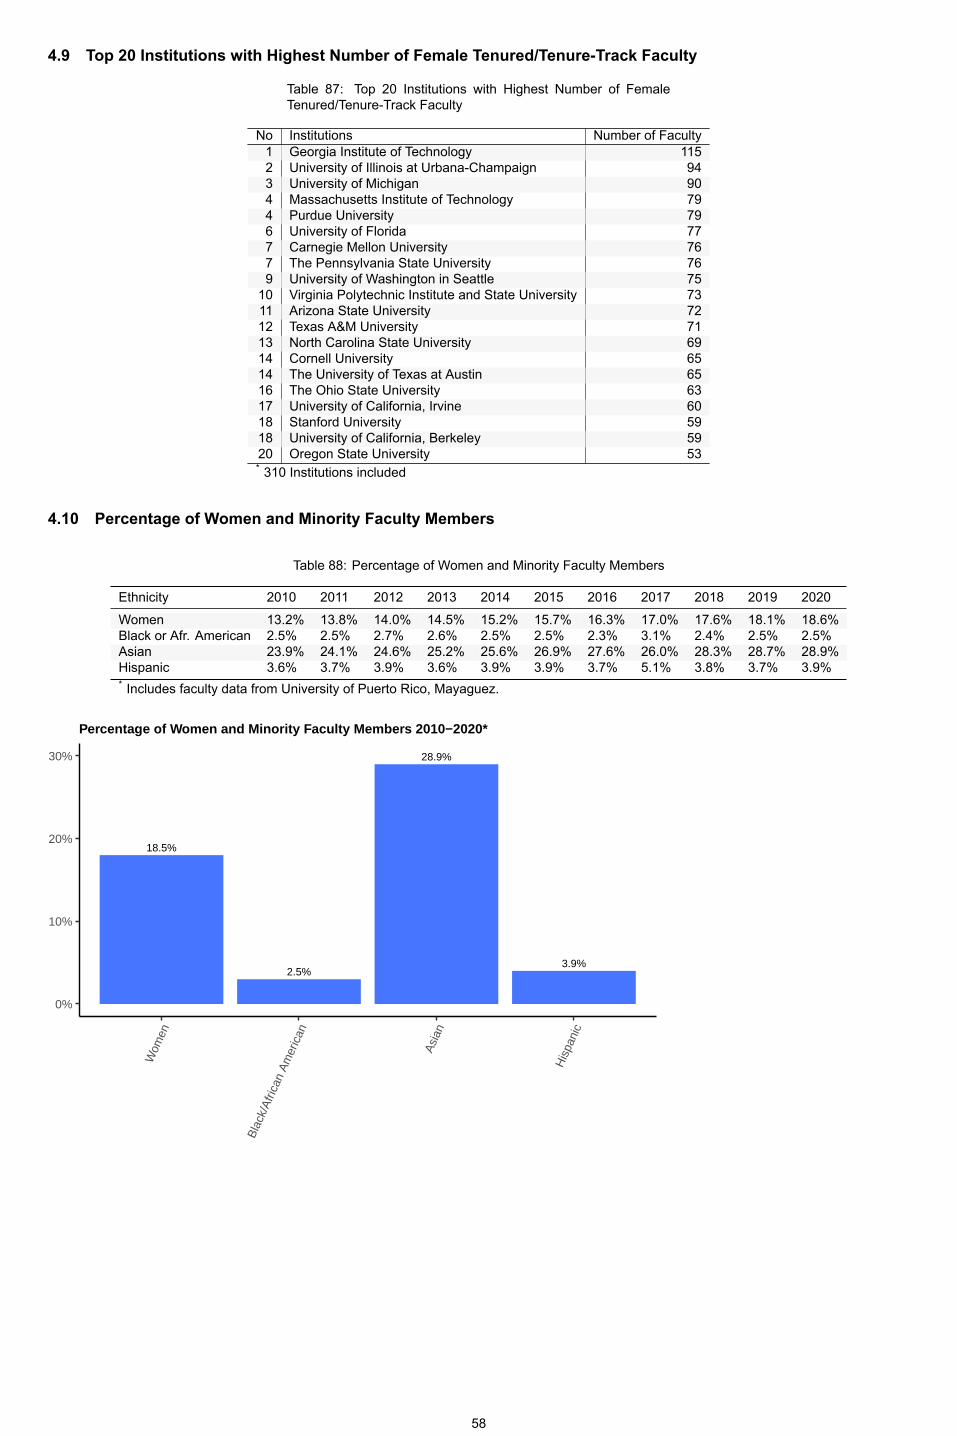
4.9 Top 20 Institutions with Highest Number of Female Tenured/TenureTrack Faculty
Table 87: Top 20 Institutions with Highest Number of FemaleTenured/TenureTrack Faculty
No Institutions Number of Faculty1 Georgia Institute of Technology 1152 University of Illinois at UrbanaChampaign 943 University of Michigan 904 Massachusetts Institute of Technology 794 Purdue University 796 University of Florida 777 Carnegie Mellon University 767 The Pennsylvania State University 769 University of Washington in Seattle 75
10 Virginia Polytechnic Institute and State University 7311 Arizona State University 7212 Texas A&M University 7113 North Carolina State University 6914 Cornell University 6514 The University of Texas at Austin 6516 The Ohio State University 6317 University of California, Irvine 6018 Stanford University 5918 University of California, Berkeley 5920 Oregon State University 53* 310 Institutions included
4.10 Percentage of Women and Minority Faculty Members
Table 88: Percentage of Women and Minority Faculty Members
Ethnicity 2010 2011 2012 2013 2014 2015 2016 2017 2018 2019 2020
Women 13.2% 13.8% 14.0% 14.5% 15.2% 15.7% 16.3% 17.0% 17.6% 18.1% 18.6%Black or Afr. American 2.5% 2.5% 2.7% 2.6% 2.5% 2.5% 2.3% 3.1% 2.4% 2.5% 2.5%Asian 23.9% 24.1% 24.6% 25.2% 25.6% 26.9% 27.6% 26.0% 28.3% 28.7% 28.9%Hispanic 3.6% 3.7% 3.9% 3.6% 3.9% 3.9% 3.7% 5.1% 3.8% 3.7% 3.9%* Includes faculty data from University of Puerto Rico, Mayaguez.
18.5%
2.5%
28.9%
3.9%
0%
10%
20%
30%
Wom
en
Bla
ck/A
frica
n A
mer
ican
Asi
an
His
pani
c
Percentage of Women and Minority Faculty Members 2010−2020*
58

4.11 Number of Full Professors by Race/Ethnicity
Table 89: Number of Full Professors by Race/Ethnicity: 13,910
Ethnicity Number of Faculty
White 8,281Asian 3,915Unknown 785Hispanic 551Black or Afr. American 290Multiracial 47American Indian 31Hawaiian/Pac.Isl 10* Includes 124 Faculty from Institutions in Puertio Rico.* Computer Science(Outside Engineering) has been removed
8,281
3,915
785551
29047 31 10
0
2,000
4,000
6,000
8,000
Whi
te
Asi
an
Unk
now
n
His
pani
c
Bla
ck o
r Afr.
Am
eric
an
Mul
tirac
ial
Am
eric
an In
dian
Haw
aiia
n/P
ac.Is
l
Number of Full Professors by Race/Ethnicity (teaching)
4.12 Number of Assistant Professors by Race/Ethnicity
Table 90: Number of Assistant Professors by Race/Ethnicity: 6,878
Ethnicity Number of Faculty
White 3,365Asian 2,270Unknown 640Hispanic 273Black or Afr. American 224Multiracial 81American Indian 20Hawaiian/Pac.Isl 5* Includes 4 Faculty from Institutions in Puertio Rico.* Computer Science(Outside Engineering) has been removed
59

3,365
2,270
640
273 22481 20 5
0
1,000
2,000
3,000W
hite
Asi
an
Unk
now
n
His
pani
c
Bla
ck o
r Afr.
Am
eric
an
Mul
tirac
ial
Am
eric
an In
dian
Haw
aiia
n/P
ac.Is
l
Number of Assistant Professors by Race/Ethnicity (teaching)
4.13 Number of Associate Professors by Race/Ethnicity
Table 91: Number of Associate Professors by Race/Ethnicity: 7,400
Ethnicity Number of Faculty
White 4,085Asian 2,214Unknown 428Hispanic 335Black or Afr. American 237Multiracial 60American Indian 30Hawaiian/Pac.Isl 11* Includes 20 Faculty from Institutions in Puertio Rico.* Computer Science(Outside Engineering) has been removed
4,085
2,214
428 335 23760 30 11
0
1,000
2,000
3,000
4,000
Whi
te
Asi
an
Unk
now
n
His
pani
c
Bla
ck o
r Afr.
Am
eric
an
Mul
tirac
ial
Am
eric
an In
dian
Haw
aiia
n/P
ac.Is
l
Number of Associate Professors by Race/Ethnicity (teaching)
60
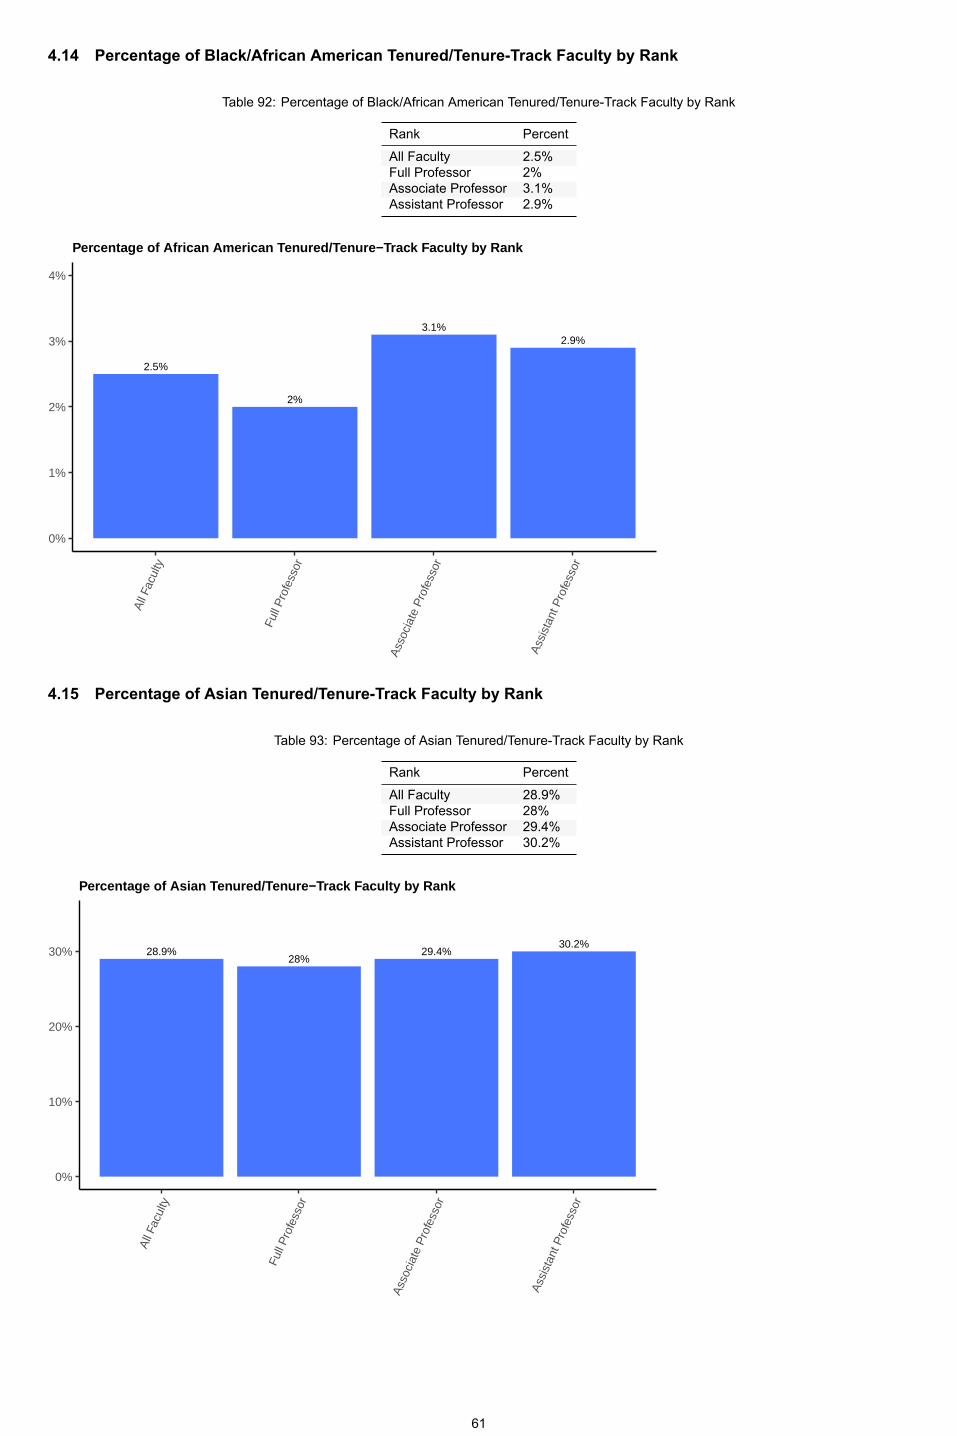
4.14 Percentage of Black/African American Tenured/TenureTrack Faculty by Rank
Table 92: Percentage of Black/African American Tenured/TenureTrack Faculty by Rank
Rank Percent
All Faculty 2.5%Full Professor 2%Associate Professor 3.1%Assistant Professor 2.9%
2.5%
2%
3.1%2.9%
0%
1%
2%
3%
4%
All
Facu
lty
Full
Pro
fess
or
Ass
ocia
te P
rofe
ssor
Ass
ista
nt P
rofe
ssor
Percentage of African American Tenured/Tenure−Track Faculty by Rank
4.15 Percentage of Asian Tenured/TenureTrack Faculty by Rank
Table 93: Percentage of Asian Tenured/TenureTrack Faculty by Rank
Rank PercentAll Faculty 28.9%Full Professor 28%Associate Professor 29.4%Assistant Professor 30.2%
28.9%28%
29.4%30.2%
0%
10%
20%
30%
All
Facu
lty
Full
Pro
fess
or
Ass
ocia
te P
rofe
ssor
Ass
ista
nt P
rofe
ssor
Percentage of Asian Tenured/Tenure−Track Faculty by Rank
61

4.16 Percentage of Hispanic Tenured/TenureTrack Faculty by Rank
Table 94: Percentage of Hispanic Tenured/TenureTrack Faculty by Rank
Rank Percent
All Faculty 3.9%Full Professor 3.8%Associate Professor 4.4%Assistant Professor 3.6%
3.9% 3.8%
4.4%
3.6%
0%
1%
2%
3%
4%
5%
6%
All
Facu
lty
Full
Pro
fess
or
Ass
ocia
te P
rofe
ssor
Ass
ista
nt P
rofe
ssor
Percentage of Hispanic Tenured/Tenure−Track Faculty by Rank
4.17 African American Tenured/Tenure Track Faculty by Institutions
Table 95: African American Tenured/Tenure Track Faculty by Institutions
No Institutions Number of Faculty1 Howard University 242 North Carolina A&T State University 202 University of Florida 204 Georgia Institute of Technology 194 Morgan State University 196 FAMUFSU College of Engineering 167 University of TennesseeChattanooga 158 University of Tennessee, Chattanooga 149 Massachusetts Institute of Technology 139 University of Michigan 1311 Virginia Polytechnic Institute and State University 1212 Rensselaer Polytechnic Institute 1112 Texas A&M University 1112 The Johns Hopkins University 1115 Florida Atlantic University 1015 University of Illinois at UrbanaChampaign 1015 University of Maryland, College Park 1018 Clemson University 918 Cornell University 918 University of California, Irvine 9* 310 Institutions included
62

4.18 Asian Tenured/Tenure Track Faculty by Institutions
Table 96: Asian Tenured/Tenure Track Faculty by Institutions
No Institutions Number of Faculty1 Georgia Institute of Technology 1942 Texas A&M University 1513 Florida Atlantic University 1474 Purdue University 1385 University of Illinois at UrbanaChampaign 1266 Rensselaer Polytechnic Institute 1177 Arizona State University 1138 University of Michigan 1069 Iowa State University 105
10 North Carolina State University 10311 The Ohio State University 10112 Michigan State University 9812 University of California, Los Angeles 9814 Virginia Polytechnic Institute and State University 9415 University of Central Florida 9016 The University of Texas at Arlington 8916 University of California, San Diego 8918 University at Buffalo, SUNY 8819 The Pennsylvania State University 8419 The University of Texas at Austin 84* 310 Institutions included
4.19 Hispanic Tenured/Tenure Track Faculty by Institutions
Table 97: Hispanic Tenured/Tenure Track Faculty by Institutions
No Institutions Number of Faculty1 University of Puerto Rico, Mayaguez Campus 1372 Florida Atlantic University 352 Texas A&M University 354 The University of Texas at El Paso 275 Massachusetts Institute of Technology 215 Purdue University 215 University of Miami 218 The University of Texas at San Antonio 188 University of California, San Diego 188 University of Illinois at UrbanaChampaign 1811 North Carolina State University 1711 University of Florida 1713 Arizona State University 1613 Georgia Institute of Technology 1613 University of Arizona 1616 Virginia Polytechnic Institute and State University 1517 The University of Texas at Austin 1418 The Pennsylvania State University 1318 University of California, Berkeley 1320 Stanford University 12* 310 Institutions included
63

4.20 Percentage of African American Tenured/TenureTrack Faculty by Discipline
Table 98: Percentage of African American Tenured/TenureTrackFaculty by Discipline: 2.5 % of Total
Discipline Name PercentageComputer 6.7%Engr. Management 5.9%Mining 4.8%Biological and Agricultural 4.6%Industrial/Manufacturing/Systems 3.6%Civil/Environmental 3.3%Electrical 3.3%Engineering (General) 2.9%Envr. Eng 2.9%Other 2.9%Chemical 2.7%Metallurgical and Matrls. 2.6%Mechanical 2.5%Electrical/Computer 2.4%Aerospace 2.2%Civil 2.2%Architectural 2%Biomedical 2%Engr. Science and Engr. Physics 1.9%Petroleum 1.8%Comp Sci. (inside Eng.) 1.5%Nuclear 1.3%Computer Sci. (outside Engr.) 1.2%
6.7%
5.9%
4.8%4.6%
3.6%
3.3% 3.3% 2.9% 2.9% 2.9%2.7% 2.6%
2.5%2.4%2.2% 2.2%2% 2% 1.9% 1.8%1.5%
1.3%1.2%
0%
1%
2%
3%
4%
5%
6%
7%
Com
pute
rE
ngr.
Man
agem
ent
Bio
logi
cal a
nd A
gric
ultu
ral
Min
ing
Indu
stria
l/Man
ufac
turin
g/S
yste
ms
Che
mic
alC
ivil/
Env
ironm
enta
lE
lect
rical
Eng
inee
ring
(Gen
eral
)E
nvr.
Eng
Met
allu
rgic
al a
nd M
atrls
.O
ther
Aer
ospa
ceA
rchi
tect
ural
Bio
med
ical
Civ
il
Com
p S
ci. (
insi
de E
ng.)
Ele
ctric
al/C
ompu
ter
Eng
r. S
cien
ce a
nd E
ngr.
Phy
sics
Mec
hani
cal
Petro
leum
Com
pute
r Sci
. (ou
tsid
e E
ngr.)
Nuc
lear
Percentage of African American Tenured/Tenure−Track Faculty by Discipline
64

4.21 Percentage of Hispanic Tenured/TenureTrack Faculty by Discipline
Table 99: Percentage of Hispanic Tenured/TenureTrack Facultyby Discipline: 3.9 % of Total
Discipline Name PercentageIndustrial/Manufacturing/Systems 6.8%Civil/Environmental 5.9%Engr. Management 5.9%Civil 5.6%Metallurgical and Matrls. 5.6%Envr. Eng 5.5%Chemical 5%Petroleum 4.7%Computer 4.6%Aerospace 4.4%Other 4.2%Biomedical 3.5%Mechanical 3.5%Electrical 3.4%Electrical/Computer 3.2%Architectural 3%Engineering (General) 2.9%Biological and Agricultural 2.7%Comp Sci. (inside Eng.) 2.5%Nuclear 2.2%Computer Sci. (outside Engr.) 2%Engr. Science and Engr. Physics 1.9%Mining 1.2%
6.8%
5.9% 5.9%5.6% 5.6%
5.5%5% 4.7%4.6%
4.4% 4.2%
3.5% 3.5%3.4% 3.2%3% 2.9%2.7% 2.5%
2.2%2% 1.9%
1.2%
0%
1%
2%
3%
4%
5%
6%
7%
8%
Indu
stria
l/Man
ufac
turin
g/S
yste
ms
Civ
ilC
ivil/
Env
ironm
enta
lE
ngr.
Man
agem
ent
Met
allu
rgic
al a
nd M
atrls
.C
hem
ical
Com
pute
rE
nvr.
Eng
Petro
leum
Aer
ospa
ceO
ther
Arc
hite
ctur
al
Bio
logi
cal a
nd A
gric
ultu
ral
Bio
med
ical
Com
p S
ci. (
insi
de E
ng.)
Ele
ctric
al
Ele
ctric
al/C
ompu
ter
Eng
inee
ring
(Gen
eral
)M
echa
nica
l
Com
pute
r Sci
. (ou
tsid
e E
ngr.)
Eng
r. S
cien
ce a
nd E
ngr.
Phy
sics
Nuc
lear
Min
ing
Percentage of Hispanic Tenured/Tenure−Track Faculty by Discipline
65

4.22 Percentage of Asian Tenured/TenureTrack Faculty by Discipline
Table 100: Percentage of Asian Tenured/TenureTrack Faculty byDiscipline: 28.9 % of Total
Discipline Name Percentage
Electrical 37.5%Computer 34.9%Comp Sci. (inside Eng.) 34.8%Electrical/Computer 32.6%Industrial/Manufacturing/Systems 31.8%Mechanical 30.7%Computer Sci. (outside Engr.) 28.6%Metallurgical and Matrls. 27.7%Biomedical 27.4%Engineering (General) 26.1%Civil/Environmental 26%Biological and Agricultural 25.2%Chemical 25%Civil 23.8%Nuclear 23.4%Other 23.4%Petroleum 23.4%Aerospace 22.5%Engr. Management 16.9%Envr. Eng 16.4%Mining 14.5%Engr. Science and Engr. Physics 13.6%Architectural 12.1%
37.5%
34.9%34.8%32.6%
31.8%30.7%
28.6%27.7%
27.4%26.1%26%
25.2% 25%23.8%
23.4% 23.4% 23.4%22.5%
16.9%16.4%
14.5%13.6%12.1%
0%
10%
20%
30%
40%
Ele
ctric
al
Com
p S
ci. (
insi
de E
ng.)
Com
pute
r
Ele
ctric
al/C
ompu
ter
Indu
stria
l/Man
ufac
turin
g/S
yste
ms
Mec
hani
cal
Com
pute
r Sci
. (ou
tsid
e E
ngr.)
Met
allu
rgic
al a
nd M
atrls
.B
iom
edic
alC
ivil/
Env
ironm
enta
l
Eng
inee
ring
(Gen
eral
)
Bio
logi
cal a
nd A
gric
ultu
ral
Che
mic
alC
ivil
Aer
ospa
ceN
ucle
arO
ther
Petro
leum
Eng
r. M
anag
emen
tE
nvr.
Eng
Eng
r. S
cien
ce a
nd E
ngr.
Phy
sics
Min
ing
Arc
hite
ctur
al
Percentage of Asian Tenured/Tenure−Track Faculty by Discipline
66
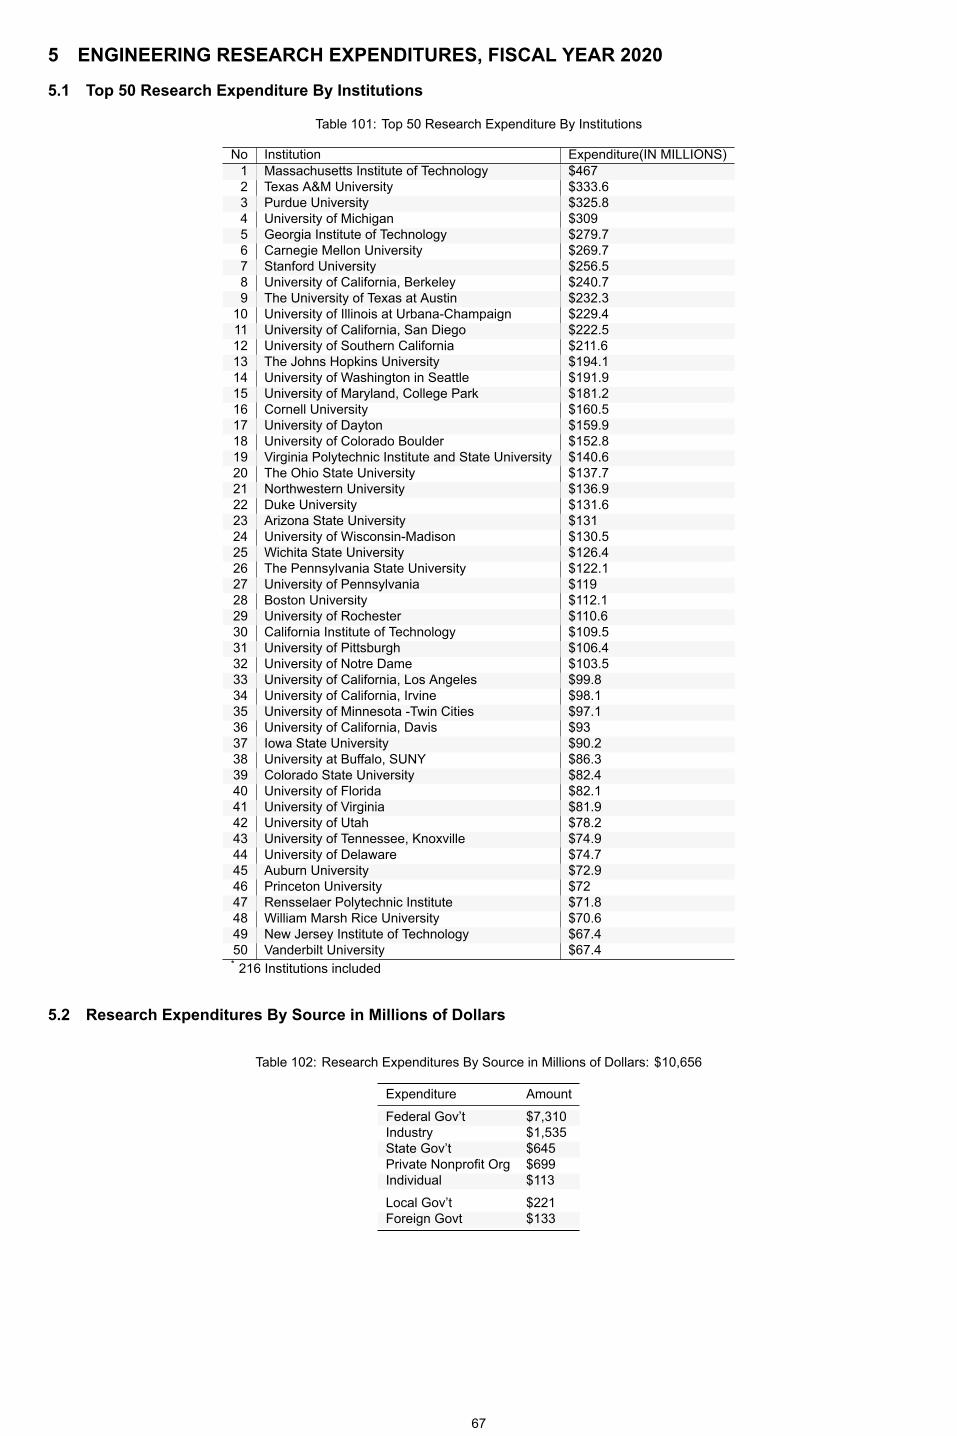
5 ENGINEERING RESEARCH EXPENDITURES, FISCAL YEAR 2020
5.1 Top 50 Research Expenditure By Institutions
Table 101: Top 50 Research Expenditure By Institutions
No Institution Expenditure(IN MILLIONS)1 Massachusetts Institute of Technology $4672 Texas A&M University $333.63 Purdue University $325.84 University of Michigan $3095 Georgia Institute of Technology $279.76 Carnegie Mellon University $269.77 Stanford University $256.58 University of California, Berkeley $240.79 The University of Texas at Austin $232.3
10 University of Illinois at UrbanaChampaign $229.411 University of California, San Diego $222.512 University of Southern California $211.613 The Johns Hopkins University $194.114 University of Washington in Seattle $191.915 University of Maryland, College Park $181.216 Cornell University $160.517 University of Dayton $159.918 University of Colorado Boulder $152.819 Virginia Polytechnic Institute and State University $140.620 The Ohio State University $137.721 Northwestern University $136.922 Duke University $131.623 Arizona State University $13124 University of WisconsinMadison $130.525 Wichita State University $126.426 The Pennsylvania State University $122.127 University of Pennsylvania $11928 Boston University $112.129 University of Rochester $110.630 California Institute of Technology $109.531 University of Pittsburgh $106.432 University of Notre Dame $103.533 University of California, Los Angeles $99.834 University of California, Irvine $98.135 University of Minnesota Twin Cities $97.136 University of California, Davis $9337 Iowa State University $90.238 University at Buffalo, SUNY $86.339 Colorado State University $82.440 University of Florida $82.141 University of Virginia $81.942 University of Utah $78.243 University of Tennessee, Knoxville $74.944 University of Delaware $74.745 Auburn University $72.946 Princeton University $7247 Rensselaer Polytechnic Institute $71.848 William Marsh Rice University $70.649 New Jersey Institute of Technology $67.450 Vanderbilt University $67.4* 216 Institutions included
5.2 Research Expenditures By Source in Millions of Dollars
Table 102: Research Expenditures By Source in Millions of Dollars: $10,656
Expenditure Amount
Federal Gov’t $7,310Industry $1,535State Gov’t $645Private Nonprofit Org $699Individual $113Local Gov’t $221Foreign Govt $133
67
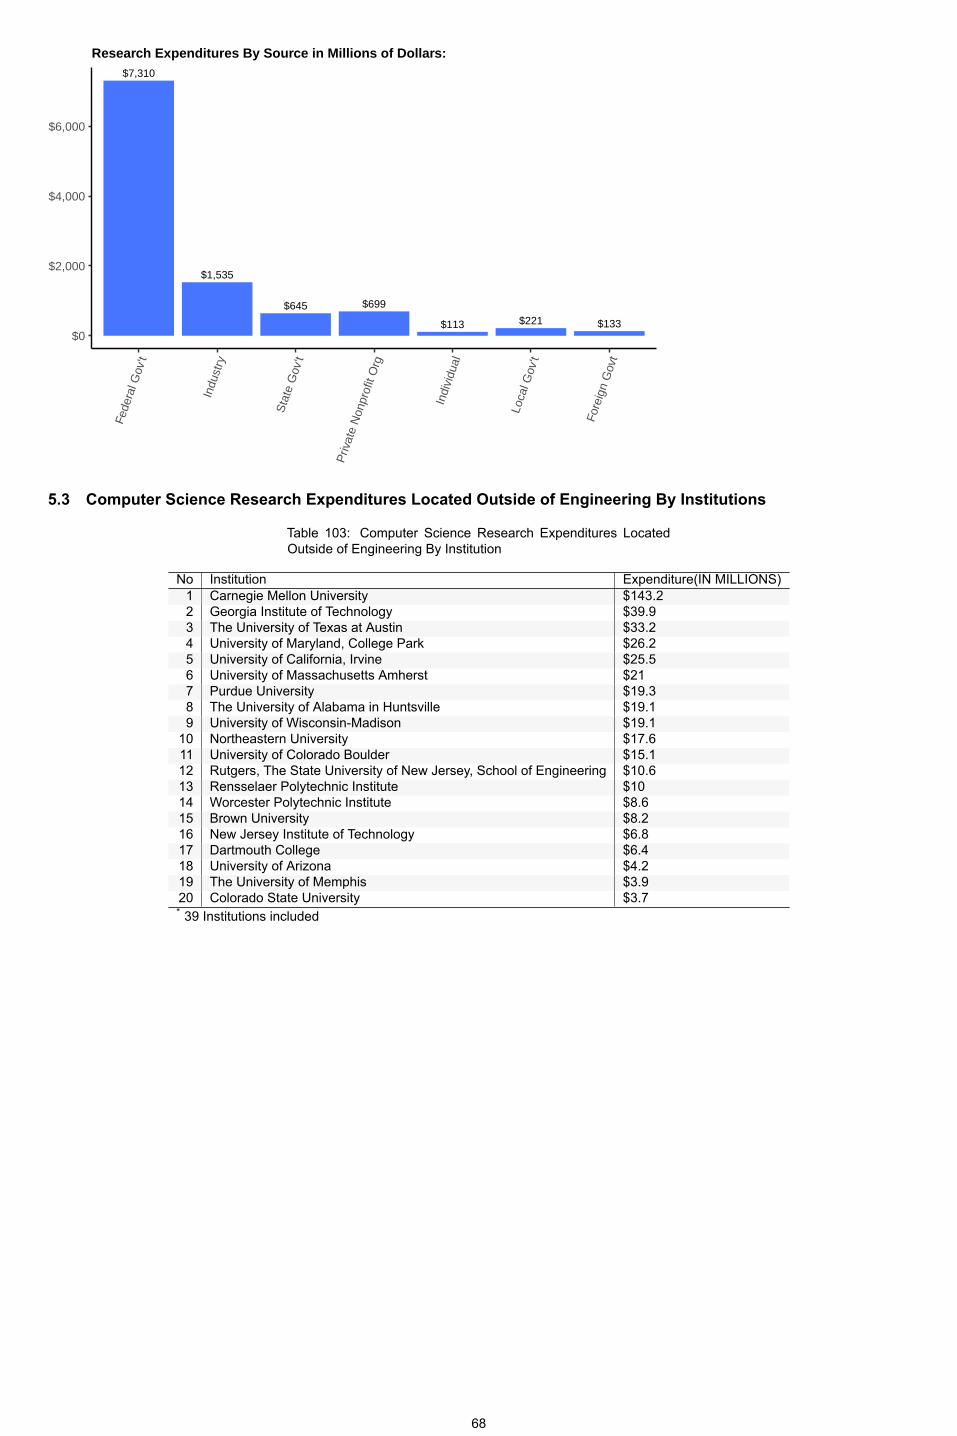
$7,310
$1,535
$645 $699
$113 $221 $133$0
$2,000
$4,000
$6,000Fe
dera
l Gov
't
Indu
stry
Sta
te G
ov't
Priv
ate
Non
prof
it O
rg
Indi
vidu
al
Loca
l Gov
't
Fore
ign
Gov
t
Research Expenditures By Source in Millions of Dollars:
5.3 Computer Science Research Expenditures Located Outside of Engineering By Institutions
Table 103: Computer Science Research Expenditures LocatedOutside of Engineering By Institution
No Institution Expenditure(IN MILLIONS)1 Carnegie Mellon University $143.22 Georgia Institute of Technology $39.93 The University of Texas at Austin $33.24 University of Maryland, College Park $26.25 University of California, Irvine $25.56 University of Massachusetts Amherst $217 Purdue University $19.38 The University of Alabama in Huntsville $19.19 University of WisconsinMadison $19.1
10 Northeastern University $17.611 University of Colorado Boulder $15.112 Rutgers, The State University of New Jersey, School of Engineering $10.613 Rensselaer Polytechnic Institute $1014 Worcester Polytechnic Institute $8.615 Brown University $8.216 New Jersey Institute of Technology $6.817 Dartmouth College $6.418 University of Arizona $4.219 The University of Memphis $3.920 Colorado State University $3.7* 39 Institutions included
68

6 CANADIAN ENGINEERING
6.1 Engineering Bachelors Degree by Canadian Institutions
Table 104: Engineering Bachelors Degree by Canadian Institutions
No Institutions Degrees Awarded1 University of Waterloo 1,3482 University of Toronto 1,0803 University of British Columbia 9224 Concordia University, Montreal 8495 University of Alberta 7976 McMaster University 7527 University of Calgary 5958 The University of Western Ontario 500
6.2 Engineering Masters Degree by Canadian Institutions
Table 105: Engineering Masters Degree by Canadian Institutions
No Institutions Degrees Awarded1 Concordia University, Montreal 1,2242 University of Toronto 7913 University of Waterloo 5534 The University of Western Ontario 4375 University of Alberta 3146 University of British Columbia 3107 University of Calgary 2968 McMaster University 155
6.3 Engineering Doctoral Degree by Canadian Institutions
Table 106: Engineering Doctoral Degree by Canadian Institutions
No Institutions Degrees Awarded1 University of Waterloo 1572 University of Toronto 1333 University of Alberta 964 Concordia University, Montreal 805 University of Calgary 766 University of British Columbia 747 The University of Western Ontario 658 McMaster University 42
6.4 Bachelors Degrees Awarded by Gender Canadian Institutions
Table 107: Bachelors Degrees Awarded by Gender Canadian Institutions
Gender Percentage
Female 26.1%Male 73.9%
73.9%
26.1%
0%
10%
20%
30%
40%
50%
60%
70%
80%
90%
100%
Mal
e
Fem
ale
Bachelors Degrees Awarded by Gender− Canadian Institutions
69
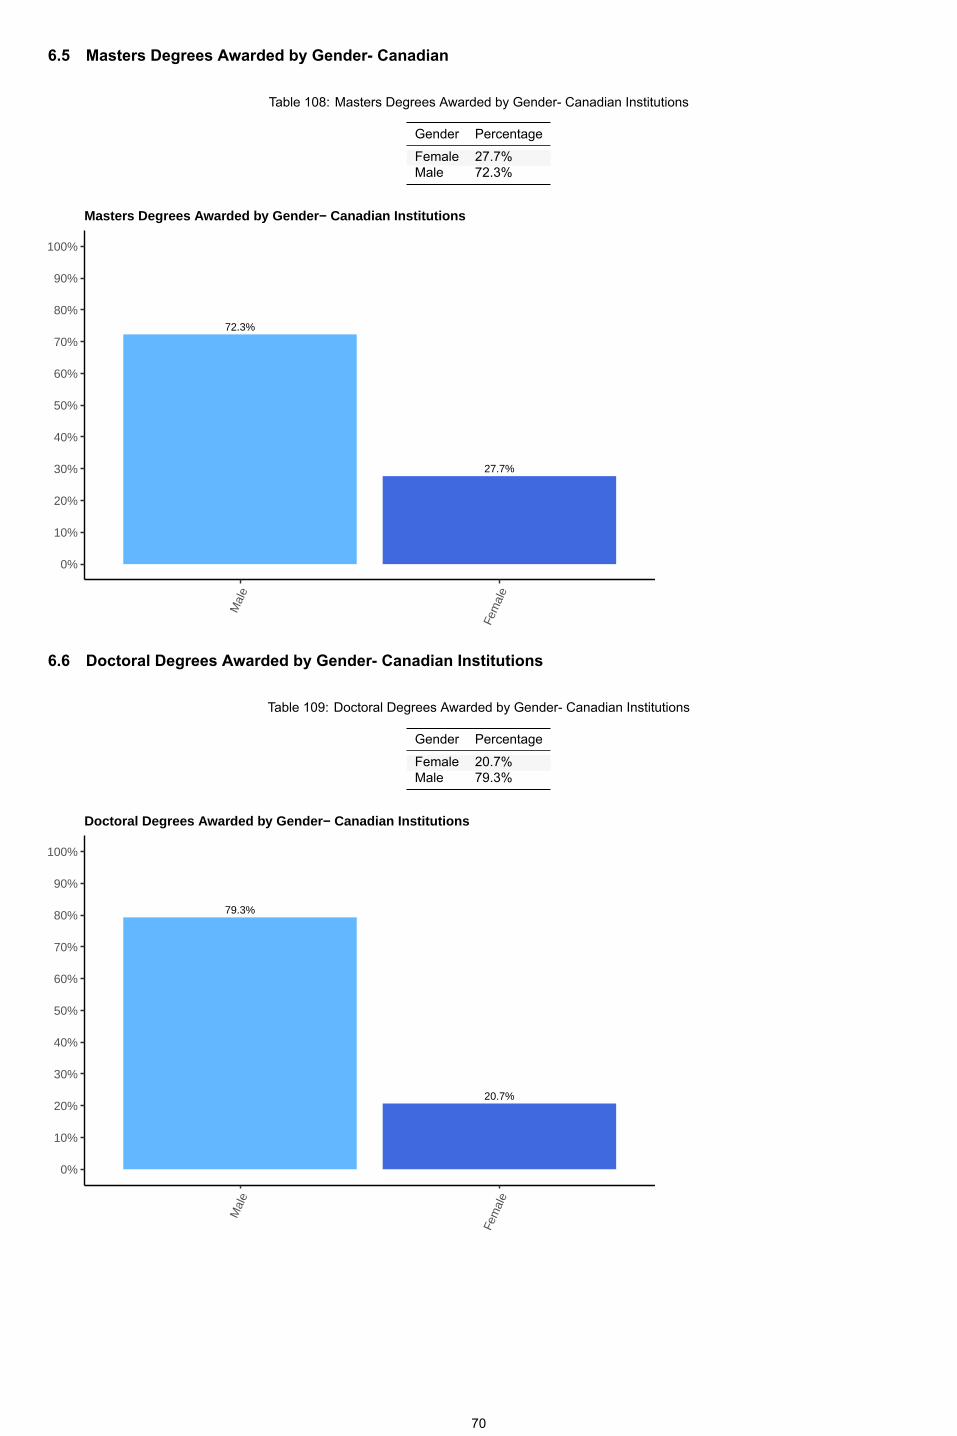
6.5 Masters Degrees Awarded by Gender Canadian
Table 108: Masters Degrees Awarded by Gender Canadian Institutions
Gender Percentage
Female 27.7%Male 72.3%
72.3%
27.7%
0%
10%
20%
30%
40%
50%
60%
70%
80%
90%
100%M
ale
Fem
ale
Masters Degrees Awarded by Gender− Canadian Institutions
6.6 Doctoral Degrees Awarded by Gender Canadian Institutions
Table 109: Doctoral Degrees Awarded by Gender Canadian Institutions
Gender Percentage
Female 20.7%Male 79.3%
79.3%
20.7%
0%
10%
20%
30%
40%
50%
60%
70%
80%
90%
100%
Mal
e
Fem
ale
Doctoral Degrees Awarded by Gender− Canadian Institutions
70

6.7 Tenured/TenureTrack Faculty Members by Institutions
Table 110: Tenured/TenureTrack Faculty Members by Institutions
No Institutions Degrees Awarded
1 University of Waterloo 2812 Concordia University, Montreal 2753 University of Toronto 2474 University of Alberta 2245 University of British Columbia 1756 University of Calgary 1497 McMaster University 1478 The University of Western Ontario 100
6.8 Percentage of Female Tenured/TenureTrack Faculty by Rank Canadian Institutions
Table 111: Doctoral Enrollment by Race and Ethnicity*
Rank Percent
All Faculty 17.6%Full Professor 13.2%Associate Professor 19%Assistant Professor 29.9%
17.6%
13.2%
19%
29.9%
0
10
20
30
All
Facu
lty
Full
Pro
fess
or
Ass
ocia
te P
rofe
ssor
Ass
ista
nt P
rofe
ssor
Percentage of Female Tenured/Tenure−Track Faculty by Rank− Canadian Institutions
71

7 ENGINEERING TECHNOLOGY
7.1 ENGINEERING TECHNOLOGY DEGREES7.1.1 Engineering Technology Degrees Awarded by Discipline
Table 112: Engineering Technology Degrees Awarded by Discipline : 11,249
Discipline Name Degrees AwardedOther Eng. Tech. Disciplines 3,596Engr. Tech. (General) 1,886Mechanical Engr. Tech. 1,436Construction Engr. Tech. 1,393Industrial/Manufacturing Eng. Tech. 1,317Computer Engr. Tech. 625Electrical/Electronics Eng. Tech. 467Civil Engr. Tech. 221Architectural Engr. Tech. 176Aerospace Engr. Tech. 132
3,596
1,886
1,436 1,393 1,317
625467
221 176 132
0
1,000
2,000
3,000
Oth
er E
ng. T
ech.
Dis
cipl
ines
Eng
r. Te
ch. (
Gen
eral
)M
echa
nica
l Eng
r. Te
ch.
Con
stru
ctio
n E
ngr.
Tech
.In
dust
rial/M
anuf
actu
ring
Eng
. Tec
h.
Com
pute
r Eng
r. Te
ch.
Ele
ctric
al/E
lect
roni
cs E
ng. T
ech.
Civ
il E
ngr.
Tech
.A
rchi
tect
ural
Eng
r. Te
ch.
Aer
ospa
ce E
ngr.
Tech
.
Engineering Technology Degrees Awarded by Discipline
7.1.2 Engineering Technology Degrees Awarded to Underrepresented Minorities by Discipline
Table 113: Engineering Technology Degrees Awarded to Underrepresented Minorities by Engineering Discipline: 2,432
Discipline Name Degrees Awarded
Other Eng. Tech. Disciplines 841Engr. Tech. (General) 515Construction Engr. Tech. 320Industrial/Manufacturing Eng. Tech. 222Mechanical Engr. Tech. 211Computer Engr. Tech. 132Electrical/Electronics Eng. Tech. 96Civil Engr. Tech. 39Architectural Engr. Tech. 36Aerospace Engr. Tech. 20* Total does not include computer science (outside engineering).
72
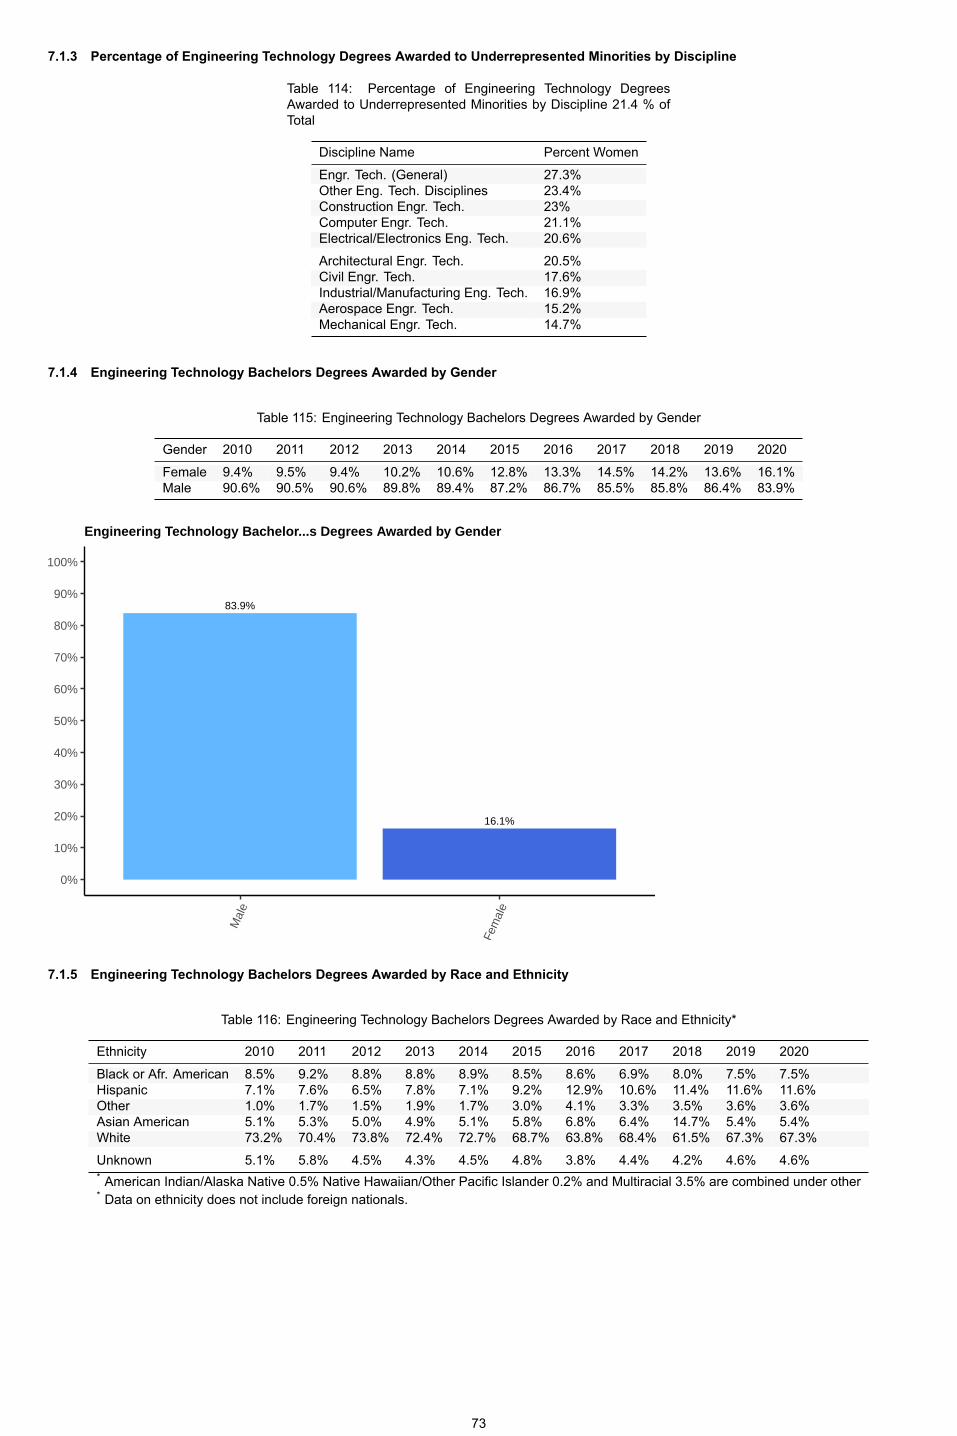
7.1.3 Percentage of Engineering Technology Degrees Awarded to Underrepresented Minorities by Discipline
Table 114: Percentage of Engineering Technology DegreesAwarded to Underrepresented Minorities by Discipline 21.4 % ofTotal
Discipline Name Percent WomenEngr. Tech. (General) 27.3%Other Eng. Tech. Disciplines 23.4%Construction Engr. Tech. 23%Computer Engr. Tech. 21.1%Electrical/Electronics Eng. Tech. 20.6%Architectural Engr. Tech. 20.5%Civil Engr. Tech. 17.6%Industrial/Manufacturing Eng. Tech. 16.9%Aerospace Engr. Tech. 15.2%Mechanical Engr. Tech. 14.7%
7.1.4 Engineering Technology Bachelors Degrees Awarded by Gender
Table 115: Engineering Technology Bachelors Degrees Awarded by Gender
Gender 2010 2011 2012 2013 2014 2015 2016 2017 2018 2019 2020Female 9.4% 9.5% 9.4% 10.2% 10.6% 12.8% 13.3% 14.5% 14.2% 13.6% 16.1%Male 90.6% 90.5% 90.6% 89.8% 89.4% 87.2% 86.7% 85.5% 85.8% 86.4% 83.9%
83.9%
16.1%
0%
10%
20%
30%
40%
50%
60%
70%
80%
90%
100%
Mal
e
Fem
ale
Engineering Technology Bachelor...s Degrees Awarded by Gender
7.1.5 Engineering Technology Bachelors Degrees Awarded by Race and Ethnicity
Table 116: Engineering Technology Bachelors Degrees Awarded by Race and Ethnicity*
Ethnicity 2010 2011 2012 2013 2014 2015 2016 2017 2018 2019 2020
Black or Afr. American 8.5% 9.2% 8.8% 8.8% 8.9% 8.5% 8.6% 6.9% 8.0% 7.5% 7.5%Hispanic 7.1% 7.6% 6.5% 7.8% 7.1% 9.2% 12.9% 10.6% 11.4% 11.6% 11.6%Other 1.0% 1.7% 1.5% 1.9% 1.7% 3.0% 4.1% 3.3% 3.5% 3.6% 3.6%Asian American 5.1% 5.3% 5.0% 4.9% 5.1% 5.8% 6.8% 6.4% 14.7% 5.4% 5.4%White 73.2% 70.4% 73.8% 72.4% 72.7% 68.7% 63.8% 68.4% 61.5% 67.3% 67.3%Unknown 5.1% 5.8% 4.5% 4.3% 4.5% 4.8% 3.8% 4.4% 4.2% 4.6% 4.6%* American Indian/Alaska Native 0.5% Native Hawaiian/Other Pacific Islander 0.2% and Multiracial 3.5% are combined under other* Data on ethnicity does not include foreign nationals.
73
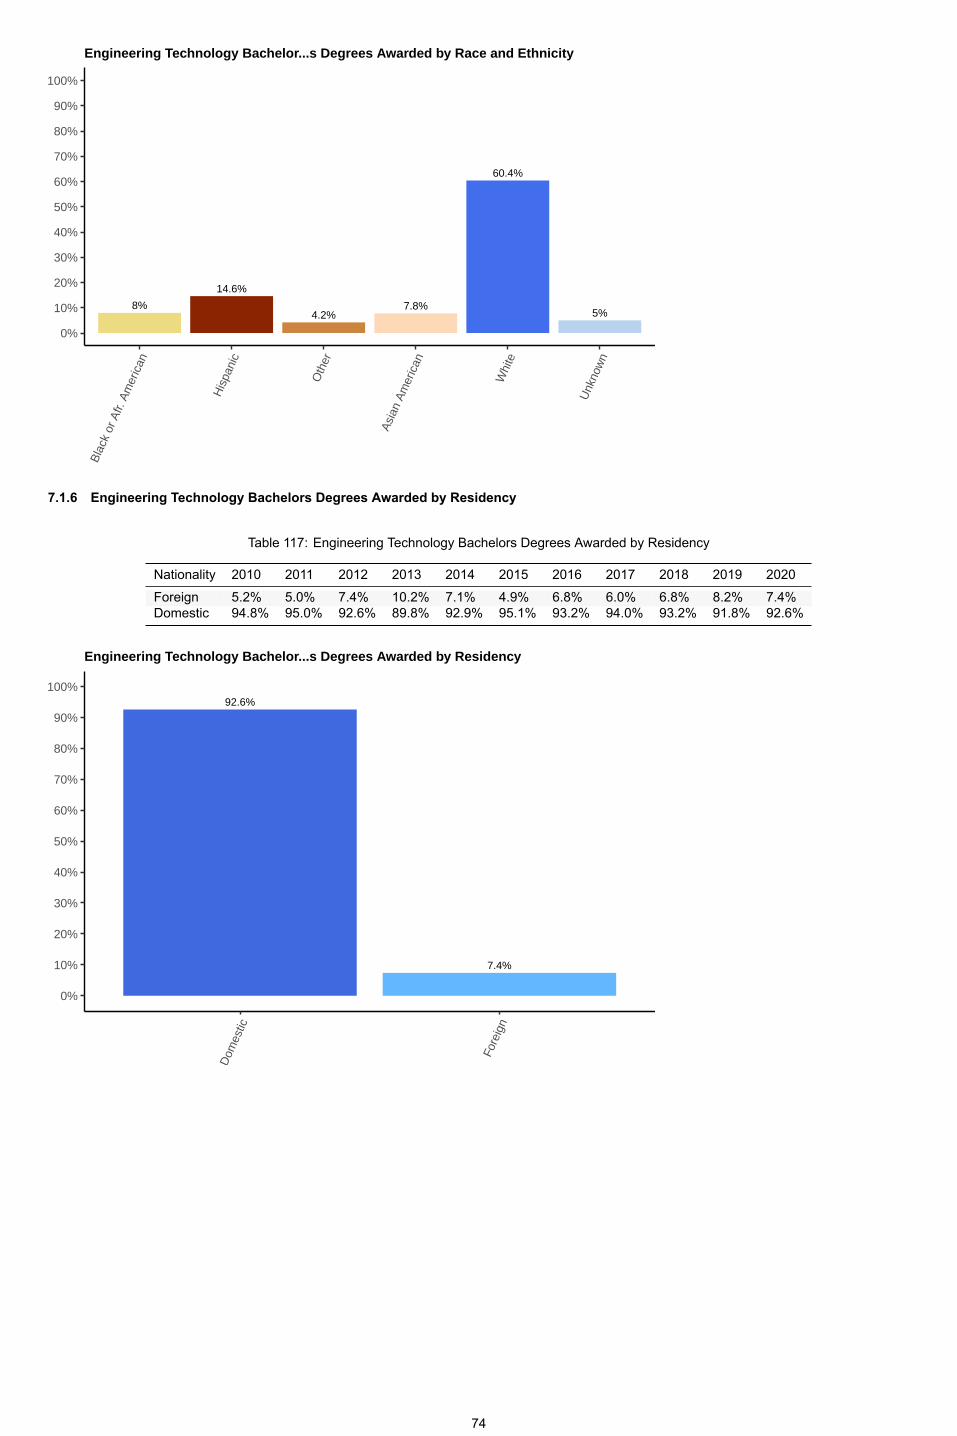
8%
14.6%
4.2%7.8%
60.4%
5%
0%
10%
20%
30%
40%
50%
60%
70%
80%
90%
100%B
lack
or A
fr. A
mer
ican
His
pani
c
Oth
er
Asi
an A
mer
ican
Whi
te
Unk
now
n
Engineering Technology Bachelor...s Degrees Awarded by Race and Ethnicity
7.1.6 Engineering Technology Bachelors Degrees Awarded by Residency
Table 117: Engineering Technology Bachelors Degrees Awarded by Residency
Nationality 2010 2011 2012 2013 2014 2015 2016 2017 2018 2019 2020Foreign 5.2% 5.0% 7.4% 10.2% 7.1% 4.9% 6.8% 6.0% 6.8% 8.2% 7.4%Domestic 94.8% 95.0% 92.6% 89.8% 92.9% 95.1% 93.2% 94.0% 93.2% 91.8% 92.6%
7.4%
92.6%
0%
10%
20%
30%
40%
50%
60%
70%
80%
90%
100%
Dom
estic
Fore
ign
Engineering Technology Bachelor...s Degrees Awarded by Residency
74

7.1.7 Top 50 Institutions Awarding Highest Number of ET Degrees
Table 118: Top 50 Institutions Awarding Highest Number of ET Degrees
No Institutions Degrees Awarded1 University of Houston 9032 Arizona State University 6873 Fu Foundation School of Engineering and Applied Science Columbia University 6274 Farmingdale State College (SUNY) 5435 Texas A&M University 5416 East Carolina University 5007 Indiana UniversityPurdue University Indianapolis 3378 Ferris State University 2539 Eastern Michigan University 233
10 Rochester Institute of Technology 22311 University of North Carolina at Charlotte 22212 New Jersey Institute of Technology 21713 Purdue University Northwest, Technology 19314 Texas State University 18715 The University of Toledo 17116 University of Wisconsin, Platteville 16817 Oklahoma State University 16318 Old Dominion University 16219 Kennesaw State University 14920 University of Cincinnati 14321 Murray State University 13622 Eastern Kentucky University 13123 University of Southern Mississippi 12824 Purdue University Northwest, Engineering 12625 California State UniversityChico 11526 Georgia Southern University 10827 Northern Illinois University 10127 Penn State Erie, The Behrend College 10129 Tarleton State University 9830 University of Dayton 9730 University of North Texas 9732 University of Louisiana at Lafayette 9232 University of Maine 9232 Western Carolina University 9235 California State UniversityFresno 9036 University of Wisconsin Stout 8937 Montana State University 8738 SUNY Polytechnic Institute 8539 New Mexico State University 8439 Weber State University 8441 Central Connecticut State University 8342 California State Polytechnic University, Pomona 8142 Western Michigan University 8144 Eastern Washington University 7945 Miami University 7846 University of Central Oklahoma 7447 Oregon Institute of Technology 7347 Purdue University Fort Wayne 7347 Southeast Missouri State University 7350 Ohio University 71* 120 Institutions included
7.1.8 Top 50 Institutions by Engineering Technology Degrees awarded to Underrepresented Minorities
Table 119: Top 50 Institutions by Engineering Technology Degreesawarded to Underrepresented Minorities
No Institutions Degrees Awarded1 University of Houston 4442 Farmingdale State College (SUNY) 1863 Arizona State University 1724 Texas A&M University 1365 Fu Foundation School of Engineering and Applied Science Columbia University 1046 East Carolina University 907 Texas State University 698 Indiana UniversityPurdue University Indianapolis 639 New Jersey Institute of Technology 58
10 New Mexico State University 5211 Kennesaw State University 5112 California State UniversityChico 4112 Eastern Michigan University 4112 Rochester Institute of Technology 4115 California State UniversityFresno 38
75

Table 119: Top 50 Institutions by Engineering Technology Degreesawarded to Underrepresented Minorities (continued)
No Institutions Degrees Awarded16 California State Polytechnic University, Pomona 3517 University of North Carolina at Charlotte 3418 University of North Texas 3219 Prairie View A & M University 3120 Old Dominion University 2721 University of Southern Mississippi 2622 Central Connecticut State University 2522 Northern Illinois University 2524 Purdue University Northwest, Engineering 2425 Jackson State University 2325 University of Hartford 2327 Ferris State University 2228 Lamar University 1929 Georgia Southern University 1829 Tarleton State University 1829 Vaughn College of Aeronautics and Technology 1832 University of Louisiana at Lafayette 1633 Norfolk State University 1533 Oklahoma State University 1533 South Carolina State University 1536 Murray State University 1436 Virginia State University 1438 University of Maryland Eastern Shore 1339 Miami University 1239 University of Cincinnati 1241 Eastern Kentucky University 1141 Western Michigan University 1143 Purdue University Northwest, Technology 1043 The University of Memphis 1043 Western Carolina University 1043 Western Illinois University 1047 Alabama A & M University 947 Eastern Washington University 947 Middle Tennessee State University 947 SUNY Polytechnic Institute 9* 120 Institutions included
7.1.9 Top 50 Institutions by Percentage of Engineering Technology Degrees awarded to Underrepresented Minorities
Table 120: Top 50 Institutions by Percentage of Engineering Technology Degrees awarded to Underrepresented Minorities
No Institutions Percent Underrepresented Minorities1 Alabama A & M University 100%1 Benjamin Franklin Institute of Technology 100%1 Jackson State University 100%1 Prairie View A & M University 100%5 South Carolina State University 93.8%6 Norfolk State University 83.3%7 University of Maryland Eastern Shore 72.2%8 New Mexico State University 61.9%9 The University of Texas Rio Grande Valley 60%
10 Vaughn College of Aeronautics and Technology 54.5%11 Pace University 50%11 Wright State University 50%13 University of Houston 49.2%14 Western Illinois University 43.5%15 California State Polytechnic University, Pomona 43.2%16 California State UniversityFresno 42.2%17 Lamar University 38.8%18 Colorado State University, Pueblo 38.1%19 Texas State University 36.9%20 California State UniversityChico 35.7%21 Farmingdale State College (SUNY) 34.3%22 Kennesaw State University 34.2%23 Drexel University 33.3%23 University of Hartford 33.3%25 University of North Texas 33%26 Central Connecticut State University 30.1%27 Fairleigh Dickinson UniversityMetropolitan Campus 30%27 West Texas A & M University 30%29 The University of Memphis 28.6%30 Virginia State University 26.9%31 New Jersey Institute of Technology 26.7%32 Texas A&M University 25.1%33 Arizona State University 25%34 Northern Illinois University 24.8%35 Tennessee State University 23.8%36 Eastern Illinois University 22.7%37 The University of West Florida 21.9%
76
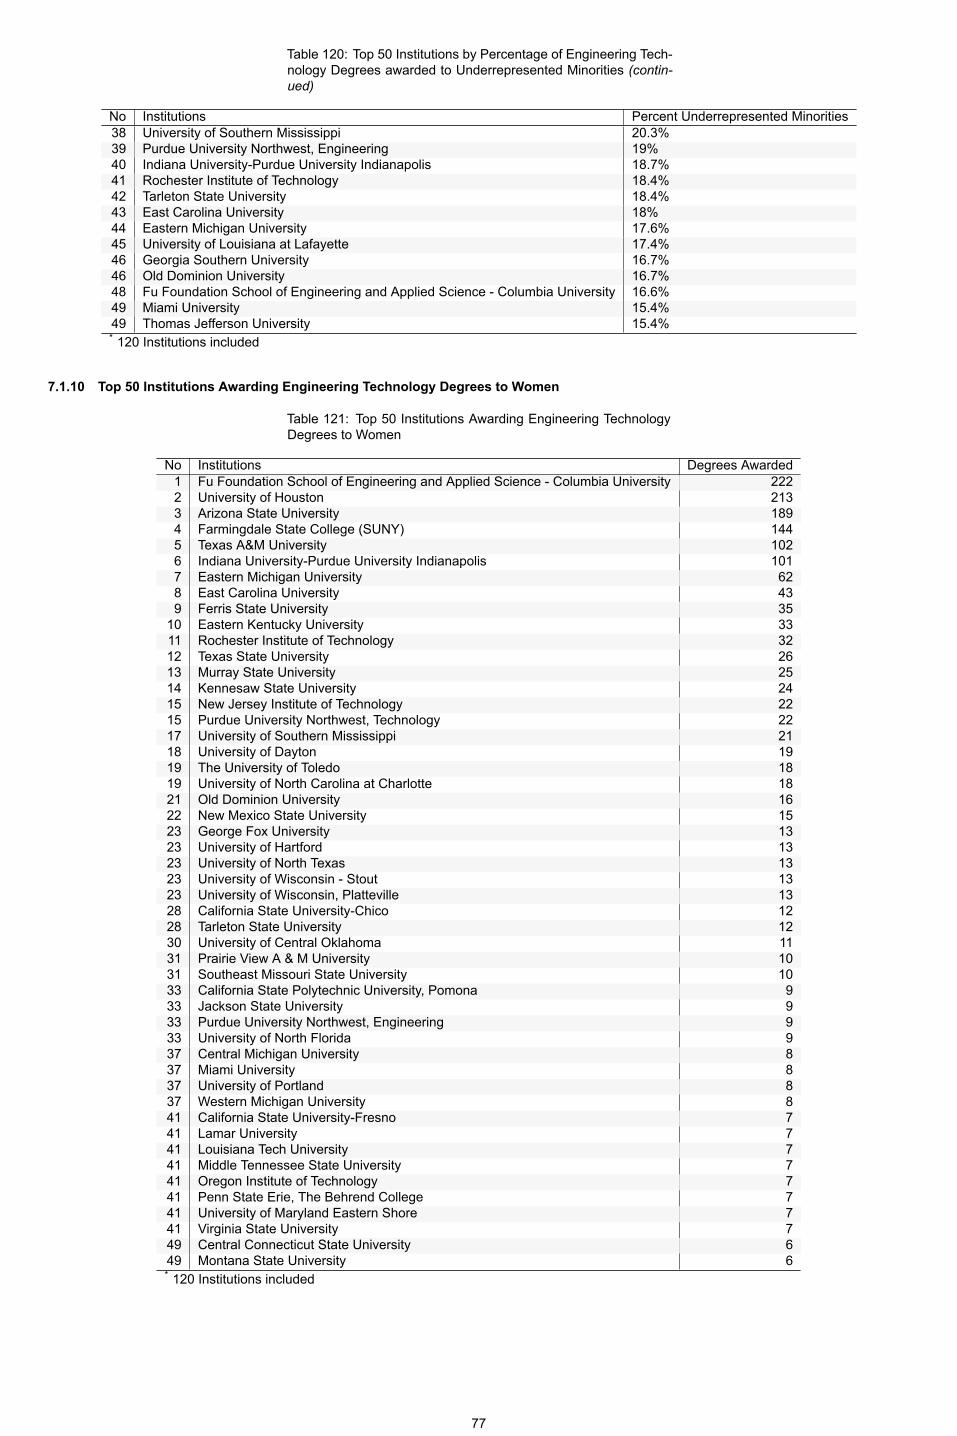
Table 120: Top 50 Institutions by Percentage of Engineering Technology Degrees awarded to Underrepresented Minorities (continued)
No Institutions Percent Underrepresented Minorities38 University of Southern Mississippi 20.3%39 Purdue University Northwest, Engineering 19%40 Indiana UniversityPurdue University Indianapolis 18.7%41 Rochester Institute of Technology 18.4%42 Tarleton State University 18.4%43 East Carolina University 18%44 Eastern Michigan University 17.6%45 University of Louisiana at Lafayette 17.4%46 Georgia Southern University 16.7%46 Old Dominion University 16.7%48 Fu Foundation School of Engineering and Applied Science Columbia University 16.6%49 Miami University 15.4%49 Thomas Jefferson University 15.4%* 120 Institutions included
7.1.10 Top 50 Institutions Awarding Engineering Technology Degrees to Women
Table 121: Top 50 Institutions Awarding Engineering TechnologyDegrees to Women
No Institutions Degrees Awarded1 Fu Foundation School of Engineering and Applied Science Columbia University 2222 University of Houston 2133 Arizona State University 1894 Farmingdale State College (SUNY) 1445 Texas A&M University 1026 Indiana UniversityPurdue University Indianapolis 1017 Eastern Michigan University 628 East Carolina University 439 Ferris State University 35
10 Eastern Kentucky University 3311 Rochester Institute of Technology 3212 Texas State University 2613 Murray State University 2514 Kennesaw State University 2415 New Jersey Institute of Technology 2215 Purdue University Northwest, Technology 2217 University of Southern Mississippi 2118 University of Dayton 1919 The University of Toledo 1819 University of North Carolina at Charlotte 1821 Old Dominion University 1622 New Mexico State University 1523 George Fox University 1323 University of Hartford 1323 University of North Texas 1323 University of Wisconsin Stout 1323 University of Wisconsin, Platteville 1328 California State UniversityChico 1228 Tarleton State University 1230 University of Central Oklahoma 1131 Prairie View A & M University 1031 Southeast Missouri State University 1033 California State Polytechnic University, Pomona 933 Jackson State University 933 Purdue University Northwest, Engineering 933 University of North Florida 937 Central Michigan University 837 Miami University 837 University of Portland 837 Western Michigan University 841 California State UniversityFresno 741 Lamar University 741 Louisiana Tech University 741 Middle Tennessee State University 741 Oregon Institute of Technology 741 Penn State Erie, The Behrend College 741 University of Maryland Eastern Shore 741 Virginia State University 749 Central Connecticut State University 649 Montana State University 6* 120 Institutions included
77
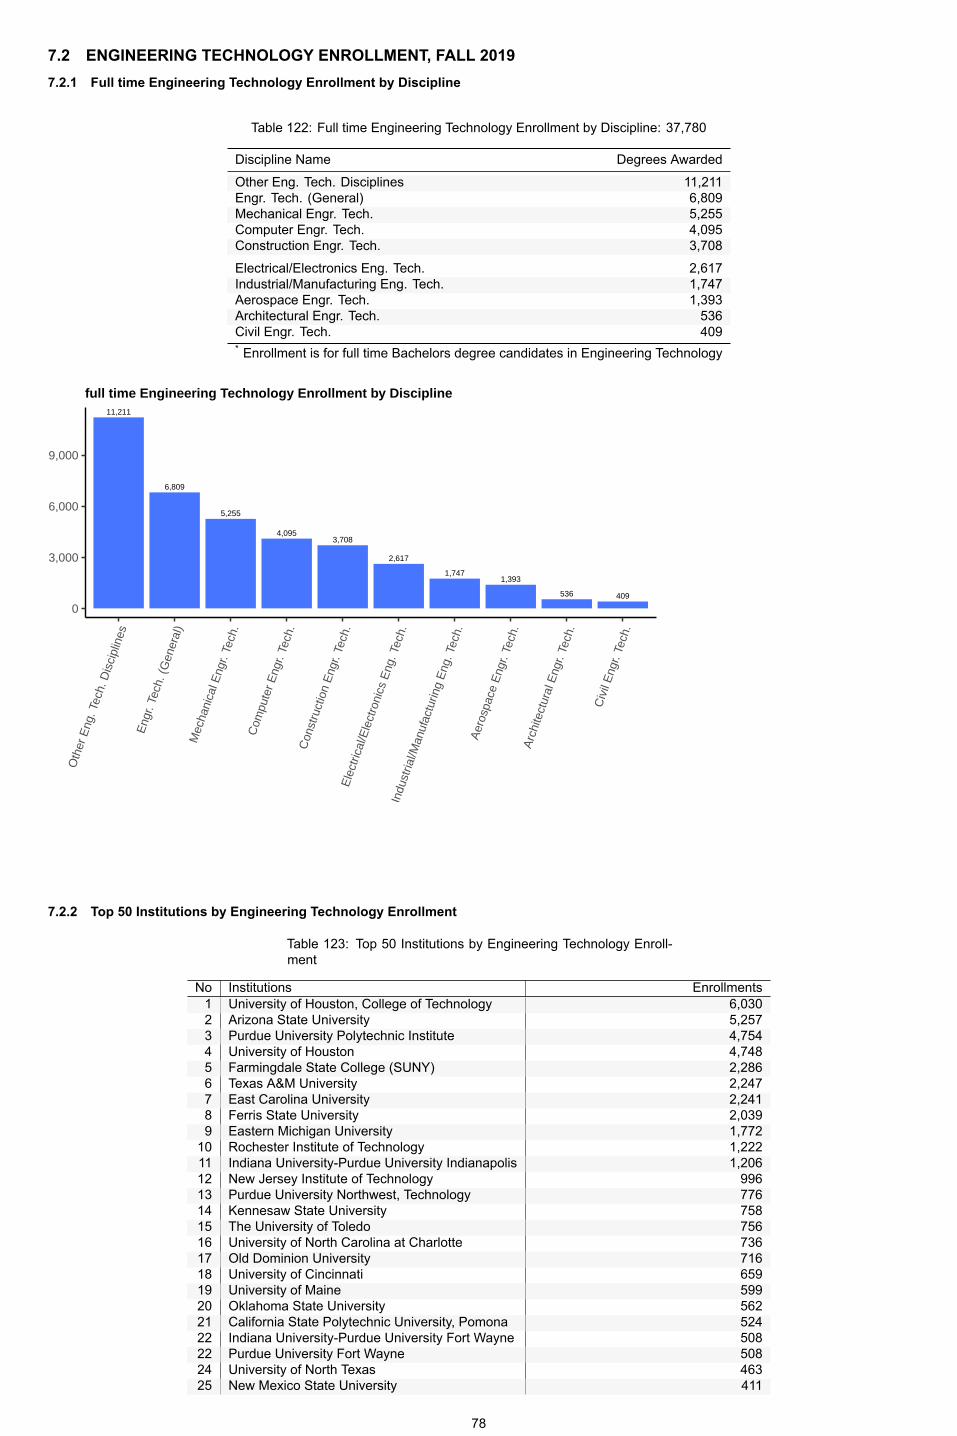
7.2 ENGINEERING TECHNOLOGY ENROLLMENT, FALL 20197.2.1 Full time Engineering Technology Enrollment by Discipline
Table 122: Full time Engineering Technology Enrollment by Discipline: 37,780
Discipline Name Degrees Awarded
Other Eng. Tech. Disciplines 11,211Engr. Tech. (General) 6,809Mechanical Engr. Tech. 5,255Computer Engr. Tech. 4,095Construction Engr. Tech. 3,708Electrical/Electronics Eng. Tech. 2,617Industrial/Manufacturing Eng. Tech. 1,747Aerospace Engr. Tech. 1,393Architectural Engr. Tech. 536Civil Engr. Tech. 409* Enrollment is for full time Bachelors degree candidates in Engineering Technology
11,211
6,809
5,255
4,0953,708
2,617
1,7471,393
536 409
0
3,000
6,000
9,000
Oth
er E
ng. T
ech.
Dis
cipl
ines
Eng
r. Te
ch. (
Gen
eral
)M
echa
nica
l Eng
r. Te
ch.
Com
pute
r Eng
r. Te
ch.
Con
stru
ctio
n E
ngr.
Tech
.E
lect
rical
/Ele
ctro
nics
Eng
. Tec
h.In
dust
rial/M
anuf
actu
ring
Eng
. Tec
h.A
eros
pace
Eng
r. Te
ch.
Arc
hite
ctur
al E
ngr.
Tech
.
Civ
il E
ngr.
Tech
.
full time Engineering Technology Enrollment by Discipline
7.2.2 Top 50 Institutions by Engineering Technology Enrollment
Table 123: Top 50 Institutions by Engineering Technology Enrollment
No Institutions Enrollments1 University of Houston, College of Technology 6,0302 Arizona State University 5,2573 Purdue University Polytechnic Institute 4,7544 University of Houston 4,7485 Farmingdale State College (SUNY) 2,2866 Texas A&M University 2,2477 East Carolina University 2,2418 Ferris State University 2,0399 Eastern Michigan University 1,772
10 Rochester Institute of Technology 1,22211 Indiana UniversityPurdue University Indianapolis 1,20612 New Jersey Institute of Technology 99613 Purdue University Northwest, Technology 77614 Kennesaw State University 75815 The University of Toledo 75616 University of North Carolina at Charlotte 73617 Old Dominion University 71618 University of Cincinnati 65919 University of Maine 59920 Oklahoma State University 56221 California State Polytechnic University, Pomona 52422 Indiana UniversityPurdue University Fort Wayne 50822 Purdue University Fort Wayne 50824 University of North Texas 46325 New Mexico State University 411
78

Table 123: Top 50 Institutions by Engineering Technology Enrollment (continued)
No Institutions Enrollments26 The Pennsylvania State University 41027 Montana State University 37927 SUNY Polytechnic Institute 37929 University of Wisconsin Stout 37830 Western Carolina University 37431 Oregon Institute of Technology 33932 Buffalo State 33633 Brigham Young University Idaho 31834 Northern Illinois University 31535 Minnesota State UniversityMankato 29536 University of Hartford 29337 Miami University 28838 University of Dayton 27839 Wayne State University 26840 Penn State Erie, The Behrend College 24541 The University of Memphis 24042 Ohio University 23743 Louisiana Tech University 23643 South Dakota State University 23645 Abilene Christian University 23446 Tennessee Technological University 21747 University of Tennessee, Chattanooga 21548 California State University Maritime Academy 20749 Virginia State University 20650 Western Michigan University 205* 120 Institutions reported.* Enrollment is for full time and parttime Bachelors degree candidates in engineering technology.
7.2.3 Engineering Technology Enrollment by Gender
Table 124: Engineering Technology Enrollment by Gender
Gender Percentage
Female 20.8%Male 79.2%
79.8%
20.2%
0%
10%
20%
30%
40%
50%
60%
70%
80%
90%
100%
Mal
e
Fem
ale
Engineering Technology Bachelor...s Enrollment by Gender
79

7.2.4 Engineering Technology Enrollment by Race and Ethnicity
Table 125: Engineering Technology Enrollment by Race and Ethnicity*
Ethnicity Percentage
Black or Afr. American 9.8%Hispanic 16.5%Other 7.1%Asian American 8.1%White 55.4%Unknown 3%* American Indian/Alaska Native 0.5% Native Hawaiian/Other Pacific Islander 0.2%* and Multiracial 3.5% are combined under other* Data on ethnicity does not include foreign nationals.
9.9%
19.7%
4.2%9.1%
55.1%
2.1%0%
10%
20%
30%
40%
50%
60%
70%
80%
90%
100%
Bla
ck o
r Afr.
Am
eric
an
His
pani
c
Oth
er
Asi
an A
mer
ican
Whi
te
Unk
now
n
Engineering Technology Enrollment by Race and Ethnicity
80

7.2.5 Engineering Technology Enrollment by Residency
Table 126: Engineering Technology Enrollment Awarded by Residency
Nationality Percentage
Foreign 4.3%Domestic 95.7%* Enrollment is for full time and parttime Bachelors degree candidates in engineering technology* 69 Institutions reported.
3.6%
96.4%
0%
10%
20%
30%
40%
50%
60%
70%
80%
90%
100%
Dom
estic
Fore
ign
Engineering Technology Enrollment Awarded by Residency
81

i
COVID-19 and Engineering Education1
Introduction
The American Society for Engineering Education (ASEE) has collected data from engineering, computing, and engineering technology programs in its annual Profiles of Engineering and Engineering Technology (Profiles) since 2001. The data collected reflects detailed demographic headcounts for program enrollment, department tenured/tenure-track faculty, and degrees awarded.
This report is an initial analysis of the data collected for Profiles 2020 as ASEE’s Department of Institutional Research & Analytics prepares a longer version of this report on the effects of COVID-19 on engineering education in the United States to be released separately before the end of 2021.
Executive Summary
• While there is a large amount of institution-specific variability, the number of domestic applications to undergraduate engineering programs for Fall 2021 have remained steady. There has been a decrease in applications for master’s and doctoral engineering programs.
• Engineering schools at Hispanic-Serving Institutions (HSIs) and Asian American, Native American, Pacific Islander-Serving Institutions (AANAPISIs) admitted a higher rate of applicants in Fall 2020.
• Whether or not applications translate into enrollments is a difficult question to answer for Fall 2021. Several institutions have reported an expected large increase in Fall 2021 enrollments due to deferrals from Fall 2020 and Spring 2021. Several institutions are reporting they are preparing for “mega-classes,” especially for first-year students.
• Nationally, representation of women and underrepresented minorities2 shows no decline in undergraduate engineering programs, including for the Fall 2020 freshman class.
• Freshman enrollment showed a median decline for all engineering disciplines in Fall 2020.
1 This work is part of an ongoing project on the effects of COVID-19 on engineering education funded by NSF-EEC Award #1748840. Any views expressed are those of the individual author and do not necessarily represent the views of the National Science Foundation. 2 ASEE uses the definition of underrepresented minority (URM) for the engineering fields from NSF’s Science and Engineering Indicators report (https://ncses.nsf.gov/pubs/nsb20201/glossary ): "This category comprises three racial or ethnic minority groups (blacks or African Americans, Hispanics or Latinos, and American Indians or Alaska Natives) whose representation in S&E education or occupations is smaller than their representation in the U.S. population."
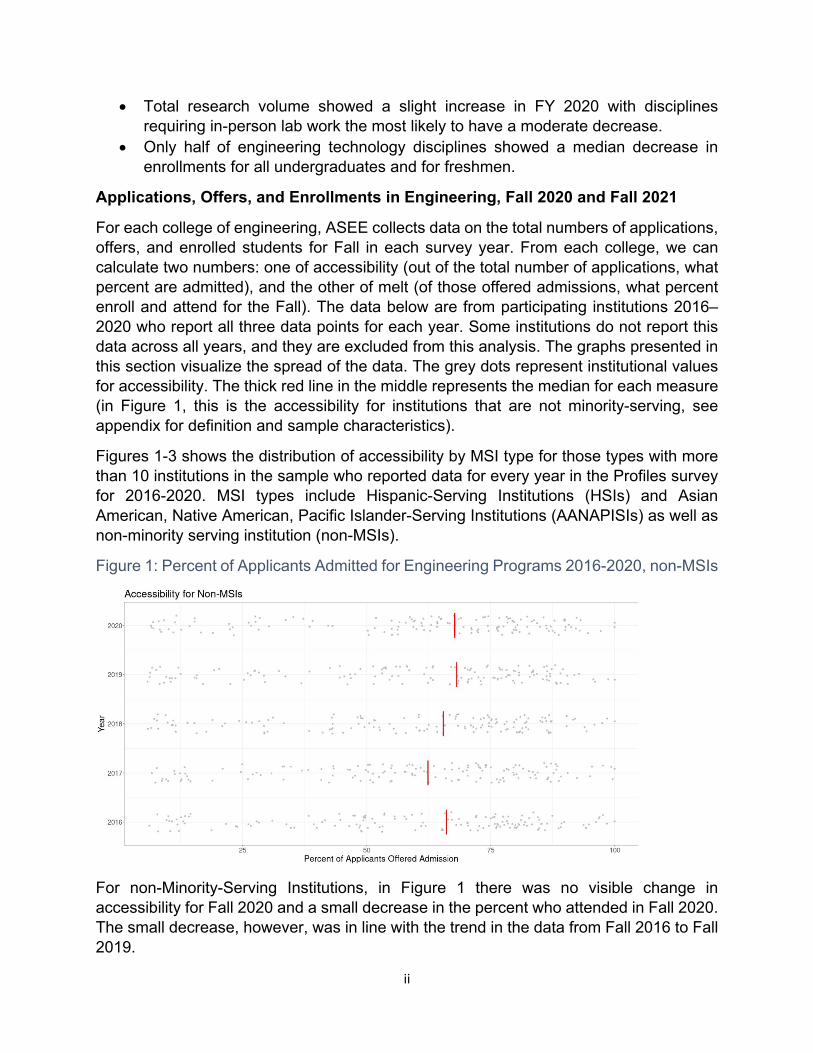
ii
• Total research volume showed a slight increase in FY 2020 with disciplines requiring in-person lab work the most likely to have a moderate decrease.
• Only half of engineering technology disciplines showed a median decrease in enrollments for all undergraduates and for freshmen.
Applications, Offers, and Enrollments in Engineering, Fall 2020 and Fall 2021
For each college of engineering, ASEE collects data on the total numbers of applications, offers, and enrolled students for Fall in each survey year. From each college, we can calculate two numbers: one of accessibility (out of the total number of applications, what percent are admitted), and the other of melt (of those offered admissions, what percent enroll and attend for the Fall). The data below are from participating institutions 2016–2020 who report all three data points for each year. Some institutions do not report this data across all years, and they are excluded from this analysis. The graphs presented in this section visualize the spread of the data. The grey dots represent institutional values for accessibility. The thick red line in the middle represents the median for each measure (in Figure 1, this is the accessibility for institutions that are not minority-serving, see appendix for definition and sample characteristics).
Figures 1-3 shows the distribution of accessibility by MSI type for those types with more than 10 institutions in the sample who reported data for every year in the Profiles survey for 2016-2020. MSI types include Hispanic-Serving Institutions (HSIs) and Asian American, Native American, Pacific Islander-Serving Institutions (AANAPISIs) as well as non-minority serving institution (non-MSIs).
Figure 1: Percent of Applicants Admitted for Engineering Programs 2016-2020, non-MSIs
For non-Minority-Serving Institutions, in Figure 1 there was no visible change in accessibility for Fall 2020 and a small decrease in the percent who attended in Fall 2020. The small decrease, however, was in line with the trend in the data from Fall 2016 to Fall 2019.

iii
Figure 2: Percent of Applicants Admitted for Engineering Programs 2016-2020, HSIs
For both MSIs and AANAPISIs, as seen in Figures 2 and 3, there is a median increase in accessibility for Fall 2020 in contrast to the median trend for Fall 2016–2019. The institutional variability, however, remains stable for Fall 2020. The enrollment melt remained stable for Fall 2020 (as can be seen by graphs in the appendix); some institutions, however, have reported that fewer students had chosen to enroll due to the inability of an institution to provide financial aid in the amount they had in past years.
Figure 3: Percent of Applicants Admitted for Engineering Programs 2016-2020, AANAPISIs
Fall 2021 Survey (May 2021): A survey was sent to institutions in early May 2021 requesting numbers for domestic and international student applications for Fall 2021 and, similarly, for Fall 2020 as a baseline. Since the Profiles data collection does not
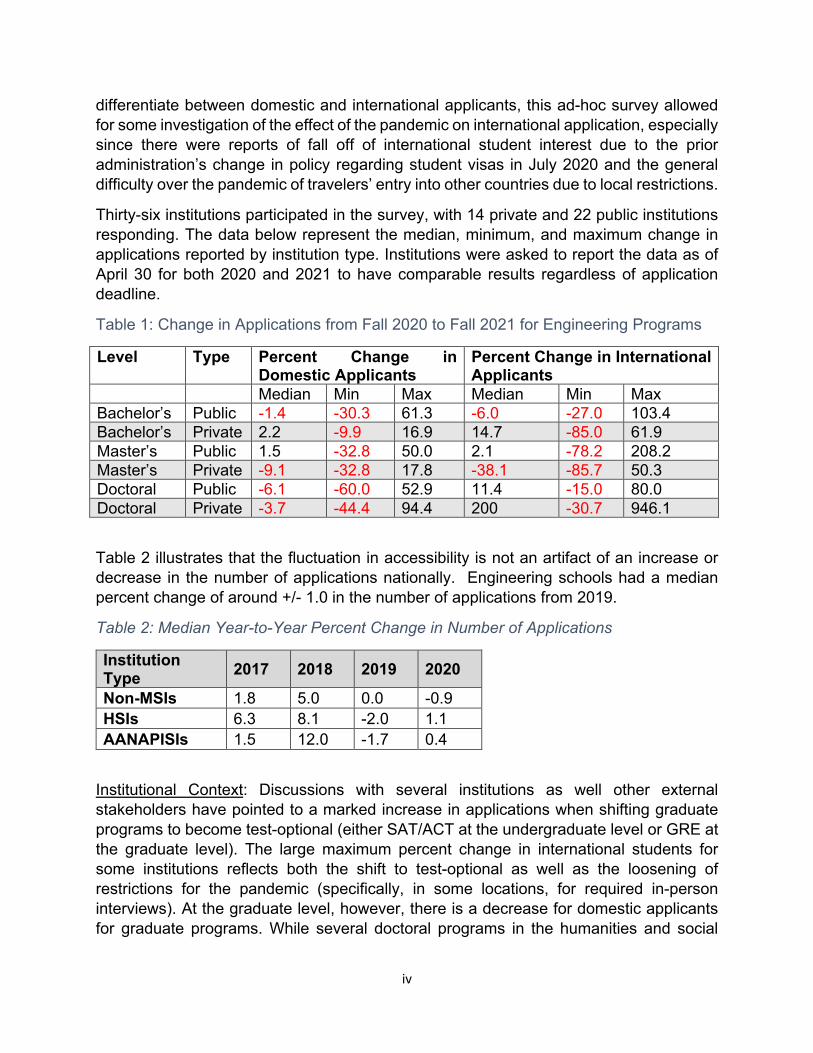
iv
differentiate between domestic and international applicants, this ad-hoc survey allowed for some investigation of the effect of the pandemic on international application, especially since there were reports of fall off of international student interest due to the prior administration’s change in policy regarding student visas in July 2020 and the general difficulty over the pandemic of travelers’ entry into other countries due to local restrictions.
Thirty-six institutions participated in the survey, with 14 private and 22 public institutions responding. The data below represent the median, minimum, and maximum change in applications reported by institution type. Institutions were asked to report the data as of April 30 for both 2020 and 2021 to have comparable results regardless of application deadline.
Table 1: Change in Applications from Fall 2020 to Fall 2021 for Engineering Programs
Level Type Percent Change in Domestic Applicants
Percent Change in International Applicants
Median Min Max Median Min Max Bachelor’s Public -1.4 -30.3 61.3 -6.0 -27.0 103.4 Bachelor’s Private 2.2 -9.9 16.9 14.7 -85.0 61.9 Master’s Public 1.5 -32.8 50.0 2.1 -78.2 208.2 Master’s Private -9.1 -32.8 17.8 -38.1 -85.7 50.3 Doctoral Public -6.1 -60.0 52.9 11.4 -15.0 80.0 Doctoral Private -3.7 -44.4 94.4 200 -30.7 946.1
Table 2 illustrates that the fluctuation in accessibility is not an artifact of an increase or decrease in the number of applications nationally. Engineering schools had a median percent change of around +/- 1.0 in the number of applications from 2019.
Table 2: Median Year-to-Year Percent Change in Number of Applications
Institution Type 2017 2018 2019 2020
Non-MSIs 1.8 5.0 0.0 -0.9 HSIs 6.3 8.1 -2.0 1.1 AANAPISIs 1.5 12.0 -1.7 0.4
Institutional Context: Discussions with several institutions as well other external stakeholders have pointed to a marked increase in applications when shifting graduate programs to become test-optional (either SAT/ACT at the undergraduate level or GRE at the graduate level). The large maximum percent change in international students for some institutions reflects both the shift to test-optional as well as the loosening of restrictions for the pandemic (specifically, in some locations, for required in-person interviews). At the graduate level, however, there is a decrease for domestic applicants for graduate programs. While several doctoral programs in the humanities and social

v
sciences have suspended admissions for Fall 20213, no engineering program has stated that they are suspending admissions or lowering the number of students admitted due to the pandemic. This may be due to the potentially strong job market in engineering and technical occupations as the U.S. economy emerges from the widespread shutdowns in March 2020. Finally, some institutions reported that beyond the overall variability in application numbers, they witnessed a shift in the pool of applicants for Fall 2021 to more local rather than geographically dispersed populations.
Fall 2020 Enrollment by Engineering Discipline
Institutions report data to ASEE by class (including freshman, sophomore, junior, and senior), gender, race/ethnicity, engineering discipline, program name, and department name. For this section of the report, we examine the change from 2019 to 2020 for undergraduate enrollment and doctoral enrollment.
Percent Change: This measure represents the percent difference between 2019 versus 2020 totals. For example, when looking at institutional total enrollment, if there were 50 students enrolled in 2019 and 55 students enrolled in 2020, that would represent a +5 percent change in enrollment (55-50)/50 x 100.
Change in Percent: This measure represents the change in percent of each group between 2019 and 2020. For example, if women represent 10 percent of total undergraduate enrollment in 2019 and 15 percent of total undergraduate enrollment in 2020, the change in percent would be 5 (15 percent-10 percent) and represents a normalized measure across years. This measure more closely reflects year-to-year change when the focus is on increasing representation.
Each figure represents the percent change in enrollment by engineering discipline, with the grey dots representing each institution in the sample and the red lines the calculated medians for each discipline. The blue dashed line represents no difference between 2019 and 2020.
Freshman Enrollment
Total undergraduate enrollment represents one dimension of potential worry for the future engineering workforce, but an important subset of that is the change in the first-year enrollment for 2020. Throughout the past year, many stakeholders have reported that first-year undergraduate students deferred enrollment. Nationally, this effect can be seen in the decrease in median percent change of freshman enrollment for all disciplines shown in Figure 4. The exceptions to this were programs in computer science, environmental engineering, and aerospace engineering.
3 A recent Chronicle story tracks those programs: https://www.chronicle.com/article/more-doctoral-programs-suspend-admissions-that-could-have-lasting-effects-on-graduate-education?cid2=gen_login_refresh&cid=gen_sign_in

vi
Figure 4: Change in Freshmen Enrollment for Fall 2020 for Engineering Disciplines
To contextualize the decreases seen in the freshman cohort for Fall 2020, some analysis of recent year trends is necessary: in other words, is there already an on-going trend of enrollment decline or was Fall 2020 an aberration. Figure 5 illustrates the year-to-year change for the freshman cohort from 2017 to 2020. Some institutions have first-year engineering programs that they do not report in the Profiles survey (i.e. programs where students are admitted to the college of engineering, but are undeclared and select a engineering major after the first or later year). Only institutions that report at least one freshman enrolled the college of engineering in each year from 2016 to 2020 were included. There were 234 institutions that met that inclusion criteria for Figure 5 and Table 3.

vii
Figure 5: Engineering Freshman Percent Change in Enrollment 2016-2020
All institutions report a median percent decrease in freshmen engineering enrollment in Fall 2020 of -4.1, but also reported a median percent decrease in Fall 2019 (pre-pandemic) of -3.6. Overall engineering enrollment has increased since 2005 as reported in Engineering by the Numbers from ASEE in 2005-2019, but the data from 2016 to 2020 suggest the potential start of a decline which be accelerated by the pandemic.
Table 3: Year-to-Year Percent Change in Total Freshmen Engineering Enrollment by Type of Institution
Type 2017 2018 2019 2020 Asian American, Native American, Pacific Islander Serving Institution (AANAPISI)
-0.8 0.9 -6.7 -3.2
Historical Black College or University (HBCU) -3.4 5.4 0.0 -0.8
Hispanic Serving Institution (HSI) 0.52 -0.51 -12.2 -4.1 Minority Serving Engineering Improvement Program (MSEIP) -4.8 4.2 -15.6 -9.4
Non-Minority Serving Institution (non-MSI) -0.9 0.9 -3.6 -4.1
All Institutions -0.3 0.3 -3.6 -4.1
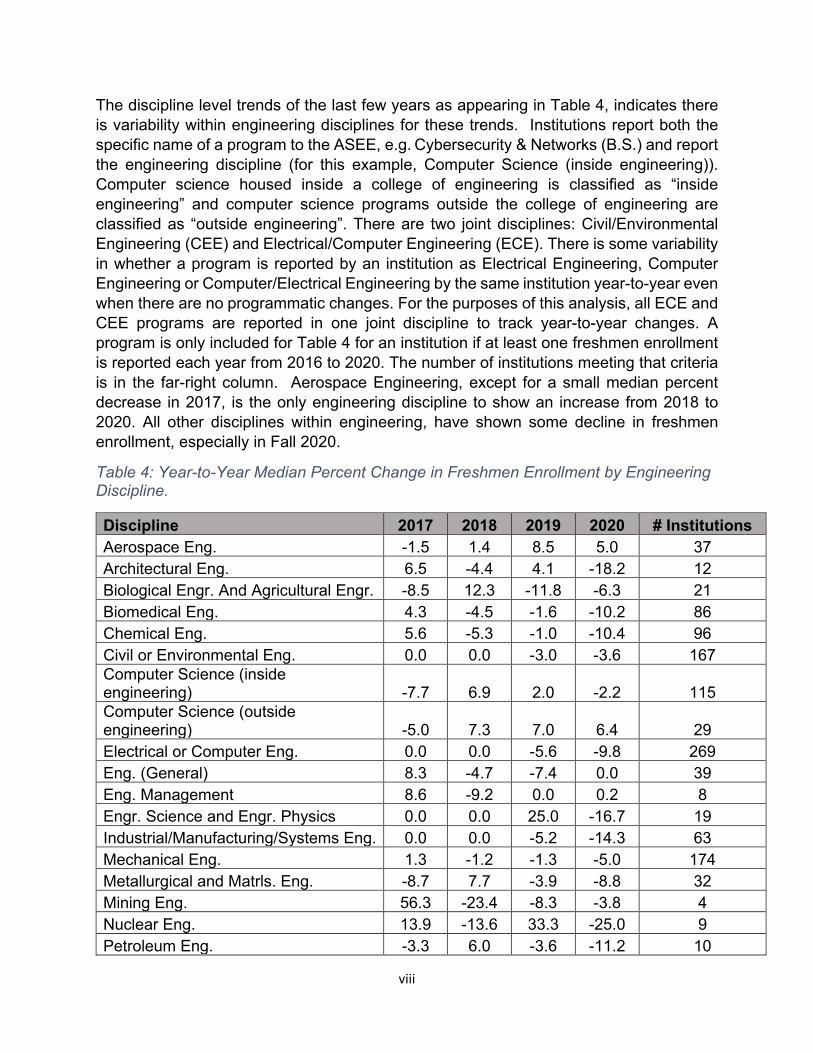
viii
The discipline level trends of the last few years as appearing in Table 4, indicates there is variability within engineering disciplines for these trends. Institutions report both the specific name of a program to the ASEE, e.g. Cybersecurity & Networks (B.S.) and report the engineering discipline (for this example, Computer Science (inside engineering)). Computer science housed inside a college of engineering is classified as “inside engineering” and computer science programs outside the college of engineering are classified as “outside engineering”. There are two joint disciplines: Civil/Environmental Engineering (CEE) and Electrical/Computer Engineering (ECE). There is some variability in whether a program is reported by an institution as Electrical Engineering, Computer Engineering or Computer/Electrical Engineering by the same institution year-to-year even when there are no programmatic changes. For the purposes of this analysis, all ECE and CEE programs are reported in one joint discipline to track year-to-year changes. A program is only included for Table 4 for an institution if at least one freshmen enrollment is reported each year from 2016 to 2020. The number of institutions meeting that criteria is in the far-right column. Aerospace Engineering, except for a small median percent decrease in 2017, is the only engineering discipline to show an increase from 2018 to 2020. All other disciplines within engineering, have shown some decline in freshmen enrollment, especially in Fall 2020.
Table 4: Year-to-Year Median Percent Change in Freshmen Enrollment by Engineering Discipline.
Discipline 2017 2018 2019 2020 # Institutions Aerospace Eng. -1.5 1.4 8.5 5.0 37 Architectural Eng. 6.5 -4.4 4.1 -18.2 12 Biological Engr. And Agricultural Engr. -8.5 12.3 -11.8 -6.3 21 Biomedical Eng. 4.3 -4.5 -1.6 -10.2 86 Chemical Eng. 5.6 -5.3 -1.0 -10.4 96 Civil or Environmental Eng. 0.0 0.0 -3.0 -3.6 167 Computer Science (inside engineering) -7.7 6.9 2.0 -2.2 115 Computer Science (outside engineering) -5.0 7.3 7.0 6.4 29 Electrical or Computer Eng. 0.0 0.0 -5.6 -9.8 269 Eng. (General) 8.3 -4.7 -7.4 0.0 39 Eng. Management 8.6 -9.2 0.0 0.2 8 Engr. Science and Engr. Physics 0.0 0.0 25.0 -16.7 19 Industrial/Manufacturing/Systems Eng. 0.0 0.0 -5.2 -14.3 63 Mechanical Eng. 1.3 -1.2 -1.3 -5.0 174 Metallurgical and Matrls. Eng. -8.7 7.7 -3.9 -8.8 32 Mining Eng. 56.3 -23.4 -8.3 -3.8 4 Nuclear Eng. 13.9 -13.6 33.3 -25.0 9 Petroleum Eng. -3.3 6.0 -3.6 -11.2 10

ix
Total Undergraduate Enrollment
Figure 6 represents the change in Fall 2020 enrollment for all undergraduates. Over half of all engineering disciplines showed a median percent decrease in undergraduate program enrollment, with petroleum engineering, metallurgical and materials engineering, and civil/environmental engineering showing the largest decrease from Fall 2019 to Fall 2020.
Figure 6: Change in Undergraduate Enrollment in Fall 2020 by Discipline
In examining underrepresented minority enrollment by engineering discipline in undergraduate programs, a noticeable difference appears, in that most engineering programs report near zero median change in percent. This indicates that in the disciplines with an overall decrease in enrollment, representation of URMs in that cohort remained stable nationally, even with large institutional swings as seen in the distribution of the institutional level responses (seen in the grey dots).
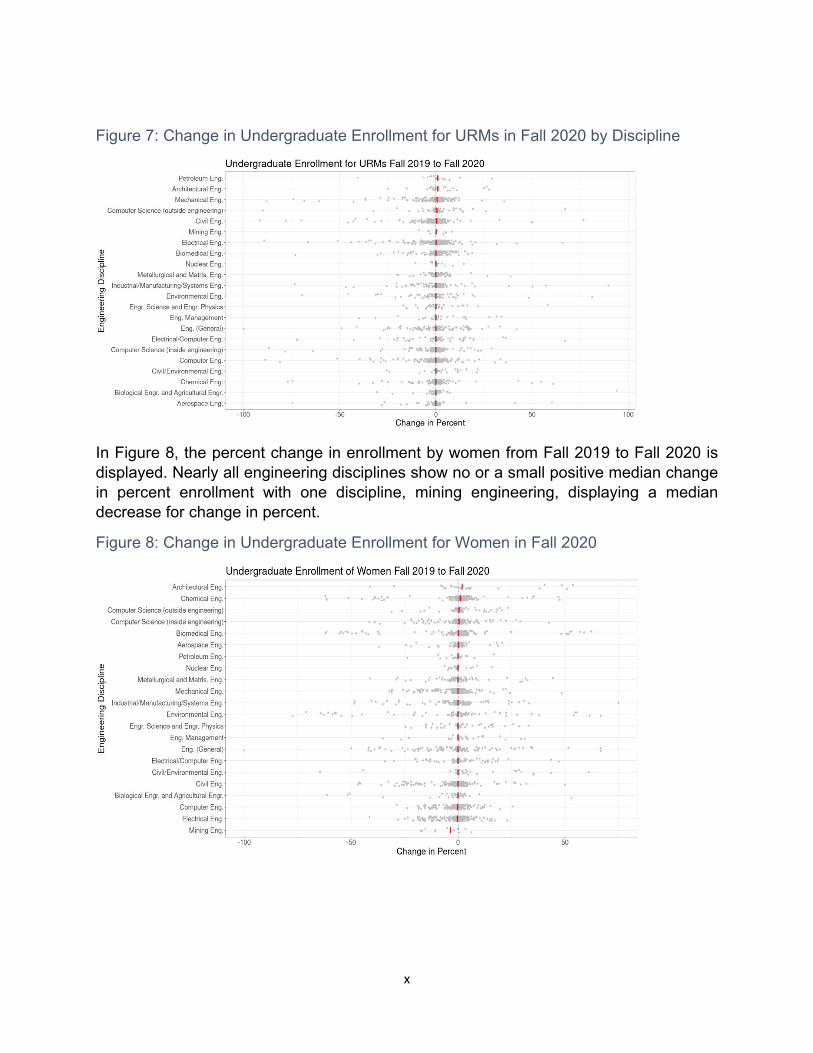
x
Figure 7: Change in Undergraduate Enrollment for URMs in Fall 2020 by Discipline
In Figure 8, the percent change in enrollment by women from Fall 2019 to Fall 2020 is displayed. Nearly all engineering disciplines show no or a small positive median change in percent enrollment with one discipline, mining engineering, displaying a median decrease for change in percent.
Figure 8: Change in Undergraduate Enrollment for Women in Fall 2020

xi
Doctoral Enrollment
Figure 9: Change in Doctoral Enrollment for Fall 2020
Due to the small cohort size for many doctoral programs, we chose to focus on change in total enrollment rather than a percent-based measure (which is subject to large volatility when dealing with n < 20). Doctoral enrollment for Fall 2020, in Figure 8, stayed relatively stable with small decreases in the median enrollment for over half of engineering disciplines. Surprisingly, total international enrollment for Fall 2020 follows the same pattern.
Figure 10: Change in Doctoral Enrollment of International Students for Fall 2020

xii
Research Volume
Figure 11: Percent Change in Total Research Expenditures by Institutional Control
The Profiles data collections gathered research volume as measured by expenditures on research by external sources (gifts, federal, state, local, and corporate) during the 2020 fiscal year (FY). For over 95 percent of reporting institutions, FY 2020 is July 1, 2019 to June 30, 2020, representing the initial four months of the pandemic. Institutions that do not align to the FY 2020 dates of July 1, 2019 to June 30, 2020 are excluded from the results reported below. There was a slight median increase in the percent change for total institutional research expenditures in FY 2020. As seen in Figure 10 there was a slight for public and private institutions in the total research expenditures for FY 2020 from FY 2019. This slight increase aligns with responses from institutions that they were able to keep research output continuing during the first few months of the pandemic by focusing on writing up results for labs that could not be open in the pandemic.
A disciplinary breakdown of percent change for research expenditures is displayed in Figure 11. The largest median increases and decreases are artifacts of the low numbers of institutions that report research expenditures within those disciplines4. There is a moderate median increase in percent change for research expenditures for electrical engineering, computer science, chemical engineering, aerospace engineering, and biomedical engineering. There were widespread reports of institutions producing personal protective equipment (PPE) using resources available to them in the final months of FY 20205. This redeployment (for non-research purposes) along with in-person research
4 Architectural engineering: two institutions reported expenditures in FY 2020 & FY2019; environmental engineering: five institutions; and engineering management: six institutions. 5 https://www.cnbc.com/2020/05/05/how-colleges-and-universities-are-producing-ppe-for-health-care-workers.html

xiii
being shut down or minimized during the initial months of the pandemic could account for the median decrease in percent change for industrial/manufacturing/systems engineering.
Figure 12: Change in Research Expenditures by Discipline
Engineering Technology Enrollment
In Figure 13, the change in undergraduate enrollment for each engineering technology discipline is displayed. Figure 14 displays the change in total enrollment for freshman from Fall 2019 to Fall 2020. Both total undergraduate enrollment and freshmen enrollment for Fall 2020 show similar trends: there were a median decrease in programs for half of engineering technology disciplines. Three disciplines, however, had only 1 or 2 programs represented in the Profiles data set: civil engineering technology, aerospace engineering technology and architectural engineering technology.

xiv
Figure 13: Change in Engineering Technology Undergraduate Enrollment
Figure 14: Change in Freshman Enrollment for Engineering Technology Programs
Joseph Roy, Ph.D. is the Director of ASEE’s Department of Institutional Research and Analytics and is the author of this report. He can be reached at [email protected] for questions.
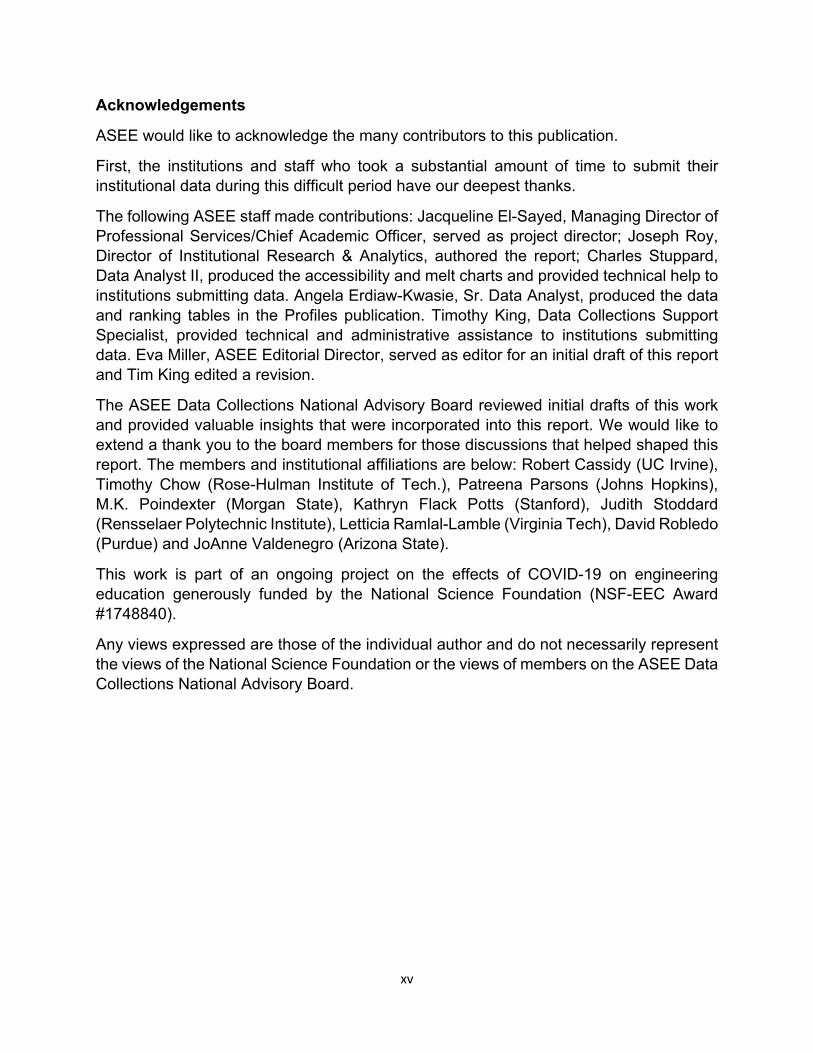
xv
Acknowledgements
ASEE would like to acknowledge the many contributors to this publication.
First, the institutions and staff who took a substantial amount of time to submit their institutional data during this difficult period have our deepest thanks.
The following ASEE staff made contributions: Jacqueline El-Sayed, Managing Director of Professional Services/Chief Academic Officer, served as project director; Joseph Roy, Director of Institutional Research & Analytics, authored the report; Charles Stuppard, Data Analyst II, produced the accessibility and melt charts and provided technical help to institutions submitting data. Angela Erdiaw-Kwasie, Sr. Data Analyst, produced the data and ranking tables in the Profiles publication. Timothy King, Data Collections Support Specialist, provided technical and administrative assistance to institutions submitting data. Eva Miller, ASEE Editorial Director, served as editor for an initial draft of this report and Tim King edited a revision.
The ASEE Data Collections National Advisory Board reviewed initial drafts of this work and provided valuable insights that were incorporated into this report. We would like to extend a thank you to the board members for those discussions that helped shaped this report. The members and institutional affiliations are below: Robert Cassidy (UC Irvine), Timothy Chow (Rose-Hulman Institute of Tech.), Patreena Parsons (Johns Hopkins), M.K. Poindexter (Morgan State), Kathryn Flack Potts (Stanford), Judith Stoddard (Rensselaer Polytechnic Institute), Letticia Ramlal-Lamble (Virginia Tech), David Robledo (Purdue) and JoAnne Valdenegro (Arizona State).
This work is part of an ongoing project on the effects of COVID-19 on engineering education generously funded by the National Science Foundation (NSF-EEC Award #1748840).
Any views expressed are those of the individual author and do not necessarily represent the views of the National Science Foundation or the views of members on the ASEE Data Collections National Advisory Board.

xvi
Technical Definitions and Method
Profiles of Engineering and Engineering Technology is produced annually in collaboration with institutions with at least one ABET-accredited program in engineering, engineering technology, or computer disciplines.
Race/ethnicity: ASEE collects enrollment, degrees awarded, and tenure-track faculty numbers by the U.S. Department of Education’s Integrated Post-Secondary Education Data System (IPEDS) reporting categories for race/ethnicity.
Underrepresented minority: ASEE uses the definition from NSF’s Science and Engineering Indicators report (https://ncses.nsf.gov/pubs/nsb20201/glossary): "this category comprises three racial or ethnic minority groups (blacks or African Americans, Hispanics or Latinos, and American Indians or Alaska Natives) whose representation in S&E education or occupations is smaller than their representation in the U.S. population."
Reporting Periods (Profiles 2020):
Fall 2020: institution enrollments, engineering college enrollments, engineering technology college enrollments, faculty head counts, admission requirements and recommendations, and personnel information. Degrees awarded between July 1, 2019 and June 30, 2020. Research expenditures are based on the most recently completed fiscal year ending in 2020.
Research Expenditures: Institutions report all expenditures associated with grants and contracts specifically budgeted for externally sponsored research and associated programs and expenditures associated with all gifts auditably used for research. Institutions are instructed to include expended funds provided by the following external sources:
1. Federal government 2. State government 3. Foreign government 4. Industry 5. Non-profit organizations (e.g., foundations) 6. Individuals 7. Local government
Gender: Institutions can report under IPEDS rules for gender or under an expanded set of options:
• Male/female (IPEDS) • Male/female/non-binary gender/another gender or unknown (expanded gender)
If an institution chooses the binary gender option spreadsheet, it is reporting data to ASEE as it would be reported to the IPEDS survey. Gender for individuals (student or faculty) that is unknown would be reported in a category (male or female) selected by the

xvii
institution. Under this option, institutions are instructed to include counts for all individuals in the required cells.
Full-time staff: As defined by the institution. The type of appointment at the snapshot determines whether an employee is full-time or part-time. The employee’s term of contract is not considered in making the determination of full- or part-time. Full-time student: Undergraduate: A student enrolled for 12 or more semester credits or 12 or more quarter credits or 24 or more clock hours a week each term Graduate: A student enrolled for 9 or more semester credits or 9 or a student involved in thesis or dissertation preparation that is considered full-time by the institution. Non-tenure track, teaching faculty: Persons identified by the institution as such as typically those whose initial assignments are made for the purpose of conducting instructions as a principle activity (or activities). They may hold academic rank titles of professor, associate professor, assistant professor, instructor, lecturer, or the equivalent of any of those academic ranks. Graduate instruction (teaching) and research assistants are not included in this category. Part-time student: Undergraduate: A student enrolled for either less than 12 semester or quarter hours or less that 24 clock hours a week each term. Graduate: A student enrolled for less than 9 semester or quarter credits. Research personnel: An occupational category used to classify persons whose specific assignments customarily are made for the purpose of conducting research. Regardless of title, academic rank, these employees formally spend the majority of their time conducting research (exclude tenure/tenure-track faculty from this count). Tuition: The amount of money charged to students for instructional services. Tuition may be charged per term, per course, or per credit Tuition and fees (published charges): The amount of tuition and required fees covering a full academic year most frequently charged to students. These values represent what a typical student would be charged and may not be the same for all students at an institution. If tuition is charged on a per-credit-hour basis, the average full-time credit hour load for an entire academic year is used to estimate average tuition. Required fees include the fixed sum charged that are required of such a large proportion of all students that the student who does not pay the charges is an exception.

xviii
Admissions & Enrollment Data 2016–2020
Table 5: Institutions by Minority Serving Institution Type in ASEE Sample for Applications and Freshman Enrollment Data.
Institution Type
ASEE Applications Sample 2016–2020
ASEE Enrollment Sample 2016-2020
Total EAC ABET Institutions (2020)
Historical Black College or University (HBCU) 2 2 15
Hispanic Serving Institution (HSI) 20 23 36
Asian American, Native American, Pacific Islander Serving Institution (AANAPISI)
13 15 23
Minority Science and Engineering Improvement Program (MSEIP)
9 10 22
Native American Serving, Non-Tribal Institution (NASNTI)
0 0 1
Non-Minority Serving Institution (Non-MSI) 127 194 302
Table 7 represents sample characteristics for applications, offers and enrollments data displayed for 2016-2020. The column for total ABET institutions for 2020 are those that have at least one accredited program from ABET in an Engineering Accreditation Commission (EAC) area that awarded at least 1 engineering degree in 2020 according to IPEDS data. MSI status is based on 2020 data from the Office of Postsecondary Education (OPE) at the U.S. Department of Education. The eligibility matrix for 2020 was used (https://www2.ed.gov/about/offices/list/ope/idues/2020eligibilitymatrix.xlsx). Historically Black Colleges and Universities (HBCUs) and Tribal Colleges and Universities (TCUs) are designated by statute. The other MSI programs are based on eligibility criteria. Institutions were categorized as MSIs if they either currently had a grant under that program or were eligible to apply for funding under a program without a waiver.

xix
Profiles Data Collection and Reporting in 2020–21
The annual deadline for the Profiles survey submission has been January 31 since 2017, and in past years ASEE received 20 to 30 requests for extensions. This year, however, the ASEE received over 140 requests for extensions and worked with institutions to accept data after the deadline. The data reported in the Profiles of Engineering & Engineering Technology publication reflect institutional submissions to ASEE as of August 22, 2021.
Degrees awarded represent the data reported by the 282 participating institutions. Institutions that did not participate but reported at least one degree awarded in 2019-20 to the Integrated Postsecondary Education Data System (IPEDS) were reported using data for the same period reported to the federal government. Included in this were institutions that had at least one ABET accredited program at their institution. All engineering, engineering technology and computer science degrees awarded were integrated into this data. Computer Science degrees awarded at non-participating institutions were uniformly categorized as “Computer Science (outside engineering)”.
Abilene Christian University Alabama A & M University Alfred University (private) Anderson University Andrews University Angelo State University Arkansas State University Asbury University Baker College Bates College Benedictine College Benjamin Franklin Institute of Technology Bethune-Cookman University Bob Jones University Bradley University California Baptist University California State University Maritime Academy California State University-Bakersfield California State University-Chico California State University-East Bay California State University-Fresno California State University-San Bernardino Calvin University Capitol Technology University Carroll College Cedarville University
Central Connecticut State University Christian Brothers University Christopher Newport University Clarkson University Coe College Colorado State University Pueblo Cornell College Dordt University Eastern Illinois University Eastern Kentucky University Eastern Washington University Elizabethtown College Fairfield University Fairleigh Dickinson University-Metropolitan Campus Ferris State University Florida Gulf Coast University Florida Polytechnic University Fort Lewis College Francis Marion University Frostburg State University Gannon University Geneva College Georgia Southern University Hampton University Harding University Henderson State University
xx
Hood College Hope College Howard University Humboldt State University Idaho State University Indiana Institute of Technology Jackson State University Lake Superior State University Lamar University LeTourneau University Lewis University Lipscomb University Loras College Loyola University Maryland Maine Maritime Academy Marietta College Marshall University Massachusetts Maritime Academy McNeese State University Mercer University Merrimack College Messiah University Middle Tennessee State University Midwestern State University Minnesota State University-Mankato Mississippi College Monmouth University Montana Technological University Mount Vernon Nazarene University Murray State University Muskingum University Navajo Technical University New Mexico Institute of Mining and Technology Norfolk State University Northern Arizona University Northern Illinois University Northwest Nazarene University Norwich University Oklahoma Christian University Olivet Nazarene University Oral Roberts University Pace University Point Park University
Prairie View A & M University Purdue University Fort Wayne Purdue University Northwest Quinnipiac University Regis University Rider University Robert Morris University Roger Williams University Saginaw Valley State University Saint Francis University Saint Louis University Saint Martin's University Samford University San Francisco State University Seattle Pacific University South Carolina State University South Dakota School of Mines and Technology Southeast Missouri State University Southern New Hampshire University Southern Utah University State University of New York at New Paltz Stephen F Austin State University Tarleton State University Taylor University Tennessee State University Texas A & M International University Texas A&M University-Texarkana Texas Christian University Texas State University The University of Tennessee-Martin The University of Texas Rio Grande Valley The University of Virginia's College at Wise The University of West Florida Thomas Jefferson University Trine University Trinity College Trinity University Tuskegee University Union University United States Merchant Marine Academy University of Alaska Anchorage University of Bridgeport University of Denver

xxi
University of Evansville University of Houston-Clear Lake University of Maryland Eastern Shore University of Massachusetts-Boston University of Michigan-Flint University of Minnesota-Duluth University of Mount Union University of New Orleans University of North Alabama University of North Carolina at Asheville University of North Carolina at Chapel Hill University of North Dakota University of North Florida University of Pittsburgh-Johnstown University of Scranton University of South Carolina Aiken University of South Dakota University of Southern Indiana University of Southern Maine
University of Southern Mississippi University of St Thomas University of Wisconsin-Eau Claire University of Wisconsin-Platteville University of Wisconsin-Stevens Point Utah Valley University Vaughn College of Aeronautics and Technology Virginia Military Institute Webb Institute Weber State University West Texas A & M University West Virginia University Institute of Technology Western Illinois University Western Kentucky University Western Washington University Wilkes University York College of Pennsylvania Youngstown State University

xxii
American Society for Engineering Education
The American Society for Engineering Education is a non-profit association of more than 10,000 engineering faculty members, U.S. and Canadian colleges of engineering and engineering technology, corporations, and other organizations dedicated to promoting excellence in engineering and engineering technology education. ASEE, which celebrated its centennial in 1993, plays a key role in developing and promoting policies that will enable engineering education to work with allied branches of science and technology to meet the new challenges of global competition and changing demographics.
Mission Statement
ASEE advances innovation, excellence, and access at all levels of education for the engineering profession.
Vision Statement
Excellent and broadly accessible education empowering students and engineering professionals to create a better world.
Values
Excellence, engagement, innovation, integrity, diversity and inclusion.
Goals
ASEE recognizes the term “engineering education” to encompass the full academic spectrum of instruction, research, scholarship, practice, and service. ASEE also has an enduring
commitment to continuous improvement.
In the context of the above two statements, ASEE pursues the following goals:
Innovation - ASEE will advance the development of innovative approaches and solutions to engineering education.
Excellence - ASEE will advance excellence in all aspects of engineering education while continuously improving the member experience.
Access - ASEE will advocate for equal access to engineering educational opportunities for all.
Advocacy and Public Policy - ASEE will be the leading advocate for advancing the broad interests of engineering education.
Communities - ASEE will cultivate an inclusive community that engages all members and values the contributions of all stakeholders.
Communication - ASEE will implement a robust and transparent communication strategy effectively linking all stakeholders.
Diversity and Inclusion - ASEE will promote diversity, broadly defined, by modeling equity and inclusion through its policies and practices.
Internal Organization - ASEE will be a strategic and dynamic organization, with a knowledgeable and responsive staff, that enhances stakeholder engagement.

xxiii
Financial Stability ASEE must carefully balance opportunities for investments in activities and programs to meet future needs with our current responsibilities, developing and maintaining a robust cash reserve, and ensuring that expenditures align with the organization's mission.
ASEE Board of Directors, 2020–2021 Sheryl Sorby President University of Cincinnati Stephanie G. Adams Immediate Past President University of Texas at Dallas Adrienne R. Minerick President-Elect Michigan Technological University Agnieszka Miguel First Vice President, Vice President, External Relations Seattle University Doug Tougaw Vice President, Finance Valparaiso University Brian Self Vice President Member Affairs California Polytechnic State University, San Luis Obispo Beth Holloway Vice President, Professional Interest Councils, Chair, Professional Interest Council IV Purdue University Dan Sayre Vice President, Institutional Councils, Chair, Corporate Member Council New World Associates, LLC
Carol Lamb Chair, Engineering Technology Council Youngstown State University Chuck Bunting Chair, Engineering Research Council Oklahoma State University Cammy Abernathy Chair, Engineering Deans Council University of Florida Christi Patton Luks Chair, Professional Interest Council I Missouri University of Science and Technology Chell Roberts Chair, Professional Interest Council II University of San Diego John K. Estell Chair, Professional Interest Council III Ohio Northern University Maureen Barcic Chair, Professional Interest Council V University of Pittsburgh Pritpal Singh Chair, Council of Sections, Zone I Villanova University John Brocato Chair, Council of Sections, Zone II University of Georgia Kenneth Van Treuren Chair, Council of Sections, Zone III Baylor University Lily Gossage Chair, Council of Sections, Zone IV California State Polytechnic University, Pomona Norman L. Fortenberry Executive Director