profile report - state - state board of education · profile report - state arkansas ... student...
TRANSCRIPT

Profile Report - State
Arkansas State Testing 2016-2017
Grade 11 Tested Students
Arkansas
ACT, INC. -- CONFIDENTIAL*01100211PD*

ACT PROFILE REPORT- State
Arkansas State Testing 2016-2017 Code 049999
Grade 11 Tested Students Arkansas
Total Students in Report: 31,110
New to your 2016-2017 Profile Report
Though ACT will continue to report English, mathematics, reading, and science subject scores, beginning in September 2016, subscores such as rhetorical skills and arts/literature will be omitted. Instead, a comprehensive set of reporting categories aligned with ACT College and Career Readiness Standards and other standards that target college and career readiness will be included. This change will make it easier for students, parents, and educators to gain deeper insight into students’ performance and better understand strengths and areas for improvement in each subject. In this report, reporting category outcomes indicate the percentage of students with reporting category scores falling within associated ACT Readiness Ranges. These ranges reflect where a student who as met an associated ACT Readiness Benchmark would typically perform in each reporting category.

ACT PROFILE REPORT - State PAGE 1
Arkansas State Testing 2016-2017 Code 049999
Grade 11 Tested Students Arkansas
Total Students in Report: 31,110
Table of Contents
Section I: Executive Summary Page 5 Section III: College Readiness & Impact of Course Rigor Page 17
Average Composite Scores: 5 Years of Testing Percent of Students Meeting 3 or 4 College Readiness
Percent Meeting 3 or 4 Benchmarks: 5 Years of Testing Benchmarks by Core College Curriculum Status
Percent Meeting STEM Benchmark: 5 Years of Testing Percent of Students in College and Career Readiness Standards (CCRS)
Percent Taking A Core Curriculum: 5 Years of Testing Score Ranges
Five Year Trends—Percent of Students Who Met Percent of Students Who Met ACT College Readiness Benchmark Scores
College Readiness Benchmarks by Gender
Five Year Trends—Average ACT Scores Percent of Students Who Met ACT College Readiness Benchmark Scores
Five Year Trends—Average ACT Scores by Level of Preparation by Race/Ethnicity
Five Year Trends—Percent and Average Composite Score Likely ACT National Career Readiness Certificate (NCRC) Level
by Race/Ethnicity Based Upon ACT Composite Score
Five Year Trends—Achievement in STEM College Readiness Benchmark Percent and Average ACT Scores
Proficiency Toward Understanding Complex Text by Overall High School Curriculum
College Readiness Benchmark Percent and Average ACT Scores
Section II: Academic Achievement Page 11 by Content-Specific Curriculum
Average ACT Composite Scores by Race and Core Curriculum Status College Readiness Benchmark Percent and Average ACT Scores
ACT Score Distributions, Cumulative Percents, and Averages by Common Course Patterns
Subject Area Reporting Categories College Readiness Benchmark Percent and Average ACT Scores
Average ACT Composite Scores for Race/Ethnicity for Gender by Common Course Patterns
by Level of Preparation
Average ACT Scores by Race/Ethnicity Section IV: Career and Educational Aspirations Page 25
Average ACT Composite Scores for Gender by Level of Preparation Average ACT Composite Scores
Average ACT Scores by Gender by Race and Student Postsecondary Aspirations
ACT Score Quartile Values Distribution of Planned Educational Majors for All Students
by College Plans
Average ACT Composite Scores for Racial/Ethnic Groups
by Post-Secondary Educational Aspirations
Students' Score Report Preferences at Time of Testing
Section V: Optional Writing Test Results Page 31
Average ACT Writing Scores by Race/Ethnicity
Average ACT Writing and English/Language Arts Scores
by Race/Ethnicity and Gender for students who took ACT Writing

ACT PROFILE REPORT - State PAGE 2
Arkansas State Testing 2016-2017 Code 049999
Grade 11 Tested Students Arkansas
Total Students in Report: 31,110
This report focuses on:
Performance - student test performance in the context of college readiness
Access - number of your graduates exposed to college entrance testing and the percent of race/ethnicity participation
Course Selection - percent of students pursuing a core curriculum
Course Rigor - impact of rigorous coursework on achievement
College Readiness - percent of students meeting ACT College Readiness Benchmark Scores in each content area
Awareness - extent to which student aspirations match performance
Articulation - colleges and universities to which your students send test results
This report provides information about the performance of your students who took the ACT as part of the Arkansas State
Testing (Grade 11 Tested Students).
Each year, test data for a school, district, and the state represents a different cohort of students. ACT encourages
educators to focus on trends (3, 5, 10 years), not year-to-year changes. Such changes can represent normal – even
expected – fluctuations. On the other hand, trend lines offer more insight into what is happening in a school, district, or
the state.
Furthermore, ACT encourages educators to measure student performance in the context of college readiness measures.
The focus should be on the number and percentage of students who met or exceeded ACT’s College Readiness
Benchmark Scores, a measure that is much more meaningful and understandable than an average composite score for a
group of students.

ACT PROFILE REPORT - State PAGE 3
Arkansas State Testing 2016-2017 Code 049999
Grade 11 Tested Students Arkansas
Total Students in Report: 31,110
The ACT is a curriculum-based measure of college readiness. ACT components include:
Tests of academic achievement in English, math, reading, science, STEM, and writing (optional)
High school grade and course information
Student Profile Section
Career Interest Inventory
The ACT:
College Course/Course Area ACT Score Benchmark Score
English Composition English 18
Algebra Mathematics 22
Social Sciences Reading 22
Biology Science 23
STEM STEM 26
For more information, go to www.act.org
Every few years, ACT conducts the ACT National Curriculum Survey to ensure its curriculum-based assessment tools accurately
measure the skills high school teachers teach and instructors of entry-level college courses expect. The ACT is the only college
readiness test designed to reflect the results of such a survey.
ACT’s College and Career Readiness Standards are sets of statements intended to help students, parents and educators
understand the meaning of test scores. The standards relate test scores to the types of skills needed for success in high school and
beyond. They serve as a direct link between what students have learned and what they are ready to do next. The ACT is the only
college readiness test for which scores can be tied directly to standards. College and Career Readiness Standards to the Classroom
interpretive guides can be found at www.act.org/content/act/en/education-and-career-planning/college-and-career-readiness-
standards.html.
Only the ACT reports College Readiness Benchmark Scores – A benchmark score is the minimum score needed on an ACT
subject-area test to indicate a 50% chance of obtaining a B or higher or about a 75% chance of obtaining a C or higher in the
corresponding credit-bearing college courses, which include English Composition, Algebra, Social Science, Biology and STEM.
These scores were empirically derived based on the actual performance of students in college.

ACT PROFILE REPORT - State PAGE 4
Arkansas State Testing 2016-2017 Code 049999
Grade 11 Tested Students Arkansas
Total Students in Report: 31,110
How to Improve Scores and Increase College Readiness
#1232
For more information on interpreting data in this report, or to learn how ACT can help your students improve their readiness for college and the
workplace, contact ACT Customer Service at 319-337-1365 or [email protected].
PLAN GUIDANCE ACTIVITIES BASED ON STUDENTS' CAREER AND COLLEGE ASPIRATIONS: Data in Tables 4.1 and 4.2 enable the reader to
determine if aspirations are consistent with academic performance and whether, among students with similar aspirations, academic performance is
consistent across racial/ethnic groups.
EVALUATING RIGOR OF COURSES: Table 3.1 reports the percentage of students falling in each of the ACT College and Career Readiness
Standards score ranges. For example, approximately 68% of the cohort fall into the lowest three Mathematics score ranges. To increase these
students' achievement, identify the standards they should focus on next by accessing ACT's College and Career Readiness Standards at at
www.act.org/content/act/en/education-and-career-planning/college-and-career-readiness-standards.html.
14% of your students met all four ACT College Readiness Benchmark Scores (Table 1.1). To improve students' scores and increase the percentage
of students identified as college ready, ACT suggests:
PROVIDING ACCESS FOR ALL STUDENTS TO TAKE THE ACT: 31,110 of your students are included in this report (the 'cohort'). Increasing
access insures that more students have the opportunity to consider college and allows the reader to use this report to evaluate how well courses and
instructional programs are preparing students for college and work.
MAKING CORE CURRICULUM A PRIORITY: Emphasize the need for all students to develop college and work ready skills, regardless of
postsecondary aspirations. 57% of the students in the cohort reported taking courses that would be considered 'Core or More' (Table 1.4).
MAKING SURE STUDENTS ARE TAKING THE RIGHT KINDS OF COURSES: Table 3.8 reports 5% of the cohort took less than three years of
math courses. Of these students, 6% were college ready. 14% of the cohort reported taking a course sequence of Algebra I, Algebra II, and
Geometry. 6% of these students were college ready. In comparison, 33% of the students who took 3 or more years of math beyond Algebra I,
Algebra II, and Geometry were college ready. Getting more students ready for Algebra prior to 9th grade will increase the chances that students will
be prepared for and take advanced-level math courses.
Similarly, Table 3.8 reports 11% of the cohort took less than three years of natural science courses. 5% of these students were college ready. In
comparison, 26% of students who took at least three years of science coursework were college ready.

ACT PROFILE REPORT - State: SECTION I, EXECUTIVE SUMMARY PAGE 5
Arkansas State Testing 2016-2017 Code 049999
Grade 11 Tested Students Arkansas
Total Students in Report: 31,110
Section I
Executive Summary
Beginning in August 2013, College Readiness Benchmarks for Reading and Science were updated to reflect the most recent college coursework research.

ACT PROFILE REPORT - State: SECTION I, EXECUTIVE SUMMARY PAGE 6
Arkansas State Testing 2016-2017 Code 049999
Grade 11 Tested Students Arkansas
Total Students in Report: 31,110
Figure 1.1. Average Composite Scores: 5 Years of Testing* Figure 1.2. Percent Meeting 3 or 4 Benchmarks: 5 Years of Testing*
Figure 1.3. Percent Meeting STEM Benchmark: 5 Years of Testing* Figure 1.4. Percent Taking A Core Curriculum: 5 Years of Testing*
* Missing columns in above graphs reflect years in which no students were tested.
18.8 19.0 18.7 18.8 18.8
1
6
11
16
21
26
31
36
2012-2013 2013-2014 2014-2015 2015-2016 2016-2017
Avera
ge A
CT
Score
State
23 26 24 24 23
0
10
20
30
40
50
60
70
80
90
100
2012-2013 2013-2014 2014-2015 2015-2016 2016-2017
Perc
ent
State
9 10 9 9 9
0
10
20
30
40
50
60
70
80
90
100
2012-2013 2013-2014 2014-2015 2015-2016 2016-2017
Perc
ent
State
60
23
58
22
60
23
67
24
57
22
0
10
20
30
40
50
60
70
80
90
100
Core LessThanCore
Core LessThanCore
Core LessThanCore
Core LessThanCore
Core LessThanCore
Perc
ent
State
2012-2013 2013-2014 2014-2015 2015-2016 2016-2017

ACT PROFILE REPORT - State: SECTION I, EXECUTIVE SUMMARY PAGE 7
Arkansas State Testing 2016-2017 Code 049999
Grade 11 Tested Students Arkansas
Total Students in Report: 31,110
Table 1.1. Five Year Trends—Percent of Students Who Met College Readiness Benchmarks
Percent Who Met Benchmarks
English Mathematics Reading Science Met All Four
Year State State State State State State
2012-2013 7,170 50 27 36 18 13
2013-2014 7,051 52 27 31 26 16
2014-2015 8,733 49 26 29 23 14
2015-2016 31,081 49 25 31 24 14
2016-2017 31,110 49 24 30 22 14
Table 1.2. Five Year Trends—Average ACT Scores
Average ACT Scores
English Mathematics Reading Science Composite
Year State State State State State State
2012-2013 7,170 18.1 19.0 18.8 18.9 18.8
2013-2014 7,051 18.2 19.0 19.2 19.2 19.0
2014-2015 8,733 18.1 18.5 19.0 18.7 18.7
2015-2016 31,081 18.1 18.6 19.0 19.1 18.8
2016-2017 31,110 18.4 18.5 18.9 18.9 18.8
Table 1.3. Five Year Trends—Average ACT Scores Statewide (table omitted for this report)
Number of Students
Tested
Number of Students
Tested

ACT PROFILE REPORT - State: SECTION I, EXECUTIVE SUMMARY PAGE 8
Arkansas State Testing 2016-2017 Code 049999
Grade 11 Tested Students Arkansas
Total Students in Report: 31,110
Table 1.4. Five Year Trends—Average ACT Scores by Level of Preparation
Average ACT Scores
Number of
Students Tested Percent2
English Mathematics Reading Science Composite
Year
Core or
More1
Less than
Core
Core
or
More
Less
than
Core
Core or
More
Less than
Core
Core or
More
Less than
Core
Core or
More
Less than
Core
Core or
More
Less than
Core
Core or
More
Less than
Core
2012-2013 4,297 1,657 60 23 19.6 15.3 19.8 17.2 20.1 16.6 20.0 16.8 20.0 16.6
2013-2014 4,110 1,585 58 22 20.0 15.3 20.1 17.2 20.6 16.8 20.4 17.2 20.4 16.7
2014-2015 5,217 2,034 60 23 19.7 15.5 19.6 16.8 20.4 16.9 20.0 16.6 20.1 16.6
2015-2016 20,702 7,393 67 24 19.4 15.5 19.6 16.9 20.2 16.9 20.1 17.4 20.0 16.8
2016-2017 17,807 6,987 57 22 20.0 16.0 19.5 16.9 20.3 16.8 20.2 17.1 20.2 16.81"Core or More" results correspond to students taking four or more years of English AND three or more years each of math, social studies, and natural science.
2Percent of all students tested. Numbers will not add up to 100% due to student non-response.
Table 1.5. Five Year Trends—Percent and Average Composite Score by Race/Ethnicity
2012-2013 2013-2014 2014-2015 2015-2016 2016-2017
Race/Ethnicity N % Avg N % Avg N % Avg N % Avg N % Avg
All Students 7,170 100 18.8 7,051 100 19.0 8,733 100 18.7 31,081 100 18.8 31,110 100 18.8
Black/African American 1,338 19 15.9 1,415 20 16.2 1,755 20 15.9 4,943 16 15.9 4,833 16 15.8
American Indian/Alaska Native 39 1 19.2 44 1 19.1 70 1 17.9 185 1 18.1 242 1 17.4
White 3,444 48 20.1 3,576 51 20.4 3,859 44 20.3 16,813 54 19.9 16,481 53 20.0
Hispanic/Latino 512 7 17.4 515 7 17.7 780 9 17.4 3,093 10 17.6 3,325 11 17.3
Asian 133 2 23.1 152 2 23.3 166 2 22.4 467 2 21.2 495 2 21.8
Native Hawaiian/Other Pacific Islander 7 0 15.4 8 0 16.0 11 0 18.0 141 0 15.2 141 0 14.9
Two or more races 215 3 19.9 264 4 19.7 313 4 19.4 1,292 4 19.2 1,367 4 19.4
Prefer not to respond/No response 1,482 21 18.4 1,077 15 18.1 1,779 20 18.2 4,147 13 18.7 4,226 14 18.3

ACT PROFILE REPORT - State: SECTION I, EXECUTIVE SUMMARY PAGE 9
Arkansas State Testing 2016-2017 Code 049999
Grade 11 Tested Students Arkansas
Total Students in Report: 31,110
Table 1.6. Five Year Trends—Achievement in STEM1
All Tested Students Students Meeting STEM Benchmarks
Number of
Students Tested Avg. STEM Score Percent Meeting STEM Benchmark Avg. Mathematics Score Avg. Science Score
Year State State State State State
2012-2013 7,170 19.2 9 27.7 28.5
2013-2014 7,051 19.3 10 27.6 27.8
2014-2015 8,733 18.9 9 27.6 28.0
2015-2016 31,081 19.1 9 27.6 28.0
2016-2017 31,110 18.9 9 27.5 28.41The STEM score describes students' overall proficiency in mathematics and science.
Table 1.7. Proficiency In Understanding Complex Texts1
Text Complexity Proficiency Level
Below Proficient Proficient Above Proficient
N Percent Avg. Reading N Percent Avg. Reading N Percent Avg. Reading
Year State State State State State State State State State
2012-2013 0 . . 0 . . 0 . .
2013-2014 0 . . 0 . . 0 . .
2014-2015 0 . . 0 . . 0 . .
2015-2016 19,469 63 15.5 8,268 27 22.9 3,344 11 30.0
2016-2017 21,363 69 15.7 5,975 19 23.3 3,772 12 29.71The text complexity indicator, beginning in Fall 2015, represents students' progress toward understanding complex written material often encountered in college and careers.

ACT PROFILE REPORT - State: SECTION I, EXECUTIVE SUMMARY PAGE 10
Arkansas State Testing 2016-2017 Code 049999
Grade 11 Tested Students Arkansas
Total Students in Report: 31,110
This page intentionally left blank.

ACT PROFILE REPORT- State: SECTION II, ACADEMIC ACHIEVEMENT PAGE 11
Arkansas State Testing 2016-2017 Code 049999
Grade 11 Tested Students Arkansas
Total Students in Report: 31,110
Section II
Academic Achievement
Beginning in August 2013, College Readiness Benchmarks for Reading and Science were updated to reflect the most recent college coursework research.

ACT PROFILE REPORT - State: SECTION II, ACADEMIC ACHIEVEMENT PAGE 12
Arkansas State Testing 2016-2017 Code 049999
Grade 11 Tested Students Arkansas
Total Students in Report: 31,110
Figure 2.1. Average ACT Composite Scores by Race and Core Curriculum Status*
20.2
16.8
19.3
21.1
18.3
23.0
15.5
20.5 20.0
16.8
15.1 15.4
17.7
15.7
19.0
14.6
17.4 16.7
1
6
11
16
21
26
31
36
All Students Black/AfricanAmerican
AmericanIndian/Alaska Native
White Hispanic Asian NativeHawaiian/OtherPacific Islander
Two or more Races Prefer not toRespond/NoResponse
Avera
ge C
om
posite S
core
Core Non-Core
*Missing columns reflect combinations of race/ethnicity and core course-taking status in which one or both indicators are missing.

ACT PROFILE REPORT- State: SECTION II, ACADEMIC ACHIEVEMENT PAGE 13
Arkansas State Testing 2016-2017 Code 049999
Grade 11 Tested Students Arkansas
Total Students in Report: 31,110
Table 2.1. ACT Score Distributions, Cumulative Percents (CP1), and Score Averages
English Mathematics Reading Science Composite STEM
N CP N CP N CP N CP N CP N CP
36 102 100 13 100 106 100 43 100 7 100 14 100 36
35 337 99 40 99 197 99 106 99 36 99 26 99 35
34 326 99 35 99 227 99 155 99 87 99 51 99 34
33 217 98 42 99 333 98 10 99 133 99 96 99 33
32 244 97 75 99 291 97 213 99 190 99 114 99 32
31 279 96 178 99 462 96 298 98 262 99 179 99 31
30 495 95 144 99 427 95 33 97 317 98 238 98 30
29 319 94 309 98 499 93 368 97 416 97 311 98 29
28 370 93 374 97 565 92 418 96 532 95 419 97 28
27 657 91 722 96 619 90 480 95 637 94 576 95 27
26 675 89 910 94 812 88 564 93 755 92 838 93 26
25 783 87 849 91 848 85 1,303 91 961 89 1,029 91 25
24 1,279 85 1,471 88 992 83 1,638 87 1,147 86 1,224 87 24
23 1,561 80 1,145 83 1,861 79 1,082 82 1,408 82 1,377 84 23
22 1,731 75 1,307 80 1,202 74 2,094 78 1,574 78 1,546 79 22
21 1,801 70 809 76 2,245 70 2,420 72 1,797 73 1,774 74 21
20 1,355 64 1,514 73 1,255 62 2,517 64 1,948 67 2,144 68 20
19 1,302 60 1,687 68 1,283 58 1,534 56 2,070 61 2,462 62 19
18 1,386 56 2,596 63 2,569 54 2,911 51 2,160 54 2,753 54 18
17 1,463 51 3,212 54 1,476 46 1,578 42 2,513 47 2,978 45 17
16 2,229 46 4,748 44 2,577 41 3,300 36 2,573 39 3,407 35 16
15 2,468 39 4,618 29 1,524 33 1,796 26 2,778 31 3,322 24 15
14 2,385 31 2,820 14 2,642 28 2,515 20 2,834 22 2,279 14 14
13 1,758 24 968 5 1,577 20 1,164 12 2,383 13 1,289 6 13
12 1,636 18 368 2 2,298 15 974 8 1,183 5 517 2 12
11 1,864 13 109 1 980 7 705 5 321 1 110 1 11
10 1,275 7 32 1 795 4 636 3 63 1 25 1 10
9 444 3 2 1 232 1 148 1 16 1 5 1 9
8 203 1 8 1 67 1 66 1 5 1 2 1 8
7 126 1 1 1 86 1 26 1 2 1 3 1 7
6 25 1 0 1 40 1 8 1 0 1 0 1 6
5 5 1 2 1 15 1 1 1 0 1 0 1 5
4 3 1 1 1 1 1 2 1 2 1 1 1 4
3 5 1 0 1 6 1 1 1 0 1 1 1 3
2 1 1 0 1 1 1 1 1 0 1 0 1 2
1 1 1 1 1 0 1 2 1 0 1 0 1 1
Avg (SD) 18.4 (6.2) 18.5 (4.4) 18.9 (6.0) 18.9 (5.0) 18.8 (4.9) 18.9 (4.4) Avg (SD)1CP is the cumulative percent of students at or below a score point.
Note: Shaded portions of columns identify the students who met/exceeded the ACT College Readiness Benchmark Scores.
ACT Scale
Score
ACT Scale
Score

ACT PROFILE REPORT - State: SECTION II, ACADEMIC ACHIEVEMENT PAGE 14
Arkansas State Testing 2016-2017 Code 049999
Grade 11 Tested Students Arkansas
Total Students in Report: 31,110
Figure 2.2. English Reporting Categories1
Figure 2.3. Math Reporting Categories1
Figure 2.4. Reading Reporting Categories1
Figure 2.5. Science Reporting Categories1
45
50
48
0 10 20 30 40 50 60 70 80 90 100
Production of Writing
Knowledge of Language
Conventions of Standard English
Percent in ACT Readiness Range State
22
30
34
29
21
41
23
25
0 10 20 30 40 50 60 70 80 90 100
Preparing for Higher Math (PHM)
PHM-Number and Quantity
PHM-Algebra
PHM-Functions
PHM-Geometry
PHM-Statistics and Probability
Integrating Essential Skills
Modeling
Percent in ACT Readiness Range State
The charts on this page show the percent of students whose reporting category scores fall within associated ACT Readiness Ranges. ACT Readiness Ranges reflect where a student who has met a particular subject area's ACT College Readiness Benchmark would typically perform within the associated reporting category. 1Reporting Categories are reported only for testing events beginning September 2016 .
31
31
37
0 10 20 30 40 50 60 70 80 90 100
Key Ideas and Details
Craft and Structure
Integration of Knowledge and Ideas
Percent in ACT Readiness Range State
25
26
23
0 10 20 30 40 50 60 70 80 90 100
Interpretation of Data
Scientific Investigation
Evaluation of Models/Inferences
Percent in ACT Readiness Range State

ACT PROFILE REPORT- State: SECTION II, ACADEMIC ACHIEVEMENT PAGE 15
Arkansas State Testing 2016-2017 Code 049999
Grade 11 Tested Students Arkansas
Total Students in Report: 31,110
Table 2.2. Average ACT Composite Scores for Race/Ethnicity by Level of Preparation
Student Number of Percent Taking Average ACT Composite Score
Group Race/Ethnicity Students Tested Core or More1
Core or More Less Than CoreAll Students 31,110 57 20.2 16.8
Black/African American 4,833 45 16.8 15.1
American Indian/Alaska Native 242 49 19.3 15.4
White 16,481 64 21.1 17.7
Hispanic/Latino 3,325 58 18.3 15.7
Asian 495 65 23.0 19.0
Native Hawaiian/Other Pac. Isl. 141 43 15.5 14.6
Two or More Races 1,367 62 20.5 17.4
Prefer not/No Response 4,226 43 20.0 16.71"Core or More" results correspond to students taking four or more years of English AND three or more years each of math, social studies, and natural science.
Table 2.3. Average ACT Scores by Race/Ethnicity
Student
Group Race/Ethnicity N Percent English Mathematics Reading Science Composite STEMAll Students 31,110 100 18.4 18.5 18.9 18.9 18.8 18.9
Black/African American 4,833 16 14.9 16.2 15.7 16.1 15.8 16.4
American Indian/Alaska Native 242 1 16.5 17.3 17.5 17.7 17.4 17.8
White 16,481 53 19.9 19.4 20.2 20.0 20.0 20.0
Hispanic/Latino 3,325 11 16.4 17.5 17.3 17.7 17.3 17.8
Asian 495 2 21.5 22.3 21.3 21.6 21.8 22.2
Native Hawaiian/Other Pac. Isl. 141 0 14.0 15.9 14.5 14.9 14.9 15.6
Two or More Races 1,367 4 19.1 18.8 19.8 19.3 19.4 19.3
Prefer not/No Response 4,226 14 17.8 18.0 18.4 18.4 18.3 18.5
State
State

ACT PROFILE REPORT- State: SECTION II, ACADEMIC ACHIEVEMENT PAGE 16
Arkansas State Testing 2016-2017 Code 049999
Grade 11 Tested Students Arkansas
Total Students in Report: 31,110
Table 2.4. Average ACT Composite Scores for Gender by Level of Preparation
Number of Percent Taking Average ACT Composite Score
Students Tested Core or More1
Core or More Less Than Core
Males 13,827 55 20.2 16.7
Females 14,075 63 20.1 17.0
No Response 3,208 43 20.2 16.8
Table 2.5. Average ACT Scores by Gender
Student Group Gender N Percent English Mathematics Reading Science Composite STEM
Males 13,827 44 17.9 18.6 18.6 18.9 18.6 19.0
Females 14,075 45 18.9 18.4 19.3 19.0 19.0 19.0
No Response 3,208 10 18.0 18.2 18.6 18.6 18.5 18.6
Table 2.6. ACT Score Quartile Values
Quartile English Mathematics Reading Science Composite
Q3 (75th Percentile) 22 21 23 22 22
Q2 (50th Percentile) 17 17 18 18 18
Q1 (25th Percentile) 14 15 14 15 15
Student Group Gender
State
State

ACT PROFILE REPORT - State: SECTION III, COLLEGE AND CAREER READINESS & THE IMPACT OF COURSE RIGOR PAGE 17
Arkansas State Testing 2016-2017 Code 049999
Grade 11 Tested Students Arkansas
Total Students in Report: 31,110
Section III
College and Career Readiness
and the Impact of Course Rigor
Beginning in August 2013, College Readiness Benchmarks for Reading and Science were updated to reflect the most recent college coursework research.

ACT PROFILE REPORT - State: SECTION III, COLLEGE AND CAREER READINESS AND THE IMPACT OF COURSE RIGOR PAGE 18
Arkansas State Testing 2016-2017 Code 049999
Grade 11 Tested Students Arkansas
Total Students in Report: 31,110
Figure 3.1. Percent of Students Meeting 3 or 4 College Readiness Benchmarks by Core College Curriculum Status*
31
8
29
38
17
54
2
32
29
11
2 3
15
6
30
8
11 10
0
10
20
30
40
50
60
70
80
90
100
All Students Black/AfricanAmerican
AmericanIndian/Alaska Native
White Hispanic Asian NativeHawaiian/OtherPacific Islander
Two or more Races Prefer not toRespond/NoResponse
Perc
ent
Core Non-Core
*Missing columns reflect combinations of race/ethnicity and core course-taking status in which one or both indicators are missing.

ACT PROFILE REPORT - State: SECTION III, COLLEGE AND CAREER READINESS & THE IMPACT OF COURSE RIGOR PAGE 19
Arkansas State Testing 2016-2017 Code 049999
Grade 11 Tested Students Arkansas
Total Students in Report: 31,110
Table 3.1. Percent of Students in College and Career Readiness Standards (CCRS) Score Ranges
Student English Mathematics Reading Science
Group N % N % N % N %
33 to 36 982 3 130 0 863 3 314 1
28 to 32 1,707 5 1,080 3 2,244 7 1,330 4
24 to 27 3,394 11 3,952 13 3,271 11 3,985 13
20 to 23 6,448 21 4,775 15 6,563 21 8,113 26
16 to 19 6,380 21 12,243 39 7,905 25 9,323 30
13 to 15 6,611 21 8,406 27 5,743 18 5,475 18
01 to 12 5,588 18 524 2 4,521 15 2,570 8
Table 3.2. Percent of Students Who Met College Readiness Benchmark Scores by Gender
Percent of Students Met
English Mathematics Reading Science All Four
Males 45 26 30 23 15
Females 53 24 32 21 13
No Response 46 23 29 20 13
CRS
Range
State
Student Group Gender
State

ACT PROFILE REPORT - State: SECTION III, COLLEGE AND CAREER READINESS & THE IMPACT OF COURSE RIGOR PAGE 20
Arkansas State Testing 2016-2017 Code 049999
Grade 11 Tested Students Arkansas
Total Students in Report: 31,110
Table 3.3. Percent of Students Who Met ACT College Readiness Benchmark Scores by Race/Ethnicity
English Mathematics Reading Science All Four STEM
Student Benchmark=18 Benchmark=22 Benchmark=22 Benchmark=23 Benchmark=26
Group Race/Ethnicity N % % % % % %
All Students 31,110 49 24 30 22 14 9
Black/African American 4,833 23 7 10 4 2 1
American Indian/Alaska Native 242 37 18 22 15 11 5
White 16,481 60 31 39 29 19 13
Hispanic/Latino 3,325 36 16 20 12 7 5
Asian 495 63 54 47 43 34 28
Native Hawaiian/Other Pac. Isl 141 18 8 7 3 1 0
Two or More Races 1,367 54 26 35 23 16 10
Prefer Not to Respond 4,226 45 21 27 19 12 7
Table 3.4. Likely ACT National Career Readiness Certificate (NCRC) Level Based Upon ACT Composite Score1
Student Average
Group ACT NCRS Level2
N % Composite
Gold or Higher 4,333 14 27.8
Silver 14,617 47 20.0
Bronze 10,568 34 14.5
Needs Improvement 1,592 5 11.71
The ACT Composite scores associated with a 50% chance of earning each ACT NCRC level or higher are: 13 for Bronze, 17 for Silver, 25 for Gold,
and 35 for Platinum. Based on those cut scores, students who earned an ACT Composite score of less than 13 would be classified as ‘Needs
Improvement’, 13 to 16 as ‘Bronze’, 17 to 24 as ‘Silver’, and 25 or above as ‘Gold or Higher’ in the table above. For comparison, individual
student score reports classify those who scored 12-13, 14-17, and 18 and higher as making progress toward Bronze, Silver, and Gold certificates.2 Additional information on the ACT NCRC can be found at www.act.org.
State
State

ACT PROFILE REPORT - State: SECTION III, COLLEGE AND CAREER READINESS & THE IMPACT OF COURSE RIGOR PAGE 21
Arkansas State Testing 2016-2017 Code 049999
Grade 11 Tested Students Arkansas
Total Students in Report: 31,110
Table 3.5. College Readiness Benchmark Percent and Average ACT Scores by Overall High School Curriculum
Student Curriculum English Mathematics Reading Science Composite4
STEM
Group Taken1 % Avg % Avg % Avg % Avg % Avg % Avg
Core or More2
17,807 61 20.0 32 19.5 39 20.3 29 20.2 19 20.2 13 20.1
Less than Core 6,987 31 16.0 12 16.9 17 16.8 11 17.1 5 16.8 4 17.3
Missing3
6,316 35 16.4 16 17.2 21 17.1 13 17.3 8 17.1 5 17.51 "Curriculum Taken" reflects overall high school curriculum in this table.
2 "Core or More" results correspond to students taking four or more years of English AND three or more years each of math, social studies, and natural science.
3 Zero years or no coursework information reported in one or more content areas.
4 Composite College Readiness Benchmark % results reflect students who met all four subject-area benchmarks.
Table 3.6. College Readiness Benchmark Percent and Average ACT Scores by Content-Specific Curriculum
Student Curriculum English Mathematics Reading Science
Group Taken1 N % Avg N % Avg N % Avg N % Avg
Core or More2
22,198 54 19.2 23,567 28 19.0 21,924 35 19.7 21,797 26 19.8
Less than Core 3,167 34 16.4 1,580 6 15.7 3,177 14 16.2 3,273 5 16.0
Missing3
5,745 36 16.5 5,963 16 17.3 6,009 21 17.2 6,040 14 17.41
"Curriculum Taken" reflects content-specific curriculum in this table.2 "Core or More" results correspond to students taking four or more years of English or three or more years of math, social studies, or natural science, respectively.
For instance, Reading "Core or More" results correspond to students taking three or more years of social studies, regardless of courses taken in other content areas.3 Zero years or no coursework information reported in the specified content area.
N
State
State

ACT PROFILE REPORT - State: SECTION III, COLLEGE AND CAREER READINESS & THE IMPACT OF COURSE RIGOR PAGE 22
Arkansas State Testing 2016-2017 Code 049999
Grade 11 Tested Students Arkansas
Total Students in Report: 31,110
Table 3.7. College Readiness Benchmark (CRB) Percent and Average ACT Scores by Common Course PatternsCourse Pattern State
ENGLISH COURSE PATTERN N
Percent Taking
Pattern
Avg ACT
English
Percent Who Met
Benchmark
Eng 9, Eng 10, Eng 11, Eng 12, & Other English 3,029 10 20.4 62
Eng 9, Eng 10, Eng 11, Eng 12 19,169 62 19.0 53
Less than 4 years of English 3,167 10 16.4 34
Zero years / no English courses reported 5,745 18 16.5 36
MATHEMATICS COURSE PATTERN N
Percent Taking
Pattern
Avg ACT
Math
Percent Who Met
Benchmark
Alg 1, Alg 2, Geom, Trig, & Calc 1,111 4 20.8 45
Alg 1, Alg 2, Geom, Trig, & Other Adv Math 1,337 4 21.1 50
Alg 1, Alg 2, Geom, & Trig 1,312 4 18.1 21
Alg 1, Alg 2, Geom, & Other Adv Math 8,205 26 18.6 23
Other comb of 4 or more years of Math 5,778 19 21.1 46
Alg 1, Alg 2, & Geom 4,221 14 16.4 6
Other comb of 3 or 3.5 years of Math 1,603 5 17.9 18
Less than 3 years of Math 1,580 5 15.7 6
Zero years / no Math courses reported 5,963 19 17.3 16
SOCIAL SCIENCE COURSE PATTERN N
Percent Taking
Pattern
Avg ACT
Reading
Percent Who Met
Benchmark
US Hist, World Hist, Am Gov, & Other Hist 160 1 18.3 26
Other comb of 4 or more years Social Science 11,183 36 20.5 41
US Hist, World Hist, & Am Gov 860 3 17.3 21
Other comb of 3 or 3.5 years of Social Science 9,721 31 19.1 30
Less than 3 years of Social Science 3,177 10 16.2 14
Zero years / no Social Science courses reported 6,009 19 17.2 21
NATURAL SCIENCE COURSE PATTERN N
Percent Taking
Pattern
Avg ACT
Science
Percent Who Met
Benchmark
Gen Sci1, Bio, Chem, & Phys 7,420 24 19.8 28
Bio, Chem, Phys 889 3 23.1 53
Gen Sci1, Bio, Chem 11,728 38 19.6 24
Other comb of 3 years of Natural Science 1,760 6 18.7 20
Less than 3 years of Natural Science 3,273 11 16.0 5
Zero years / no Natural Science courses reported 6,040 19 17.4 141Includes General, Physical and Earth Sciences.

ACT PROFILE REPORT - State: SECTION III, COLLEGE AND CAREER READINESS & THE IMPACT OF COURSE RIGOR PAGE 23
Arkansas State Testing 2016-2017 Code 049999
Grade 11 Tested Students Arkansas
Total Students in Report: 31,110
Table 3.8. College Readiness Benchmark (CRB) Percent and Average ACT Scores for Gender by Common Course PatternsCourse Pattern All Students Males Females
ENGLISH COURSE PATTERN N Percent
ACT
English
% Who Met
Benchmark N Percent
ACT
English
% Who Met
Benchmark N Percent
ACT
English
% Who Met
Benchmark
Eng 9, Eng 10, Eng 11, Eng 12, & Other English 3,029 10 20.4 62 1,269 9 19.7 57 1,602 11 20.8 66
Eng 9, Eng 10, Eng 11, Eng 12 19,169 62 19.0 53 8,479 61 18.5 50 9,012 64 19.4 56
Less than 4 years of English 3,167 10 16.4 34 1,508 11 16.0 32 1,352 10 16.8 37
Zero years / no English courses reported 5,745 18 16.5 36 2,571 19 16.1 33 2,109 15 16.9 39
MATHEMATICS COURSE PATTERN N Percent
ACT
Math
% Who Met
Benchmark N Percent
ACT
Math
% Who Met
Benchmark N Percent
ACT
Math
% Who Met
Benchmark
Alg 1, Alg 2, Geom, Trig, & Calc 1,111 4 20.8 45 491 4 21.2 47 526 4 20.4 44
Alg 1, Alg 2, Geom, Trig, & Other Adv Math 1,337 4 21.1 50 431 3 21.7 54 787 6 20.9 48
Alg 1, Alg 2, Geom, & Trig 1,312 4 18.1 21 586 4 18.2 22 612 4 18.0 21
Alg 1, Alg 2, Geom, & Other Adv Math 8,205 26 18.6 23 3,215 23 18.8 26 4,312 31 18.4 21
Other comb of 4 or more years of Math 5,778 19 21.1 46 2,753 20 21.6 50 2,660 19 20.5 43
Alg 1, Alg 2, & Geom 4,221 14 16.4 6 2,085 15 16.5 7 1,725 12 16.1 5
Other comb of 3 or 3.5 years of Math 1,603 5 17.9 18 729 5 18.2 22 710 5 17.6 16
Less than 3 years of Math 1,580 5 15.7 6 842 6 15.7 6 568 4 15.7 6
Zero years / no Math courses reported 5,963 19 17.3 16 2,695 19 17.3 16 2,175 15 17.2 15
SOCIAL SCIENCE COURSE PATTERN N Percent
ACT
Reading
% Who Met
Benchmark N Percent
ACT
Reading
% Who Met
Benchmark N Percent
ACT
Reading
% Who Met
Benchmark
US Hist, World Hist, Am Gov, & Other Hist 160 1 18.3 26 91 1 17.8 24 51 0 19.1 31
Other comb of 4 or more years Social Science 11,183 36 20.5 41 4,531 33 20.3 40 5,802 41 20.7 41
US Hist, World Hist, & Am Gov 860 3 17.3 21 464 3 17.1 21 311 2 17.4 20
Other comb of 3 or 3.5 years of Social Science 9,721 31 19.1 30 4,519 33 18.9 30 4,384 31 19.2 30
Less than 3 years of Social Science 3,177 10 16.2 14 1,519 11 16.0 15 1,321 9 16.5 14
Zero years / no Social Science courses reported 6,009 19 17.2 21 2,703 20 16.8 20 2,206 16 17.5 21
NATURAL SCIENCE COURSE PATTERN N Percent
ACT
Science
% Who Met
Benchmark N Percent
ACT
Science
% Who Met
Benchmark N Percent
ACT
Science
% Who Met
Benchmark
Gen Sci1, Bio, Chem, & Phys 7,420 24 19.8 28 3,535 26 20.2 31 3,291 23 19.5 24
Bio, Chem, Phys 889 3 23.1 53 403 3 23.1 52 447 3 23.0 53
Gen Sci2, Bio, Chem 11,728 38 19.6 24 4,464 32 19.5 25 6,267 45 19.7 23
Other comb of 3 years of Natural Science 1,760 6 18.7 20 978 7 19.0 23 654 5 18.3 15
Less than 3 years of Natural Science 3,273 11 16.0 5 1,732 13 16.0 6 1,190 8 16.2 5
Zero years / no Natural Science courses reported 6,040 19 17.4 14 2,715 20 17.2 14 2,226 16 17.5 121Includes General, Physical and Earth Sciences.

ACT PROFILE REPORT - State: SECTION III, COLLEGE AND CAREER READINESS & THE IMPACT OF COURSE RIGOR PAGE 24
Arkansas State Testing 2016-2017 Code 049999
Grade 11 Tested Students Arkansas
Total Students in Report: 31,110
This page intentionally left blank.

ACT PROFILE REPORT - State: SECTION IV, CAREER AND EDUCATIONAL ASPIRATIONS PAGE 25
Arkansas State Testing 2016-2017 Code 049999
Grade 11 Tested Students Arkansas
Total Students in Report: 31,110
Section IV
Career and Educational Aspirations
Beginning in August 2013, College Readiness Benchmarks for Reading and Science were updated to reflect the most recent college coursework research.

ACT PROFILE REPORT - State: SECTION IV, CAREER AND EDUCATIONAL ASPIRATIONS PAGE 26
Arkansas State Testing 2016-2017 Code 049999
Grade 11 Tested Students Arkansas
Total Students in Report: 31,110
Figure 4.1. Average ACT Composite Scores by Race and Student Postsecondary Aspirations*
13.8 14.5
16.4
15.1
18.4
13.8 14.4
15.6
16.9
15.5 15.0 15.2
16.1
17.6
20.0
17.6
20.0
16.0
17.8 18.4
23.1
19.2
23.7
16.8
17.7
20.4
22.3
19.6
25.3
15.6
1
6
11
16
21
26
31
Black/African American American Indian/Alaska Native White Hispanic/Latino Asian Native Hawaiian/Pacific Islander
Avera
ge C
om
posite S
core
Voc-Tech 2-yr College Degree Bachelors Degree Graduate Study Prof. Level Degree
*Missing columns reflect combinations of race/ethnicity and postsecondary aspiration in which one or both indicators are missing.

ACT PROFILE REPORT - State: SECTION IV, CAREER AND EDUCATIONAL ASPIRATIONS PAGE 27
Arkansas State Testing 2016-2017 Code 049999
Grade 11 Tested Students Arkansas
Total Students in Report: 31,110
Table 4.1. Distribution of Planned Educational Majors for All Students by College Plans
All Students Plan on 2 Years or Less of College Plan on 4 Years or More of College
Planned Educational Major N1
Percent2
Avg ACT
Comp N Percent
Avg ACT
Comp N Percent
Avg ACT
Comp
Agriculture & Natural Resources Conservation 747 2 18.0 152 5 15.9 536 3 18.9
Architecture 321 1 19.3 38 1 16.2 268 1 19.9
Area, Ethnic, & Multidisciplinary Studies 35 0 18.5 8 0 15.3 25 0 19.6
Arts: Visual & Performing 1,783 6 19.1 272 9 16.2 1,403 8 19.8
Business 1,731 6 19.5 249 8 15.8 1,416 8 20.3
Communications 265 1 20.0 38 1 16.1 222 1 20.8
Community, Family, & Personal Services 1,049 3 17.0 293 9 16.1 649 4 17.7
Computer Science & Mathematics 659 2 22.3 56 2 17.8 582 3 22.9
Education 1,295 4 19.4 85 3 15.4 1,167 6 19.7
Engineering 1,441 5 20.8 198 6 15.8 1,170 6 21.9
Engineering Technology & Drafting 394 1 18.5 93 3 16.3 282 2 19.4
English & Foreign Languages 233 1 21.4 16 1 17.6 204 1 22.0
Health Administration & Assisting 813 3 17.2 95 3 15.7 684 4 17.5
Health Sciences & Technologies 5,223 17 19.7 317 10 16.7 4,734 26 19.9
Philosophy, Religion, & Theology 133 0 20.3 12 0 16.5 112 1 20.8
Repair, Production, & Construction 783 3 16.7 420 13 16.3 276 1 17.5
Sciences: Biological & Physical 963 3 22.1 31 1 17.3 906 5 22.3
Social Sciences & Law 1,594 5 20.6 68 2 16.1 1,459 8 21.0
Undecided 2,391 8 18.7 400 13 16.0 1,661 9 19.9
No Response 9,038 29 17.3 291 9 14.6 615 3 16.312-Year and 4-Year "N" counts do not reflect "Missing" and "Other" college plans, therefore they may not add up to the N count for All Students.
2Percent of students tested within College Plan groups (All Students, 2-Year, 4-Year).

ACT PROFILE REPORT - State: SECTION IV, CAREER AND EDUCATIONAL ASPIRATIONS PAGE 28
Arkansas State Testing 2016-2017 Code 049999
Grade 11 Tested Students Arkansas
Total Students in Report: 31,110
Table 4.2. Average ACT Composite Scores for Racial/Ethnic Groups by Post-Secondary Educational Aspirations
All Racial/Ethnic Groups
Combined Black/African American American Indian/ Alaska Native White Hispanic/Latino
N Average N Average N Average N Average N Average
Voc-Tech 988 15.7 145 13.8 8 14.5 495 16.4 114 15.1
2-yr College Degree 2,207 16.1 369 14.4 24 15.6 1,089 16.9 304 15.5
Bachelors Degree 10,902 19.0 1,517 16.1 79 17.6 6,134 20.0 1,295 17.6
Graduate Study 2,591 21.9 258 17.8 18 18.4 1,639 23.1 232 19.2
Prof. Level Degree 5,012 21.3 693 17.7 30 20.4 2,850 22.3 454 19.6
Other 867 16.1 84 15.1 11 16.7 475 16.7 110 15.2
No Response 8,543 17.5 1,767 15.1 72 16.7 3,799 18.7 816 16.4
All Racial/Ethnic Groups
Combined Asian
Native Hawaiian/
Pacific Islander Two or more races
Prefer not to respond/
No Response
N Average N Average N Average N Average N Average
Voc-Tech 988 15.7 11 18.4 13 13.8 46 16.7 156 15.8
2-yr College Degree 2,207 16.1 20 15.0 10 15.2 90 16.4 301 15.9
Bachelors Degree 10,902 19.0 143 20.0 34 16.0 500 19.6 1,200 18.5
Graduate Study 2,591 21.9 60 23.7 5 16.8 109 21.8 270 20.9
Prof. Level Degree 5,012 21.3 135 25.3 11 15.6 255 21.6 584 20.8
Other 867 16.1 10 14.7 7 13.6 38 16.2 132 15.6
No Response 8,543 17.5 116 21.1 61 14.4 329 18.1 1,583 17.7
Educational Degree
Aspirations
Educational Degree
Aspirations
ACT PROFILE REPORT - State: SECTION IV, CAREER AND EDUCATIONAL ASPIRATIONS PAGE 29
Arkansas State Testing 2016-2017 Code 049999
Grade 11 Tested Students Arkansas
Total Students in Report: 31,110
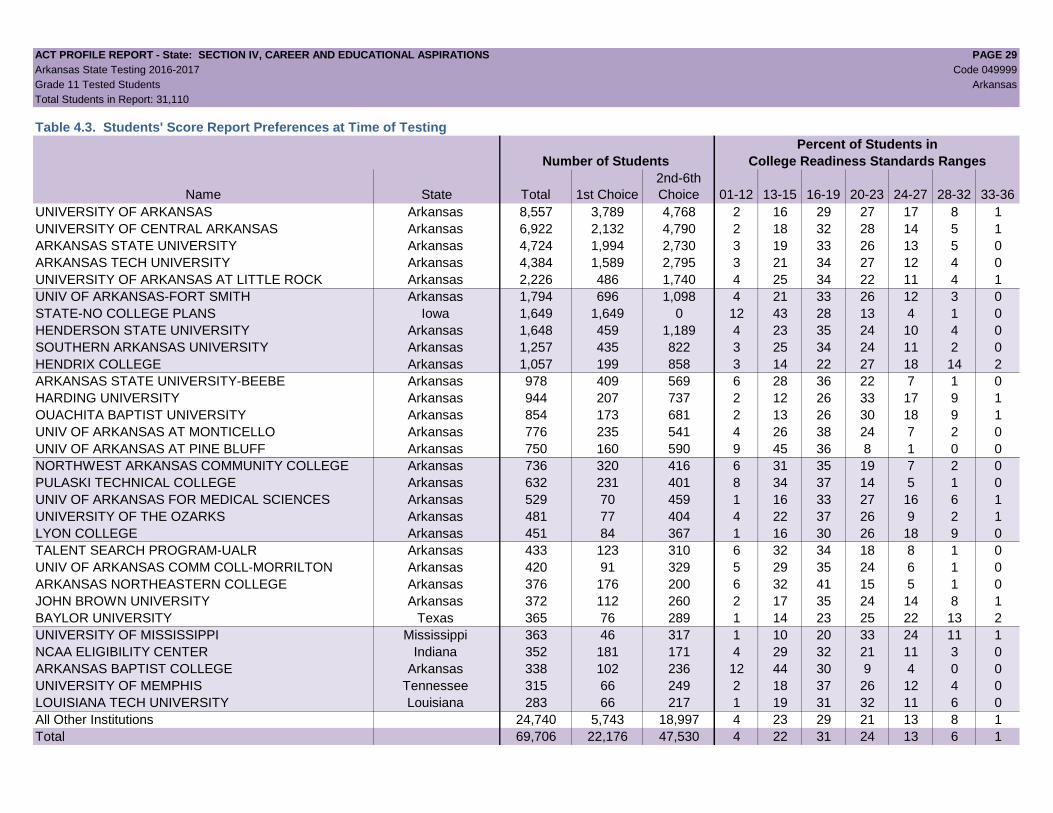
Table 4.3. Students' Score Report Preferences at Time of Testing
Percent of Students in
Number of Students College Readiness Standards Ranges
Name State Total 1st Choice
2nd-6th
Choice 01-12 13-15 16-19 20-23 24-27 28-32 33-36
UNIVERSITY OF ARKANSAS Arkansas 8,557 3,789 4,768 2 16 29 27 17 8 1
UNIVERSITY OF CENTRAL ARKANSAS Arkansas 6,922 2,132 4,790 2 18 32 28 14 5 1
ARKANSAS STATE UNIVERSITY Arkansas 4,724 1,994 2,730 3 19 33 26 13 5 0
ARKANSAS TECH UNIVERSITY Arkansas 4,384 1,589 2,795 3 21 34 27 12 4 0
UNIVERSITY OF ARKANSAS AT LITTLE ROCK Arkansas 2,226 486 1,740 4 25 34 22 11 4 1
UNIV OF ARKANSAS-FORT SMITH Arkansas 1,794 696 1,098 4 21 33 26 12 3 0
STATE-NO COLLEGE PLANS Iowa 1,649 1,649 0 12 43 28 13 4 1 0
HENDERSON STATE UNIVERSITY Arkansas 1,648 459 1,189 4 23 35 24 10 4 0
SOUTHERN ARKANSAS UNIVERSITY Arkansas 1,257 435 822 3 25 34 24 11 2 0
HENDRIX COLLEGE Arkansas 1,057 199 858 3 14 22 27 18 14 2
ARKANSAS STATE UNIVERSITY-BEEBE Arkansas 978 409 569 6 28 36 22 7 1 0
HARDING UNIVERSITY Arkansas 944 207 737 2 12 26 33 17 9 1
OUACHITA BAPTIST UNIVERSITY Arkansas 854 173 681 2 13 26 30 18 9 1
UNIV OF ARKANSAS AT MONTICELLO Arkansas 776 235 541 4 26 38 24 7 2 0
UNIV OF ARKANSAS AT PINE BLUFF Arkansas 750 160 590 9 45 36 8 1 0 0
NORTHWEST ARKANSAS COMMUNITY COLLEGE Arkansas 736 320 416 6 31 35 19 7 2 0
PULASKI TECHNICAL COLLEGE Arkansas 632 231 401 8 34 37 14 5 1 0
UNIV OF ARKANSAS FOR MEDICAL SCIENCES Arkansas 529 70 459 1 16 33 27 16 6 1
UNIVERSITY OF THE OZARKS Arkansas 481 77 404 4 22 37 26 9 2 1
LYON COLLEGE Arkansas 451 84 367 1 16 30 26 18 9 0
TALENT SEARCH PROGRAM-UALR Arkansas 433 123 310 6 32 34 18 8 1 0
UNIV OF ARKANSAS COMM COLL-MORRILTON Arkansas 420 91 329 5 29 35 24 6 1 0
ARKANSAS NORTHEASTERN COLLEGE Arkansas 376 176 200 6 32 41 15 5 1 0
JOHN BROWN UNIVERSITY Arkansas 372 112 260 2 17 35 24 14 8 1
BAYLOR UNIVERSITY Texas 365 76 289 1 14 23 25 22 13 2
UNIVERSITY OF MISSISSIPPI Mississippi 363 46 317 1 10 20 33 24 11 1
NCAA ELIGIBILITY CENTER Indiana 352 181 171 4 29 32 21 11 3 0
ARKANSAS BAPTIST COLLEGE Arkansas 338 102 236 12 44 30 9 4 0 0
UNIVERSITY OF MEMPHIS Tennessee 315 66 249 2 18 37 26 12 4 0
LOUISIANA TECH UNIVERSITY Louisiana 283 66 217 1 19 31 32 11 6 0
All Other Institutions 24,740 5,743 18,997 4 23 29 21 13 8 1
Total 69,706 22,176 47,530 4 22 31 24 13 6 1

ACT PROFILE REPORT - State : SECTION IV, CAREER AND EDUCATIONAL ASPIRATIONS PAGE 30
Arkansas State Testing 2016-2017 Code 049999
Grade 11 Tested Students Arkansas
Total Students in Report: 31,110
This page intentionally left blank.

ACT PROFILE REPORT - State: SECTION V, OPTIONAL WRITING TEST RESULTS PAGE 31
Arkansas State Testing 2016-2017 Code 049999
Grade 11 Tested Students Arkansas
Total Students in Report: 31,110
Section V
Optional Writing Test Results
Beginning in August 2013, College Readiness Benchmarks for Reading and Science were updated to reflect the most recent college coursework research.

ACT PROFILE REPORT - State: SECTION V, OPTIONAL WRITING TEST RESULTS PAGE 32
Arkansas State Testing 2016-2017 Code 049999
Grade 11 Tested Students Arkansas
Total Students in Report: 31,110
Figure 5.1. Average ACT Writing Scores by Race/Ethnicity*
2
3
4
5
6
7
8
9
10
11
12
All Students Black/African American American Indian/AlaskaNative
White Hispanic/Latino Asian Native Hawaiian/OtherPac. Isl.
Two or More Races
Avera
ge C
om
posite S
core
State
*Missing columns reflect race/ethnicity groupings that are missing. Results based on students with ACT Writing scores from test events beginning September 2016. Score scale is 2-12.

ACT PROFILE REPORT - State: SECTION V, OPTIONAL WRITING TEST RESULTS PAGE 33
Arkansas State Testing 2016-2017 Code 049999
Grade 11 Tested Students Arkansas
Total Students in Report: 31,110
Table 5.1. Average ACT English Language Arts and Constituent Scores by Race/Ethnicity and Gender for Students Who Took ACT Writing1
Average ACT Scores
English
N Writing English Reading Language Arts
State State State State State
All Students 0 . . . .
Black/African American . . . . .
American Indian/Alaska Native . . . . .
White . . . . .
Hispanic/Latino . . . . .
Asian . . . . .
Native Hawaiian/Other Pac. Isl. . . . . .
Two or More Races . . . . .
Prefer not/No Response . . . . .
Males . . . . .
Females . . . . .
No Response . . . . .1Results based on students with ACT writing scores with test events beginning September 2016. The writing score range is 2-12.
