profile of aapi tentatively eligible applicants
DESCRIPTION
TRANSCRIPT
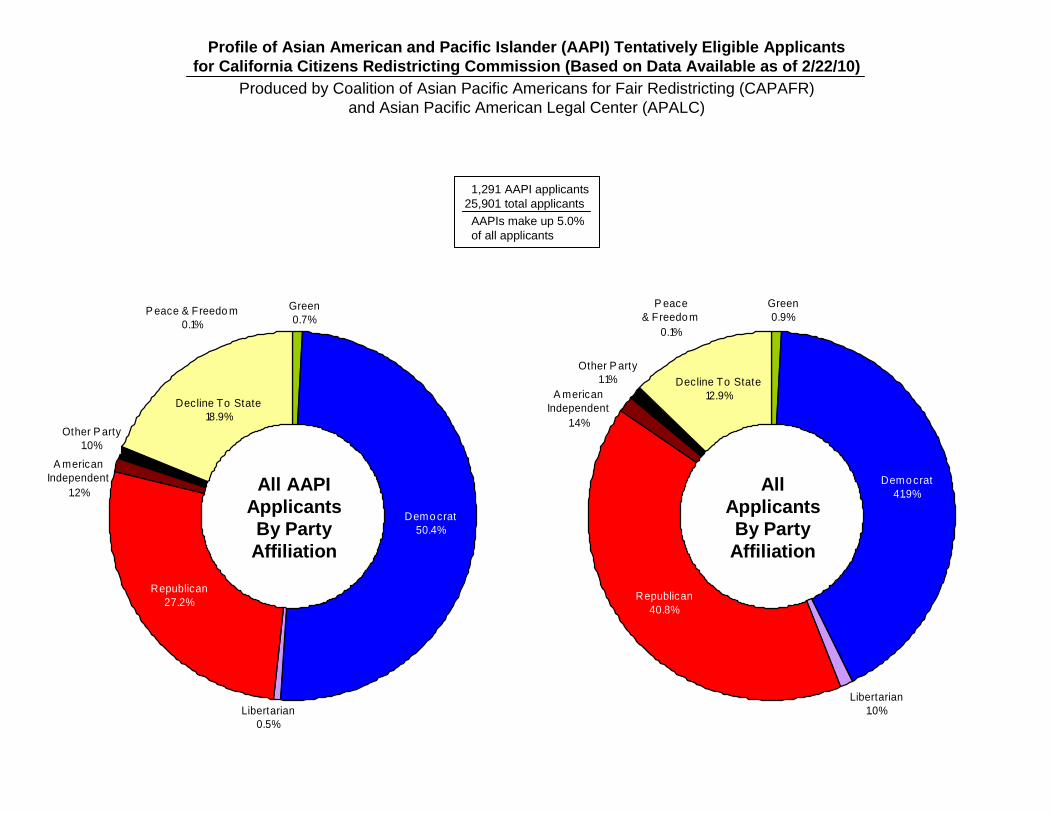
Demo crat50.4%
Republican27.2%
Libertarian0.5%
A merican Independent
1.2%
Other P arty1.0%
P eace & Freedo m0.1%
Green0.7%
Decline To State18.9%
Profile of Asian American and Pacific Islander (AAPI) Tentatively Eligible Applicantsfor California Citizens Redistricting Commission (Based on Data Available as of 2/22/10)
Produced by Coalition of Asian Pacific Americans for Fair Redistricting (CAPAFR)and Asian Pacific American Legal Center (APALC)
All AAPIApplicantsBy PartyAffiliation
Demo crat41.9%
Republican40.8%
A merican Independent
1.4%
Other P arty1.1%
Green0.9%
P eace & Freedo m
0.1%
Libertarian1.0%
Decline To State12.9%
AllApplicantsBy PartyAffiliation
01,291 AAPI applicants25,901 total applicants
AAPIs make up 5.0%of all applicants

Democrat41.9%
Republican40.8%
Other Party17.3%
Demo crat50.4%
Republican27.2%
Other P arty22.4%
Profile of Asian American and Pacific Islander (AAPI) Tentatively Eligible Applicantsfor California Citizens Redistricting Commission (Based on Data Available as of 2/22/10)
Produced by Coalition of Asian Pacific Americans for Fair Redistricting (CAPAFR)and Asian Pacific American Legal Center (APALC)
All AAPIApplicantsBy PartyCategory
AllApplicantsBy PartyCategory
01,291 AAPI applicants25,901 total applicants
AAPIs make up 5.0%of all applicants

B ay A rea24.4%
Central Co astal4.1%
Outside Califo rnia0.7%
So uthernCentral Valley & M o untain
8.3%
Inland Empire
7.8%
So uthern Co astal39.1%
No rthern Central Valley & M o untain
14.9%
No rthern Co astal0.5%
B ay A rea40.3%
No rthernCentral Valley &
M o untain8.1%
No rthern Co astal0.1%
So uthern Co astal
42.1%
Central Co astal
1.5%
Outside Califo rnia0.6%
Inland Empire3.6%
So uthern Central Valley & M o untain
3.8%
Profile of Asian American and Pacific Islander (AAPI) Tentatively Eligible Applicantsfor California Citizens Redistricting Commission (Based on Data Available as of 2/22/10)
Produced by Coalition of Asian Pacific Americans for Fair Redistricting (CAPAFR)and Asian Pacific American Legal Center (APALC)
All AAPIApplicantsBy Region
AllApplicantsBy Region
01,291 AAPI applicants25,901 total applicants
AAPIs make up 5.0%of all applicants

$ 250,001 & Over
4.8%$ 34,999 & Under
12.6%
$ 125,000 - $ 250,000
21.9%
$ 35,000 - $ 74,999
28.5%
$ 75,000 - $ 124,999
32.3%
$ 35,000 - $ 74,999
28.2%
$ 125,000 - $ 250,000
23.5%
$ 34,999 & Under
13.7%
$ 250,001 & Over
4.6%
$ 75,000 - $ 124,999
30.0%
Profile of Asian American and Pacific Islander (AAPI) Tentatively Eligible Applicantsfor California Citizens Redistricting Commission (Based on Data Available as of 2/22/10)
Produced by Coalition of Asian Pacific Americans for Fair Redistricting (CAPAFR)and Asian Pacific American Legal Center (APALC)
All AAPIApplicants
By HouseholdIncome
AllApplicants
By HouseholdIncome
01,291 AAPI applicants25,901 total applicants
AAPIs make up 5.0%of all applicants
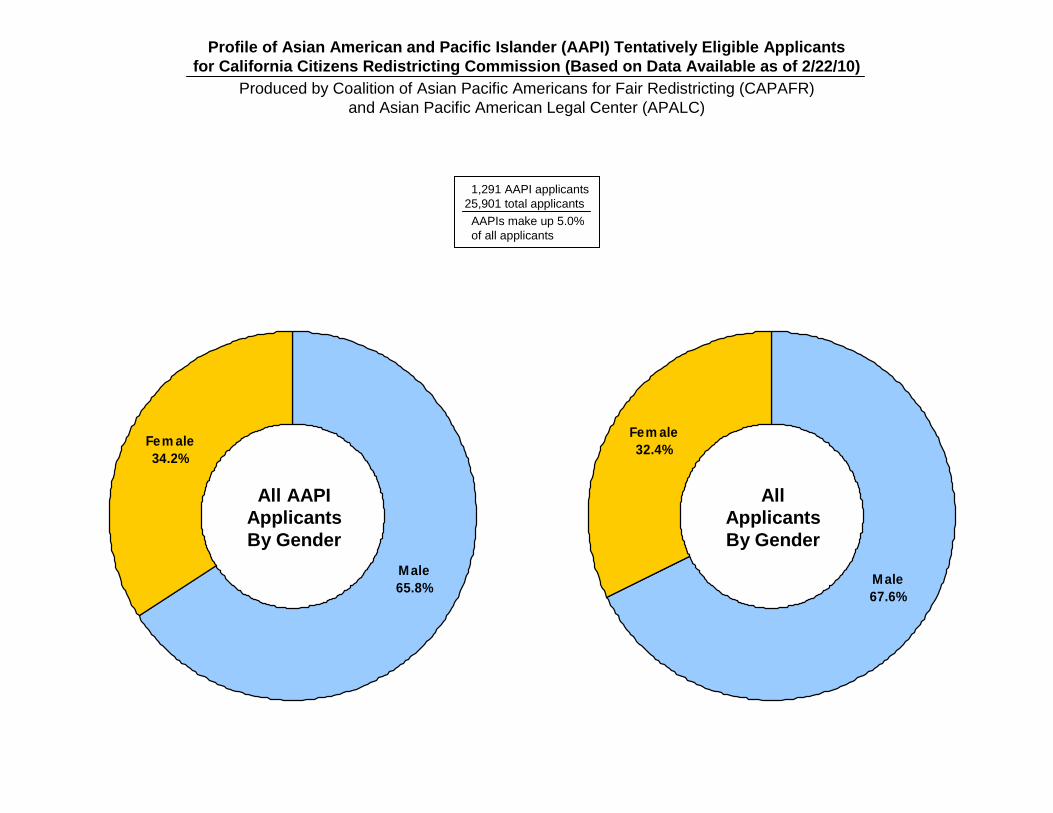
Male67.6%
Fem ale32.4%
Male65.8%
Fem ale34.2%
Profile of Asian American and Pacific Islander (AAPI) Tentatively Eligible Applicantsfor California Citizens Redistricting Commission (Based on Data Available as of 2/22/10)
Produced by Coalition of Asian Pacific Americans for Fair Redistricting (CAPAFR)and Asian Pacific American Legal Center (APALC)
All AAPIApplicantsBy Gender
AllApplicantsBy Gender
01,291 AAPI applicants25,901 total applicants
AAPIs make up 5.0%of all applicants

35 & Under12.4%
36 - 4515.4%
46 - 5525.1%
56 - 6529.0%
66 & Over18.1%35 & Under
25.8%
36 - 4521.1%
46 - 5522.3%
56 - 6522.4%
66 & Over8.4%
Profile of Asian American and Pacific Islander (AAPI) Tentatively Eligible Applicantsfor California Citizens Redistricting Commission (Based on Data Available as of 2/22/10)
Produced by Coalition of Asian Pacific Americans for Fair Redistricting (CAPAFR)and Asian Pacific American Legal Center (APALC)
All AAPIApplicants
By Age
AllApplicants
By Age
01,291 AAPI applicants25,901 total applicants
AAPIs make up 5.0%of all applicants

B ay A rea28.9%
Inland Empire5.7%
No rthernCentral Valley &
M o untain13.1%
Outside Califo rnia0.8%
So uthernCentral Valley & M o untain
6.4%
No rthern Co astal0.6%
So uthern Co astal40.0%
Central Co astal
4.5%
B ay A rea44.9%
No rthern Co astal0.0%
So uthern Co astal38.7%
Outside Califo rnia0.8%
Inland Empire2.3%
So uthern CentralValley & M o untain
3.2%No rthernCentralValley &
M o untain8.0%
Central Co astal2.2%
Profile of Asian American and Pacific Islander (AAPI) Tentatively Eligible Applicantsfor California Citizens Redistricting Commission (Based on Data Available as of 2/22/10)
Produced by Coalition of Asian Pacific Americans for Fair Redistricting (CAPAFR)and Asian Pacific American Legal Center (APALC)
AAPIDemocratApplicantsBy Region
AllDemocratApplicantsBy Region
00,651 AAPI Democrats10,857 total Democrats
AAPIs make up 6.0%of Democrat applicants

$ 250,001 & Over
4.6% $ 34,999 & Under
14.3%$ 125,000
- $ 250,00020.8%
$ 75,000 - $ 124,999
31.3%
$ 35,000 - $ 74,999
28.9%
$ 35,000 - $ 74,999
27.6%
$ 75,000 - $ 124,999
30.6%
$ 125,000 - $ 250,000
21.0%
$ 34,999 & Under
15.8%
$ 250,001 & Over
4.9%
Profile of Asian American and Pacific Islander (AAPI) Tentatively Eligible Applicantsfor California Citizens Redistricting Commission (Based on Data Available as of 2/22/10)
Produced by Coalition of Asian Pacific Americans for Fair Redistricting (CAPAFR)and Asian Pacific American Legal Center (APALC)
AAPIDemocratApplicants
By HouseholdIncome
AllDemocratApplicants
By HouseholdIncome
00,651 AAPI Democrats10,857 total Democrats
AAPIs make up 6.0%of Democrat applicants

Male56.2%
Fem ale43.8%
Male56.7%
Fem ale43.3%
Profile of Asian American and Pacific Islander (AAPI) Tentatively Eligible Applicantsfor California Citizens Redistricting Commission (Based on Data Available as of 2/22/10)
Produced by Coalition of Asian Pacific Americans for Fair Redistricting (CAPAFR)and Asian Pacific American Legal Center (APALC)
AAPIDemocratApplicantsBy Gender
AllDemocratApplicantsBy Gender
00,651 AAPI Democrats10,857 total Democrats
AAPIs make up 6.0%of Democrat applicants

35 & Under14.0%
36 - 4514.8%
46 - 5523.3%
56 - 6530.3%
66 & Over17.7%
35 & Under28.4%
36 - 4520.6%46 - 55
19.5%
56 - 6522.4%
66 & Over9.1%
Profile of Asian American and Pacific Islander (AAPI) Tentatively Eligible Applicantsfor California Citizens Redistricting Commission (Based on Data Available as of 2/22/10)
Produced by Coalition of Asian Pacific Americans for Fair Redistricting (CAPAFR)and Asian Pacific American Legal Center (APALC)
AAPIDemocratApplicants
By Age
AllDemocratApplicants
By Age
00,651 AAPI Democrats10,857 total Democrats
AAPIs make up 6.0%of Democrat applicants

B ay A rea18.3%
Outside Califo rnia0.6%
So uthern Central Valley &
M o untain11.1%
Inland Empire10.3%
So uthern Co astal38.7%
No rthern Co astal0.4%
Central Co astal
3.6%
No rthern Central Valley & M o untain
17.0%
B ay A rea29.1%
No rthern Co astal0.3%
So uthern Co astal49.9%
Central Co astal
0.9%
Inland Empire
4.8%
Outside Califo rnia0.6%
No rthern Central Valley &
M o untain9.4%
So uthern Central Valley & M o untain
5.1%
Profile of Asian American and Pacific Islander (AAPI) Tentatively Eligible Applicantsfor California Citizens Redistricting Commission (Based on Data Available as of 2/22/10)
Produced by Coalition of Asian Pacific Americans for Fair Redistricting (CAPAFR)and Asian Pacific American Legal Center (APALC)
AAPIRepublicanApplicantsBy Region
AllRepublicanApplicantsBy Region
00,351 AAPI Republicans10,569 total Republicans
AAPIs make up 3.3%of Republican applicants

$ 75,000 - $ 124,999
34.0%
$ 35,000 - $ 74,99927.9%
$ 34,999 & Under
9.3%
$ 250,001 & Over
5.3%
$ 125,000 - $ 250,000
23.6%
$ 35,000 - $ 74,999
27.4%
$ 75,000 - $ 124,999
30.8%
$ 125,000 - $ 250,000
27.6%
$ 250,001 & Over4.0%
$ 34,999 & Under
10.3%
Profile of Asian American and Pacific Islander (AAPI) Tentatively Eligible Applicantsfor California Citizens Redistricting Commission (Based on Data Available as of 2/22/10)
Produced by Coalition of Asian Pacific Americans for Fair Redistricting (CAPAFR)and Asian Pacific American Legal Center (APALC)
AAPIRepublicanApplicants
By HouseholdIncome
AllRepublicanApplicants
By HouseholdIncome
00,351 AAPI Republicans10,569 total Republicans
AAPIs make up 3.3%of Republican applicants

Male76.5%
Fem ale23.5%
Male78.3%
Fem ale21.7%
Profile of Asian American and Pacific Islander (AAPI) Tentatively Eligible Applicantsfor California Citizens Redistricting Commission (Based on Data Available as of 2/22/10)
Produced by Coalition of Asian Pacific Americans for Fair Redistricting (CAPAFR)and Asian Pacific American Legal Center (APALC)
AAPIRepublicanApplicantsBy Gender
AllRepublicanApplicantsBy Gender
00,351 AAPI Republicans10,569 total Republicans
AAPIs make up 3.3%of Republican applicants
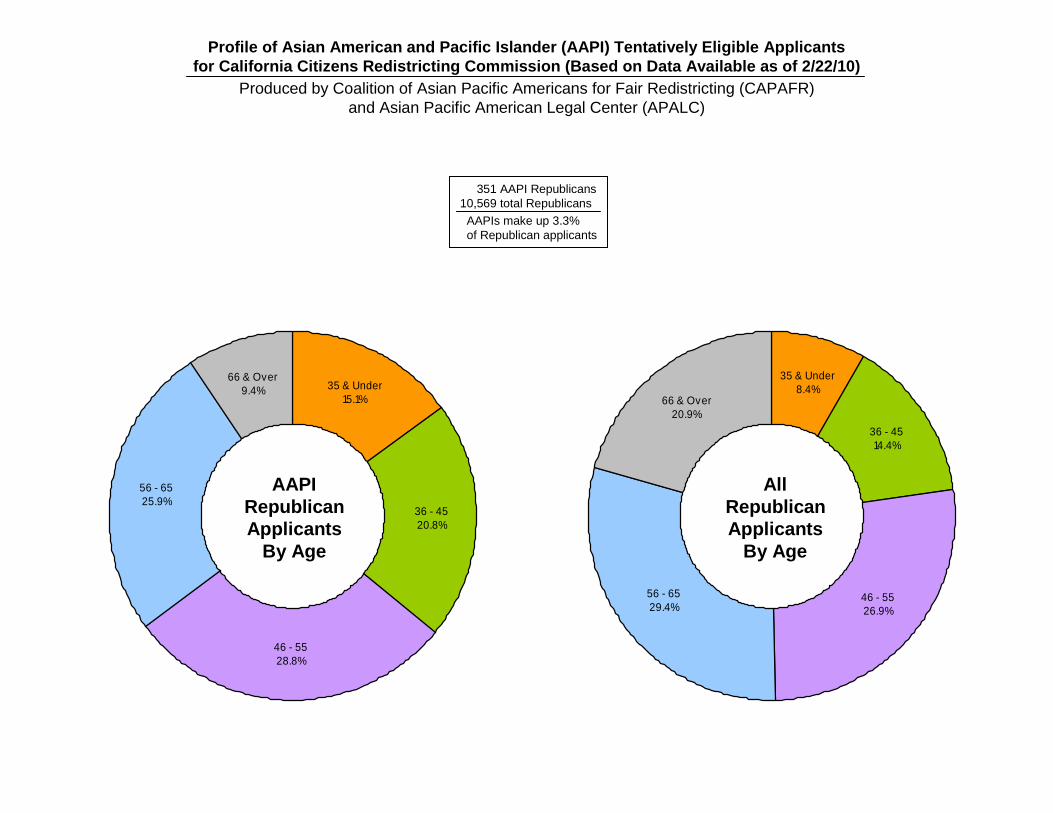
35 & Under8.4%
36 - 4514.4%
46 - 5526.9%
56 - 6529.4%
66 & Over20.9%
35 & Under15.1%
36 - 4520.8%
46 - 5528.8%
56 - 6525.9%
66 & Over9.4%
Profile of Asian American and Pacific Islander (AAPI) Tentatively Eligible Applicantsfor California Citizens Redistricting Commission (Based on Data Available as of 2/22/10)
Produced by Coalition of Asian Pacific Americans for Fair Redistricting (CAPAFR)and Asian Pacific American Legal Center (APALC)
AAPIRepublicanApplicants
By Age
AllRepublicanApplicants
By Age
00,351 AAPI Republicans10,569 total Republicans
AAPIs make up 3.3%of Republican applicants

Green5.0%
Decline To State74.6%
Other P arty6.2%
A merican Independent
8.0%
Libertarian5.7%
P eace & Freedo m0.5%
Decline To State84.4%
Other P arty4.5%
A merican Independent
5.2%
P eace & Freedo m0.3% Libertarian
2.4%
Green3.1%
Profile of Asian American and Pacific Islander (AAPI) Tentatively Eligible Applicantsfor California Citizens Redistricting Commission (Based on Data Available as of 2/22/10)
Produced by Coalition of Asian Pacific Americans for Fair Redistricting (CAPAFR)and Asian Pacific American Legal Center (APALC)
AAPIOther PartyApplicantsBy PartyAffiliation
AllOther PartyApplicantsBy PartyAffiliation
0,289 AAPI Other Party applicants4,475 total Other Party applicants
Other Party applicants includedecline-to-state and third-party voters
AAPIs make up 6.5% of Other Partyapplicants

B ay A rea28.0%
No rthern Co astal0.6%
So uthern Co astal38.0%
Central Co astal
4.3%
Inland Empire
7.0%
Outside Califo rnia0.8%
No rthern CentralValley & M o untain
14.6% So uthern Central Valley & M o untain
6.6%
B ay A rea43.6%
No rthern Co astal0.0%
So uthern Co astal40.5%
Central Co astal
0.7%
Outside Califo rnia0.3%
No rthern Central Valley &
M o untain6.6%
So uthern Central Valley & M o untain
3.5%
Inland Empire
4.8%
Profile of Asian American and Pacific Islander (AAPI) Tentatively Eligible Applicantsfor California Citizens Redistricting Commission (Based on Data Available as of 2/22/10)
Produced by Coalition of Asian Pacific Americans for Fair Redistricting (CAPAFR)and Asian Pacific American Legal Center (APALC)
AAPIOther PartyApplicantsBy Region
AllOther PartyApplicantsBy Region
0,289 AAPI Other Party applicants4,475 total Other Party applicants
Other Party applicants includedecline-to-state and third-party voters
AAPIs make up 6.5% of Other Partyapplicants
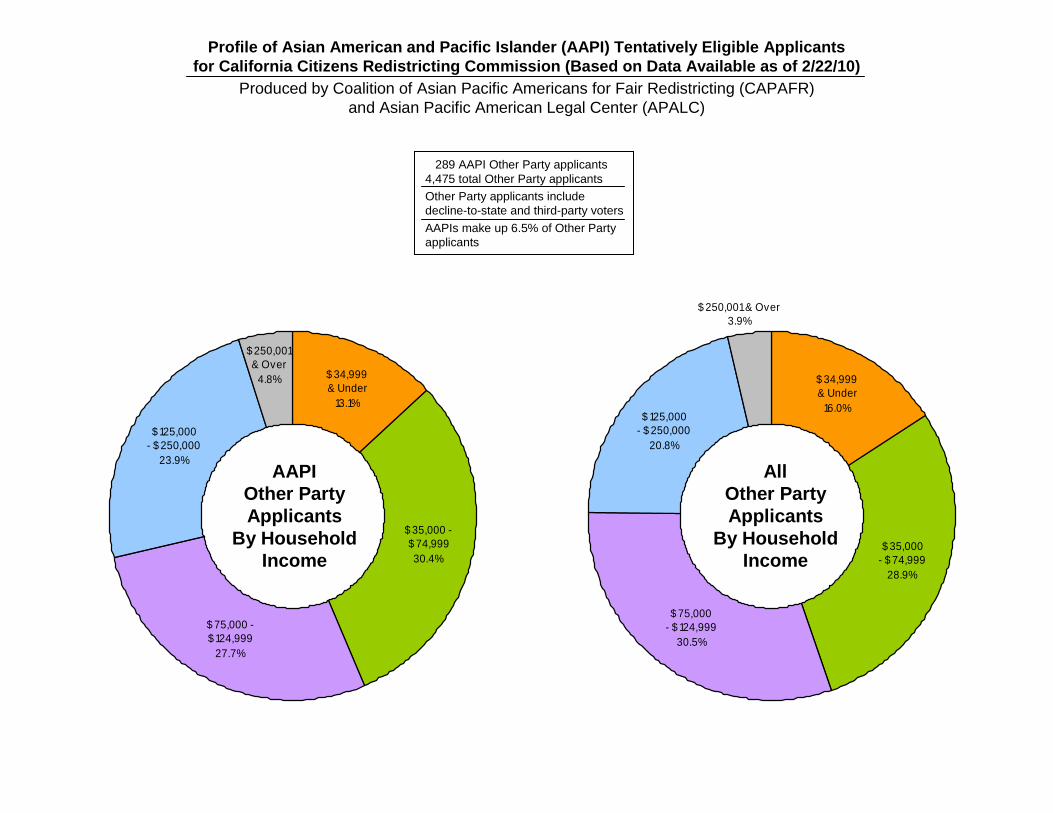
$ 35,000 - $ 74,999
28.9%
$ 75,000 - $ 124,999
30.5%
$ 125,000 - $ 250,000
20.8%
$ 34,999 & Under
16.0%
$ 250,001 & Over3.9%
$ 75,000 - $ 124,999
27.7%
$ 35,000 - $ 74,99930.4%
$ 34,999 & Under
13.1%
$ 250,001 & Over
4.8%
$ 125,000 - $ 250,000
23.9%
Profile of Asian American and Pacific Islander (AAPI) Tentatively Eligible Applicantsfor California Citizens Redistricting Commission (Based on Data Available as of 2/22/10)
Produced by Coalition of Asian Pacific Americans for Fair Redistricting (CAPAFR)and Asian Pacific American Legal Center (APALC)
AAPIOther PartyApplicants
By HouseholdIncome
AllOther PartyApplicants
By HouseholdIncome
0,289 AAPI Other Party applicants4,475 total Other Party applicants
Other Party applicants includedecline-to-state and third-party voters
AAPIs make up 6.5% of Other Partyapplicants
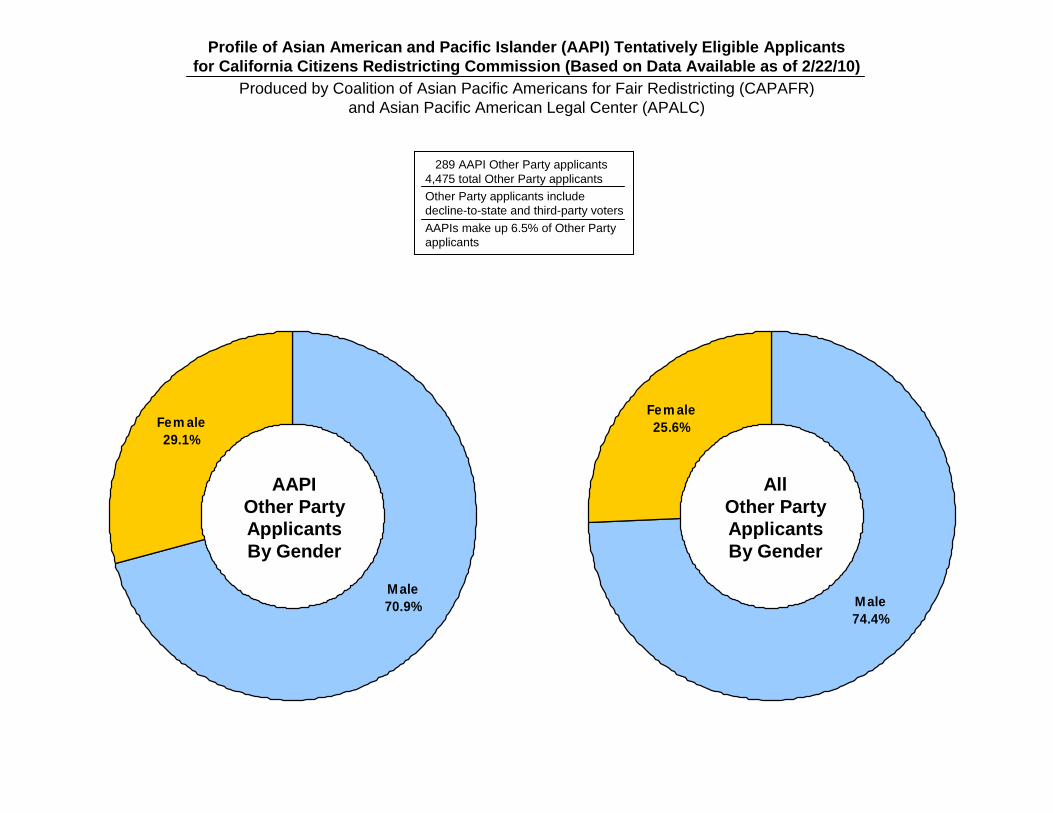
Male74.4%
Fem ale25.6%
Male70.9%
Fem ale29.1%
Profile of Asian American and Pacific Islander (AAPI) Tentatively Eligible Applicantsfor California Citizens Redistricting Commission (Based on Data Available as of 2/22/10)
Produced by Coalition of Asian Pacific Americans for Fair Redistricting (CAPAFR)and Asian Pacific American Legal Center (APALC)
AAPIOther PartyApplicantsBy Gender
AllOther PartyApplicantsBy Gender
0,289 AAPI Other Party applicants4,475 total Other Party applicants
Other Party applicants includedecline-to-state and third-party voters
AAPIs make up 6.5% of Other Partyapplicants
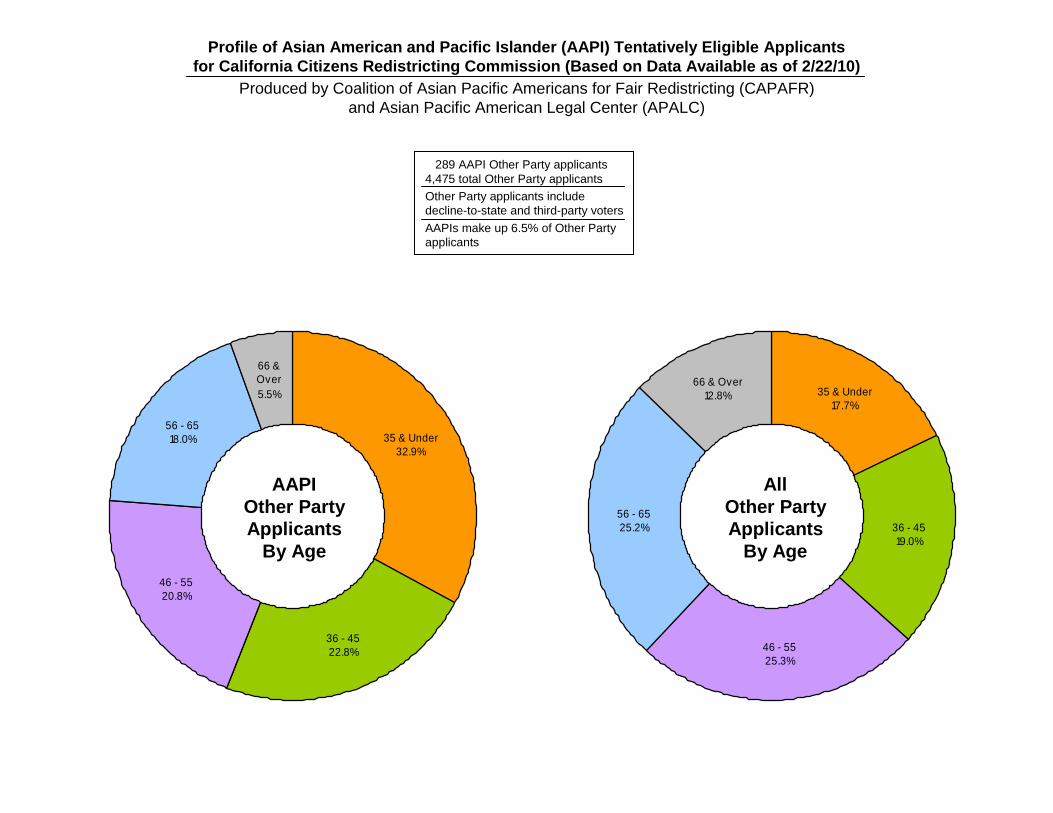
35 & Under17.7%
36 - 4519.0%
46 - 5525.3%
56 - 6525.2%
66 & Over12.8%
35 & Under32.9%
36 - 4522.8%
46 - 5520.8%
56 - 6518.0%
66 & Over5.5%
Profile of Asian American and Pacific Islander (AAPI) Tentatively Eligible Applicantsfor California Citizens Redistricting Commission (Based on Data Available as of 2/22/10)
Produced by Coalition of Asian Pacific Americans for Fair Redistricting (CAPAFR)and Asian Pacific American Legal Center (APALC)
AAPIOther PartyApplicants
By Age
AllOther PartyApplicants
By Age
0,289 AAPI Other Party applicants4,475 total Other Party applicants
Other Party applicants includedecline-to-state and third-party voters
AAPIs make up 6.5% of Other Partyapplicants

Profile of Asian American and Pacific Islander (AAPI)Tentatively Eligible Applicants for California Citizens
Redistricting Commission (Based on Data Available as of 2/22/10)Produced by Coalition of Asian Pacific Americans for Fair Redistricting (CAPAFR)
and Asian Pacific American Legal Center (APALC)
Shows counties grouped into the same regionalgroupings used by the California State Auditor. The colors shown here correspond to the colorsin the previous charts showing the number ofapplicants by region.
Inland Empire
Southern CentralValley & Mountain
Southern Coastal
Northern CentralValley & Mountain
Central Coastal
BayArea
NorthernCoastal

Profile of Asian American and Pacific Islander (AAPI) Tentatively Eligible Applicantsfor California Citizens Redistricting Commission (Based on Data Available as of 2/22/10)
Produced by Coalition of Asian Pacific Americans for Fair Redistricting (CAPAFR)and Asian Pacific American Legal Center (APALC)
Technical Notes:
Figures are based on data available at the California State Auditor’s website as of February 22, 2010 concerning individuals who submitted applications for the Citizens Redistricting Commission and who are considered “tentatively eligible.”
Applicants whom the State Auditor deems to be “tentatively eligible” based on information provided by applicants are eligible to participate in the next phase of application process (the supplemental application period).
The figures presented here are based on the number of tentatively eligible applicants as of February 22, 2010. This number may change depending on the State Auditor’s decisions with respect to reconsideration requests submitted by applicants who were initially deemed ineligible.
The number of AAPI applicants presented here includes individuals who identified as “Asian” or “Pacific Islander” in their application forms. Because of technical issues, this number does not include individuals who identified as “Other” in their application forms and indicated a multi-racial Asian or Pacific Islander background.