profile: bojanala platinum district
TRANSCRIPT

PROFILE: BOJANALA PLATINUM DISTRICT
2
PROFILE: BOJANALA PLATINUM DISTRICT 3
Table of Contents
EXECUTIVE SUMMARY ........................................................ Error! Bookmark not defined.
1. INTRODUCTION: BRIEF OVERVIEW .......................... Error! Bookmark not defined. 1.1. Location ................................................................................................................................. 8 1.2. Historical Perspective .......................................................................................................... 8 1.3. Spatial Status ........................................................................................................................ 9
2. SOCIAL DEVELOPMENT PROFILE ........................................................................ 9 2.1. Key Social Demographics ................................................................................................... 9 2.1.1. Population .............................................................................................................................. 9 2.1.2. Race, Gender & Age .......................................................................................................... 10 2.1.3. Households .......................................................................................................................... 10 2.1.4. Child Headed Households ................................................................................................. 11 2.1.5. Women headed Households ............................................................................................. 12 2.2. District Health Profile .......................................................................................................... 12
2.3. Covid-19 ............................................................................................................................... 13 2.3.1. Number of cases ................................................................................................................. 13 2.3.2. Quarantine Facilities Available and Assessed ............................................................... 14 2.3.3. Infrastructure (responding to COVID 19) ......................................................................... 15 2.3.4. Social Support (responding to Covid 19)......................................................................... 15 2.3.5. Economic Support ............................................................................................................... 16 2.4 Poverty Dimensions ............................................................................................................ 16 2.4.1 Distribution ........................................................................................................................... 16 2.4.2 Inequality .............................................................................................................................. 17 2.4.3 Employment/Unemployment ............................................................................................. 18 2.4.4 Crime ..................................................................................................................................... 18
3 DRIVERS OF THE ECONOMY ...................................... Error! Bookmark not defined. 3.1 Structure of the Economy ................................................................................................. 21 3.2 Primary sector ..................................................................................................................... 25 3.3 Secondary sector ............................................................................................................... 26
4 SERVICE DELIVERY ...................................................... Error! Bookmark not defined. 4.1 Water & Sanitation ............................................................................................................. 26 4.2 Human Settlements ........................................................................................................... 27 4.3 Waste Management ........................................................................................................... 27 4.4 Roads & Transport ............................................................................................................. 28 4.5 Electricity ............................................................................................................................. 28
5 GOVERNANCE AND MANAGEMENT ......................... Error! Bookmark not defined. 5.1 Municipality Performance .................................................................................................. 29 5.1.1 Audit Outcomes .................................................................................................................. 29 5.2 Municipal Capacity ............................................................................................................. 29 5.3 Traditional Affairs Governance ......................................................................................... 30
6 PROJECTS TO DIVERSIFY AND GROW PEOPLE AND THE ECONOMY Error! Bookmark not defined.
6.1 Social Development Projects............................................................................................ 30 6.2 Spatial Development .......................................................................................................... 32 6.3 Infrastructure Projects ....................................................................................................... 33 6.4 Economic Projects ............................................................................................................. 33 6.5 Environmental forecast ...................................................................................................... 34
7 KEY RECOMMENDATIONS .......................................... Error! Bookmark not defined. 7.1 Prioritise Integrated Development Plan .......................................................................... 36 7.2. Investor and Sponsorship opportunities ......................................................................... 36

PROFILE: BOJANALA PLATINUM DISTRICT
4
PROFILE: BOJANALA PLATINUM DISTRICT 5
CO
VID
-19 V
uln
era
bility
Index
Mo
pani
Sourc
e: C
SIR
/NC
DM
`

PROFILE: BOJANALA PLATINUM DISTRICT
6
Executive Summary
The Mopani District Municipality is located within the north-eastern
quadrant of the Limpopo Province. It is bordered in the north by
Zimbabwe and Vhembe District Municipality, in the south by the
Mpumalanga Province through Ehlanzeni District Municipality, in the
south-west by Sekhukhune District Municipality, in the east by
Mozambique, and in the west by the Capricorn and Vhembe District
Municipalities. There are 16 urban areas (towns and townships), 354
villages (rural settlements) and a total of 129 Wards.
The District has a land size of 20 011km² and includes a portion of Kruger National
Park from Olifants to Shingwedzi camps or Lepelle to Shingwedzi rivers. The Mopani
District Municipality is one of the five district municipalities in the Limpopo Province
and consists of five local municipalities, namely; Ba-Phalaborwa (7 489km²), Greater
Giyani (4 172km²), Maruleng (3 563km²), Greater Tzaneen (2 897km²) and Greater
Letaba (1 891km²). The Council seat of Mopani DM is in Giyani, and the district is part
of the Great Limpopo Transfrontier Park.
Mopani District has a total population of 1 150 722 people which is about 20% of the
province’s population. The district has a total number of 338 425 households, which is
about one-fifth of the number in the province and less than 10% of the total number of
households in the country. In 2016, 2.2% of the households in the districts lived in
informal dwellings (shacks), which is about half the rate in the province (4.8%) and
about one-fifth of the rate in South Africa (12.96%). About 86% of the households in
the district lived in a formal house.
In 2019, there were 628 941 people living in poverty, using the upper poverty line
definition, across Mopani District Municipality - this is higher than the 674 588 in 2009.
The district has median age of 23, with 477 120 children calling it home. 7 166
households are headed by children. This has devastating impact to social upbringing
of the society. A majority of the population in the district is black African, accounting to
98% of the total population, followed by whites representing 2% of the total population.
Within Mopani District Municipality, the number of people without any schooling
decreased from 179 855 (2009) to 95 112 (2019), while in the same period the number
of people within the 'matric only' category, increased from 64 714 to 179 874. The
number of people with 'matric and a certificate/diploma' increased from 20 417 to
44 066 in the same period, while number of people with a 'matric and a Bachelor's'
degree increasing from 1 512 to 16 030.
PROFILE: BOJANALA PLATINUM DISTRICT 7
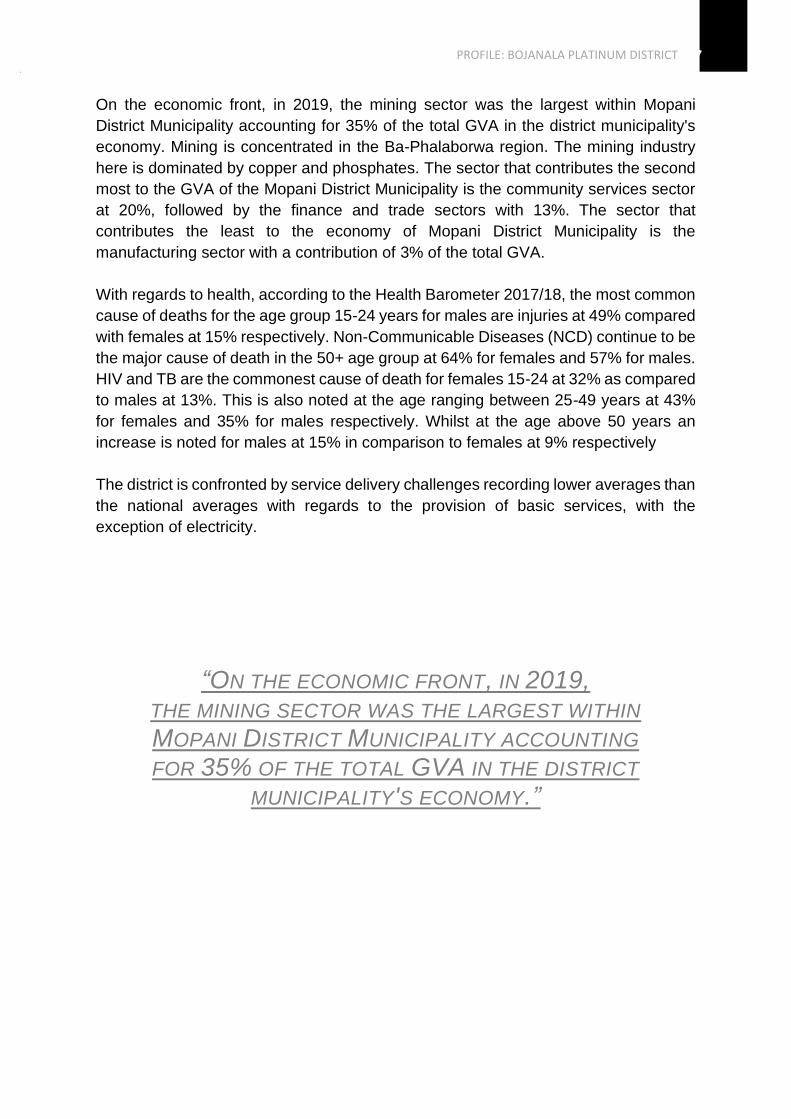
On the economic front, in 2019, the mining sector was the largest within Mopani
District Municipality accounting for 35% of the total GVA in the district municipality's
economy. Mining is concentrated in the Ba-Phalaborwa region. The mining industry
here is dominated by copper and phosphates. The sector that contributes the second
most to the GVA of the Mopani District Municipality is the community services sector
at 20%, followed by the finance and trade sectors with 13%. The sector that
contributes the least to the economy of Mopani District Municipality is the
manufacturing sector with a contribution of 3% of the total GVA.
With regards to health, according to the Health Barometer 2017/18, the most common
cause of deaths for the age group 15-24 years for males are injuries at 49% compared
with females at 15% respectively. Non-Communicable Diseases (NCD) continue to be
the major cause of death in the 50+ age group at 64% for females and 57% for males.
HIV and TB are the commonest cause of death for females 15-24 at 32% as compared
to males at 13%. This is also noted at the age ranging between 25-49 years at 43%
for females and 35% for males respectively. Whilst at the age above 50 years an
increase is noted for males at 15% in comparison to females at 9% respectively
The district is confronted by service delivery challenges recording lower averages than
the national averages with regards to the provision of basic services, with the
exception of electricity.
“ON THE ECONOMIC FRONT, IN 2019, THE MINING SECTOR WAS THE LARGEST WITHIN MOPANI DISTRICT MUNICIPALITY ACCOUNTING FOR 35% OF THE TOTAL GVA IN THE DISTRICT
MUNICIPALITY'S ECONOMY.”
PROFILE: BOJANALA PLATINUM DISTRICT
8
1. Introduction: Brief Overview
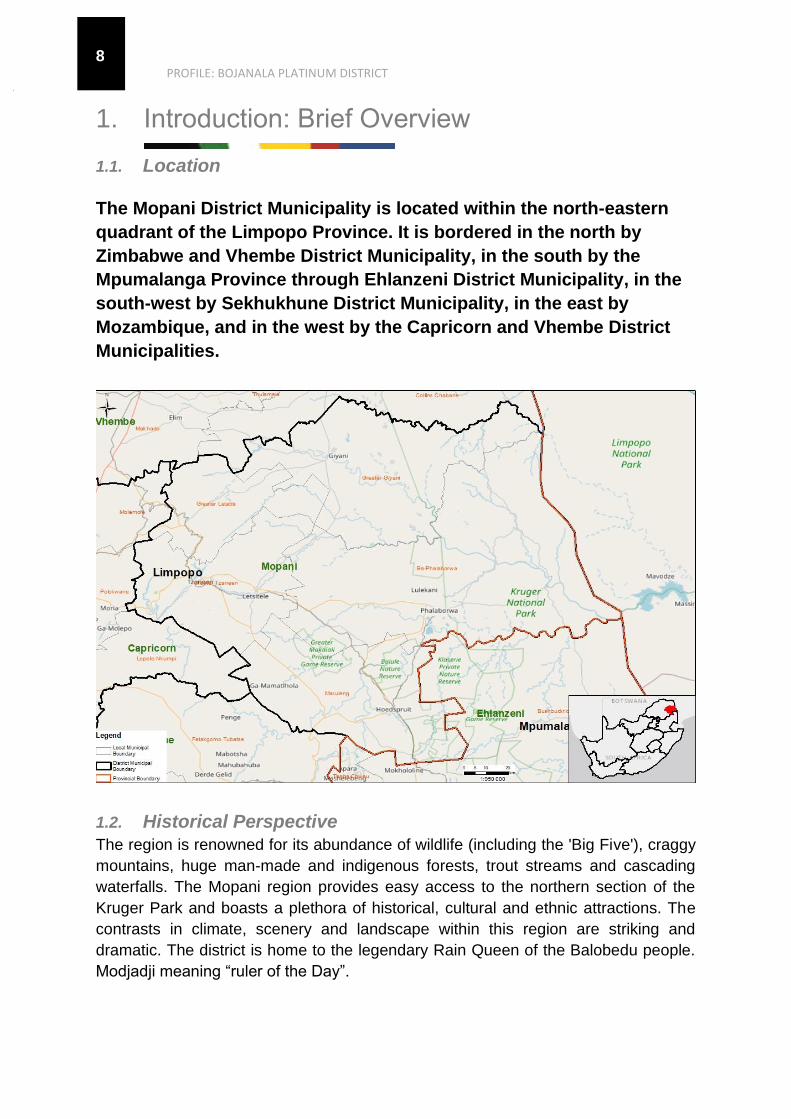
1.1. Location
The Mopani District Municipality is located within the north-eastern
quadrant of the Limpopo Province. It is bordered in the north by
Zimbabwe and Vhembe District Municipality, in the south by the
Mpumalanga Province through Ehlanzeni District Municipality, in the
south-west by Sekhukhune District Municipality, in the east by
Mozambique, and in the west by the Capricorn and Vhembe District
Municipalities.
1.2. Historical Perspective
The region is renowned for its abundance of wildlife (including the 'Big Five'), craggy
mountains, huge man-made and indigenous forests, trout streams and cascading
waterfalls. The Mopani region provides easy access to the northern section of the
Kruger Park and boasts a plethora of historical, cultural and ethnic attractions. The
contrasts in climate, scenery and landscape within this region are striking and
dramatic. The district is home to the legendary Rain Queen of the Balobedu people.
Modjadji meaning “ruler of the Day”.
PROFILE: BOJANALA PLATINUM DISTRICT 9
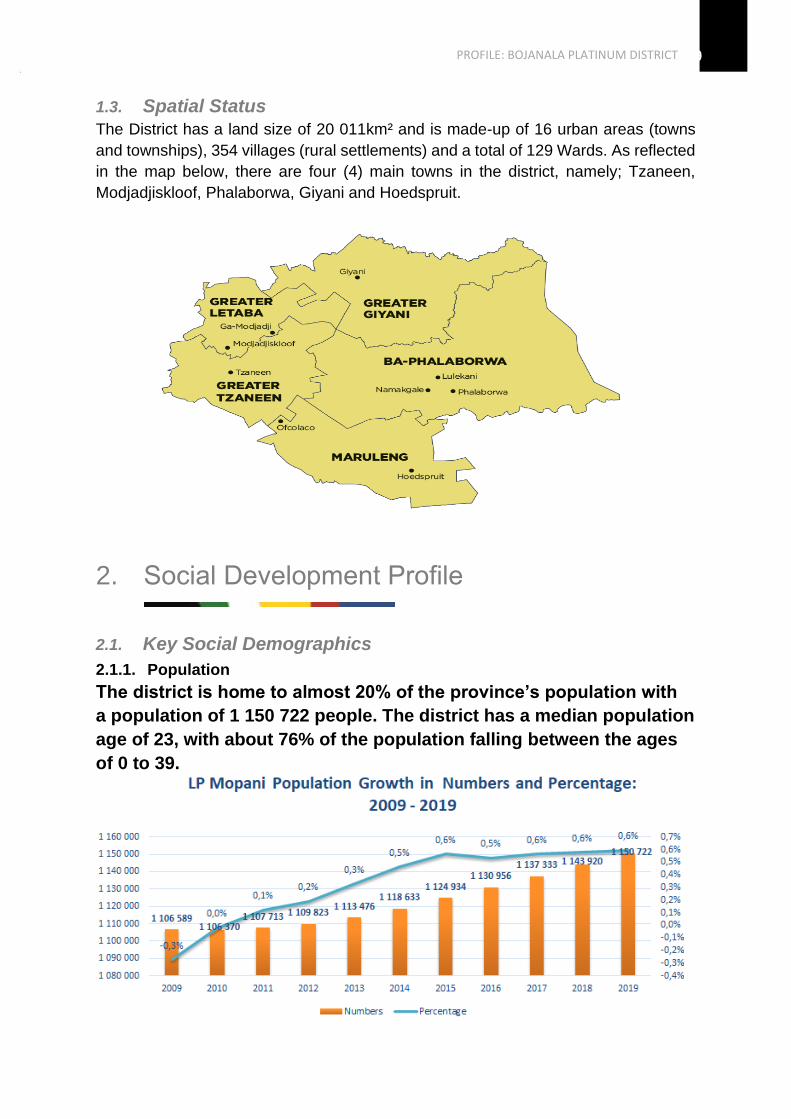
1.3. Spatial Status
The District has a land size of 20 011km² and is made-up of 16 urban areas (towns
and townships), 354 villages (rural settlements) and a total of 129 Wards. As reflected
in the map below, there are four (4) main towns in the district, namely; Tzaneen,
Modjadjiskloof, Phalaborwa, Giyani and Hoedspruit.
2. Social Development Profile
2.1. Key Social Demographics
2.1.1. Population
The district is home to almost 20% of the province’s population with
a population of 1 150 722 people. The district has a median population
age of 23, with about 76% of the population falling between the ages
of 0 to 39.
PROFILE: BOJANALA PLATINUM DISTRICT
10
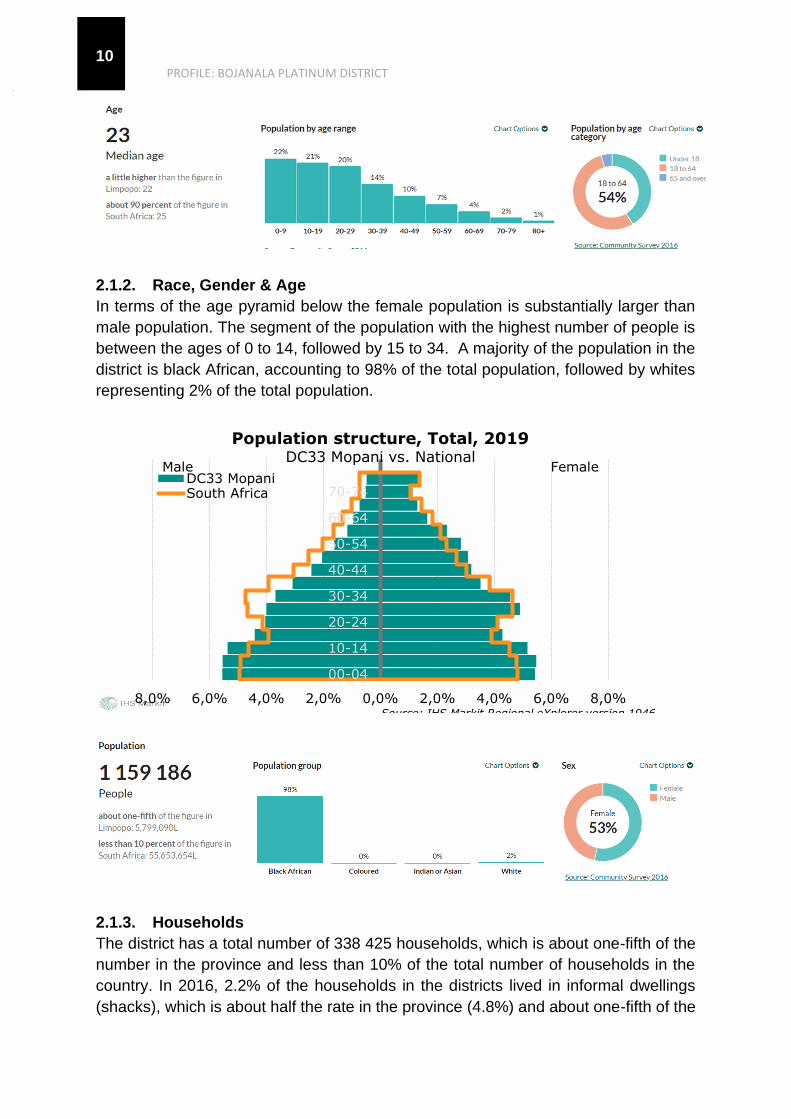
2.1.2. Race, Gender & Age
In terms of the age pyramid below the female population is substantially larger than
male population. The segment of the population with the highest number of people is
between the ages of 0 to 14, followed by 15 to 34. A majority of the population in the
district is black African, accounting to 98% of the total population, followed by whites
representing 2% of the total population.
2.1.3. Households
The district has a total number of 338 425 households, which is about one-fifth of the
number in the province and less than 10% of the total number of households in the
country. In 2016, 2.2% of the households in the districts lived in informal dwellings
(shacks), which is about half the rate in the province (4.8%) and about one-fifth of the
8,0% 6,0% 4,0% 2,0% 0,0% 2,0% 4,0% 6,0% 8,0%
00-04
10-14
20-24
30-34
40-44
50-54
60-64
70-74
Population structure, Total, 2019DC33 Mopani vs. National
DC33 MopaniSouth Africa
Male Female
Source: IHS Markit Regional eXplorer version 1946

PROFILE: BOJANALA PLATINUM DISTRICT 11
rate in South Africa (12.96%). About 86% of the households in the district lived in a
formal house.
“THE SEGMENT OF THE POPULATION WITH THE
HIGHEST NUMBER OF PEOPLE IS BETWEEN THE AGES
OF 0 TO 14, FOLLOWED BY 15 TO 34.”
2.1.4. Child Headed Households
The district is also home to 7 166 child headed households, which is about one-quarter
of the figure in the province and less than 10% of the figure in the country. About 2.3%
of child headed households in the district live in informal dwellings and 86% live in
formal houses. In 2016, there were 34.8% of child headed household in Mopani with
women as their head.
PROFILE: BOJANALA PLATINUM DISTRICT
12
2.1.5. Women headed Households
In 2016, 49% of the households were headed by women, which is comparable with
that of the province (48.5%) and about 20% higher than the rate in the country.
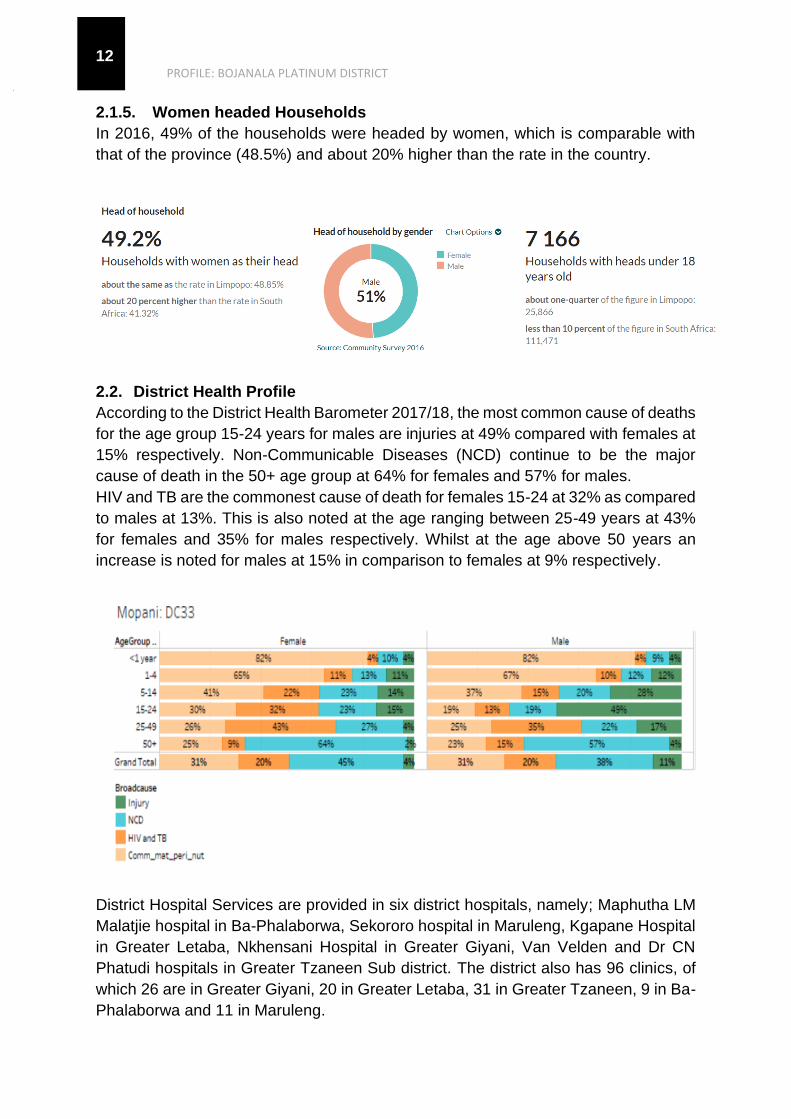
2.2. District Health Profile
According to the District Health Barometer 2017/18, the most common cause of deaths
for the age group 15-24 years for males are injuries at 49% compared with females at
15% respectively. Non-Communicable Diseases (NCD) continue to be the major
cause of death in the 50+ age group at 64% for females and 57% for males.
HIV and TB are the commonest cause of death for females 15-24 at 32% as compared
to males at 13%. This is also noted at the age ranging between 25-49 years at 43%
for females and 35% for males respectively. Whilst at the age above 50 years an
increase is noted for males at 15% in comparison to females at 9% respectively.
District Hospital Services are provided in six district hospitals, namely; Maphutha LM
Malatjie hospital in Ba-Phalaborwa, Sekororo hospital in Maruleng, Kgapane Hospital
in Greater Letaba, Nkhensani Hospital in Greater Giyani, Van Velden and Dr CN
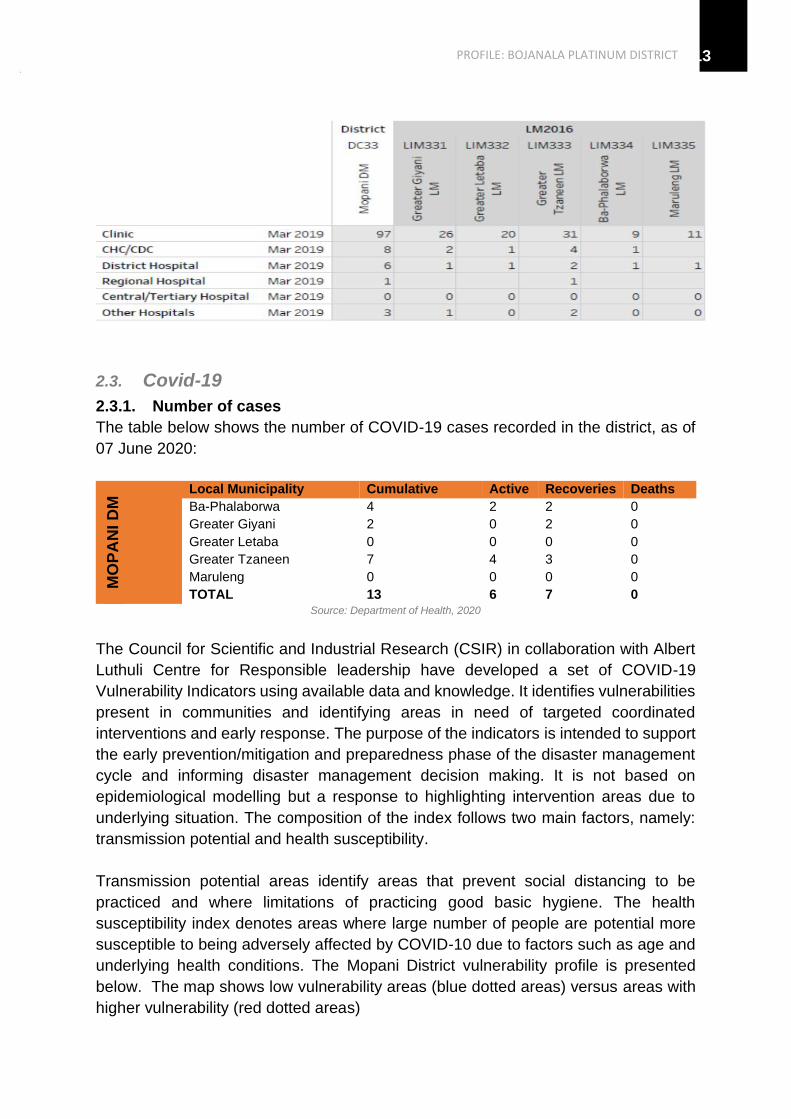
Phatudi hospitals in Greater Tzaneen Sub district. The district also has 96 clinics, of
which 26 are in Greater Giyani, 20 in Greater Letaba, 31 in Greater Tzaneen, 9 in Ba-
Phalaborwa and 11 in Maruleng.
PROFILE: BOJANALA PLATINUM DISTRICT 13
2.3. Covid-19
2.3.1. Number of cases
The table below shows the number of COVID-19 cases recorded in the district, as of
07 June 2020:
MO
PA
NI
DM
Local Municipality Cumulative Active Recoveries Deaths
Ba-Phalaborwa 4 2 2 0
Greater Giyani 2 0 2 0
Greater Letaba 0 0 0 0
Greater Tzaneen 7 4 3 0
Maruleng 0 0 0 0
TOTAL 13 6 7 0 Source: Department of Health, 2020
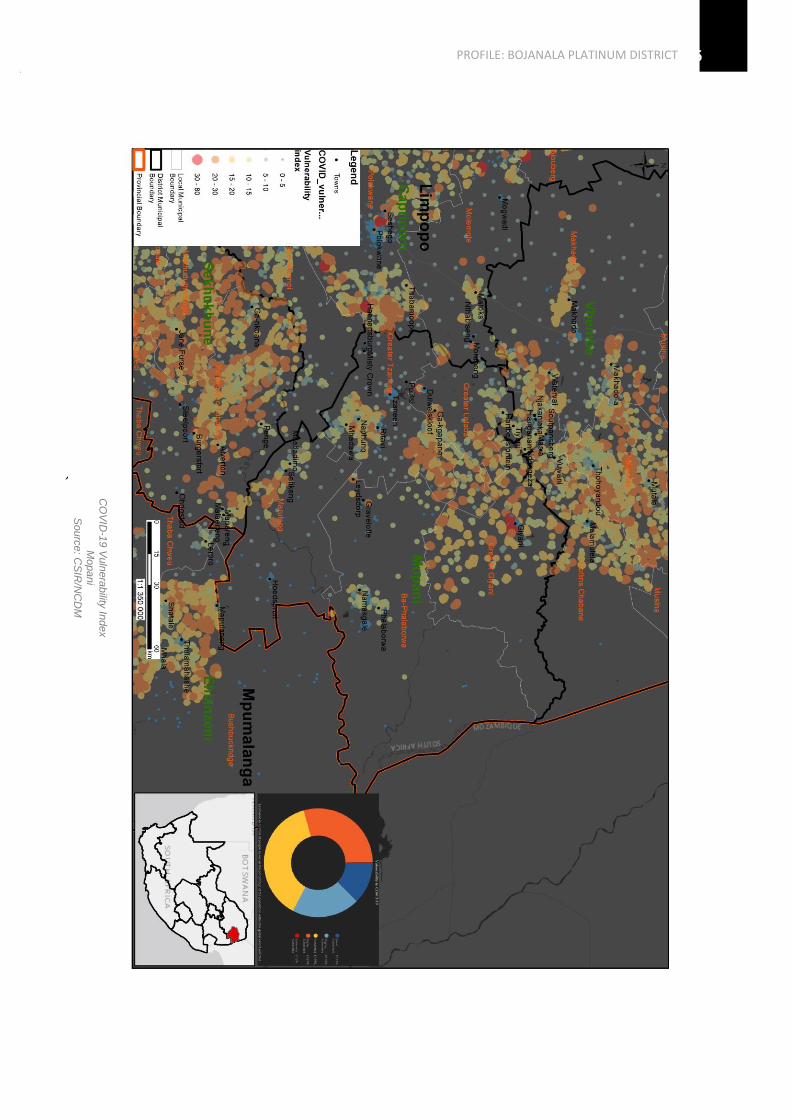
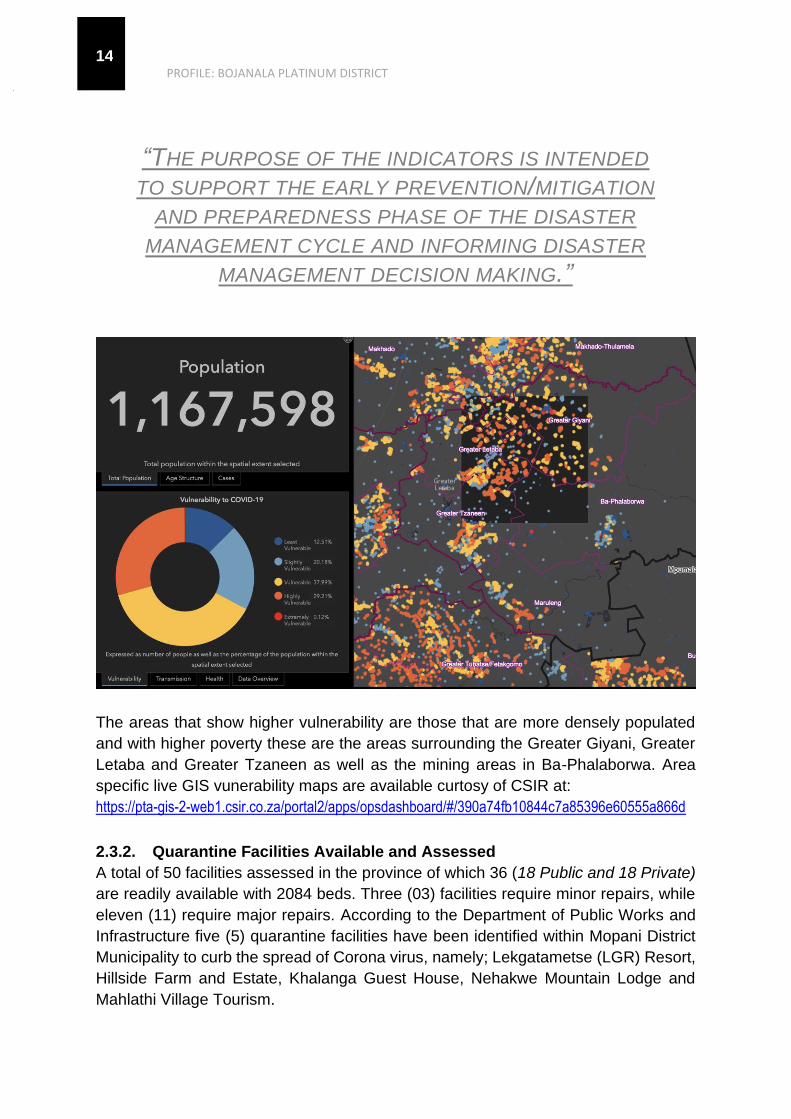
The Council for Scientific and Industrial Research (CSIR) in collaboration with Albert
Luthuli Centre for Responsible leadership have developed a set of COVID-19
Vulnerability Indicators using available data and knowledge. It identifies vulnerabilities
present in communities and identifying areas in need of targeted coordinated
interventions and early response. The purpose of the indicators is intended to support
the early prevention/mitigation and preparedness phase of the disaster management
cycle and informing disaster management decision making. It is not based on
epidemiological modelling but a response to highlighting intervention areas due to
underlying situation. The composition of the index follows two main factors, namely:
transmission potential and health susceptibility.
Transmission potential areas identify areas that prevent social distancing to be
practiced and where limitations of practicing good basic hygiene. The health
susceptibility index denotes areas where large number of people are potential more
susceptible to being adversely affected by COVID-10 due to factors such as age and
underlying health conditions. The Mopani District vulnerability profile is presented
below. The map shows low vulnerability areas (blue dotted areas) versus areas with
higher vulnerability (red dotted areas)
PROFILE: BOJANALA PLATINUM DISTRICT
14
“THE PURPOSE OF THE INDICATORS IS INTENDED TO SUPPORT THE EARLY PREVENTION/MITIGATION
AND PREPAREDNESS PHASE OF THE DISASTER
MANAGEMENT CYCLE AND INFORMING DISASTER
MANAGEMENT DECISION MAKING.”
The areas that show higher vulnerability are those that are more densely populated
and with higher poverty these are the areas surrounding the Greater Giyani, Greater
Letaba and Greater Tzaneen as well as the mining areas in Ba-Phalaborwa. Area
specific live GIS vunerability maps are available curtosy of CSIR at:
https://pta-gis-2-web1.csir.co.za/portal2/apps/opsdashboard/#/390a74fb10844c7a85396e60555a866d
2.3.2. Quarantine Facilities Available and Assessed
A total of 50 facilities assessed in the province of which 36 (18 Public and 18 Private)
are readily available with 2084 beds. Three (03) facilities require minor repairs, while
eleven (11) require major repairs. According to the Department of Public Works and
Infrastructure five (5) quarantine facilities have been identified within Mopani District
Municipality to curb the spread of Corona virus, namely; Lekgatametse (LGR) Resort,
Hillside Farm and Estate, Khalanga Guest House, Nehakwe Mountain Lodge and
Mahlathi Village Tourism.
PROFILE: BOJANALA PLATINUM DISTRICT 15
2.3.3. Infrastructure (responding to COVID 19)
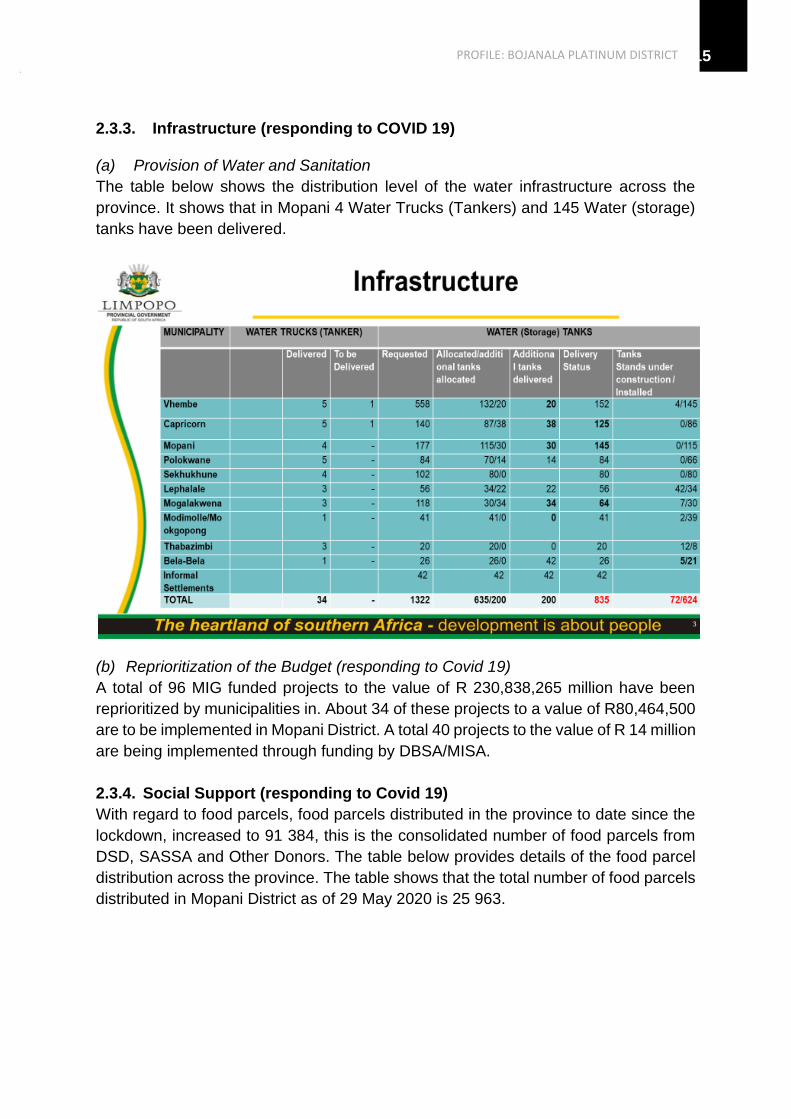
(a) Provision of Water and Sanitation
The table below shows the distribution level of the water infrastructure across the
province. It shows that in Mopani 4 Water Trucks (Tankers) and 145 Water (storage)
tanks have been delivered.
(b) Reprioritization of the Budget (responding to Covid 19)
A total of 96 MIG funded projects to the value of R 230,838,265 million have been
reprioritized by municipalities in. About 34 of these projects to a value of R80,464,500
are to be implemented in Mopani District. A total 40 projects to the value of R 14 million
are being implemented through funding by DBSA/MISA.
2.3.4. Social Support (responding to Covid 19)
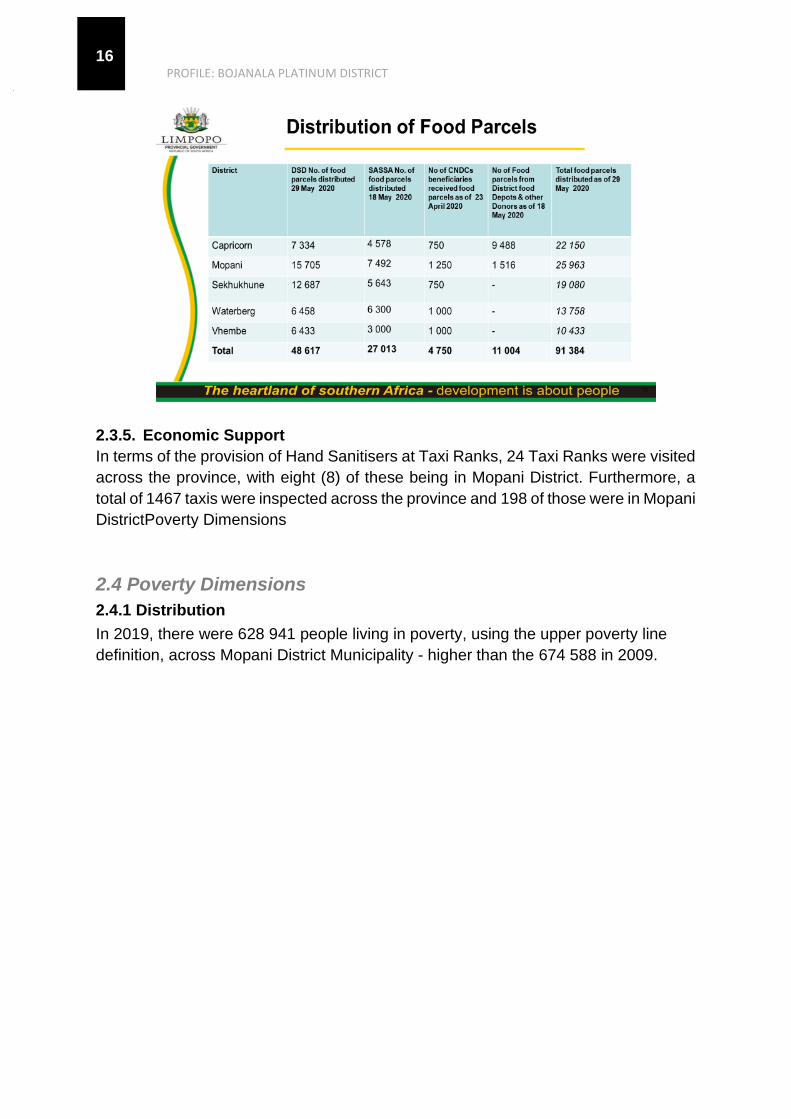
With regard to food parcels, food parcels distributed in the province to date since the
lockdown, increased to 91 384, this is the consolidated number of food parcels from
DSD, SASSA and Other Donors. The table below provides details of the food parcel
distribution across the province. The table shows that the total number of food parcels
distributed in Mopani District as of 29 May 2020 is 25 963.
PROFILE: BOJANALA PLATINUM DISTRICT
16
2.3.5. Economic Support
In terms of the provision of Hand Sanitisers at Taxi Ranks, 24 Taxi Ranks were visited
across the province, with eight (8) of these being in Mopani District. Furthermore, a
total of 1467 taxis were inspected across the province and 198 of those were in Mopani
DistrictPoverty Dimensions
2.4 Poverty Dimensions
2.4.1 Distribution
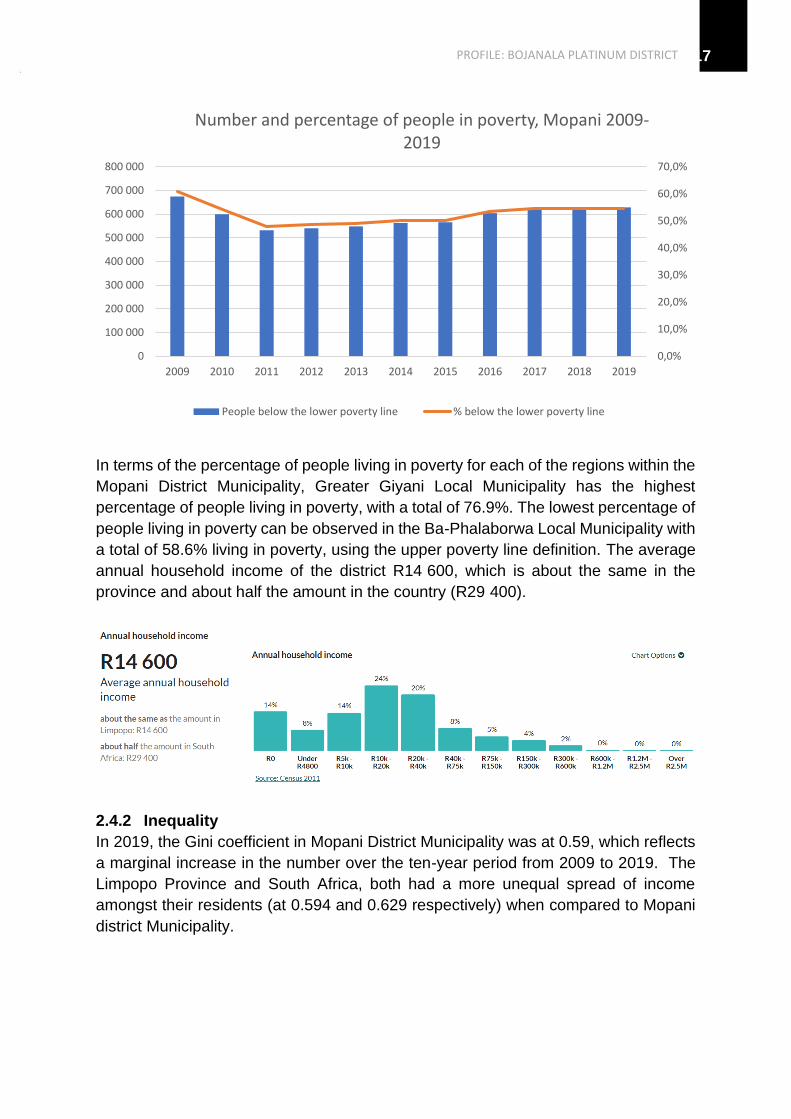
In 2019, there were 628 941 people living in poverty, using the upper poverty line
definition, across Mopani District Municipality - higher than the 674 588 in 2009.
PROFILE: BOJANALA PLATINUM DISTRICT 17
In terms of the percentage of people living in poverty for each of the regions within the
Mopani District Municipality, Greater Giyani Local Municipality has the highest
percentage of people living in poverty, with a total of 76.9%. The lowest percentage of
people living in poverty can be observed in the Ba-Phalaborwa Local Municipality with
a total of 58.6% living in poverty, using the upper poverty line definition. The average
annual household income of the district R14 600, which is about the same in the
province and about half the amount in the country (R29 400).
2.4.2 Inequality
In 2019, the Gini coefficient in Mopani District Municipality was at 0.59, which reflects
a marginal increase in the number over the ten-year period from 2009 to 2019. The
Limpopo Province and South Africa, both had a more unequal spread of income
amongst their residents (at 0.594 and 0.629 respectively) when compared to Mopani
district Municipality.
0,0%
10,0%
20,0%
30,0%
40,0%
50,0%
60,0%
70,0%
0
100 000
200 000
300 000
400 000
500 000
600 000
700 000
800 000
2009 2010 2011 2012 2013 2014 2015 2016 2017 2018 2019
Number and percentage of people in poverty, Mopani 2009-2019
People below the lower poverty line % below the lower poverty line

PROFILE: BOJANALA PLATINUM DISTRICT
18
2.4.3 Employment/Unemployment
In 2018, the unemployment rate in Mopani District Municipality was 16.32% and was
lower than of the province (19, 4%) and South Africa (27.31%). In the same year, the
labour force participation rate for Mopani was at 50.2% which was significantly higher
when compared to the 41.7% in 2008. Ba-Phalaborwa Local Municipality had the
highest labour force participation rate with 56.0% in 2018 increasing from 48.5% in
2008. Greater Giyani Local Municipality had the lowest labour force participation rate
of 42.9% in 2018, this increased from 37.3% in 2008.
Source: IHS Markit Regional eXplorer version 1803
2.4.4 Crime
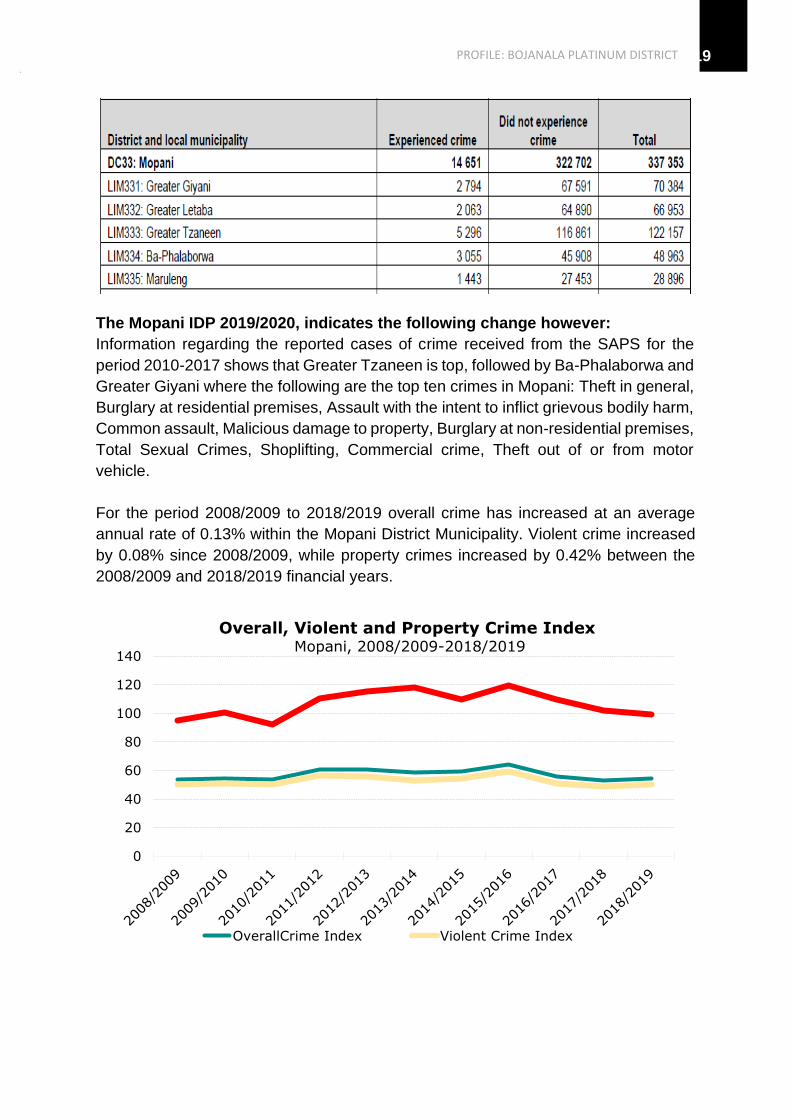
The table below shows that 14 651 households (4,3%) reported that they have
experienced crime in the 12 months preceding the StatsSA Community survey. The
highest proportions of households that have experienced crime were found in Ba-
Phalaborwa (6.2%), and Maruleng (5%) local municipalities.
0,520,530,540,550,560,570,580,590,600,610,62
Mopani Vhembe Capricorn Waterberg Sekhukhune
Inequality at District level
2009 2013 2016 2019
71 11454 448 45 387 45 975 56 343 57 921
223 834 215 134 222 299
255 851284 067
297 526
0
50 000
100 000
150 000
200 000
250 000
300 000
350 000
2008 2010 2012 2014 2016 2018
Number of employed versus unemployed people in Mopani: 2008 - 2018
Unemployed Employed
PROFILE: BOJANALA PLATINUM DISTRICT 19
The Mopani IDP 2019/2020, indicates the following change however:
Information regarding the reported cases of crime received from the SAPS for the
period 2010-2017 shows that Greater Tzaneen is top, followed by Ba-Phalaborwa and
Greater Giyani where the following are the top ten crimes in Mopani: Theft in general,
Burglary at residential premises, Assault with the intent to inflict grievous bodily harm,
Common assault, Malicious damage to property, Burglary at non-residential premises,
Total Sexual Crimes, Shoplifting, Commercial crime, Theft out of or from motor
vehicle.
For the period 2008/2009 to 2018/2019 overall crime has increased at an average
annual rate of 0.13% within the Mopani District Municipality. Violent crime increased
by 0.08% since 2008/2009, while property crimes increased by 0.42% between the
2008/2009 and 2018/2019 financial years.
0
20
40
60
80
100
120
140
Overall, Violent and Property Crime Index Mopani, 2008/2009-2018/2019
OverallCrime Index Violent Crime Index

PROFILE: BOJANALA PLATINUM DISTRICT
20
“FOR THE PERIOD 2008/2009
TO 2018/2019 OVERALL CRIME HAS INCREASED
AT AN AVERAGE ANNUAL RATE OF 0.13% WITHIN
THE MOPANI DISTRICT MUNICIPALITY.”
2.4.5 Education and Skills profile
The number of people without any schooling decreased from 179 855 (2009) to 95 112
(2019), while in the same period the number of people within the 'matric only' category,
increased from 64 714 to 179 874. The number of people with 'matric and a
certificate/diploma' increased from 20 417 to 44 066 in the same period, while number
of people with a 'matric and a Bachelor's' degree increasing from 1 512 to 16 030.
Overall improvement in the level of education is visible with an increase in the number
of people with 'matric' or higher education.
0%
10%
20%
30%
40%
50%
60%
70%
80%
90%
100%
199719992001200320052007200920112013201520172019
Progress in EducationDC33 Mopani, Total
Matric &
Postgrad
degreeMatric &
Bachelors
degreeMatric &
certificate /
diplomaMatric only
Certificate /
diploma
without matricGrade 10-11
Grade 7-9
Source: IHS Markit Regional eXplorer version 1946

PROFILE: BOJANALA PLATINUM DISTRICT 21
Number of schools within the Mopani District:
There are a total number of 741 Early Childhood Development (ECD) registered sites,
of which 394 are funded by Equitable Share, 97 funded on Conditional Grants, and
250 are not yet funded because of budget constraints while some of them are privately
owned. About 450 ECDs operate in proper learning sites, 76 operate in shacks, 56
operate in dilapidated and life threating conditions, and 62 are overcrowded.
GREATER
GIYANI MARULENG
BA –
PHALABORWA
GREATER
LETABA
GREATER
TZANEEN MOPANI
139 104 69 157 272 741
“ABOUT 450 ECDS OPERATE IN PROPER LEARNING SITES, 76 OPERATE IN SHACKS, 56 OPERATE
IN DILAPIDATED AND LIFE THREATING CONDITIONS, AND 62 ARE OVERCROWDED.”
3. Economic Drivers
3.1 Structure of the Economy

PROFILE: BOJANALA PLATINUM DISTRICT
22
Mining and agriculture are the two main economic sectors in Mopani.
The mining sector sustains the economy, with copper, magnetite and
phosphate being the main minerals. Copper is smelted in Phalaborwa
while phosphate is transported in its raw form and processed in
Richards Bay primarily for exports.
The agricultural sector is the fourth largest economic contributor after mining,
government and community services, wholesale and retail. Most of the agricultural
activities take place in Tzaneen, Maruleng and Letaba. The main agricultural produce
includes sub-tropical fruit such as tomatoes, bananas, mangoes, oranges and
pineapples. The bulk of these crops are exported.
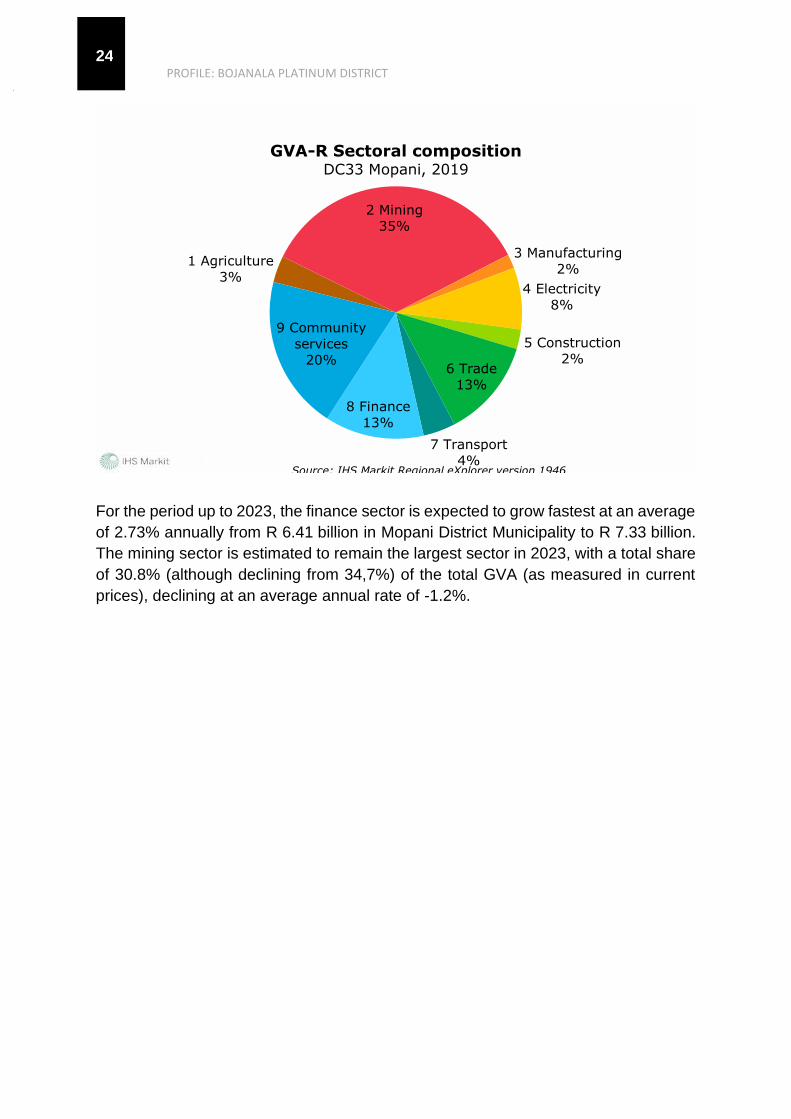
In 2019, the mining sector was the largest within Mopani District Municipality
accounting for 35% of the total GVA in the district municipality's economy. Mining is
concentrated in the Ba-Phalaborwa region. The mining industry here is dominated by
copper and phosphates. The sector that contributes the second most to the GVA of
the Mopani District Municipality is the community services sector at 20%, followed by
the finance and trade sectors with 13%. The sector that contributes the least to the
economy of Mopani District Municipality is the manufacturing sector with a contribution
of 3% of the total GVA.

PROFILE: BOJANALA PLATINUM DISTRICT 23
PROFILE: BOJANALA PLATINUM DISTRICT
24
For the period up to 2023, the finance sector is expected to grow fastest at an average
of 2.73% annually from R 6.41 billion in Mopani District Municipality to R 7.33 billion.
The mining sector is estimated to remain the largest sector in 2023, with a total share
of 30.8% (although declining from 34,7%) of the total GVA (as measured in current
prices), declining at an average annual rate of -1.2%.
1 Agriculture
3%
2 Mining
35%
3 Manufacturing
2%
4 Electricity
8%
5 Construction
2%6 Trade
13%
7 Transport
4%
8 Finance
13%
9 Community
services
20%
GVA-R Sectoral compositionDC33 Mopani, 2019
Source: IHS Markit Regional eXplorer version 1946
PROFILE: BOJANALA PLATINUM DISTRICT 25
3.2 Primary sector
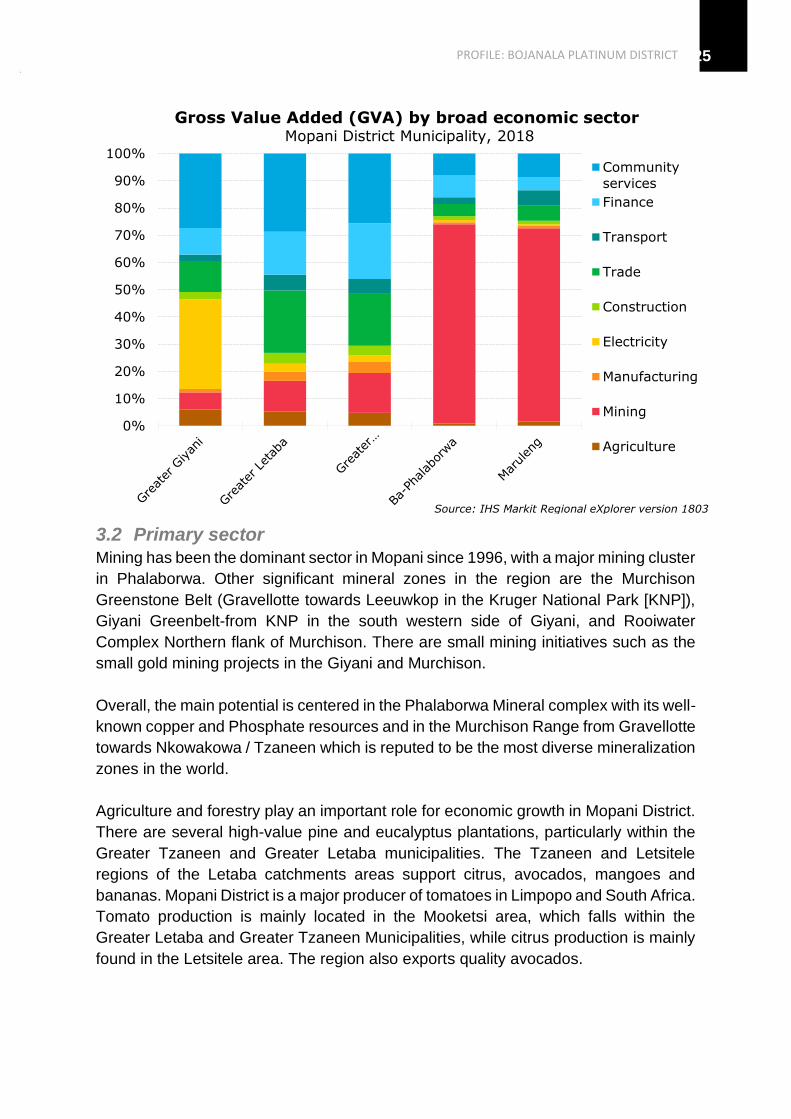
Mining has been the dominant sector in Mopani since 1996, with a major mining cluster
in Phalaborwa. Other significant mineral zones in the region are the Murchison
Greenstone Belt (Gravellotte towards Leeuwkop in the Kruger National Park [KNP]),
Giyani Greenbelt-from KNP in the south western side of Giyani, and Rooiwater
Complex Northern flank of Murchison. There are small mining initiatives such as the
small gold mining projects in the Giyani and Murchison.
Overall, the main potential is centered in the Phalaborwa Mineral complex with its well-
known copper and Phosphate resources and in the Murchison Range from Gravellotte
towards Nkowakowa / Tzaneen which is reputed to be the most diverse mineralization
zones in the world.
Agriculture and forestry play an important role for economic growth in Mopani District.
There are several high-value pine and eucalyptus plantations, particularly within the
Greater Tzaneen and Greater Letaba municipalities. The Tzaneen and Letsitele
regions of the Letaba catchments areas support citrus, avocados, mangoes and
bananas. Mopani District is a major producer of tomatoes in Limpopo and South Africa.
Tomato production is mainly located in the Mooketsi area, which falls within the
Greater Letaba and Greater Tzaneen Municipalities, while citrus production is mainly
found in the Letsitele area. The region also exports quality avocados.
0%
10%
20%
30%
40%
50%
60%
70%
80%
90%
100%
Gross Value Added (GVA) by broad economic sector Mopani District Municipality, 2018
Community
services
Finance
Transport
Trade
Construction
Electricity
Manufacturing
Mining
Agriculture
Source: IHS Markit Regional eXplorer version 1803
PROFILE: BOJANALA PLATINUM DISTRICT
26
3.3 Secondary sector
The District is named Mopani because of the abundance of nutritional Mopani worms
found in the area. The Mopani District boasts remarkable tourist attraction landmarks.
The enchanting and breathtaking sceneries have become a standard characteristic of
the district. The district is also home to the world-renowned Rain Queen, giant
baobabs, tropical paradise of Tzaneen, wildlife haven of Ba-Phalaborwa and Maruleng
and Manómbe nature reserve and Baleni salt pan.
In terms of the previous Regional Industrial Development Programmes (RIDP), three
towns qualified as Industrial Development points, namely Giyani, Tzaneen and
Nkowakowa. The main industries in the district are mainly basic metals and fabricated
metals followed by food manufacturing. The District also has a number of industries
involved in the processing of wood (saw milling). The food manufacturing industries
are dominated by canned, preserved and dried fruit and vegetable juices which
indicates a degree of linkages to the local Agriculture sector.
4. Service Delivery
4.1 Water & Sanitation
Mopani District Municipality is a Water Services Authority for the
whole District area and all its local municipalities have Water Service
Provider (WSP) Agreements in place. There are over 20 dams in the
district and nine (9) of those are for primary consumption – domestic,
industrial and commercial. Most of the other dams are used for
irrigation purposes.
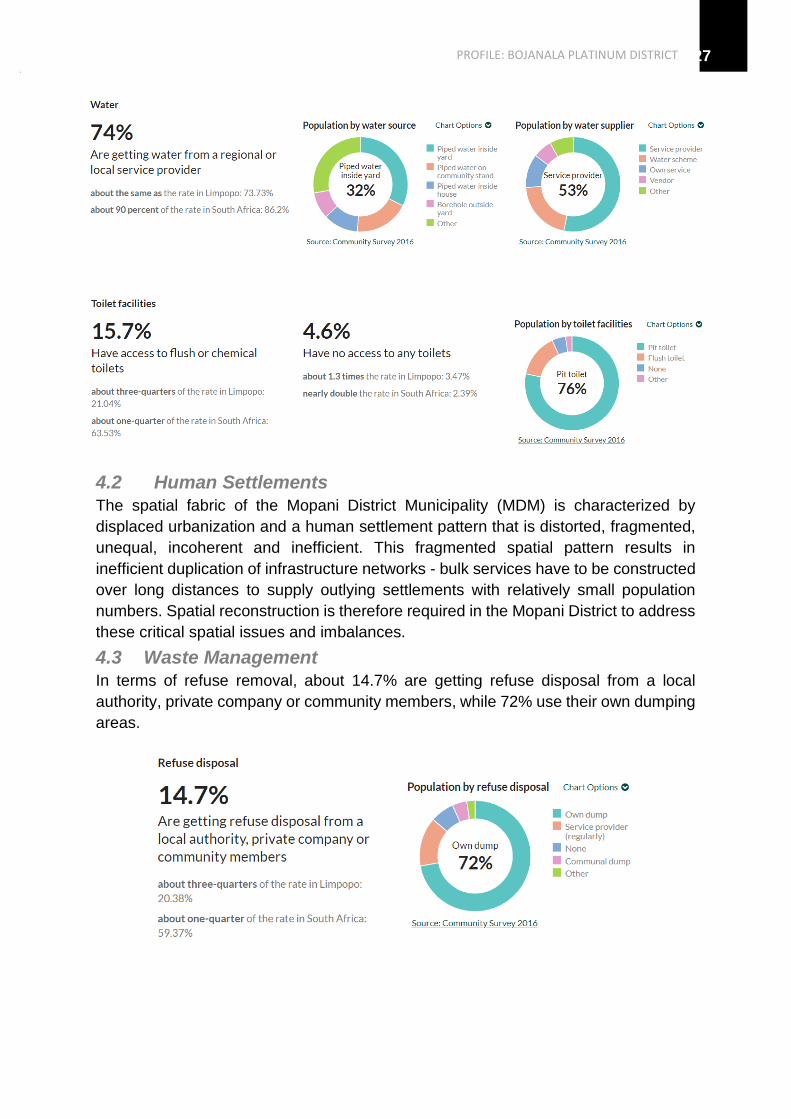
About 74% of the population in the district is getting water from a regional or local
service provider and 32% of the households have piped water inside their yards, while
15.7% have access to a flush or chemical toilet. About 76% of the population use pit
toilets in the district.
PROFILE: BOJANALA PLATINUM DISTRICT 27
4.2 Human Settlements
The spatial fabric of the Mopani District Municipality (MDM) is characterized by
displaced urbanization and a human settlement pattern that is distorted, fragmented,
unequal, incoherent and inefficient. This fragmented spatial pattern results in
inefficient duplication of infrastructure networks - bulk services have to be constructed
over long distances to supply outlying settlements with relatively small population
numbers. Spatial reconstruction is therefore required in the Mopani District to address
these critical spatial issues and imbalances.
4.3 Waste Management
In terms of refuse removal, about 14.7% are getting refuse disposal from a local
authority, private company or community members, while 72% use their own dumping
areas.

PROFILE: BOJANALA PLATINUM DISTRICT
28
4.4 Roads & Transport
The state of the road infrastructure reflects on the development of the region. Due to
the potential for development of the district through tourism, road infrastructure is a
necessity in the district. Most of the gravel roads are not maintained regularly and do
not have route names, nor appropriate road signs. Most importantly, fencing along the
routes has been removed, resulting in the wandering of wild animals onto the roads.
Most of the affected areas are found around Greater Tzaneen (Boyne/ Sedan areas)
and Greater Giyani (Nkomo and Matsosela areas) municipalities.
There is a lack of access bridges (Marulang municipality), and they have tarred roads
that require storm water drainage. There is need for expansion and maintenance of
the Ivory tourism route from Giyani into the Kruger National Park so that it can support
tourism.
When it comes to public transportation, taxis form a high percentage of public transport
in the district. In the Greater Tzaneen area there are 24 taxi facilities, of which only
two that are in Tzaneen Town are formal and the rest are informal. Ba-Phalaborwa
has 11 taxi facilities, of which one in Phalaborwa Town is formal. Greater Letaba has
12, of which 4 are formal and they are in Modjadjiskloof, Ga-Kgapane, Sekgosese and
Mokwakwaila in Greater Giyani are 18. More than 85% of taxi facilities are informal
without necessary facilities.
4.5 Electricity
In terms of electricity, 3% of the households have no access to electricity, which is
about two-thirds of the rate in the province (4.24%) and about two-fifths of the rate in
the country (7.29%). About 87% of the households in the district are on in-house pre-
paid electricity.
“THERE IS NEED FOR EXPANSION AND MAINTENANCE OF THE IVORY TOURISM ROUTE FROM GIYANI INTO
PROFILE: BOJANALA PLATINUM DISTRICT 29
THE KRUGER NATIONAL PARK SO THAT IT CAN SUPPORT TOURISM.”
5. Governance and Management
4.6 Municipality Performance
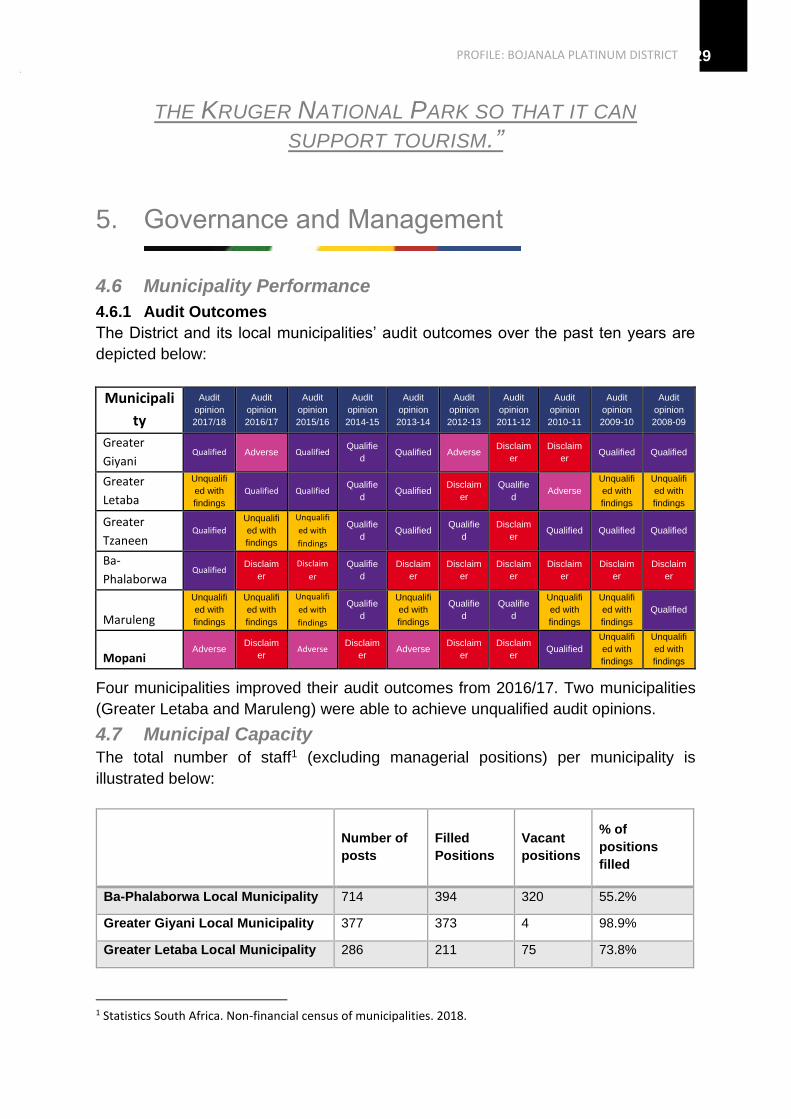
4.6.1 Audit Outcomes
The District and its local municipalities’ audit outcomes over the past ten years are
depicted below:
Municipali
ty
Audit
opinion
2017/18
Audit
opinion
2016/17
Audit
opinion
2015/16
Audit
opinion
2014-15
Audit
opinion
2013-14
Audit
opinion
2012-13
Audit
opinion
2011-12
Audit
opinion
2010-11
Audit
opinion
2009-10
Audit
opinion
2008-09
Greater
Giyani Qualified Adverse Qualified
Qualifie
d Qualified Adverse
Disclaim
er
Disclaim
er Qualified Qualified
Greater
Letaba
Unqualifi
ed with
findings
Qualified Qualified Qualifie
d Qualified
Disclaim
er
Qualifie
d Adverse
Unqualifi
ed with
findings
Unqualifi
ed with
findings
Greater
Tzaneen Qualified
Unqualifi
ed with
findings
Unqualifi
ed with
findings
Qualifie
d Qualified
Qualifie
d
Disclaim
er Qualified Qualified Qualified
Ba-
Phalaborwa Qualified
Disclaim
er
Disclaim
er
Qualifie
d
Disclaim
er
Disclaim
er
Disclaim
er
Disclaim
er
Disclaim
er
Disclaim
er
Maruleng
Unqualifi
ed with
findings
Unqualifi
ed with
findings
Unqualifi
ed with
findings
Qualifie
d
Unqualifi
ed with
findings
Qualifie
d
Qualifie
d
Unqualifi
ed with
findings
Unqualifi
ed with
findings
Qualified
Mopani Adverse
Disclaim
er Adverse
Disclaim
er Adverse
Disclaim
er
Disclaim
er Qualified
Unqualifi
ed with
findings
Unqualifi
ed with
findings
Four municipalities improved their audit outcomes from 2016/17. Two municipalities
(Greater Letaba and Maruleng) were able to achieve unqualified audit opinions.
4.7 Municipal Capacity
The total number of staff1 (excluding managerial positions) per municipality is
illustrated below:
Number of
posts
Filled
Positions
Vacant
positions
% of
positions
filled
Ba-Phalaborwa Local Municipality 714 394 320 55.2%
Greater Giyani Local Municipality 377 373 4 98.9%
Greater Letaba Local Municipality 286 211 75 73.8%
1 Statistics South Africa. Non-financial census of municipalities. 2018.
PROFILE: BOJANALA PLATINUM DISTRICT
30
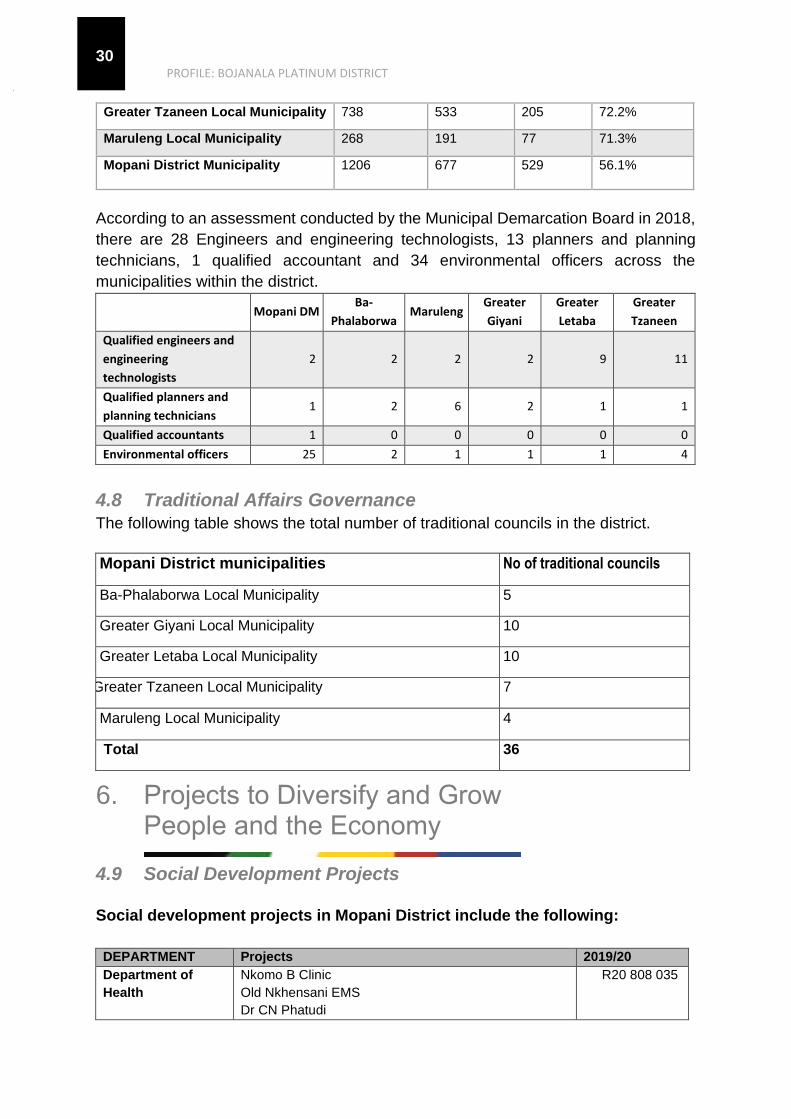
Greater Tzaneen Local Municipality 738 533 205 72.2%
Maruleng Local Municipality 268 191 77 71.3%
Mopani District Municipality 1206 677 529 56.1%
According to an assessment conducted by the Municipal Demarcation Board in 2018,
there are 28 Engineers and engineering technologists, 13 planners and planning
technicians, 1 qualified accountant and 34 environmental officers across the
municipalities within the district.
Mopani DM Ba-
Phalaborwa Maruleng
Greater
Giyani
Greater
Letaba
Greater
Tzaneen
Qualified engineers and
engineering
technologists
2 2 2 2 9 11
Qualified planners and
planning technicians 1 2 6 2 1 1
Qualified accountants 1 0 0 0 0 0
Environmental officers 25 2 1 1 1 4
4.8 Traditional Affairs Governance
The following table shows the total number of traditional councils in the district.
Mopani District municipalities No of traditional councils
Ba-Phalaborwa Local Municipality 5
Greater Giyani Local Municipality 10
Greater Letaba Local Municipality 10
Greater Tzaneen Local Municipality 7
Maruleng Local Municipality 4
Total 36
6. Projects to Diversify and Grow People and the Economy
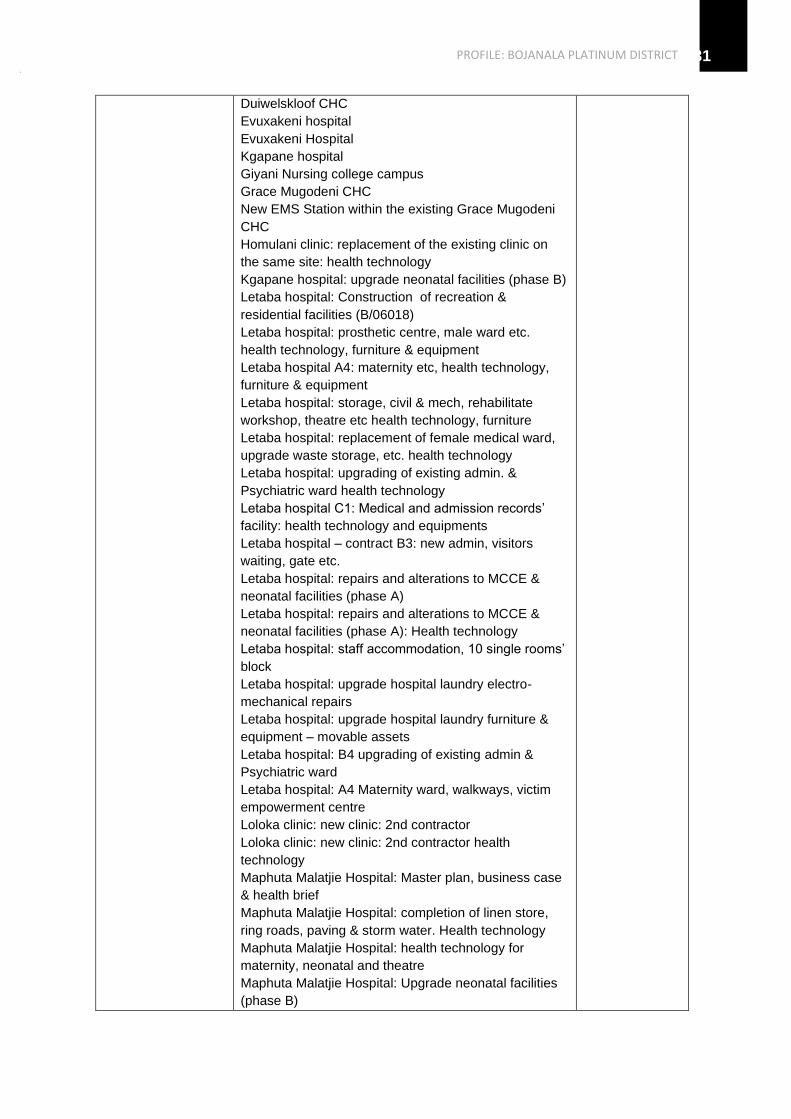
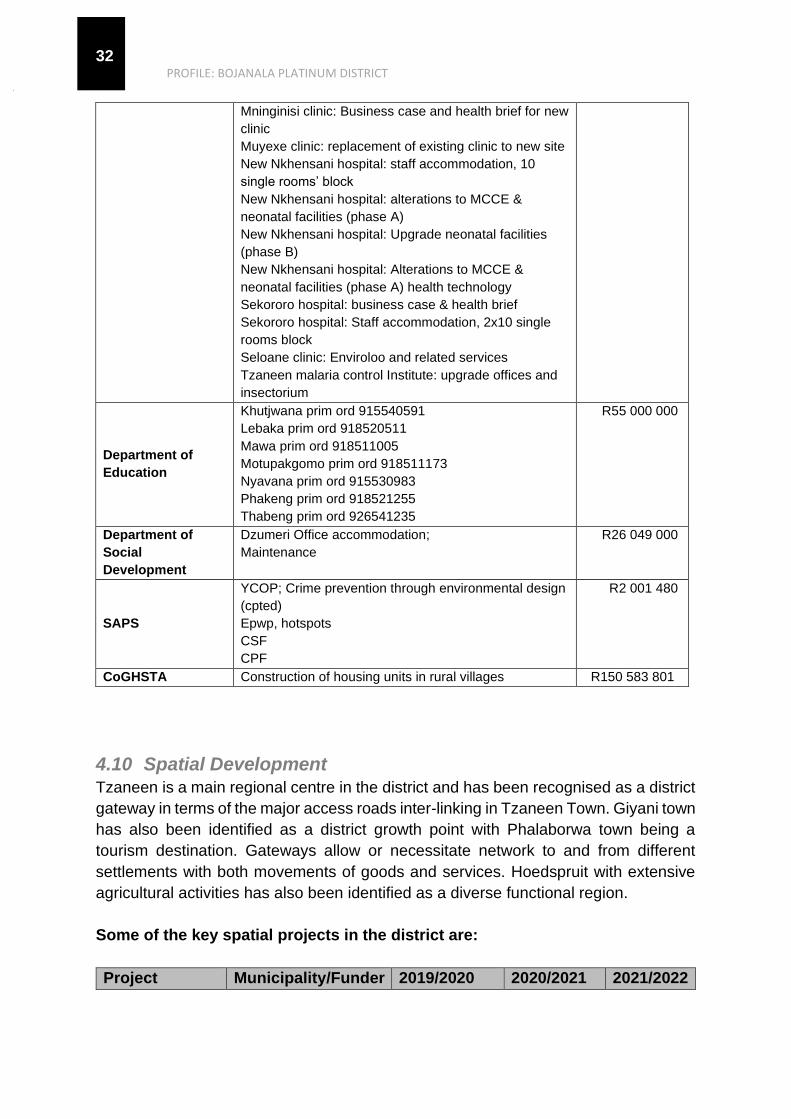
4.9 Social Development Projects
Social development projects in Mopani District include the following:
DEPARTMENT Projects 2019/20
Department of
Health
Nkomo B Clinic
Old Nkhensani EMS
Dr CN Phatudi
R20 808 035
PROFILE: BOJANALA PLATINUM DISTRICT 31
Duiwelskloof CHC
Evuxakeni hospital
Evuxakeni Hospital
Kgapane hospital
Giyani Nursing college campus
Grace Mugodeni CHC
New EMS Station within the existing Grace Mugodeni
CHC
Homulani clinic: replacement of the existing clinic on
the same site: health technology
Kgapane hospital: upgrade neonatal facilities (phase B)
Letaba hospital: Construction of recreation &
residential facilities (B/06018)
Letaba hospital: prosthetic centre, male ward etc.
health technology, furniture & equipment
Letaba hospital A4: maternity etc, health technology,
furniture & equipment
Letaba hospital: storage, civil & mech, rehabilitate
workshop, theatre etc health technology, furniture
Letaba hospital: replacement of female medical ward,
upgrade waste storage, etc. health technology
Letaba hospital: upgrading of existing admin. &
Psychiatric ward health technology
Letaba hospital C1: Medical and admission records’
facility: health technology and equipments
Letaba hospital – contract B3: new admin, visitors
waiting, gate etc.
Letaba hospital: repairs and alterations to MCCE &
neonatal facilities (phase A)
Letaba hospital: repairs and alterations to MCCE &
neonatal facilities (phase A): Health technology
Letaba hospital: staff accommodation, 10 single rooms’
block
Letaba hospital: upgrade hospital laundry electro-
mechanical repairs
Letaba hospital: upgrade hospital laundry furniture &
equipment – movable assets
Letaba hospital: B4 upgrading of existing admin &
Psychiatric ward
Letaba hospital: A4 Maternity ward, walkways, victim
empowerment centre
Loloka clinic: new clinic: 2nd contractor
Loloka clinic: new clinic: 2nd contractor health
technology
Maphuta Malatjie Hospital: Master plan, business case
& health brief
Maphuta Malatjie Hospital: completion of linen store,
ring roads, paving & storm water. Health technology
Maphuta Malatjie Hospital: health technology for
maternity, neonatal and theatre
Maphuta Malatjie Hospital: Upgrade neonatal facilities
(phase B)
PROFILE: BOJANALA PLATINUM DISTRICT
32
Mninginisi clinic: Business case and health brief for new
clinic
Muyexe clinic: replacement of existing clinic to new site
New Nkhensani hospital: staff accommodation, 10
single rooms’ block
New Nkhensani hospital: alterations to MCCE &
neonatal facilities (phase A)
New Nkhensani hospital: Upgrade neonatal facilities
(phase B)
New Nkhensani hospital: Alterations to MCCE &
neonatal facilities (phase A) health technology
Sekororo hospital: business case & health brief
Sekororo hospital: Staff accommodation, 2x10 single
rooms block
Seloane clinic: Enviroloo and related services
Tzaneen malaria control Institute: upgrade offices and
insectorium
Department of
Education
Khutjwana prim ord 915540591
Lebaka prim ord 918520511
Mawa prim ord 918511005
Motupakgomo prim ord 918511173
Nyavana prim ord 915530983
Phakeng prim ord 918521255
Thabeng prim ord 926541235
R55 000 000
Department of
Social
Development
Dzumeri Office accommodation;
Maintenance
R26 049 000
SAPS
YCOP; Crime prevention through environmental design
(cpted)
Epwp, hotspots
CSF
CPF
R2 001 480
CoGHSTA Construction of housing units in rural villages R150 583 801
4.10 Spatial Development
Tzaneen is a main regional centre in the district and has been recognised as a district
gateway in terms of the major access roads inter-linking in Tzaneen Town. Giyani town
has also been identified as a district growth point with Phalaborwa town being a
tourism destination. Gateways allow or necessitate network to and from different
settlements with both movements of goods and services. Hoedspruit with extensive
agricultural activities has also been identified as a diverse functional region.
Some of the key spatial projects in the district are:
Project Municipality/Funder 2019/2020 2020/2021 2021/2022

PROFILE: BOJANALA PLATINUM DISTRICT 33
LUS
development
Ba-Phalaborwa 1.4m 0 0
SDF review Mopani District 1m 1.2 mil 1.4 mil
Gravelotte
Township
establishment
(400 sites)
Ba-Phalaborwa 1m 0 0
Greater Letaba
SDF
Greater
Letaba/DRDLR
500 000 0 0
4.11 Infrastructure Projects
The Infrastructure development projects include the following:
DEPARTMENT 2019/20
Department of Transport 160 100 963
Depart. of Public Works, Roads & Infrastructure 189 116 417
Department of Water and Sanitation 228 000 000
Lepelle Northern Water 55 840 000
ESKOM 62 285 683
“TZANEEN IS A MAIN REGIONAL CENTRE
IN THE DISTRICT AND HAS BEEN RECOGNISED AS A
DISTRICT GATEWAY IN TERMS OF THE MAJOR ACCESS
ROADS INTER-LINKING IN TZANEEN TOWN.”
4.12 Economic Projects
The key economic project that could unlock the economy of Mopani are:
DEPARTMENT Projects 2019/20
Department of
Agriculture
GRASP 2 (Holofelang ;efa Christian; Davano;
Khomanani; Eunique
Grasp 4 ( Mongwe, Rikhotso, 100 Mandanda,
Xipfimbamahlo, Makwale, Greenlight
GRASP 4 ( Moradu, Vuxaka ikudya, Mandla maheli,
Reyaya)
Masalal Structural works
Marievert
10 X Mahale Farmers cluster
Benfarm coop
R24 815 000

PROFILE: BOJANALA PLATINUM DISTRICT
34
GRASP 3
Oasis nursery
GRASP Aquaculture
Mariveni farm coop
Exilite 499cc
Malemela Peba
AMATA TRADING CC
Commercialization and production increase strategy
continue only funded for planning: _ Projects:
Mohale Farming; Moradu farming; New Dawn Farming
Enterprise; Mabunda; Mariveni farm Coop; Makepisi;
Maswele Farming.
R1 900 000
Department of
Rural Development
and Land Reform
Nkowankowa Industrial Park, Greater Tzaneen R 36 157 183
Other Projects:
GRASP; Letsitele; Titirheleni Vomanana; Sofaya
Cooperative; Ximambani Cooperative; Hasani & Sons;
Ndzahluli projects; Muyexe arts and craft; Mopani Agri
hub; Macena Gardens; Gonono internal street paving;
Muyexe internal street paving; Nwamatatani community
hall; Masalal FPSU; Various fencing project
Mopani Agri hub; Maswanganyi; Gravelotte/ Selwana
Prieska Farmers secondary coopeartive ; Baloyi fence;
Homu irrigation scheme
Bend irrigation scheme; Solani irrigation scheme;Metz
irrigation scheme; Mahumane; Julesburg ; Senatlala
farming primary cooperative; Lemondokop primary maize
cooperative; Mmakgomo primary coop; Aganang Ntata
fresh produce; Raleputso coop; Deerpak no 459; Lofdal
42 KT Ptn 8 (Shai Shai); Rhualani project; Portion 64 & 65
of the farm Carlifornia 507 LT; Portion 10 of the farm
Carlifornia 507 LT; Portion 16 of the farm Dwarsfontein
541 LT
R144,003,804
4.13 Environmental forecast
The climate change phenomenon has led to an increase in weather hazards such
drought, floods and wildfires. Using the Local Government Climate Change Support
Program, spearheaded by the Department of Environmental Affairs, the Mopani
District has already developed a climate change vulnerability assessment and
response plan. This plan outlines the following key areas, namely; agriculture,
biodiversity and environment, human health, human settlements and water.
In terms of the climate change vulnerability assessment and response plan, change
in maize production was identified as a problem for the agricultural sector, as well as
increased risks to livestock. From a biodiversity perspective, the loss of grasslands
was identified as a particular area of concern since the grasslands are vulnerable to
climate change and form a vital role in water production. The critically endangered
Woodbush Granite Grasslands, gazetted as a protected vegetation type, are only

PROFILE: BOJANALA PLATINUM DISTRICT 35
found in and around the Haenertsburg area. Protecting this grassland, as well as those
found in the upper reaches of the Lekgalameetse Nature Reserve / Wolkberg should
be regarded as an imperative.
Most of the rain in Mopani district is received during summer (85% of the rain). The
rainfall varies from the Great Escarpment areas (2000 mm/a), to the dry savannah of
the Kruger National Park (400 mm/a). The temperature ranges from a maximum
average of 21°C in the mountainous areas, to 25°C in the dry lowveld areas. Frost
rarely occurs in the Mopani District. The District falls within both the Letaba and
Olifants Catchment areas, with the former covering approximately 13 400km² while
the latter covers approximately 54 550km² (Department of Water & Sanitation, 2011).
IN TERMS OF THE CLIMATE CHANGE VULNERABILITY ASSESSMENT AND RESPONSE PLAN, CHANGE IN MAIZE PRODUCTION WAS IDENTIFIED AS A
PROBLEM FOR THE AGRICULTURAL SECTOR, AS WELL AS INCREASED RISKS TO LIVESTOCK.”
PROFILE: BOJANALA PLATINUM DISTRICT
36
7. Key Recommendations
4.14 Prioritise Integrated Development Plan
The process to reprioritize programmes in the IDP
should consider the following:
• There are agricultural schemes along the perennial rivers that are abandoned and
they need to be revitalized so that they can enter the mainstream economy. Most
of them produce vegetables and grain products, which are sold to the local
markets. Water scarcity and related infrastructure is one of the problems that have
led to the collapse of the schemes.
• The inclusion of women and youth in tourism-related opportunities, ranging from
tour guides to selling of arts & crafts through craft markets that are strategically
located to tourist attraction destinations
7.2. Investor and Sponsorship opportunities
There are a number of opportunities identified for economic development in the
Mopani District Municipality. These include:
• Agro-processing - Mopani worms are some of the special commodities in the
intervention area although there is still a challenge in terms of marketing them.
Tzaneen is the hub of the extensive activities within the District Municipality where
most of the citrus fruit, sub-tropical fruit and vegetables in the district are
produced. This immediately offers opportunities for beneficiation from fruit
produce. Agri-parks provide a unique opportunity for the realisation of
transformative agricultural development and rural economic transformation in
Mopani and beyond.
• Small Scale Mining - The Ba-Phalaborwa corridor is particularly well endowed
with mining deposits with a number of mining operations already underway. The
revival of old mines in Giyani.
• Tourism- The Ba-Phalaborwa corridor also offers opportunities in eco-tourism
and game farming due to its proximity to Kruger National Park. Making the
Mopani District a gate-way through Giriondo Border post on tourism
promotion. The Maruleng Municipality has large game farms from which the
municipality can grow its tax base.

PROFILE: BOJANALA PLATINUM DISTRICT 37