proficiency testing of laboratories for paralytic
TRANSCRIPT
Proficiency testing of laboratories for paralytic shellfish poisoningtoxins in shellfish by QUASIMEME: A reviewStephen Burrell a,b,*, Steven Crum c, Barry Foley b, Andrew D. Turner d
a Marine Institute, Marine Environment and Food Safety Services, Rinville, Oranmore, County Galway H91R673, Irelandb Dublin Institute of Technology, Kevin Street, Dublin 2 D08NF82, Irelandc Wageningen University and Research Centre, Alterra, QUASIMEME Laboratory Performance Studies, Netherlandsd Centre for Environment Fisheries and Aquaculture Science, Barrack Road, Weymouth, Dorset DT4 8UB, UK
A R T I C L E I N F O
Keywords:Proficiency testingParalytic shellfish poisoningHPLCMouse bioassayMass spectrometry
A B S T R A C T
Paralytic Shellfish Poisoning (PSP) toxins are some of the most toxic substances known to man and con-sumption of shellfish containing these naturally-occurring neurotoxins can lead to a range of differentsymptoms including death in extreme cases. It is imperative therefore, to implement robust shellfish moni-toring programs to minimise the possibility of contaminated product reaching the marketplace. To improvethe quality assurance of these programs, QUASIMEME, the proficiency test provider added to its scope PSPtoxins in shellfish. Since 2009, six proficiency testing exercises have been delivered by QUASIMEME witha total of thirty-four different laboratories submitting data using a range of different methods. These includeanimal and antibody based assays, together with High Performance Liquid Chromatography (HPLC) tech-niques using post and pre-column oxidation and more recently LC-MS/MS methodologies.
Data from these exercises is presented and laboratory performance is assessed to determine any changesin overall performance over the six rounds, together with any potential method-related performance issues.The data showed the improvement of laboratories over the six exercises with between laboratory CV%values decreasing from an average of 39% in the first year to 22% in 2014 and the average percentage ofparticipants receiving satisfactory z-scores increasing from 50% in 2009 to over 66% in 2014.
© 2015 The Authors. Published by Elsevier B.V. This is an open access article under the CC BY license(http://creativecommons.org/licenses/by/4.0/).
Contents
1. Introduction ........................................................................................................................................................................................................................................................... 111.1. Toxicity equivalency factor (TEF) ...................................................................................................................................................................................................... 111.2. Methods of analysis .............................................................................................................................................................................................................................. 111.3. QUASIMEME’s Cofino model for data assessment ...................................................................................................................................................................... 131.4. Proficiency testing for PSP toxins ..................................................................................................................................................................................................... 14
2. Materials and methods ...................................................................................................................................................................................................................................... 153. Intercomparison results .................................................................................................................................................................................................................................... 154. Discussion .............................................................................................................................................................................................................................................................. 18
4.1. Identification of poor performance ................................................................................................................................................................................................. 184.2. Factors affecting poor performance ................................................................................................................................................................................................. 194.3. CRMs .......................................................................................................................................................................................................................................................... 194.4. Misidentification of toxins ................................................................................................................................................................................................................. 194.5. Method recovery correction factors ................................................................................................................................................................................................ 204.6. Method dependency and individual analogues .......................................................................................................................................................................... 204.7. Method choice ........................................................................................................................................................................................................................................ 204.8. Performance improvements ............................................................................................................................................................................................................... 21
5. Conclusions ............................................................................................................................................................................................................................................................ 21Acknowledgements ............................................................................................................................................................................................................................................. 21References .............................................................................................................................................................................................................................................................. 22
* Corresponding author. Tel.: +35391387379; Fax: +35391387201.E-mail address: [email protected] (S. Burrell).
http://dx.doi.org/10.1016/j.trac.2015.09.0040165-9936/© 2015 The Authors. Published by Elsevier B.V. This is an open access article under the CC BY license (http://creativecommons.org/licenses/by/4.0/).
Trends in Analytical Chemistry 75 (2016) 10–23
Contents lists available at ScienceDirect
Trends in Analytical Chemistry
journal homepage: www.elsevier.com/ locate / t rac

1. Introduction
Paralytic shellfish poisoning (PSP) is caused by a group of over30 structurally similar analogues based on a tetrahydropurine skel-eton and produced, mainly, by some marine dinoflagellates (Fig. 1)[1,2]. These potent neurotoxins can accumulate in the food chainthrough the filter-feeding of toxin-producing algae by bivalve molluscshellfish. Subsequent consumption of contaminated shellfish canresult in human intoxication, with symptoms including numbnessin the extremities, tingling in the face, nausea, vomiting, diar-rhoea and in severe cases, death by asphyxiation [3].
PSP toxin profiles in shellfish differ substantially worldwide andvariations occur for a number of reasons. The toxin profile differsbetween algal species, between strains of the same species, betweenspecies in different geographical locations or even between iso-lates from the same location [4,5]. Differences also exist in themetabolic transformation of some PSP toxins into others from variousshellfish species [6]. This can lead to issues for PSP proficiency test(PT) providers in supplying materials with a wide range of pro-files to cater to participants from different geographical locations.
Numerous intoxications and incidences have been reported fromaround the world [7–12] and with global aquaculture productionreaching record levels of 90.4 million tonnes in 2012 (US$144.4billion) [13], it is vital, for human protection and as a statutory re-quirement in many countries, to implement robust shellfishmonitoring programs [14,15].
Essential to any effective monitoring program is the proper ap-plication of a quality management system, incorporating both qualityassurance and quality control [16]. PT plays a vital role in the im-plementation of these programs, and participation in these schemesis a requirement both legislatively in the EU [17,18] as well as bymost national accreditation bodies.
QUASIMEME (Quality Assurance of Information in Marine En-vironmental Monitoring) was founded in 1992 and was initiallyfunded by the European Union (EU). The aim was to establish acomprehensive network of laboratories producing demonstrably re-liable chemical information while providing a holistic approach toquality assurance. The determination of PSP toxins was added tothe QUASIMEME scope in 2009 as a development exercise, with oneround being organised per year.
The aim of this review is to disseminate the data generated overthe previous six years of PSP PT delivered by QUASIMEME and tohighlight issues related to the analysis of this toxin group by thevarious methods used by participants. The review seeks to high-light the advantages of PT participation and shows the developmentof the exercises through laboratory performance.
1.1. Toxicity equivalency factor (TEF)
The PSP analogues differ substantially in their toxicity and theirTEFs have been derived from MBA data. Fig. 1 lists the TEFs re-ported by Oshima et al. in 1995 [19] alongside values compiled bythe Scientific Panel on Contaminants in the Food Chain (CONTAM)of the European Food Safety Authority (EFSA) in 2009 [20]. The twosets of figures are similar with the exception of dcSTX where theTEF was increased to 1.0 from 0.5 by the CONTAM panel. This changewould significantly affect reported total toxicities of samples withdcSTX as the predominant toxin present which is the case in someof the samples supplied by QUASIMEME.
1.2. Methods of analysis
There are few internationally recognised methods available fordetermining PSP toxins. Table 1 lists the numbers of participants
Fig. 1. Chemical structure of the PSP toxins together with toxicity equivalence factors (TEFs) reported by Oshima and those recommended by the European Food SafetyAuthority (EFSA).
11S. Burrell et al./Trends in Analytical Chemistry 75 (2016) 10–23

over the last six years and the methods employed are briefly de-scribed below:
1. Mouse bioassay (MBA): The MBA was first applied in the deter-mination of PSP toxicity by Sommer and Meyer in 1937[21]. Subsequently the procedure underwent standardisation,culminating in association of analytical communities (AOAC) of-ficial method (OMA) 959.08 [22]. This is the reference methodspecified in EU legislation [23] and involves the extraction of theshellfish homogenate tissue in dilute hydrochloric acid followedby intraperitoneal injection of filtered extracts into replicate mice.The time taken from injection to mouse death is recorded and thetoxicity determined from a conversion table developed by Sommerand Meyer [21]. Reported drawbacks of the method include un-derestimations of total toxicity caused by high salt concentrationsor the presence of some metals in samples [3,24]. The presenceof other metals, such as zinc, particularly evidenced in oystertissues has been reported to increase the threat of false posi-tives [25]. The method is also controversial in its use of largenumbers of mice and in stipulating death as an endpoint. A furtherdrawback of the MBA is that it only provides a total toxicity valueand no information about the specific toxin profile of a sample.However, the method has been used globally for many years andhas provided an excellent preventative method for the signifi-cant reduction of PSP intoxications worldwide.
2. Liquid Chromatography-Fluorescence Detection (LC-FLD): PSPtoxins do not exhibit natural ultraviolet absorption or fluores-cence and must therefore be oxidised into fluorescent derivativesbefore detection by FLD. This oxidation process can be carriedout either before or after separation by LC and has given rise totwo distinct LC methods.a. Pre-column Oxidation (preCOX): two preCOX methods were
used by participants. The first, also called the “Lawrencemethod” is the only named alternative to the MBA usable forofficial control testing in the EU and was written into EU leg-islation in 2006 [23]. The second closely-related method, usedby one participant in 2014 is that described by the EuropeanCommittee for Standardisation (CEN) and recently publishedas European standard DIN EN 14526 [26]. Both methods involvethe oxidation of toxins into iminopurine derivatives before sep-aration and determination by LC-FLD. The method cited inlegislation was originally developed by Lawrence and Meynard[27] and underwent international validation in 2004 beforebeing approved as an AOAC official method in 2005 [28]. Themethod is based on a two-step boiling acetic acid extractionfollowed by cleanup steps using solid phase extraction (SPE).Extracts are then oxidised using periodic acid or hydrogen per-oxide depending on the toxin profile present. The maindrawbacks of the method relate to the complex chromato-graphic output as well as the lack of separation of epimeric pairs(gonyautoxins 1&4 (GTX1 & GTX4), GTX2 & GTX3, C1 & C2,decarbamoylgonyautoxin 2&3 (dcGTX2 & dcGTX3) and C3 &C4) characteristic of this toxin group. Users of this method cal-culate summed toxin concentrations for each epimeric pair.
Sample toxicities are estimated from the sum of toxin con-centrations, which leads to a slight overestimation as the moretoxic analogue for each epimer pair is used to calculate totaltoxicity. This is in spite of the fact that the epimer ratio in bivalvetissues typically reaches an equilibrium of 3:1 predominatedby the less toxic α-epimers (GTX1, 2) compared to the moretoxic β-epimers (GTX3, 4) [29]. Pre-column derivatization canproduce one to three oxidation product peaks per toxin, leadingto difficulties in determining toxin profiles and accuratequantitation. This is particularly pertinent for samples oftenused in PT schemes where two or more different toxin pro-files are mixed to prepare the RMs or the analysis of toxinprofiles not routinely encountered at the participants labora-tory. Another drawback of using this method and all chemicalbased methods of analysis is the lack of certified reference stan-dards for all the PSP toxins, most notably GTX6, C3, C4, dcGTX1and dcGTX4. Example chromatograms, generated from preCOXLC-FLD analysis are illustrated in Fig. 2a–b which highlight thecomplex chromatographic output from this methodand some of the potential issues in accurate identification. Al-though complex, the method has been refined and standardisedsince acceptance as a first action AOAC method, and in recentyears has been implemented into routine official control testingof shellfish in a number of countries including Ireland, UK, Por-tugal and New Zealand.
b. Post-column oxidation (PCOX): methods based on post-column derivatization were first utilised for shellfish monitoringby Sullivan and Wekell in 1984 [30]. Further developments weredescribed by Oshima et al. in 1989 where separation of the fullsuite of known PSP toxins was achieved using three separatechromatographic conditions [31]. A method modified from thatof Oshima [19] and subsequently Thomas et al. [32] was pub-lished by Rourke et al. in the journal of the AOAC in 2008 [33].This method underwent international validation in 2010 andwas accepted as AOAC OMA 2011.02 [34]. The extraction tech-nique is based on that of the MBA, with the use of boilinghydrochloric acid. Partial hydrolysis of certain PSP toxins intomore toxic analogues occurs with the PCOX/MBA extractionmethod which, some argue, mimics the process of digestionin the stomach thereby more accurately reflecting sample po-tential toxicity [26]. The milder conditions of the preCOXextraction method do not cause hydrolysis of the toxins, withtoxin profile consequently remaining unaffected. A distinct ad-vantage the PCOX method has over the preCOX method is theformers ability to separate the PSP epimers contained in thisgroup [35]. One disadvantage with the PCOX methods is theirinability to separate certain PSP toxins (dcNEO/NEO and GTX6/GTX4) unless a very long runtime is used [33]. OMA 2011.02also requires two chromatographic runs in order to separatethe full suite of PSP toxins. The method has recently beenadopted into US legislation and has been implemented into of-ficial control monitoring programs within Canada, Norway andsome US states. Chromatograms obtained from PCOX LC-FLDanalysis of a material used in these exercises are provided inFig. 2c–d, which clearly shows the separation of the epimerpairs contained in the sample.
3. Assays: The immunoassay technique used by QUASIMEME par-ticipants for PSP testing is that of a competitive enzyme-linkedimmunosorbent assay (ELISA). A number of kits are commercial-ly available, although the one used for reporting QUASIMEMEsamples is available under the name Ridascreen™ (R-Biopharm,Darmstadt, Germany) and is based on the competition betweenfree PSP toxins and PSP toxin conjugates for PSP antibody bindingsites. The high number of saxitoxin (STX) congeners has posedproblems for developers of these methods, with, for example,neosaxitoxin (NEO) and GTX1,4 exhibiting poor cross reactivity
Table 1Total number of participants in each round including breakdown of methods used
Year Round Methods Used Total Numberof Participants
preCOX PCOX MBA ELISA LC-MS/MS
2009 57 8 2 4 – – 142010 61 9 5 2 – – 162011 65 8 5 4 2* – 192012 69 9 5 2 – – 162013 72 13 6 2 – 1 222014 2014-1 13 5 2 – 3 23
* Ridascreen ELISA used by participants.
12 S. Burrell et al./Trends in Analytical Chemistry 75 (2016) 10–23

with the Ridascreen assay [36]. Other immunological test kits avail-able commercially suffer the same cross reactivity issuesdescribed above apart from one test kit supplied by Neogen, wherethe cross reactivity of NEO was improved [37]. A hydrolysis stephas also been implemented by one kit supplier, Scotia Rapid TestingLtd., which converts GTX1,4 to NEO in order to circumvent someof the GTX1,4 cross reactivity issues [38].A receptor binding assay (RBA) was first developed in the early90’s by Vieytes et al. [39] and after extensive method refine-ment and further development was accepted as an official AOACmethod of analysis in 2011 (OMA AOAC 2011.27) [40]. Al-though the method has performed well in comparison with theMBA and HPLC [41], its use in routine monitoring programmeshas been limited in part by the reliable availability of tritiatedsaxitoxin and from the use and handling of radioisotopes usedin the method. The RBA has not been used for the analysis ofany Quasimeme samples to date.
4. Liquid Chromatography – Tandem Mass Spectrometry (LC-MS/MS): The use of mass spectrometry as a detection system fordetermining PSP toxins is desirable, based on the high sensitiv-ity and selectivity this technique potentially gives the user. EarlyLC-MS/MS methods required the use of ion-pairing reagents inthe mobile phase in order to ensure adequate retention of thecharged PSP species [42,43]. This, along with the aqueous mobilephase these methods employed, leads to poor ionization andsignal suppression. Hydrophilic interaction liquid chromatog-raphy (HILIC), which does not require the use of ion pairingreagents, was first utilised for PSP determination by Dell’Aversanoet al. in 2005 [44]. The technique is ideally suited to the sepa-ration of polar compounds and for electrospray ionisation (ESI)MS detection owing to the high organic content of mobile phasesused [44]. Despite these advantages the technique still suffersfrom significant matrix effects issues caused by salts and co-extractives present. These issues coupled with the high detectionlimits reported have limited this methods use in monitoring pro-grammes, despite improved sensitivity compared to previouslydeveloped LC-MS/MS methods [44]. Recent developments in thefield have focused on sample pre-treatment in order to over-come the issues highlighted above. Boundy et al. reported on aneffective desalting pre-treatment cleanup step using inexpen-sive graphitised carbon SPE cartridges prior to HILIC separationand MS detection [45]. The procedure reduced matrix effects sub-stantially and the method was subjected to an extensive single-laboratory validation study on various shellfish species as reportedby Turner et al. [46]. Method sensitivity was significantly in-creased and detection limits were found to be similar or belowthose reported for both preCOX and PCOX LC-FLD methods. Thisrepresents a major breakthrough in overcoming the technicalissues that have traditionally affected LC-MS/MS determina-tion of PSP toxins in complex matrices. The use of LC-MS/MSmethods for PSP testing by QUASIMEME participants has beenlimited to date with results submitted by three participants in2013 and 2014 only. The LC-MS/MS methods used by these par-ticipants were based on HILIC-MS/MS with one participant (Lab28) using the method of Boundy et al. [45].
5. Others: alternative methods for PSP determination include cap-illary electrophoresis coupled to ultraviolet (UV) or MS detection,although very little research has been carried out in this area[47–52] and no QUASIMEME participants have submitted databased on these technologies to date.
1.3. QUASIMEME’s Cofino model for data assessment
The data assessment carried out by QUASIMEME is based on ISOguide 13528 concerning the proficiency testing of analytical chem-istry laboratories [53] with some slight modifications. The assigned
0 2 4 6 8 10 12 14
Detector Response
0
10
20
30
40
GTX1,4
GTX1,4
GTX1,4
a)
0 2 4 6 8 10 12 140
20
40
60
80
100
120
140b)
C1,2
dcSTX
dcSTX
GTX2,3
STX
GTX5
0 4 8 12 16 20 240
20
40
60
80
100
120
140c)
GTX1
GTX4
GTX3 NEO dcSTXSTX
GTX2
Time (mins)0 4 8 12 16 20 24
0
10
20
30
40
50d)
C1
C2
Fig. 2. Chromatograms of Tissue B (QST076BT, 095BT & 133BT) obtained by a) preCOXLC-FLD analysis of carboxylic acid solid phase extraction (SPE) fraction 2, periodateoxidised, b) preCOX LC-FLD analysis of C18 SPE cleaned, peroxide oxidised, c) PCOXLC-FLD analysis of GTX/STX toxins and d) PCOX LC-FLD analysis of C-toxins.
13S. Burrell et al./Trends in Analytical Chemistry 75 (2016) 10–23

value and z-scores are calculated using a model developed by Cofinoet al. [54] which was specifically designed for use in the determinationof population characteristics [55]. Robust statistics form the basis tothe ISO13528 guide to data assessment but this model can be limitedwhere a high percentage of extreme values are submitted by par-ticipants, as the model can typically deal with ~7–10% tailing data.The Cofino model is unique as it can be used directly with a wholerange of datasets including tailing or skewed data, datasets contain-ing extreme outliers and bimodal or multimodal distributions.
The model works by identifying clusters of data within a datasetexhibiting a high level of agreement. From this the mean, stan-dard deviation (s.d.) and percentage of data associated with eachcluster is calculated. A distinct advantage this model has over thestandard robust model is that no preparation of the dataset is nec-essary, either by using subjective boundaries or outlier testing beforeentering it into the database for assessment.
The Cofino model uses probability density functions for each ob-servation weighting values centred around the mean more heavilythan those further away from the mean.
The detailed, graphical information provided by the model canbe seen in Fig. 3 and the derivation of each is described in theQUASIMEME handbook [55]. The graphical information includes:
- A plot of the population density functions (Fig. 3a).- Matrix overlap (Kilt) plot which is a colour density plot very sen-
sitive to identifying the structure of data, especially modality(Fig. 3b).
- A ranked overview of the means and standard deviations of eachdata set (Fig. 3c).
- Z-score plot for reviewing performance against targets (Fig. 3d).
1.4. Proficiency testing for PSP toxins
QUASIMEME currently provide the only commercially avail-able, open access PT schemes for marine biotoxins in shellfishworldwide. Previous interlaboratory and PT schemes for PSP toxinshave focused on the MBA [56], on the preCOX LC-FLD method [57]or on a combination of the most widely used methods includingMBA, preCOX and PCOX LC-FLD, ELISA and LC-MS/MS [58–62].
A pilot study organised by the Food Analysis Performance As-sessment Scheme FAPAS® in 2003 highlighted issues related to thechoice of extraction method used by participants [63]. Under boilingHCl conditions, partial hydrolysis of the N-sulfocarbamoyl toxins,GTX5 and C1,2, present in the sample, were transformed into their
Fig. 3. Data plots for the toxin dcSTX found in sample QST132BT in 2012. a) Summed probability density functions (PDFs) for all data (black line) and for the first mode,PMF1, (blue line) with histogram of individual measurements in grey. Each observation from a participant is described by a PDF and is not regarded as a value using theCofino model. b) The Kilt plot (Overlap matrix) showing degree of overlap of each pair of data. Areas of the map coloured white indicate complete overlap (agreement) forthe observations concerned while black indicates no overlap. c) Ranked overview of all data with error bars of ±2 s.d. d) Ranked z-score plot for all data.
14 S. Burrell et al./Trends in Analytical Chemistry 75 (2016) 10–23

carbamoyl counterparts, STX and GTX-2,3 respectively [36], leadingto significant differences in the results supplied by users of both ex-traction methods.
A ring trial organised by CEFAS in 2011/2012 found statisticaldifferences between the preCOX and PCOX methods, most notablyfor the toxins GTX1,4 and NEO, with significantly higher results onaverage submitted by preCOX LC-FLD users compared to PCOX LC-FLD. Conversely results returned for the other toxins covered in thatstudy, C1,2, GTX2,3 and STX were found to be lower on average whendetermined by preCOX LC-FLD compared to PCOX LC-FLD. Theorganisers surmised that the higher levels of inter-laboratory methodvariability associated with preCOX LC-FLD analysis, as evidenced bythe higher standard deviations submitted by participants contrib-uted to the differences observed [59].
Other studies have highlighted issues relating to the analysis ofthe toxins dcNEO and GTX6 by both LC-FLD methods. The toxindcNEO co-elutes with another toxin, NEO, when analysed using thePCOX method, leading to potentially significant over-estimations oftotal toxicity due to the differences in TEF values for both toxins,(Fig. 1). The lack of certified reference materials for all the knownPSP toxins but in particular GTX6 and C3,4, highlights another issuebetween both LC-FLD methods. An hydrolysis step, converting GTX6into NEO and C3,4 into GTX1,4, can be applied by users of the preCOXmethod, allowing indirect quantitation of these toxins, which is notpossible when using the PCOX method.
2. Materials and methods
All materials were prepared by the lead author and designed totest the performance of QUASIMEME participant methods with theanalysis of a wide variety of analytes, whilst minimising the numberof samples to be tested. Materials incorporated a range of toxin con-centrations and different complexities in toxin profile composition.The shellfish tissues used were naturally contaminated with a rangeof PSP toxins and prepared following in-house procedures to ensurehomogeneity. Stabilisation of the toxins and matrices was achievedusing a combination of heat treatment and the addition of antibi-otics and an antioxidant [64,65] with short-term stability andhomogeneity studies performed on all materials before distribu-tion to participants [66].
A total of eight materials have been used over the six exercises2009–2014, with Tissues A & C being incorporated into four roundseach, Tissues B & D used in three rounds, Tissue E used in two rounds
and Tissues F, G & H used in one round only. Table 2 lists each ofthe materials and the rounds in which they were used, the as-signed codes, predominant toxins present, matrices studied and thehomogeneity results determined. The coefficients of variation werecalculated from the homogeneity data contained in Table 2 and com-pared to expected levels of method variability determined throughvalidation of the test method, below which the RM was deemed suf-ficiently homogenous.
The exercises are true proficiency tests so no standardised methodprotocol was provided by QUASIMEME and participants were re-quested to use the analytical method routinely employed at theirlaboratories. The only stipulation in the protocol was in the use ofTEFs supplied and these were requested to be used in total toxic-ity calculations. In 2009 (Round (R) 57) and 2010 (R61), the TEFssupplied in the protocol were those reported by Oshima [19], whilein 2011 (R65), 2012 (R69), 2013 (R72) and 2014 (R 2014-1) TEFsrecommended by the EFSA [20] were prescribed in the protocol(Fig. 1).
The format of the data submitted by participants is dependentupon the method employed for material testing. All participants arerequired to submit a total toxicity result for each sample, enablingassessment and comparison of all methodologies including par-ticipants using MBA. Participants using either the preCOX, PCOX orLC-MS/MS methods of analysis, where individual analogue con-centrations can be determined, were able to submit results such thata data assessment and therefore z-scores can be calculated for eachindividual toxin, or epimeric pair, in addition to total toxicity. Thisallows participants receiving less than satisfactory z-scores to pin-point potential causes of method failure or operator error, if theyrelate to the determination of a particular analogue.
3. Intercomparison results
Table 3 summarises participants’ data taken over the six exer-cises and contains assigned values, number of observations perdeterminant, between-laboratory CV (%) and percentage of partici-pants receiving satisfactory z-scores. The performance of laboratorieswas not assessed in cases where an assigned value could not be cal-culated. In these cases an indicative value was generated and noz-scores were calculated. Only materials where assigned values couldbe calculated are listed in table 3. The criteria set out in calculat-ing an assigned value and z-scores are contained in the QUASIMEMEmanual [55].
Table 2List of materials used in each exercise, assigned codes, predominant toxins present, matrices studied and homogeneity results determined using OMA AOAC2005.06
Tissue Rounds Used Year Codes Used Predominant Toxins Present Matrix Homogeneity Results (n = 15)μgSTXdiHCl eq./kg
A 57 2009 QST075BT dcSTX, STX, GTX-5 Mytilus galloprovincialis 533 ± 2461 2010 QST093BT69 2012 QST132BT2014-1 2014 Sample 1
B 57 2009 QST076BT dcSTX, GTX-2,3, GTX-1,4, STX,GTX-5 & C-1,2
Mytilus edulis & Mytilusgalloprovincialis
1174 ± 4561 2010 QST095BT69 2012 QST133BT
C 61 2010 QST094BT dcGTX-2,3, dcSTX & dcNEO Spisula solida 2829 ± 6265 2011 QST111BT69 2012 QST134BT2014-1 2014 Sample 2
D 65 2011 QST113BT GTX-2,3 & STX Mytilus edulis 1400 ± 4472 2013 QST152BT2014-1 2014 Sample 3
E 65 2011 QST114BT GTX-2,3, STX & dcSTX Mytilus edulis 1249 ± 5572 2013 QST154BT
F 69 2012 QST135BT GTX-2,3, STX, GTX-1,4 & NEO Crassostrea gigas 803 ± 22G 72 2013 QST155BT GTX-2,3, STX, GTX-1,4 & dcSTX Mytilus edulis 829 ± 29H 2014-1 2014 Sample 4 GTX-2,3, STX, GTX-1,4 & dcSTX Crassostrea gigas 1715 ± 51
15S. Burrell et al./Trends in Analytical Chemistry 75 (2016) 10–23

Table 3Summary data from all methods 2009–2014, showing assigned values, number of observations, coefficient of variation and % of z-scores satisfactory
Year Test Material and Code STX dcSTX dcGTX-2 dcGTX-3 dcGTX-2,3 C-1,2 GTX-2 GTX-3 GTX-2,3 GTX-5 GTX-1 GTX-4 GTX-1,4 neoSTX dcNEO Total Toxicity
μmol/kg μgSTXdiHCleq./kg
2009 Mussel QST075BT Tissue A 461, 1435, 50
Mussel QST076BT Tissue B 977, 1444, 50
2010 Mussel QST093BT Tissue A 0.07, 6 1.69, 13 0.20, 10 400, 1631, 42 34, 85 39, 69 44, 50
Clam QST094BT Tissue C 3.47,14 1.37, 7 1886, 1641, 50 36, 57 45, 44
Mussel QST095BT Tissue B 0.37, 11 0.93, 13 0.48, 8 1.36, 11 0.13, 7 1.14, 8 0.17, 5 950, 1523, 77 28, 71 43, 50 13, 75 16, 46 22, 55 58, 33 36, 44
2011 Clam QST111BT Tissue C 3.53, 12 9.32, 7 1.40, 8 2670, 1914, 83 29, 71 20, 63 19, 89
Mussel QST113BT Tissue D 2.56, 12 1.01, 5 1.15, 7 1139, 1915, 83 22, 80 29, 86 30, 58
Mussel QST114BT Tissue E 1.92, 12 0.58, 12 1.54, 7 1187, 1916, 75 27, 92 18, 71 27, 63
2012 Mussel QST132BT Tissue A 0.08, 10 1.71, 13 0.21, 10 629, 1563, 69 23, 69 20, 75 18, 60
Mussel QST133BT Tissue B 0.35, 14 0.97, 13 0.35, 6 1.09, 8 0.12, 7 0.83, 5 0.90, 7 0.14, 6 986, 1523, 86 29, 69 26, 71 21, 75 4, 64 14, 80 19, 86 35, 56 32, 53
Clam QST134BT Tissue C 3.34, 13 9.00, 8 0.10, 4 1.32, 9 2734, 1518, 62 24, 63 44, 44 24, 67 19, 67
Oyster QST135BT Tissue F 0.60, 14 1.62, 7 0.69, 7 0.12, 7 789, 1528, 86 21, 71 39, 50 80, 50 38, 47
2013 Mussel QST152BT Tissue D 2.59, 19 1.06, 6 0.45, 6 1.31, 12 1245, 1813, 68 5, 100 2, 100 27, 92 11, 72
Mussel QST154BT Tissue E 1.98, 19 0.56, 17 1.36, 6 0.54, 6 1.53, 12 1246, 1820, 68 25, 76 17, 100 5, 83 18, 83 17, 78
Mussel QST155BT Tissue G 0.32, 18 0.54, 17 0.84, 6 0.30, 6 0.95, 12 0.17, 5 0.54, 10 742, 1727, 78 26, 76 25, 100 7, 83 17, 83 48, 83 38, 64 19, 67
2014 Mussel Sample 1 Tissue A 0.10, 13 1.96, 21 0.20, 13 750, 2277, 65 31, 57 45, 75 33, 55
Clam Sample 2 Tissue C 3.46, 20 11.20, 6 3.07, 6 10.20, 14 1.46, 13 3045, 2224, 65 4, 100 9, 67 37, 50 53, 46 22, 68
Mussel Sample 3 Tissue D 2.61, 20 0.94, 6 0.42, 6 1.21, 14 1289, 2118, 80 9, 83 12, 100 32, 79 17, 71
Mussel Sample 4 Tissue H 1.94, 21 0.09, 13 2.24, 7 0.74, 7 2.41, 14 0.17, 6 0.74, 9 0.24, 11 1569, 229, 90 55, 63 8, 86 7, 100 25, 64 27, 86 45, 55 47, 57 15, 68
Codes: assigned value, number of observations (Nobs) / coefficient of variation % (CV%), % z-scores satisfactory (|z| <2).
16S.Burrellet
al./Trendsin
AnalyticalChem
istry75
(2016)10–23

Figs 4 and 5 graphically represent z-scores generated over thelast six exercises with calculated upper and lower z-score limits forsatisfactory (z ≤ |2|), questionable (|2| < z ≤ |3|) and unsatisfactory(z ≥ |3|) data.
A list of the methods used by participants since 2009, includ-ing references where possible, is detailed in Table 4. Please note thatlabs 3 and 8 changed from using the MBA as their method of anal-ysis in R57 (2009) to using preCOX and PCOX methods respectively,when they next participated in 2010 and 2011.
All materials were prepared from naturally contaminated tissuesat levels ranging from approximately half to three and a half timesthe current EU regulatory limit of 800 micrograms per kilogram [15].The materials were chosen to test participant performance usingthe most common shellfish species of global commercial impor-tance where possible, with toxin profiles of varying complexity andover a range of concentrations. The results summarised in Table 3show the improvement of participants over the six exercises. Thecoefficients of variation have decreased from an average of 39% in2009 to 22% in 2014 and the percentage of participants receivingsatisfactory z-scores have increased from an average of 50% in 2009to 65% in 2014.
Although substantial improvements have been made during thesedevelopment exercises certain issues have been highlighted whichmay have contributed to some of the variability seen in the datasets.
The application of TEFs to estimate the total toxicity of a samplewas necessary in order to compare all methods together. Two different
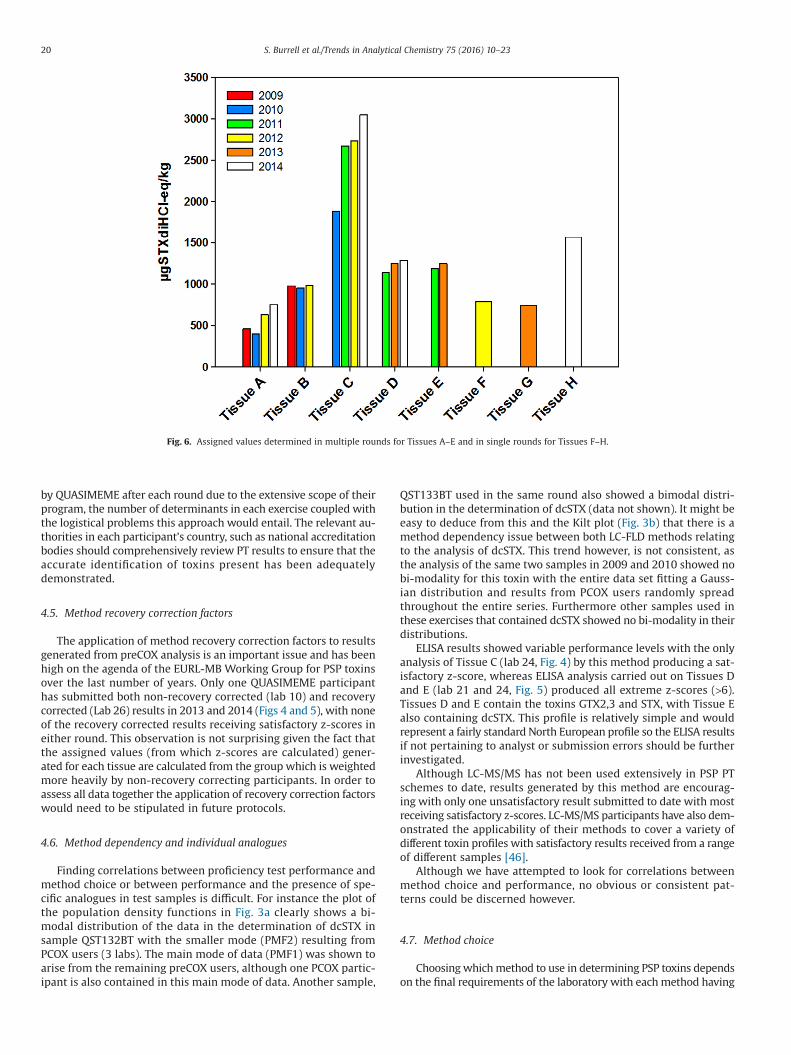
sets of TEFs have been prescribed in the protocols over the last 6 yearsas described in the previous section. The differences between bothsets of TEFs are minimal apart from one toxin, dcSTX, which was in-creased from 0.5 to 1.0 by the EFSA. These changes account for thevariability in assigned values of materials used in multiple roundswhere dcSTX was a predominant toxin present. This is clearly evidentin tissues A and C where assigned total toxicity values of 461 and400 μg STX diHCleq./kg (tissue A) and 1886 μg STX diHCleq./kg (tissueC) in early rounds increased to 629 and 750 μg STX diHCleq./kg (tissueA) and 2670, 2734 and 3045 μg STX diHCleq./kg (tissue C) in latterexercises. Fig. 6 illustrates this point and graphically presents the as-signed values for all tissues used in these exercises. Recent studiescarried out by Munday et al. determined the median lethal doses ofsome PSP analogues through interperitoneal injection, gavage andfeeding experiments [67]. They concluded that there was a lower riskwith dcSTX than that proposed by the EFSA with their figures beingmore in line with earlier data such as those determined by Oshimaet al. [19]. This may explain some of the differences observed betweeninstrument based methods of analysis and the MBA in samples withdcSTX as a predominant toxin present.
Another interesting observation from the data contained inTable 3 relates to the comparison of methods capable of epimerseparation, such as the PCOX and LC-MS/MS methods to the preCOXmethod, where epimer separation is not possible. In tissues wherevalues were assigned to both individual epimers as well as the sumof the epimers, significant differences can be observed. In the
2009 2012
PCOX ELISA
2013
LC-MS/MS2010
MBA2011 2014
preCOXz-score +/- 3z-score +/- 2
Did not participate / submit
Tissue A
0 1 2 3 4 5 6 7 8 9 10 11 12 13 14 15 16 17 18 19 20 21 22 23 24 25 26 27 28 29 30 31 32 33 34 35 36
z-score
-6
-4
-2
0
2
4
6
Tissue B
0 1 2 3 4 5 6 7 8 9 10 11 12 13 14 15 16 17 18 19 20 21 22 23 24 25 26 27 28 29 30 31 32 33 34 35 36-6
-4
-2
0
2
4
6
Tissue C
Laboratory Number
0 1 2 3 4 5 6 7 8 9 10 11 12 13 14 15 16 17 18 19 20 21 22 23 24 25 26 27 28 29 30 31 32 33 34 35 36-6
-4
-2
0
2
4
6
Fig. 4. Distribution of participants’ z-scores for Tissues A–C used in various rounds from 2009–2014.
17S. Burrell et al./Trends in Analytical Chemistry 75 (2016) 10–23

determination of GTX2 and GTX3, present in all three tissues usedin 2013, the addition of both assigned values for each individualepimer, determined by PCOX LC-FLD and LC-MS/MS users only, wassubstantially higher than the assigned value of the epimers deter-mined together by preCOX LC-FLD users only. This was also observedin tissues D and H used in 2014 for GTX 2 and GTX3 but also forthe toxins dcGTX2 and dcGTX3 in tissue C in 2014. This observa-tion is surprising given the accepted overestimation of epimerconcentrations determined when using the preCOX LC-FLD methodas the more toxic analogue of each epimer pair is used to calcu-late total toxicity. As in the case of the CEFAS ring trial discussedpreviously, the higher inter-laboratory method variability of thepreCOX LC-FLD method may explain some of the differencesobserved.
Where individual analogues could be determined by a methodsuch as preCOX and PCOX LC-FLD and LC-MS/MS, assigned valuescould be calculated from the datasets if certain conditions, as high-lighted in the Quasimeme handbook were met [55]. The analysisof one analogue, NEO has been problematic for participants as evi-denced by the high %CVs, with an average value of 55% (n = 4)calculated from the four datasets where assigned values could bedetermined for this toxin (Table 3). This value is high when com-pared to other individual analogues determined in QUASIMEMEtissues with average %CVs determined for dcNEO (33%, n = 4) andGTX5, dcSTX and STX (28% each, n = 13). This observation is not sur-prising given the fact that NEO co-elutes with dcSTX, if also present
in a sample, when determined by the preCOX LC-FLD method. Inthis instance the NEO concentration in a sample is estimated througha back calculation which takes into account the dcSTX contribu-tion to the overall response. PCOX LC-FLD and LC-MS/MS methodscan directly determine this toxin so no back calculation is required.
4. Discussion
4.1. Identification of poor performance
The source or sources of poor performance in PT schemes canbe difficult to pinpoint for both the participant and organiser. Findingcorrelations between method choice and analytical performance isvery difficult even with the large amount of data submitted by par-ticipants over the last six years. This is mainly due to the largenumber of variabilities potentially influencing PSP analysis andresults, for example changes to staff and associated training, re-agents used, slight variations in the oxidation of toxins or batch tobatch variability of consumables such as SPE cartridges.
The majority of extreme z-scores (z ≥ |6|) received by partici-pants can be traced back to either gross calculation errors (as highas 2–3 orders of magnitude difference) made during the conver-sion of concentration data into total sample toxicities or themisidentification of toxins present. Adequate training of person-nel, particularly new employees, in-house validation of methods anda comprehensive review process prior to submission is therefore
Fig. 5. Distribution of participants’ z-scores for Tissues D–F used in various rounds from 2011–2014.
18 S. Burrell et al./Trends in Analytical Chemistry 75 (2016) 10–23

of huge importance and would minimise or eliminate these extremeresults. Experienced laboratories can also suffer from variable per-formance levels due to the recruitment of new staff requiring trainingor the implementation of new methodologies and instrumentation.
While the causes of extreme z-scores are in general easier forparticipants to trace and remedy, unsatisfactory z-scores (|3| < z < |6|)can be a lot more difficult to investigate. New participants to theseschemes typically take two to three exercises before receiving sat-isfactory z-scores, the exact causes of which are unknown but aremost likely because of their unfamiliarity with the submissionprocess, reporting units required or analysing toxin profiles atyp-ical of their geographical location. This can be seen in Fig. 4,particularly for laboratories 1, 2 and 4 where initial unsatisfactoryz-scores received in the first round were improved in subsequentexercises. The opposite of this can also be the case however (seelaboratory 5 in Fig. 4) so participants have to be continually vigi-lant to ensure satisfactory performances are maintained.
4.2. Factors affecting poor performance
Previous PT schemes, ring trials and interlaboratory studies forPSP toxins have highlighted issues related to each of the methodsused [56,57,59,63]. The MBA is known to suffer from recovery issues
caused by “salt” effects [56] and the presence of some metals, par-ticularly zinc can have a large suppressive effect on the bioassay [24]with underestimation of total toxicity particularly in samples closeto the EU regulatory limit. These observations could explain someof the MBA results returned by participants in particular tissues B-Ewhere results were consistently below the assigned value (24 of 27in total) with some results ~60% below the assigned value.
The choice of extraction method can also have a fundamentalinfluence on results, with previous studies showing that underboiling HCl conditions (MBA & PCOX methods), partial hydrolysisof the N-sulfocarbamoyl toxins, GTX-5 and C-1,2 transformed theminto their carbamoyl counterparts, STX and GTX-2,3 respectively [63].It was noted however that the N-sulfocarbamoyl toxins were notpresent at very high concentrations in the tissues used in theseexercises.
4.3. CRMs
The lack of certified reference materials (CRMs), both solvent andmatrix for all the PSP toxins is a problem consistently highlightedin the area, although a matrix CRM has recently been produced byCEFAS [68]. This lack of CRMs, particularly for the toxins GTX6 andC3,4, although not present in any QUASIMEME samples to date, hashighlighted problems in the PT schemes delivered by the EU Ref-erence Laboratory for Marine Biotoxins (EURL-MB) [60,61].Participants using preCOX methods can perform an hydrolysis stepconverting GTX6 into NEO and C3,4 into GTX1,4 which allows anindirect means of quantification for those toxins. Although the tox-icity of GTX6 is relatively low it can still contribute significantly tothe overall toxicity of some samples [35].
4.4. Misidentification of toxins
The misidentification of toxins, particularly dcNEO has been anissue for some participants and has been a source of poor perfor-mance in these exercises. The dcNEO misidentification wasparticularly highlighted in the analysis of Tissue C. Users of PCOXmethods of analysis misidentify this toxin as NEO due to the methodsinability to separate both toxins unless a very long run time is utilised(>60 mins). This is an accepted limitation of the PCOX method andpresents no consumer risk in a real sample scenario owing to the10-fold difference in TEF values between the two toxins. It can leadto a significant over estimation of total toxicity owing to the dif-ferences in TEF however, and for the most part resulted inparticipants receiving unsatisfactory or extreme z-scores. This wasnot always the case however as some laboratories received satis-factory z-scores even with dcNEO misidentified, (see laboratories8 and 15 in 2011, 2012 and 2014 for Tissue C, Fig. 4). The analysisof dcNEO can also pose problems to preCOX participants as this toxinco-elutes with dcSTX, and requires a back calculation in order toestimate the dcNEO concentration in the sample. Only two preCOXparticipants (Lab 11 & 14) have failed to correctly identify dcNEOas being present in Tissue C in 2010. Lab 11 received an unsatis-factory z-score for this sample while Lab 14 received a satisfactoryz-score as they significantly overestimated the dcSTX content in thesample, negating the fact that dcNEO was not quantified and usedin the total toxicity calculation. In subsequent rounds Lab 11 cor-rectly identified dcNEO in this sample and received satisfactoryz-scores again highlighting participant improvements as experi-ence is gained. Lab 14 did not participate in subsequent rounds. Asno data is removed by QUASIMEME before assigned values andz-scores are calculated, the onus is on participants to have a com-prehensive review process of final reports and z-score results toensure correct identification of all toxins present in the materialshas been achieved. Personalised feedback to participants, particu-larly those with less than satisfactory performance is not provided
Table 4Overview of methods used from 2009–2014 with references where applicable
Lab Number Method Used
2009 2010 2011 2012 2013 2014
1 1 1 1 1 1 12 1 1 1 1 1 13 2 – 1 1 1 14 2 2 2 2 2 25 3 3 3 – – 46 1 1 1 1 1 17 1 1 1 1 1 18 2 4 4 4 4 49 1 1 1 1 1 –
10 1 1 – 1 1 111 1 1 1 1 1 –12 4 – – – – –13 2 2 2 – – –14 – 1 – – – –15 4 4 4 4 4 416 – 4 – – 4 417 – 1 1 1 1 118 – 4 4 4 – –19 – – 4 4 4 420 – – – 4 – –21 – – 5 – – –22 – – 2 2 – –23 – – 2 – – –24 – – 5 – – –25 – – – – 4 –26 – – – – 1 127 – – – – 6 628 – – – – – 629 – – – – – 130 – – – – – 631 – – – – – 132 – – – – – 733 – – – – – 134 – – – – – 135 – – – – – 2Codes: 1. OMA AOAC 2005.06 [28]
2. OMA AOAC 959.08 [22]3. Oshima (PCOX) [19]4. OMA AOAC 2011.02 [34]5. ELISA (Ridascreen)6. HILIC-MS-MS
Internal method7. DIN EN 14526 [26]
19S. Burrell et al./Trends in Analytical Chemistry 75 (2016) 10–23
by QUASIMEME after each round due to the extensive scope of theirprogram, the number of determinants in each exercise coupled withthe logistical problems this approach would entail. The relevant au-thorities in each participant’s country, such as national accreditationbodies should comprehensively review PT results to ensure that theaccurate identification of toxins present has been adequatelydemonstrated.
4.5. Method recovery correction factors
The application of method recovery correction factors to resultsgenerated from preCOX analysis is an important issue and has beenhigh on the agenda of the EURL-MB Working Group for PSP toxinsover the last number of years. Only one QUASIMEME participanthas submitted both non-recovery corrected (lab 10) and recoverycorrected (Lab 26) results in 2013 and 2014 (Figs 4 and 5), with noneof the recovery corrected results receiving satisfactory z-scores ineither round. This observation is not surprising given the fact thatthe assigned values (from which z-scores are calculated) gener-ated for each tissue are calculated from the group which is weightedmore heavily by non-recovery correcting participants. In order toassess all data together the application of recovery correction factorswould need to be stipulated in future protocols.
4.6. Method dependency and individual analogues
Finding correlations between proficiency test performance andmethod choice or between performance and the presence of spe-cific analogues in test samples is difficult. For instance the plot ofthe population density functions in Fig. 3a clearly shows a bi-modal distribution of the data in the determination of dcSTX insample QST132BT with the smaller mode (PMF2) resulting fromPCOX users (3 labs). The main mode of data (PMF1) was shown toarise from the remaining preCOX users, although one PCOX partic-ipant is also contained in this main mode of data. Another sample,
QST133BT used in the same round also showed a bimodal distri-bution in the determination of dcSTX (data not shown). It might beeasy to deduce from this and the Kilt plot (Fig. 3b) that there is amethod dependency issue between both LC-FLD methods relatingto the analysis of dcSTX. This trend however, is not consistent, asthe analysis of the same two samples in 2009 and 2010 showed nobi-modality for this toxin with the entire data set fitting a Gauss-ian distribution and results from PCOX users randomly spreadthroughout the entire series. Furthermore other samples used inthese exercises that contained dcSTX showed no bi-modality in theirdistributions.
ELISA results showed variable performance levels with the onlyanalysis of Tissue C (lab 24, Fig. 4) by this method producing a sat-isfactory z-score, whereas ELISA analysis carried out on Tissues Dand E (lab 21 and 24, Fig. 5) produced all extreme z-scores (>6).Tissues D and E contain the toxins GTX2,3 and STX, with Tissue Ealso containing dcSTX. This profile is relatively simple and wouldrepresent a fairly standard North European profile so the ELISA resultsif not pertaining to analyst or submission errors should be furtherinvestigated.
Although LC-MS/MS has not been used extensively in PSP PTschemes to date, results generated by this method are encourag-ing with only one unsatisfactory result submitted to date with mostreceiving satisfactory z-scores. LC-MS/MS participants have also dem-onstrated the applicability of their methods to cover a variety ofdifferent toxin profiles with satisfactory results received from a rangeof different samples [46].
Although we have attempted to look for correlations betweenmethod choice and performance, no obvious or consistent pat-terns could be discerned however.
4.7. Method choice
Choosing which method to use in determining PSP toxins dependson the final requirements of the laboratory with each method having
Fig. 6. Assigned values determined in multiple rounds for Tissues A–E and in single rounds for Tissues F–H.
20 S. Burrell et al./Trends in Analytical Chemistry 75 (2016) 10–23

its own advantages and limitations [24,35]. In a routine monitor-ing scenario laboratories in the EU or exporting into the EU are legallybound to use designated methods of analysis such as the MBA orOMA AOAC 2005.06. The MBA is still the reference method in theEU however. Each of the methods used over the previous six exer-cises have demonstrated their applicability for these purposes buthave also highlighted the potential pitfalls, with each method re-ceiving the entire range of possible z-scores, satisfactory,questionable, unsatisfactory and extreme. No one method standsout as providing a clear advantage over the others so the final choicemay be based on practical issues associated with the method, accessand cost of equipment or the training and skills of the analyst, ratherthan any perceived shortcomings of each method.
MS determination of PSP toxins is desirable primarily based onthe specificity the method provides and the significant reductionof matrix related problems recently reported have eliminated crit-ical issues affecting method performance.
The LC-MS/MS results highlight the applicability of using HILIC-MS/MS technology for the separation and determination of PSP toxinswith only one of thirteen results submitted to date receiving an un-satisfactory z-score. With sensitivity issues greatly improved throughthe application of an SPE clean-up step, detection limits are com-parable or below those of the more established AOAC officialmethods. Each of the official AOAC methods based on LC-FLD havesufficient sensitivity to enable effective monitoring at current reg-ulatory levels however.
Sample turnaround times using the method of Boundy et al. [45]are increased through the application of an SPE clean-up step com-pared to the original HILIC method of Dell’Aversano et al. [44]. Sampleturnaround times are however similar when compared to both AOACLC-FLD methods where two SPE steps and two oxidation reac-tions may need to be performed on a single sample (AOAC2005.06),or two chromatographic runs in the case of AOAC 2011.02. SPE canbe fully automated and the application of UPLC technology greatlyreduces analysis times which are critical in its application to a highthroughput statutory monitoring scenario.
4.8. Performance improvements
Overall the development of this exercise and the performanceof participating laboratories have improved since its inception in2009. Participant numbers have increased which highlights thestrengthening of the exercise and its economic sustainability goingforward. The performance of laboratories has mostly improved andthis is clearly evidenced from Fig. 7 which displays the averages ofboth the coefficient of variation for all samples in each round andthe percentage of participants receiving satisfactory z-scores. The
percentage of participants receiving satisfactory z-scores has in-creased most years as laboratories gain experience in these exercisesand in determining potentially atypical toxin profiles. The preci-sion of the laboratories as expressed by the coefficient of variationhas also showed signs of significant improvement from the earlyexercises in 2009 and 2010.
The datasets also compare favourably with the PSP PT schemeoperated by the EURL-MB and the lipophilic biotoxin exercise (BT-11) operated by QUASIMEME. In 2012 and 2013 where data fromall methods was assessed together by the EURL-MB, between lab-oratory %CVs ranged from 33–52% in 2012 and 25–44% in 2013. In2014 the EURL-MB did not assess the entire dataset from all par-ticipants together so comparison to the 2014 QUASIMEME PSP datawas not possible. The QUASIMEME lipophilic biotoxin exercise in2014 generated between laboratory %CVs in the range 20–38%, whichequated to between 45–80% of participants receiving satisfactoryz-scores. These exercises compare favourably with the QUASIMEMEPSP exercise over the same period with average %CVs of 27, 15 and22% in the years 2012–2014 equating to 56, 72 and 66% of partici-pants receiving satisfactory z-scores respectively.
Through adding PSP toxins to their scope, QUASIMEME have es-tablished a comprehensive PT scheme for all EU regulated shellfishbiotoxins.
5. Conclusions
Six development exercises for PSP toxins have been deliveredsince 2009 by QUASIMEME, with participation from laboratories inthe EU, the Americas, Asia and Oceania using a range of differentmethods of analysis based on LC-FLD, LC-MS/MS, animal toxicityand immuno-based assays. Whilst no specific and consistent methoddependency issues could be detected from the datasets, factors af-fecting poor performance were highlighted with suggestions madeon how improvements could be made by participants. Monitoringthe trends in z-scores from consecutive rounds has allowedQUASIMEME to determine which participants have improved, de-clined or maintained performance in these exercises.
The range of different methods used by QUASIMEME partici-pants has highlighted the choice available for determining PSP toxinsin shellfish. All the methods used over the previous six exerciseshave received the full range of z-scores from satisfactory to extreme.The choice of which method to use is therefore dependent on leg-islative requirements in the participants region, access and cost ofequipment and the training and skills of the analyst rather than anyperceived limitations of a particular method.
The use of HILIC-MS/MS technology in determining PSP toxinshas shown the comparability this technique has compared to theother more established methods in routine monitoring programmesworldwide. Recent advances that have overcome issues affectingmethod performance have, for the first time provided a viable MSalternative for routine monitoring purposes. It is recommended thatthis modified HILIC-MS/MS method should be considered for furthervalidation through a full collaborative study under the auspices ofthe AOAC or other relevant bodies.
QUASIMEME will continue to deliver a PSP exercise annually withdata continually monitored by the Scientific Advisory Board (SAB)to determine issues contributing to poor performance and anymethod related issues.
Acknowledgements
We wish to thank all the participants over the last six years fortheir time and effort and for providing method specific informa-tion. Particular thanks to Wade Rourke (Canadian Food InspectionAgency) for helpful discussions on the data sets and the Biotoxin
01020304050607080
2009 2010 2011 2012 2013 2014
%
Year
Exercise Development 2009-2014
Coefficient of variation (average) % z-scores satisfactory (average)
Linear (Coefficient of variation (average)) Linear (% z-scores satisfactory (average))
Fig. 7. Improvements made over the duration of the PSP development exercise.
21S. Burrell et al./Trends in Analytical Chemistry 75 (2016) 10–23

Chemistry Team (BCT) at the Marine Institute for assistance in thepreparation of materials.
References
[1] E.A. Smith, F. Grant, C.M.J. Ferguson, S. Gallacher, Biotransformations of ParalyticShellfish Toxins by Bacteria Isolated from Bivalve Molluscs, Appl. Environ.Microbiol. 67 (2001) 2345–2353, doi:10.1128/AEM.67.5.2345-2353.2001.
[2] T.K. Mihali, R. Kellmann, B.A. Neilan, Characterisation of the paralytic shellfishtoxin biosynthesis gene clusters in Anabaena circinalis AWQC131C andAphanizomenon sp. NH-5, BMC Biochem. 10 (2009) 8, doi:10.1186/1471-2091-10-8.
[3] Anonymous, Report of the Joint FAO/IOC/WHO ad hoc expert consultation onbiotoxins in molluscan bivalves, Oslo, Norway, 26–30 September 2004, Rome,Italy, Food and Agriculture Organisation, 2005.
[4] D.M. Anderson, T.J. Alpermann, A.D. Cembella, Y. Collos, E. Masseret, M.Montresor, The globally distributed genus Alexandrium: multifaceted roles inmarine ecosystems and impacts on human health, Harmful Algae 14 (2012)10–35.
[5] G.M. Hallegraeff, S.I. Blackburn, M.A. Doblin, C.J.S. Bolch, Global toxicology,ecophysiology and population relationships of the chainforming PSTdinoflagellate Gymnodinium catenatum, Harmful Algae 14 (2012) 130–143,doi:10.1016/j.hal.2011.10.018.
[6] E. Jaime, G. Gerdts, B. Luckas, In vitro transformation of PSP toxins by differentshellfish tissues, Harmful Algae 6 (2007) 308–316.
[7] IPCS (International Programme on Chemical Safety), Aquatic (marine andfreshwater) biotoxins, Environmental Health Criteria 37 World HealthOrganization, 1984.
[8] S.E. Shumway, A review of the effects of algal blooms on shellfish andaquaculture, J. World Aquac. Soc. 21 (1990) 65–104.
[9] B.D. Gessner, P. Bell, G.J. Doucette, E. Moczydlowski, M.A. Poli, F. Van Dolah,et al., Hypertension and identification of toxin in human urine and serumfollowing a cluster of mussel-associated paralytic shellfish poisoning outbreaks,Toxicon 35 (1997) 711–722.
[10] L.E. Llewellyn, M.J. Dodd, A. Robertson, G. Ericson, C. de Koning, A.P. Negri,Post-mortem analysis of samples from a human victim of a fatal poisoningcaused by the xanthid crab, Zosimus aeneus, Toxicon 40 (2002) 1463–1469.
[11] C. García, M. del Carmen Bravo, M. Lagos, N. Lagos, Paralytic shellfish poisoning:post-mortem analysis of tissue and body fluid samples from human victimsin the Patagonia fjords, Toxicon 43 (2004) 149–158.
[12] S. Burrell, T. Gunnarsson, K. Gunnarsson, D. Clarke, A.D. Turner, First detectionof paralytic shellfish poisoning (PSP) toxins in Icelandic mussels (Mytilus edulis):links to causative phytoplankton species, Food Control 31 (2013) 295–301.
[13] Fisheries and Aquaculture Topics, The State of World Fisheries and Aquaculture(SOFIA), FAO Fisheries and Aquaculture Department, Rome, 2014.
[14] U.S. Food and Drug Administration, Compliance Policy Guides – CPG Sec. 540.250Clams, Mussels, Oysters, Fresh, Frozen or Canned – Paralytic Shellfish Poison,U.S. Food and Drug Administration, 2015. [accessed 29.09.14] <http://www.fda.gov/ICECI/ComplianceManuals/CompliancePolicyGuidanceManual/ucm074492.htm>.
[15] Anonymous, Commission Regulation (EC) No. 853/2004 of the EuropeanParliament and of the Council of 29 April 2004 laying down specific hygienerules for food of animal origin, OJ L 139, 30.4.2004, p. 55, 2004.
[16] International Organization for Standardization, ISO/IEC Guide 17025: GeneralRequirements for the Competence of Testing and Calibration Laboratories,International Organization for Standardization, Geneva, 1999.
[17] Anonymous, Commission Decision (EC) No. 1999/312/EC, OJ L 229, 08.05.1999,p. 37, 1999.
[18] Anonymous, Council Directive (EC) No. 93/99/EEC, OJ L 290, 24.11.1993 pp.14–17, 1993.
[19] Y. Oshima, Postcolumn derivatization liquid chromatographic method forparalytic shellfish toxins, J. AOAC Int. 78 (1995) 528–532.
[20] EFSA, Scientific opinion of the panel on contaminants in the food chain –saxitoxin group, EFSA J. 1019 (2009) 1–76.
[21] H. Sommer, K.F. Meyer, Paralytic shellfish poisoning, Arch. Pathol. 24 (1937)560–598.
[22] AOAC International, AOAC Official method 959.08. Paralytic shellfish poison.Biological method, in: Association of Analytical Communities (AOAC) OfficialMethods of Analysis of AOAC International, 18th ed., Gaithersburg, MD, USA,2005, pp. 79–80.
[23] Anonymous, Commission Regulation (EC) No. 1664/2006 of 6 November 2006amending Regulation (EC) No 2074/2005 as regards implementing measuresfor certain products of animal origin intended for human consumption andrepealing certain implementing measures 1664/2006. OJ L 320, pp. 13–45, 2006.
[24] A.D. Turner, M. Dhanji-Rapkova, M. Algoet, B.A. Suarez-Isla, M. Cordova, C.Caceres, et al., Investigations into matrix components affecting the performanceof the official bioassay reference method for quantitation of paralytic shellfishpoisoning toxins in oysters, Toxicon 59 (2012) 215–230.
[25] T. Aune, H. Ramstad, B. Heidenreich, T. Landsverk, T. Waaler, E. Egaas, et al., Zincaccumulation in oysters giving mouse deaths in paralytic shellfish poisoningbioassay, J. Shellfish Res. 17 (1998) 1243–1246.
[26] European Committee for Standardization (CEN), Foodstuffs – determination ofsaxitoxin and dc-saxitoxin in mussels – HPLC method using pre-columnderivatization with peroxide or periodate oxidation. DIN EN 14526:2004-11,
Standard. <http://www.beuth.de/en/standard/din-en-14526/69966439> 2015(accessed 16.01.15).
[27] J.F. Lawrence, C. Ménard, Liquid chromatographic determination of paralyticshellfish poisons in shellfish after prechromatographic oxidation, J. Assoc. Off.Anal. Chem. 74 (1991) 1006–1012.
[28] AOAC International, AOAC Official method 2005.06. Paralytic shellfish poisoningtoxins in shellfish. Prechromatographic oxidation and liquid chromatographywith fluorescence detection. First action 2005, in: W. Horwitz, G.W. Latimer(Editors), AOAC Office Methods of Analysis of AOAC International, Gaithersburg,MD, USA, 2005, p. 83.
[29] E. Turrell, J.-P. Lacaze, L. Stobo, Determination of Paralytic Shellfish Poisoning(PSP) Toxins in Shellfish by Prechromatographic Oxidation and LiquidChromatography (LC) with Flourescence Detection: Analysis of Shellfish Extractsfrom the UK Jellet Rapid Test (JRT) Trial, Fisheries Research Services, Aberdeen,Scotland, 2006. Contract Report No. 08/06.
[30] J. Sullivan, M. Wekell, Determination of paralytic shellfish poisoning toxins byhigh pressure liquid chromatography, in: E. Regalis (Editor), Seafood Toxins,vol. 262, ACS symposium series, American Chemical Society, Washington, DC,1984, pp. 197–205.
[31] Y. Oshima, K. Sugino, T. Yasumoto, Latest advances in HPLC analysis of paralyticshellfish toxins, in: S. Natori, K. Hashimoto, Y. Ueno (Editors), MycotoxinsPhycotoxins, vol. 88, Elsevier, Amsterdam, The Netherlands, 1989, pp. 319–326.
[32] K. Thomas, S. Chung, J. Ku, K. Reeves, M. Quilliam, Analysis of PSP toxins byliquid chromatography with post column oxidation and fluorescence detection,in: K. Henshilwood, B. Deegan, T. McMahon, C. Cusack, S. Keaveney, J. Silke, et al.(Editors), Molluscan Shellfish Safety, The Marine Institute, Galway, Ireland, 2006,pp. 132–138.
[33] W.A. Rourke, C.J. Murphy, G. Pitcher, J.M. van de Riet, B.G. Burns, K.M. Thomas,et al., Rapid postcolumn methodology for determination of paralytic shellfishtoxins in shellfish tissue, J. AOAC Int. 91 (2008) 589–597.
[34] AOAC International, AOAC Official method 2011.02. Determination of ParalyticShellfish Poisoning Toxins in mussels, clams, oysters and scallops. Post-columnoxidation method (PCOX). First action, in: AOAC Office Methods of Analysis ofAOAC International, Gaithersburg, MD, USA, 2011.
[35] S.L. DeGrasse, J. van de Riet, R. Hatfield, A. Turner, Pre- versus post-columnoxidation liquid chromatography fluorescence detection of paralytic shellfishtoxins, Toxicon 57 (2011) 619–624.
[36] B. Ben-Gigirey, A. Villar-Gonzalez, Chemical analysis, in: L.M. Botana (Editor),Seafood and Freshwater Toxins: Pharmacology, Physiology, and Detection, 2nded., CRC Press, Florida, USA, 2008, pp. 192–193.
[37] W. Jawaid, K. Campbell, K. Melville, S.J. Holmes, J. Rice, C.T. Elliott, Developmentand Validation of a Novel Lateral Flow Immunoassay (LFIA) for the RapidScreening of Paralytic Shellfish Toxins (PSTs) from Shellfish Extracts, Anal. Chem.87 (2015) 5324–5332, doi:10.1021/acs.analchem.5b00608.
[38] A.D. Turner, S. Tarnovius, S. Johnson, W.A. Higman, M. Algoet, Testing andapplication of a refined rapid detection method for paralytic shellfish poisoningtoxins in UK shellfish, Toxicon 100 (2015) 32–41, doi:10.1016/j.toxicon.2015.04.004.
[39] M.R. Vieytes, A.G. Cabado, A. Alfonso, M.C. Louzao, A.M. Botana, L.M. Botana,Solid-phase radioreceptor assay for paralytic shellfish toxins, Anal. Biochem.211 (1993) 87–93, doi:10.1006/abio.1993.1237.
[40] AOAC International, AOAC Official method 2011.27. Paralytic Shellfish Toxins(PSTs) in shellfish, receptor binding assay, in: AOAC Office Methods of Analysisof AOAC International, Gaithersburg, MD, USA, 2011.
[41] F.M. Van Dolah, S.E. Fire, T.A. Leighfield, C.M. Mikulski, G.J. Doucette,Determination of paralytic shellfish toxins in shellfish by receptor binding assay:collaborative study, J. AOAC Int. 95 (2012) 795–812.
[42] N. Lagos, H. Onodera, P.A. Zagatto, D. Andrinolo, S.M. Azevedo, Y. Oshima, Thefirst evidence of paralytic shellfish toxins in the fresh water cyanobacteriumCylindrospermopsis raciborskii, isolated from Brazil, Toxicon 37 (1999) 1359–1373.
[43] P. Pereira, H. Onodera, D. Andrinolo, S. Franca, F. Araújo, N. Lagos, et al., Paralyticshellfish toxins in the freshwater cyanobacterium Aphanizomenon flos-aquae,isolated from Montargil reservoir, Portugal, Toxicon 38 (2000) 1689–1702.
[44] C. Dell’Aversano, P. Hess, M.A. Quilliam, Hydrophilic interaction liquidchromatography – mass spectrometry for the analysis of paralytic shellfishpoisoning (PSP) toxins, J. Chromatogr. A 1081 (2005) 190–201.
[45] M.J. Boundy, A.I. Selwood, D.T. Harwood, P.S. McNabb, A.D. Turner, Developmentof a sensitive and selective liquid chromatography-mass spectrometry methodfor high throughput analysis of paralytic shellfish toxins using graphitisedcarbon solid phase extraction, J. Chromatogr. A 1387 (2015) 1–12, doi:10.1016/j.chroma.2015.01.086.
[46] A.D. Turner, P.S. McNabb, D.T. Harwood, A.I. Selwood, M.J. Boundy, Singlelaboratory validation of a multitoxin ultra-performance LC-HydrophilicInteraction LC-MS/MS method for quantitation of paralytic shellfish toxins inbivalve shellfish, J. AOAC Int. 98 (3) (2015) 609–621.
[47] P. Thibault, S. Pleasance, M.V. Laycock, Analysis of paralytic shellfish poisonsby capillary electrophoresis, J. Chromatogr. 542 (1991) 483–501.
[48] A. Buzy, P. Thibault, M.V. Laycock, Development of a capillary electrophoresismethod for the characterization of enzymatic products arising from thecarbamoylase digestion of paralytic shellfish poisoning toxins, J. Chromatogr.A 688 (1994) 301–316.
[49] S.J. Locke, P. Thibault, Improvement in detection limits for the determinationof paralytic shellfish poisoning toxins in shellfish tissues using capillaryelectrophoresis/electrospray mass spectrometry and discontinuous buffersystems, Anal. Chem. 66 (1994) 3436–3446.
22 S. Burrell et al./Trends in Analytical Chemistry 75 (2016) 10–23

[50] N. Piñeiro, J.M. Leão, A. Gago Martínez, J.A. Rodríguez Vázquez, Capillaryelectrophoresis with diode array detection as an alternative analytical methodfor paralytic and amnesic shellfish toxins, J. Chromatogr. A 847 (1999) 223–232.
[51] A. Gago-Martínez, J. Manuel Leão, N. Piñeiro, E. Carballal, E. Vaquero, M.Nogueiras, et al., An application of capillary electrophoresis for the analysis ofalgal toxins from the aquatic environment, Int. J. Environ. Anal. Chem. 83 (2003)443–456.
[52] Y. Wu, A.Y.T. Ho, P.-Y. Qian, K.S.-Y. Leung, Z. Cai, J.-M. Lin, Determination ofparalytic shellfish toxins in dinoflagellate Alexandrium tamarense byusing isotachophoresis/capillary electrophoresis, J. Sep. Sci. 29 (2006) 399–404.
[53] M. Thompson, S.L.R. Ellison, R. Wood, The International Harmonized Protocolfor the proficiency testing of analytical chemistry laboratories (IUPAC TechnicalReport), Pure Appl. Chem. 78 (2006) 145–196.
[54] W.P. Cofino, I.H.M. van Stokkum, D.E. Wells, F. Ariese, J.-W.M. Wegener, R.A.L.Peerboom, A new model for the inference of population characteristics fromexperimental data using uncertainties. Application to interlaboratory studies,Chemometr. Intell. Lab. Syst. 53 (2000) 37–55.
[55] D.E. Wells, W. Cofino, J. Scurfield, The Application of the Cofino Model toEvaluate Laboratory Performance Study Data Using the Bandwidth Estimator,Fisheries Research Services/Wageningen University, Aberdeen, Scotland/Wageningen, The Netherlands, 2004. Collaborative Report No. 04/04.
[56] M. LeDoux, S. Hall, Proficiency testing of eight French laboratories in using theAOAC Mouse bioassay for paralytic shellfish poisoning: interlaboratorycollaborative study, J. AOAC Int. 83 (2000) 305–310.
[57] H.P. van Egmond, K.M. Jonker, M. Poelman, P. Scherpenisse, A.G. Stern, P.Wezenbeek, et al., Proficiency studies on the determination of paralytic shellfishpoisoning toxins in shellfish, Food Addit. Contam. 21 (2004) 331–340.
[58] H.P. van Egmond, A. Mouriño, P.A. Burdaspal, A. Boenke, Development ofreference materials for paralytic shellfish poisoning toxins, J. AOAC Int. 84 (2001)1668–1676.
[59] A.D. Turner, A.M. Lewis, W.A. Rourke, W.A. Higman, Interlaboratory comparisonof two AOAC liquid chromatographic fluorescence detection methods forparalytic shellfish toxin analysis through characterization of an oyster referencematerial, J. AOAC Int. 97 (2014) 380–390.
[60] EURLMB, EURLMB 2012 Proficiency Testing For Saxitoxin Group (PSP) ToxinsDetermination, European Union Reference Laboratory for Marine Biotoxins,2012.
[61] EURLMB, EURLMB 2013 Proficiency Testing For Saxitoxin Group (PSP) ToxinsDetermination, European Union Reference Laboratory for Marine Biotoxins,2013.
[62] EURLMB, EURLMB 2014 Proficiency Testing For Saxitoxin Group (PSP) ToxinsDetermination, European Union Reference Laboratory for Marine Biotoxins,2014.
[63] A. Earnshaw, Marine Toxins, Pilot Study August 2003. Report Food AnalysisPerformance Assessment Scheme, Central Science Laboratory, Sand Hutton, York,UK, 2003.
[64] S. Burrell, V. Clion, V. Auroy, B. Foley, A.D. Turner, Heat treatment and the useof additives to improve the stability of paralytic shellfish poisoning toxins inshellfish tissue reference materials for internal quality control and proficiencytesting, Toxicon 99 (2015) 80–88, doi:10.1016/j.toxicon.2015.03.013.
[65] P. McCarron, S. Burrell, P. Hess, Effect of addition of antibiotics and an antioxidanton the stability of tissue reference materials for domoic acid, the amnesicshellfish poison, Anal. Bioanal. Chem. 387 (2007) 2495–2502.
[66] ISO, ISO Guide 35:2006 Reference Materials – General and Statistical Principlesfor Certification, International Organization for Standardization, Geneva, 2006.
[67] R. Munday, K. Thomas, R. Gibbs, C. Murphy, M.A. Quilliam, Acute toxicities ofsaxitoxin, neosaxitoxin, decarbamoyl saxitoxin and gonyautoxins 1&4 and 2&3to mice by various routes of administration, Toxicon 76 (2013) 77–83.
[68] A.D. Turner, W.A. Higman, Certficate of Analysis Pacific Oyster PSP Toxin MatrixCRM (PO PST CRM 1101), Centre for Environment Fisheries and AquacultureScience, Dorset, UK, 2012.
23S. Burrell et al./Trends in Analytical Chemistry 75 (2016) 10–23