professor of virology & infectious diseases, university of...
TRANSCRIPT

AnnaMariaGerettionbehalfofco-authorsProfessorofVirology&InfectiousDiseases,UniversityofLiverpool
ExpertScientist,RochePharmaResearch&EarlyDiscovery

§ Funding:Wellcome Trust,NationalInstitutesofHealth
§ ResearchGovernance:UniversityofLiverpool(UoL)
§ Employment:AMGisemployedbytheUoL andbyRochePharmaResearch&EarlyDiscovery(pRED)– theworkpresentedisindependentofandnotendorsedbyRochepRED

§ AlexanderStockdalea,b
§MatthewSaundersc
§MarkBoydd,e
§ LauraBonnetta
§ VictoriaJohnstonf
§ GillesWandelerg
§ Annelot Schoffelenh
§ LauraCiaffii
§ KristenStaffordj
§ AnnCollierk
§ NicholasPatonl
aUniversity ofLiverpool,UK;bMalawi-
Liverpool-Wellcome TrustCRP,Malawi;cImperial CollegeLondon,UK;dUniversity of
NewSouthWalesandeUniversityofAdelaide,
Australia;fLondon SchoolofHygiene&
TropicalMedicine,UK;gUniversity ofBern,
Switzerland;hUniversity MedicalCentre
Utrecht,Netherlands;iUniversity of
Montpellier,France;jUniversity ofMaryland
SchoolofMedicine,USA;kUniversity of
WashingtonSchoolofMedicine,USA;lNational UniversityofSingapore,Singapore

§ ThenumberofpeoplereceivingARTinSSAincreasedfrom7.5millionin2010to17millionin20151,2
§ Virologicalsuppressionrateswith1st-lineARTinLMICs:67%at12months,65%at24months,62%at48months(meta-analysisof93studies,ITT)3
§ Theneedfor2nd-lineARTprojectedtoincreaseto>4Mby2030,inkeepingwiththeexpansionoftreatmentprovision2,4,5
§ Outcomedatarequiredtoinformpolicy
1.UNAIDS.JointUnitedNationsProgramme onHIV/AIDS,2016;2.UNAIDS.90-90-90AnambitioustreatmenttargettohelpendtheAIDSepidemic,2014;3.Boender etal.Long-termvirologicaloutcomesoffirst-lineantiretroviraltherapyforHIV-1inlow- andmiddle-incomecountries:Asystematicreviewand
meta-analysis.Clin InfectDis2015;4.WHO.ConsolidatedguidelinesontheuseofantiretroviraldrugsfortreatingandpreventingHIVinfection,2016;5.Estilletal.Theneedforsecond-lineantiretroviraltherapyinadultsinsub-SaharanAfricaupto2030:amathematicalmodellingstudy.LancetHIV2016
ART= Antiretroviral Therapy; SSA= Sub-Saharan Africa LMICs= Low-Middle-Income Countries; ITT= Intention-To-Treat

§ Systematicreviewandmeta-analysisofstudiesreportingthevirologicaloutcomesofPI-based2nd-lineARTinSSA
PRIMARYOUTCOMEVirologicalsuppression*after48and96weeksoftreatment
SECONDARYOUTCOMES1. ImpactofNRTIresistance2. ProportionwithPIRAMs
at2nd-linefailure
*Virologicalsuppression:PlasmaHIV-1RNA<400cps/ml
PI= Protease Inhibitor; RAMs= Resistance-Associated Mutations

§ PubMed,EMBASE,CochraneCentralRegisterofControlledTrials,Scopus,WebofScience
§ Terms:“HIV”,“sub-SaharanAfrica”(andcountriestherein),“second-line”,“proteaseinhibitor”,genericandproprietarynamesofdrugsincludedin2nd-lineART
§ Articlespublishedfrom1Jan1996to10Jul2016
Oneprevioussystematicreviewoftheeffectivenessof2nd- lineARTinLMIC(2012);newRCTs(e.g.,SECOND-LINE,EARNEST,2- LADY,SELECT)andcohortstudiespublishedsince
RCTs= Randomised Clinical Trials
§ ReferencescitedinthearticlesandabstractsfromIAS(2014-2015)andCROI(2014-2016)conferences
§ Authorscontactedtoobtainandclarifydata

§ RCTs(n=5)andobservationalcohortstudiesreportingvirologicaloutcomesofPI-based2nd-lineARTinSSA
EXCLUSIONSStudieswith<20participantsParticipantsoutsideSSAinmulti-centre trialsPIsornon-standardregimensusedas1st-lineARTNoclearlydefinedcriteriaforswitchingfrom1st- to2nd-lineART
INCLUSIONSHIV-1positivesubjectsaged>10years1st-lineART(2NRTIs+NNRTI)for≥6monthspriortostarting2nd-lineARTClinical,immunologicalorvirologicalcriteriaforstarting2nd-lineARTViralloadmeasuredatleastannually

§ DatafromSouthAfrica,Nigeria,Uganda,Zimbabwe,Kenya,Malawi,Zambia,BurkinaFaso,Cameroon,Senegal,Tanzania
§MostpatientsreceivedLPV/r;oneRCTrandomised onethirdofpatientstoDRV/r(800mgod)
CI= Confidence Interval
*ITTanalysis
VirologicalfailurebyWHOdefinition(>1000cps/ml):2.5-26.6%atwk 48,4.1-11.1%atwk 96
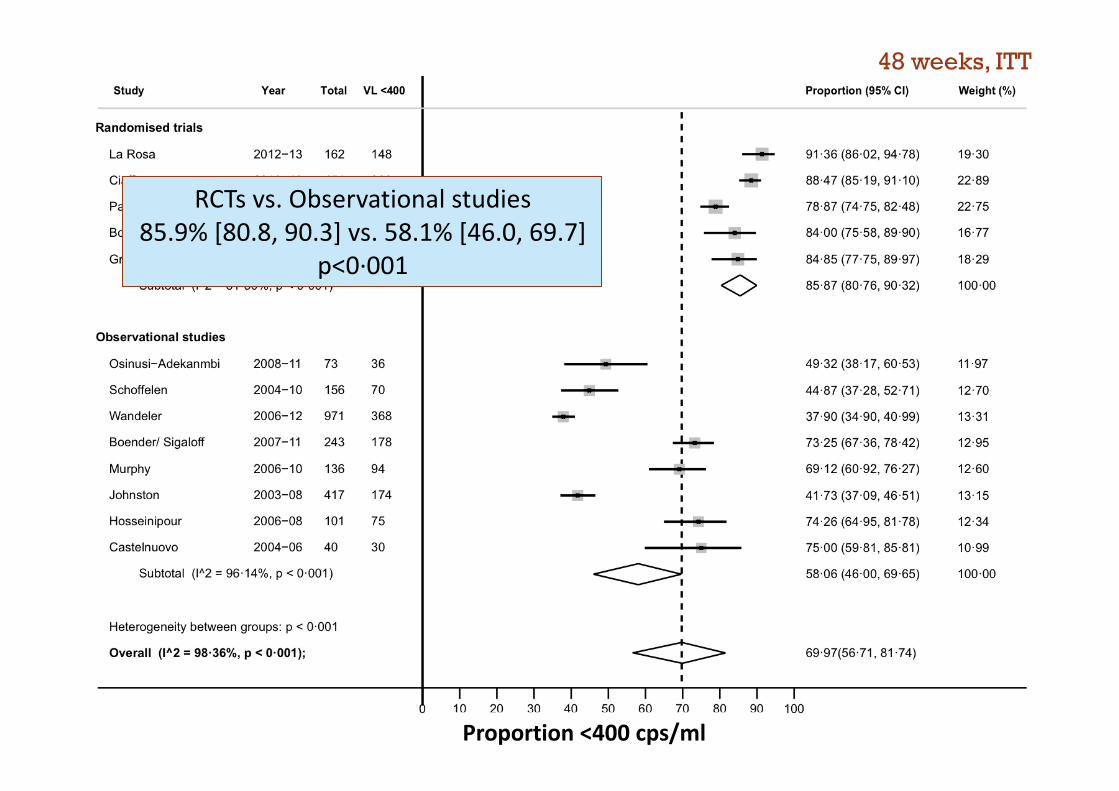
Virologicalsuppression70.0%*[95%CI56.7,81.7]
Virologicalsuppression61.5%* [95%CI47.2,74.9]
WEEK48:13studies3408participants
WEEK96:8studies2145participants

48 weeks, ITT
Observed:83.3%[76.7,89.0] Proportion<400cps/ml

Heterogeneity between groups: p 0·0< 01
Overall (I^2 = 98·3 %, p 0· 0 );6 < 0 1
La Rosa
Gross
Subtotal (I^2 = 81· %, p 0· 0 )50 < 0 1
Paton
Boyd/Amin
Ciaffi
Randomised trials
2012−13
2009−11
2010−14
2010−14
2010−13
162
132
426
100
451
148
112
336
85
399
Hosseinipour
Castelnuovo
Subtotal (I^2 = 96·14%, p 0·0 )< 01
Boender/ Sigaloff
Johnston
Murphy
Observational studies
Schoffelen
Osinusi−Adekanmbi
Wandeler
2006−08
2004−06
2007−11
2003−08
2006−10
2004−10
2008−11
2006−12
101
40
243
417
136
156
73
971
75
30
178
174
94
70
36
368
69·97 1 7(56·7 , 81· 4)
74·26 (64·95, 81·78)
75·00 (59·81, 85·81)
58·06 (46·00, 69·65)
73·25 (67·36, 78·42)
41·73 (37·09, 46·51)
69·12 (60·92, 76·27)
91·36 (86·02, 94·78)
44·87 (37·28, 52·71)
49·32 (38·17, 60·53)
84·85 (77·75, 89·97)
85·87 (80·76, 90·32)
78·87 (74·75, 82·48)
8 00 (7 , )4· 5·58 89·90
88·47 (85·19, 91·10)
37·90 (34·90, 40·99)
12·34
10·99
100·00
12·95
13·15
12·60
19·30
12·70
11·97
18·29
100·00
22·75
16·77
22·89
13·31
0 10 20 30 40 50 60 70 80 90 100
Proportion with <400 copies/ml (%)viral load
Study Year Total VL <400 Proportion (95% CI) Weight (%)
A: 48 weeks
Heterogeneity between groups: p 0·00< 1
Overall (I^2 = 97· %, p 0·0 );32 < 01
Schoffelen
Randomised trials
Osinusi−Adekanmbi
Observational study
Murphy
Boender/ Sigaloff
Wandeler
Subtotal (I^2 = 94·45%, p 0·00 )< 1
Paton
Castelnuovo
Boyd/Amin
2004−10
2008−11
2006−10
2007−11
2006−12
2010−14
2004−06
2010−14
156
73
136
243
971
426
40
100
67
41
74
150
361
326
34
76
61·48 7· 5 4· 7(4 1 , 7 8 )
42.95 (35.44, 50.79)
56.16 (44.76, 66.95)
7 . (7 . , . 4)6 49 2 75 80 0
54.41 (46.03, 62.55)
61.73 (55.48, 67.61)
37.18 (34.19, 40.26)
55.66 (43.14, 67.82)
76.53 (72.27, 80.30)
85.00 (70.93, 92.94)
76 66.77 83.31.00 ( , )
.
17.12
15.90
100.00
16.95
17.55
18.16
100.00
80.93
14.33
19.07
.
0 10 20 30 40 50 60 70 80 90 100
B: 96 weeks
Study Year Total VL <400 Proportion (95% CI) Weight (%)
Proportion with <400 copies/ml (%)viral load
Figure 3
96 weeks, ITT
Observed84.8%[78.8,89.9]
Proportion<400cps/ml
48 weeks, ITT
RCTsvs.Observationalstudies85.9%[80.8,90.3]vs.58.1%[46.0,69.7]
p<0·001
Proportion<400cps/ml

Heterogeneity between groups: p 0·0< 01
Overall (I^2 = 98·3 %, p 0· 0 );6 < 0 1
La Rosa
Gross
Subtotal (I^2 = 81· %, p 0· 0 )50 < 0 1
Paton
Boyd/Amin
Ciaffi
Randomised trials
2012−13
2009−11
2010−14
2010−14
2010−13
162
132
426
100
451
148
112
336
85
399
Hosseinipour
Castelnuovo
Subtotal (I^2 = 96·14%, p 0·0 )< 01
Boender/ Sigaloff
Johnston
Murphy
Observational studies
Schoffelen
Osinusi−Adekanmbi
Wandeler
2006−08
2004−06
2007−11
2003−08
2006−10
2004−10
2008−11
2006−12
101
40
243
417
136
156
73
971
75
30
178
174
94
70
36
368
69·97 1 7(56·7 , 81· 4)
74·26 (64·95, 81·78)
75·00 (59·81, 85·81)
58·06 (46·00, 69·65)
73·25 (67·36, 78·42)
41·73 (37·09, 46·51)
69·12 (60·92, 76·27)
91·36 (86·02, 94·78)
44·87 (37·28, 52·71)
49·32 (38·17, 60·53)
84·85 (77·75, 89·97)
85·87 (80·76, 90·32)
78·87 (74·75, 82·48)
8 00 (7 , )4· 5·58 89·90
88·47 (85·19, 91·10)
37·90 (34·90, 40·99)
12·34
10·99
100·00
12·95
13·15
12·60
19·30
12·70
11·97
18·29
100·00
22·75
16·77
22·89
13·31
0 10 20 30 40 50 60 70 80 90 100
Proportion with <400 copies/ml (%)viral load
Study Year Total VL <400 Proportion (95% CI) Weight (%)
A: 48 weeks
Heterogeneity between groups: p 0·00< 1
Overall (I^2 = 97· %, p 0·0 );32 < 01
Schoffelen
Randomised trials
Osinusi−Adekanmbi
Observational study
Murphy
Boender/ Sigaloff
Wandeler
Subtotal (I^2 = 94·45%, p 0·00 )< 1
Paton
Castelnuovo
Boyd/Amin
2004−10
2008−11
2006−10
2007−11
2006−12
2010−14
2004−06
2010−14
156
73
136
243
971
426
40
100
67
41
74
150
361
326
34
76
61·48 7· 5 4· 7(4 1 , 7 8 )
42.95 (35.44, 50.79)
56.16 (44.76, 66.95)
7 . (7 . , . 4)6 49 2 75 80 0
54.41 (46.03, 62.55)
61.73 (55.48, 67.61)
37.18 (34.19, 40.26)
55.66 (43.14, 67.82)
76.53 (72.27, 80.30)
85.00 (70.93, 92.94)
76 66.77 83.31.00 ( , )
.
17.12
15.90
100.00
16.95
17.55
18.16
100.00
80.93
14.33
19.07
.
0 10 20 30 40 50 60 70 80 90 100
B: 96 weeks
Study Year Total VL <400 Proportion (95% CI) Weight (%)
Proportion with <400 copies/ml (%)viral load
Figure 3
96 weeks, ITT
RCTsvs.Observationalstudies76.5%[72.8,80.4]vs.55.7%[43.1,67.8]
p<0·001
Proportion<400cps/ml

NOTE: Weights are from random effects analysis
Overall (I−squared = 62·8%, p = 0·020)
Paton
Boyd
Hosseinipour
Castelnouvo
Sigaloff
Johnston
22
4
3
11
69
18
33 (66·6)
10 (40·0)
5 (60·0)
12 (91·7)
80 (86·3)
35 (51·4)
310
71
84
4
95
62
358 (86·6)
81 (87·7)
89 (94·4)
4 (100)
112 (84.8)
79 (78·5)
0·31 (0·14, 0·70)
0·31 (0·14, 0·68)
0·09 (0·02, 0·39)
0·09 (0·01, 0·66)
0·85 (0·03, 25·05)
1·12 (0·49, 2·55)
0·29 (0·12, 0·68)
100·00
23·56
15·48
10·49
4·75
23·09
22·63
10·1 0·2 0·5 1 2 5 10 30
Odds ratio
Study VL<400 Total (%) VL<400 Total (%) OR (95% CI) Weight (%)
Fully active Partially active
Higher odds of virological suppressionwith fully active regimen
Lower odds of virological suppressionwith fully active regimen
Figure 5
IMPACTOFNRTIRESISTANCEResistancetestresultsatstartof2nd-lineARTavailablein6studies
OddsRatio

§ Unbiasedselectionmethodforresistancetestingrequired:• eitherallpatientsmeetingadefinedviralloadthreshold,or
• arandomselectionofthetotalfailurepopulation
• 11studies
• Thresholdforresistancetesting400-5000cps/ml
• Durationof2nd-lineARTatresistancetesting:6-31months
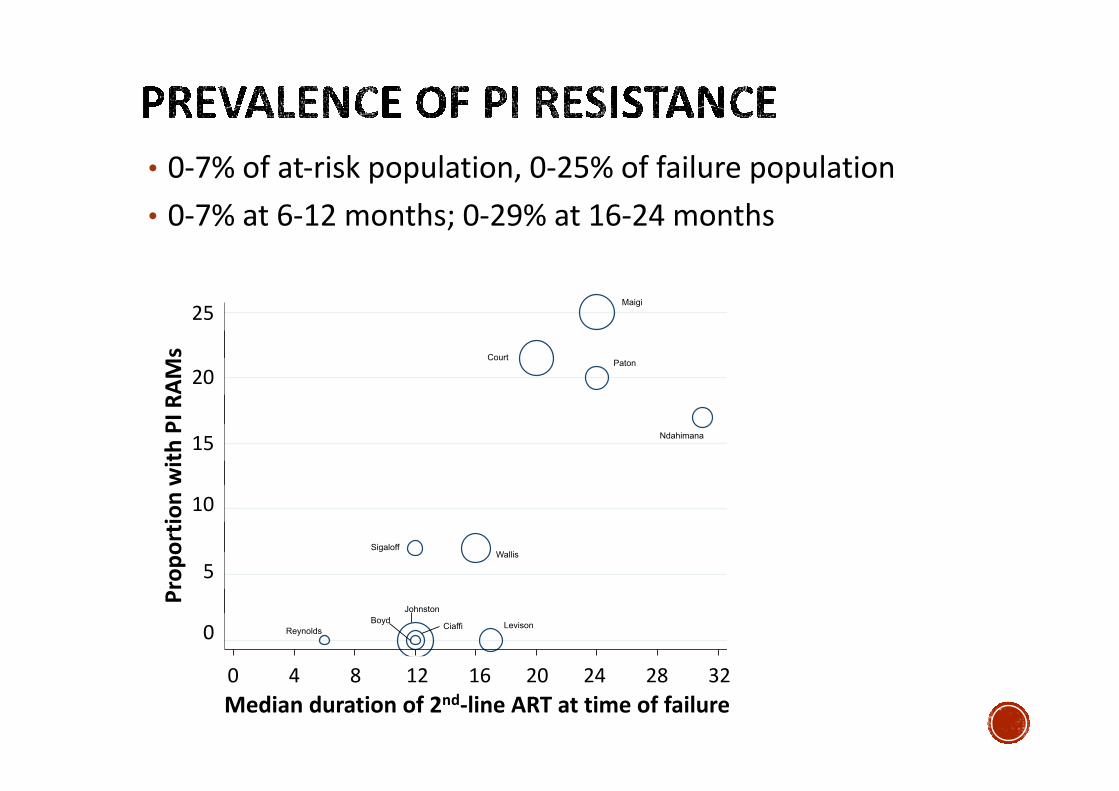
• 0-7%ofat-riskpopulation,0-25%offailurepopulation
• 0-7%at6-12months;0-29%at16-24months0
510
15
20
25
Pro
port
ion w
ith m
ajo
r P
I m
uta
tion(%
)
0 4 8 12 16 20 24 28 32
Cohort median duration of second−line ART at failure (months)
Maigi
CourtPaton
WallisSigaloff
ReynoldsLevison
Boyd
Johnston
Ciaffi
Ndahimana
Figure 6
Mediandurationof2nd-lineARTattimeoffailure
Prop
ortio
nwith
PIR
AMs
25
20
15
10
5
0
048121620242832

§ PI-based2nd-lineART(withcontinuedNRTIuse)resultsinvirologicalsuppressioninmostpatientsinSSAandcarriesarelativelylowriskofPIresistance

§ PI-based2nd-lineART(withcontinuedNRTIuse)resultsinvirologicalsuppressioninmostpatientsinSSAandcarriesarelativelylowriskofPIresistance
§ Substantialheterogeneityacrossobservationalstudies
ØOnesource:variableproportionofmissingviralloaddatanotexplainedbydeathorlosstofollow-up
§ Virologicaloutcomessignificantlybetter(andlosstofollow-uplower)amongRCTparticipantsvs.observationalstudies
§ NRTIresistancepredictedhigheroddsofvirologicalsuppression
ØResistanceasaproxyforhigheradherence
ØZDVandTDFretainsignificantresidualactivitydespiteTAMs,enhancedbycontinuationof3TC

§ Long-termdata
§ Standardised reportingØE.g.,sizeof1st-lineARTpopulation,rateof1st-lineARTfailure,rateofswitchingto2nd-lineART,NRTIsusedin1st- and2nd-lineregimens,rateofadverseevents,contributionoftolerabilitytotreatmentdiscontinuation
§ OnethirdofpatientsdidnotachievevirologicalsuppressionØRiskofdiseaseprogressionandonwardHIVtransmission
§ Optimalstrategiesforpreventing,defining,andmanaging2nd-lineARTfailure,bothwithandwithoutPIresistance,representaresearchpriorityforSSA
